 Karina Dracott
 Chloe V. Robinson
 Alice Brown-Dussault1
- 1Whales Initiative, Ocean Wise, Vancouver, BC, Canada
- 2Marine Education and Research Society (MERS), Port McNeill, BC, Canada
- 3Cetacean Conservation Research Program, Raincoast Conservation Foundation, Sidney, BC, Canada
Pacific Harbour Porpoise (Phocoena phocoena vomerina) occupy a large range throughout coastal waters of British Columbia. Despite their wide distribution, they remain largely data-deficient regarding abundance and population trends, and as such are listed as Special Concern under the Species At Risk Act. Harbour porpoises are also particularly sensitive to disturbance, especially vessel-related acoustic disturbance. Large aggregations of harbour porpoise have been documented in waters around the entrance to the Port of Prince Rupert during the winter months, however little is known about the annual fine-scale activity of this species in this highly trafficked area. In this multi-year study, we used a combination of land-based visual surveys and passive acoustic monitoring (PAM) devices (C-PODs and F-PODs) to address data gaps regarding density, diel patterns, and seasonality of harbour porpoise around Prince Rupert. Echolocation activity was detected during 96% of the 1086 C-POD deployment days and 100% of the 727 F-POD deployment days, with 86% of visual surveys recording harbour porpoise presence. We detected strong seasonal and diel trends in activity, with echolocation peaks between April and June and during the hours of darkness throughout the year. There was a notable increase in daytime activity of harbour porpoise between January and March, which coincides with the months of large aggregation observations. This study indicates that despite the constant presence of large vessels, harbour porpoise continue to persist within waters surrounding Prince Rupert. This suggests the area is an important habitat for this species and also may indicate some extent of acclimatization to localized disturbance.
Introduction
The Pacific harbour porpoise (Phocoena phocoena vomerina) is a recognised subspecies of harbour porpoise, which inhabits the north Pacific from California to northern Japan (Gaskin, 1984; Ridgway et al., 1998; Taguchi et al., 2010). This species is listed as ‘Special Concern’ under the Species At Risk Act (Government of Canada, 2002). Populations of Pacific harbour porpoise (hereafter PHP) in the eastern part of their range are considered to exist as smaller sub-units, with no to limited exchange of genetic material between these populations (Chivers et al., 2002; Taguchi et al., 2010). Despite the continuous distribution of PHP along the north Pacific, PHP are primarily found in shallow bays, sounds, estuaries, and harbours due to the species’ foraging and diving capabilities and prey distribution (Goodwin, 2008; Nichol et al., 2013). Characterized by deep channels, large tidal influx and proximity to the Skeena River estuary, the entrance to the Port of Prince Rupert is an area where high marine productivity and porpoise presence coincide with vessel traffic. PHP typically target schooling fish species such as Pacific herring (Clupea pallasi), Pacific sardines (Sardinops sagax), walleye pollock (Theragra chalcogramma), Pacific hake (Merluccius productus) and Pacific sand lance (Ammodytes hexapterus) (Nichol et al., 2013; Elliser et al., 2020).
An extensive network of citizen scientists has facilitated a better understanding of population aggregations of PHP presence throughout their range. The B.C. Cetacean Sightings Network (BCCSN) has collated sightings of PHP since 1955 via observer reports through mediums including the WhaleReport app and paper logbooks. Identified seasonal hotspots of PHP include southeastern Haida Gwaii, Chatham Sound and northern Vancouver Island between May and September and around eastern Haida Gwaii,, western Vancouver Island and the Gulf Islands between October and April, and southeast Vancouver Island between May and October (Hall, 2004; Wright et al., 2021). Due to their coastal distribution, there is extensive overlap between PHP range and anthropogenic activity, particularly in productive waters such as those in Chatham Sound (Clarke and Jamieson, 2006; Skov and Thomsen, 2008; Fisheries and Oceans Canada, 2009). Unusually large harbour porpoise aggregations have been reported to occur in the vicinity of the Port of Prince Rupert, which we suspect serves as a regionally important habitat area for the species. Supporting this, there has been documentation of extensive feeding and mating activity (Caitlin Birdsall, pers.comms). This combination of anthropogenic activity overlap and high sensitivity of PHP to acoustic and physical disturbance (Wisniewska et al., 2016) signifies high vulnerability of the species. Additional threats, such as fishing gear entanglement, overfishing, habitat degradation, and contamination by persistent bio-accumulative toxic chemicals are also of great concern for this species (Fisheries and Oceans Canada, 2009). Gathering data on these small, elusive cetaceans is notoriously difficult, leading to a poor general understanding of their ranges, population structures, diet, and breeding phenology in the north Pacific.
Harbour porpoise (HP) populations across the North Atlantic are subject to similar threats and environmental pressures as PHP, however more data is available on HP distribution, densities, abundance and diel patterns, and the threats facing them are better understood. Numerous studies have highlighted fluctuations in diel patterns of HP echolocation activity, through employing passive acoustic monitoring (PAM) devices, such as C-PODs (Continuous Porpoise Detector) and F-PODs (Full waveform capture Porpoise Detector) and how this relates to the impact of anthropogenic threats (Goodwin, 2008; Todd et al., 2009; Hall, 2011; Jeffries, 2012; Brandt et al., 2014; Benjamins et al., 2017; Williamson et al., 2017; Schartmann, 2019; Osiecka et al., 2020). In addition to monitoring HPs acoustically, data on HP habitat use and abundance has also been generated through land-based (e.g. (Oakley et al., 2017)), aerial (Jefferson et al., 2016), and boat-based surveys, including citizen science programs (e.g. (Nielsen et al., 2021)).
Understanding the impact of threats on PHP presence, echolocation activity, and sub-population health is essential for determining appropriate management and conservation strategies in BC (Baird, 2003; Fisheries and Oceans Canada, 2009). To protect and conserve PHP populations, we first need to bridge existing knowledge gaps regarding population structure and identification of core habitat (Fisheries and Oceans Canada, 2009). Outside of the Salish Sea, there is little information in British Columbia on important foraging habitats, availability of prey species, location of vital habitats for mating and birthing and on spatiotemporal variation in core habitat usage (Baird, 2003; Hall, 2004; Fisheries and Oceans Canada, 2009; Benjamins et al., 2017; Elliser and Hall, 2021; Wright et al., 2021). The area surrounding Prince Rupert, BC, is an important area for PHP, based on the observation of seasonal fluctuations in large aggregations since 2010 (C. Birdsall, BC Cetacean Sightings Network, pers. comm. 2022). The best estimate of PHP abundance within northern BC (northern Vancouver Island to Alaska border) was determined at 1,314 individuals (Wright et al., 2021), with an estimated abundance of between 100 and 700 within Chatham Sound (Stantec Consulting, 2016), especially concentrated around Prince Rupert. Since 2016, the BCCSN has documented the presence of PHP around Tuck Island (north-eastern BC) year-round. Closely related to the PHP, Dall’s porpoise (Phocoenoides dalli) have not been observed within the study site through citizen science surveys nor land and boat-based surveys, however both transient and northern resident killer whales (Orcinus orca) have been documented transiting through here throughout the year.
Within a 10km radius of Tuck Island, there are six active shipping terminals and three ferry terminals. During 2021 alone, 25 million tonnes of foreign cargo and ~50,000 passengers passed through these terminals, and the port is one of the fastest growing in North America (Prince Rupert Port Authority, 2022a). The DP World Fairview Terminal offers the fastest connection from Asia to North America and is currently being expanded to move the equivalent of 1.8 million 20-foot shipping containers per year, a 33% increase from its current capacity (Prince Rupert Port Authority, 2022b). This terminal expansion will significantly increase the number and frequency of large vessels traversing through the wider study area. It is likely that the current shipping traffic and port expansion activity is causing some degree of disturbance to PHP (Wisniewska et al., 2018; Benhemma-Le Gall et al., 2021) and that this disturbance will increase as the port expands (Nabe-Nielsen et al., 2014).
The aims of this study are to: 1) generate data on diel echolocation activity and densities of PHPs in productive coastal waters within Chatham Sound and the approach to Prince Rupert Harbour, which is an important area frequented by PHP, 2) identify biotic and/or abiotic predictors of PHP aggregations within this area and 3) build a comprehensive picture of PHP habitat use by combining data collected from surveys, PAM devices, and citizen scientists to conservation measures in support of PHP in the north-east Pacific.
Materials and methods
Study site
Our study site consisted of a 2 km2 region in Chatham Sound, southeast of Digby Island near Prince Rupert in north-western British Columbia, Canada (Figure 1). Canada), this site was centered around Tuck Island, and is a hotspot of PHP, likely due to the presence of optimal oceanographic characteristics for energy-efficient transport and/or prey habitat, such as deep channels, boils, eddies and tidal rapids (Hall, 2011).
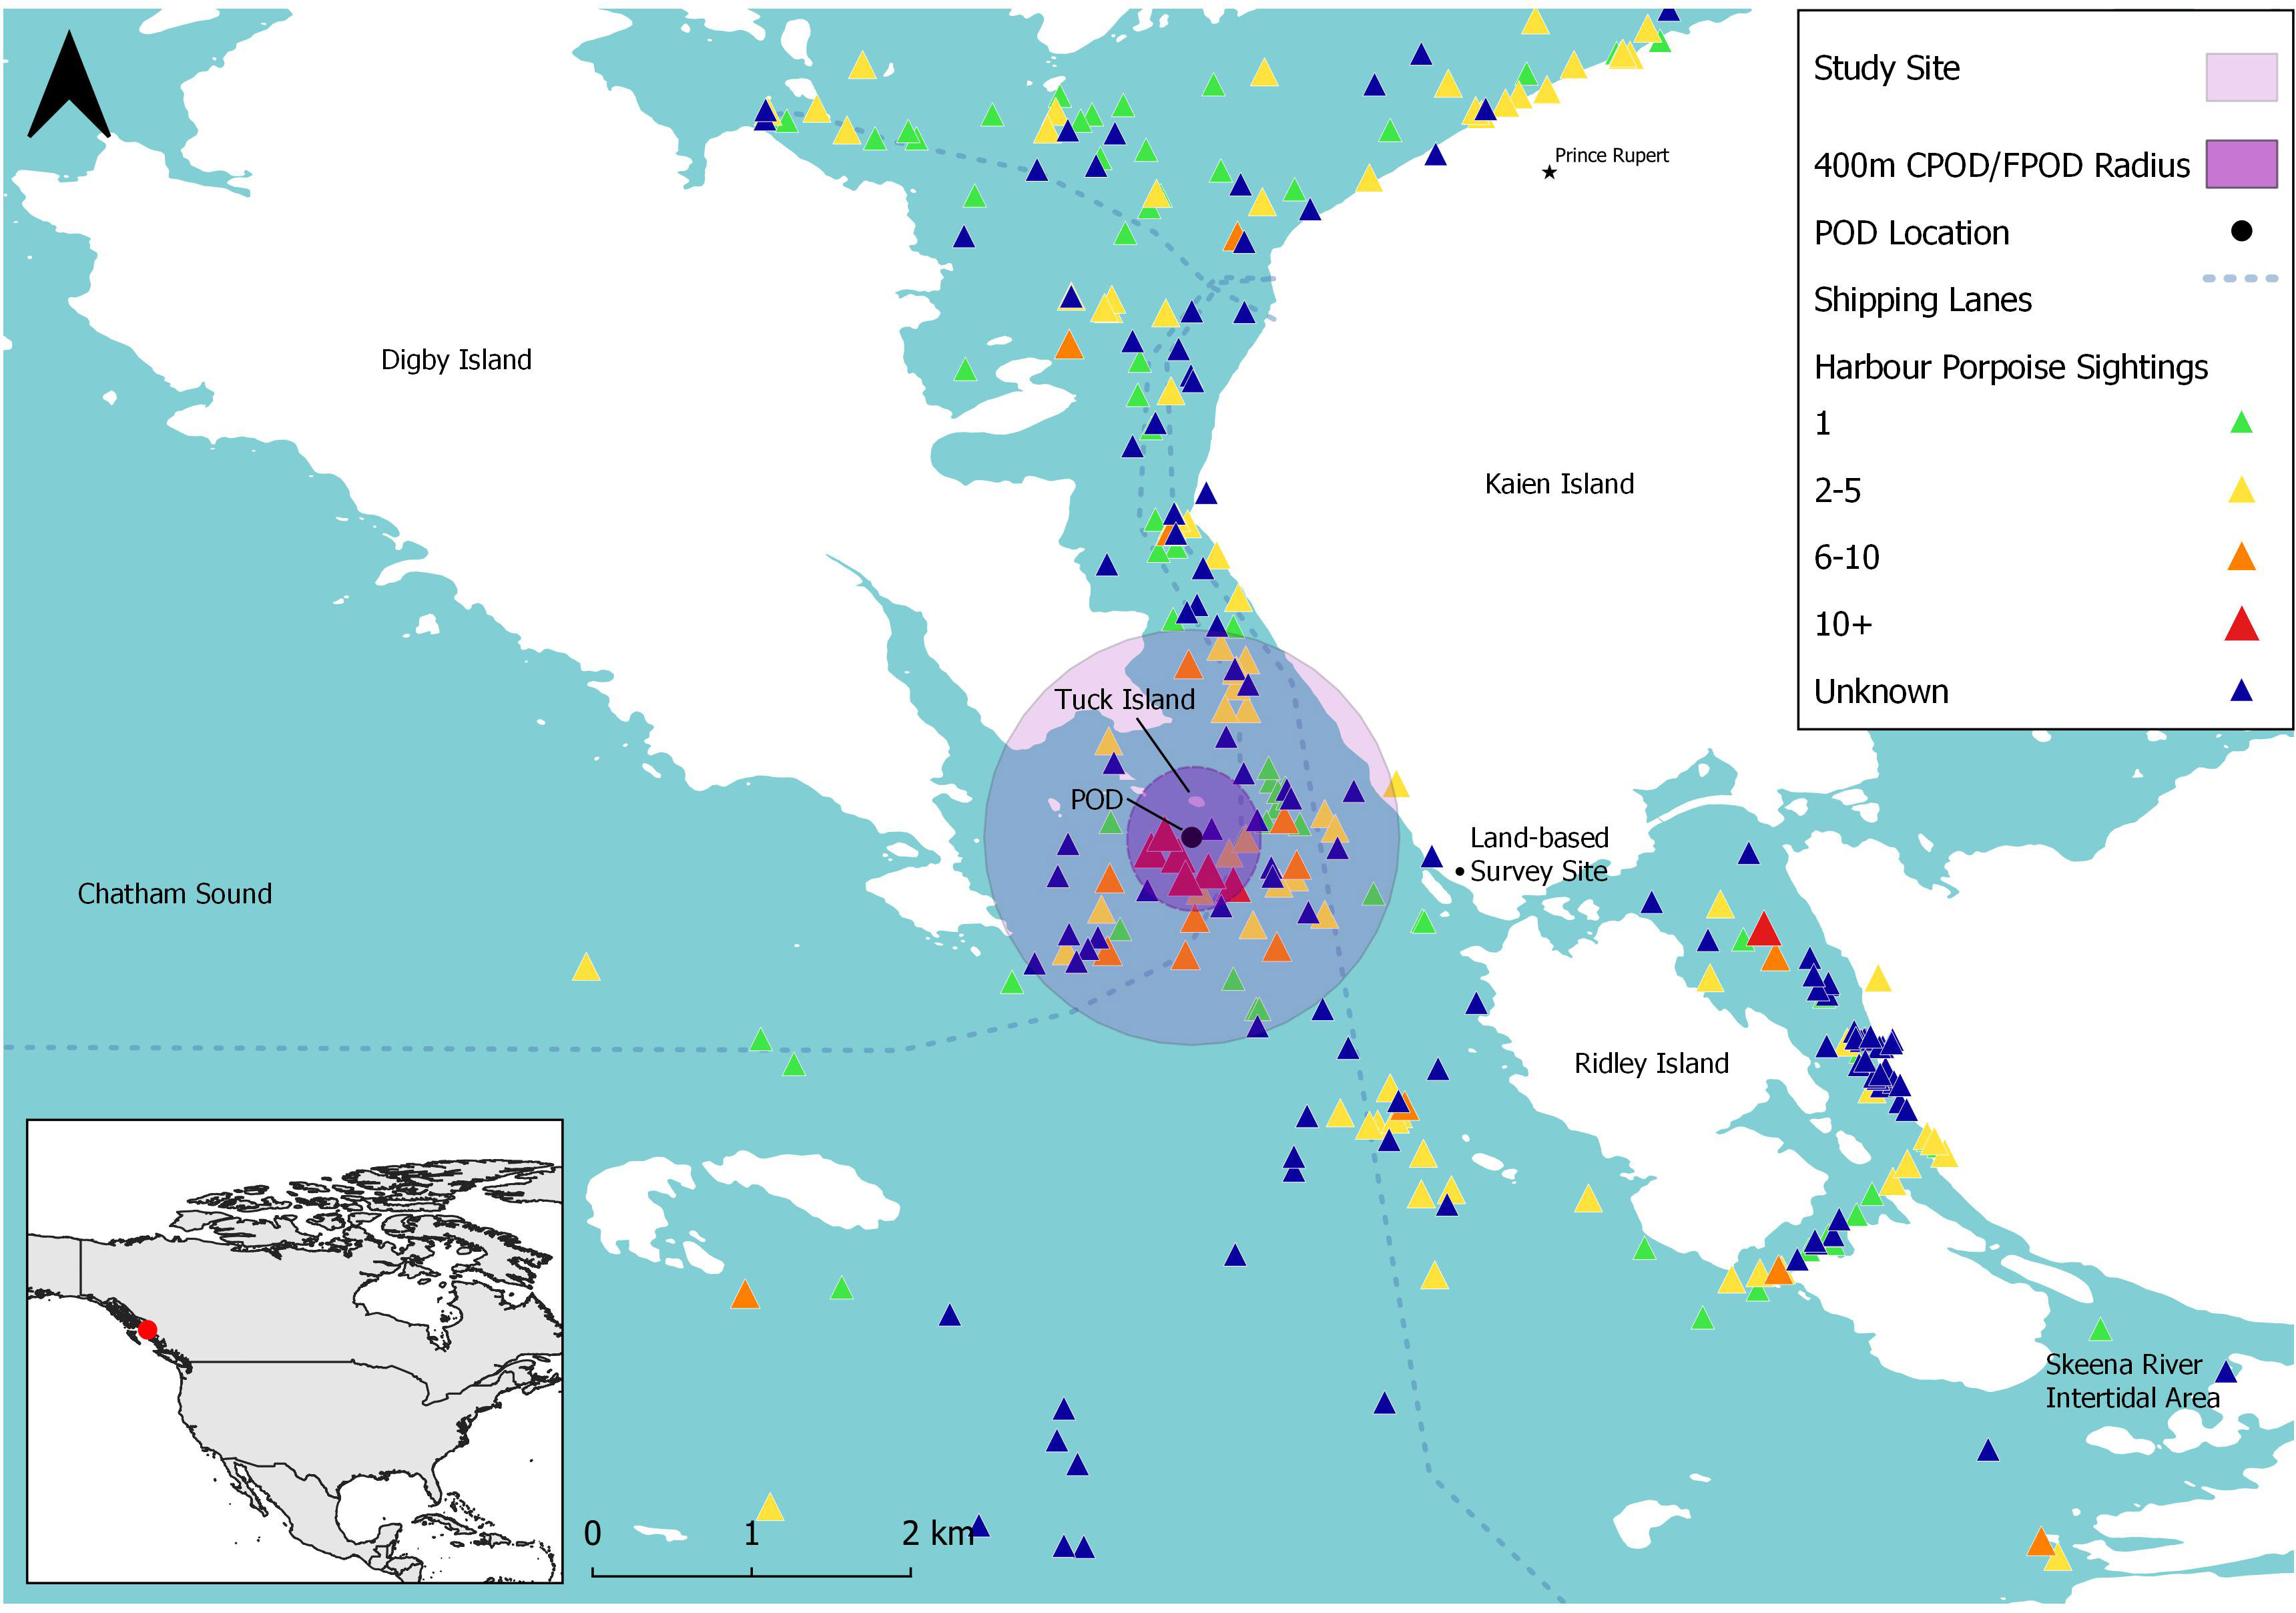
Figure 1 Map of study site (purple circle) south of Digby Island (British Columbia, Canada) and harbour porpoise sightings (triangles) reported to the British Columbia Cetacean Sightings Network (BCCSN) between 2016 and 2021. The black circle indicates the location of the Passive Acoustic Monitoring (PAM) device (C-POD/F-POD) found at the centre of the study site. The primary shipping lanes are represented by the dotted lines. Map in bottom left shows the larger map area (within purple box) in relation to North America. BCCSN sightings were filtered to contain only harbour porpoise sightings with ‘Certain’ and ‘Probable’ confidence levels (n = 2,252).
Historic harbour porpoise sightings in Prince Rupert
To obtain records of PHP occurrence around Prince Rupert, we searched the BCCSN database, consisting of ~300,000 cetacean sightings reports for sightings of harbour porpoise within the geographical boundary of the wider Prince Rupert study area (latitude 54.174 to 54.366 and longitude -130.549 to -130.116). We exported the following data fields: sighting ID, date of sightings, latitude and longitude (decimal degrees), group size and identification confidence (determined both by observer and Ocean Wise staff member who processed the sighting). Each sighting was given a confidence level by BCCSN staff (Uncertain, Possible, Probable and Certain) based on the identification confidence rating given by the observer themselves (Uncertain, Possible, Probable and Certain) and based on the location, observer type/organization, experience of the observer with the BCCSN, and photos submitted by the observer. To maintain high confidence in sightings, Ocean Wise staff engaged with observers to clarify and obtain additional information regarding each sighting submitted. Finally, based on the number of individuals reported across all the filtered sightings, we then created aggregation categories of 1 to 5 individuals, 6 to 10, 11 to 30, 31 to 100 and 101+.
C-POD and F-POD deployment
We used a combination of Passive Acoustic Monitoring (PAM) devices (C-POD and F-PODs) moored 12 feet from the bottom in 60-80 ft of water to collect echolocation activity data on PHP. C-PODs (Cetacean – Porpoise Detector) and F-PODs (Full waveform capture – Porpoise Detector) detect cetaceans by classifying groups of echolocation signals (‘trains’) based on the intensity, duration, frequency content, and variation in inter-click intervals (Sarnocinska et al., 2016). F-PODs are newer PAM devices compared to C-PODs and use new electronics and software to capture more information from the clicks detected. Due to the maximum detection range of these acoustic devices, our study site encompassed a circle with a radius of 400m centered on the location of the moored POD. The C-POD was deployed intermittently and for durations of up to four months between the 16th of July 2016 to the 18th of October 2018 (Supplementary Table 1). We deployed F-PODs for a total period of 24 months consistently (24th of January 2020 to 20th of January 2022) by exchanging the deployed F-POD with another F-POD simultaneously to avoid gaps in logging. Deployment logistics, in terms of anchoring and the use of surface buoys varied between C-PODs and F-PODs (Supplementary Table 1). Both the C-POD and F-POD continually monitored clicks between 20-160kHz and stored data on a single SD card to allow rapid servicing at sea.
Echolocation click detection
Like other odontocetes, harbour porpoises emit echolocation clicks in series referred to as click trains. Acoustic files were adjusted to local GMT-7 and 8 depending on the season of the deployment and cropped to exclude acoustic data collected during POD deployment and retrieval time and for time units with missing or only partial data. We extracted and characterized narrow-band high-frequency (NBHF) PHP echolocation click trains using a KERNO classifier built into both the C-POD and F-POD (Tregenza et al., 2016), applied ‘High’ and ‘Medium’ quality train filters to maximize the likelihood that the click trains were from porpoises and avoid false positives (Sarnocinska et al., 2016) and exported the data in minute bins using the train length duration total (ms) format. Bins in which HP echolocation was detected by this procedure are subsequently referred to as ‘Detection Positive Minutes’.
To investigate diel patterns in PHP echolocation activity, the 24 hours of a day were divided into five diel phases: morning, day, evening, night1 and night2, by comparison with civil twilight and sun-state tables from the US Naval Observatory (http://www.usno.navy.mil/) following (Carlström, 2005; Todd et al., 2009) and accounting for annual differences in daylight hours. Subsequently, the detections per hour of C-POD and F-POD recordings were determined for each day and diel phase.
Visual surveys
In addition to detecting PHP via PAM devices, we also conducted land-based visual surveys during daylight hours at random periods throughout the same period when the C-POD was deployed and collecting data (2016-2018). Land-based visual surveys offer some benefits over vessel-based surveys in that they do not disturbthe animals (Keen et al., 2020). Vessel-based surveys can result in vessel avoidance behaviour from PHP, leading to biased estimates of aggregation size and animal behaviour (Oakley et al., 2017). Land-based surveys were only conducted when sea state was between Beaufort 0-2, to improve detection probabilities (Barlow, 1988; Palka, 1995; Hammond et al., 2002) and were conducted from Kaien Island adjacent to the Ridley Island access road, south of Barrett Rock (Figure 1). Surveys comprised one- to two-hour periods spent continuously scanning the study site adjacent to the PAM device location using a 60 x 80mm spotting scope, recording the cumulative number of PHPs observed within 14 zones delineated by natural landmarks in 10-minute intervals (including resightings of individuals recorded in previous intervals). To test whether there was a significant difference in PHP detections between visual surveys and the C-POD detector, we ran a McNemar’s test to compare frequencies on binary outcomes (0=no detection, 1=detection) per survey (McNemar, 1947), and a Spearman rank correlation test to assess evidence of correlation between the cumulative number of PHP observed during visual surveys and the DPM recorded on the C-POD (Spearman, 1904).
Environmental metadata collection
An Ocean Networks Canada underwater monitoring station located 8.3 km from the study site at depths of 28 and six metres provided the following hourly data during our study: Chlorophyll A (μg/L), turbidity (NTU), sea temperature (°C) and practical salinity (PSU). Sea temperature values were obtained from Fisheries and Oceans Canada (DFO) Cow Bay station (no. 6139; Supplementary Table 2), located 8.5 km from the study site. The Canadian Hydrographic Service provided daily lunar events for the range of our study period. We recorded lunar phases as first quarter, full moon, last quarter, new moon, waning crescent, waxing crescent, waning gibbous and waxing gibbous. All environmental data were obtained on an hourly basis throughout the study.
Statistical analyses
For statistical analysis, we retained a total of 727 days (1,046,880 minutes) of data for the F-POD and (1,509,120 minutes) for the C-POD. Due to the lack of consistent temporal data collection using the C-POD (Supplementary Table 3), we chose to conduct statistical analysis on F-POD data only. All statistical analyses for this data were carried out in R version 4.12 (R Core Team, 2020) and R Studio version 2021.09.1.372 (R Studio Team, 2021).
To investigate the importance of PHP echolocation activity covariates using F-POD data, we used Generalised Additive Models (GAM) with log link functions and negative binomial distribution to account for overdispersion, using the bam() function from R package mgcv v. 1.8-38 (Wood, 2022). We used number of detection positive minutes (DPM) as the response variable. Before running models, we first tested for evidence of collinearity in the data using the vif function from the car R package v. 3.0-12 (Fox et al., 2022), with 5 as a cut-off value (Craney and Surles, 2002). We assessed the response variable for autocorrelation via ACF plots using the acf() function (mgcv package), with 0.2 as the threshold (Nuuttila et al., 2017). No evidence of autocorrelation was detected, therefore subsequent models were run without AR1 structure. We did not detect collinearity among our covariates (Hour, Month, average Chlorophyll A (μg/L), average practical salinity (PSU), average sea level (m), average temperature (°C), average turbidity (NTU), diel phase (Morning, Day, Evening, Night1 and Night2) and moon phase); therefore, all selected variables were retained in the model. Non-significant variables (P>0.05) were sequentially removed from the model by assessing the resulting P-values from the Parametric Coefficients and the Approximate significance of smooth terms for each variable in the model summary. Final model selection was based on a combination of Akaike’s Information Criterion (AIC) and the adjusted R2 values.
We visualized the relationship between DPM and month/hour for F-POD data using ggplot() function in R package ggplot2 v.3.3.5. (Wickham et al., 2022). For C-POD data, we plotted DPM against hour using data from months where data was collected consistently over the three years (July to October 2016-2018; Supplementary Table 3). This subset of contained 313 days (450,720 minutes) of data. For both F-POD and C-POD data, we plotted diurnal echolocation activity patterns per month, using the mean DPM across years.
Results
Harbour porpoise aggregations in Prince Rupert
After filtering BCCSN data for opportunistic PHP sightings within the geographical boundary of the wider study area (latitude 54.174 to 54.366 and longitude -130.549 to -130.116), we retained 626 sightings. Reports spanned from 1993 to 2022 and consisted of a minimum of 2,647 PHP individuals. We created aggregation categories of 1 to 5 individuals, 6 to 10, 11 to 30, and 31+ (Table 1). The most common aggregation size was 1 to 5 individuals (541 sightings), followed by 6 to 10 (46 sightings) and then 11 to 30 (27 sightings; Table 1). There were 12 sightings reports which recorded over 31 individuals with the largest estimated at between 200 and 1000 individuals (Fisheries and Oceans Canada, pers.comm). Aggregations of PHP >11 (n=39) were reported between the months of December to April (Table 1). The first year in which large aggregations (>30) of PHP were reported was 2011 (Supplementary Table 4). Since routine monitoring of PHP began in 2016, the number of sightings per year increase from around <30 to >50 (Supplementary Table 4).
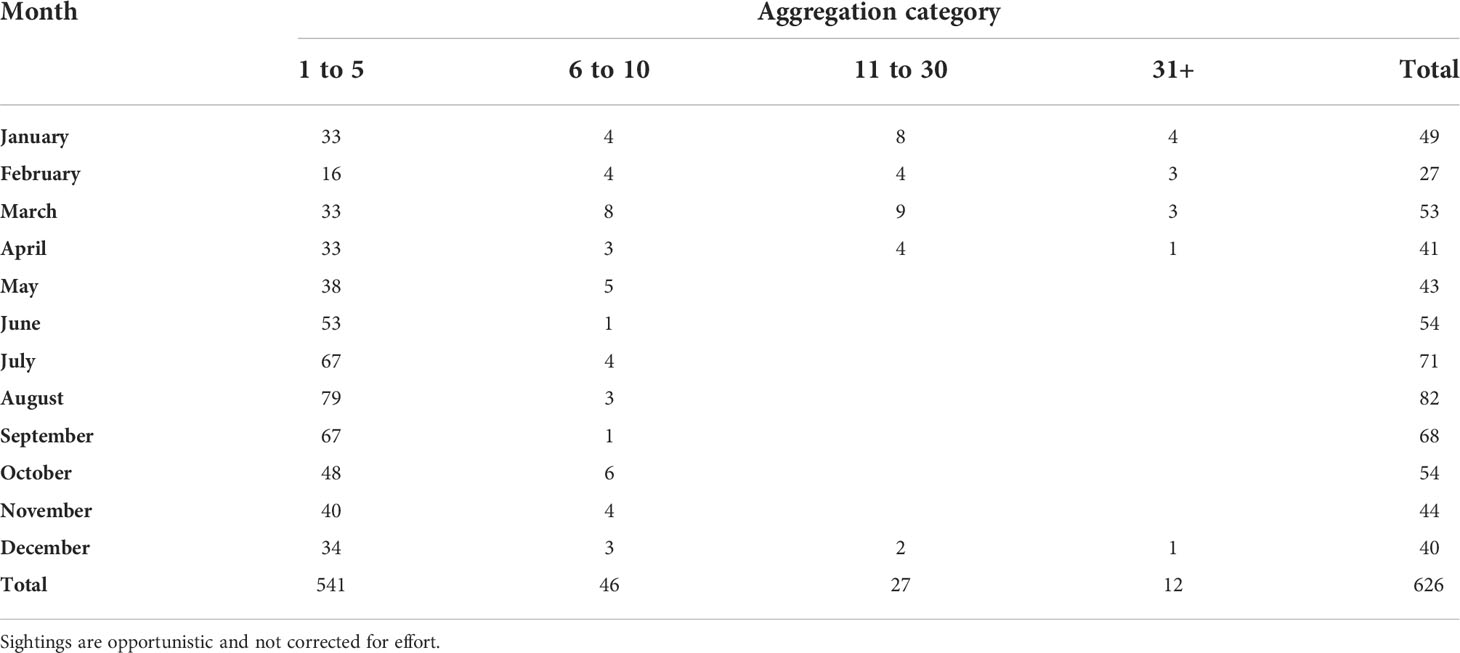
Table 1 B.C. Cetacean Sightings Network (BCCSN) data pull for number of harbour porpoise sightings, including number of individuals, reported per month within the Prince Rupert wider study area between 1993 and March 2022.
Land-based surveys versus C-POD detection
A total of 49 surveys were conducted between July 13, 2016, and June 28, 2019 (Supplementary Table 3). For 31 of these surveys, the C-POD was actively recording echolocation activity. PHPs were detected on 42 of the land-based surveys visually (86%), and the C-POD detected PHPs during 77% of the 31 surveys it was deployed for (Supplementary Table 5). In comparing visual and C-POD detections, PHP were not visually detected for 2 (6%) of the surveys that had positive C-POD detections and PHP were not acoustically detected for 4 (13%) of the surveys that had positive visual detections (Supplementary Table 5). The difference between these proportions was not statistically significant (McNemar’s chi-squared = 0, p = 1). The cumulative number of PHP observed during visual surveys ranged between 1 and 116 (Supplementary Table 5), with an average of 17 PHP observed per survey. There was a statistically significant correlation between the cumulative number of PHP observed and DPM per survey (rs (29) = 0.52, p < 0.05).
GAM model
The final GAM model included the following covariates with porpoise detections: sample year (2020 and 2021), month (January to December), hour (1 to 24), practical salinity (PSU), Chlorophyll A (μg/L), and diel phase (Morning, Day, Evening, Night1 and Night2; Figure 2). This model explained 14.3% of the variation observed (Supplementary Table 6). Month and sample year were the most important covariates for determining PHP echolocation activity based on both AIC and adjusted-R2 values (Table 2). All covariates had significant effects in the model (Supplementary Table 6).
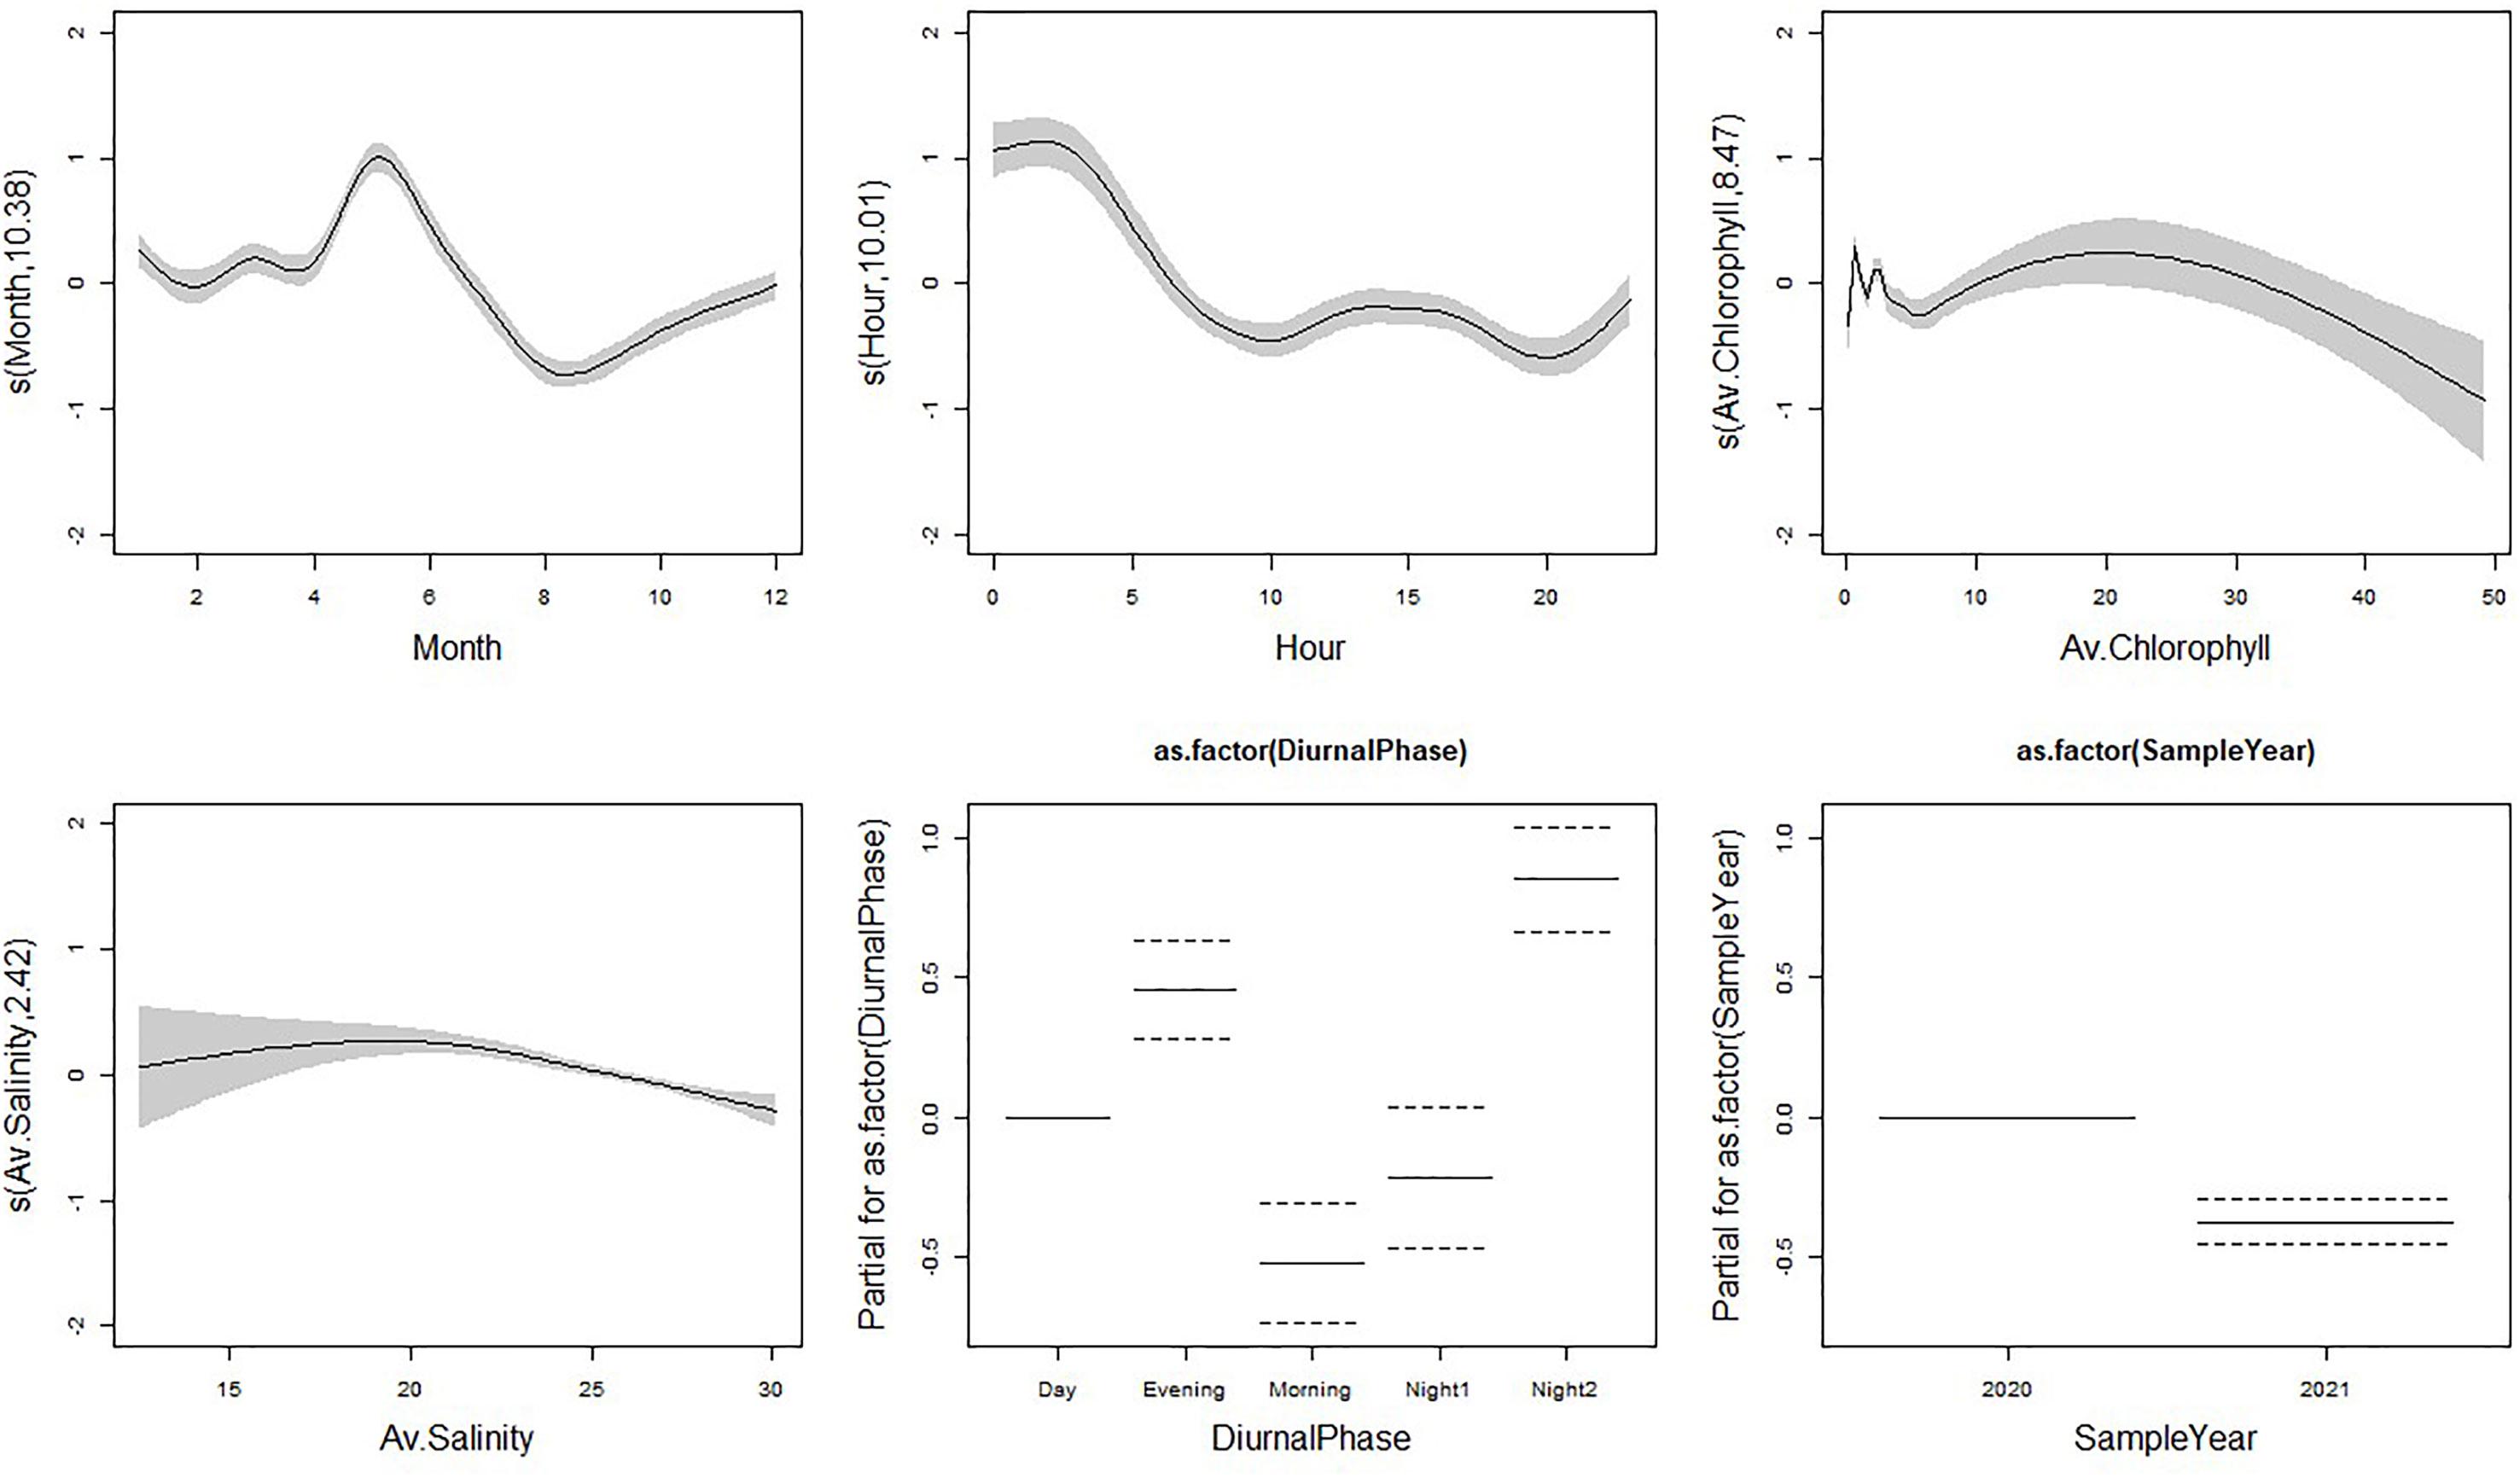
Figure 2 Fitted relationships for our F-POD Detection Positive Minutes (DPM) model based on GAM standard errors. 95% confidence intervals are represented by the grey areas around the relationship for each smooth covariate and as dotted lines for factor variables. The Y axis displays the partial residuals for each model covariate generated by regressing the response on the other covariates. A larger Y axis indicates a more important covariate for DPM of harbour porpoise.
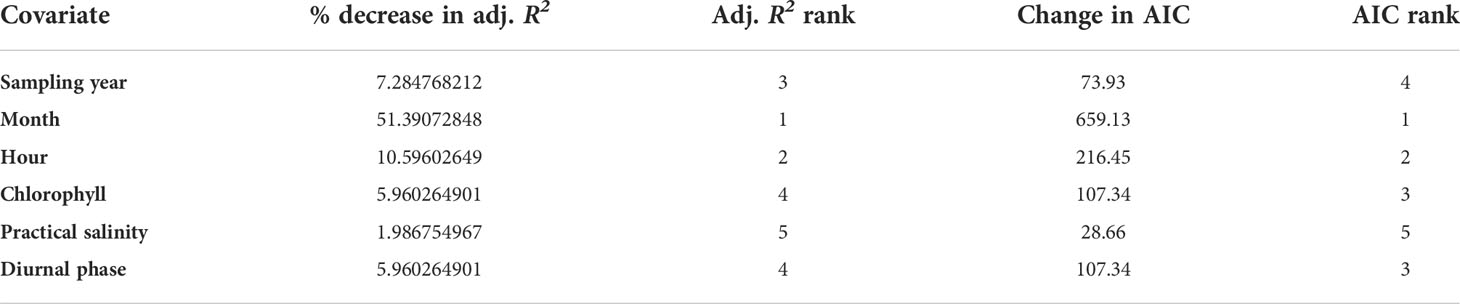
Table 2 The relative influence of model covariates for explaining the harbour porpoise activity patterns.
Monthly variation in echolocation activity
When observing the mean train length duration per month, peak train length duration occurred between the months of May to June, with lowest mean train length duration occurring between the months of July to October (F-POD data; Figure 3). There was a clear difference in mean train length duration between the two sampling years, with 2020 displaying higher values for the peak month (47,865) compared to 2021 (16,544; Supplementary Table 7).
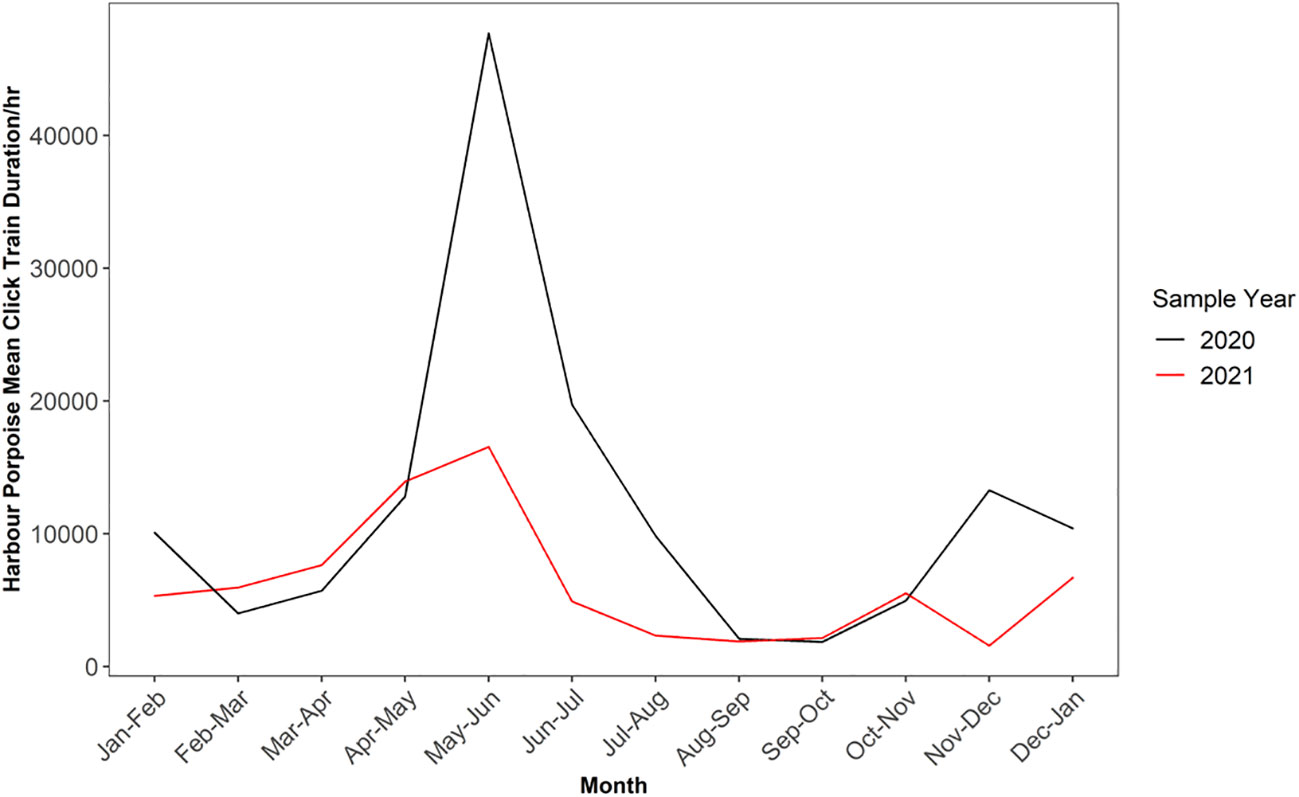
Figure 3 Monthly variation in mean click train duration for harbour porpoise across 2020 and 2021 sampling years for F-POD data. Note sample year begins January 24th and ends January 23rd and 20th respectively.
For DPM, PHP detections peaked between the months of May and June, with a secondary peak in echolocation activity occurring between November to December in 2020 (F-POD data; Supplementary Table 7). Echolocation activity peaks were more pronounced in 2020, with mean DPM per hour value nearly halving from 9.3 in 2020 to 5.3 in 2021 for the same time period (Supplementary Table 7). Additionally, we did not observe a secondary activity peak between November to December in 2021; this time period also has the lowest mean DPM per hour for all of 2021 (0.9). Echolocation activity was the lowest between the months of August to November for 2020, and similar levels of DPM were observed for both F-POD sampling years between August to November.
Diel variation in echolocation activity
Diel period was an important factor in determining PHP echolocation activity. The mean detections peaked between the hours of darkness 23:00-3:00 PST, before sharply dropping off between the hours of 3:00-5:00/6:00 PST (Figure 4). A similar diel echolocation activity pattern was observed in the C-POD data (Supplementary Figure 1). Hourly DPM between 2016 and 2018 for July to October displayed higher echolocation activity during dark and civil twilight hours compared to daylight hours for all 3 years (Supplementary Figure 1). For F-POD data daylight hours (between 7:00-20:00 PST on average) were the least echolocation active periods for harbour porpoise, with DPMs as low as 310 versus values of >1000 DPM during peak periods (Figure 4).
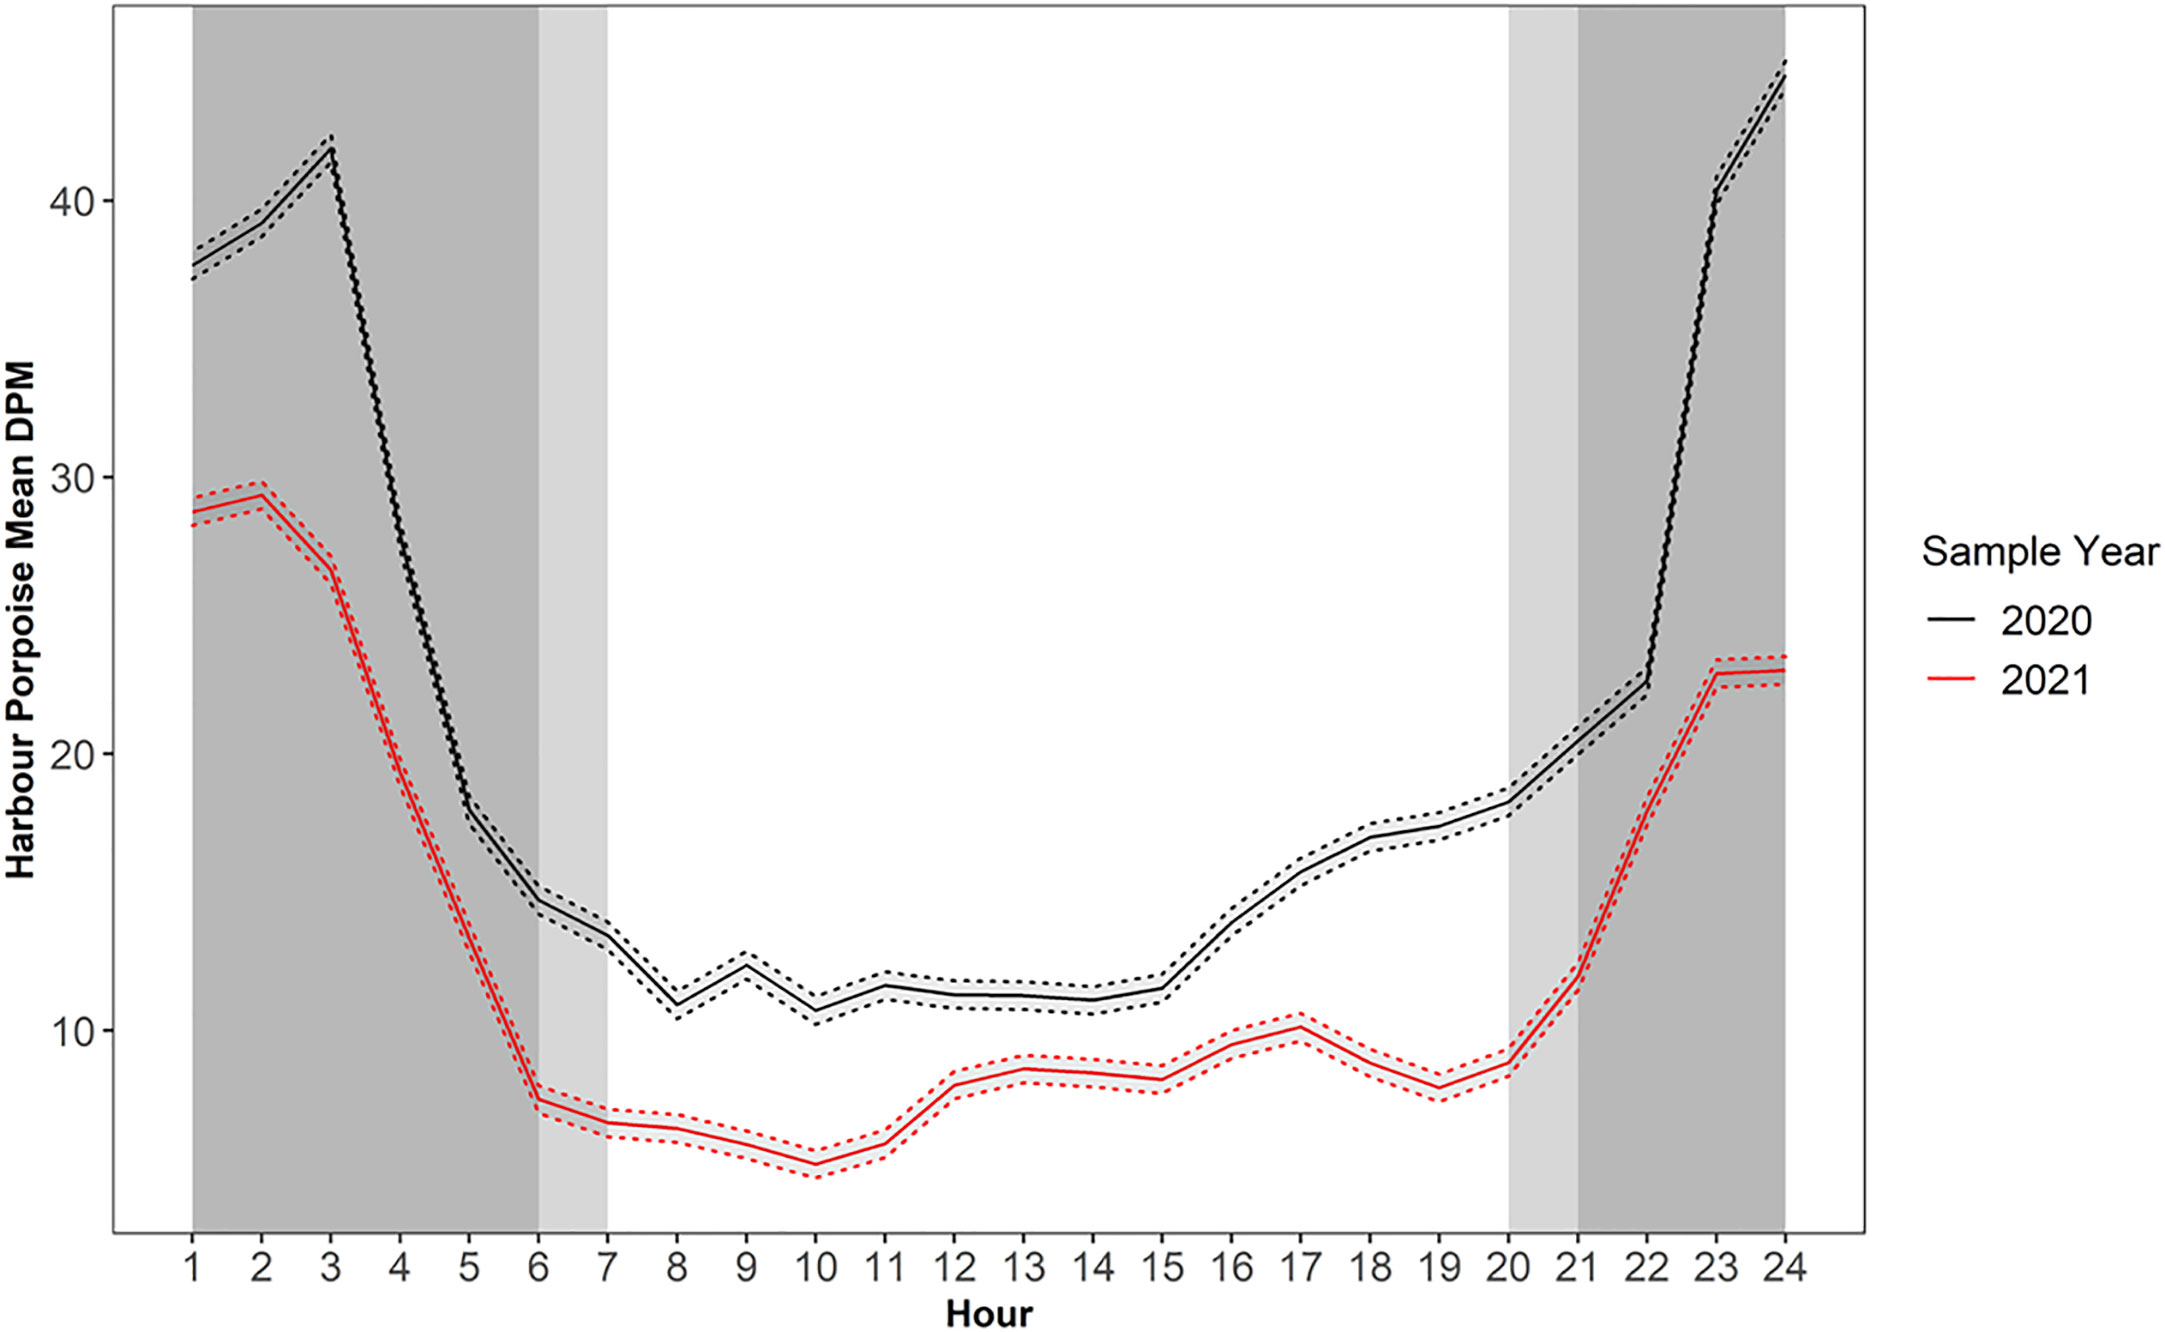
Figure 4 Diel variation in mean harbour porpoise Detection Positive Minutes (DPM) for F-POD data. Dashed line depicts the 95% confidence interval around the means. Note sample year begins January 24th and ends January 23rd and 20th respectively.
For individual months, higher levels of daytime echolocation activity were observed between January and March and in September for F-POD data (Figure 5). Similarly, despite only July-October sampled consistently for the three years for C-POD data, the mean DPM for per month displayed greater extent of daytime echolocation activity between January and March, with a peak in nighttime echolocation activity between April and August (Supplementary Figure 2). This pattern corresponds with the diel echolocation activity per month patterns as observed with F-POD data (Figure 5).
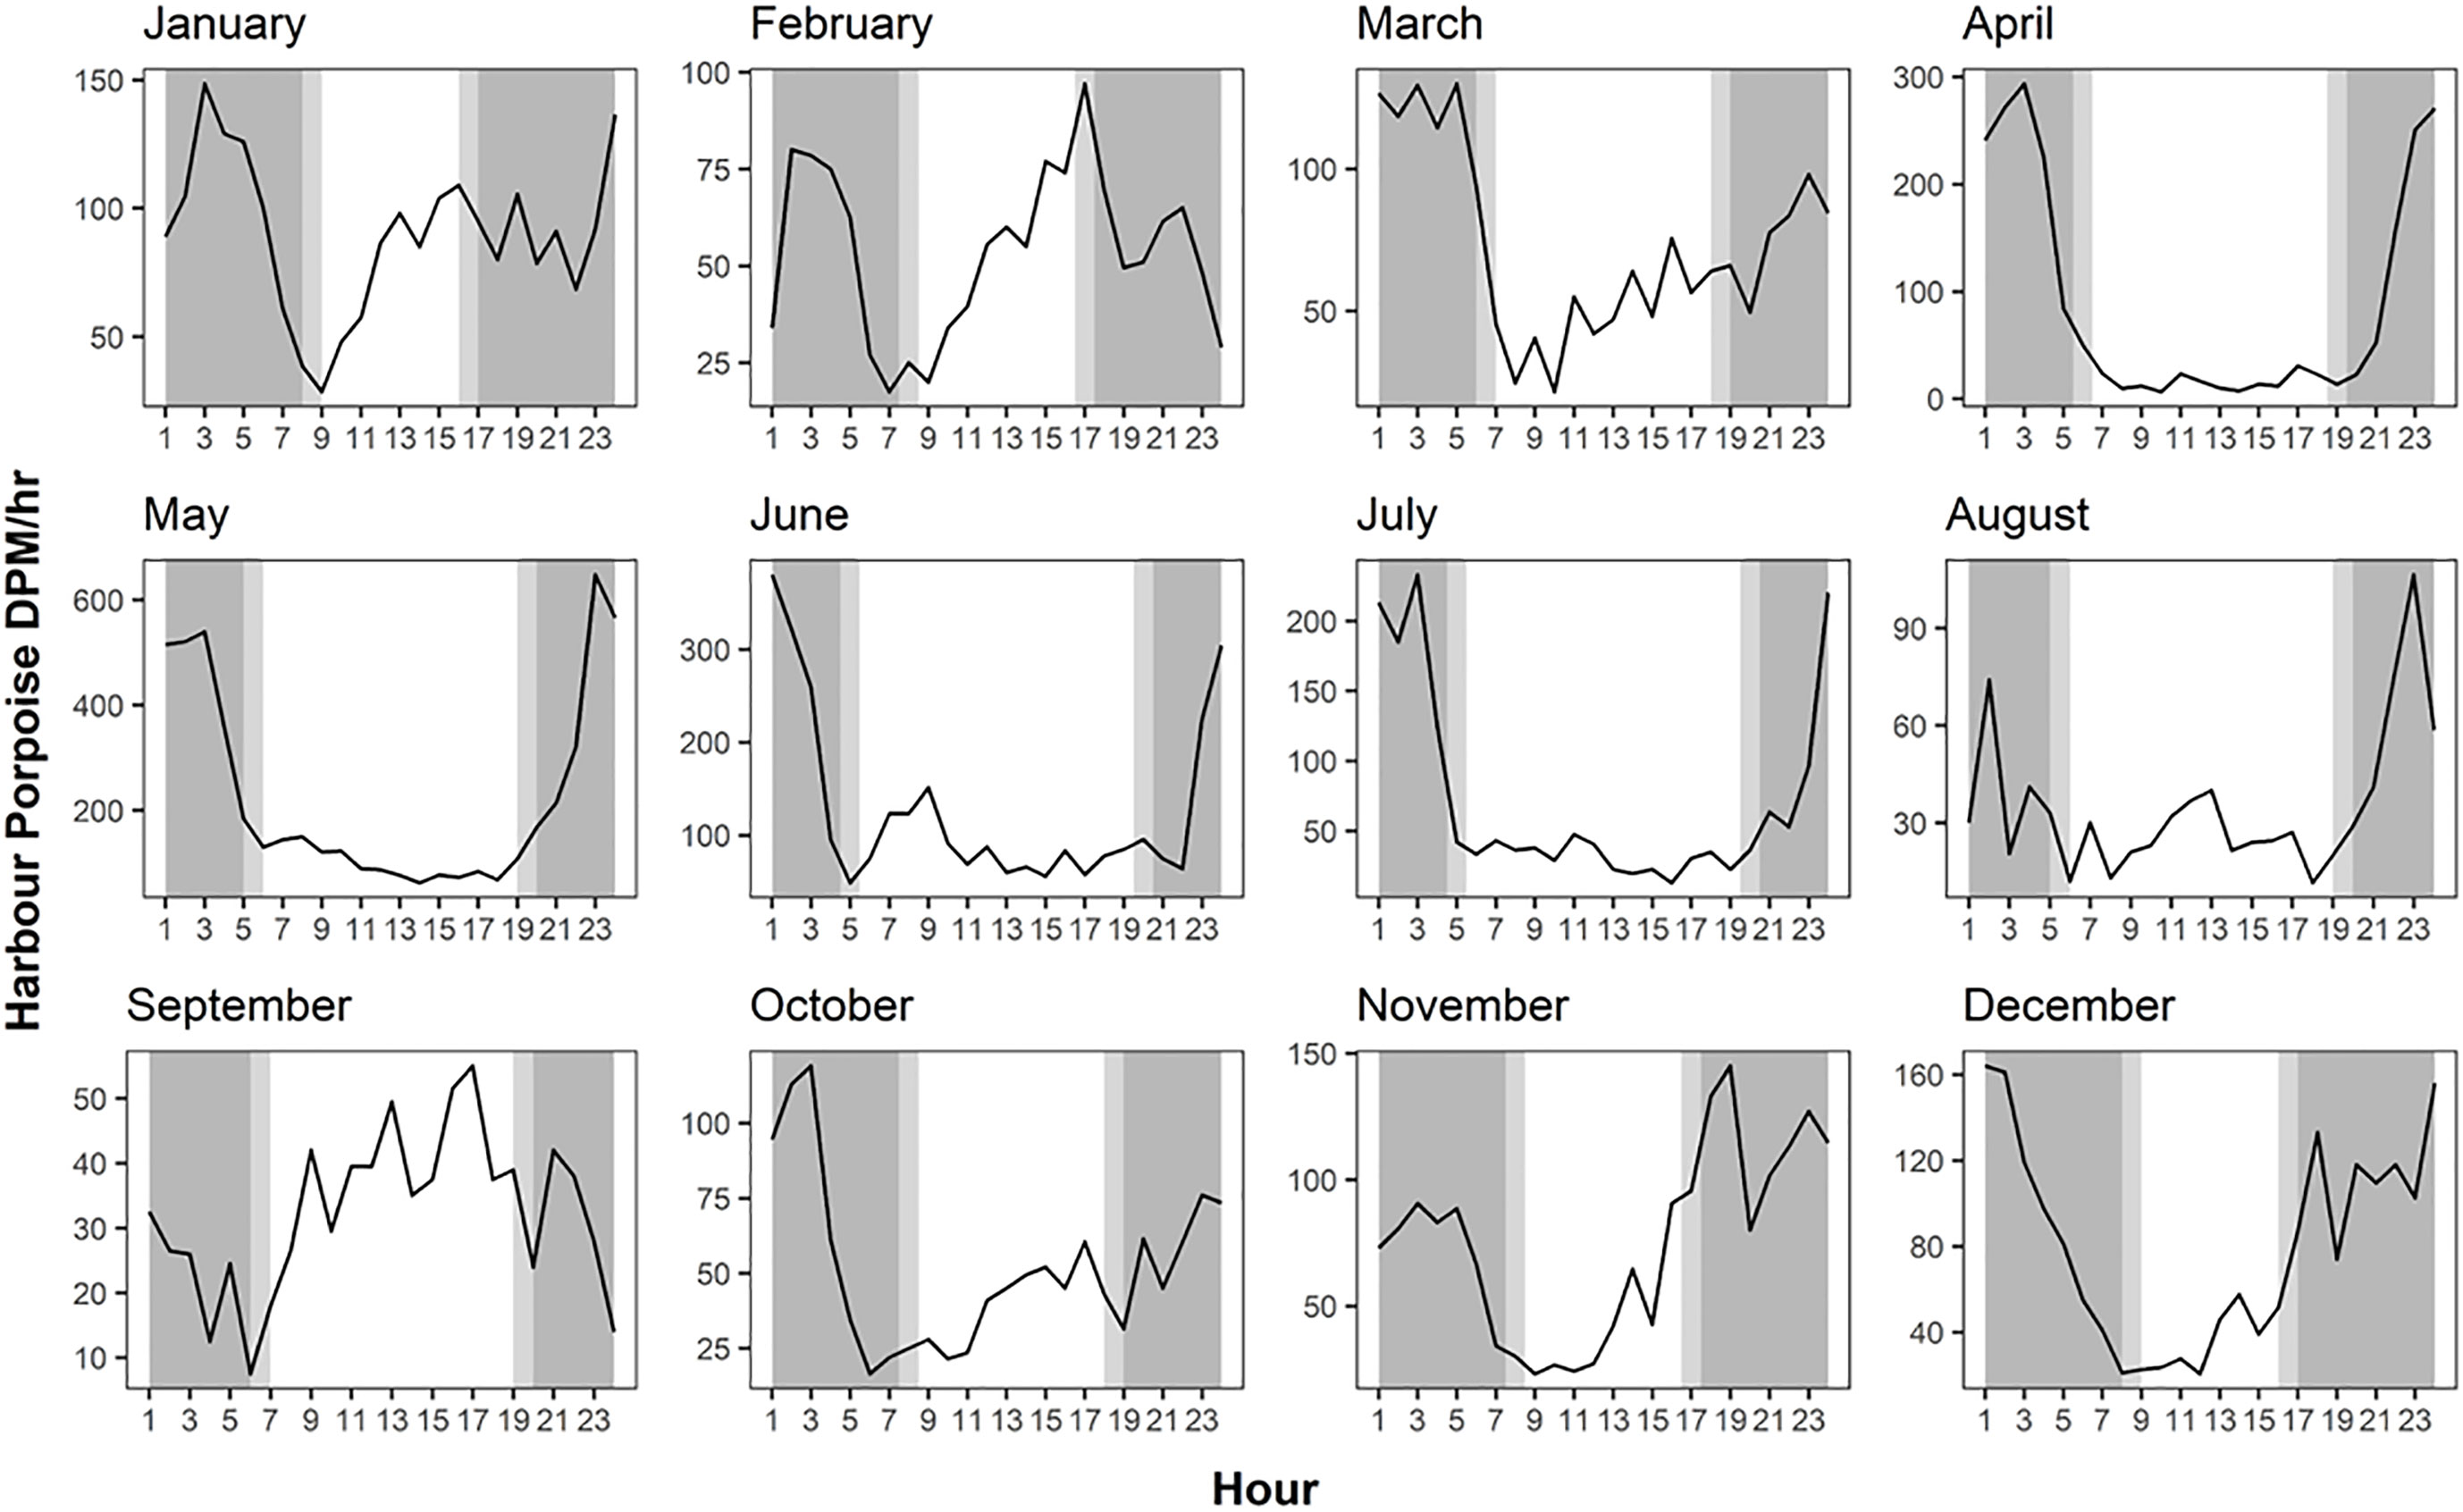
Figure 5 Hourly variation in mean harbour porpoise Detection Positive Minutes (DPM) across months for F-POD data. Data for 2020 and 2021 combined.
Environmental influence on echolocation activity variation
Detections of PHP varied across the range of Chlorophyll A and practical salinity values recorded. Generally, mean DPM peaked around 23-24 PSU for practical salinity and for Chlorophyll A, DPM peaked at 2.5 µg/L and 4.5 µg/L for 2020 and 2021 respectively. Mean DPM was lowest at higher salinities (>27) and for Chlorophyll A levels < 2.0 µg/L (Supplementary Figure 3). Levels of Chlorophyll A peaked bi-annually for both years (April and July), with higher levels of Chlorophyll A in 2021 (Supplementary Figure 4), whereas salinity levels remained relatively consistent throughout the seasons, with slightly elevated levels between January and May for both years (Supplementary Figure 5).
Discussion
In this study, we have shown how both passive acoustic monitoring and land-based surveys can be used to determine fine-scale trends in PHP echolocation activity within a highly trafficked coastal area. Continuous data collection from PAM devices is demonstrated to being key in understanding the influence of environmental covariates on PHP echolocation activity. Through deploying F-PODs on a rotational basis, it is possible to capture data to extract inter-annual and intra-annual trends in echolocation activity with confidence.
Visual surveys, whether via a vessel- or land-based platform, are the most widely used approach for assessing cetacean presence and distribution (Frasier et al., 2021). Whilst vessel-based surveys typically cover a wide spatial area and can provide metrics on abundance and a greater number of behavioural metrics of observed cetaceans, observations are limited to when animals surface to breathe, daylight hours, visibility, weather, presence of vessels and often sea state (Forney et al., 1991; Soldevilla et al., 2011; Yack et al., 2014; Frasier et al., 2021). For PHP, we found that both PAM devices and land-based survey approaches had similar levels of detectability for determining both presence and relative numbers of PHP within our study site. The high sensitivity of PAM devices such as C-PODs, F-PODs and their predecessors (POD and T-PODs) for detecting HPs is already well known e.g. (Simon et al., 2010; Tregenza et al., 2016; Jacobson et al., 2017). Harbour porpoise in British Columbia are subject to predation by Bigg’s killer whales, which may use the porpoise’ own echolocation signals as an aide to locating them (Barrett-Lennard et al., 1996). One might therefore expect porpoises in this part of their range to use echolocation sparingly and remain silent much of the time. We found this not to be the case—indeed, the concordance of visual and acoustic detections reported here was striking, consistent with findings reported by Akamatsu et al., 2007. Furthermore, we detected PHP on 96% and 100% of C-POD and F-POD deployment days respectively. This suggests that in our study area the perceived risk of predation by Bigg’s killer whales was low during our observing periods and/or that the foraging advantage provided by echolocation outweighed the increased risk of predation that it posed.
In addition to the high detection rates, the F-POD derived data demonstrated distinct seasonal and diel variations in PHP echolocation activity. Seasonality of HPs is relatively well understood for populations in the UK and Europe; peak echolocation activity was observed in April for North Sea populations (Zein et al., 2019), October to March for west Wales populations (Simon et al., 2010; Nuuttila et al., 2017), December to February for northwest Ireland populations (Todd et al., 2009), April to October in Baltic Sea populations (Sveegaard et al., 2012), and August for northwestern North Sea populations (Weir et al., 2007). In a majority of cases, local prey abundance was hypothesized to be driving these inter-annual peaks of echolocation activity (Weir et al., 2007; Sveegaard et al., 2012; Schaffeld et al., 2016).
We detected a distinct peak in PHP echolocation activity between April and August for both years, which corresponded with the double peak of Chlorophyll A concentrations in April and July (Supplementary Figure 4) and was supported by the significance of Chlorophyll A as an echolocation activity predictor for PHP. Elsewhere in the world, HP echolocation activity is known to coincide with Chlorophyll A concentration peaks (Tynan et al., 2005; Gilles et al., 2011; Wingfield et al., 2017; Stalder et al., 2020). In the NE Pacific, Chlorophyll A concentrations have been shown to highly correlate with variation in resident fish yield (Ware and Thomson, 2005), and in particular with the productivity of Pacific herring (Clupea pallasi) populations (Perry and Schweigert, 2008). PHP are known to feed on a variety of fish species, including sand lance (Ammodyies hexapterus), Pacific hake (Merluccius productus), and Pacific herring (Clupea pallasi) (Hall, 2011; Nichol et al., 2013), suggesting that the trends in echolocation activity we observed are related to the presence of prey. Juvenile herring tend to have greater nutrition-dense prey availability after the initial May phytoplankton bloom (Foy and Norcross, 1999) and therefore are located more readily in coastal waters in the northeast Pacific between May and October (Beamish, 1995; Fisheries and Oceans Canada, 2008; Lewandoski and Bishop, 2018). PHP tend to forage for mostly small fish as opposed to those focused on by fisheries (Wisniewska et al., 2016), therefore seasonal trends observed in our study could be largely driven by presence of nutritionally rich juvenile herring between the months of May and August.
Additional hydrography variables, including salinity, are also known to influence the availability and distribution of important HP prey (van Beest et al., 2018). In the North Sea, the distribution of Atlantic herring (Clupea harengus), particularly spawning populations, positively correlates with salinity levels (Akimova et al., 2016). Salinity levels remained fairly constant over our 2020 and 2021 study period, corresponding with salinity ranges previously reported in the area (Trites, 1952; Johannessen et al., 2020). Slight reductions in salinity observed after April likely correspond to the spring freshwater input from the Skeena and Nass rivers into Chatham Sound (Trites, 1952), however PSU levels did not drop below 20, which is again consistent with previous studies (Johannessen et al., 2020). PHP echolocation activity peaked between 23 and 24 PSU, which coincides with the timeframe where freshwater input reduced salinity levels. Some studies have described higher HP presence around the lower end of the relative salinity range for the area (Edrén et al., 2010; Stalder et al., 2020), however it is most likely that the trends observed in our study are driven by the behaviour and habitat preference of their prey (Fontaine et al., 2010; Sveegaard et al., 2012; IJsseldijk et al., 2015).
Diel trends in HP echolocation activity elsewhere have been shown to be influenced by diel trends in the distribution of prey fish species within the water column (Schaffeld et al., 2016; Wisniewska et al., 2016). In both the Atlantic and Pacific, herring display reduced predator avoidance mechanisms during the hours of darkness and tend to be located closer to the surface in less aggregated schools (Cardinale et al., 2003; Didrikas and Hansson, 2009; Godefroid et al., 2019; Zein et al., 2019). This greater availability of herring during the night could explain the mostly nocturnal PHP echolocation activity patterns observed in this study. HP need to forage nearly continuously to meet energy requirements (Wisniewska et al., 2016), therefore to optimize foraging, PHP are likely to follow the vertical distribution of their prey in the hours of darkness (Zein et al., 2019). The notable shift between January and March to increased echolocation activity during daylight hours from both F-POD and C-POD data, could also be in response to local forage fish fluctuations. Fish species including sand eels and sand lance present an inverse pattern to the diel trends of herring (Santos et al., 2004). Sand lance burrow within soft sediment during nighttime hours and spend diurnal hours foraging within the water column (Hobson, 1986). It is therefore possible that sand lance are more readily available during the daylight hours between January and March and that PHP are foraging opportunistically on them (Zein et al., 2019).
Peaks in sightings of PHP aggregations between the months of December to April co-occur with the increased diel variation we observed in these winter months. Larger aggregations of PHP are also good indicators of increased local prey availability (Sveegaard et al., 2012; Torres Ortiz et al., 2021) and could also signal evidence of annual social and/or mating interactions (Herr et al., 2009; Crossman et al., 2014). Similarly, there were peaks in total number of PHP sightings reported within the wider study area between July and August over the 23 years, again corresponding to the peaks in echolocation activity. Despite not identifying terminal feeding buzzes of PHP in this study, the proven strong relationship between Chlorophyll A concentrations, prey availability, and the energetic demands of PHP means it is likely that a majority of the echolocation activity observed is prey driven (Schaffeld et al., 2016).
Overall, this study has highlighted key patterns in PHP occurrence and identified predictors of echolocation activity patterns observed. It is evident that the area surrounding Prince Rupert between December and April is key for supporting large aggregations of PHP, especially during the daylight hours, and between April to August nocturnal activities of smaller PHP aggregations. Due to the high energetic demands of PHP, it is expected than many of these patterns are directly driven by prey distribution, density and abundance within Chatham Sound. The combination of high detection rate and apparent prey-driven responses likely reflects that the area surrounding Tuck Island at the approach to Prince Rupert Harbour is important foraging habitat for PHP. HPs elsewhere have been shown to be highly susceptible to vessel disturbance (Jenkins et al., 2009; Nabe-Nielsen et al., 2014; Oakley et al., 2017), with the effect of cumulative disturbance (i.e. vessel traffic in combination with other stressors such as prey availability) likely resulting in detrimental effects on fitness and individual survivorship (Booth et al., 2013; Dyndo et al., 2015; Wisniewska et al., 2016). However, as demonstrated in this study, PHP are currently persisting and continuing to utilize this highly trafficked area in the north Pacific on an annual basis. Results of a study from Denmark suggested that, whilst increases in ship disturbance is known to reduce population sizes, populations of HP can become resistant to vessel disturbance if the disturbance is consistent (Nabe-Nielsen et al., 2014). This suggests that HP are capable of acclimatizing to the disturbance associated with vessel traffic, providing vessel traffic volumes remain stable. This is important to consider for PHP in Prince Rupert; with the expected increased vessel traffic associated with the ongoing terminal expansion, it is possible that this increased localized disturbance could result in reductions in population size (Nabe-Nielsen et al., 2014) and is important to consider for species at risk management. Ultimately, the findings of this study could be used to inform management of PHP in the form of establishing spatial and temporal hotspots based on PHP activity. These hotspots could inform commercial mariners, industry (including proposed development and construction schedules) and recreational boaters of the periods when PHP are most active and abundant, to potentially mitigate disturbance during these periods.
Going forward, it will be beneficial to analyse echolocation train inter-click intervals (ICIs) and rates of feeding buzzes within the study site to determine foraging rates in relation to presence or absence of vessels, vessel type and total vessel traffic. To understand the influence of potential fish prey species on PHP interannual trends, robust monitoring tools such as environmental DNA (eDNA) could be employed to gather information on seasonal presence of fish community assemblages within our study site (Thomsen et al., 2016; Sigsgaard et al., 2017). Additionally, in Europe it is well known that HPs display tide-dependent patterns in occurrence (Johnston et al., 2005; Pierpoint, 2008; IJsseldijk et al., 2015), therefore it would be of interest to examine the relationship between PHP and tide in Chatham Sound to further understand additional abiotic drivers of PHP echolocation activity and foraging rates.
Data availability statement
The raw data supporting the conclusions of this article will be made available by the authors, without undue reservation.
Ethics statement
Ethical review and approval were not required for the animal study because there was no direct involvement with harbour porpoise. All data were collected via non-invasive passive acoustic monitoring.
Author contributions
KD, CB and LBL conceived the study design, KD and CB conducted fieldwork to deploy and receive C-POD and F-PODs, ABD sorted environmental and raw acoustic data into analysis files, CVR conducted statistical and graphical analysis on sorted acoustic data and CVR wrote the manuscript with support from all co-authors. All authors contributed to the article and approved the submitted version.
Funding
Fisheries and Oceans Canada provided funding for field research, salaries and open access publication fees (award number(s): 18-015-PAC PR; 2022-083-Pac-PR), and Prince Rupert Port Authority provided granted funds for field research and salaries. Donations for field research and salaries were also received from numerous additional industry partners (LNG Canada, DP World, BG Group).
Acknowledgments
We wish to acknowledge that this research took place on the traditional territory of the Nine Allied Tribes of Metlakatla and Lax Kw’alaams who have been stewards of these lands and waters since time immemorial. This project was supported partially by a financial contribution from Fisheries and Oceans Canada/Ce projet fut partiellement appuyé par une contribution financière de Pêches et océans Canada. Deployment and retrieval of the C-POD and F-POD was possible thanks to both financial and in-kind support from the Prince Rupert Port Authority. Thank you to the crew of the Charles Hays and Amwaal for your patience and perseverance throughout this project, to Aileen Jeffries for help with the study design, to James Pilkington for advice and assistance with C-POD deployment logistics, and the numerous volunteers who conducted land-based surveys. Thank you to Ocean Networks Canada and the Canadian Hydrographic Service for supplying important environmental data near the study site. Finally, thank you to previous Ocean Wise staff and volunteers for time and effort spent collecting survey data.
Conflict of interest
The authors declare that the research was conducted in the absence of any commercial or financial relationships that could be construed as a potential conflict of interest.
Publisher’s note
All claims expressed in this article are solely those of the authors and do not necessarily represent those of their affiliated organizations, or those of the publisher, the editors and the reviewers. Any product that may be evaluated in this article, or claim that may be made by its manufacturer, is not guaranteed or endorsed by the publisher.
Supplementary material
The Supplementary Material for this article can be found online at: https://www.frontiersin.org/articles/10.3389/fmars.2022.1010095/full#supplementary-material
References
Akamatsu T., Teilmann J., Miller L. A., Tougaard J., Dietz R., Wang D., et al. (2007). Comparison of echolocation behaviour between coastal and riverine porpoises. Deep Sea Research Part II: Topical Studies in Oceanography 54, 290–297. doi: 10.1371/journal.pone.0161917
Akimova A., Núñez-Riboni I., Kempf A., Taylor M. H. (2016). Spatially-resolved influence of temperature and salinity on stock and recruitment variability of commercially important fishes in the north Sea. PloS One 11, e0161917. doi: 10.1371/journal.pone.0161917
Baird R. (2003). Assessment and update status report on the harbour porpoise phocoena phocoena pacific ocean population (Ontario, Canada: Ottawa).
Barlow J. (1988). Harbor porpoise, phocoena phocoena, abundance estimate for California, Oregon, and Washington: I. ship surveys. Fish. Bull. 86, 417–432. Available at: https://spo.nmfs.noaa.gov/sites/default/files/pdf-content/1988/863/barlow.pdf
Barrett-Lennard L. G., Ford J. K. B., Heise K. A. (1996). The mixed blessing of echolocation: differences in sonar use by fish-eating and mammal-eating killer whales. Anim. Behav. 51, 553–565. doi: 10.1006/anbe.1996.0059
Beamish R. J. (1995). Climate change and northern fish populations (Ottawa, Ontario, Canada: NRC Research Press).
Benhemma-Le Gall A., Graham I. M., Merchant N. D., Thompson P. M. (2021) Broad-scale responses of harbor porpoises to pile-driving and vessel activities during offshore windfarm construction. frontiers in marine science. Available at: https://www.frontiersin.org/article/10.3389/fmars.2021.664724 (Accessed June 26, 2022).
Benjamins S., van Geel N., Hastie G., Elliott J., Wilson B. (2017). Harbour porpoise distribution can vary at small spatiotemporal scales in energetic habitats. Deep Sea Res. Part II: Topical Stud. Oceanogr. 141, 191–202. doi: 10.1016/j.dsr2.2016.07.002
Booth C. G., Embling C., Gordon J., Calderan S. V., Hammond P. S. (2013). Habitat preferences and distribution of the harbour porpoise phocoena phocoena west of Scotland. Mar. Ecol. Prog. Ser. 478, 273–285. doi: 10.3354/meps10239
Brandt M. J., Hansen S., Diederichs A., Nehls G. (2014). Do man-made structures and water depth affect the diel rhythms in click recordings of harbor porpoises (Phocoena phocoena)? Mar. Mamm. Sci. 30, 1109–1121. doi: 10.1111/mms.12112
Cardinale M., Casini M., Arrhenius F., Håkansson N. (2003). Diel spatial distribution and feeding activity of herring (Clupea harengus) and sprat (Sprattus sprattus) in the Baltic Sea. Aquat. Living Resour. 16, 283–292. doi: 10.1016/S0990-7440(03)00007-X
Carlström J. (2005). Diel variation in echolocation behavior of wild harbor porpoises. Mar. Mamm. Sci. 21, 1–12. doi: 10.1111/j.1748-7692.2005.tb01204.x
Chivers S., Dizon A., Gearin P., Robertson K. (2002) Small-scale population structure of eastern north pacific harbour porpoises (Phocoena phocoena) indicated by molecular genetic analyses. journal of cetacean research and management. Available at: https://www.semanticscholar.org/paper/Small-scale-population-structure-of-eastern-North-Chivers-Dizon/5fe0830c3bd6e716807178524a221195e36be7b2 (Accessed June 26, 2022).
Clarke C. L., Jamieson G. S. (2006). Identification of ecologically and biologically significant areas in the pacific north coast integrated management area: Phase II – final report. Fisheries and Oceans Canada, Nanaimo, British Columbia, Canada
Craney T. A., Surles J. G. (2002). Model-dependent variance inflation factor cutoff values. Qual. Eng. 14, 391–403. doi: 10.1081/QEN-120001878
Crossman C., Barrett-Lennard L., Taylor E. (2014). Population structure and intergeneric hybridization in harbour porpoises phocoena phocoena in British Columbia, Canada. Endang. Species Res. 26, 1–12. doi: 10.3354/esr00624
Didrikas T., Hansson S. (2009). Effects of light intensity on activity and pelagic dispersion of fish: studies with a seabed-mounted echosounder. ICES J. Mar. Sci. 66, 388–395. doi: 10.1093/icesjms/fsn173
Dyndo M., Wiśniewska D. M., Rojano-Doñate L., Madsen P. T. (2015). Harbour porpoises react to low levels of high frequency vessel noise. Sci. Rep. 5, 11083. doi: 10.1038/srep11083
Edrén S. M. C., Wisz M. S., Teilmann J., Dietz R., Söderkvist J. (2010). Modelling spatial patterns in harbour porpoise satellite telemetry data using maximum entropy. Ecography 33, 698–708. doi: 10.1111/j.1600-0587.2009.05901.x
Elliser C. R., Hessing S., MacIver K. H., Webber M. A., Keener W. (2020). Harbor porpoises (Phocoena phocoena vomerina) catching and handling large fish on the U.S. West Coast. Aquatic Mammals 46, 191–199. doi: 10.1578/AM.46.2.2020.191
Elliser C. R., Hall A. (2021) Return of the salish Sea harbor porpoise, phocoena phocoena: Knowledge gaps, current research, and what we need to do to protect their future. frontiers in marine science. Available at: https://www.frontiersin.org/article/10.3389/fmars.2021.618177 (Accessed June 26, 2022).
Fisheries and Oceans Canada (2008). Stock assessment report on prince Rupert district pacific herring (Naniamo: Pacific Biological Station).
Fisheries and Oceans Canada (2009). Management plan for the pacific harbour porpoise (Phocoena phocoena) in Canada (Ottawa: Fisheries and Oceans Canada).
Fontaine M. C., Tolley K. A., Michaux J. R., Birkun A., Ferreira M., Jauniaux T., et al. (2010). Genetic and historic evidence for climate-driven population fragmentation in a top cetacean predator: the harbour porpoises in European water. Proc. R. Soc. B: Biol. Sci. 277, 2829–2837. doi: 10.1098/rspb.2010.0412
Forney K. A., Hanan D. A., Barlow J. (1991). Detecting trends in harbor porpoise abundance from aerial surveys using analysis of covariance. Fish. Bull. 89, 367–377. Available at: https://spo.nmfs.noaa.gov/sites/default/files/pdf-content/1991/893/forney.pdf.
Fox J., Weisberg S., Price B., Adler D., Bates D., Baud-Bovy G., et al. (2022) Car: Companion to applied regression. Available at: https://CRAN.R-project.org/package=car (Accessed June 26, 2022).
Foy R. J., Norcross B. L. (1999). Spatial and temporal variability in the diet of juvenile pacific herring (Clupea pallasi) in prince William sound, Alaska. Can. J. Zool. 77, 697–706. doi: 10.1139/z99-030
Frasier K. E., Garrison L. P., Soldevilla M. S., Wiggins S. M., Hildebrand J. A. (2021). Cetacean distribution models based on visual and passive acoustic data. Sci. Rep. 11, 8240. doi: 10.1038/s41598-021-87577-1
Gaskin D. E. (1984). The harbour porpoise phocoena phocoena (L.) : regional populations, status and information on direct and indirect catches. Environment Canada, Ottawa, Ontario, Canada
Gilles A., Adler S., Kaschner K., Scheidat M., Siebert U. (2011). Modelling harbour porpoise seasonal density as a function of the German bight environment: implications for management. Endang. Species Res. 14, 157–169. doi: 10.3354/esr00344
Godefroid M., Boldt J. L., Thorson J. T., Forrest R., Gauthier S., Flostrand L., et al. (2019). Spatio-temporal models provide new insights on the biotic and abiotic drivers shaping pacific herring (Clupea pallasi) distribution. Prog. Oceanogr. 178, 102198. doi: 10.1016/j.pocean.2019.102198
Goodwin L. (2008). Diurnal and tidal variations in habitat use of the harbour porpoise (Phocoena phocoena) in southwest Britain. Aquat. Mamm. 34, 44–53. doi: 10.1578/AM.34.1.2008.44
Government of Canada (2002). Species at risk act (Schedule 1), S.C. Minister of Justice, Ottawa, Ontario, Canada
Hall A. (2004). Seasonal abundance, distribution and prey species of harbour porpoise (Phocoena phocoena) in southern Vancouver island waters. University of British Columbia, Vancouver, British Columbia, Canada
Hall A. (2011). Foraging behaviour and reproductive season habitat selection of northeast pacific porpoise. University of British Columbia, Vancouver, British Columbia, Canada
Hammond P. S., Berggren P., Benke H., Borchers D. L., Collet A., Heide-Jørgensen M. P., et al. (2002). Abundance of harbour porpoise and other cetaceans in the north Sea and adjacent waters. J. Appl. Ecol. 39, 361–376. doi: 10.1046/j.1365-2664.2002.00713.x
Herr H., Fock H. O., Siebert U. (2009). Spatio-temporal associations between harbour porpoise phocoena phocoena and specific fisheries in the German bight. Biol. Conserv. 142, 2962–2972. doi: 10.1016/j.biocon.2009.07.025
Hobson E. S. (1986). Predation on the pacific sand lance, ammodytes hexapterus (Pisces: Ammodytidae), during the transition between day and night in southeastern Alaska. Copeia (1), 223–226. doi: 10.2307/1444914
IJsseldijk L. L., Camphuysen K. C. J., Nauw J. J., Aarts G. (2015). Going with the flow: Tidal influence on the occurrence of the harbour porpoise (Phocoena phocoena) in the marsdiep area, the Netherlands. J. Sea Res. 103, 129–137. doi: 10.1016/j.seares.2015.07.010
Jacobson E. K., Forney K. A., Barlow J. (2017). Using paired visual and passive acoustic surveys to estimate passive acoustic detection parameters for harbor porpoise abundance estimates. J. Acoust. Soc. Am. 141, 219. doi: 10.1121/1.4973415
Jefferson T. A., Campbell G. S., Smultea M. A., Courbis S. S. (2016). Harbor porpoise (Phocoena phocoena) recovery in the inland waters of Washington: estimates of density and abundance from aerial surveys 2013-2015. Can. J. zool. 94, 505–515. doi: 10.1139/cjz-2015-0236
Jeffries A. (2012). Passive acoustics: An effective monitoring technique for the harbour porpoise (Washington: Pacific Biodiversity Institute).
Jenkins R. E., Brown R. D. H., Phillips M. R. (2009). Harbour porpoise (Phocoena phocoena) conservation management: A dimensional approach. Mar. Policy 33, 744–749. doi: 10.1016/j.marpol.2009.02.003
Johannessen S. C., Greer C. W., Hannah C. G., King T. L., Lee K., Pawlowicz R., et al. (2020). Fate of diluted bitumen spilled in the coastal waters of British Columbia, Canada. Mar. Pollut. Bull. 150, 110691. doi: 10.1016/j.marpolbul.2019.110691
Johnston D., Westgate A., Read A. (2005). Effects of fine-scale oceanographic features on the distribution and movements of harbour porpoises phocoena phocoena in the bay of fundy. Mar. Ecol. Prog. Ser. 295, 279–293. doi: 10.3354/meps295279
Keen E. M., Wray J., Hendricks B., O’Mahony É., Picard C. R., Alidina H. (2020). Determining marine mammal detection functions for a stationary land-based survey site. wilr 48, 115–126. doi: 10.1071/WR19232
Lewandoski S., Bishop M. A. (2018). Distribution of juvenile pacific herring relative to environmental and geospatial factors in prince William sound, Alaska. Deep Sea Res. Part II: Topical Stud. Oceanogr. 147, 98–107. doi: 10.1016/j.dsr2.2017.08.002
McNemar Q. (1947). Note on the sampling error of the difference between correlated proportions or percentages. Psychometrika 12, 153–157. doi: 10.1007/BF02295996
Nabe-Nielsen J., Sibly R. M., Tougaard J., Teilmann J., Sveegaard S. (2014). Effects of noise and by-catch on a Danish harbour porpoise population. Ecol. Model. 272, 242–251. doi: 10.1016/j.ecolmodel.2013.09.025
Nichol L. M., Hall A. M., Ellis G. M., Stredulinsky E., Boogaards M., Ford J. K. B. (2013). Dietary overlap and niche partitioning of sympatric harbour porpoises and dall’s porpoises in the salish Sea. Prog. Oceanogr. 115, 202–210. doi: 10.1016/j.pocean.2013.05.016
Nielsen K. A., Robbins J. R., Embling C. B. (2021). Spatio-temporal patterns in harbour porpoise density: citizen science and conservation in UK seas. Mar. Ecol. Prog. Ser. 675, 165–180. doi: 10.3354/meps13828
Nuuttila H. K., Courtene-Jones W., Baulch S., Simon M., Evans P. G. H. (2017). Don’t forget the porpoise: acoustic monitoring reveals fine scale temporal variation between bottlenose dolphin and harbour porpoise in Cardigan bay SAC. Mar. Biol. 164, 50. doi: 10.1007/s00227-017-3081-5
Oakley J. A., Williams A. T., Thomas T. (2017). Reactions of harbour porpoise (Phocoena phocoena) to vessel traffic in the coastal waters of south West Wales, UK. Ocean Coast. Manage. 138, 158–169. doi: 10.1016/j.ocecoaman.2017.01.003
Osiecka A. N., Jones O., Wahlberg M. (2020). The diel pattern in harbour porpoise clicking behaviour is not a response to prey activity. Sci. Rep. 10, 14876. doi: 10.1038/s41598-020-71957-0
Palka D. (1995). Abundance estimate of the gulf of Maine harbor porpoise. International Whaling Commission, Cambridge, United Kingdom
Perry R. I., Schweigert J. F. (2008). Primary productivity and the carrying capacity for herring in NE pacific marine ecosystems. Prog. Oceanogr. 77, 241–251. doi: 10.1016/j.pocean.2008.03.005
Pierpoint C. (2008). Harbour porpoise (Phocoena phocoena) foraging strategy at a high energy, near-shore site in south-west Wales, UK. J. Mar. Biol. Assoc. United Kingdom 88, 1167–1173. doi: 10.1017/S0025315408000507
Prince Rupert Port Authority (2022a) Cargo volumes report summary: December 2021. Available at: https://www.rupertport.com/cargo-volumes/.
Prince Rupert Port Authority (2022b) Terminal expansion to 1.8M TEU capacity (2 stages). Available at: https://www.rupertport.com/active_project/fairview-container-terminal/.
R Core Team (2020) R: A language and environment for statistical computing. Available at: https://www.eea.europa.eu/data-and-maps/indicators/oxygen-consuming-substances-in-rivers/r-development-core-team-2006.
Ridgway S. H., Harrison R., Harrison R. J. (1998). Handbook of marine mammals: The second book of dolphins and the porpoises (San Diego, California, United States of America: Elsevier).
R Studio Team (2021). RStudio: Integrated development environment for r (Boston, MA, R Studio, Inc).
Santos M. B., Pierce G. J., Learmonth J. A., Reid R. J., Ross H. M., Patterson I. A. P., et al. (2004). Variability in the diet of harbor porpoises (phocoena phocoena) in Scottish waters 1992–2003. Mar. Mamm. Sci. 20, 1–27. doi: 10.1111/j.1748-7692.2004.tb01138.x
Sarnocinska J., Tougaard J., Johnson M., Madsen P. T., Wahlberg M. (2016). Comparing the performance of c-PODs and SoundTrap/PAMGUARD in detecting the acoustic activity of harbor porpoises (Phocoena phocoena) (Dublin, Ireland, Proceedings of Meetings on Acoustics), 070013. doi: 10.1121/2.0000288
Schaffeld T., Bräger S., Gallus A., Dähne M., Krügel K., Herrmann A., et al. (2016). Diel and seasonal patterns in acoustic presence and foraging behaviour of free-ranging harbour porpoises. Mar. Ecol. Prog. Ser. 547, 257–272. doi: 10.3354/meps11627
Schartmann H. (2019) Activity pattern of the harbour porpoise phocoena phocoena in the coastal waters of fyn (Denmark). Available at: https://www.thuenen.de/media/institute/of/Aktuelles_und_Service/Lehre-Abschlussarbeiten/Schartmann_2019_Master_Activity_pattern_of_the_harbour_porpoise.pdf.
Sigsgaard E. E., Nielsen I. B., Carl H., Krag M. A., Knudsen S. W., Xing Y., et al. (2017). Seawater environmental DNA reflects seasonality of a coastal fish community. Mar. Biol. 164, 128. doi: 10.1007/s00227-017-3147-4
Simon M., Nuuttila H., Reyes-Zamudio M. M., Ugarte F., Verfub U., Evans P. G. H. (2010). Passive acoustic monitoring of bottlenose dolphin and harbour porpoise, in Cardigan bay, Wales, with implications for habitat use and partitioning. J. Mar. Biol. Assoc. United Kingdom 90, 1539–1545. doi: 10.1017/S0025315409991226
Skov H., Thomsen F. (2008). Resolving fine-scale spatio-temporal dynamics in the harbour porpoise phocoena phocoena. Mar. Ecol. Prog. Ser. 373, 173–186. doi: 10.3354/meps07666
Soldevilla M. S., Wiggins S. M., Hildebrand J. A., Oleson E. M., Ferguson M. C. (2011). Risso’s and pacific white-sided dolphin habitat modeling from passive acoustic monitoring. Mar. Ecol. Prog. Ser. 423, 247–260. doi: 10.3354/meps08927
Spearman C. (1904). The proof and measurement of association between two things. Am. J. Psychol. 15, 72–101. doi: 10.2307/1412159
Stalder D., van Beest F., Sveegaard S., Dietz R., Teilmann J., Nabe-Nielsen J. (2020). Influence of environmental variability on harbour porpoise movement. Mar. Ecol. Prog. Ser. 648, 207–219. doi: 10.3354/meps13412
Stantec Consulting (2016). Pacific NorthWest LNG project marine mammal program final report (Burnaby, BC: Pacific NorthWest LNG Limited Partnership). Available at: https://iaac-aeic.gc.ca/050/documents/p80032/106768E.pdf.
Sveegaard S., Andreasen H., Mouritsen K. N., Jeppesen J. P., Teilmann J., Kinze C. C. (2012). Correlation between the seasonal distribution of harbour porpoises and their prey in the sound, Baltic Sea. Mar. Biol. 159, 1029–1037. doi: 10.1007/s00227-012-1883-z
Taguchi M., Chivers S. J., Rosel P. E., Matsuishi T., Abe S. (2010). Mitochondrial DNA phylogeography of the harbour porpoise phocoena phocoena in the north pacific. Mar. Biol. 157, 1489–1498. doi: 10.1007/s00227-010-1423-7
Thomsen P. F., Møller P. R., Sigsgaard E. E., Knudsen S. W., Jørgensen O. A., Willerslev E. (2016). Environmental DNA from seawater samples correlate with trawl catches of subarctic, deepwater fishes. PloS One 11, e0165252. doi: 10.1371/journal.pone.0165252
Todd V. L. G., Pearse W. D., Tregenza N. C., Lepper P. A., Todd I. B. (2009). Diel echolocation activity of harbour porpoises (Phocoena phocoena) around north Sea offshore gas installations. ICES J. Mar. Sci. 66, 734–745. doi: 10.1093/icesjms/fsp035
Torres Ortiz S., Stedt J., Midtiby H. S., Egemose H. D., Wahlberg M. (2021). Group hunting in harbour porpoises (Phocoena phocoena). Can. J. Zool. 99, 511–520. doi: 10.1139/cjz-2020-0289
Tregenza N. C., Dawson S., Rayment W., Verfuss U. (2016)Listening to echolocation clicks with PODs. In: Listening in the ocean modern acoustics and signal processing (New York: Elsevier). Available at: https://link.springer.com/book/10.1007/978-1-4939-3176-7 (Accessed June 26, 2022).
Trites R. W. (1952). The oceanography of chatham sound, British Columbia. University of British Columbia, Vancouver, British Columbia, Canada. doi: 10.14288/1.0085414
Tynan C. T., Ainley D. G., Barth J. A., Cowles T. J., Pierce S. D., Spear L. B. (2005). Cetacean distributions relative to ocean processes in the northern California current system. Deep Sea Res. Part II: Topical Stud. Oceanogr. 52, 145–167. doi: 10.1016/j.dsr2.2004.09.024
van Beest F. M., Teilmann J., Dietz R., Galatius A., Mikkelsen L., Stalder D., et al. (2018). Environmental drivers of harbour porpoise fine-scale movements. Mar. Biol. 165, 95. doi: 10.1007/s00227-018-3346-7
Ware D. M., Thomson R. E. (2005). Bottom-up ecosystem trophic dynamics determine fish production in the northeast pacific. Science 308, 1280–1284. doi: 10.1126/science.1109049
Weir C. R., Stockin K. A., Pierce G. J. (2007). Spatial and temporal trends in the distribution of harbour porpoises, white-beaked dolphins and minke whales off Aberdeenshire (UK), north-western north Sea. J. Mar. Biol. Assoc. United Kingdom 87, 327–338. doi: 10.1017/S0025315407052721
Wickham H., Chang W., Henry L., Pedersen T. L., Takahashi K., Wilke C., et al. (2022) ggplot2: Create elegant data visualisations using the grammar of graphics. Available at: https://CRAN.R-project.org/package=ggplot2 (Accessed June 26, 2022).
Williamson L. D., Brookes K. L., Scott B. E., Graham I. M., Thompson P. M. (2017). Diurnal variation in harbour porpoise detection–potential implications for management. Mar. Ecol. Prog. Ser. 570, 223–232. doi: 10.3354/meps12118
Wingfield J. E., O’Brien M., Lyubchich V., Roberts J. J., Halpin P. N., Rice A. N., et al. (2017). Year-round spatiotemporal distribution of harbour porpoises within and around the Maryland wind energy area. PloS One 12, e0176653. doi: 10.1371/journal.pone.0176653
Wisniewska D. M., Johnson M., Teilmann J., Rojano-Doñate L., Shearer J., Sveegaard S., et al. (2016). Ultra-high foraging rates of harbor porpoises make them vulnerable to anthropogenic disturbance. Curr. Biol. 26, 1441–1446. doi: 10.1016/j.cub.2016.03.069
Wisniewska D. M., Johnson M., Teilmann J., Siebert U., Galatius A., Dietz R., et al. (2018). High rates of vessel noise disrupt foraging in wild harbour porpoises (Phocoena phocoena). Proc. R. Soc. B: Biol. Sci. 285, 20172314. doi: 10.1098/rspb.2017.2314
Wood S. (2022) Mgcv: Mixed GAM computation vehicle with automatic smoothness estimation. Available at: https://CRAN.R-project.org/package=mgcv (Accessed June 26, 2022).
Wright B. M., Nichol L. M., Doniol-Valcroze T. (2021). Spatial density models of cetaceans in the Canadian pacific estimated from 2018 ship-based surveys (Nanaimo: Pacific Biological Station). Available at: https://publications.gc.ca/collections/collection_2021/mpo-dfo/fs70-5/Fs70-5-2021-049-eng.pdf.
Yack T. M., Norris T. F., Ferguson E., Rone B. K., Zerbini A. N. (2014). From clicks to counts: Applying line-transect methods to passive acoustic monitoring of sperm whales in the gulf of Alaska. J. Acoust. Soc. America 136, 2246–2246. doi: 10.1121/1.4900107
Keywords: passive acoustic monitoring (PAM), Pacific harbour porpoise, vessel disturbance, echolocation behaviour, Port of Prince Rupert, GAM (generalized additive model)
Citation: Dracott K, Robinson CV, Brown-Dussault A, Birdsall C and Barrett-Lennard L (2022) Porpoises after dark: Seasonal and diel patterns in Pacific harbour porpoise (Phocoena phocoena vomerina) aggregations at one of North America’s fastest growing ports. Front. Mar. Sci. 9:1010095. doi: 10.3389/fmars.2022.1010095
Received: 02 August 2022; Accepted: 14 September 2022;
Published: 04 October 2022.
Edited by:
Michele Thums, Australian Institute of Marine Science (AIMS), AustraliaReviewed by:
Kelly Waples, Conservation and Attractions (DBCA), AustraliaLaura J. May-Collado, University of Vermont, United States
Copyright © 2022 Dracott, Robinson, Brown-Dussault, Birdsall and Barrett-Lennard. This is an open-access article distributed under the terms of the Creative Commons Attribution License (CC BY). The use, distribution or reproduction in other forums is permitted, provided the original author(s) and the copyright owner(s) are credited and that the original publication in this journal is cited, in accordance with accepted academic practice. No use, distribution or reproduction is permitted which does not comply with these terms.
*Correspondence: Karina Dracott, S2FyaW5hLkRyYWNvdHRAb2NlYW4ub3Jn