 Andra Whiteside
 Cécile Dupouy
 Awnesh Singh
 Philipson Bani
 Jing Tan
 Robert Frouin
- 1Aix Marseille Université, Université de Toulon, Centre National de la Recherche Scientifique (CNRS)/Ĺinstitut national des sciences de ĺUnivers (INSU), Institut de Recherche pour le Développement (IRD), Mediterranean Institute of Oceanography (MIO), Marseille, France
- 2Pacific Centre for Environment and Sustainable Development (PaCE-SD), University of the South Pacific, Suva, Fiji
- 3Institut de Recherche pour le Développement (IRD), Nouméa, New Caledonia
- 4Laboratoire Magmas Et Volcans, Université Clermont–Auvergne–CNRS–IRD, L'Observatoire de Physique du Globe de Clermont-Fd (OPGC), Aubière, France
- 5Scripps Institution of Oceanography, University of California, San Diego, CA, United States
A powerful eruption within the Hunga Tonga-Hunga Ha’apai (HTHH) volcano (20.64°S, 175.19°W) in the Kingdom of Tonga, occurred on 15 January 2022. The volcanic blast was enormous, leading many scientists to investigate the full impact and magnitude of this event via satellite observations. In this study, we describe a new ocean color signature from a discolored water patch created by the HTHH eruption using NASA and CMEMS products of satellite-derived biological and optical properties. Elevated surface chlorophyll-a concentration (Chl-a) between 0.15 to 2.7 mg.m-3 was not associated with phytoplankton growth, but to basalt-andesitic ash material expelled by the volcano and into the ocean, which resulted in erroneous Chl-a estimates. Distribution of the patch over time was aligned with CMEMS ocean currents for 19 days. The gradual decrease of light attenuation or diffuse attenuation coefficient for downward irradiance at 490 nm, Kd(490), was interpreted as due to the sinking of ash particles with time. It is suggested that due to high porosity of 30-40%, a density close to that of seawater, ash particles stay suspended in the water column for more than 10 days with sustained high values of satellite-derived Chl-a, Kd(490), and particulate backscattering coefficient at 443 nm. The high attenuation of light due to ash, reducing the penetration depth to less than 10 meters during the first period after the eruption may have had implications on ecological processes and biogeochemical cycles in Tongan waters.
1. Introduction
An extraordinary and powerful eruption within the mostly submerged Hunga Tonga-Hunga Ha’apai (HTHH) volcano (20.64° S, 175.19° W) in the Kingdom of Tonga, occurred on 15 January 2022 (Coordinated Universal Time). Situated in the Pacific Ocean, the HTHH volcano is approximately 60 km northwest from the largest Tongan island, Tongatapu.
The volcanic blast was enormous, sending shockwaves across the globe which were heard across the Pacific and as far as Alaska in the United States of America (Cappucci, 2022). Captured by Earth-orbiting satellites, the blast was strong enough to send a thick layer of volcanic ash into the lower stratosphere, subsequently covering islands across the Tongan group which comprises an archipelago of 169 islands, and is home to 105,000 people (NOAA, 2022). The volcano had been erupting at smaller scales between 20 December 2021 and 5 January 2022 prior to the main event (Cronin, 2022). According to literature, an eruption of this magnitude occurs once every thousand years and has never been seen in the modern scientific era (Witze, 2022). Within 30 minutes of the eruption, a giant umbrella-shaped ash plume covering 300 km in diameter was formed, propelling ash and volcanic gas over 30 km into the atmosphere (Cronin, 2022). The nearby Tongatapu and Eua island groups were blanketed with ash up to 5 to 50 mm thickness (The World Bank, 2022).
Prior to 2014, the HTHH consisted of two andesitic islands (Hunga Tonga in the northeast and Hunga Ha’apai in the west, and have had past major eruptions in 2014, 2009, 1988, 1937, and 1912 (Bryan et al., 1972; Mantas et al., 2011; Smithsonian Institute, 2019). Some information suggests that HTHH and the latter volcano described here has had catastrophic eruptions similar in scale to the 2022 eruption about 1000 and 2000 years ago, and the volcanic edifice was at times a huge volcano that periodically collapses during these catastrophic events (Cronin et al., 2017).
Ocean color observed via satellite sensors is a tool for detecting, monitoring, and mapping phytoplankton chlorophyll biomass and has already been used to investigate major features after submarine eruptions, typically resulting in a discoloration of seawater around the site and the emergence of consolidated or fragmented pumice rafts (Mantas et al., 2011; Eugenio et al., 2014). These discolored waters can last days or weeks, appearing milky in color or yellowish-brown compared to the surrounding ocean, depending on its composition. In 2019, discolored sea water was described from three different satellite sensors following an undersea volcanic eruption occurring off Fonualei, about 65 km north of Tongatapu (Whiteside et al., 2021). Ocean color (i.e., spectral reflectance) was utilized to discriminate between discolored waters, consolidated pumice, and fragmented pumice rafts (formed from magma that encounters water). In addition, sea surface temperature (SST) was examined and reflected changes in emissivity of pumice in the infra-red. A striking characteristic of the 2019 discolored waters, however, came from satellite estimates of chlorophyll-a concentration (Chl-a), which measured lower than the surrounding Chl-a. Their makeup is typically of hydrous oxides which are formed when aluminum and iron-rich acidic waters mix with seawater, or due to an outflow of neutral-pH waters (Urai and Machida, 2005; Sakuno, 2021). In contrast, after the 2022 January eruption, a giant Chl-a patch with unusually high concentration was found in the area of the discolored waters around the HTHH volcano. This patch was observed by satellite imagery for at least two weeks. A detail work on such discoloration were carried out following Tagoro eruption in October 2011 in the Canary Islands, Spain (Fraile-Nuez et al., 2012; Santana-Casiano et al., 2013; Ariza et al., 2014; Santana-González et al., 2017; González-Vega et al., 2022). The eruption has led to physical and chemical implications on the surrounding waters such as temperature changes, ocean acidification, nutrient enrichment, and deoxygenation (Fraile-Nuez et al., 2012; Santana-Casiano et al., 2013). As a result, the local marine ecosystem experienced high rates of mortality (González-Vega et al., 2022) including a reduction of epipelagic stocks and disruption of diel vertical migration of mesopelagic organisms (Ariza et al., 2014) and species richness decline during the eruptive phase (Ferrera et al., 2015).
The present work focuses on biological and optical properties extracted by Sea Data Analysis Software (SeaDAS) applied to a time series of National Aeronautics and Space Administration (NASA) satellite images acquired pre- and post-eruption (15 January - 2 February 2022). Importantly, the study aims at explaining the apparently high Chl-a values occurring post-eruption. We hypothesize that the origin of the material expelled by the volcano and the elevated Chl-a values are not related to phytoplankton growth but rather to the ash itself deposited in the upper ocean and, consequently, is the result of an erroneous calculation due to a specific optical signature confounded with the Chl-a signature. We further discuss the influence of ocean currents on dispersal patterns of the ash patch and of the gradual decrease of the attenuation signal, which is interpreted as due to the sinking of particles with time. The rest of the manuscript is organized as follows: Section 2 describes the data and methods used in the study, Sections 3 and 4 present and discuss results, and finally Section 5 provides concluding remarks.
2. Data and methods
2.1. Satellite data (MODIS, VIIRS and OLCI)
Ocean color products of NASA and Copernicus Marine Environment Monitoring Service (CMEMS) were used in this study. A series of ocean color images from 14 January to 2 February 2022 were examined. Daily retrievals of satellite images from Moderate Resolution Imaging Spectroradiometer (MODIS) onboard the Aqua and Terra satellites at spatial resolution of 1 km and Visible Infrared Imaging Radiometer Suite (VIIRS) onboard Suomi-NPP at 750 m were selected and extracted from NASA’s Ocean Color website (Table 1). Level 2 (L2) images were created using the NASA SeaDAS software package. For higher resolution viewing, a true color RGB Sentinel-2 mosaic image at a 60 m resolution acquired on 17 January 2022 was taken from the Copernicus Open Access Hub and visualized using the Sentinel Application Platform (SNAP) package (Figure 1A). The study area comprises the Tongan region at 18 to 23.5° S, 172 to 178°W (Figure 1B).
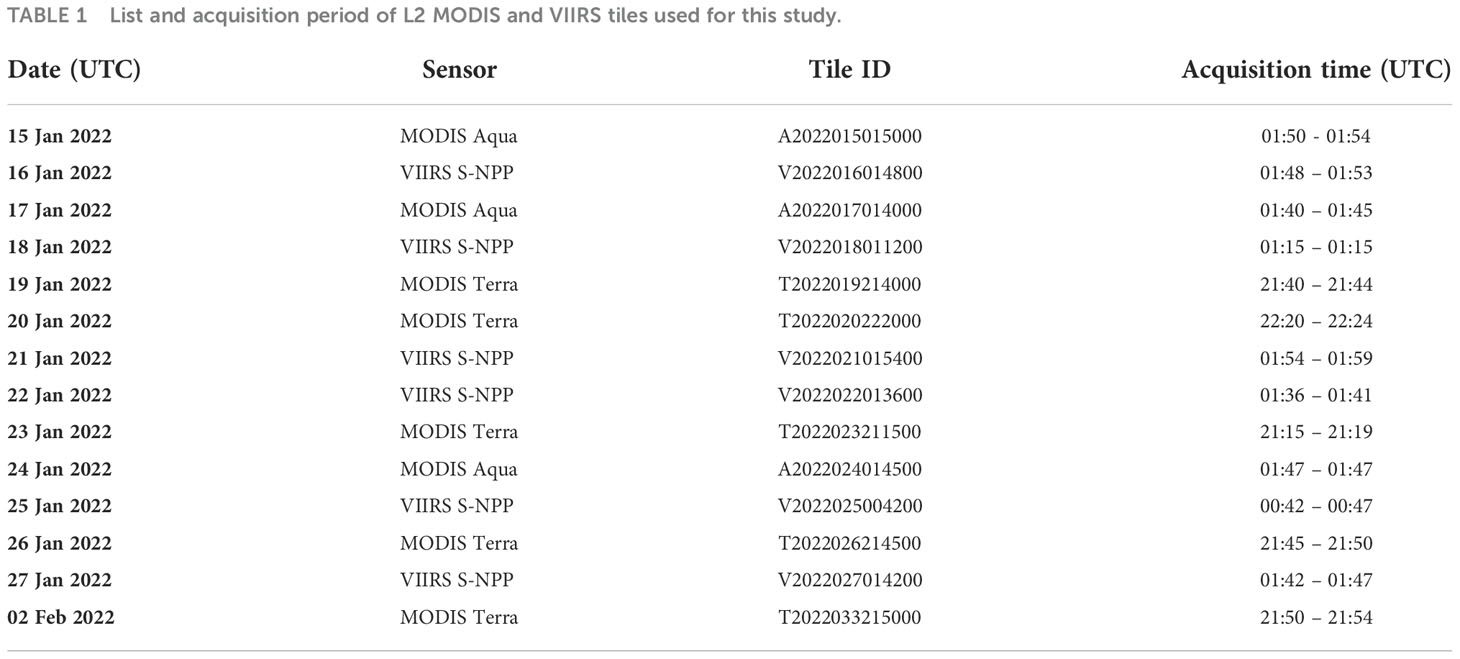
Table 1 List and acquisition period of L2 MODIS and VIIRS tiles used for this study.
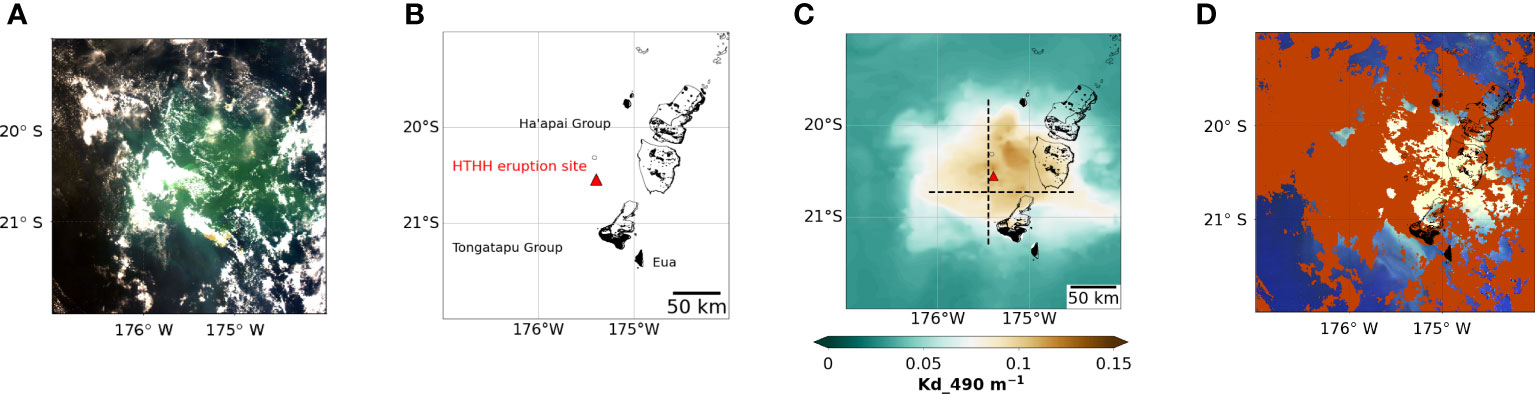
Figure 1 (A) True Color MODIS image showing the Tongan islands surrounded by discolored waters on 17 January 2022. (B) Map of Tongatapu island and other island groups in Tonga indicating the eruption site of HTHH (in red). (C) Interpolated CMEMS Kd concentration on 17 January 2022 with a coral reef shapefile overlay published by the Tongan Department of Environment (outlined in black around land masses). The dashed black lines across the patch depict the analyzed line transects along latitude of 20.73°S and longitude of 175.45°W. (D) RGB L2 composite image of Rrs at 443, 555 and 678 nm. Cloud cover is masked in red.
2.2. Satellite data analysis tools
Individual MODIS/VIIRS images were extracted and reprojected onto a Plate Carrée grid to allow comparisons for each date by applying the Cartopy geospatial data processing package into Python 3. As in Whiteside et al. (2021), we examined various daily products derived from the L2 product in SeaDAS using standard MODIS satellite processing. These included the Rrs suite and inherent optical properties in MODIS and VIIRS, i.e., Rrs (Rrs 443, Rrs 551 or 555, 671 or 678 nm in sr-1), backscattering coefficient at 443 nm, bbp(443) (“bbp_giop” GIOP), Chl-a, Kd(490) and normalized fluorescence line height or nFLH. It should be noted that caution must be taken with Kd values presented in this paper, which were derived from Rrs ratios in the blue and green using the operational NASA algorithm based on (Austin and Petzold, 1981). In Case 2 waters, the situation after the eruption when ashes are present, the Kd retrievals may be inaccurate, although good performance was reported below 0.2 m-1 (Lee et al., 2005).
Gilerson et al. (2008) found from simulations that the relative contribution of the fluorescence component to the reflectance spectra peak in the near infrared (NIR) decreases rapidly with increasing concentration of non-algal particles mostly because of the increased contribution of the elastic component to the total reflectance, affecting the performance of the nFLH retrieval. Therefore, we examined the possibility to correct nFLH values in the case of the 2022 patch reflectance by applying an algal bloom index (ABI) to reduce the false-positive detection (Hu and Feng, 2016). For MODIS, ABI is defined as ABI = nFLH/[1 – (Rrs547 – 0.0015) a] where nFLH and Rrs547 are default MODIS products and a is an empirical factor.
The CMEMS “cloud free” daily interpolated Kd(490) product and the penetration depth (1/Kd) at 4 km resolution was specifically used (ref no. 2.6) over the MODIS and VIIRS Kd and 1/Kd products as it was already interpolated, making calculations for volume estimates of the discolored water patch possible. This product uses a combination of sensors including MODIS-Terra, VIIRS, OLCI S3A and S3B, and the algorithm used (Morel et al., 2007) and validation for interpolated “cloudless” Kd demonstrated good correlation (R2 = 0.81) with global in-situ measurements according to the quality information document released for the Kd product. When extracting Kd values from CMEMS and MODIS on the 2022 patch, we found that values from CMEMS (which ranged from 0.05 to 0.12 m-1 at the center of the patch) were lower in comparison to MODIS (0.05 to 0.2 m-1), and this discrepancy can result from both inversion algorithms and/or from the spatial averaging.
Using SeaDAS software, all MODIS-VIIRS optical parameters (Rrs, bbp, Chl-a, Kd, nFLH) were extracted at source resolution and then averaged (on 9 x 9 pixels) from the center of each discolored water patch i.e., where the highest values were present (longitude [175.57° W, 174.1° W], latitude [20.79° S, 20.36° S]) at the eruption site. Extractions of these optical parameters were made at similar intervals before, during, and after the event (29 December 2021, 17 January 2022, 26 January 2022) to show the magnitude of the effect of the eruption.
From CMEMS Kd, Hovmöller diagrams were created using boundaries set along horizontal (longitude [176.1° W, 174.5° W], latitude [20.73° S]) and vertical (longitude [175.45° W], latitude [21.3° S, 19.7° S]) line transects (Figure 1C), to illustrate the distribution of the patch for each day in January from east to west and north to south. The diagrams were generated using the Matplotlib visualization library and Xarray package in Python 3. Time-evolution of the penetration depth (1/Kd) average values along the horizontal line transect was presented over time, and over longitude for the same period as the Hovmöller diagrams. It was checked that the same transect could be kept throughout the post-eruption study period as the patch moved sufficiently slowly. For comparison of the two eruption effects on ocean color, the same suite of parameters was extracted for the last 2019 eruption studied though the eruption site was farther north than the 2022 one (longitude [174.72°W, 174.6°W], latitude [18.48°S, 18.43°S]) (Whiteside et al., 2021).
To delineate the surface of the patch from the surrounding ocean, the bbp threshold given in Whiteside et al. (2021) for the 2019 eruption (bbp_giop 443 nm > 0.0032 m-1) could not be used as it included too many “non-enriched” oceanic pixels. Therefore, to minimize non-enriched pixels in the calculation of the patch surface, a higher threshold for bbp_giop 443 nm had to be chosen that was equivalent to a value of Kd(490) > 0.052 m-1, and similar to the value used for detecting high material-enriched waters in coastal areas (Zhang and Fell, 2007). Then, the penetration depth (1/Kd(490)) was used to give an estimate of the volume of water impacted by the total amount of material deposited using the formula:
where the discolored patch was present.
Daily mean surface current velocities were superimposed onto the bbp L2 images on a Plate Carrée grid with the already available ‘quiver’ and ‘quiverkey’ functions within the Matplotlib library and generated in Python, displaying ocean current direction in meters per second (m.s-1). This function allowed superimposing 9 km x 9 km current data over 4 km x 4 km pixels.
2.3. CMEMS nutrient and ocean surface current data
To further evaluate whether the high levels in the Chl-a band around the volcano (described in Section 3) were due to an unusual phytoplankton bloom (despite the time lag seeming inconsistent with growth) a modeled forecasted dataset from the CMEMS database for 4 types of nutrients were explored to identify whether available pre-eruption nutrients allowed phytoplankton growth. These nutrient parameters included dissolved iron (Fe(II)), nitrates(NO3-), phosphate (PO4), and dissolved silicate (Si(OH)4). Daily mean levels of Fe(II), Si(OH)4, PO4 and NO3- were extracted from CMEMS over a 4-month period from December 2021 to March 2022. The dataset is part of the output of a biogeochemical global ocean analysis and forecast system at 1/4-degree resolution that provides files of daily and monthly mean biogeochemical variables.
To analyze the influence of ocean currents on dispersal patterns of the enriched patch, daily mean surface horizontal velocities were used. The gridded CMEMS product consists of daily global ocean forecasts and real-time data at a spatial horizontal gridded resolution of 0.083° (9.213 km).
2.4. Ash characterization
Ash samples were collected on 26 January 2022, eleven days after the eruption, at 3 different locations on Tongatapu island. These fine particles were black and powdered with different grain sizes. They were constituted by fine particles of mainly 200-700 µm with a large proportion of pumice. The samples were analyzed for major elements using the Inductively Coupled Plasma Atomic Emission Spectroscopy (ICP-AES) in two different laboratories, including LAMA (Laboratoire des Moyens Analytiques) at IRD (Institut de Recherche pour le Développement) in Nouméa, New Caledonia and Geo-Ocean in Brest, France. Samples were analyzed after dissolution of finely crushed samples by alkaline fusion.
3. Results
3.1. Satellite observations
Large water discoloration around the HTHH volcano was evidenced from L2 RGB true color MODIS images following the major eruption (Figure 1D) after the eruption’s effect on the atmosphere on 15 January 2022. The masked L2 ‘MODGLINT’ flag from MODIS and VIIRS products was applied to confirm that this was indeed water discoloration and not a result of sun glint (as glint can introduce similar features). This discoloration was directly associated with the new island formed during the 2015 eruption and then destroyed by the current eruption (oceanic patch elongated in a south-west direction). On 17 January 2022, the largest observed discolored water patch was captured by a Sentinel-3 image centered on the HTHH eruption reaching approximately the same size and center as the atmospheric ash plume which was 650 km in diameter. Chlorophyll-a concentration calculated in SeaDAS was within the range of 0.15 to 2.7 mg.m-3. The optical signature of the MODIS discolored water patch was characterized by high attenuation coefficient Kd(490) between 0.1 to 0.16 m-1 from its borders toward the center of the patch.
3.2. Optical characteristics of discolored waters
Figure 2 illustrates the main spectral patterns for three chosen dates: 18 days before the eruption (29 December 2021) (Figures 2A–E), 1 day after the eruption (Figures 2F–J), and 10 days after (Figures 2K–O) on 17 and 26 January 2022. There were no significant changes in the suite of products observed prior to the major eruption. High Chl-a (up to 1.93 mg.m-3) for this region were observed immediately after the eruption using a standard OCI algorithm. Such concentrations are exceptional particularly in oligotrophic waters around Tonga (OUTPACE cruise, Dupouy et al., 2018) as even after 9 days, on 26 January 2022, Chl-a concentrations still experienced higher than expected values (> 0.3 mg.m-3). On 17 January 2022, Rrs at 443 nm, Rrs443, was between 0.01-0.015 sr-1. Such reflectance values were higher than observed in normal oligotrophic waters (~0.008-0.009 sr-1). Nine days later, on 26 January 2022, Rrs443 values returned to normal with only restricted areas of higher absorption mainly related to coral reef areas within the Ha’apai group of islands east of the eruption in Tonga (~0.005 sr-1). Similarly, high Rrs at 555 nm, Rrs555, in the green/yellow wavelength was observed in areas of water discoloration compared to the surrounding normal ocean values (0.0165 sr-1). The Rrs555 reflectance in MODIS continued to measure 6 times higher than normal in the Tongan area. This influences the result of the calculation of Chl-a as the change is disproportionate in the green and blue channels (because this ratio is used in the polynomial equation of the algorithm).
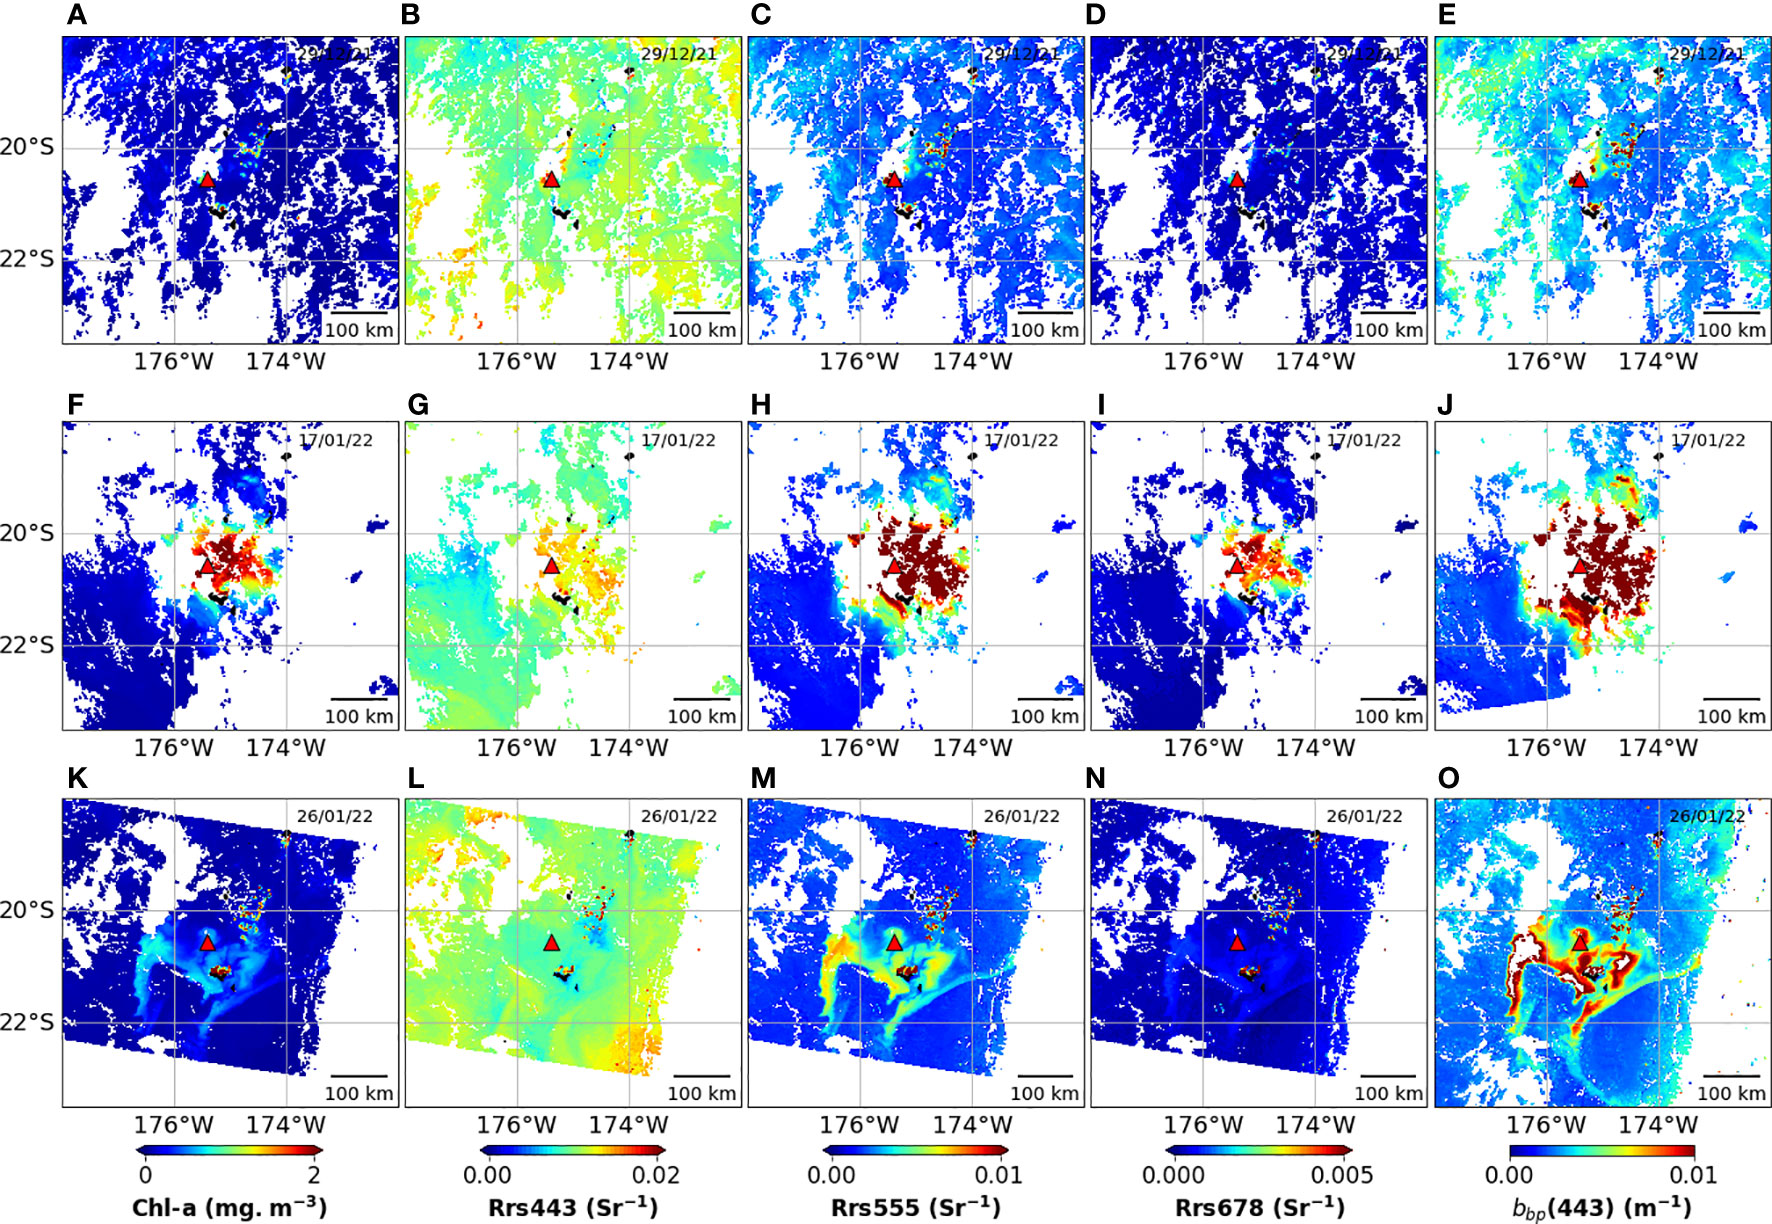
Figure 2 Comparison of MODIS and VIIRS extracted Chl-a, Rrs and Bbp products pre-eruption (A–E) on 29 December 2021, 2 days after the eruption (F–J) on 17 January 2022, and 9 days after the eruption (K–O) on 26 January 2022.
Similar results of high reflectance values were seen in the Rrs at 678 nm, Rrs678. On 26 January 2022, values were still above the normal oceanic value (Rrs678 > 0.0003 sr-1) within the zone of discolored waters. On 17 January 2022, values in the center of the patch (Rrs 678 > 0.0041 sr-1) were approximately 12 times the normal predicted oceanic signal. Note the presence of high normalized fluorescence with values increasing by a factor of 3 from 0.11 to 0.347 from December to 17 January 2022, and then back to normal on 26 January (0.091 nFLH mWcm−2 μm−1 sr−1). Such high values are linked to elevated values of Rrs678.
The magnitude of simultaneous increases of reflectance in all channels just after the eruption is well illustrated at Figure 3, where Rrs spectra extracted on the 17 January 2022 (Jan_17) are compared with those selected in surrounding waters or outside of the patch and with pre- (Dec_29) and post-eruption (Jan_26) spectra (Figure 3). Note that there is no evidence of a fluorescence peak in the discolored water patch. One would expect a dip at 667 nm due to Chl-a absorption, but the Rrs values at 667 nm and 678 nm are similar in the brown curve, even slightly lower at 678 nm, suggesting that the baseline reflectance at 678 nm, estimated from Rrs values at 667 and 748 nm, was too low. This might be due to an underestimation of the Rrs at 748 nm in the iterative scheme designed to account for non-negligible Rrs in the near infrared (Bailey et al., 2010). In that scheme, the slope of the backscattering coefficient in the red and near infrared is estimated empirically using a dataset (Werdell and Bailey, 2005) that did not include the type of waters with volcanic ash considered in the present study.
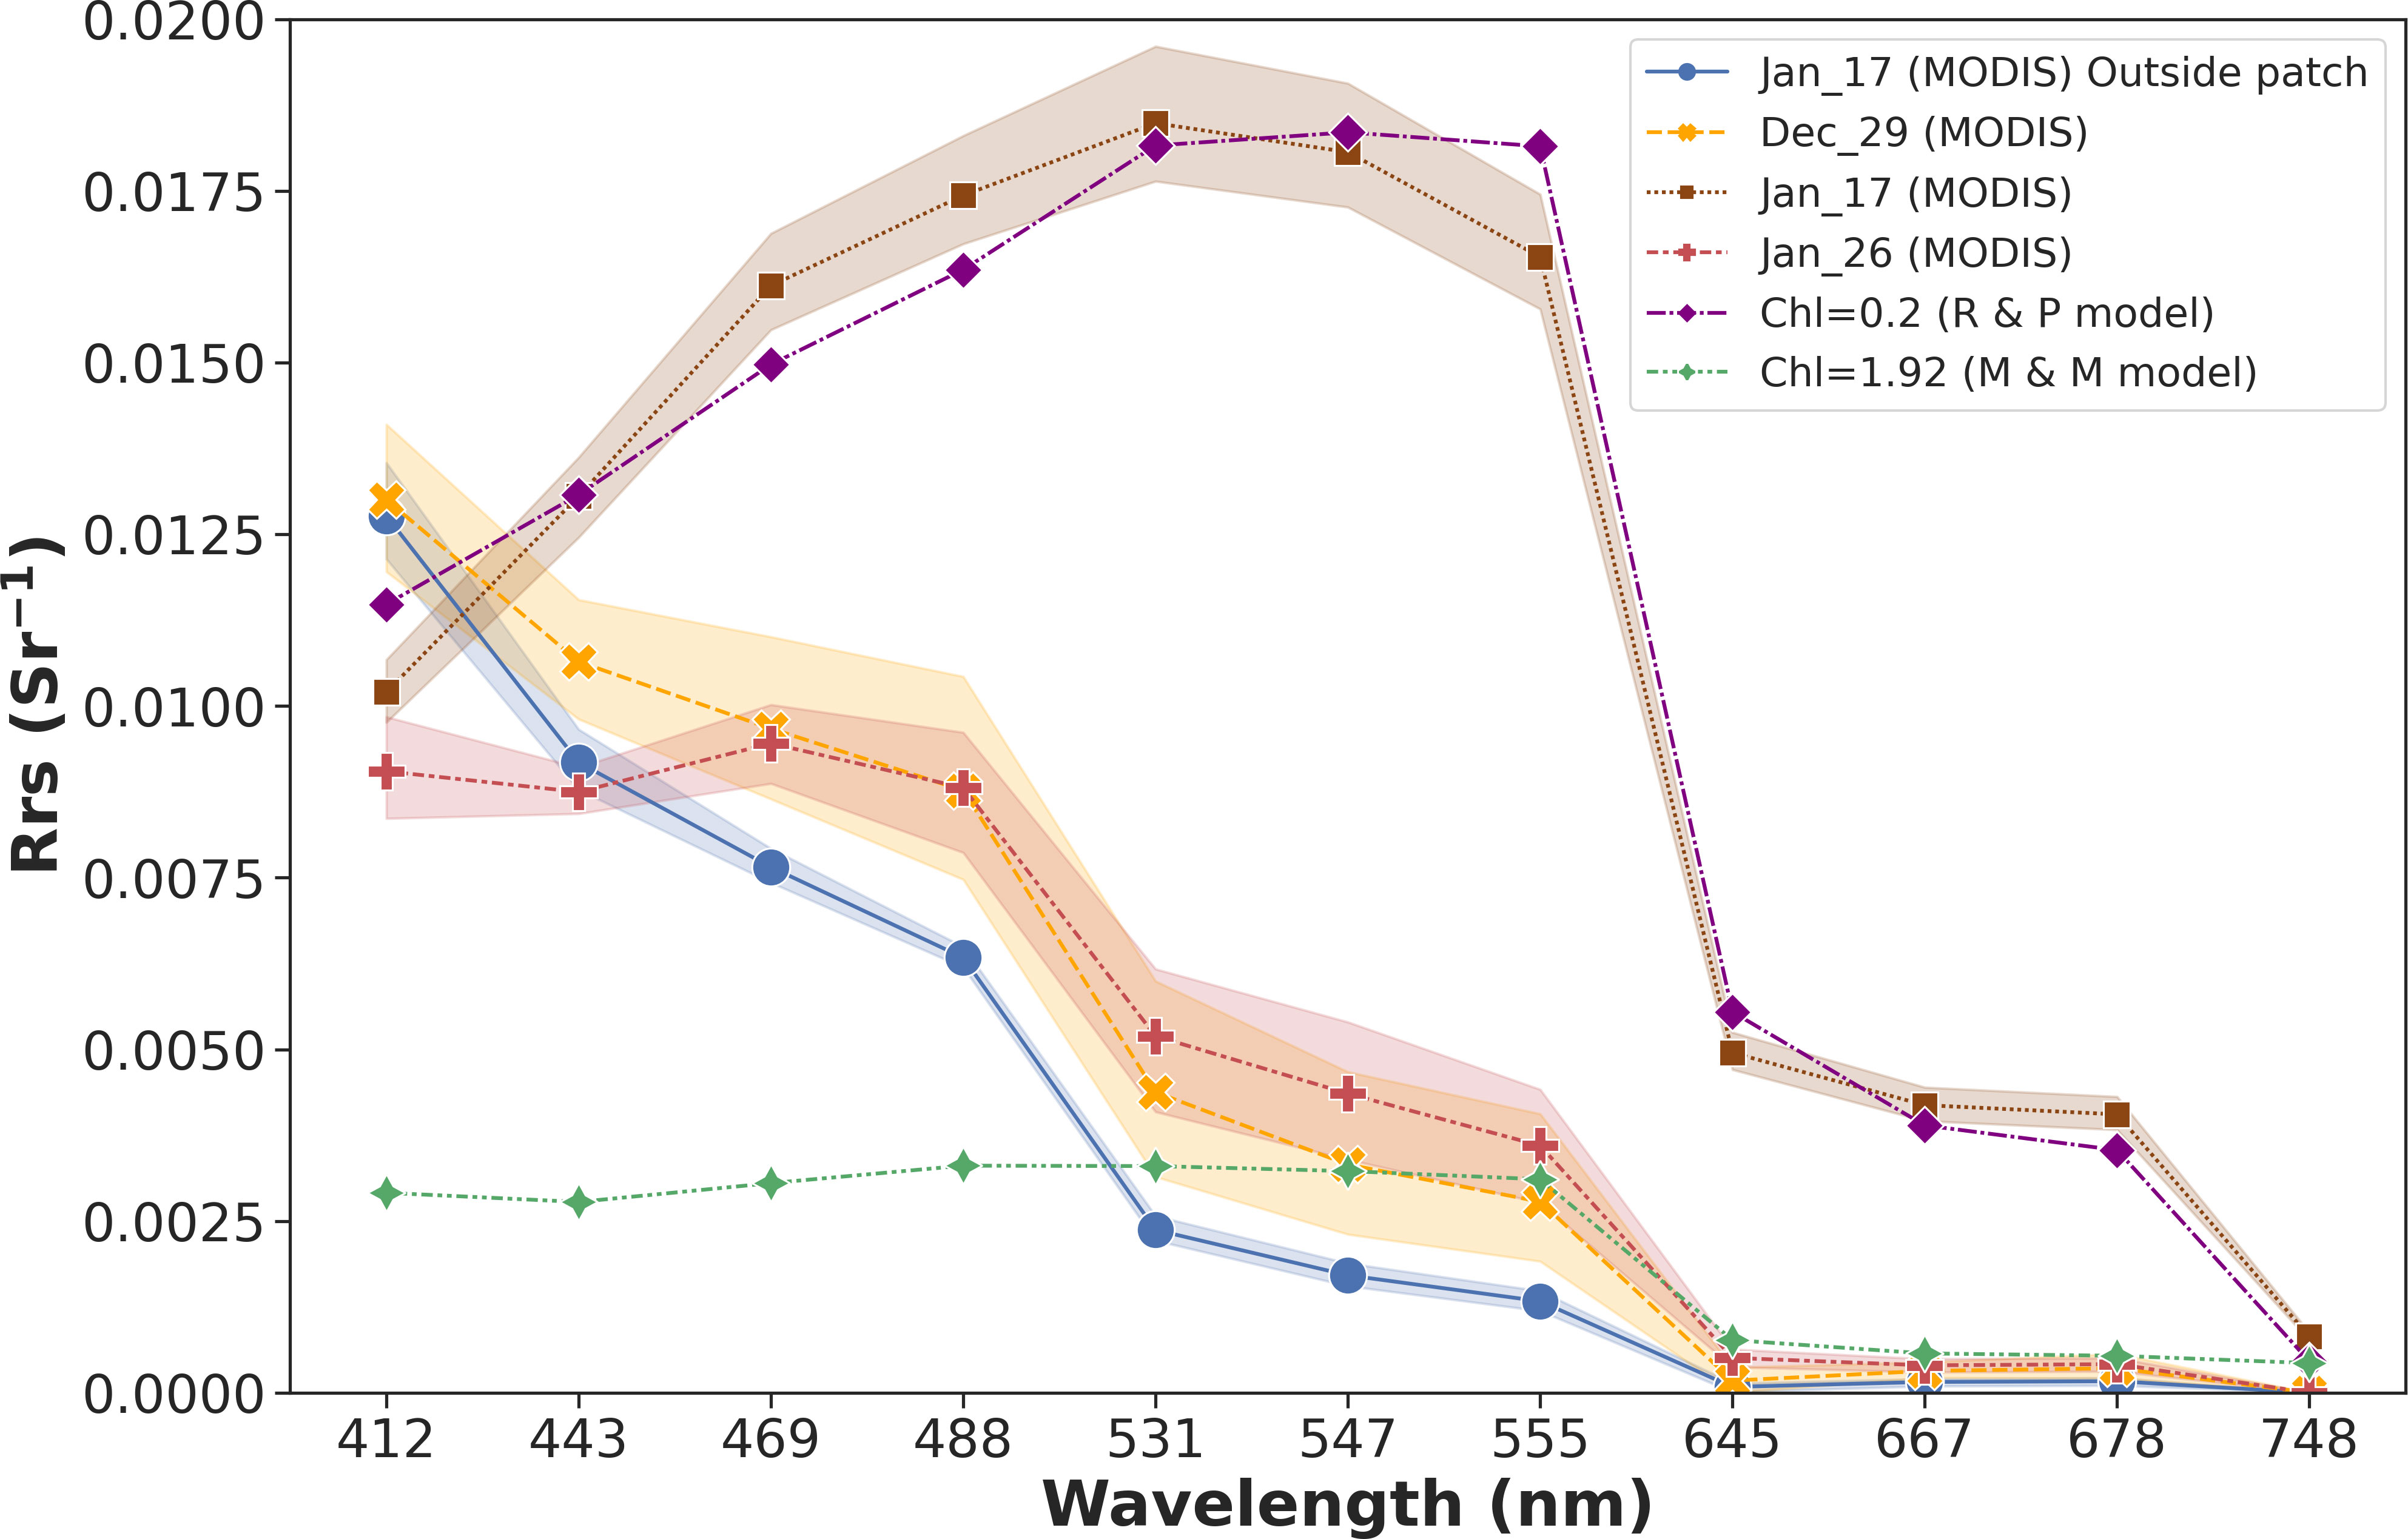
Figure 3 Rrs spectra of pixels inside the discolored water patch and outside the patch pre- and post-eruption (December 29, 2021; 2 days after the eruption on January 17, 2022; 9 days after the eruption on January 26, 2022) and another on 17 January if Chl=0.2 mg.m-3 using the Park and Ruddick (2005) model, and Chl=1.92 mg.m-3 using the Morel & Maritorena (2001) model. Pixels outside the patch were taken on 17 January 2022.
Table 2 summarizes the optical properties of discolored waters pre- (29 December 2021), and post-eruption (2 days after, i.e., 17 January 2022, and 9 days after the eruption, i.e., 26 January 2022). Increases between 29 December 2021 and 17 January 2022 by factors of slightly above 1, 6, and 12 for Rrs 443, Rrs 555 and Rrs 678, respectively, are not in favor of the time-lag of a phytoplankton bloom. Blooms of this magnitude would not occur immediately after an eruption. Table 2 also displays Kd(490) and bbp(443), calculated from SeaDAS. In the discolored patch, Kd(490) and bbp(443) were respectively up to 0.16 and 0.035 m-1 at its center on 17 January 2022, which is 4 and 7 times greater than the pre-eruption December value. Kd(490) for 17 January 2022 showed highest intensity at the center of the plume between 0.1 – 0.3 m-1. Such Kd(490) values in the patch center is 5 times the measured oceanic values for the Tonga region during the OUTPACE cruise in March 2015, i.e., 0.022 m-1 (Dupouy et al., 2018). Outer parts of the plume displayed < 0.1 m-1 attenuation coefficient. Nine days after the eruption, Kd(490) and bbp recovered to near normal values. Waters north of Tongatapu island, 57 km south of the volcano, and waters situated more than 100 kilometers off the center of the eruption, still experienced a bbp(443) value of 0.0011 m-1, nine days after the eruption.
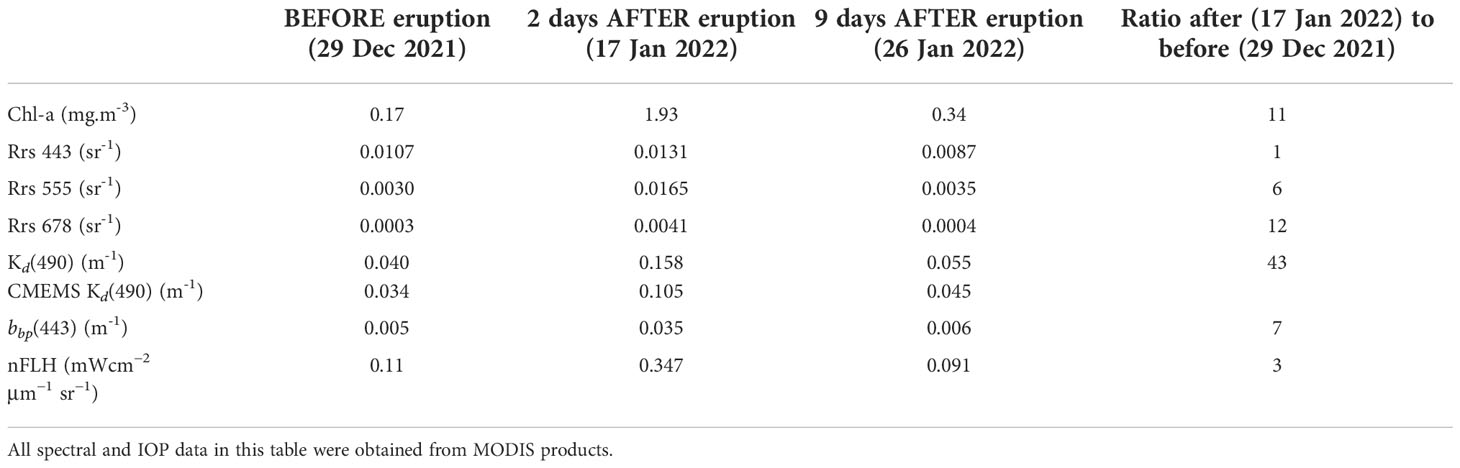
Table 2 Optical parameters for the 15 January 2022 eruption were extracted from MODIS/VIIRS products at the center of the patch and from CMEMS for Kd for comparison.
3.3. Spatial and temporal evolution of the patches
Time evolution of the CMEMS attenuation coefficient Kd(490) is shown in the Hovmöller diagrams along the longitudinal and latitudinal transects crossing the discolored patch (from 176°W to 174.5°W and from 19.75 to 21.25°S) (Figure 1C). At 20.73°S, Figure 4A shows high Kd (between 0.08-0.11 m-1) the day after the eruption on 16 January 2022 between longitudes 176.1°W and 174.5°W. These high Kd values were sustained for 5 days before gradually decreasing (< 0.075 m-1) and eventually going back to normal (< 0.052 m-1) by 28 January 2022. Along 175.45°W longitude, Figure 4B shows a sudden increase in Kd that had concentrated values (0.07-0.11 m-1) between latitudes 20.2°S and 20.8°S from 16 to 18 January 2022. A shift in the patch southward over time resulted in higher-than-normal Kd values which were maintained until 30 January 2022 compared to the northern part of the transect which normalized to < 0.05 m-1 by 24 January.
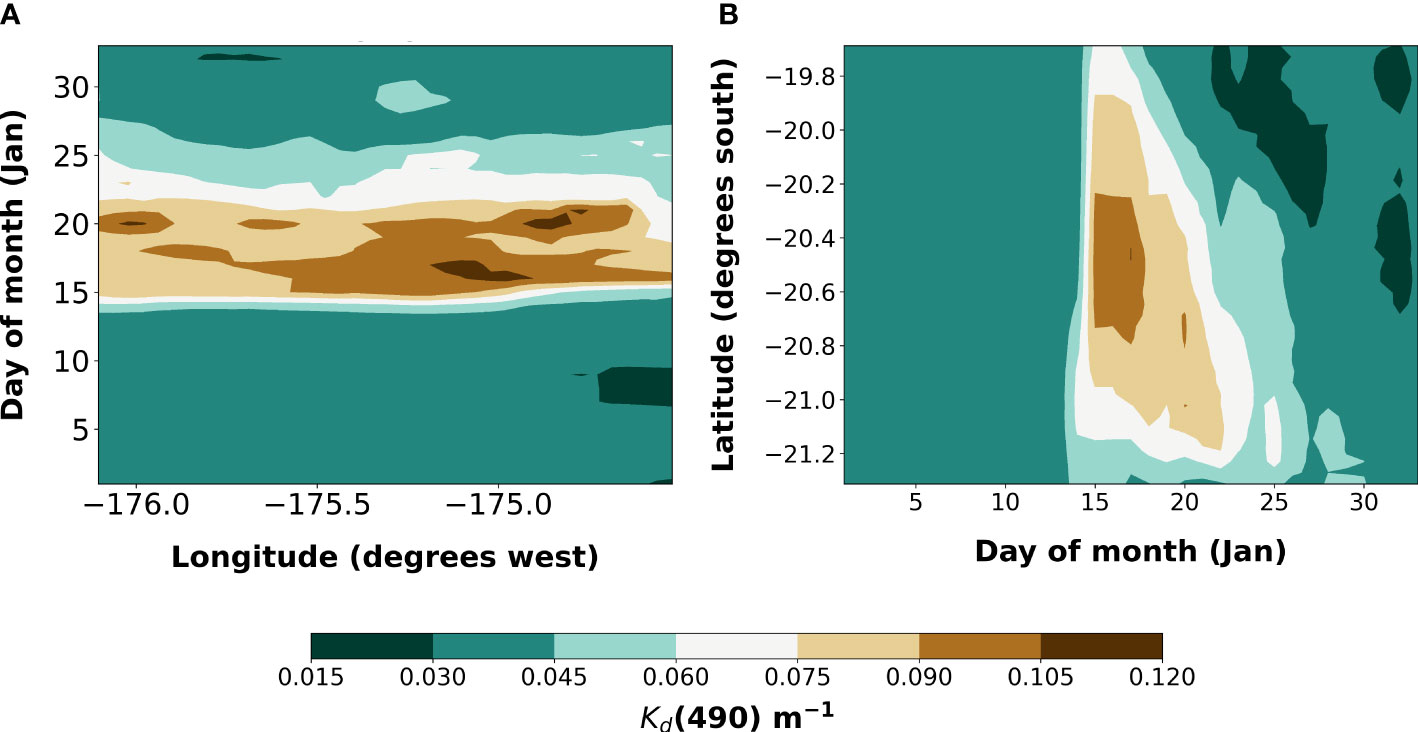
Figure 4 Hovmöller plots of CMEMS Kd(490) (in m-1) for the month of January 2022 representing the (A) latitudinal transect along 175.45°W, and (B) longitudinal transect along 20.73°S within the discolored water patch (location illustrated in Figure 1C). Values are represented from 0.015 to 0.120 m-1 for more contrast.
3.4. Temporal evolution of Kd(490) and estimated volume of suspended material
The average and standard deviation of the penetration depth at 490 nm was extracted on all pixels along the 20.73°S horizontal transect of Figure 1C. The average penetration depth of pixels over the transect increased from 10 m on 17 January 2022 to 32 m by 2 February 2022 (Figure 5A). Water clarity became normal by 2 February 2022.
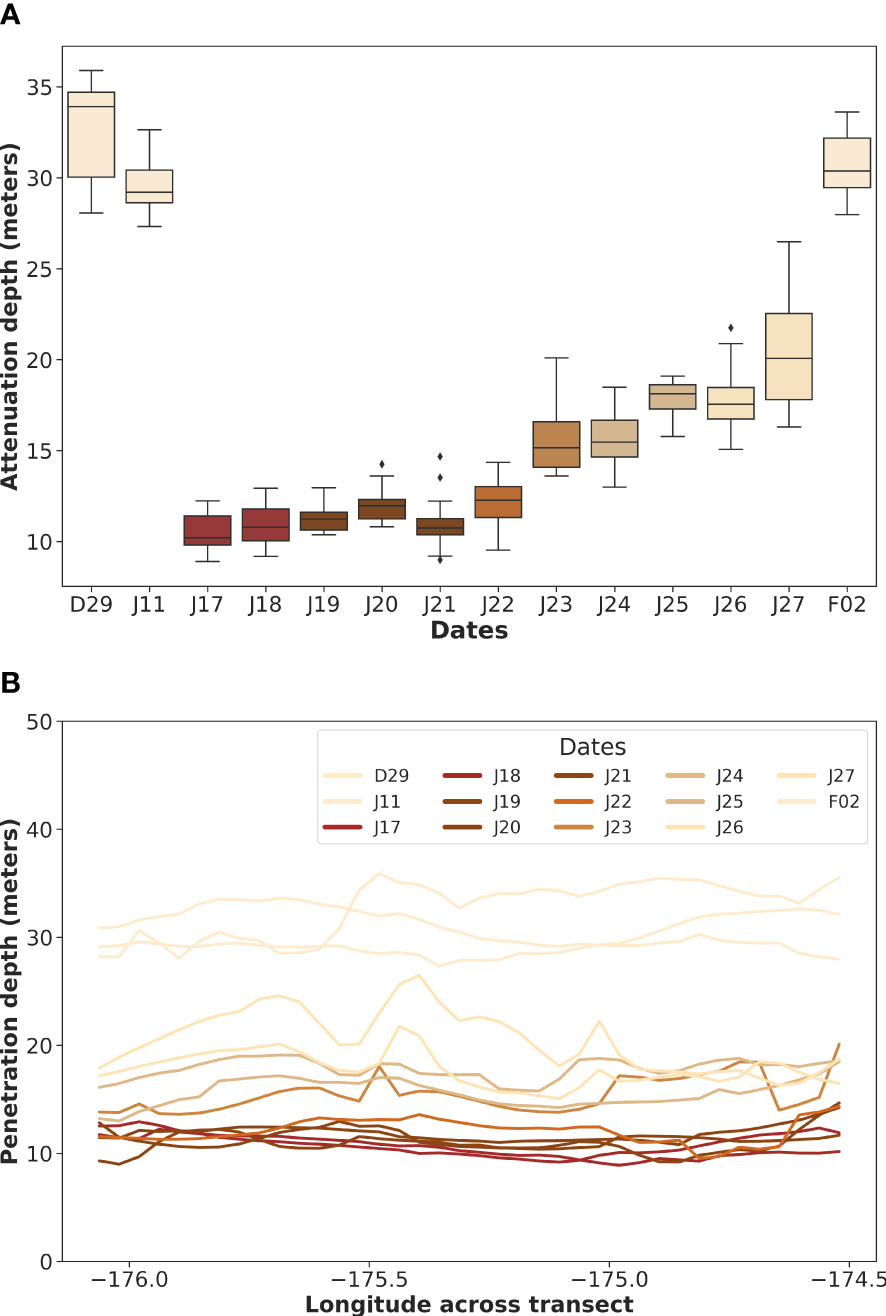
Figure 5 (A) Box and whisker plot showing light penetration depth (in meters) along the 20.73°Stransect (illustrated in Figure 1C within the patch) over time, from values of the CMEMS interpolated 1/Kd(490) data. (B) Time evolution of the penetration depth along 20.73°S from the earliest day of observations (17 January 2022) to the final day (2 February 2022).
The penetration depth within the plume’s center was approximately 8.8 to 10 m along the transect right after the eruption, and > 10 m in the outer parts of the plume on 17 January 2022 (Figure 5B) preventing most light from penetrating through the water deeper than 10 meters. The penetration depth increased to 17 m on 23 January 2022. Water clarity became normal between 27 January and 2 February 2022, like that of the surrounding open ocean waters (~ 35 meters), and comparable to normal ocean conditions. A measured penetration depth value during the OUTPACE oceanographic cruise off Tongan waters with a profiling spectroradiometer in the Chl-a bloom was 40 m (Kd(490) of < 0.03 m-1) for a Chl-a concentration of 0.3 mg.m-3 at the same location in March 2015 (Dupouy et al., 2018).
The associated estimation of the volume of water affected by backscattering material was estimated to be 482 km3 on 17 January 2022, 257 km3 on 22 January 2022, and 161 km3 on 26 January 2022, which is 1 or 2 orders of magnitude higher than the expected volume of ash (0.5 to 10 km3).
3.5. Ash mineral composition and characteristics
The ash compositions obtained by LAMA and Geo-Ocean are comparable (Table 3), indicating a silica content varying between 53 and 56 wt%, while TiO2, Al2O3, Fe2O3, MnO, MgO and CaO fluctuate between 0.49-0.54 wt%, 13.8-15.2 wt%, 10.2-10.7 wt%, 0.164-0.171 wt%, 3.18-3.76 wt%, and 8.59-11.16 wt%, respectively. The total alkali (Na2O+k2O) fluctuates between 2.54 and 3.02 wt% whilst P2O5 ranges from 0.077 to 0.105 wt%. When plotting the SiO2 versus the total alkali, it appears that all the samples are of basaltic andesite origin (Figure 6).
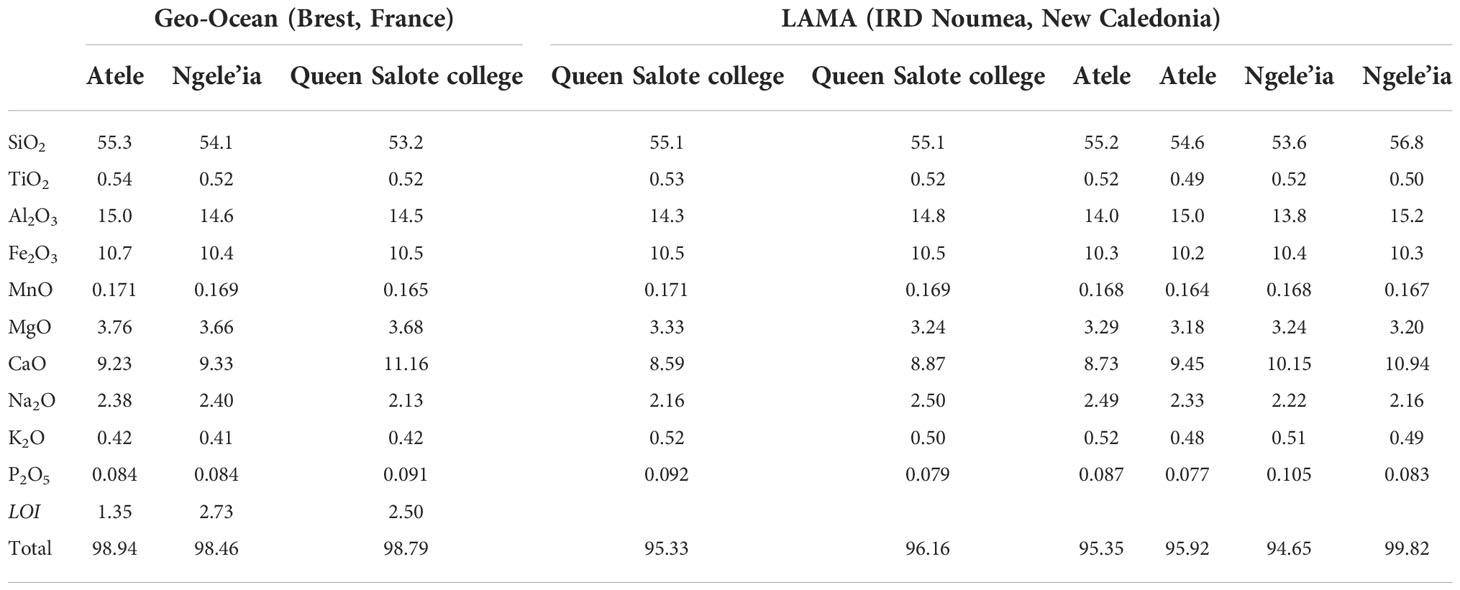
Table 3 Chemistry of ash samples (in wt%) collected on Tongatapu island after the 15 January 2022 eruption.
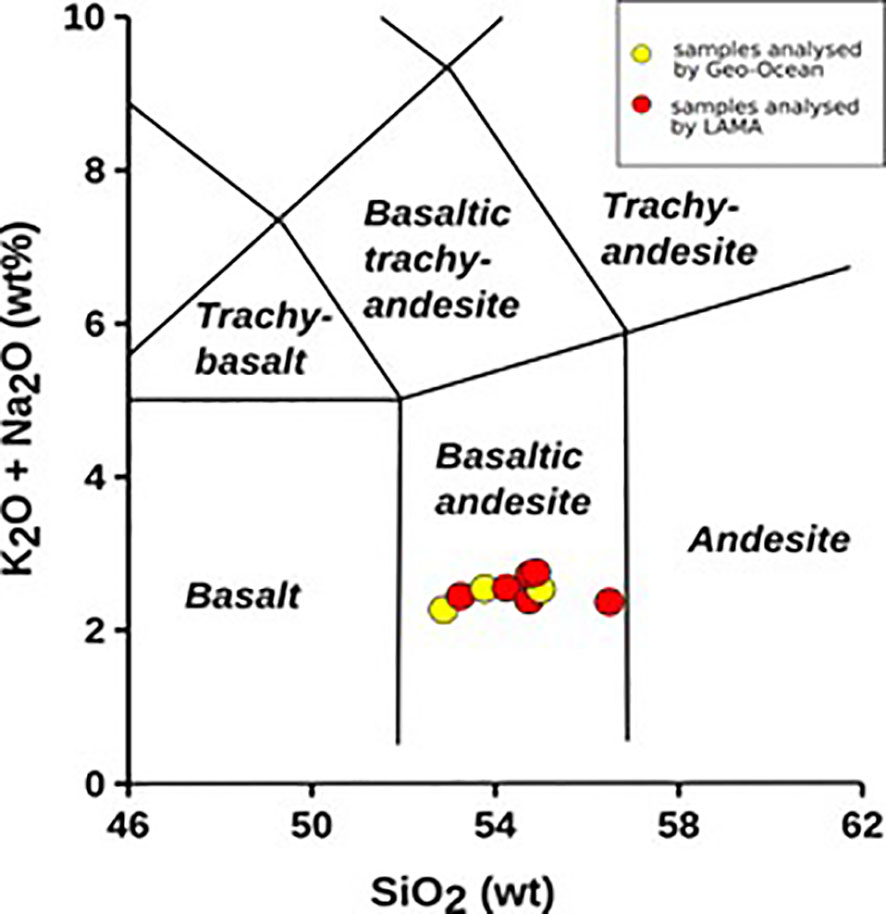
Figure 6 SiO2 versus total alkali of ash samples analyzed by Geo-Ocean (in yellow) and LAMA (in red) indicating that the ash samples are of basaltic andesite composition.
4. Discussion
4.1. Confusion with an atmospheric patch
Confirmation that the observed plume was not a result of atmospheric release through the observation of sulfur dioxide (SO2) was given by the TROPOspheric Monitoring Instrument (TROPOMI). The TROPOMI data showed that a SO2 patch over Tonga was much greater than the oceanic patch and had drifted to the west in less than two days toward Fiji and Australia (https://so2.gsfc.nasa.gov/). Within four days of the eruption, no SO2 signal could be recorded over the area of the discolored water patch.
4.2. Comparison with the 2019 eruption
It is remarkable that discolored water signatures of the 2022 eruption are different from the ones in 2019. The 2019 eruption was accompanied by a spread of discolored waters which could be delineated and followed for 2 weeks (Whiteside et al., 2021) in addition to large consolidated and fragmented pumice rafts. The spectral signature of the discolored waters was described as “milky”, as previously reported in Mantas et al. (2011). In 2019, Rrs in the 443-channel appeared higher than normal and calculated Chl-a was lower than the surrounding environment. Such discolored oceanic patches (“milky waters”) were well visible from December 2021 on the NASA Worldview Earthdata website (https://worldview.earthdata.nasa.gov/), as first indications of eruptive events, following atmospheric effects above the HTHH volcano on 20 December, 22 December 2022. Such pre-eruption discolored waters were similar to the ones already observed in 2019 (Whiteside et al., 2021) or after the 2008 eruption (Mantas et al., 2011). Chlorophyll-a calculated in 2019 were low and waters considered to be more oligotrophic than the surrounding ocean. Moreover, change rates of OC and IOP products prior to and after the eruption were small (by a factor between 2 and 3, Table 4).
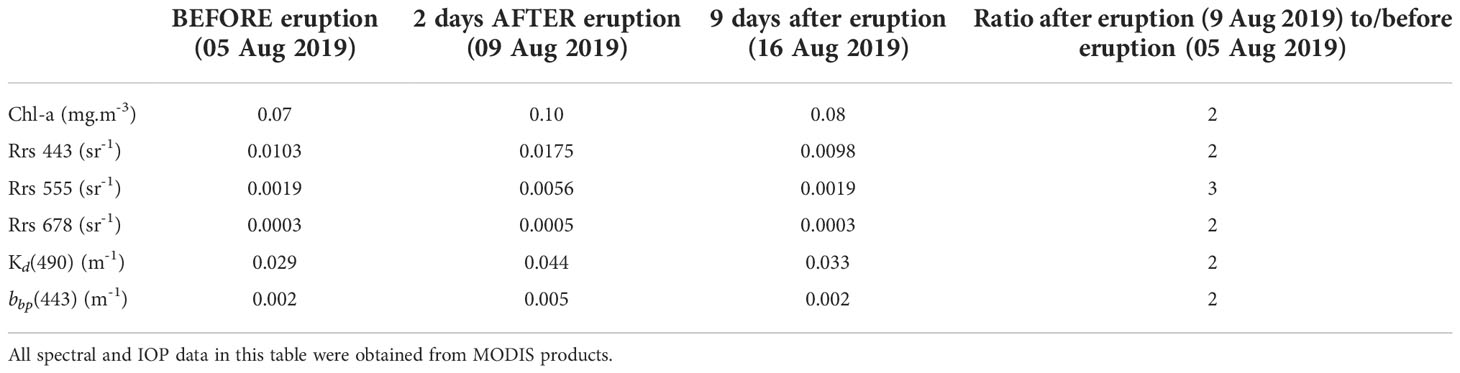
Table 4 Optical parameters for the 9 August 2019 eruption were extracted from MODIS/VIIRS products at the center of the patch.
The discolored waters following the 2022 eruption thus differ immensely from previous ones already described in the literature for all parameters.
4.3. Evidence of non-biological origin of the patch
Conclusive evidence of rapid phytoplankton growth is lacking, as seen from the sudden large increase on 17 January 2022 in the Chl-a, Kd or bbp, and nFLH series that occurred only a few days after little signal was observed just before the eruption, making it incompatible with a bloom formation. Chlorophyll-a was observed from 25 December 2021 to 26 January 2022. Conditions were normal up until 11 January, before clouds covered the area from 12 January to immediately post-eruption. A sudden rise in Chl-a (over 10 times greater) was evident at the location of the volcano directly afterwards, as similarly seen in a time series in Barone et al. (2022); see their Figure 2). The immediate positive effect of the eruption on Chl-a has rarely been documented despite numerous analyses of the MODIS satellite imagery following eruptions. Mantas et al. (2011) did not find any Chl-a enrichment just after the 2008 eruption off Tonga and found no direct link spatially to the eruption. Some enrichment was observed about 2 months after the event, and without spatial relation to the eruption site. During the previous 2019 eruption, discolored waters were not accompanied by high Chl-a but rather characterized a lower-than-normal Chl-a in milky waters, and Whiteside et al. (2021) hypothesized that silica, phosphate, and iron from the eruption would not be available soon after as mineralization by bacteria is not rapid enough to invoke a phytoplankton bloom. Similarly, following the 2011 volcanic eruption in the Canary Islands, Eugenio et al. (2014) concluded that the accuracy in chlorophyll monitoring via remote sensing during the eruptive phase was flawed due to the alterations provoked in the composition of the water. They established that OC MODIS models completely fail in environments of moderate turbidity.
We consider that nFLH extracted from the default L2 MODIS products was overestimated due to the presence of ashes, and thus is not reliable, which is expected for Case 2 waters (Gilerson et al., 2008; Hu and Feng, 2016) Gilerson et al. (2008) found that for concentrations of non-algal particles >5 g.m-3 the FLH algorithm was almost non-effective. Also, as indicated in Section 3, the retrieved water reflectance in the discolored patch does not exhibit a fluorescence signal, and the high nFLH values might be due to underestimating the baseline reflectance by using a very low water reflectance at 748 nm in the atmospheric correction scheme. Ahn and Park (2020) evaluated the Bailey et al. (2010) near-infrared reflectance model used to estimate Rrs at 748 nm in turbid waters against simulations and in situ data and concluded that it underestimated Rrs at 745 nm. Differences increased with increasing turbidity but were also large for retrieved Rrs values of <0.001 sr-1 at 745 nm, which corresponds to the Rrs values at 748 nm displayed in Figure 3. Furthermore, Ruddick et al. (2006)’s similarity spectrum, established from ship-based reflectance measurements in the red and near infrared and valid for a wide range of turbid waters, indicated that the Rrs values at 748 nm obtained in the discolored patch were much too low than those expected for the estimated Rrs values at 667 nm, providing additional indirect evidence of an underestimation of the baseline reflectance at 748 nm.
The ABI values within the patch center, obtained using an algorithm by Hu and Feng (2016), gave lower nFLH values than that of the MODIS operational algorithm, but higher than the surrounding waters. That coefficient, however, was determined for coastal waters of the Gulf of Mexico and may not be applicable to the discolored patch. According to our discussion above, there should not be significantly higher fluorescence in the patch after the eruption, and thus can calculate α which eliminates false-positive detection for the fluorescence signal. The α value used was three times higher than the one used for the phytoplanktonic blooms in Florida waters (i.e., 240 instead of 80). It corresponds to high turbidity, expected to characterize the patch, and correspond to extremely high values of MODIS bbp(443).
Such high Chl-a values were considered to be real in a recent study by Barone et al. (2022), who concluded that dramatic phytoplankton growth observed during the eruptive process was stimulated by nutrients released from volcanic ash. This is a strong counterhypothesis which unfortunately cannot be verified as no in situ data of Chl-a were available immediately after the eruption (Ministry of Fisheries, Tonga via Pers. Comm.). Based on the CMEMS modeled nutrient data, iron and nitrate levels were around 0 µM at the end of December 2021 preceding the first eruption, as expected for this ultra-oligotrophic region (e.g., Moutin et al., 2017). Modeled silica from the southwest of Tonga (1.09-1.17 µM) in December 2021 (1.12-1.88 µM) and modeled phosphate which is the main nutrient favoring diazotrophic blooms in the region (Moutin et al., 2012), i.e., 0.11-0.2 µM in December 2021 and January 2022, could not be a source for phytoplankton at the time of the eruption.
The discolored water patch’s round shape and size in the true color imagery was proportional to the spread of the atmospheric ash cloud over the eruptive column. This suggests that such discoloration of the water could be the result of ash fallout. The ash cloud also covered Tonga’s capital, Nuku’alofa, where ash samples were collected and analyzed in this work. The P2O5 content in the ash was relatively small (0.077-0.105 wt%) and may not be the main nutrient source of phosphorus if blooming did occur. The iron content was not exceptional either in comparison to other volcanoes. The question of hydrothermal input of dissolved inorganic nutrients creating the fertilization of local phytoplanktonic communities has not yet been answered (González-Vega et al., 2020). However, the ash deposits were mainly of juvenile magma materials which thus suggest less input from hydrothermal manifestation if any.
Another aspect of the patch evolution is the lack of Photosynthetic Available Radiation (PAR) in the middle of the patch. A phytoplankton bloom is unexpected here, as the penetration depth was reduced right after the eruption to less than 6 meters, preventing light from permeating through waters deeper than 10 meters.
Thus, the explanation of high Chl-a associated with higher-than-normal reflectance in the blue and green channels must be found elsewhere than to a phytoplanktonic origin. As the MODIS Chl-a algorithm is based on a combination of blue/green reflectance ratios, and as this blue/green reflectance ratio is influenced by the high Rrs555 value, the resulting Chl-a concentration is likely erroneous. In such highly turbid waters, Rrs sensitivity to Chl-a becomes very small in that spectral range. Two algorithms designed for coastal turbid waters, those of (Tassan, 1994) and Gitelson et al. (2008), when applied to the average Rrs spectrum observed on January 17 (Figure 3, brown curve), also yielded high but very different Chl-a values, i.e., 1.4 and 9.8 mg.m-3, respectively. Tassan’s algorithm utilizes Rrs at 4 wavelengths in the blue and green (412, 443, 490, and 555 nm), while Gitelson et al. (2008) uses Rrs at three wavelengths in the red (665, 715, and 750 nm). Using wavelengths in the red is especially difficult, in view of the relatively low signal in this spectral range and the uncertainties in the SeaDAS atmospheric correction, especially in Rrs at 748 nm, as discussed above. All the proposed Chl-a algorithms, however, have not been established using data collected in waters contaminated by volcanic ash and are not expected to provide reliable results in such situations. It is therefore highly probable that those are incorrect Chl-a values, and that ashes themselves were controlling the ocean color signature.
To provide additional evidence about the non-biogenic nature of the highly reflective patch, we compared the bbp(443)/Chl-a values retrieved by SeaDAS software from the various Rrs spectra of January 17 (Figure 3) to those of the (Morel and Maritorena, 2001) model developed for Case 1 waters, the type of waters encountered around Tonga. The average satellite-derived and model bbp(443)/Chl-a values were 0.0187 ± 0.0002 m2.mg-1 and 0.0023 ± 0.0001 m2.mg-1, respectively, i.e., 8.1 times higher than the former, suggesting that non-algal particles dominated the backscattering coefficient. The 0.0187 m2.mg-1 value is probably underestimated because, as indicated above, Chl-a is likely overestimated. We also used the Park and Ruddick (2005) reflectance model in inverse mode to retrieve, from the spectral Rrs data, the 3 model parameters, Chl-a, fa, and fb. In this model, the last 2 parameters characterize variability in absorption by CDOM (Colored Dissolved Organic Matter) and non-algal particles and backscattering by phytoplankton and non-algal particles, respectively. The spectral matching applied to the January 17 Rrs spectra gave an average Chl-a of 6.3 mg.m-3, which is large. The reflectance model, however, is constrained by bio-optical relations that do not consider ash-contaminated waters, and the retrieval only provides the best combination of the 3 parameters. However, if we fix Chl-a to 0.2 mg.m3, a typical value for waters not contaminated by ash in the region, we obtain a very good match of the average Rrs spectrum of January 17 for log10fb = 1.76 and log10fa = -0.25 (Figure 3, purple curve). This translates, according to the model parameterizations, into a backscattering coefficient at 550 nm and an absorption coefficient at 443 nm for non-algal particles about 56 and 29 times higher than the respective coefficients for phytoplankton, which is not unrealistic in the presence of large amounts of absorbing ash. This much higher backscattering coefficient is consistent with the retrieved average bbp(443) value from the Rrs spectra of January 17, i.e., 0.0359 m-1 instead of 0.00097 m-1 for phytoplankton (i.e., 37 times higher). In other words, the average Rrs spectrum observed on January 17 is not incompatible with a low Chl-a value of 0.2 mg.m-3.
Furthermore, if the reflective patch were of biogenic origin with large Chl-a, i.e., 1.92 mg.m-3on January 17 according to Table 2, the Rrs spectrum obtained using the Morel and Maritorena (2001) model would resemble that of Figure 3 (green curve), which is completely different from the observed spectrum (Figure 3, brown curve), with much lower values in the blue than those of non-contaminated waters.
4.4. Evidence of ash origin for the observed spectral signatures
A remarkable impact of the 2022 eruption was the increase of reflectance in all channels, consistent with large amounts of ash, a discolored material in contrast to phytoplankton which is green due to Chl-a absorption in the blue, deposited in the upper ocean layer. The high reflectance spectrum obtained inside the patch on January 17 is compatible with the gray color of the ashes which were collected on land in Tonga.
Considering the very specific optical signature of the patch during the period observed (17-26 January 2022, Table 2, Table 4) the abnormal Chl-a (Kd, or bbp) concentration was much higher than expected for the Tonga region, we conclude that the optical signature described above cannot be attributed to phytoplankton itself but rather to other particles with a high scattering coefficient (i.e., mineral ones). Indeed, the specific backscattering coefficient of minerals is higher than those of living cells and this has already been proven in the post 2019 eruption discolored waters (Whiteside et al., 2021). This also explains why the backscattering coefficient (much higher than that of phytoplankton cells) also remained at high levels for more than 2 weeks.
Magma released from the volcano erupted explosively, expelling large amounts of ash and pumice. Based on previous compositions, the magma released was not particularly rich in volatiles including sulfur or fluorine. According to their size and color, the ashes made good candidates for explaining the optical signature for the discolored waters. Powdered ash particles in the water column were likely to be the dominant substance and reason for the high Chl-a values and uncorrected fluorescence, extreme values of Kd, or bbp, and Rrs at all channels. Via personal communication (Ngaluafe, 2022), ash and pumice were spotted in the Tonga region long after the eruption. Preliminary results from an ecological survey conducted around the HTHH volcano by the NIWA and NIPPON Foundation indicated that ash was still suspended in the water column, months later. Chlorophyll measurements immediately post-eruption around the volcano are unfortunately lacking.
4.5. Implications of the ash patch for the area
4.5.1. Comparison with CMEMS currents
The ash patch on 17 January decreased in size and intensity over time (Figure 7). Dispersal patterns and shape of the ash water patch seem to be influenced by ocean currents for 19 days (15 January to 2 February). Anticyclonic eddies dispersed the southern end of the plume southward and then eastward (see red boxes in Figure 6) eventually causing the plume to follow the currents in the eddy. The southward-oriented currents to the west of the plume (see green boxes in Figure 6) further dispersed the plume southward eventuating in an inverted crown-like shape for the southern end of it. The eastern part of the plume was affected by another anticyclonic eddy (see blue boxes in Figure 6) causing northwestward dispersion. The ash plume centroid moved southwards due to southward currents both to the west and east of the plume.
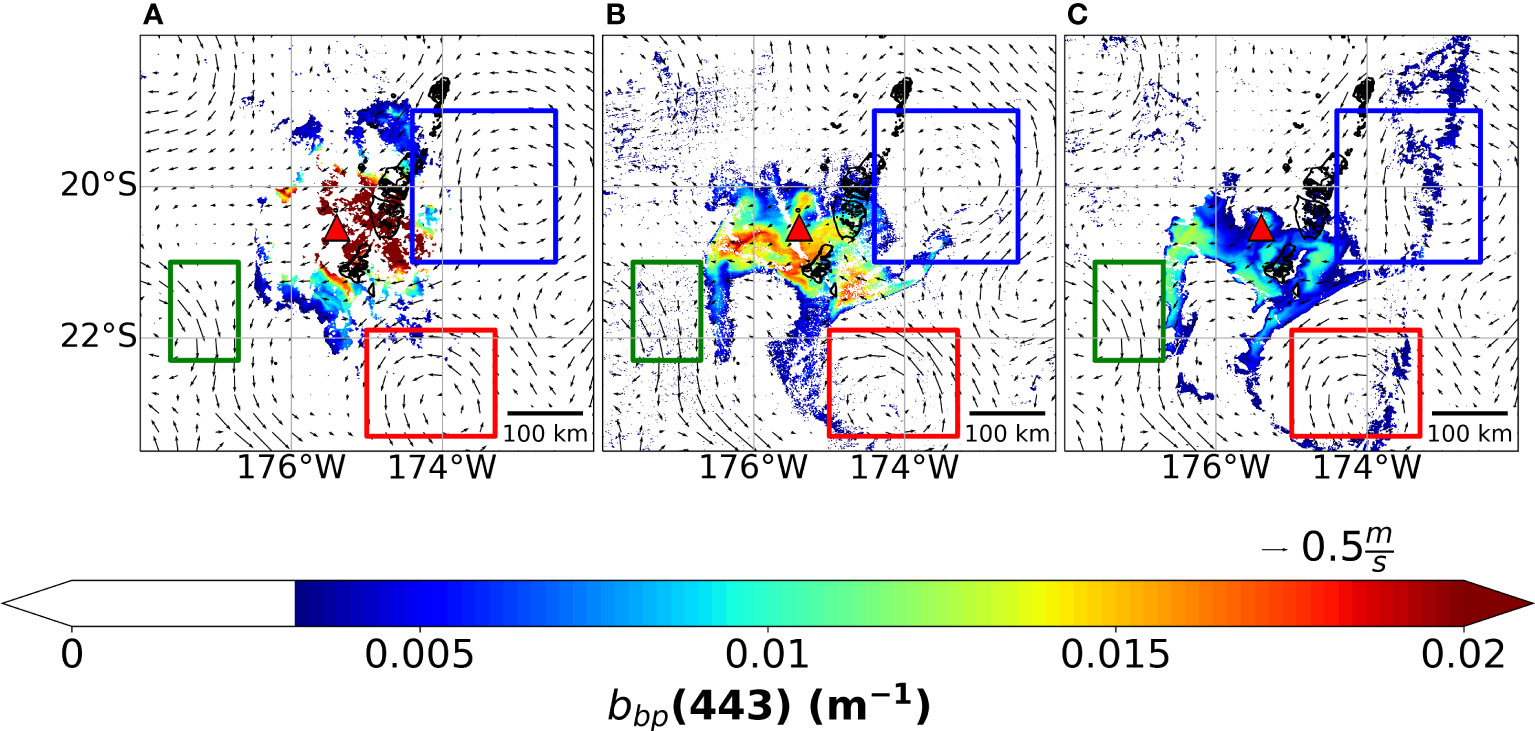
Figure 7 Backscattering of particles bbp(443) with superimposed CMEMS ocean surface current velocity on (A) 17 January 2022, (B) 22 January 2022, and (C) 26 January 2022. Current scale is in meters per second (the reference length of the arrow represents 0.5 m/s). The backscattering coefficient threshold of Whiteside et al., 2021 (>0.0032 m-1) was applied to delineate the patch from clouds and from oceanic water with no value.
4.5.2. Permanence of the patch
Laboratory analysis of the ash samples indicated that the ejected material is basaltic and andesitic in composition, resulting in a corresponding rock density of 2600 kg/m3. However, this is more than twice the density of seawater (1030 kg/m3) and with such a difference, one would not expect to see suspended and floating material. By way of observation, the particles were small (70-200 µm), however, they had a porosity of 30-40%, which reduced their density to 780-1040 kg/m3. Thus, we have a density much closer to the density of seawater, which would explain the long-term suspension of the particles. Attenuation decrease may also be linked to the gradual sinking of ashes in the water column as currents were weak in this area. The high porosity of the ashes might explain that the ashes stay in the water column with an almost constant value of Kd, bbp and Chl-a, greater than 10 days in the water column (still visible and disappear only on 2 February).
There is a possibility that the ash optical signature changed over time due to their gradual sinking and filling of microscopic pumice ashes with sea water. Indeed, the reflectance in all channels decreases progressively within 10 days post-eruption (Figure 2 and Table 2), with Kd and bbp and Chl-a reaching minimum values by 2 February (Figures 4A, B).
4.6. Implications for coral reefs of Tonga archipelago
Severe deoxygenation may have had serious implications within the surrounding area which was a main cause of mortality in marine life in the early weeks following the 2011 Tagoro eruption (González-Vega et al., 2022). Similarly, the reduction of light from the ashes raised immediate concerns over the health of the coral reef ecosystems after the eruption, notably the smothering of ash particles in waters over corals (Franklin and Storel, 2022). Though impossible to give exact penetration values of Kd(490) above locations where corals are present due to the high bottom reflectance effect of reefs, utilizing Kd(490) gave us an indication of the lack of light provided to corals from ash increase in surrounding waters. Localized decrease of the blue reflectance (linked to a phytoplankton or high CDOM concentration) near the northern reefs of the Ha’apai group of islands, disconnected to the patch, may result from a biological response occurring after several days (from a phytoplankton growth or absorbing CDOM released from reefs). It is likely that coral benthic organisms suffered from lower light penetration in the water during the first three weeks as a function of flushing times over reefs. In-situ observations to determine the current state of Tonga’s corals that may have been exposed to high turbidity would be necessary. In addition, coral monitoring post-eruption is important to better understand past submarine eruptions in terms of their timing, duration, and intensity (Álvarez-Valero et al., 2018). Further studies are required to assist and aid in forecasting eruptive events.
5. Conclusion
The optical signature of discolored waters observed after the powerful 15 January 2022 eruption (high Chl-a, high reflectance in the blue-green channels) is most likely caused by ash material issued from the eruption that was ejected and deposited into the ocean. The high Chl-a values derived from satellite are likely to be incorrect as nutrients would not be sufficiently available for growth to occur immediately. The presence of ash influenced the ocean color signature, biasing the Chl-a estimates. Although phytoplankton can grow after such an event and even bloom, conclusive evidence for this to have occurred has been lacking and they typically do not develop as quickly as in a day. In addition, particle backscattering in the blue-green channels showed the discolored water patch shape being inconsistent with a Chl-a normal optical signature, further contradicting the observed ‘high chlorophyll’ using the NASA standard algorithm and therefore highlighting here the direct impact of ashes on ocean color.
To conclude, this study shows how ocean color products tracked the expanse of floating and suspended material (basalt andesitic powdered ashes, and potentially combined with some phytoplankton signature) post 2022 eruption. Surface pumice appeared in a few fragments after this eruption, contrary to the 2019 one which initially saw larger consolidated floating material travel west toward Fiji. The high attenuation of light due to ash, reducing the penetration depth to less than 10 meters during the first period after the eruption may have had strong implications on ecological processes and biogeochemical cycles in the Tongan waters. The study also showed the difficulty of interpreting ocean color signals in this area.
Data availability statement
The original contributions presented in the study are included in the article/Supplementary Material. Further inquiries can be directed to the corresponding author.
Author contributions
AW and CD designed the research. AW, RF, JT, PB, CD and AS analyzed and interpreted the data. AW wrote the original draft CD, RF, PB and AS reviewed and edited the manuscript. CD and AS supervised the study. All authors contributed to the article and approved the submitted version.
Funding
The University of Bergen and the University of the South Pacific supported publication costs through their support of the Norway-Pacific Chair in Ocean and Climate Change. AW’s PhD is funded by the « Allocations de recherche pour une thése au Sud (ARTS-IRD) » program and receives support from the Ecole Doctorale Sciences de l’environnement—ED 251-Aix Marseille Université, 2019–2023 and UM 110 Mediterranean Institute of Oceanography.
Acknowledgments
The authors thank NASA for making available the MODIS/ VIIRS Aqua data and the SeaDAS data processing software. We acknowledge CMEMS Copernicus data (modeled currents, modeled nutrients, interpolated data of Kd and bbp). We deeply thank Geo-ocean (GO) – UMR 6538 Institut Universitaire Europeen de la Mer (IUEM) and LAMA (Laboratoire des Moyens Analytiques of UAR IMAGO) at the Center IRD of Noumea (New Caledonia) for ash analyses. We also acknowledge Mr. Poasi Ngaluafe of the Tongan Ministry of Fisheries for providing us with on the ground observations. This work would not have been possible without the ash collection in Tonga done by Etienne Hus of France Volontaires International. RF’s and JT’s work was supported by NASA under various grants. We acknowledge the University of Bergen and the University of the South Pacific who supported publication costs through their support of the Norway-Pacific Chair in Ocean and Climate Change.
Conflict of interest
The authors declare that the research was conducted in the absence of any commercial or financial relationships that could be construed as a potential conflict of interest.
Publisher’s note
All claims expressed in this article are solely those of the authors and do not necessarily represent those of their affiliated organizations, or those of the publisher, the editors and the reviewers. Any product that may be evaluated in this article, or claim that may be made by its manufacturer, is not guaranteed or endorsed by the publisher.
Supplementary material
The Supplementary Material for this article can be found online at: https://www.frontiersin.org/articles/10.3389/fmars.2022.1028022/full#supplementary-material
References
Ahn J.-H., Park Y.-J. (2020). Estimating water reflectance at near-infrared wavelengths for turbid water atmospheric correction: A preliminary study for GOCI-II. Remote Sens. 12, 3791. doi: 10.3390/rs12223791
Álvarez-Valero A. M., Burgess R., Recio C., de Matos V., Sánchez-Guillamón O., Gómez-Ballesteros M., et al. (2018). Noble gas signals in corals predict submarine volcanic eruptions. Chem. Geol. noble gases as geochem. tracers – celebration Pete Burnard 480, 28–34. doi: 10.1016/j.chemgeo.2017.05.013
Ariza A., Kaartvedt S., Røstad A., Garijo J. C., Arístegui J., Fraile-Nuez E., et al. (2014). The submarine volcano eruption off El hierro island: Effects on the scattering migrant biota and the evolution of the pelagic communities. PloS One 9, e102354. doi: 10.1371/journal.pone.0102354
Austin R. W., Petzold T. J. (1981). The determination of the diffuse attenuation coefficient of Sea water using the coastal zone color scanner (New York, USA: SpringerLink).
Bailey S. W., Franz B. A., Werdell P. J. (2010). Estimation of near-infrared water-leaving reflectance for satellite ocean color data processing. Opt. Express OE 18, 7521–7527. doi: 10.1364/OE.18.007521
Barone B., Letelier R. M., Rubin K. H., Karl D. M. (2022). Satellite detection of a massive phytoplankton bloom following the 2022 submarine eruption of the hunga Tonga-hunga haʻapai volcano. Geophysical Res. Lett. 49, e2022GL099293. doi: 10.1029/2022GL099293
Bryan W. B., Stice G. D., Ewart A. (1972). Geology, petrography, and geochemistry of the volcanic islands of Tonga. J. Geophysical Res. 1896-1977) 77, 1566–1585. doi: 10.1029/JB077i008p01566
Cappucci M. (2022). How the Tonga volcano generated a shock wave around the world (Washington D.C., USA: Washington Post).
Cronin S. (2022)A once in a 1000-year eruption [WWW document]. In: A once on a 1000-year eruption. Available at: https://www.spc.int/updates/blog/partners/2022/01/a-once-in-a-1000-year-eruption (Accessed 2.13.22).
Cronin S., Brenna M., Smith I., Barker S., Tost M., Ford M., et al. (2017). New volcanic island unveils explosive past. Eos 98, 1–6. doi: 10.1029/2017EO076589
Dupouy C., Frouin R., Tedetti M., Maillard M., Rodier M., Lombard F., et al. (2018). Diazotrophic trichodesmium impact on UV–vis radiance and pigment composition in the western tropical south pacific. Biogeosciences 15, 5249–5269. doi: 10.5194/bg-15-5249-2018
Eugenio F., Martin J., Marcello J., Fraile-Nuez E. (2014). Environmental monitoring of El hierro island submarine volcano, by combining low and high resolution satellite imagery. Int. J. Appl. Earth Observation Geoinformation 29, 53–66. doi: 10.1016/j.jag.2013.12.009
Ferrera I., Aristegui J., Gonzalez J., Montero M., Fraile-Nuez E., Gasol J. (2015). Transient changes in bacterioplankton communities induced by the submarine volcanic eruption of El hierro (Canary islands). PloS One 10, e0118136. doi: 10.1371/journal.pone.0118136
Fraile-Nuez E., González-Dávila M., Santana-Casiano J. M., Arístegui J., Alonso-González I. J., Hernández-León S., et al. (2012). The submarine volcano eruption at the island of El hierro: physical-chemical perturbation and biological response. Sci. Rep. 2, 486. doi: 10.1038/srep00486
Franklin J., Storel M. (2022). Satellite images show the aftermath of Tonga volcano’s eruption (Washington D.C., USA: NPR).
Gilerson A., Zhou J., Hlaing S., Ioannou I., Gross B., Moshary F., et al. (2008). Fluorescence component in the reflectance spectra from coastal waters. II. Perform. retrieval algorithms. Optics express 16, 2446–2460. doi: 10.1364/OE.16.002446
Gitelson A. A., Dall’Olmo G., Moses W., Rundquist D. C., Barrow T., Fisher T. R., et al. (2008). A simple semi-analytical model for remote estimation of chlorophyll-a in turbid waters: Validation. Remote Sens. Environ. 112, 3582–3593. doi: 10.1016/j.rse.2008.04.015
González-Vega A., Callery I., Arrieta J. M., Santana-Casiano J. M., Domínguez-Yanes J. F., Fraile-Nuez E. (2022). Severe deoxygenation event caused by the 2011 eruption of the submarine volcano tagoro (El hierro, canary islands). Front. Mar. Sci. 9. doi: 10.3389/fmars.2022.834691
González-Vega A., Fraile-Nuez E., Santana-Casiano J. M., González-Dávila M., Escánez-Pérez J., Gómez-Ballesteros M., et al. (2020). Significant release of dissolved inorganic nutrients from the shallow submarine volcano tagoro (Canary islands) based on seven-year monitoring. Front. Mar. Sci. 6. doi: 10.3389/fmars.2019.00829
Hu C., Feng L. (2016). Modified MODIS fluorescence line height data product to improve image interpretation for red tide monitoring in the eastern gulf of Mexico. J. Appl. Remote Sens. 11, 12003. doi: 10.1117/1.JRS.11.012003
Lee Z.-P., Darecki M., Carder K., Davis C., Stramski D., Rhea W. (2005). Diffuse attenuation coefficient of downwelling irradiance: An evaluation of remote sensing methods. J. Geophys. Res. 110, 1–9. doi: 10.1029/2004JC002573
Mantas V. M., Pereira A. J. S. C., Morais P. V. (2011). Plumes of discolored water of volcanic origin and possible implications for algal communities. the case of the home reef eruption of 2006 (Tonga, southwest pacific ocean). Remote Sens. Environ. 115, 1341–1352. doi: 10.1016/j.rse.2011.01.014
Morel A., Gentili B., Claustre H., Babin M., Bricaud A., Ras J., et al. (2007). Optical properties of the “clearest” natural waters. Limnol. Oceanogr. - LIMNOL OCEANOGR. 52, 217–229. doi: 10.4319/lo.2007.52.1.0217
Morel A., Maritorena S. (2001). Bio-optical properties of oceanic waters. J. Geophys. Res. doi: 10.1029/2000JC000319
Moutin T., Doglioli A., Verneil A., Bonnet S. (2017). Preface: The oligotrophy to the UlTra-oligotrophy PACific experiment (OUTPACE cruise, 18 February to 3 April 2015). Biogeosciences 14, 3207–3220. doi: 10.5194/bg-14-3207-2017
Moutin T., Wambeke F., Prieur L. (2012). Introduction to the biogeochemistry from the oligotrophic to the ultraoligotrophic Mediterranean (BOUM) experiment. Biogeosciences 9, 3817–3825. doi: 10.5194/bg-9-3817-2012
NOAA (2022). “The hunga Tonga-hunga ha’apai eruption, a multi-hazard event | nesdis [WWW document],” in The hunga Tonga-hunga ha’apai eruption, a multi-hazard event. Maryland, USA: National Environmental Satellite Data and Information Service. Available at: https://www.nesdis.noaa.gov/news/the-hunga-tonga-hunga-haapai-eruption-multi-hazard-event.
Park Y.-J., Ruddick K. (2005). Model of remote-sensing reflectance including bidirectional effects for case 1 and case 2 waters. Appl. optics 44, 1236–1249. doi: 10.1364/AO.44.001236
Ruddick K. G., De Cauwer V., Park Y.-J., Moore G. (2006). Seaborne measurements of near infrared water-leaving reflectance: The similarity spectrum for turbid waters. Limnol. Oceanogr. 51, 1167–1179. doi: 10.4319/lo.2006.51.2.1167
Sakuno Y. (2021). Trial of chemical composition estimation related to submarine volcano activity using discolored seawater color data obtained from GCOM-c SGLI. A Case Study Nishinoshima Island Japan 2020. Water 13, 1100. doi: 10.3390/w13081100
Santana-Casiano J. M., González-Dávila M., Fraile-Nuez E., de Armas D., González A. G., Domínguez-Yanes J. F., et al. (2013). The natural ocean acidification and fertilization event caused by the submarine eruption of El hierro. Sci. Rep. 3, 1140. doi: 10.1038/srep01140
Santana-González C., Santana-Casiano J. M., González-Dávila M., Fraile-Nuez E. (2017). Emissions of Fe(II) and its kinetic of oxidation at tagoro submarine volcano, El hierro. Mar. Chem. SI: Honoring Frank Millero 195, 129–137. doi: 10.1016/j.marchem.2017.02.001
Smithsonian Institute (2019) Most recent weekly report: 14 august to 20 august 2019 [WWW document] (National Museum of Natural History: Global Volcanism Program). Available at: https://volcano.si.edu/volcano.cfm?vn=243091 (Accessed 11.30.20)
Tassan S. (1994) Local algorithms using SeaWiFS data for the retrieval of phytoplankton, pigments, suspended sediment, and yellow substance in coastal waters [WWW document]. Available at: https://opg.optica.org/ao/abstract.cfm?uri=ao-33-12-2369 (Accessed 11.15.22).
The World Bank (2022). THE JANUARY 15, 2022 HUNGA TONGA-HUNGA HA’APAI ERUPTION AND TSUNAMI, TONGA. GLOBAL RAPID POST DISASTER DAMAGE ESTIMATION (GRADE) REPORT. Washington D.C., USA: International Bank for Reconstruction and Development
Urai M., Machida S. (2005). Discolored seawater detection using ASTER reflectance products: A case study of Satsuma-iwojima, Japan. Remote Sens. Environ. - Remote SENS Environ. 99, 95–104. doi: 10.1016/j.rse.2005.04.028
Werdell P. J., Bailey S. W. (2005). An improved in-situ bio-optical data set for ocean color algorithm development and satellite data product validation. Remote Sens. Environ. 98, 122–140. doi: 10.1016/j.rse.2005.07.001
Whiteside A., Dupouy C., Singh A., Frouin R., Menkes C., Lefèvre J. (2021). Automatic detection of optical signatures within and around floating Tonga-Fiji pumice rafts using MODIS, VIIRS, and OLCI satellite sensors. Remote Sens. 13, 501. doi: 10.3390/rs13030501
Witze A. (2022)Why the Tongan eruption will go down in the history of volcanology [WWW document]. In: Why the Tongan eruption will down in the history of volcanology. Available at: https://www.nature.com/articles/d41586-022-00394-y (Accessed 2.13.22).
Keywords: chlorophyll-a (Chl-a), HTHH, light attenuation, particle backscattering, ocean currents, volcanic ash, remote sensing
Citation: Whiteside A, Dupouy C, Singh A, Bani P, Tan J and Frouin R (2023) Impact of ashes from the 2022 Tonga volcanic eruption on satellite ocean color signatures. Front. Mar. Sci. 9:1028022. doi: 10.3389/fmars.2022.1028022
Received: 25 August 2022; Accepted: 25 November 2022;
Published: 04 January 2023.
Edited by:
Lei Ren, Sun Yat-sen University, ChinaReviewed by:
Eugenio Fraile-Nuez, Centro Oceanográfico de Canarias, Consejo Superior de Investigaciones Científicas (CSIC), SpainXiaogang Xing, Ministry of Natural Resources, China
Copyright © 2023 Whiteside, Dupouy, Singh, Bani, Tan and Frouin. This is an open-access article distributed under the terms of the Creative Commons Attribution License (CC BY). The use, distribution or reproduction in other forums is permitted, provided the original author(s) and the copyright owner(s) are credited and that the original publication in this journal is cited, in accordance with accepted academic practice. No use, distribution or reproduction is permitted which does not comply with these terms.
*Correspondence: Andra Whiteside, YW5kcmF3aGl0ZXNpZGVAZ21haWwuY29t