 Hyuntae Choi1
 Bohyung Choi1,2Yoshito Chikaraishi3
 Yoshinori Takano4
 Haryun Kim5
 Kitack Lee6
 Dhongil Lim7
 Kyung-Hoon Shin1*
- 1Department of Marine Science and Convergent Technology, Hanyang University, Ansan, South Korea
- 2Central Inland Fisheries Research Institute, National Institute of Fisheries Science, Geumsan, South Korea
- 3Isotope Physiology, Ecology, and Geochemistry Group, Institute of Low Temperature Science (ILTS), Hokkaido University, Sapporo, Japan
- 4Biogeochemistry Research Center (BGC), Japan Agency for Marine-Earth Science and Technology (JAMSTEC), Yokosuka, Japan
- 5East Sea Research Institute, Korea Institute of Ocean Science and Technology, Uljin, South Korea
- 6Division of Environmental Science and Engineering, Pohang University of Science and Technology, Pohang, South Korea
- 7South Sea Research Institute, Korea Institute of Ocean Science and Technology, Geoge, South Korea
The proportion of amino acids (AAs) in sediment can be used as an indicator of microbial degradation, which is primarily the product of benthic prokaryote activity. The microbial activity would be reflected with the stable isotope ratio of nitrogen (δ15N) at the time of mineralization and resynthesis of AAs. In this study, the compound-specific isotope analysis of individual AAs was used to investigate δ15N variation associated with microbial processes in marine sediment samples. Our results showed a decrease in AA concentrations in core-top sediment was accompanied by an increase in δ15N values, suggesting large 15N enrichment in buried AAs. Phenylalanine displayed an increase in δ15N from the surface to depths greater than 2 cm, whereas relatively constant δ15N values at depths below 2 cm, suggesting that microbial utilization of phenylalanine varies with depth. Glycine showed the highest relative molar contribution (from 12.1 to 36.4%), with the largest δ15N increase (from 0.8 to 8.7) in deep sediment, implying that such information can serve as a measure of AA diagenesis in sedimentary environments. Our results also indicated that the δ15N values of individual AAs in sediment reflected the microbial alteration of organic matter at water-sediment interfaces and in sub-surface environments. These findings form an important basis for interpreting the δ15N values of AAs in sediment.
Introduction
Compound-specific isotope analysis of individual amino acids (CSIA-AAs) is increasingly used as an improved research tool in marine ecology (Chikaraishi et al., 2009; McMahon and McCarthy, 2016; Ohkouchi et al., 2017). CSIA-AAs can solve the inherent problem posed by bulk stable isotope analysis, which provides mixed information on both trophic transfer and basal sources. Amino acids (AAs) are separated by trophic and source AAs within an organism according to the metabolic pathway. Trophic AAs (e.g., alanine and glutamic acid) usually exhibit large nitrogen isotopic fractionation due to metabolic processes, such as deamination and transamination (Chikaraishi et al., 2007). In contrast, source AAs (e.g., phenylalanine) exhibit negligible isotopic fractionation because carbon-nitrogen bonds are preserved in metabolism (Chikaraishi et al., 2007). The trophic transfer and isotopic baseline information in an ecosystem can be obtained separately by trophic and source AAs, respectively. Independent information on the trophic transfer and source (baseline) in an organism allows us to estimate the trophic position (TP) of a consumer without the need for establishing a nitrogen isotope ratio (δ15N) of the baseline in an ecosystem (Chikaraishi et al., 2014). Nitrogen isotope ratios of phenylalanine (δ15Nphe), which represent source AAs, are also a useful indicator of nitrogen baseline due to the high isotopic stability through trophic transfer (Chikaraishi et al., 2009; Chikaraishi et al., 2014). The δ15Nphe values can be used to trace nitrogen sources and to understand the nitrogen cycle in diverse marine environments. For example, the spatial difference in δ15N baselines has been determined by using sessile bivalves (Vokhshoori and McCarthy, 2014; Choi and Shin, 2021), and the shifting of a primary producer was discovered by using a gorgonian coral skeleton in a tropical region (Sherwood et al., 2014).
Amino acids are major compounds of organic nitrogen found in aquatic environments and, as one of the most important compounds in both living organisms and non-living organic matter. The bioactivity of AAs in dissolved and sedimentary organic matter plays a significant role in geochemistry (Dauwe and Middelburg, 1998; Davis et al., 2009; Fernandes et al., 2014). Amino acid composition, as well as organic matter composition, within sediments, can differ by grain size (Calvert et al., 1995; Keil et al., 1998), calcium carbonate concentration (Carter and Mitterer, 1978), water depth, and oxygen concentration (Pedersen et al., 1992; Dauwe et al., 1999; Mayer et al., 2002). Various degradation states in sedimentary organic matter have been observed based on these environmental factors mentioned above. The degree of the microbial degradation in organic matter has been determined by the contribution of AAs to total nitrogen (TN) and non-proteinaceous AAs (Cowie and Hedges, 1992; Cowie and Hedges, 1994). The microbial degradation of organic matter also could be evaluated using detailed AAs proportion based on the selective preservation of specific AAs (Vandewiele et al., 2009) and bacterial community–generating peptidoglycan (Lomstein et al., 2006). The DI value is calculated based on the compositional alteration of AA molar percent, indicating the degradation status of organic matter (Dauwe et al., 1999). The mole percent of Gly over Ser can be interpreted as the result of preferential accumulation of peptidoglycan over diatom frustules, and the increase of Gly/Ser ratio could indicate the conversion of organic matter from phytoplankton into bacteria in sediment (Niggemann et al., 2018). Recently, the trophic position estimated by δ15N values of AAs could be applied to understand the composition of biogenic organic matter (autotroph vs. heterotroph) in non-living samples, such as particulate organic matter (McCarthy et al., 2007; Eglite et al., 2018), sinking particle (Shen et al., 2021; Choi et al., 2022), and sediment (Carstens et al., 2013; Batista et al., 2014; Stücheli et al., 2021). Additionally, the degree of AA resynthesis by heterotrophic microbes has been demonstrated using an index, ∑V, estimated by the δ15N values of multiple trophic AAs (McCarthy et al., 2007). The ∑V value has been applied to sediments (Carstens et al., 2013; Batista et al., 2014; Larsen et al., 2015) and dissolved organic matter (Yamaguchi and McCarthy, 2018). However, the information on nitrogen isotope alterations for individual AAs is insufficient to fully understand the effect of microbial activity on sedimentary organic matter. The current approach of interpreting isotopic fractionation of nitrogen-containing organic compounds triggered by chemical degradation remains challenging to implement (Robinson et al., 2012).
Rapid degradation of labile compounds typically raises the C:N ratio (Gälman et al., 2008) and increases elemental isotope ratios (Brahney et al., 2014). In particular, water-sediment interfaces between surface and subsurface environments can induce high microbial activities at an early stage of diagenesis (Santschi et al., 1990; Wakeham, 2002). Amino acids and labile short-chain peptides are highly bioavailable organic compounds, and their isotopic composition can easily and rapidly change during early diagenesis, recycling processes, microbial uptake, and reproduction in sediments (Orsi, 2018). For example, δ15NPhe values exhibited little fractionation in a cultivation experiment involving fungi, bacteria, and archaea (Steffan et al., 2017; Yamaguchi et al., 2017) based on animal-like utilization of organic substrate. However, the δ15NPhe values can change when peptide bonds break during microbial degradation in dissolved organic matter (Yamaguchi and McCarthy, 2018). The difference between these two patterns of isotopic fractionation suggests that microbes can utilize AAs for both (1) direct assimilation and (2) carbon and nitrogen source. The relative magnitude of (1) and (2) determines the degree of δ15N elevation in non-living organic matter. However, few δ15N values in CSIA-AA studies using marine sediment have been reported (Carstens et al., 2013; Batista et al., 2014) even though sediment samples are potentially informative for observing microbial nitrogen cycle.
In this study, we evaluated the effects of isotopic fractionation associated with microbial degradation using measurements of the molar abundance and isotopic composition of AAs in sediment samples collected across a wide range of locations from the Yellow and East China Seas, East/Japan Sea, and the Pacific Arctic Ocean (Figure 1). We used surface sediment samples, which showed a wide range of δ15N values (3.9 to 9.2‰) (Kim et al., 2017) and may thereby help to understand variation in the degree of degradation according to the δ15N baseline.
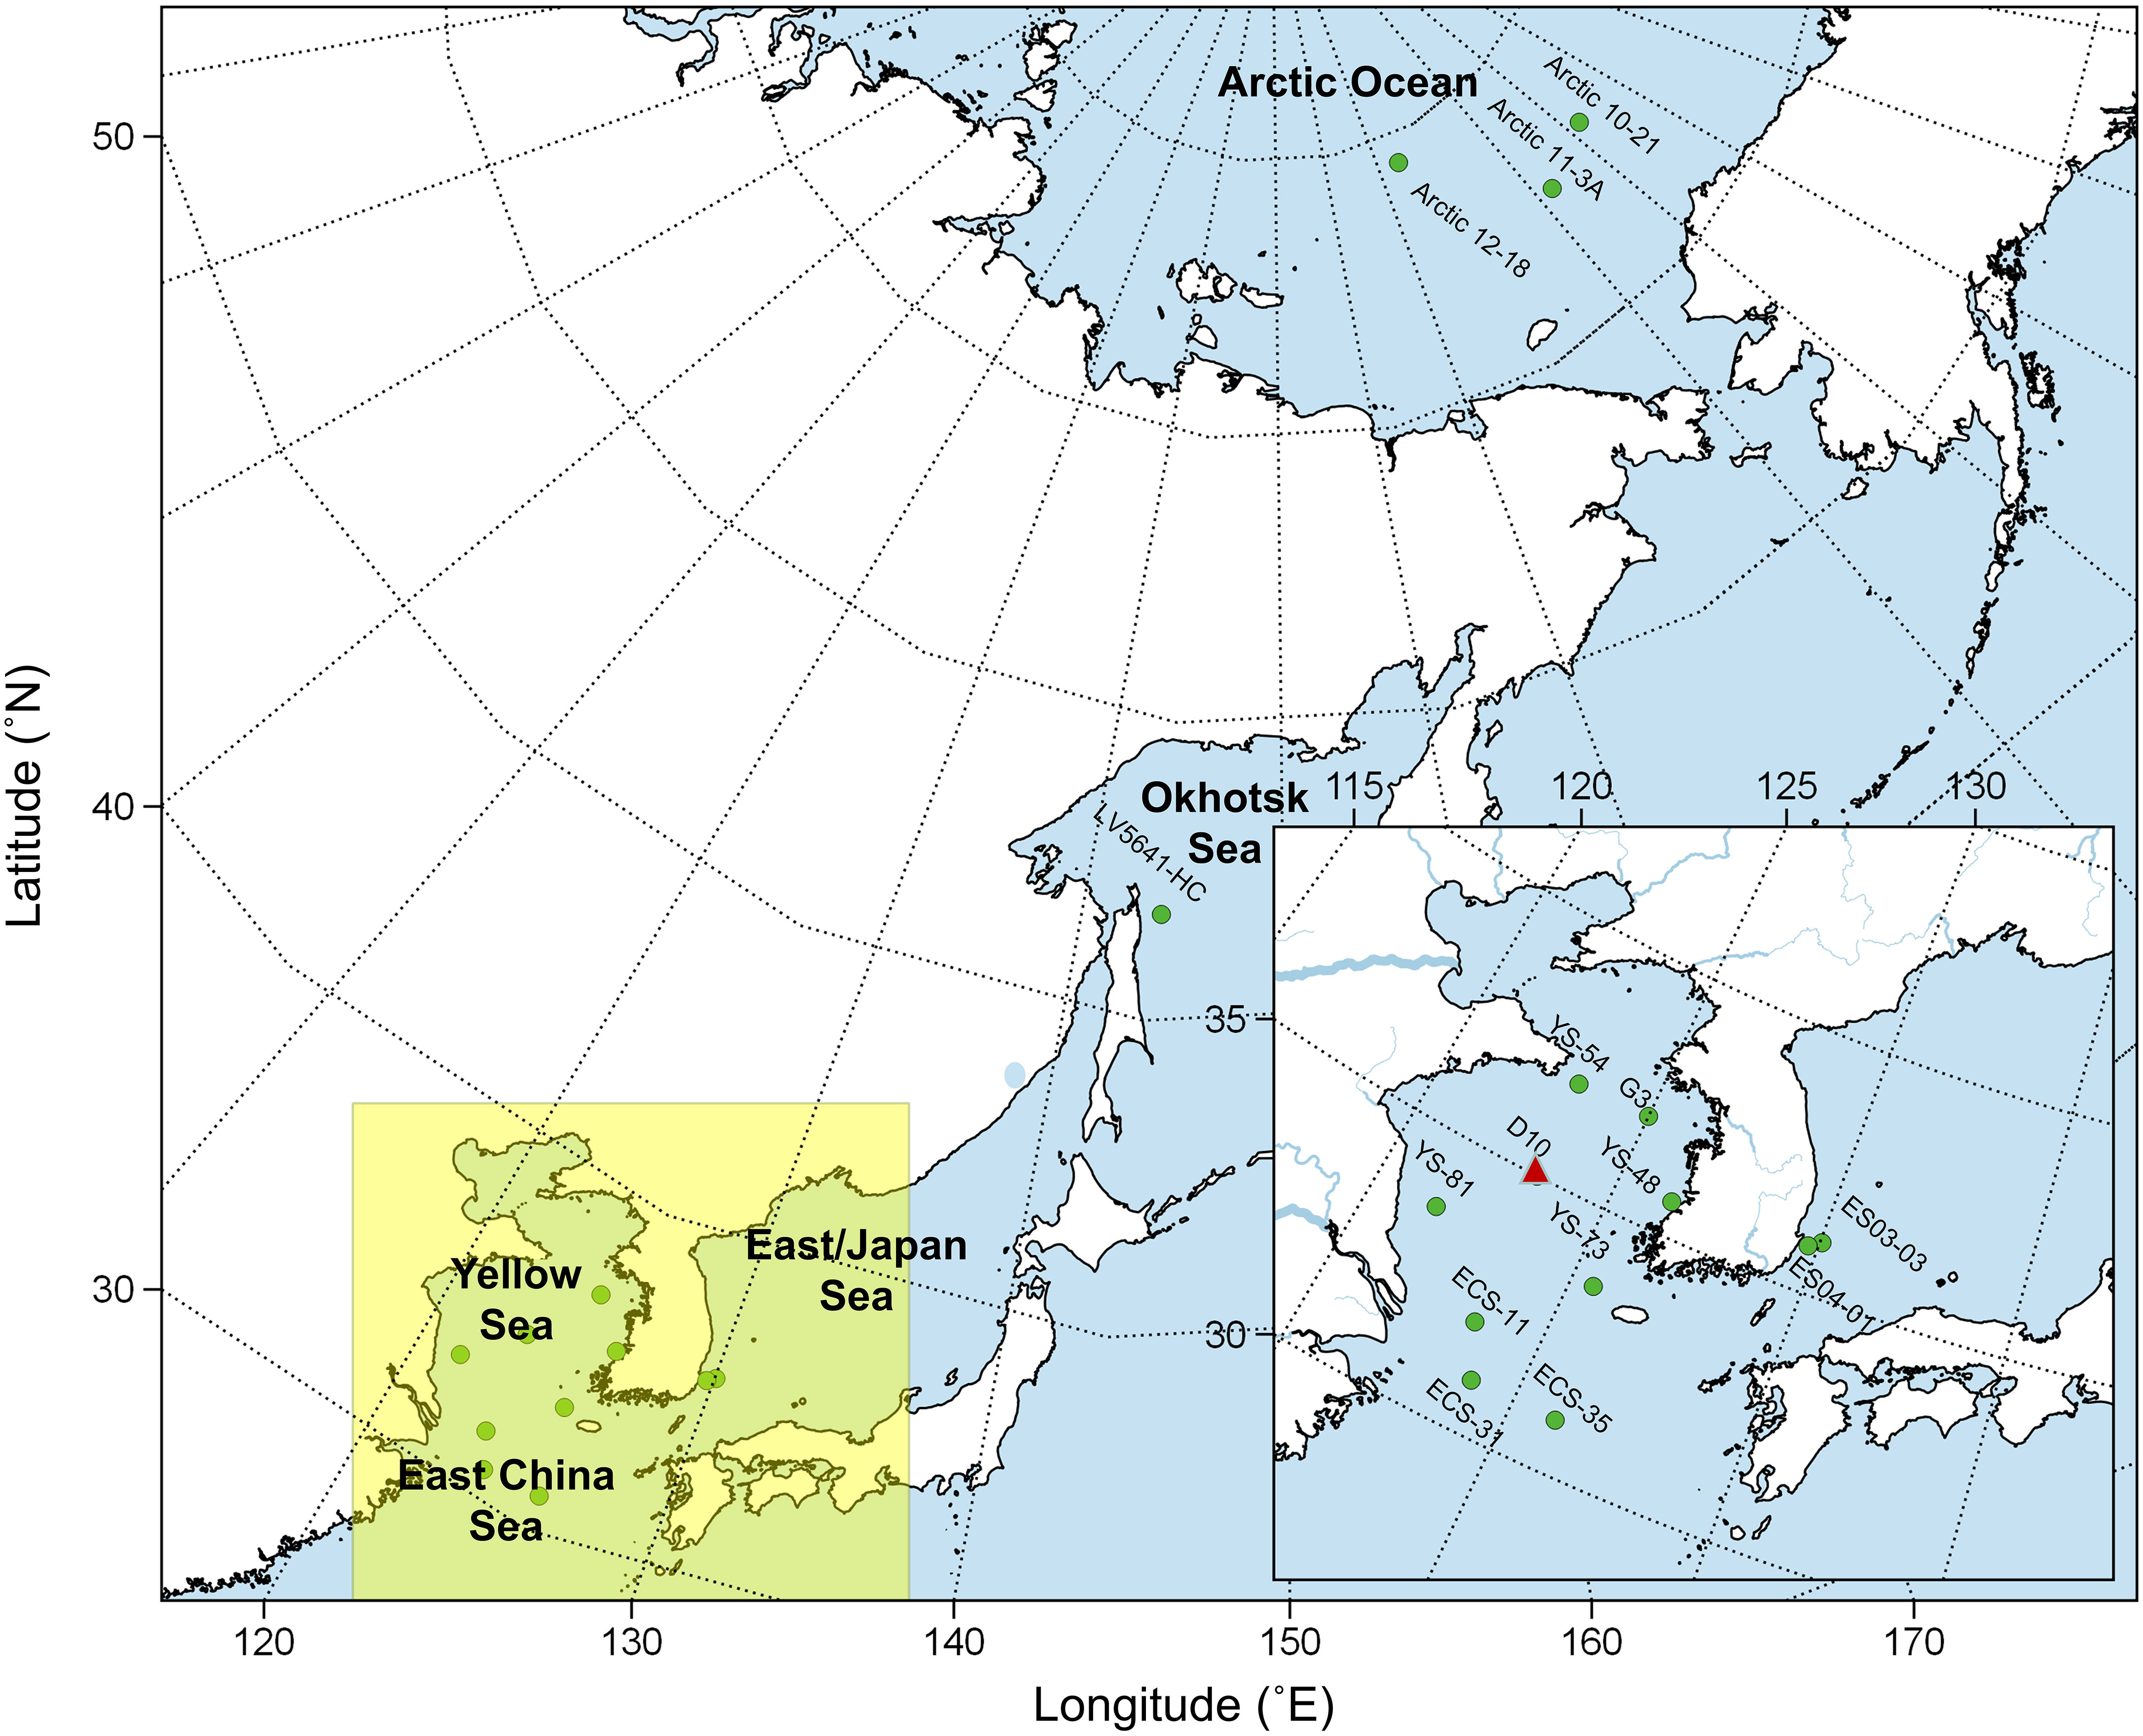
Figure 1 Sampling sites of this study. The triangle symbol indicates a core sample collected in the Yellow Sea.
Materials and methods
Sample collection
Figure 1 depicts the sampling sites of this study. Surface sediments in oceanic regions were obtained from the Yellow Sea (n = 4), East China Sea (n = 4), East Sea (Japan Sea) (n = 2), Okhotsk Sea (n = 1), and the Pacific Arctic Ocean (n = 3) in the previous study (Kim et al., 2017). Core D10 was extracted by a box corer in the middle of the Central Yellow Sea (35.00°N,.123.25°E). We used freeze-dried and grounded sediments for further experiments. The detailed sampling protocol and measurement of total organic carbon (TOC), total nitrogen (TN), bulk δ13C, and δ15N of core and surface sediments were described in previous studies (Kim et al., 2017; Kim et al., 2018; Kim et al., 2019).
Amino acid extraction and derivatization
For quantification and δ15N analysis of individual AAs, samples were prepared following a protocol described by Chikaraishi et al. (2007). Briefly, homogenized sediments (0.5–1.5 g dry weight) were hydrolyzed in 6 M HCl at 110°C for 24 h. L-2-aminobutyric acid (α-aminobutyric acid, Sigma-Aldrich) dissolved in 0.1 M HCl was added as an internal standard. Sediment particles and hydrophobic contents were removed by 3:2 n-hexane/dichloromethane (v/v). After the samples were verified to be dry, a purification step developed by Takano et al. (2010) was conducted to remove inorganic impurities. Samples were loaded in a pre-washed and conditioned cation-exchange column (AG-50X W8, 200–400 μm mesh size, Bio-Rad) and eluted with a 10% ammonia solution. After drying, purified AAs fractions were derivatized with 1:4 thionyl chloride/2-propanol (v/v) and 1:4 pivaloyl chloride/dichloromethane (v/v) in order. Derivatives of the AAs were extracted with 3:2 n-hexane/dichloromethane (v/v) for the final fraction.
Amino acid concentration and nitrogen isotope analysis
Amino acids were identified from the mass spectra and retention times of standard of AA derivatives (alanine, glycine, valine, leucine, isoleucine, proline, aspartic acid, threonine, serine, methionine, glutamic acid, and phenylalanine) by GC/MS (Shimadzu GC 2010, Japan). Concentrations of AA were measured by GC/FID (Shimadzu GC 2010, Japan). An HP-Ultra 2 column (25 m in length with an inner diameter of 0.32 m and a film thickness of 0.52 μm) was used for both GC/MS and GC/FID. The nitrogen isotope composition of each amino acid was analyzed by gas chromatography/combustion/isotope ratio mass spectrometry (GC/C/IRMS) using an isotope ratio mass spectrometer (Isoprime, Elementar, Germany) combined with gas chromatography (HP 6890N, Agilent, US) and combustion furnaces (GC5 interface, Elementar, Germany). An HP-Ultra 2 column (50 m in length with an inner diameter of 0.32 m and a film thickness of 0.52 μm) was used. A derivative of a standard mixture of individual amino acids (alanine, glycine, leucine, aspartic acid, methionine, glutamic acid, and phenylalanine) was used to calibrate measured δ15NAA values of the samples and to check the reproducibility of GC/C/IRMS. Due to the poor isotopic reproducibility associated with the co-elution of peaks on GC/C/IRMS chromatograms, the δ15N values of valine, β-alanine, leucine, isoleucine, aspartic acid, and threonine were not determined. Therefore, we report on six AAs in this study: alanine (Ala), glycine (Gly), proline (Pro), serine (Ser), glutamic acid (Glu), and phenylalanine (Phe). Those six AAs were classified into trophic AAs (Ala, Pro, and Glu), source AAs (Phe), and two other AAs (Gly, Ser) based on Ohkouchi et al. (2017). During each five-sample run, a derivative of a standard mixture of individual AAs (Ala, Gly, leucine, aspartic acid, methionine, Glu, and Phe) purchased by SHOKO-Science (Japan) and Indiana University (US) was used to calibrate measured δ15NAA values of samples and to check the reproducibility of GC/C/IRMS. The δ15N values of the AA standards were within ±1‰ in all calibration procedures. The δ15NAA values of sediments were determined through duplicate injection. The robustness of these analytical methods has been reported by an inter-laboratory test and cross-validated with several different reports described in (Ohkouchi et al., 2017; Ishikawa et al., 2022) and references therein.
Data processing
The degradation index (DI) (Dauwe and Middelburg, 1998; Dauwe et al., 1999) was estimated using the molar abundance of AAs:
Where vari is the mol % of AAi in our dataset. AVGi, STDi, and factor coefficienti are reference data for the respective average, standard deviation, and the first axis of factor coefficient of AAi from Dauwe et al. (1999).
The ∑V (McCarthy et al., 2007) was estimated by trophic AAs within our dataset.
Where δ15NTrophic AA is the average nitrogen isotope ratio of the three trophic AAs (Ala, Pro, and Glu), and n is the number of trophic AAs used for ∑V estimation.
Trophic position (TP) was estimated by δ15N values of Phe and Glu, using the following equations (Chikaraishi et al., 2009):
Where β is the difference between δ15NGlu and δ15NPhe in primary producers. The trophic discrimination factor (TDF) represents δ15N elevation through the trophic transfer of Glu from Phe. In this study, 3.4‰ was used as β values, and 7.6‰ was used as the TDF value for TP (Chikaraishi et al., 2009). The propagation of error in TP was estimated by the equation suggested by (Ohkouchi et al., 2017).
Results
TOC, TN, and THAA contents
The TOC and TN content of the D10 core samples ranged from 1.09% and 0.15% at the surface (0~1 cm) to 0.74% and 0.09% at the bottom (30 cm below seafloor), respectively (Figure 2A, B, and Table S1). The C/N ratio gradually increased from the surface (7.3) to 30 cm below the seafloor (8.0) (Figure 2C and Table S1). However, AA concentrations rapidly decreased by more than a 70% loss of total hydrolyzable amino acids (THAA) from the surface to 2 cm below the seafloor (Figure 2D and Table S3). Phenylalanine was the most degraded AA at 2 cm below the seafloor compared with surface values in both concentration (from 0.98 to 0.06 μmol/g) and mole percent (5.2 to 1.4%) (Figure 2E and Table S3). The concentration of Gly decreased minimally from the surface (2.27 μmol/g) to 2 cm below the seafloor (1.43 μmol/g). The mole percent of Gly in the sediment at 2 cm below the seafloor (32.7%) was more than double that of surface sediment (12.1%) (Figure 2E and Table S3). THAA-N/TN was decreased profoundly from the surface (17.6%) to 2 cm below the seafloor (5.1%) (Figure 2D). The surface sediment samples collected at five locations showed various TOC (0.19 to 2.75%), TN contents (0.03 to 0.33%), C/N ratio (6.17 to 11.10) and THAA concentration (0.4 to 11.3 μmol/g) (Figure 3 and Table S2). THAA-N/TN values ranged from 1.5% to 15.9% and showed large values in the East China Sea (ECS-31, 15.9%) (Figure 3D).
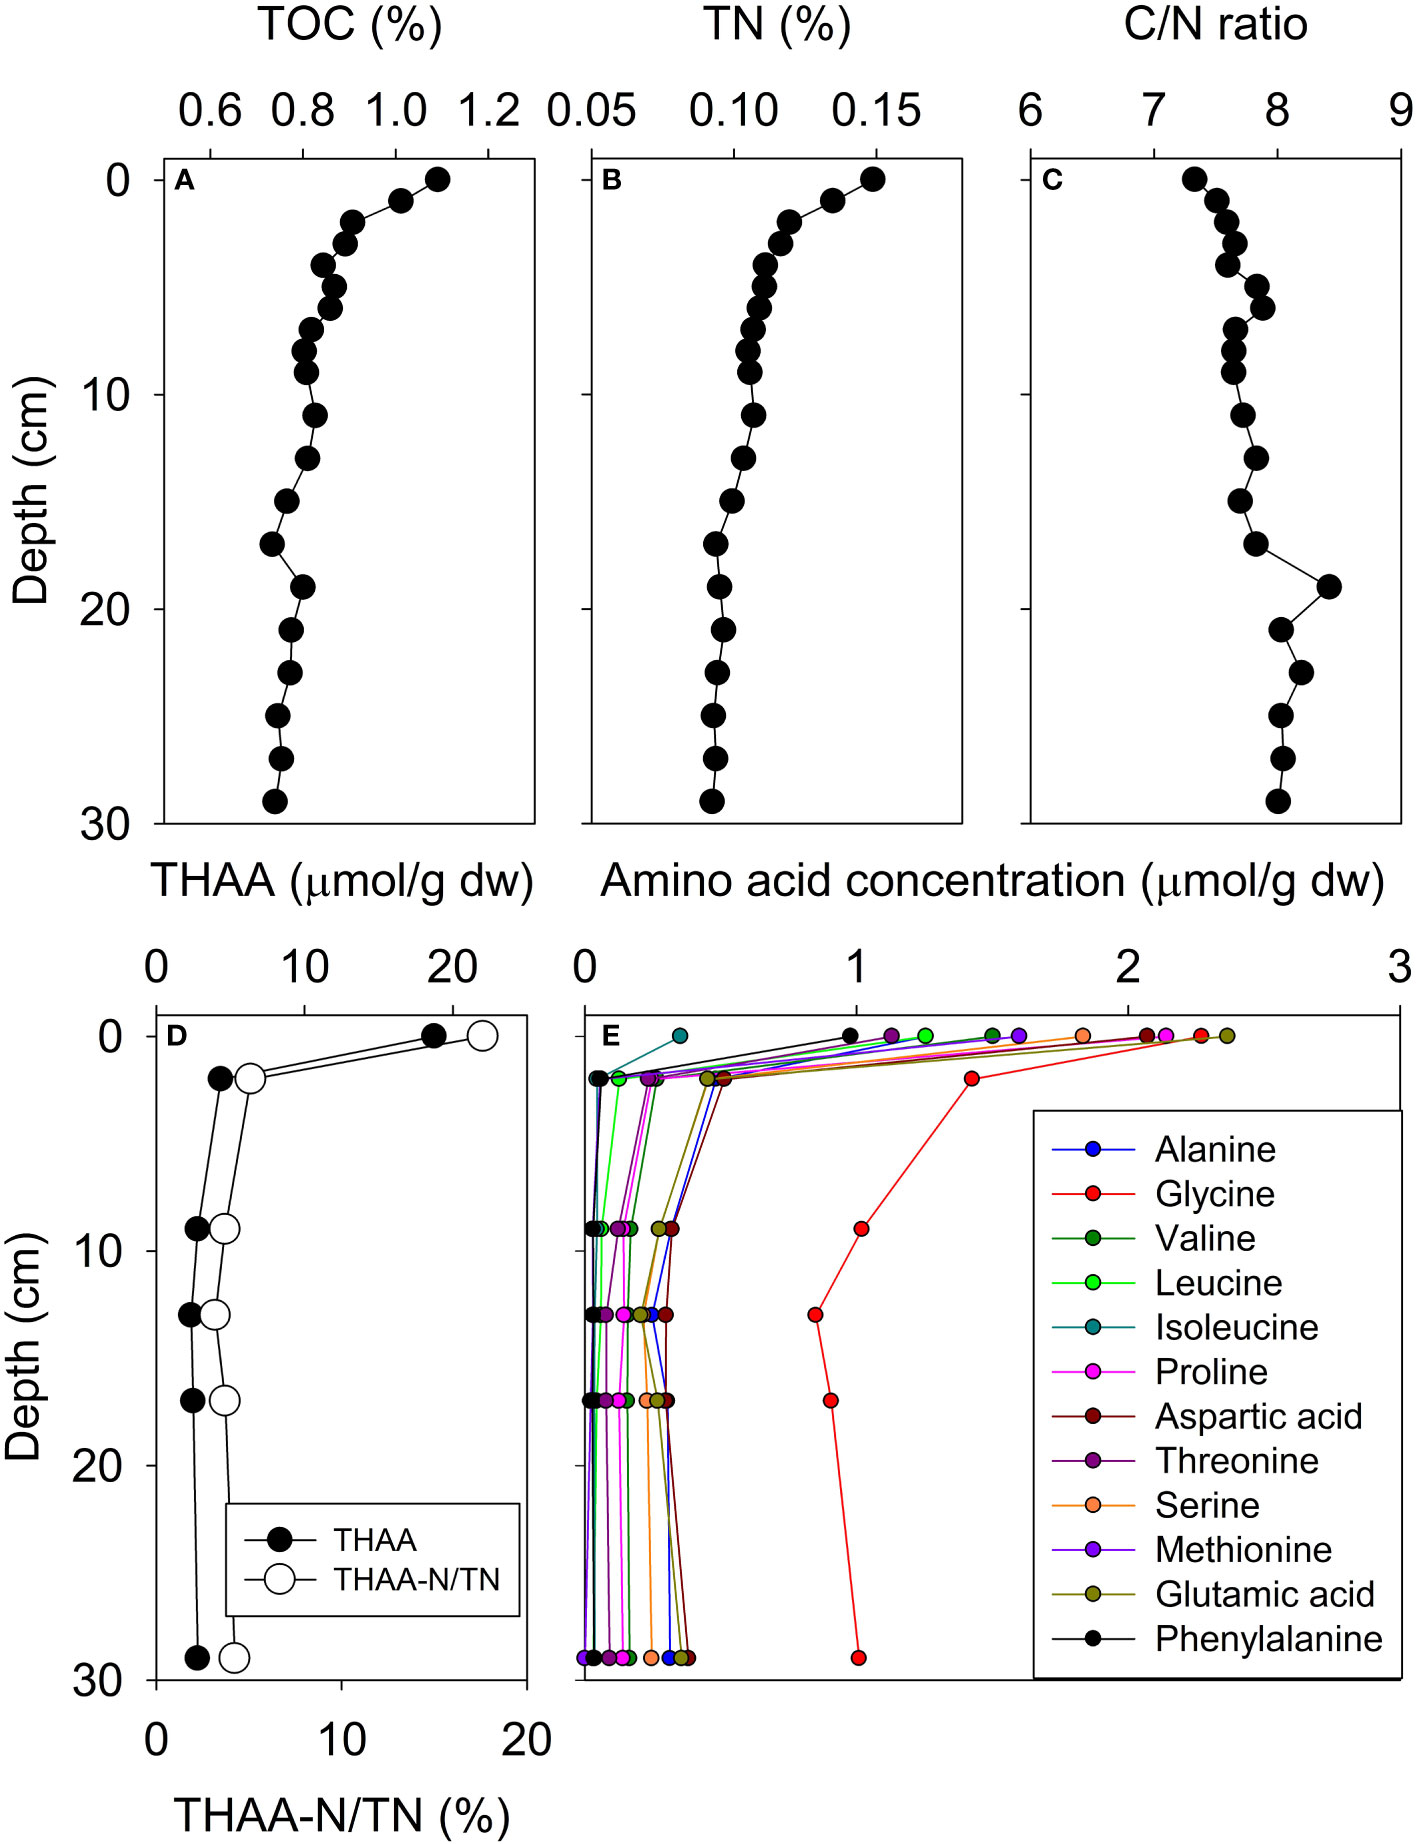
Figure 2 Vertical profile of core D10. TOC (A), TN contents (B), C/N ratio (C), THAA concentration and THAA-N/TN percent (D), and individual AA concentrations (E).
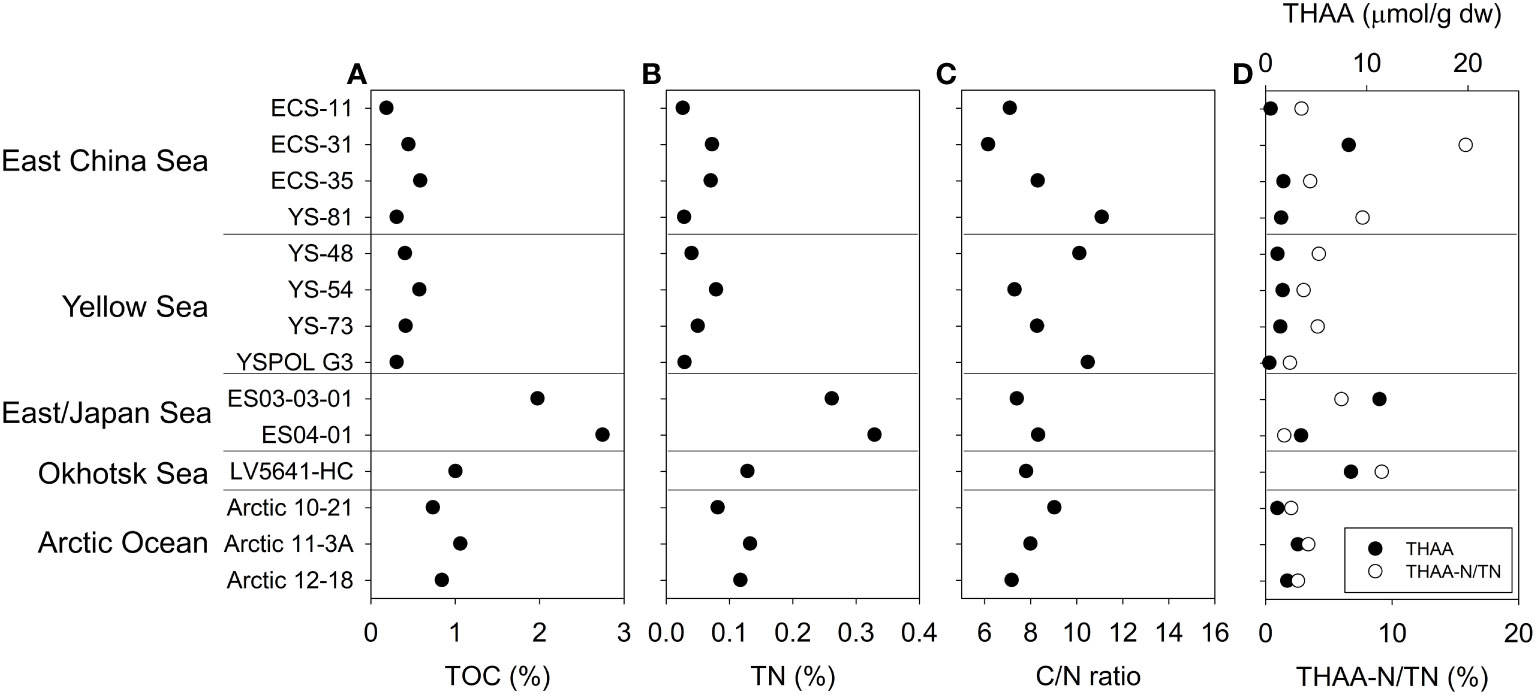
Figure 3 TOC (A), TN (B), C/N ratio (C), THAA concentration and THAA-N/TN percent (D) of surface sediments.
Amino acid nitrogen isotope ratios
Both δ13CBulk and δ15NBulk values of core D10 averaged -24.2 ± 0.4‰ and 5.6 ± 0.2‰ respectively, showing close to analytical error (0.3‰) reported in a previous study (Kim et al., 2017) (Figures 4A, B, and Table S1). From the surface to 2 cm below the seafloor, the δ15NBulk values did not show any significant increase from 5.7 to 5.8‰. In contrast, the δ15N values of all AAs increased on average 2.2‰ at 2 cm below the seafloor compared with surface sediment. Relative compositions of trophic AAs between the surface and depths below 2 cm of sediment in core D10 displayed diverse patterns. For example, the mole percent of Ala increased from the surface (6.7%) to sediments at 2 cm below the seafloor (10.5–12.2%) in core D10 (Figure 4C and Table S3). In contrast, the mole percent of Pro decreased at 2 cm below the seafloor (5.0–6.1%) compared with the surface (11.4%) (Figure 4C and Table S3). Interestingly, the mole percent of Glu exhibited a relatively small range from 8.8 to 12.6% compared to Ala and Pro in core D10 (Figure 4C and Table S3). A vertical change of trophic AA abundance would be closely related to an isotopic pattern in the downward core. For three trophic AAs, the δ15NAla, δ15NPro, and δ15NGlu values in core D10 followed a gradual increase along core depth (from 10.4 to 14.7‰, 7.8 to 12.3‰, and 9.9 to 11.5‰, respectively). While δ15NPhe increased from 3.4‰ at the surface to 6.1‰ at 2 cm below the seafloor, δ15NPhe values from 2 cm to 30 cm did not increase (Figure 4D and Table S5). Gly had the greatest δ15N increase (7.0‰) from surface to bottom (30 cm) (Figure 4D and Table S5).
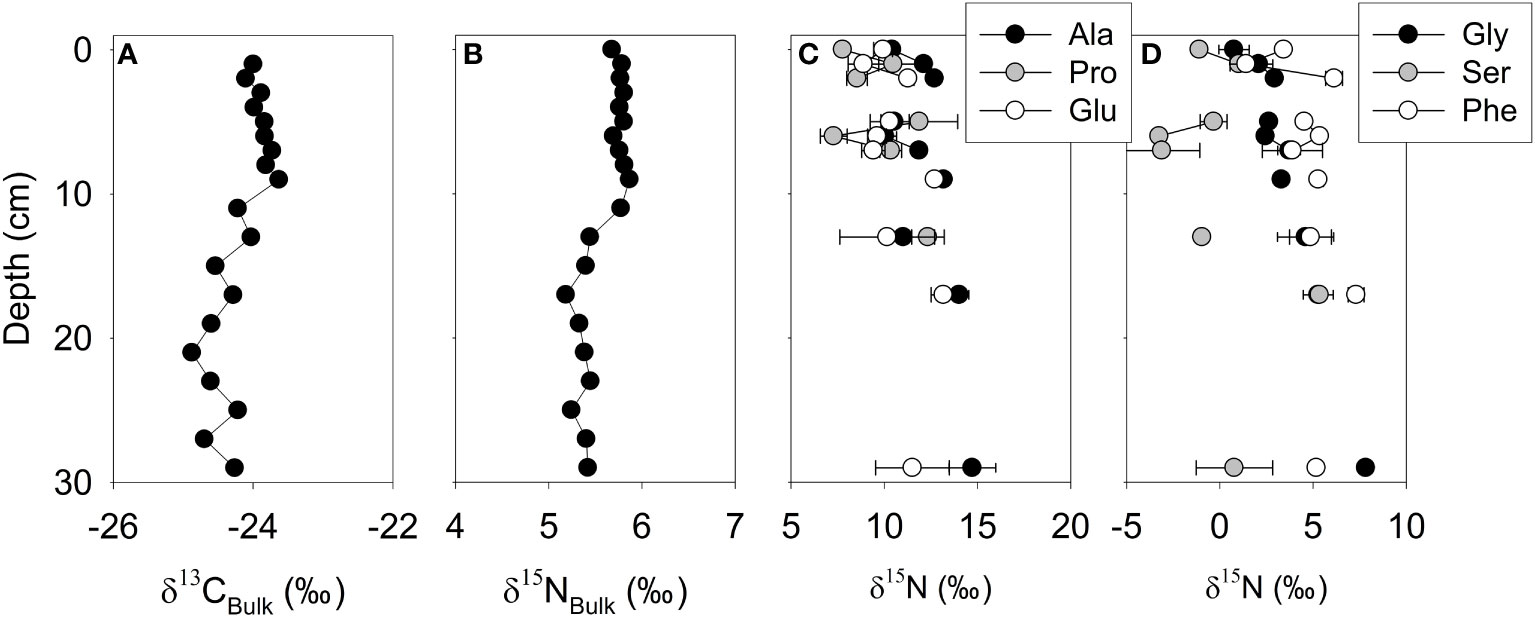
Figure 4 δ13CBulk(A), δ15NBulk(B), trophic (C), source and other AA δ15NAA profiles (D) of core D10. Error bars indicate the standard deviation of the duplicate measurement.
The δ13CBulk values ranged from -22.6 to -19.4‰ among surface sediments (Figure 5A; Table S2). The highest δ15NBulk value was found in the Arctic Ocean (8.9‰), and the lowest δ15NBulk value was observed in the East China Sea (3.9‰) (Figure 5B and Table S2). The δ15NAA values of surface sediments exhibited a wider range than those of δ15NBulk (3.9 to 8.9‰) (Figure 6A). Ala showed the widest δ15N values, ranging spatially from 8.6 to 23.3‰. The δ15N values of Pro and Glu ranged from 6.3 to 17.2‰ and from 7.5 to 17.4‰, respectively (Figure 5C and Table S6). Gly, Ser, and Phe demonstrated a wider δ15N range compared to bulk sediment (Figure 5D and Table S6). Gly (1.7 to 11.5‰) displayed the widest δ15N range within those three AAs. The δ15N values of Ser and Phe ranged from −2.9 to 10.9‰ and 2.3 to 13.8‰, respectively.
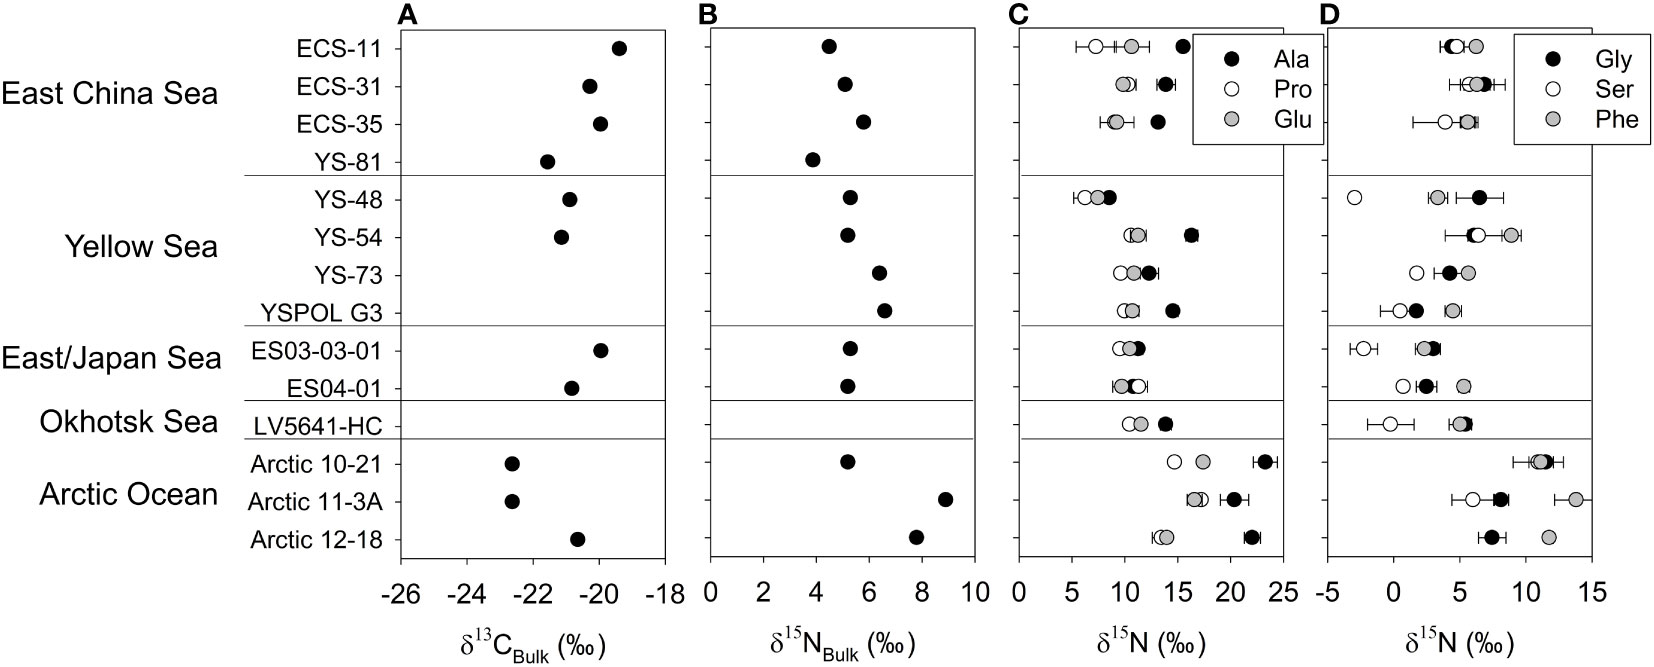
Figure 5 δ13CBulk(A), δ15NBulk(B), trophic, (C) source and other AA δ15NAA profiles (D) of surface sediments in study sites. Error bars indicate the standard deviation of the duplicate measurement.
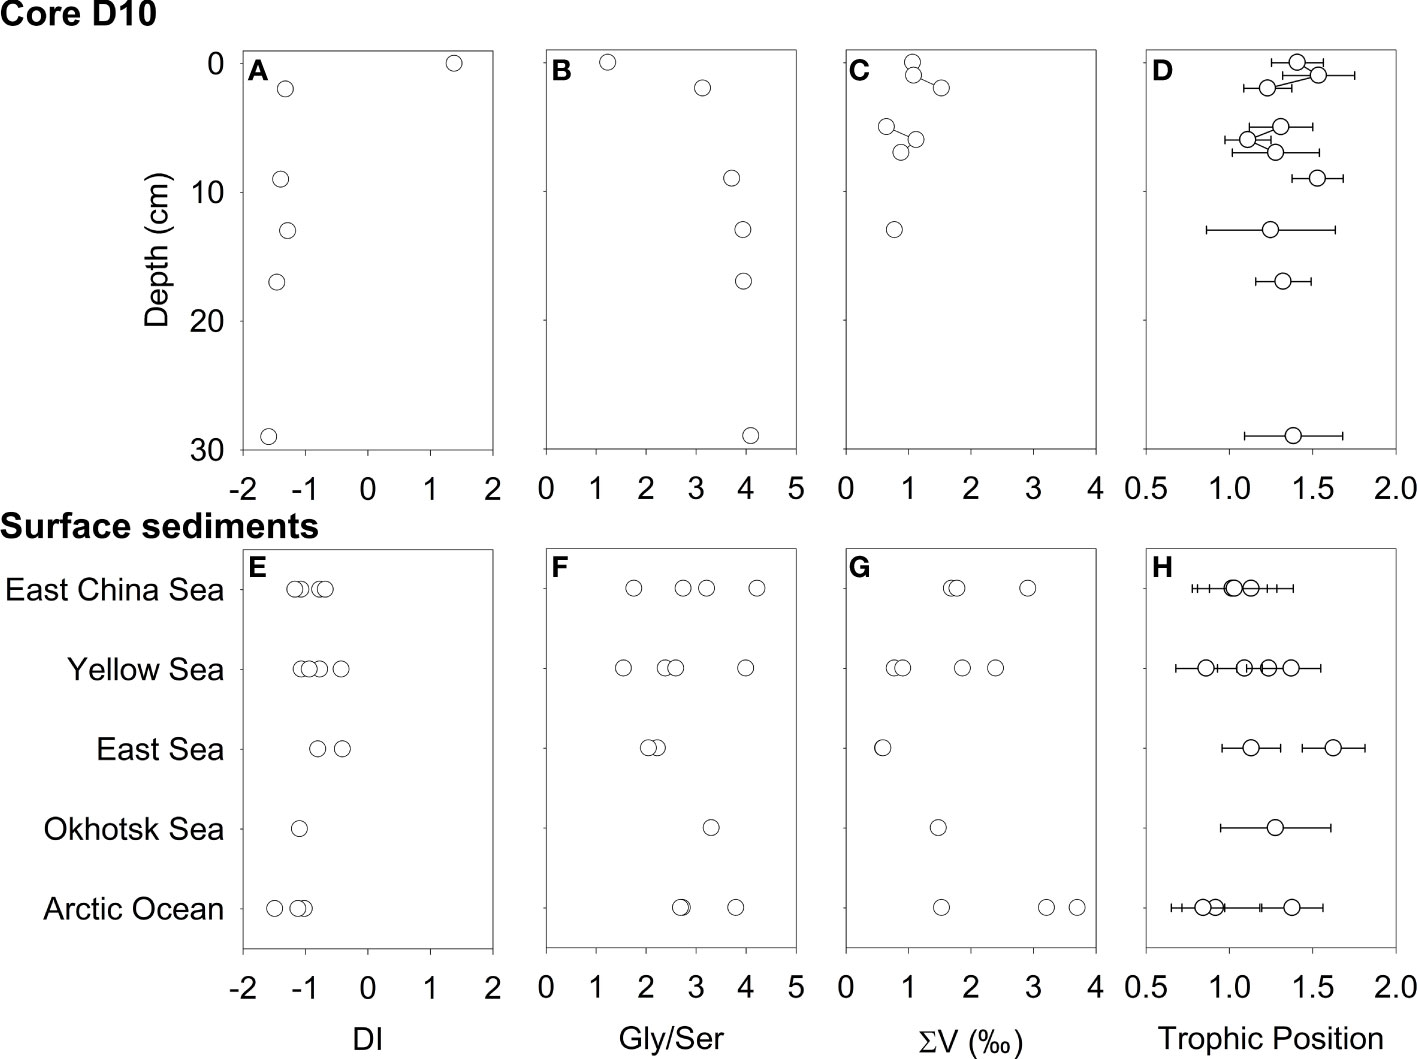
Figure 6 Degradation index (A, E), Gly/Ser ratio (B, F), ∑V (C, G), and trophic position (D, H) of core D10 and surface sediment.
Diagenetic indicators and trophic position
The DI values were relatively constant after large decreases from the surface (1.4) to 2 cm below the seafloor (−1.3) of the core D10 (Figure 6A and Table S3). In contrast, a ratio of Gly and Ser showed large increases from the surface (1.2) to 2 cm below the seafloor (4.1) of the core (Figure 6B). A vertical trend in ∑V values was not found along the core depth, from 1.1 to 1.5 (Figure 6C and Table S5). The trophic position estimated by glutamic acid and phenylalanine (TP) ranged from 0.9 to 1.5, with an unclear vertical trend (Figure 6D and Table S5).
For surface sediments, the DI values were negative and ranged from −1.49 to −0.40 (Figure 6E and Table S4), with similar distribution to those reported previously (Ingalls et al., 2003; Pantoja and Lee, 2003; Lomstein et al., 2006; Vandewiele et al., 2009). Gly/Ser ratios ranged from 1.6 to 4.2 among surface sediments (Figure 6F). ∑V values ranged from 0.6 to 3.7 (Figure 6G and Table S6). The East/Japan Sea samples had the lowest ∑V value (0.6), and the Arctic Ocean had the highest ∑V value (3.7). The TP values were all within a relatively narrow range (0.8–1.4) (Figure 6H and Table S6).
Discussion
Elemental compositions in surface sediments
We used sediment samples that showed diverse organic matter contents and nitrogen isotope ratios in spatially various locations (Kim et al., 2017), to understand δ15N variations of amino acids through microbial diagenesis in comparison to δ15NBulk values. High TOC contents were found in the East/Japan Sea (2.37 ± 0.54%), Okhotsk Sea (1.01%), and Pacific Arctic Ocean (0.88 ± 0.17%), suggesting the high production in the pelagic layer of those sampling sites (Sorokin and Sorokin, 1999; Harada, 2016; Jang et al., 2021). Relatively high THAA-N/TN (17.6%) and low C/N ratio (7.33) were found in the surface of core D10, located in the Central Yellow Sea, compared to THAA-N/TN (3.6 ± 1.1%) and C/N ratio (9.06 ± 1.51%) at other sampling sites in the Yellow Sea. Other locations (East China Sea, East/Japan Sea, Okhotsk Sea, and Pacific Arctic Ocean) also showed low THAA-N/TN (<10%) with a few exceptions. Such variations in the THAA-N/TN and C/N ratio are likely due to spatial differences in sedimentary environments (Pantoja and Lee, 2003; Vandewiele et al., 2009). Wei et al. (2021) reported high TOC contents and AA concentrations in the mud patches in the Central Yellow Sea. TOC contents in surface sediment were more than 1.0% in the Central Yellow Sea, compared to the average of the Yellow Sea and East China Sea (0.6 ± 0.4%) (Kim et al., 2018). Such differences in starting points of the amounts (THAA-N) and composition (C/N ratio) of organic matter in surface sediment need to be further evaluated using diagenetic indicators.
Amino acid composition and bioavailability in sediments
A previous study suggested the eutrophication of the Yellow Sea began at least in 1855 due to high amounts of nutrient input, as defined by photosynthetic pigment composition (Zhu et al., 2014). Considering the deposition rate of 0.15 cm yr-1 in the central Yellow Sea reported by Zhu et al. (2014), the core D10 (30 cm) can include the timing of eutrophication started in 1855. Since 1990, an increase in atmospheric nitrogen deposition has enriched excessive nitrogen in the Yellow Sea (Zheng and Zhai, 2021). However, the downcore consistency of δ15NBulk values at the entire depths in core D10 would suggest that a temporal variation of primary production and its nitrogen sources could be stable.
We found a considerable loss of AA contents within 2 cm below the seafloor compared to those in TN contents (Figure 2). A decrease in THAA-N contribution in the TN pool of core samples has been frequently reported, indicating the mineralization of organic nitrogen by microbial activity (Pantoja and Lee, 2003; Lomstein et al., 2006; Carstens and Schubert, 2012). Cowie and Hedges (1992) suggested that a value below 38% for THAA-N/TN indicates organic matter degraded by microbes. The sharply decreased THAA-N/TN values of the D10 core — from 17.6% at the surface to below 10% at depth — therefore indicate an increase of microbial degradation with depth. THAA-N/TN values in surface sediment varied within the Yellow Sea.
A negative DI value is generally found in highly degraded sediment, and fresh organic matter usually has a positive value. The Gly/Ser ratios were typically greater than 2.0 in surface sediments in the Yellow Sea (Wei et al., 2021) and Aarhus Bay (Denmark) (Langerhuus et al., 2012). The Gly/Ser ratio for core sediments increased up to 4.0 along the core depth (Niggemann et al., 2018; Stücheli et al., 2021). Surface sediments in this study showed mostly negative DI values and high Gly/Ser ratios (>2.0), suggesting apparent organic matter degradation and alteration in the seawater-seafloor interface. AA compositions in surface sediments could be close to the bacterial organic matter in most sampling sites. The exceptional values of DI value (1.4) and Gly/Ser ratio (1.2) at the surface in the D10 core, therefore, indicate relatively fresh organic matter in the sediment, considering its high TOC and TN contents in the sampling site. The DI value in the D10 core also showed a decreasing pattern from the surface to the bottom (30 cm), supporting enhanced microbial degradation in deeper sediment. Despite a decreasing DI value, the THAA-N/TN values below 2 cm in core D10 varied negligibly with depth (Figure 2E). The DI values and THAA-N/TN contents were weakly correlated (R2 = 0.382, p=0.004, Figure 7A) because of the various controlling factor, such as the magnitude of pelagic production and the spatial variation in export flux to the seafloor. This suggests the nitrogen contents in THAA could not fully indicate the freshness of organic matter in sampling sites. As expected, the DI and Gly/Ser values showed a significant correlation (R2 = 0.542, p=0.000, Figure 7B). Especially Gly is one of the most important AA to evaluate microbial degradation, showing a significant correlation between its mole percent and DI values (R2 = 0.594, p=0.000, Figure 7C).
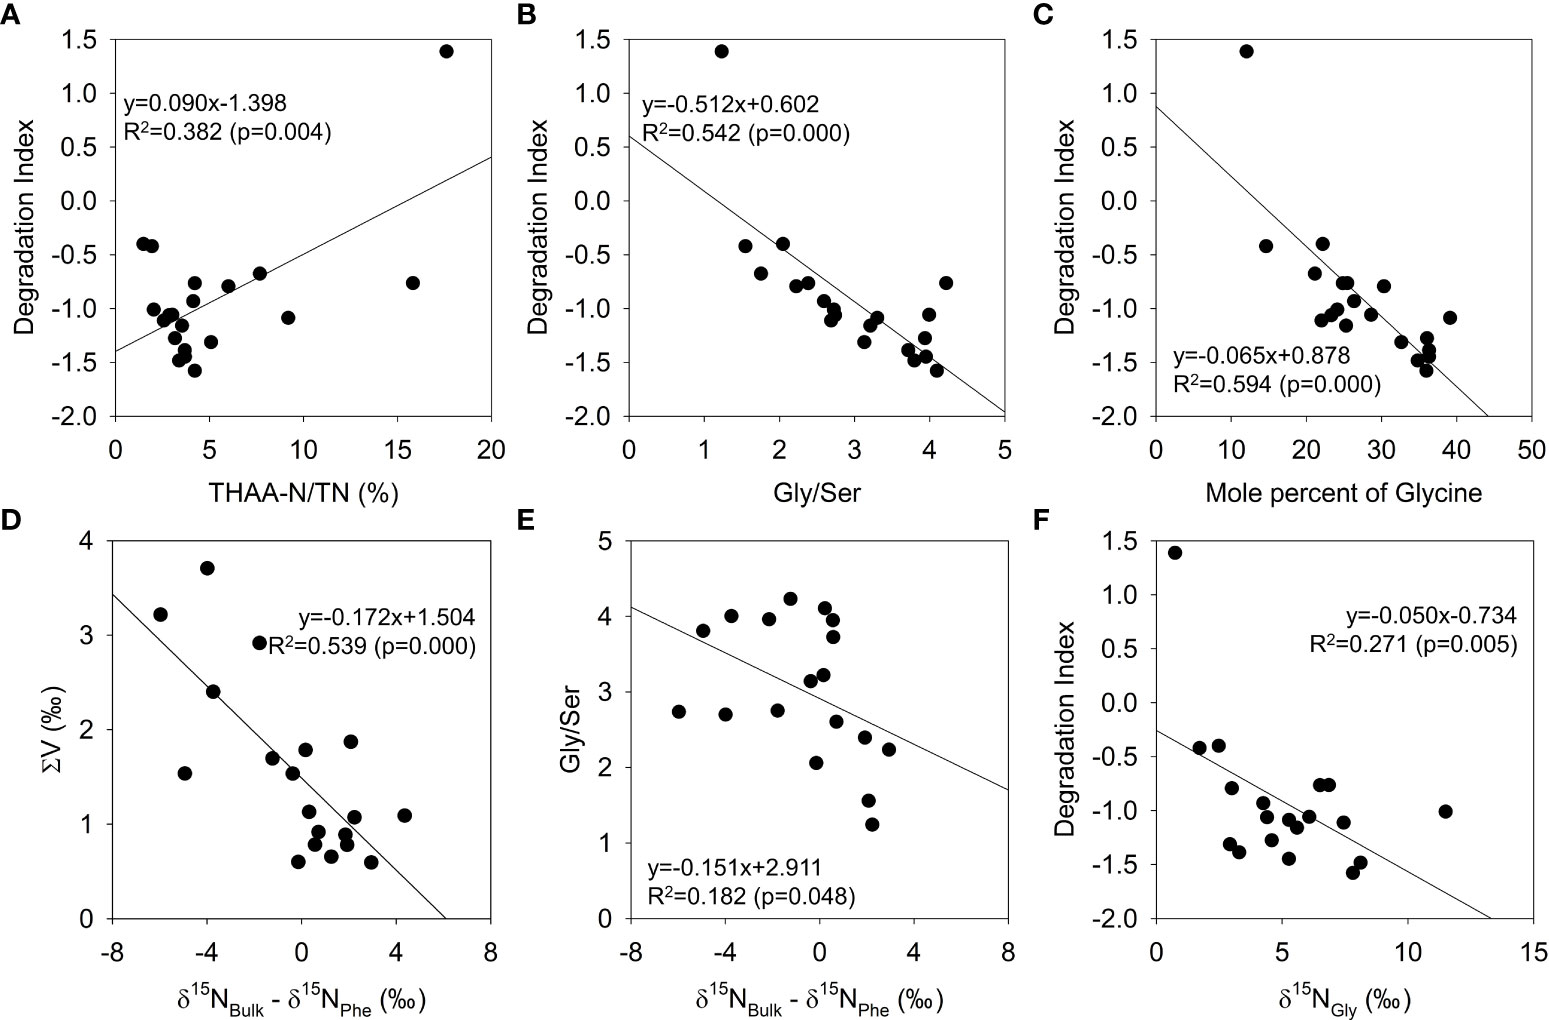
Figure 7 Regressions among diagenetic indicators estimated from core and surface sediment. THAA-N/TN versus DI (A), Gly/Ser versus DI (B), mole percent of Gly versus DI (C), δ15NBulk - δ15NPhe versus ΣV (D), δ15NBulk - δ15NPhe versus Gly/Ser (E), and δ15NGly versus DI (F).
The AA availability by microbes can differ by sediment depth. McMahon and McCarthy (2016) suggested three types of AA fluxes in microbes: de novo synthesis of AAs from inorganic substrates, salvage incorporation (uptake of free AAs directly into a cell), and trophic resynthesis. The δ15N fractionation of de novo synthesis appears to be species-specific, but that of salvage incorporation showed animal-like trophic elevation (Yamaguchi et al., 2017). As a result, δ15N patterns of AAs in sediment vary with the relative magnitude of the type of microbial activity and the δ15N baseline of organic and inorganic substrates. Moreover, most AAs can be used as carbon and nitrogen sources by microbes for AA resynthesis, resulting in elevated δ15N of residual AAs. The process of AA degradation would not be selective, as suggested in the previous study (McCarthy et al., 2007) because concentrations of all AAs were largely decreased within the upper 2 cm of the surface sediment in core D10 (Figure 2E). Thus, microbial use of AAs in surface sediment may be mostly focused on carbon and nitrogen source. But for subsurface sediments, we expected that δ15N patterns of individual AAs could be dependent on the type of AAs and their metabolic pathway, as stated in the following subchapters.
Trophic amino acids for microbial use
Three trophic AAs (Ala, Pro, and Glu) used in this study exhibited an elevated δ15N values and can be utilized to inform microbial degradation and resynthesis with an elevated δ15N. Ala can be synthesized by pyruvate, but it can also be created from Glu via transamination (Yamaguchi et al., 2017). Glu is generally formed through the addition of ammonium to α-ketoglutaric acid, which is synthesized from the tricarboxylic acid (TCA) cycle, and Pro is synthesized from glutamate through a specific transamination pathway via the formation of L-Glu-5-semialdehyde and L-1-Pyrroline-5-carboxylate (Yamaguchi et al., 2017). But in subsurface sediments, most of the bacterial activity could occur under anoxic conditions. The processes within the TCA cycle are mostly paused, especially for the transformation pathway from α-ketoglutaric acid to glutamate and glutamine (Chinopoulos, 2013). Such conditions would inhibit the new synthesis of Glu by microbes in anoxic sediment. D-Ala and D-Glu can also be synthesized by bacteria to build bacterial cell walls (peptidoglycan) (Schleifer and Kandler, 1972). Ala and Glu can therefore accumulate in sedimentary bacteria through bacterial activity. It is likely these metabolic pathways of trophic AAs are responsible for the relatively high δ15N values in deeper sediment compared with surface samples in the D10 core (Figure 4B).
The ΣV value, which can be estimated based on the δ15N variation of trophic AAs, is a useful application of CSIA-AA to evaluate the magnitude of microbial resynthesis in organic matter (McCarthy et al., 2007). Previous studies reported that the ΣV values in algae and fresh organic matter (1.0–1.5‰) may be altered by microbial degradation (> 1.5‰) (McCarthy et al., 2007; Yamaguchi and McCarthy, 2018). In this study, the ΣV values were correlated with neither DI values (R2 = 0.056, p=0.769) nor Gly/Ser ratio (R2 = 0.021, p=0.914). Such low correspondence was because the ΣV values are fundamentally independent but complementary parameters with DI values and Gly/Ser ratio (McCarthy et al., 2007). The DI values and Gly/Ser ratio can track the enrichment of refractory materials (i.e., algal cell wall components). In contrast, ΣV values are focused on microbial resynthesis of AAs in organic matters. The ΣV values in surface sediments also differed within the same region, indicating various magnitudes of AA resynthesis (Figure 6G). This indicates the magnitude of δ15N increase through microbial resynthesis likely varies, according to the amounts of bioavailable AAs relative to preserved AAs. The AAs bound in silicate and calcium carbonate biominerals can occupy 0.4 to 62.4% of the THAA pool in sediments in the Southern Ocean (Ingalls et al., 2003), suggesting planktonic compositions forming biominerals and their export flux need to be considered. Although the ΣV values in the D10 core showed inconsistent pattern along depths (Figure 6C), most organic materials would not be preserved in subsurface sediments (depths below 2 cm) in the D10 core considering downcore decrease in DI values (Figure 6) and increase in Gly/Ser ratio (Figure 6B).
A TP estimated with δ15NAA values in non-living organic matter can indicate the integrated signals of the structure of a planktonic ecosystem in well-preserved sediments (Batista et al., 2014). Compositions of organic matters derived from autotrophs and heterotrophs can be reflected in TP values, leading to wide ranges in sinking particles (1.0–2.9) and sediment (1.0–2.0) (McCarthy et al., 2007; Batista et al., 2014; Shen et al., 2021; Choi et al., 2022). Chemoautotrophic bacteria cultured in an ammonium substrate showed phytoplankton-like TP values (0.8–1.2) and ∑V values (0.6–1.4) in a previous report (Yamaguchi et al., 2017), suggesting that de novo synthesis of AAs in bacteria cells produces fresh organic matter. In contrast, chemoautotrophic bacteria using organic substrates (casamino acids) display animal-like TP values (1.9–2.5) and higher ∑V values (1.0–2.5) (Yamaguchi et al., 2017), indicating that both salvage incorporation and resynthesis of AA are major processes. In our data, the TP values ranged from 0.8 to 1.6 and were commonly found in sediment (Carstens et al., 2013; Batista et al., 2014), but the TP values did not show any significant trend with sediment depth (core D10) or geographic location (surface sediment). Because of microbial degradation and resynthesis, δ15NAA values in sediments could be shifted mostly from those in fresh organic matter. Therefore, the composition of biogenic organic matter exported from the pelagic layer cannot be evaluated precisely in this study.
Nitrogen isotope distribution of phenylalanine
Phenylalanine is used to identify the source of δ15N (alternatively known as a δ15N baseline) in given sedimentary environments because it is known to undergo minimal fractionation in δ15N elevation through trophic transfer (Chikaraishi et al., 2007). The δ15N baseline values for exported organic matter have been reported for deep-sea corals because the δ15NPhe values represent the integrated δ15N value of various nitrogen sources (Sherwood et al., 2014; Shen et al., 2021). Batista et al. (2014) suggested that sedimentary δ15NPhe values are also indicative of the primary producers in well-preserved sedimentary environments.
In an earlier study of similar geographic locations by Kim et al. (2017), the progressive increase in δ15NBulk values in surface sediment from the Northeast Asian marginal seas to the Arctic Ocean was likely the result of the decreasing influence of anthropogenic nitrate. These variations in the δ15NBulk indicate that the different organic sources are related to the spatial distribution in the δ15NPhe values, which are derived from the δ15N value of dissolved inorganic nitrogen baseline sources. Our δ15NPhe values for the surface sediments appeared to be correlated to δ15NBulk values (R2 = 0.478, p=0.025). The δ15NBulk - δ15NPhe values have been used in biota samples, showing a high correlation with the trophic position (Mompeán et al., 2016; Dolgova et al., 2018). An offset of the δ15NBulk and δ15NPhe values showed a negative regression with ∑V values (R2 = 0.539, p< 0.001, Figure 7D) and a weak correlation with Gly/Ser ratios (R2 = 0.182, p=0.048, Figure 7E), implying that an increase of the δ15NPhe values relative to δ15NBulk values and may be influenced by microbial resynthesis in seafloor sediment. If the δ15NBulk values of sediment solely reflect organic nitrogen sources, the δ15NBulk values should have been greater than the δ15NPhe values because of the coexistence of trophic AAs, which contain more dominant mole percent and larger δ15N values compared with source AAs. The rest of the nitrogen in sediment includes inorganic nitrogen or other organic nitrogen compounds that contain lower δ15N values. In this study, the δ15NPhe values of surface sediments in the Pacific Arctic Ocean were greater than 10‰, which were also greater than corresponding δ15NBulk values. A possible reason would be nitrate loss of Pacific water through northward flow from the Bering to Chukchi Sea shelf (Brown et al., 2015), leading to high δ15N values of organic nitrogen. Additionally, coupled partial nitrification-denitrification (CPND) could remove organic nitrogen and increase δ15N values in sediments up to 10‰ in the Bering Sea shelf (Granger et al., 2011). Those processes potentially remove AAs and increase δ15NPhe values of sediments in the Pacific Arctic Ocean. The δ15NBulk - δ15NPhe values were also negative in other sampling sites, but spatial variation was unclear. This result indicates that δ15NPhe values in most sediments would be influenced by the active microbial diagenesis and thus could not be a robust indicator for a nitrogen baseline under intensive microbial activity.
Phe is an essential AA, and its carbon and nitrogen isotope ratios do not change significantly during trophic transfer (Takizawa et al., 2020). An actual abundance of Phe as both an energy source and an essential AA would be highly limited in deeper sediments (<1% of the THAA pool). The high energetic cost of Phe synthesis could drive salvage incorporation, resulting in little fractionation between substrates and microbes, even though some microbes can synthesize phenylalanine with internal metabolism (Yamaguchi et al., 2017). Degradation of Phe as a nitrogen or carbon source for microbe should be suppressed in Phe-deficient conditions in deeper sediment. Phe would therefore be used as an energy source in surface sediment and as a cell component of microbes in deeper sediment, showing a weak downcore trend in deep sediments (below 2 cm from the surface) in core D10. The result suggests the microbial use of Phe should be different between near-surface (depths of 0~2 cm) and deeper sediments (depths deeper than 2 cm) in this study.
Glycine and serine as a diagenetic parameter
Glycine has distinct concentration and isotope profiles in the core D10. Although Gly concentrations below 2 cm from the surface were reduced compared to the surface, relative contributions showed increasing trends with depth (Figure 2E). Such a high contribution of Gly in the THAA pool within sediment organic matter has been reported frequently, suggesting a selective preservation of Gly in siliceous exoskeletons of diatom cells (Hecky et al., 1973; Pantoja and Lee, 2003) or the additional input of newly synthesized Gly from microbial activities. Bacterial peptidoglycan contains a Gly bridge as a common component (Schleifer and Kandler, 1972). The contribution of peptidoglycan-derived AA to THAA increases as microbial degradation proceeds (Lomstein et al., 2006). It is possible that transamination to Gly is the dominant process in microbial activity in deeper sediment. As a product of 15N enrichment by microbial activity, Gly is reportedly an indicator for microbial degradation of organic matter (Keil and Fogel, 2001; McCarthy et al., 2004; Calleja et al., 2013) because 15N enrichment of Gly would be possible during microbial alteration of sedimentary organic matter. During the degradation of Gly, 14N-Gly would be preferentially degraded by microbes as a nitrogen source, leaving enriched 15N in residual Gly. Through microbial degradation and resynthesis, most of the free Gly would be replaced by microbial-origin Gly, which increases the δ15N values, as seen in Gly/Ser ratio. Overall, both the relative abundance and the δ15NGly could be important diagenetic indicators. We found that the DI values showed significant regression with the mole percent of Gly (Figure 7C) but not a clear regression with δ15NGly values (Figure 7F). This is because the initial δ15NGly values in organic matter can be determined from a nitrogen isotope baseline before sedimentation. Therefore, the degree of δ15N increase of Gly from the nitrogen isotope baseline and Gly sources (preserved and microbially altered) needs to be elucidated in further research.
Serine also can be preserved in siliceous exoskeletons of diatom cells (Kröger et al., 1999; Ingalls et al., 2003) but it makes less of a contribution than Gly in peptidoglycans (Sugai et al., 1997). Compared with Gly, the relative contributions of Ser to THAA averaged less than 10% in our dataset. However, Ser and Gly are associated with multiple metabolisms, including Ser hydroxymethyl transferase and the one-carbon pathway (Yamaguchi et al., 2017; Kendall et al., 2019). Those pathways and various environmental conditions among sampling sites could result in a considerable variation in the δ15NGly and δ15NSer values. During mineralization and resynthesis, the common L-form Ser can be replaced by the D-form, increasing the D/L ratio with the depth of the core (Lomstein et al., 2006). These processes result in a relative increase in δ15NSer values from the surface to 16-18 cm. In core D10, the downcore increase in Gly/Ser ratio suggests that the sedimentary organic matter was mostly affected through diagenesis and partially assimilated into bacterial biomass in subsurface sediments, indicating the downcore increase in both δ15NGly and δ15NSer values.
Conclusion
The present study explored a variation in the δ15N values of AAs in sediment samples controlled by microbial degradation. Patterns in δ15N values coupled with conventional diagenetic indicators (DI value and Gly/Ser ratio) provided more details on microbial activity in seafloor sediments. AAs experienced a large magnitude of mineralization and 15N enrichment at the top 0–2 cm of core sediment. Both DI values and Gly/Ser ratio exhibited an increasing magnitude of microbial activity along the core depth. The mole percent and δ15N patterns differed by the types of AA in deeper (2 cm below the surface) core sediment. Three trophic AAs (Ala, Pro, and Glu) showed elevated δ15N along the core sediment depth. We also observed intensive Phe degradation by microbes in surface sediments, suggesting that using δ15NPhe values would be difficult for determining nitrogen baseline under active microbial degradation. Thus, the degree of degradation and corresponding δ15N increase needs to be elucidated in the future in reconstructing baseline δ15N variation in sediment samples. The δ15NPhe values increased within 2 cm below the surface but maintained in deeper parts of the core, likely due to Phe limitation. The downcore increase in δ15NGly, δ15NSer, and Gly/Ser ratio indicated active microbial resynthesis with little selective preservation of AAs in the central Yellow Sea.
The δ15N values of individual AAs in sediments offer an advantage in understanding microbial degradation of organic matter, even though AAs make a small contribution to TN. Further study is needed to understand better the specific pathways involved in utilizing AAs according to seafloor sedimentary environments, including oxic and anoxic conditions.
Data availability statement
The original contributions presented in the study are included in the article/Supplementary Material. Further inquiries can be directed to the corresponding author.
Author contributions
K-HS and BC conceived the ideas. HK, KL, DL provided samples and performed bulk nitrogen isotope analysis. HC performed the amino acid concentration and nitrogen isotope analysis aided by BC, YC and YT. Also HC, BC, and K-HS wrote the manuscript. All authors have read and commented and agreed to the published version of the manuscript.
Funding
This study was a part of project titled 'Determining origin and fate of inflow nitrogen into marine environment using nitrogen stable isotope ratio of amino acid', funded by the Ministry of Oceans and Fisheries, Korea (20150203). This work was supported by the National Research Foundation of Korea (NRF) grants funded by the Ministry of Science and ICT (MSIT) (2021M3I6A1091270). This study was also supported by the National Institute of Fisheries Science (R2022039).
Acknowledgments
The authors express their gratitude to Dr. N. Ohkouchi (JAMSTEC) and Dr. Y. Takizawa (Hokkaido Univ.) for their technical advices and discussion. Preliminary results of this study were reported at International Meeting on Organic Geochemistry (IMOG) 2019 at Gothenburg, Sweden. We are also grateful to two reviewers and the editor for detailed and constructive comments on the manuscript.
Conflict of interest
The authors declare that the research was conducted in the absence of any commercial or financial relationships that could be construed as a potential conflict of interest.
Publisher’s note
All claims expressed in this article are solely those of the authors and do not necessarily represent those of their affiliated organizations, or those of the publisher, the editors and the reviewers. Any product that may be evaluated in this article, or claim that may be made by its manufacturer, is not guaranteed or endorsed by the publisher.
Supplementary material
The Supplementary Material for this article can be found online at: https://www.frontiersin.org/articles/10.3389/fmars.2022.1030669/full#supplementary-material
References
Batista F. C., Ravelo A. C., Crusius J., Casso M. A., McCarthy M. D. (2014). Compound specific amino acid δ15N in marine sediments: A new approach for studies of the marine nitrogen cycle. Geochimica Cosmochimica Acta 142, 553–569. doi: 10.1016/j.gca.2014.08.002
Brahney J., Ballantyne A., Turner B. L., Spaulding S., Otu M., Neff J. (2014). Separating the influences of diagenesis, productivity and anthropogenic nitrogen deposition on sedimentary δ15N variations. Organic Geochem. 75, 140–150. doi: 10.1016/j.orggeochem.2014.07.003
Brown Z. W., Casciotti K. L., Pickart R. S., Swift J. H., Arrigo K. R. (2015). Aspects of the marine nitrogen cycle of the chukchi Sea shelf and Canada basin. Deep Sea Res. Part II: Topical Stud. Oceanogr. 118, 73–87. doi: 10.1016/j.dsr2.2015.02.009
Calleja M. L., Batista F., Peacock M., Kudela R., McCarthy M. (2013). Changes in compound specific δ15N amino acid signatures and D/L ratios in marine dissolved organic matter induced by heterotrophic bacterial reworking. Mar. Chem. 149, 32–44. doi: 10.1016/j.marchem.2012.12.001
Calvert S., Pedersen T., Naidu P., Von Stackelberg U. (1995). On the organic carbon maximum on the continental slope of the eastern Arabian Sea. J. Mar. Res. 53, 269–296. doi: 10.1357/0022240953213232
Carstens D., Lehmann M. F., Hofstetter T. B., Schubert C. J. (2013). Amino acid nitrogen isotopic composition patterns in lacustrine sedimenting matter. Geochimica Cosmochimica Acta 121, 328–338. doi: 10.1016/j.gca.2013.07.020
Carstens D., Schubert C. J. (2012). Amino acid and amino sugar transformation during sedimentation in lacustrine systems. Organic geochem. 50, 26–35. doi: 10.1016/j.orggeochem.2012.06.006
Carter P. W., Mitterer R. M. (1978). Amino acid composition of organic matter associated with carbonate and non-carbonate sediments. Geochimica Cosmochimica Acta 42, 1231–1238. doi: 10.1016/0016-7037(78)90116-3
Chikaraishi Y., Kashiyama Y., Ogawa N. O., Kitazato H., Ohkouchi N. (2007). Metabolic control of nitrogen isotope composition of amino acids in macroalgae and gastropods: implications for aquatic food web studies. Mar. Ecol. Prog. Ser. 342, 85–90. doi: 10.3354/meps342085
Chikaraishi Y., Ogawa N. O., Kashiyama Y., Takano Y., Suga H., Tomitani A., et al. (2009). Determination of aquatic food-web structure based on compound-specific nitrogen isotopic composition of amino acids. Limnology Oceanogr.: Methods 7, 740–750. doi: 10.4319/lom.2009.7.740
Chikaraishi Y., Steffan S. A., Ogawa N. O., Ishikawa N. F., Sasaki Y., Tsuchiya M., et al. (2014). High-resolution food webs based on nitrogen isotopic composition of amino acids. Ecol. Evol. 4, 2423–2449. doi: 10.1002/ece3.1103
Chinopoulos C. (2013). Which way does the citric acid cycle turn during hypoxia? the critical role of α-ketoglutarate dehydrogenase complex. J. Neurosci. Res. 91, 1030–1043. doi: 10.1002/jnr.23196
Choi H., Hwang J., Kim G., Shin K.-H. (2022). Seasonal trophic dynamics of sinking particles in the ulleung basin of the East Sea (Japan sea): An approach employing nitrogen isotopes of amino acids. Front. Mar. Sci. 9, 824479. doi: 10.3389/fmars.2022.824479
Choi B., Shin K.-H. (2021). Determination of precise nitrogen stable isotopic baselines from heterotrophic organism in coastal ocean environments using compound specific isotope analysis of amino acids. Mar. pollut. Bull. 171, 112777. doi: 10.1016/j.marpolbul.2021.112777
Cowie G. L., Hedges J. I. (1992). Sources and reactivities of amino acids in a coastal marine environment. Limnology Oceanogr. 37, 703–724. doi: 10.4319/lo.1992.37.4.0703
Cowie G. L., Hedges J. I. (1994). Biochemical indicators of diagenetic alteration in natural organic matter mixtures. Nature 369, 304–307. doi: 10.1038/369304a0
Dauwe B., Middelburg J. J. (1998). Amino acids and hexosamines as indicators of organic matter degradation state in north Sea sediments. Limnology Oceanogr. 43, 782–798. doi: 10.4319/lo.1998.43.5.0782
Dauwe B., Middelburg J. J., Herman P. M., Heip C. H. (1999). Linking diagenetic alteration of amino acids and bulk organic matter reactivity. Limnology Oceanogr. 44, 1809–1814. doi: 10.4319/lo.1999.44.7.1809
Davis J., Kaiser K., Benner R. (2009). Amino acid and amino sugar yields and compositions as indicators of dissolved organic matter diagenesis. Organic Geochem. 40, 343–352. doi: 10.1016/j.orggeochem.2008.12.003
Dolgova S., Popp B. N., Courtoreille K., Espie R. H., Maclean B., McMaster M., et al. (2018). Spatial trends in a biomagnifying contaminant: Application of amino acid compound–specific stable nitrogen isotope analysis to the interpretation of bird mercury levels. Environ. Toxicol. Chem. 37, 1466–1475. doi: 10.1002/etc.4113
Eglite E., Wodarg D., Dutz J., Wasmund N., Nausch G., Liskow I., et al. (2018). Strategies of amino acid supply in mesozooplankton during cyanobacteria blooms: a stable nitrogen isotope approach. Ecosphere 9, e02135. doi: 10.1002/ecs2.2135
Fernandes L., Garg A., Borole D. V. (2014). Amino acid biogeochemistry and bacterial contribution to sediment organic matter along the western margin of the bay of Bengal. Deep Sea Res. Part I: Oceanogr. Res. Papers 83, 81–92. doi: 10.1016/j.dsr.2013.09.006
Gälman V., Rydberg J., de-Luna S. S., Bindler R., Renberg I. (2008). Carbon and nitrogen loss rates during aging of lake sediment: changes over 27 years studied in varved lake sediment. Limnology Oceanogr. 53, 1076–1082. doi: 10.4319/lo.2008.53.3.1076
Granger J., Prokopenko M., Sigman D. M., Mordy C., Morse Z., Morales L., et al. (2011). Coupled nitrification-denitrification in sediment of the eastern Bering Sea shelf leads to 15N enrichment of fixed n in shelf waters. J. Geophys. Research: Oceans 116, C11006. doi: 10.1029/2010JC006751
Harada N. (2016). Potential catastrophic reduction of sea ice in the western Arctic ocean: Its impact on biogeochemical cycles and marine ecosystems. Global Planetary Change 136, 1–17. doi: 10.1016/j.gloplacha.2015.11.005
Hecky R., Mopper K., Kilham P., Degens E. (1973). The amino acid and sugar composition of diatom cell-walls. Mar. Biol. 19, 323–331. doi: 10.1007/BF00348902
Ingalls A. E., Lee C., Wakeham S. G., Hedges J. I. (2003). The role of biominerals in the sinking flux and preservation of amino acids in the southern ocean along 170 W. Deep Sea Res. Part II: Topical Stud. Oceanogr. 50, 713–738. doi: 10.1016/S0967-0645(02)00592-1
Ishikawa N. F., Ogawa N. O., Sun Y., Chikaraishi Y., Takano Y., Ohkouchi N. (2022). Integrative assessment of amino acid nitrogen isotopic composition in biological tissue samples determined by GC/C/IRMS, LC× EA/IRMS, and LC× GC/C/IRMS. Limnology Oceanogr.: Methods 20, 531–542. doi: 10.1002/lom3.10502
Jang H.-K., Youn S.-H., Joo H., Kim Y., Kang J.-J., Lee D., et al. (2021). First concurrent measurement of primary production in the yellow Sea, the south Sea of Korea, and the East/Japan Sea 2018. J. Mar. Sci. Eng. 9(11), 1237. doi: 10.3390/jmse9111237
Keil R. G., Fogel M. L. (2001). Reworking of amino acid in marine sediments: Stable carbon isotopic composition of amino acids in sediments along the Washington coast. Limnology Oceanogr. 46, 14–23. doi: 10.4319/lo.2001.46.1.0014
Keil R. G., Tsamakis E., Giddings J. C., Hedges J. I. (1998). Biochemical distributions (amino acids, neutral sugars, and lignin phenols) among size-classes of modern marine sediments from the Washington coast. Geochimica Cosmochimica Acta 62, 1347–1364. doi: 10.1016/S0016-7037(98)00080-5
Kendall I. P., Woodward P., Clark J. P., Styring A. K., Hanna J. V., Evershed R. P. (2019). Compound-specific δ15N values express differences in amino acid metabolism in plants of varying lignin content. Phytochemistry 161, 130–138. doi: 10.1016/j.phytochem.2019.01.012
Kim H., Lee K., Lim D.-I., Nam S.-I., Hee Han S., Kim J., et al. (2019). Increase in anthropogenic mercury in marginal sea sediments of the Northwest pacific ocean. Sci. Total Environ. 654, 801–810. doi: 10.1016/j.scitotenv.2018.11.076
Kim H., Lee K., Lim D.-I., Nam S.-I., Kim T.-W., Yang J.-Y. T., et al. (2017). Widespread anthropogenic nitrogen in northwestern pacific ocean sediment. Environ. Sci. Technol. 51, 6044–6052. doi: 10.1021/acs.est.6b05316
Kim J., Lim D., Jung D., Kang J., Jung H., Woo H., et al. (2018). Sedimentary mercury (Hg) in the marginal seas adjacent to Chinese high-Hg emissions: source-to-sink, mass inventory, and accumulation history. Mar. pollut. Bull. 128, 428–437. doi: 10.1016/j.marpolbul.2018.01.058
Kröger N., Deutzmann R., Sumper M. (1999). Polycationic peptides from diatom biosilica that direct silica nanosphere formation. Science 286, 1129–1132. doi: 10.1126/science.286.5442.1129
Langerhuus A. T., Røy H., Lever M. A., Morono Y., Inagaki F., Jørgensen B. B., et al. (2012). Endospore abundance and d: L-amino acid modeling of bacterial turnover in holocene marine sediment (Aarhus bay). Geochimica Cosmochimica Acta 99, 87–99. doi: 10.1016/j.gca.2012.09.023
Larsen T., Bach L. T., Salvatteci R., Wang Y. V., Andersen N., Ventura M., et al. (2015). Assessing the potential of amino acid 13 c patterns as a carbon source tracer in marine sediments: effects of algal growth conditions and sedimentary diagenesis. Biogeosciences 12, 4979–4992. doi: 10.5194/bg-12-4979-2015
Lomstein B. A., Jørgensen B. B., Schubert C. J., Niggemann J. (2006). Amino acid biogeo-and stereochemistry in coastal Chilean sediments. Geochimica Cosmochimica Acta 70, 2970–2989. doi: 10.1016/j.gca.2006.03.015
Mayer L., Benninger L., Bock M., DeMaster D., Roberts Q., Martens C. (2002). Mineral associations and nutritional quality of organic matter in shelf and upper slope sediments off cape hatteras, USA: a case of unusually high loadings. Deep Sea Res. Part II: Topical Stud. Oceanogr. 49, 4587–4597. doi: 10.1016/S0967-0645(02)00130-3
McCarthy M. D., Benner R., Lee C., Fogel M. L. (2007). Amino acid nitrogen isotopic fractionation patterns as indicators of heterotrophy in plankton, particulate, and dissolved organic matter. Geochimica Cosmochimica Acta 71, 4727–4744. doi: 10.1016/j.gca.2007.06.061
McCarthy M. D., Benner R., Lee C., Hedges J. I., Fogel M. L. (2004). Amino acid carbon isotopic fractionation patterns in oceanic dissolved organic matter: an unaltered photoautotrophic source for dissolved organic nitrogen in the ocean? Mar. Chem. 92, 123–134. doi: 10.1016/j.marchem.2004.06.021
McMahon K. W., McCarthy M. D. (2016). Embracing variability in amino acid δ15N fractionation: mechanisms, implications, and applications for trophic ecology. Ecosphere 7, e01511. doi: 10.1002/ecs2.1511
Mompeán C., Bode A., Gier E., McCarthy M. D. (2016). Bulk vs. amino acid stable n isotope estimations of metabolic status and contributions of nitrogen fixation to size-fractionated zooplankton biomass in the subtropical n Atlantic. Deep Sea Res. Part I: Oceanogr. Res. Papers 114, 137–148. doi: 10.1016/j.dsr.2016.05.005
Niggemann J., Lomstein B. A., Schubert C. J. (2018). Diagenesis of amino compounds in water column and sediment of lake baikal. Organic Geochem. 115, 67–77. doi: 10.1016/j.orggeochem.2017.10.008
Ohkouchi N., Chikaraishi Y., Close H. G., Fry B., Larsen T., Madigan D. J., et al (2017) Advances in the application of amino acid nitrogen isotopic analysis in ecological and biogeochemical studies. Organic geochem 113, 150–174. doi: 10.1016/j.orggeochem.2017.07.009
Orsi W. D. (2018). Ecology and evolution of seafloor and subseafloor microbial communities. Nat. Rev. Microbiol. 16, 671–683. doi: 10.1038/s41579-018-0046-8
Pantoja S., Lee C. (2003). Amino acid remineralization and organic matter lability in Chilean coastal sediments. Organic Geochem. 34, 1047–1056. doi: 10.1016/S0146-6380(03)00085-8
Pedersen T., Shimmield G., Price N. (1992). Lack of enhanced preservation of organic matter in sediments under the oxygen minimum on the Oman margin. Geochimica Cosmochimica Acta 56, 545–551. doi: 10.1016/0016-7037(92)90152-9
Robinson R. S., Kienast M., Luiza Albuquerque A., Altabet M., Contreras S., De Pol Holz R., et al. (2012). A review of nitrogen isotopic alteration in marine sediments. Paleoceanography 27, A4203. doi: 10.1029/2012PA002321
Santschi P., Höhener P., Benoit G., Buchholtz-ten Brink M. (1990). Chemical processes at the sediment-water interface. Mar. Chem. 30, 269–315. doi: 10.1016/0304-4203(90)90076-O
Schleifer K. H., Kandler O. (1972). Peptidoglycan types of bacterial cell walls and their taxonomic implications. Bacteriol. Rev. 36, 407–477. doi: 10.1128/br.36.4.407-477.1972
Shen Y., Guilderson T. P., Sherwood O. A., Castro C. G., Chavez F. P., McCarthy M. D. (2021). Amino acid δ13C and δ15N patterns from sediment trap time series and deep-sea corals: Implications for biogeochemical and ecological reconstructions in paleoarchives. Geochimica Cosmochimica Acta 297, 288–307. doi: 10.1016/j.gca.2020.12.012
Sherwood O. A., Guilderson T. P., Batista F. C., Schiff J. T., McCarthy M. D. (2014). Increasing subtropical north pacific ocean nitrogen fixation since the little ice age. Nature 505, 78–81. doi: 10.1038/nature12784
Sorokin Y. I., Sorokin P. Y. (1999). Production in the Sea of Okhotsk. J. Plankton Res. 21(2), 201–230. doi: 10.1093/plankt/21.2.201
Steffan S. A., Chikaraishi Y., Dharampal P. S., Pauli J. N., Guédot C., Ohkouchi N. (2017). Unpacking brown food-webs: Animal trophic identity reflects rampant microbivory. Ecol. Evol. 7, 3532–3541. doi: 10.1002/ece3.2951
Stücheli P. E., Larsen T., Wehrli B., Schubert C. J. (2021). Amino acid and chlorin based degradation indicators in freshwater systems. Geochimica Cosmochimica Acta 304, 216–233. doi: 10.1016/j.gca.2021.04.006
Sugai M., Fujiwara T., Ohta K., Komatsuzawa H., Ohara M., Suginaka H. (1997). Epr, which encodes glycylglycine endopeptidase resistance, is homologous to femAB and affects serine content of peptidoglycan cross bridges in staphylococcus capitis and staphylococcus aureus. J. Bacteriol. 179, 4311–4318. doi: 10.1128/jb.179.13.4311-4318.1997
Takano Y., Kashiyama Y., Ogawa N. O., Chikaraishi Y., Ohkouchi N. (2010). Isolation and desalting with cation-exchange chromatography for compound-specific nitrogen isotope analysis of amino acids: application to biogeochemical samples. Rapid Commun. Mass Spectrom. 24, 2317–2323. doi: 10.1002/rcm.4651
Takizawa Y., Takano Y., Choi B., Dharampal P. S., Steffan S. A., Ogawa N. O., et al. (2020). A new insight into isotopic fractionation associated with decarboxylation in organisms: implications for amino acid isotope approaches in biogeoscience. Prog. Earth Planetary Sci. 7, 1–13. doi: 10.1186/s40645-020-00364-w
Vandewiele S., Cowie G., Soetaert K., Middelburg J. J. (2009). Amino acid biogeochemistry and organic matter degradation state across the Pakistan margin oxygen minimum zone. Deep Sea Res. Part II: Topical Stud. Oceanogr. 56, 376–392. doi: 10.1016/j.dsr2.2008.05.035
Vokhshoori N. L., McCarthy M. D. (2014). Compound-specific δ15N amino acid measurements in littoral mussels in the California upwelling ecosystem: A new approach to generating baseline δ15N isoscapes for coastal ecosystems. PloS One 9, e98087. doi: 10.1371/journal.pone.0098087
Wakeham S. (2002). “Diagenesis of organic matter at the water-sediment interface,” in Chemistry of marine water and sediments (Berlin, Heidelberg: Springer), 2002, 147–164.
Wei J.-E., Chen Y., Wang J., Yan S.-B., Zhang H.-H., Yang G.-P. (2021). Amino acids and amino sugars as indicators of the source and degradation state of sedimentary organic matter. Mar. Chem. 230, 103931. doi: 10.1016/j.marchem.2021.103931
Yamaguchi Y. T., Chikaraishi Y., Takano Y., Ogawa N. O., Imachi H., Yokoyama Y., et al. (2017). Fractionation of nitrogen isotopes during amino acid metabolism in heterotrophic and chemolithoautotrophic microbes across eukarya, bacteria, and archaea: effects of nitrogen sources and metabolic pathways. Organic Geochem. 111, 101–112. doi: 10.1016/j.orggeochem.2017.04.004
Yamaguchi Y. T., McCarthy M. D. (2018). Sources and transformation of dissolved and particulate organic nitrogen in the north pacific subtropical gyre indicated by compound-specific δ15N analysis of amino acids. Geochimica Cosmochimica Acta 220, 329–347. doi: 10.1016/j.gca.2017.07.036
Zheng L.-w., Zhai W.-D. (2021). Excess nitrogen in the bohai and yellow seas, China: Distribution, trends, and source apportionment. Sci. Total Environ. 794, 148702. doi: 10.1016/j.scitotenv.2021.148702
Keywords: amino acid, nitrogen isotope, sediment, microbial degradation, compound-specific isotope analysis (CSIA)
Citation: Choi H, Choi B, Chikaraishi Y, Takano Y, Kim H, Lee K, Lim D and Shin K-H (2022) Microbial alteration in marine sediments: Insights from compound-specific isotopic compositions of amino acids in subseafloor environments. Front. Mar. Sci. 9:1030669. doi: 10.3389/fmars.2022.1030669
Received: 29 August 2022; Accepted: 01 November 2022;
Published: 14 November 2022.
Edited by:
Travis Blake Meador, Academy of Sciences of the Czech Republic (ASCR), CzechiaCopyright © 2022 Choi, Choi, Chikaraishi, Takano, Kim, Lee, Lim and Shin. This is an open-access article distributed under the terms of the Creative Commons Attribution License (CC BY). The use, distribution or reproduction in other forums is permitted, provided the original author(s) and the copyright owner(s) are credited and that the original publication in this journal is cited, in accordance with accepted academic practice. No use, distribution or reproduction is permitted which does not comply with these terms.
*Correspondence: Kyung-Hoon Shin, c2hpbmtoQGhhbnlhbmcuYWMua3I=