 Laura Kauppi1,2*
 Norman Göbeler1,2
 Joanna Norkko1,2†
 Alf Norkko1,2†
 Alicia Romero-Ramirez3
 Guillaume Bernard3,4
- 1Tvärminne Zoological Station, University of Helsinki, Hanko, Finland
- 2Faculty of Biological and Environmental Sciences, University of Helsinki, Helsinki, Finland
- 3Station Marine d’Arcachon, UMR CNRS 5805 EPOC—OASU Université de Bordeaux, Arcachon, France
- 4IFREMER, Department of Oceanography and Ecosystem Dynamics (ODE), Littoral unit, LERAR, Littoral, Arcachon, France
The increasing frequency and intensity of marine heatwaves (MHWs) observed worldwide entails changes in the structure and functioning of ecological communities. While severe and extreme heatwaves often have more destructive effects, the more subtle effects of moderate and strong heatwaves may nevertheless affect ecosystem functioning through complex, context-dependent linkages between different processes. Here we conducted a laboratory experiment to study the effects of repeated short-term, strong MHWs on macrofauna bioturbation and associated solute fluxes as a measure of ecosystem functioning using natural soft-sediment communities from the Baltic Sea. Our results showed changes in both bioturbation and biogeochemical cycling of nutrients following short-term, strong heatwaves, which seemed to contribute to an enhanced degradation of organic matter in the seafloor and an enhanced exchange of solutes across the sediment-water interface as well as increased sediment oxygen consumption. Following changes in these processes, the relative contribution of macrofauna and the environmental context to ecosystem functioning was altered. Our results highlight the potential of even shorter-term, strong MHWs of having system-wide impacts due to changes in the mechanistic process of bioturbation underpinning the biogeochemical cycling of nutrients. This study also highlights the need to measure a wide range of variables for a comprehensive understanding of the changes in functioning under disturbances, such as MHWs.
1 Introduction
Soft sediments cover more surface area than any other ecosystem in the world (Snelgrove, 1999). Macrofauna in these soft sediments contribute to the functioning of the whole aquatic ecosystem through their role in benthic-pelagic coupling (Lohrer et al., 2004; Griffiths et al., 2017). Bioturbation by macrofauna links benthic animals to biogeochemical cycling of nutrients through direct consumption of organic matter (Kristensen et al., 1992) and modification of the sediment matrix affecting the redox conditions and activating the microbial degradation processes (Yazdani Foshtomi et al., 2015). The ongoing anthropogenic climate change has caused an increase not only in average temperatures in both aquatic and terrestrial ecosystems (IPCC, 2021), but also in the frequency of periods of abnormally high temperatures, called heatwaves (sensu Hobday et al., 2016). The influence of benthic animals on biogeochemical cycling of nutrients at the seafloor is context-dependent, and is therefore likely to be affected by changes in environmental conditions following climate change (Solan et al., 2004). Only a few studies have looked at the effects of heatwaves on the bioturbation of macrofauna and tried to link that to ecosystem functioning (see Crespo et al., 2017; Dolbeth et al., 2021; Kauppi & Villnäs, 2022) despite the pivotal role this plays in the functioning of marine ecosystems. However, the results of these studies have been somewhat inconclusive with no clear effect on bioturbation due to context-dependent responses and/or the methodology used. Variation in the response could also arise from the duration of the heatwave. There are also interspecific differences in species’ response to warming (Harvey et al., 2013; Verdelhos et al., 2015) which could contribute to increasing variation in the observed response and obscure the results. Organisms could also adapt to the increase in any stressor. For example, Fox et al. (2021) observed increases in thermal tolerance in corals following recurrent El Niño heatwaves.
Temperature affects all processes on Earth and thereby also determines ecological patterns and limits the distribution of species (Verdelhos et al., 2015). The frequency and intensity of marine heatwaves (MHW) has already increased following anthropogenic climate change (Hobday et al., 2016; Frölicher et al., 2018; Göbeler et al., 2022). MHWs have the potential to profoundly change the structure of biological communities (e.g. Wernberg et al., 2013; Pansch et al., 2018; Smale et al., 2019), and thereby impair their functioning and provision of goods and services (Smale et al., 2019). Changes in the abundance and/or performance of key species are likely to cause the largest ecological responses to climate change (Reed et al., 2022). Although the effects of heatwaves on the recipient ecosystem are context-dependent (Frölicher & Laufkötter, 2018), severe and extreme heatwaves usually lead to more drastic changes often characterized by mass mortalities of habitat forming species such as corals, kelps or seagrasses (Hobday et al., 2018). Consequences of severe or extreme events might therefore be easier to detect and predict. Even moderate heatwaves, however, may induce changes in species behavior or feeding due to physiological changes following environmental stress associated with increasing temperature (Gillooly et al., 2001; Verdelhos et al., 2015; Amorim et al., 2020; Horwitz et al., 2020; Redfern et al., 2021). While these changes are not lethal, they may still indirectly affect ecosystem processes associated with macrofauna feeding and locomotion activities (Maire et al., 2007; Bernard et al., 2016; Woodin et al., 2016; Pascal et al., 2019). These activities include sediment particle mixing and burrow ventilation (bioirrigation) activities, jointly called bioturbation, which alter the redox conditions of the sediment (Kristensen et al., 2012) and thereby oxygen and nutrient fluxes across the sediment-water interface (Braeckman et al., 2010; Pascal et al., 2019). Any changes in the behavior of macrofauna inducing changes in their bioturbation following changes in temperature could therefore lead to changes in oxygenation of the sediment and cycling of organic matter (Solan et al., 2020).
The Baltic Sea has a long history of eutrophication and coastal areas are suffering from multiple stressors such as hypoxia and pollution. On top of that, mean annual temperature in our study area, an aphotic coastal site at the entrance to the Gulf of Finland, has increased by approximately 2°C since the 1920’s and since the late 1980’s the increase has been nearly linear (Göbeler et al., 2022). Due to the brackish water and the geologically young age of the Baltic Sea, taxonomic diversity is low, but functional diversity is relatively high (Elmgren & Hill, 1997). Benthic macrofauna communities are dominated by the bivalve Macoma balthica, the amphipod Monoporeia affinis and the invasive polychaete Marenzelleria spp. (e.g. Kauppi et al., 2015). One of the Marenzelleria species, Marenzelleria arctia, can alone contribute up to 52% of the variation in ammonium fluxes at the sediment-water interface on muddy sites (Kauppi et al., 2018). In shallow coastal sites in the northern Baltic, macrofauna accounted for 25% of the variation in solute fluxes with only a few species having a significant contribution (Gammal et al., 2019) and the same species being responsible for most of the variation in bioturbation rates at these same sites (Bernard et al., 2019a). Bioturbation intensity of the species was defined by the environmental context, with animals having a larger contribution in cohesive than non-cohesive sediments, whereas environmental conditions were more important in non-cohesive sediments (Bernard et al., 2019a). The contribution of macrofauna to variation in solute fluxes can be both direct or indirect through their bioturbation and is also solute-dependent (Kauppi et al., 2018). Given the importance of the macrofauna for the nutrient cycling processes and the relative vulnerability of a system, where the functional contribution is shared by only a few species, any changes in bioturbation following a marine heatwave could have a major effect on ecosystem functioning.
The context-dependent nature of the links between macrofauna, bioturbation and nutrient cycling demonstrated in several earlier studies makes is critical to observe all of these variables together in order to establish a comprehensive understanding of the functioning of the system and how it may change under environmental forcing. To fill in the knowledge gaps regarding the effects of MHWs on benthic macrofauna bioturbation and associated ecosystem functioning in the form of nutrient cycling, we conducted a laboratory experiment using natural sediment communities. More specifically we investigated the effects of repeated, strong MHWs on 1) sediment mixing and bioirrigation processes performed by benthic macrofauna 2) the effects of repeated MHWs on sediment oxygen consumption as a proxy of macrofaunal and microbial activities and 3) changes in solute fluxes as an outcome of remineralisation of organic matter. The results of this study adds to our understanding of the sublethal effects of MHWs that nevertheless might profoundly affect ecosystem processes.
2 Material and methods
2.1 Experiment setup
In total 12 experimental boxes used as experimental units (surface area 34.5 x 29 cm) were retrieved with a box corer onboard “R/V Augusta” on 6th and 7th October, 2020 from a 30 m deep site at Byxholmen (59° 51.734’ N, 23° 21.095’ E), SW Finland, northern Baltic Sea. The sediment is characterized as clayey mud with elements of sand and gravel. The temperatures chosen for control (CONTROL) and heated (HEAT1/HEAT2) treatments followed climatological temperatures for the reference period 1931-2020 calculated for a monitoring site in close vicinity to the sediment collection site (Göbeler et al., 2022). Of the 12 boxes (a) four boxes functioned as controls and were kept at the climatological mean temperature (about 8.7°C), (b) four boxes received one short-term, strong heatwave and a recovery until the end of the experiment (HEAT1), and (c) the four remaining boxes received two short-term, strong heatwaves with a 7-day recovery period in between (HEAT2; see schematic Figure 1). The first strong MHW had an intensity (relative to the climatological mean) of about 6°C above the climatological mean. As the temperatures naturally decline this time of the year, the 2nd MHW was less intense (about 3.8°C above to the climatological mean) but still of strong category. On 9th October we obtained additional cores with a GEMAX twin corer (diameter of one core 9 cm), that were used to measure porewater and sediment organic content throughout the experiment.
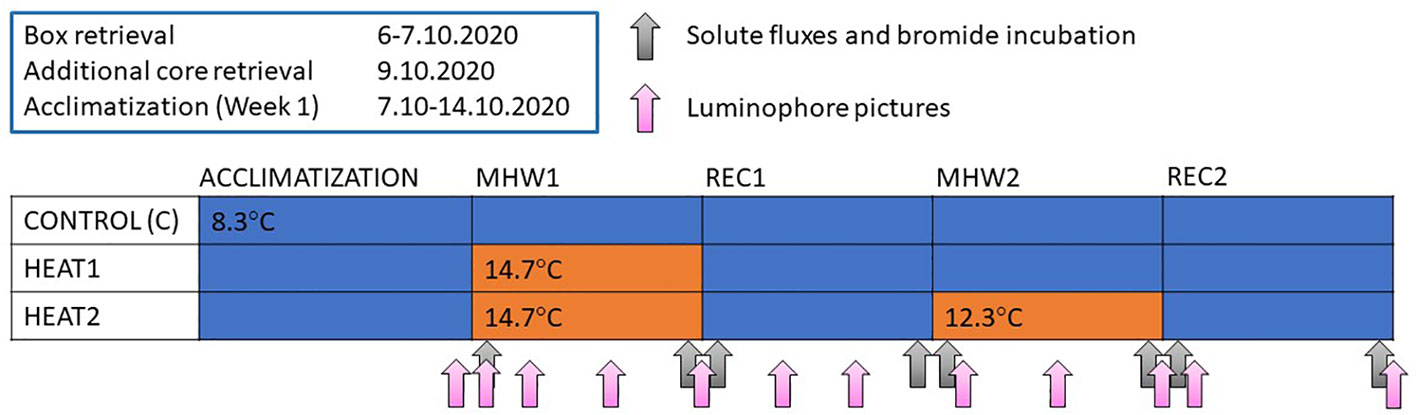
Figure 1 Schematic figure representing the experimental design and approximate timepoints when incubations were done and pictures taken. Blue color refers to the control temperature corresponding to the climatological mean and orange color refers to the experimentally induced heatwave, that is CONTROL was kept at control temperature throughout the experiment, HEAT1 received one heatwave and HEAT2 received two heatwaves with a recovery period in between.
After retrieval, the boxes were carefully transferred to 600 L plastic containers (120 x 80 cm x 80 cm, one box per container) that functioned as water baths. The containers were transferred into two temperature-controlled aquaria rooms (at Tvärminne Zoological Station) set to the climatological mean temperature during the reference period (1931-2020; 8.7°C) and kept in darkness throughout the experiment. Each box received a flow-through of either heated or cooled (down to the control temperature 8.7°C), unfiltered seawater throughout the experiment, except during flux and bromide incubations, but no additional food was given to the macrofauna community. The chl a values in the incoming water, however, corresponded to values in the sea at the time of the experiment (1.49 to 1.94 ug/l at 30 m depth; Tvärminne Zoological Station, unpublished data from hydrographic monitoring). Each box was equipped with a circulatory pump to ensure proper mixing of the overlying water. The unfiltered seawater was heated or cooled in header tanks and directed to the experimental units gravitationally. The whole water mass of each box was exchanged ca. 12 times per day. Bottom water temperature in the boxes was followed with an Onset HOBO UA-002-64 Pendant (one pendant in each box logging every 10 minutes). The boxes were left to settle 7 to 8 days prior to experiment start, depending on the retrieval date.
The heatwaves were induced by switching the flow-through from the cooled seawater to the heated seawater. The targeted daily average temperature was reached within twelve hours. Once the heatwave was over, the inflow of heated water was switched back to cooled water to start the recovery period. The first heatwave started 14.10 and ended 21.10, the second heatwave started 28.10 and ended 3.11, first recovery started accordingly on 21.10 and ended 28.10, and second recovery started 3.11 and ended 9.11.
2.2 Luminophore incubations
Sediment mixing was quantified using luminophores as sediment particle tracers incubated during the course of the experiment. In total 36 g DW of pink luminophores (eco-trace®, environmental tracing systems, density = 2.5 g cm−3) were gently spread using a Pasteur pipette on the sediment surface of each box at the beginning of the first heatwave and flow-through was stopped during one hour to allow them to settle. At the start of the second heatwave, a second similar spread of yellow luminophores was performed to study differences in sediment mixing rates under a repeated heatwave (Supplementary Figure 1). The boxes were photographed on each side under UV light (VILBER VL.215.L, wavelength=365nm) using a NIKON D850 digital camera (5408x3600 pixels definition, image resolution of 6 pixels.mm-1) at 12 occasions during the course of the experiment allowing for the assessment of temporal changes in tracer redistribution during each induced phase (Figure 1). Obtained images (JPEG, RGB) were then analyzed using a custom analysis software (Bernard et al., 2016; Bernard et al., 2019b). The sediment-water interface was first manually drawn and then flattened so the vertical location of a given pixel below the interface corresponds to its depth in the sediment. The vertical distribution of tracers in the sediment column (at mm scale) was obtained after a binarization step (based on the RGB levels). Three metrics were then calculated, characterizing the intensity of the particle mixing performed by the whole community, namely the mean (meanPD), the median (medPD) and the maximum (maxPD) penetration depth of luminophores in the sediment column (Crespo et al., 2017; Dolbeth et al., 2021). For each box, meanPD and medPD measured in the four sides of each box were averaged and the maximum maxPD measured in the four sides was kept. During each of the four tested phases (first MHW, short recovery, second MHW, long recovery from first MHW), increasing rates in the depth of these three variables were assessed using simple linear regressions. The rates were then given in mm day-1.
2.3 Dark incubations of solute fluxes
Dark incubations of solute fluxes were conducted at day 1 and day 5 of each heatwave or recovery period (see Figure 1).The magnitude and direction of solute fluxes at the sediment-water interface link to both macrofauna and the environmental context, such as temperature and organic matter availability (Kauppi et al., 2017; Gammal et al., 2019). Combined they can be used as a measure of nutrient cycling. At the start of the incubations, the inflow of water into the box was stopped and start samples for oxygen (O2) and nutrients (-N, NO2-+ (hereafter NOX-N), –P, Si4+) were taken from the overlying water column with a syringe. The box was then closed with a lid. The circulatory pump kept the water circulating and prevented the formation of gradients interfering with the diffusion of solutes throughout the incubation. The incubations lasted for 24 hours, thereafter the pump was switched off and the end samples were drawn with a syringe through an opening in the lid. The lid was then removed and the flow-through was started for approximately 30 min-1 hour to exchange the water in the box before starting the bromide incubations. Nutrient samples were filtered through a GF/F filter and stored in the freezer (-20°C) for later analysis in the laboratory at Tvärminne Zoological Station. Oxygen samples were analyzed with Winkler titration either straight after the incubations, or the following day after being stored in the fridge overnight. From the start and end sample, a flux of solutes per square meter per day was calculated considering the volume of water in the box, the incubation time and the area of the box.
2.4 Bioirrigation
Bioirrigation was quantified in each box while assessing the decrease of an inert bromide (Br-) solute tracer spread in the overlying water. A known volume of stock sodium bromide solution (NaBr, 1 M) was to an initial Br- concentration of ca. 1 mM in the overlying water after flow-through was stopped. Incubation then lasted 24 h during which overlying water was stirred using gentle air bubbling. After the addition of NaBr solution 5 ml of overlying water samples were taken at 0 (15 min), 6, 12 and 24 hours. Flow-through was restarted after 24 hours. Samples were kept at 4°C until analysis. Concentration of Br- ions in the water samples was analyzed spectrophotometrically (Presley & Claypool, 1971) at Tvärminne Zoological Station (Shimadzu UV-2501 PC) and the relation between bromide concentration in the overlying water and incubation time assessed using simple linear regression (Kauppi et al., 2018). Bioirrigation rates were then given as a pore water exchange rate Q (in ml d−1) calculated after Kauppi et al., 2018.
2.5 Macrofauna community
Box-wise quantification of macrofauna enables the establishment of links between macrofauna, bioturbation and solute fluxes. At the end of the experiment, the sediment was sieved through a 0.5 mm sieve to obtain all macrofauna in the boxes. Macrofauna were stored in 70% ethanol and later identified, measured, counted and weighed.
2.6 Sediment characteristics and porewater nutrients
Vertical profiles of sediment organic content were analyzed at the time of box retrieval (initial values from the field) and for each treatment from GEMAX cores (diameter 9.0 cm) kept in same conditions as the boxes at the end of each experimental phase. The cores were sliced at 0-1, 1-2, 3-4 and 8-9 cm intervals. The slices were transferred to 50 ml Falcon tubes and centrifuged at 2000 rpm for 20 min. The supernatant was then filtered through a GF/F filter and frozen for later analysis of porewater nutrients -N, NOX-N, P and Si4+. At the end of the experiment, three replicate samples of surface sediment (0-2 cm) were taken from each box. One replicate was used for grain size analysis after treatment with 6% H2O2 (l) to remove organic material, and two replicates were freeze-dried and pulverized and analyzed for particulate organic nitrogen (PON) and particulate organic carbon (POC) in the laboratory at Tvärminne Zoological Station.
2.7 Statistical analyses
Differences in macrofaunal community structure between the experimental boxes were assessed using non-metric multidimensional scaling (nMDS) based on a Bray-Curtis dissimilary matrix of abundances and biomasses of the taxa. Biomasses (wet weight) were fourth-root transformed to reduce the dominant effect of the clam Macoma balthica.
For bioturbation, the increase in mean, median and maximum penetration depth (meanPD, medianPD, maxPD, respectively) of luminophores in the sediment (in mm d-1) and the porewater exchange rate Q (in ml d-1) were calculated for each experimental phase and combined after normalization of the variables into one multivariate distance matrix based on Euclidean distances between the samples. A Principal Coordinated Analysis (PCO) was run to illustrate the patterns in bioturbation throughout the experiment. We used the PERMANOVA –procedure in PRIMER 7 PERMANOVA add-on (Anderson et al., 2008) 1) for differences between treatments during each phase (treatment as a fixed factor) and 2) between phases within each treatment (phase as fixed and box as random factor to account for repeated measures design). If the main test testing for overall differences was significant at the P < 0.05 –level, a pairwise test was run to test for between-treatment or phase differences. The PERMDISP procedure accompanied the PERMANOVAS to test for differences in multivariate dispersions that could affect the PERMANOVA result. To illustrate the changes in the overall bioturbation processes we used PCO. For the second, long recovery period, only differences between CONTROL and HEAT1 were tested. The variables meanPD and medPD showing clearest responses to the induced heatwaves were also studied separately and illustrated with box plots.
Sediment oxygen consumption was studied separately from the other fluxes, since it is so closely related to many of the solutes, such as NOX-N and Si4+, and thus tends to drive the multivariate patterns. Differences in oxygen consumption throughout the experiment were studied using the PERMANOVA procedure between treatments within each experimental phase and between experimental phases within each treatment.
To study differences in the biogeochemical processes between treatments and between different phases of the experiment (heatwave vs. recovery, see Figure 1), we combined the normalized nutrient fluxes (excluding oxygen) into one multivariate distance matrix based on Euclidean distances between the samples. We used the PERMANOVA –procedure in PRIMER 7 PERMANOVA add-on (Anderson et al., 2008) 1) for differences between treatments during each phase (treatment as fixed factor) and 2) between phases within each treatment (phase as fixed and box as random factor to account for repeated measures design). If the main test testing for overall differences was significant at the P < 0.05 –level, a pairwise test was run to test for between-treatment or phase differences. The PERMDISP procedure accompanied the PERMANOVAS to test for differences in multivariate dispersions that could affect the PERMANOVA result. To illustrate the changes in the overall biogeochemical processes we used PCO. Draftsman plots with correlations were inspected prior to analysis to inspect the variables for any need of transformations. At the end of the second recovery phase we had lost three boxes from the heated treatments to leakage issues, thus results from the last flux measurements were omitted from the analyses.
3 Results
3.1 Temperature during the experiment
The temperatures aimed for in this experimental setting followed the climatological values of the reference period 1931-2020. The temperature in the controls remained close to the climatological mean at about 8.8°C ± 0.6°C (mean ± SD throughout) over the course of the experiment. Treatment HEAT1 experienced a strong MHW at about 14.9°C ± 0.5 followed by a recovery period at 8.8°C ± 0.8 SD). The HEAT2 treatment experienced the same strong MHW as HEAT1, but followed by a recovery at 8.8°C for 6 days, a repeated strong MHW at 12.0°C ± 0.4 for 5 days and a final recovery at about 8.6°C ± 0.77 SD (Figure 2). Both experimentally induced heatwaves peaked as strong heatwaves but due to the natural cooling this time of the year, the second MHW required less intense temperatures to be categorized as strong MHW.
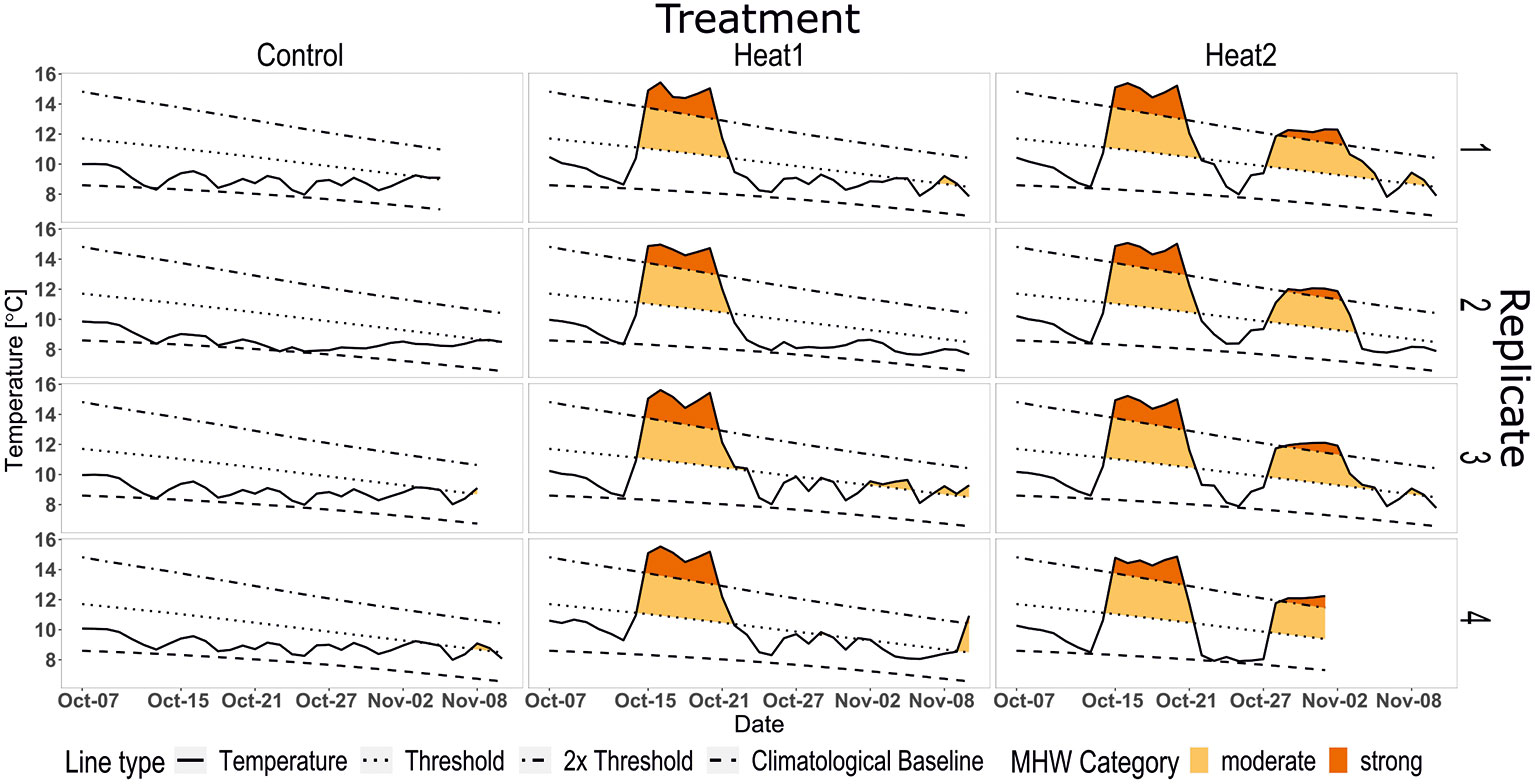
Figure 2 Measured temperature (solid line) in the three different treatments during the experiment; CONTROL (first panel), HEAT1 (second panel) and HEAT2 (third panel). Following climatological values (based on reference period 1931-2020) as linetypes (in order from bottom to top for each panel): dashed – climatological baseline; dotted – threshold for moderate MHW; dotdash – 2 x threshold for strong MHW. The HOBO pendant in HEAT2, replicate 4 had stopped working 1st November, which is why no data is presented for this box after that.
3.2 Macrofauna
In total 15 different taxa were observed in the boxes of which the clam Macoma balthica, the polychaete genus Marenzelleria spp. and the amphipod Monoporeia affinis were the three most common species in terms of abundance. In terms of biomass, M. balthica, Marenzelleria spp. and the priapulid worm Halicryptus spinulosus were the three dominant species. Based on visual inspection of the nMDS graphs there were no significant differences in the macrofauna structural composition based either on abundances or on wet weight of identified taxa (Figure 3).
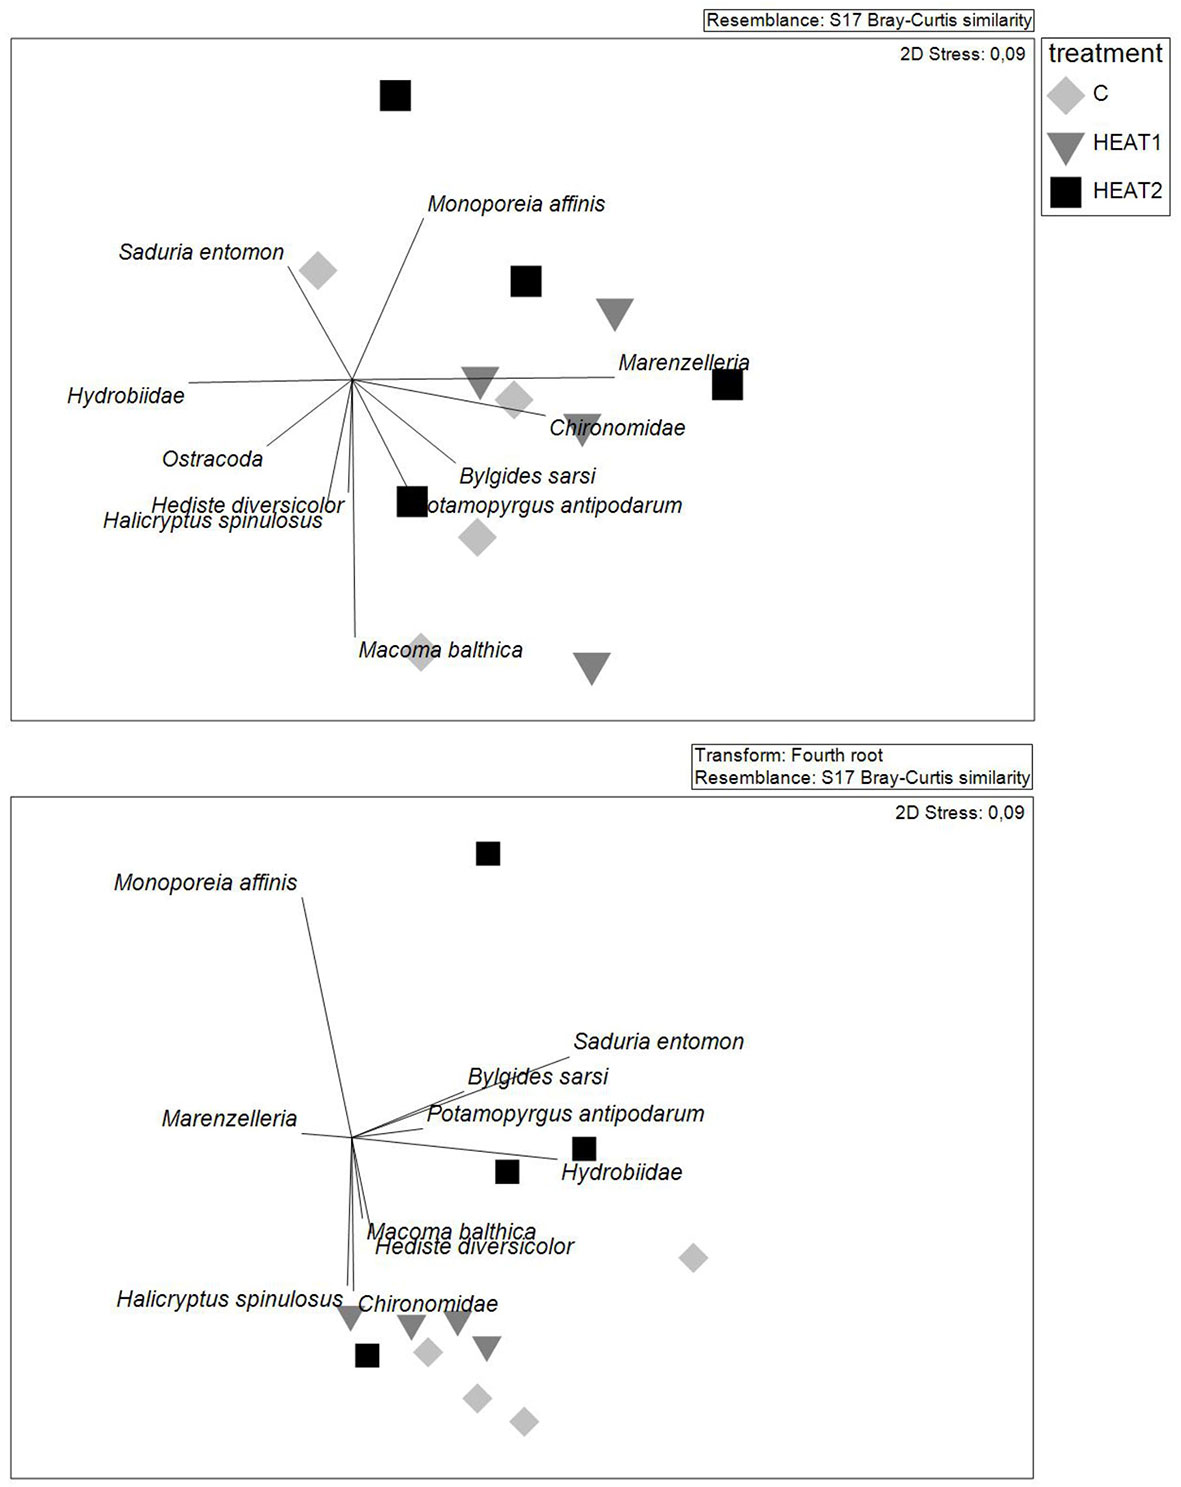
Figure 3 Community composition in the experimental boxes illustrated by nMDS plots based on densities (upper panel)) and fourth root transformed wet weights (lower panel) of the different taxa identified from the boxes at the end of the experiment.
3.3 Changes in macrofauna bioturbation
There were no significant changes in the multivariate bioturbation between treatments during the first heatwave and the first and second recovery period (Figure 4A). There was, however, an increasing trend in both the magnitude and the variation of meanPD and medianPD from the CONTROL towards the heated treatments. During the second heatwave, there was a significant difference in multivariate bioturbation between the treatments including the luminophores spread at the beginning of the experiment (Pseudo-F 7.78, P 0.004) but not when including those spread at the beginning of the second heatwave (Figure 4B). This could be due to the significant PERMDISP test for the second layer of luminophores, indicating that the multivariate dispersion was too high to detect a significant difference. Pairwise comparisons showed that HEAT2 differed significantly from both the CONTROL (t 2.46, P 0.02) and HEAT1 (t 4.02, P 0.005) treatments. For meanPD, the CONTROL and HEAT1 differed significantly from HEAT2 (t 10.12, P 0.0002 for C and t 12.96, P 0.0002 for HEAT1). For medianPD, the CONTROL differed significantly from HEAT1 (t 2.62, P 0.05) and from HEAT2 (t 7.79, P 0.0002) and HEAT1 differed significantly from HEAT2 (t 8.64, P 0.0005). The increase in meanPD differed significantly between treatments also for the luminophores spread at the beginning of the second heatwave (Pseudo-F 5.72, P 0.03) with CONTROL differing significantly from HEAT2 (t 2.60, P 0.04) and HEAT1 showing an almost significant difference from HEAT2 (t 2.37, P 0.07).
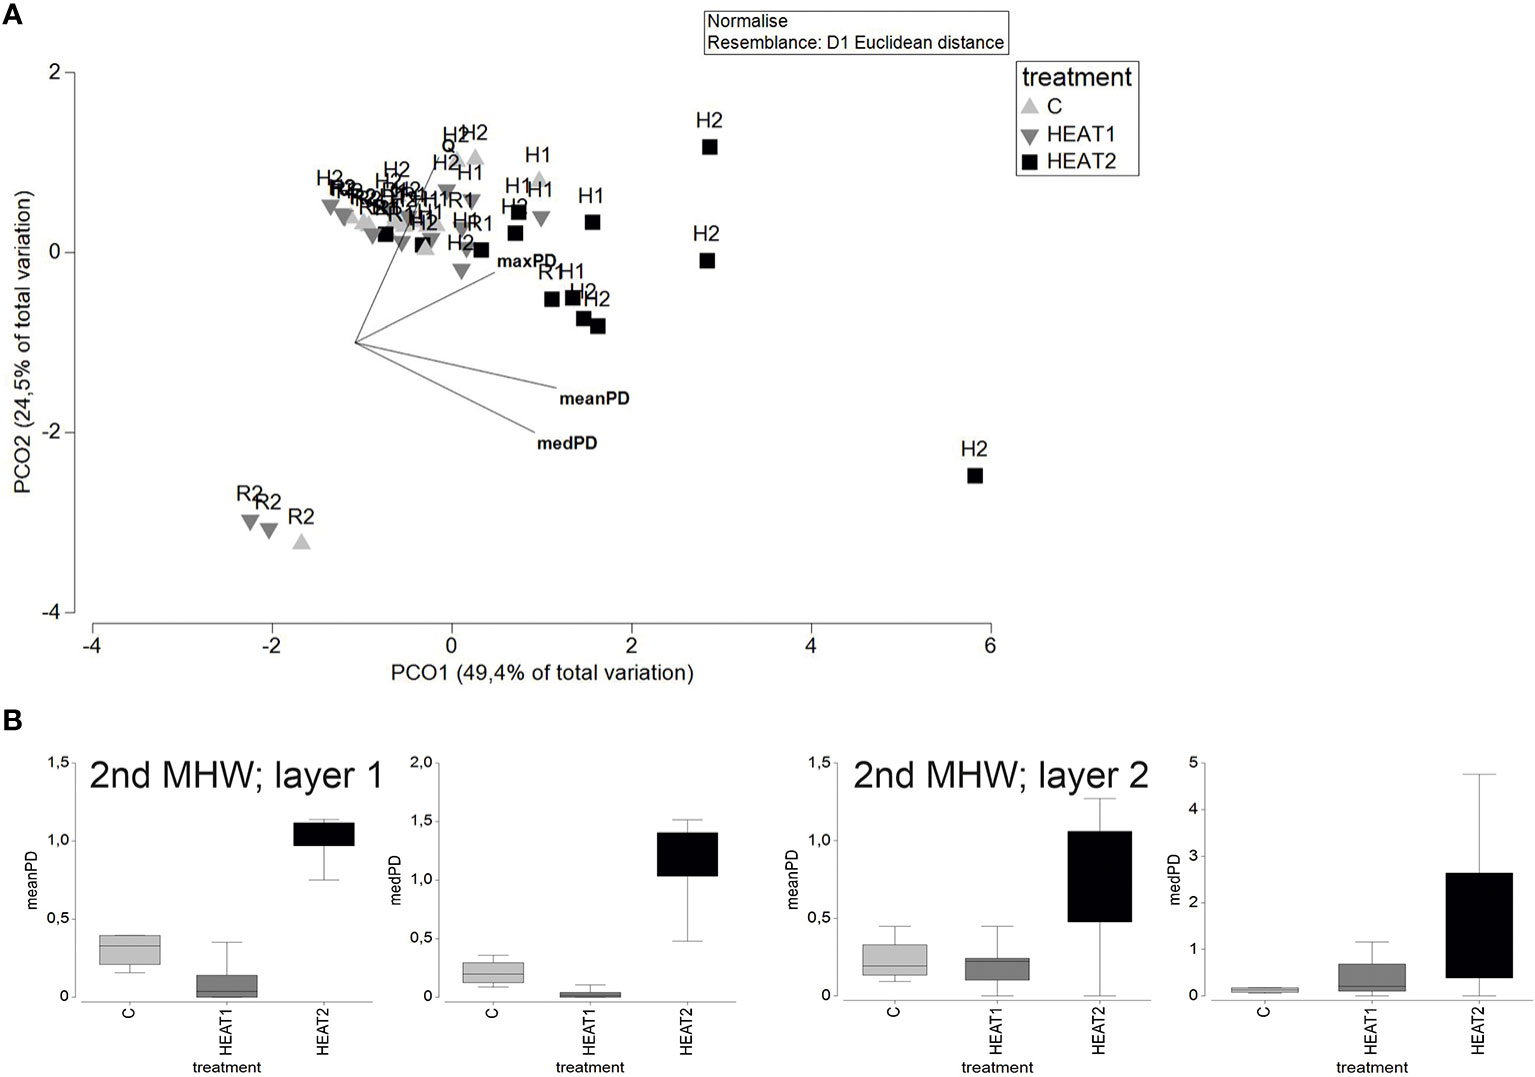
Figure 4 A PCO graph on the multivariate distance matrix on bioturbation including the increase in mean penetration depth (meanPD), median penetration depth (medPD) and maximum penetration depth (maxPD) of luminophores and the porewater exchange rate (Q) (A). The vectors overlain on the graph show the correlation of the base variables with the two PCO axes. The labels refer to the different experimental phases: H1= first heatwave, R1= first recovery, H2= second heatwave, R2= second recovery. Vectors show the direction and magnitude of correlation of the variables in the multivariate bioturbation with the PCO axes. In (B) the significant differences in meanPD and medPD during the second heatwave are illustrated by box plot graphs with the whiskers representing min and max, the box representing first and third quartiles and the line representing median. CONTROL/C=light grey, HEAT1=dark grey, HEAT2=black. Layer 1 refers to the first set of luminophores spread at the beginning of the first heatwave and layer 2 to the second set of luminophores spread at the beginning of the second heatwave.
3.4 Changes in sediment oxygen consumption
There were no significant changes in sediment oxygen consumption between the different experimental phases in any of the treatments (C, HEAT1, HEAT2; Figure 5). However, the oxygen consumption rates are higher during the heatwaves in the heated treatments, and there is a slight decrease in oxygen consumption overall through time in C and HEAT1 after the first heatwave.
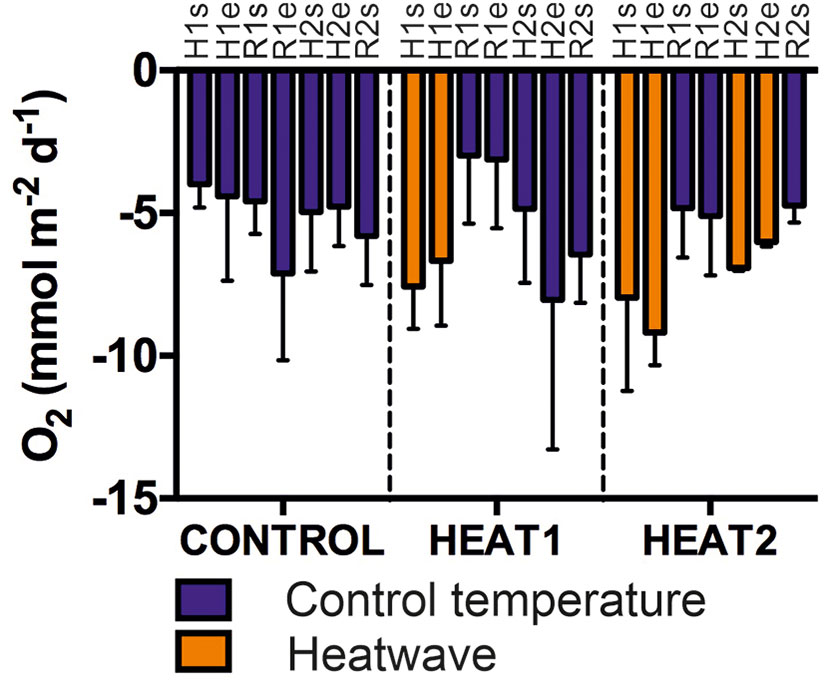
Figure 5 Oxygen consumption in mmol/m2/d in the different treatments throughout the course of the experiment. Each bar represents a single flux measurement starting from the start of the first heatwave and ending at the start of the second recovery. Fluxes were measured at the start and end of each experimental phase according to Figure 1. Blue color represents oxygen consumption at control temperature maintained throughout the experiment (8.9°C) and orange color represents oxygen consumption during the experimentally induced heatwaves (at about 14.9°C and 12°C). Bars represent mean consumption and error bars standard deviation.H1s=start of first MHW, H1e=end of first MHW, R1s=start of first recovery, R1e=end of first recovery, H2s=start of second heatwave, H2e=end of second heatwave, R2s=start of second recovery.
3.5 Changes in sediment biogeochemical processes
The clearest changes in sediment biogeochemical processes (multivariate fluxes) happened at the end of the first heatwave in HEAT1 and HEAT2 (Figure 6; PERMANOVA main test: Pseudo-F 8.54, P 0.002), where the CONTROL differed significantly from HEAT1 (t 4.19, P 0.002) and from HEAT2 (t 3.52, P 0.005). Also at the end of the second heatwave, HEAT2 differed significantly from CONTROL (PERMANOVA main test: Pseudo-F 4.3011, P 0.05; pairwise comparison between CONTROL and HEAT2: t 3.10, P 0.03). Between the MHWs the recovery of the multivariate fluxes is visible as the disappearance of the separation between the treatments.
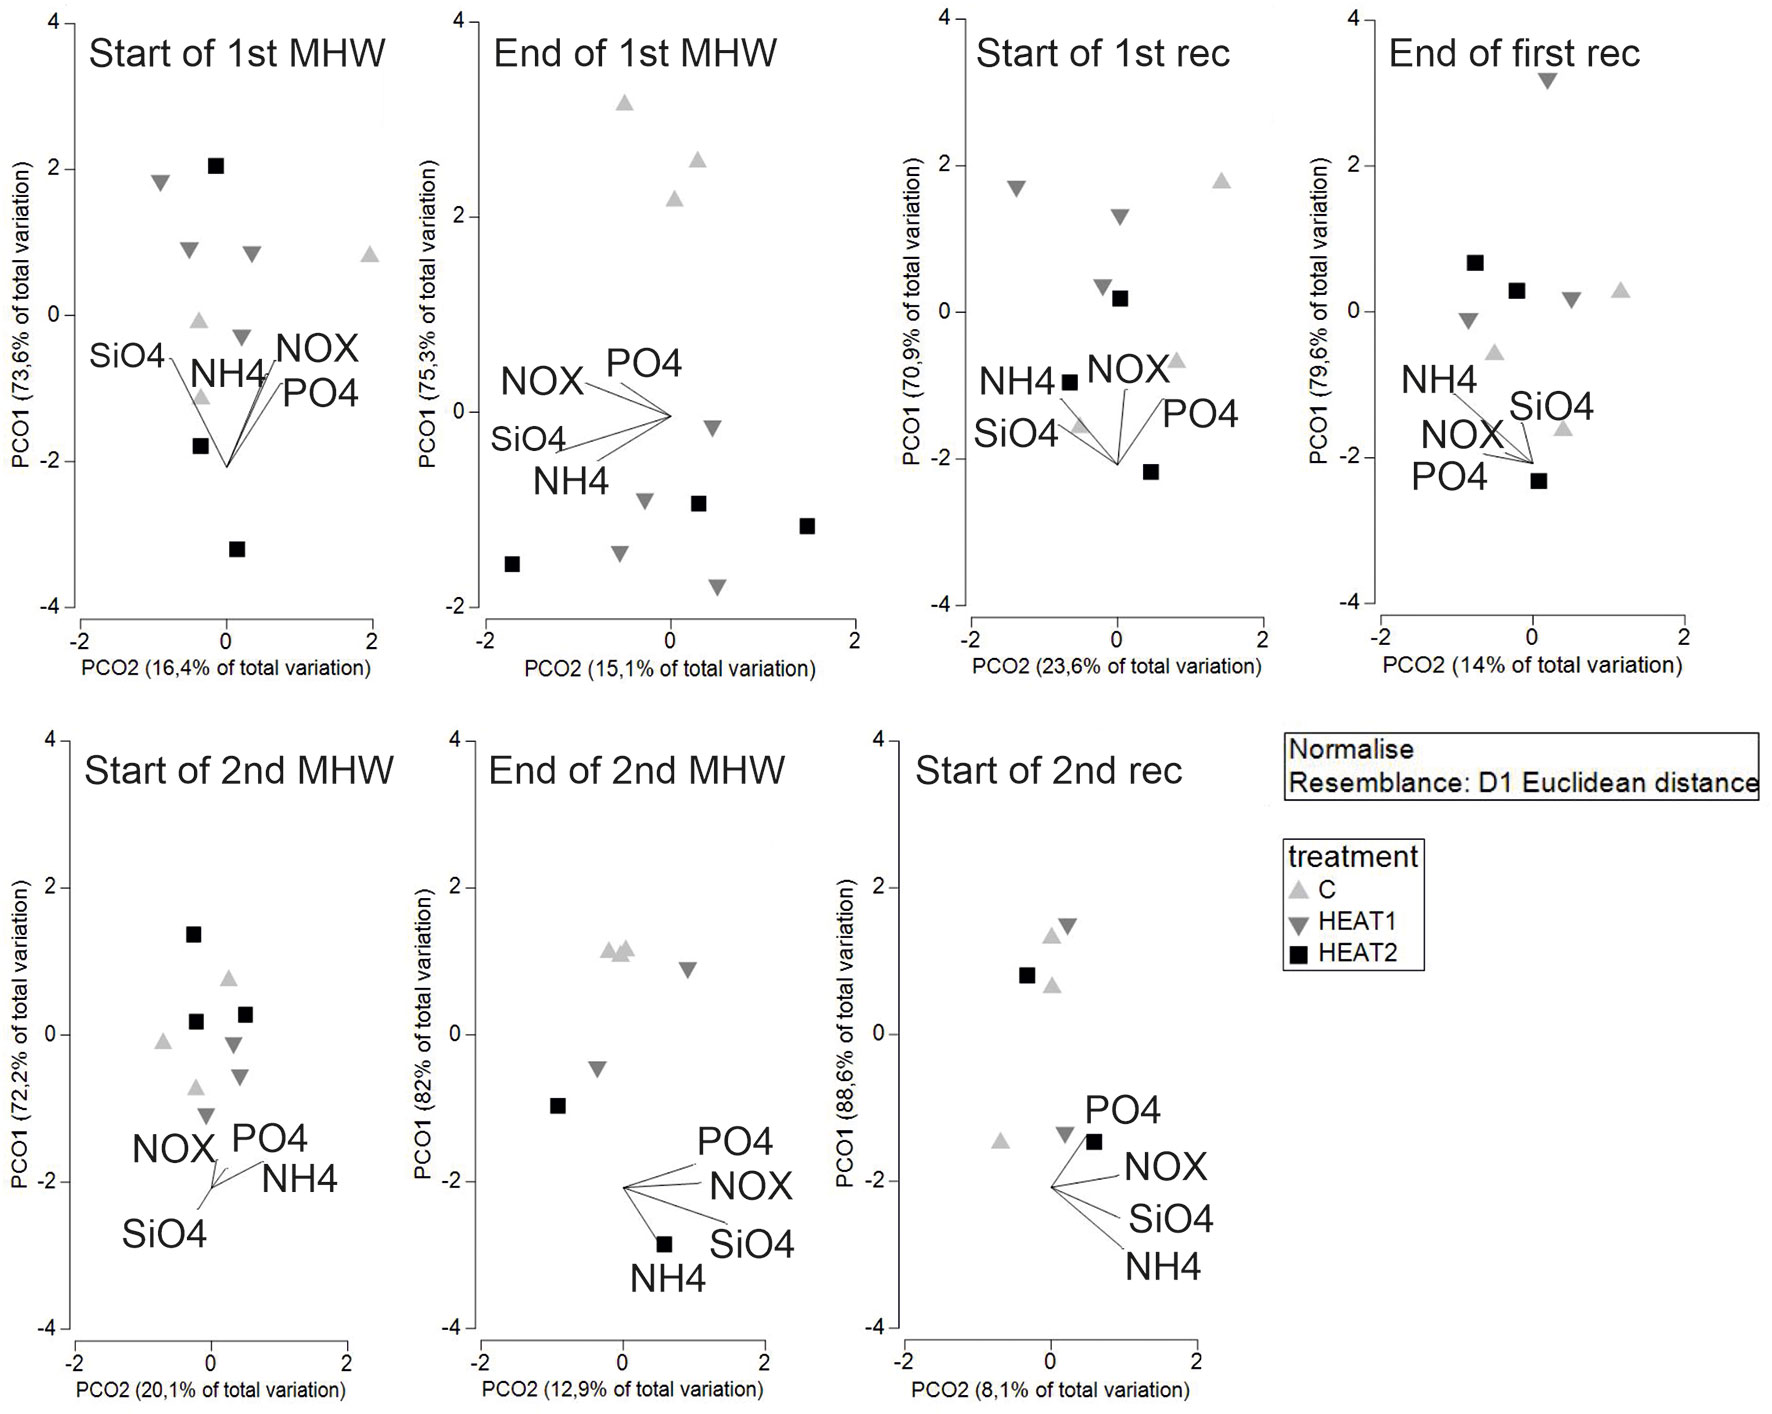
Figure 6 PCO graphs showing the multivariate dispersion of fluxes in the different experimental phases. The vectors represent the direction and magnitude of correlation of the different fluxes with the PCO axes.
There were significant within-treatment differences between the different experimental phases in the biogeochemical processes in HEAT1 and HEAT2 and an almost significant difference in the control (CONTROL: Pseudo-F 1.93, P 0.06; HEAT1: Pseudo-F 4.98, P 0.0001; HEAT2: Pseudo-F 2.53, P 0.01). For the CONTROL treatment, the pair-wise comparisons were not significant at the P=0.05 level. There was a decrease in all the fluxes, except silicate, in the CONTROL treatment throughout the experiment (Supplementary Figure 2). Pairwise comparisons within HEAT1 (Table 1) revealed significant differences between H1_start and H1_end (t 3.04, P 0.003) and H2_start (t 3.78, P 0.002), H1_end and R1_start (t 2.98, P 0.005) and H2_start (t 5.06, P 0.001). In HEAT1, there was also a decrease in all solute fluxes excluding phosphate throughout the course of the experiment (Supplementary Figure 2). Pairwise comparisons in HEAT2 (Table 1) revealed significant differences between H1_end and R1_start (t 3.20 P 0.01), H1_end and R1_end (t3.04, P 0.01), H1_end and H2_start (t 3.95, P 0.004), H1_end and H2_end (t 2.20, P 0.05) and H1_end and R2_start (t 2.76, P 0.03). In HEAT2, no clear overall increase or decrease in the fluxes were observed, rather the heatwaves could be separated from the recovery phases with higher effluxes at the end of the heatwaves (Figure 6).

Table 1 Pair-wise comparisons of the multivariate biogeochemical flux within treatments HEAT1 and HEAT2 (PERMANOVA).
3.6 Sediment characteristics and porewater
The two replicate surface sediment samples taken at the end of the experiment were averaged per treatment (n=8 per treatment). The amount of organic carbon was highest in CONTROL (422.1 ± 112.0 μg) and lowest in HEAT2 (390.6 ± 85.6 μg), whereas in HEAT1, the amount of organic carbon was slightly lower than in CONTROL (416.9 ± 96.3 μg). The C/N ratio was highest in HEAT2 (9.4 ± 0.8) and lowest in CONTROL (9.0 ± 0.9), whereas the C/N ratio in HEAT1 was again slightly higher than in CONTROL (9.1 ± 0.8).
In the porewater in CONTROL and HEAT1 treatments, there was a build-up of NH4-N, PO4-P and Si in the porewater below 4 cm depth towards the end of the experiment (Figure 7). NOx-N profiles did not show any difference through time in CONTROL but had a surface peak in HEAT1 at the end of the first and second recovery phases. In HEAT2, on the other hand, the amount of NH4-N, PO4-P and Si in the porewater after 5 cm depth was highest at the end of the second heatwave and lowest at the end of the second recovery period. Similarly to HEAT1, there was a surface peak in NOX-N at the end of the first and second heatwaves, and at the end of the second recovery.
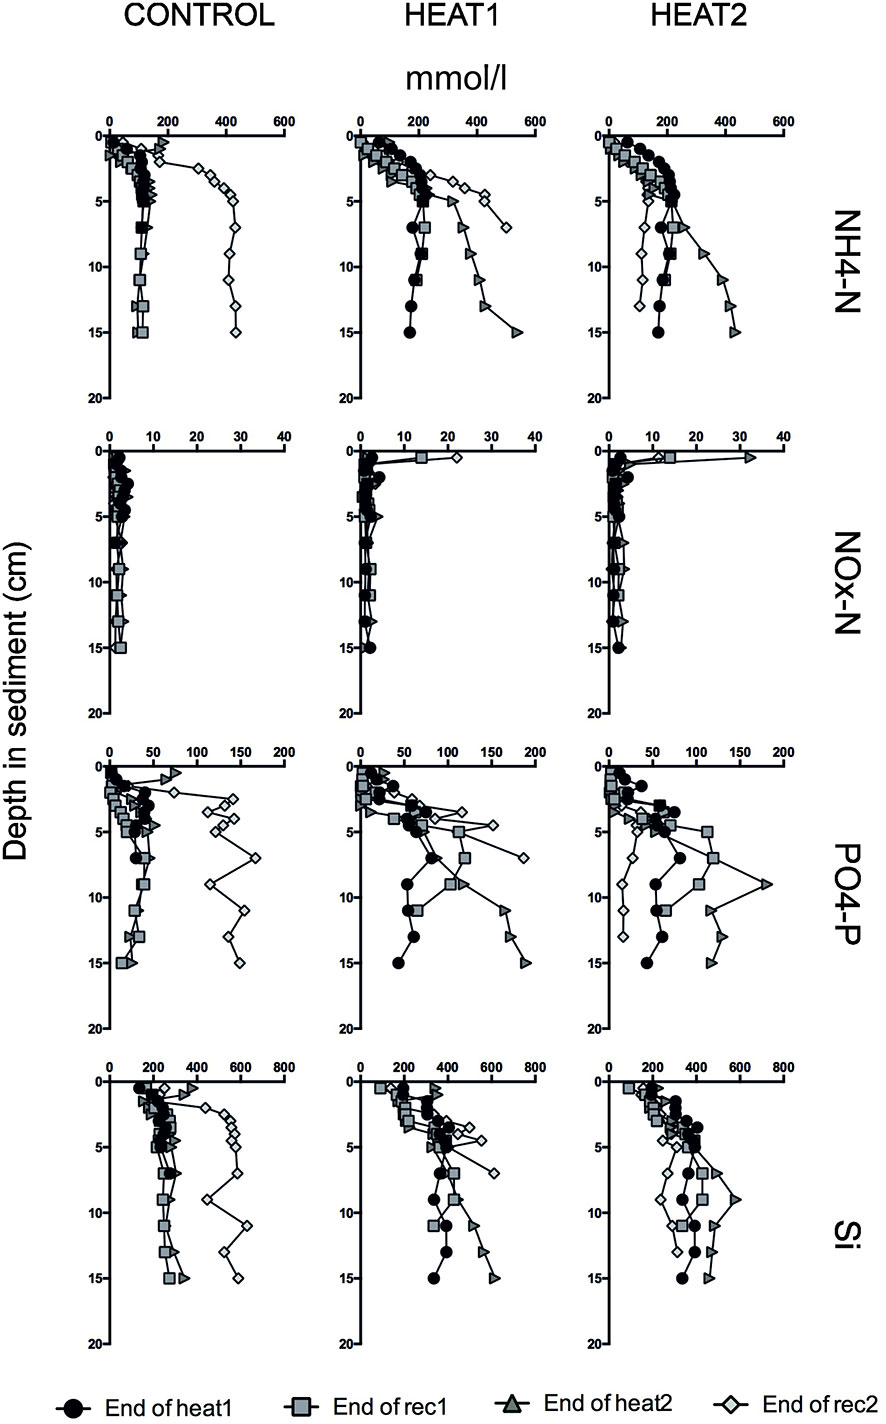
Figure 7 Porewater profiles for NH4-N (first row), NOx-N (second row), PO4-P (third row) and Si (last row) from GEMAX cores kept at the same temperature conditions with the experimental units and analyzed at the end of each experimental phase. On the y-axis is the depth of the sediment and on the x-axis the concentration of the solute in mmol/l.
4 Discussion
Given the context-dependent interactions between macrofauna community composition, bioturbation and nutrient cycling, it is essential to measure a wide range of variables together for a more comprehensive understanding of ecosystem functioning when the context (environment) and/or the macrofauna community or bioturbation changes. Since the mean temperature of the oceans and the frequency of heatwaves is increasing, it is imperative to explore the effects of MHWs on the mechanistic effect of macrofauna bioturbation and the associated biogeochemical processes (nutrient cycling). The results of this study indicate an increase in bioturbation activities of macrofauna during short-term, strong heatwaves compared to control temperatures. This increase matches an increase in the biogeochemical cycling of nutrients measured as fluxes of solutes across the sediment-water interface. The increase in sediment oxygen consumption during the heatwaves is likely a consequence of both increased macro- and meiofaunal (bioturbation) as well as microbial (decomposition) activities (Glud, 2008). Oxygen consumption as well as the bioturbation activities and fluxes seem to return to the same level with the control during the recovery phase following the heatwave. A repeated, strong heatwave induced a similar response. During the repeated heatwave, we also observed a difference between treatments in the increase of the penetration depth of tracers that was clearly more marked when considering the first layer of tracers spread in the beginning of the experiment than the second one (spread in the beginning of the second heatwave). This indicates that subsurface sediment is more affected than the surface layer by the enhanced bioturbation activities induced by the heatwave. This corresponds to a known effect of increased temperature on subsurface activity (corresponding to increased foraging for food and burrow maintenance activities) and subsequent bioturbation rates observed in the tellinid bivalves of the genus Abra (Maire et al., 2007; Bernard et al., 2016) or burrowing polychaetes (Ouellette et al., 2004; Braeckman et al., 2010). The species mostly responsible for subsurface bioturbation in the soft sediments of the study area are the bivalve Macoma balthica and polychaete Marenzelleria spp. (Kauppi et al., 2018; Bernard et al., 2019a).
To be considered a heatwave, the period of abnormally high temperature must be at least of 5 days in duration (Hobday et al., 2016; Hobday et al., 2018; Oliver et al., 2021) but is a short-term MHW enough to induce a change? According to the results of this study the answer is yes, a short-term, repeated MHW was enough to generate a significant response in both the bioturbation of the animals and the biogeochemical processes. Kauppi and Villnäs (2022) detected a similar change in solute fluxes in their short-term moderate heatwave treatment but the effect on bioturbation was less clear. Their strong heatwave treatment peaking at approximately 17°C, however, showed significantly decreased activity based on oxygen consumption, which they considered mostly being due to a shutdown of microbial degradation processes under the strong heatwave conditions since macrofauna still seemed to remain active. In this experiment, the highest amount of organic carbon was lost in the repeated heatwaves treatment. This treatment also had the highest C/N ratio indicating most degraded material. Additionally, the increase in sediment mixing depth was most notable and the porewater profiles indicated lowest concentrations of dissolved solutes in the deeper layers after repeated heatwaves. This implies that the higher activity of macrofauna enhanced the diffusion of solutes from the sediment to the water column and contributed to an increase in the organic matter degradation processes. This contribution was probably both direct through consumption (Kristensen et al., 1992) to meet the higher energetic demand induced by increased activity, and indirect through enhancing microbial activity (Yazdani Foshtomi et al., 2015). Meiofauna, which was not analyzed in this experiment, also has the potential to greatly enhance microbial communities as well as oxygen consumption of the sediment (Bonaglia et al., 2020) and undoubtedly contributed to the increased sediment oxygen consumption observed during the heatwaves.
Microbial processes are central to carbon cycling and their response to warming in marine environments should be included in experiments combining mechanistic effects and bioturbation of macrofauna to biogeochemical processes given the tight links existing between these compartments. Tamelander et al. (2017) suggested that heterotrophic processes in the pelagic compartment would become more important with warmer climate leading to a decrease in organic matter input to the seafloor, resulting in less biomass production (Ehrnsten et al., 2020). Based on the decrease in organic carbon content and increase in C/N ratio in this experiment following repeated, strong heatwaves, organic matter consumption and degradation in the seafloor could also become more efficient with warming thus, at some point, substrate depletion could decrease microbial activity. The low sediment mixing activities of macrofauna in the CONTROL treatment and during the long recovery period of the HEAT1 treatment contributed to a build-up of dissolved nutrients in the sediment as observed from the porewater profiles. This seems to also be the reason for the change in the direction of the solute fluxes from effluxes to influxes towards the end of the experiment in these treatments. Although the differences in carbon and nitrogen content between the treatments are not massive and the porewater profiles are not replicated, the results support each other, highlighting again the importance of studying a range of variables to discern the respective contributions of biological and environmental variables to ecosystem functioning in a changing environment.
Many ecosystems especially along the heavily populated coastlines are already under multiple anthropogenic pressures such as eutrophication, habitat destruction and overfishing (Cloern et al., 2016) on top of which the global climate change further affects ecosystems and their functioning worldwide (Smale et al., 2019). The potential for recovery of an ecosystem after disturbance, such as MHWs, varies depending on the duration and spatial extent of the disturbance event (Thrush and Dayton, 2002). Both the biogeochemical processes as well as the macrofauna activities in this experiment seemed to recover to the control level after the first experimentally induced, strong short-term heatwave. Unfortunately, we could not follow the recovery after the repeated short-term event due to loss of experimental units to leakage, but the immediate response after the repeated heatwave at the start of the (second) recovery period suggested no differences between the treatments. Nevertheless, resources (organic carbon) after the repeated event were more depleted, suggesting that the reason for a decrease in solute fluxes after the repeated heatwaves to a level comparable to the control, could be a combination of lack of material for degradation processes and decreased activity of macrofauna. In the control and after one short-term heatwave, on the other hand, material was still (readily) available. Thus, the system seems to have recovered but despite the similar outcome in terms of ecosystem functioning, the effect of the disturbance on the quantity and quality of resources in the seafloor could in fact have changed the respective contributions of macrofauna and microbial activity and purely diffusional processes to biogeochemical processes. Studies with longer-term heatwaves of different categories are needed to assess the resilience of the ecosystem to MHWs more thoroughly.
Given the multiple stressors affecting marine ecosystems, heatwaves can and probably will co-occur with other stressors, such as hypoxia (Vaquer-Sunyer & Duarte, 2011; Gruber et al., 2021). Field observations from the Baltic Sea (Tvärminne Zoological Station benthic monitoring program, unpublished data) also indicate increased mortality of Macoma balthica following first a prolonged MHW and then the occurrence of a hypoxic event. This highlights the need to include multiple stressors in future studies. Species-specific differences in their response to disturbances, such as MHWs, should also be considered in more detail. Differences in adaptive strategies have been observed for example in fiddler crabs (da Silva Vianna et al., 2020) and limpets (Redfern et al., 2021). Given the low species diversity in the Baltic Sea, changes in the bioturbation, as observed in our experiment, or survival of even one species following an MHW can have substantial effects on the functioning of the system.
In contrast to our results, results from earlier studies indicate a lack of effects of short-term, moderate MHWs (e.g. Crespo et al., 2017; Dolbeth et al., 2021). These studies were, however, conducted on intertidal estuarine populations, naturally subject and adapted to higher and more frequent daily variations of temperature and could therefore tolerate the changes induced by the simulated heatwave (Dolbeth et al., 2021). Nevertheless, our ability to detect significant differences in sediment mixing metrics in response to heatwave also results from the methodological choice of monitoring the distribution of particle tracers through time. Although sensitive to functional trait composition of the animal community and habitat structure (Hale et al., 2014; Crespo et al., 2017), the comparison of the same, but non-time integrated metrics did not end in the detection of significant heatwave effects (Crespo et al., 2017). Following a similar approach to this study, Dolbeth et al. (2021) noted that, although non-significant, “more evident” trends were detected when using time-integrated metrics.
The results of this study clearly demonstrate the potential of even short-term MHWs to alter species burrowing and burrow ventilation activities linked to ecosystem functioning. Significant changes in nutrient cycling in this study were observed earlier than changes in the underlying mechanistic effect of bioturbation. The environmental context (chemical composition of sediment and porewater, organic matter content) also changed following the MHWs, and while the results demonstrate a quick recovery in terms of both bioturbation and the associated solute fluxes even from repeated short-term events, the relative contribution of different factors remains altered after disturbance. The indications of stress responses in this study across a range of variables from environmental and biological to biogeochemical highlights the need to include different types of evidence for a comprehensive understanding of the changes happening in the system as both the environment and the functioning of the organisms are altered. It also implies the concerning fact that already the realised increase in the frequency and intensity of MHWs currently observed (Göbeler et al., 2022) may induce system-wide impacts. There are still important gaps in our knowledge that warrant future studies with regards to for example microbial processes, duration of the heatwaves and multiple stressor effects not only in the Baltic Sea but in marine environments globally.
Data availability statement
The raw data supporting the conclusions of this article will be made available by the authors, without undue reservation.
Author contributions
LK designed and conducted the experiment, performed the data analysis and wrote the manuscript, NG designed and conducted the experiment, JN and AN participated in designing the experiment and provided substantial comments on the manuscript, AR-R participated in the design and substantially contributed to the image analysis and acquisition of data, GB designed the experiment, processed and analyzed the bioturbation data and provided substantial comments on the manuscript. All authors contributed to the article and approved the submitted version.
Funding
Funding for the project was received from Walter and Andrée de Nottbeck Foundation (personal grants to LK, NG and JN), as well as from the ASSEMBLE Plus project (European Union’s Horizon 2020 research and innovation programme grant agreement No 730984) to GB and AR-R and the Centre for Coastal Ecosystem and Climate Change Research to AN.
Acknowledgments
We thank Göran Lundberg and Jostein Solbakken for their invaluable help with sampling and handling of the samples and development of the mesocosm space. This study has utilized research infrastructure facilities provided by FINMARI (Finnish Marine Research Infrastructure network).
Conflict of interest
The authors declare that the research was conducted in the absence of any commercial or financial relationships that could be construed as a potential conflict of interest.
Publisher’s note
All claims expressed in this article are solely those of the authors and do not necessarily represent those of their affiliated organizations, or those of the publisher, the editors and the reviewers. Any product that may be evaluated in this article, or claim that may be made by its manufacturer, is not guaranteed or endorsed by the publisher.
Supplementary material
The Supplementary Material for this article can be found online at: https://www.frontiersin.org/articles/10.3389/fmars.2022.1070377/full#supplementary-material
References
Amorim V. E., Gonçalves O., Capela R., Fernández-Boo S., Oliveira M., Dolbeth M., et al. (2020). Immunological and oxidative stress responses of the bivalve Scrobicularia plana to distinct patterns of heatwaves. Fish Shellf. Immunol. 106 (June), 1067–1077. doi: 10.1016/j.fsi.2020.09.024
Anderson M. J., Gorley R. N., Clarke K. R. (2008). Permanova+ for primer: guide to software and statistical methods (Plymouth: PERIMER-e).
Bernard G., Duchêne J.-C., Romero-Ramirez A., Lecroart P., Maire O., Ciutat A., et al. (2016). Experimental assessment of the effects of temperature and food availability on particle mixing by the bivalve Abra alba using new image analysis techniques. PloS One 11, e0154270. doi: 10.1371/journal.pone.0154270
Bernard G., Gammal J., Järnström M., Norkko J., Norkko A. (2019a). Quantifying bioturbation across coastal seascapes: Habitat characteristics modify effects of macrofaunal communities. J. Sea Res. 152, 101766. doi: 10.1016/j.seares.2019.101766
Bernard G., Romero-Ramirez A., Tauran A., Pantalos M., Deflandre B., Grall J., et al. (2019b). Declining maerl vitality and habitat complexity across a dredging gradient: Insights from in situ sediment profile imagery (SPI). Sci. Rep. 9 (1), 1–12. doi: 10.1038/s41598-019-52586-8
Bonaglia S., Hedberg J., Marzocchi U., Iburg S., Glud R. N., Nascimento F. J. (2020). Meiofauna improve oxygenation and accelerate sulfide removal in the seasonally hypoxic seabed. Mar. Environ. Res. 159, 104968. doi: 10.1016/j.marenvres.2020.104968
Braeckman U., Provoost P., Gribsholt B., Van Gansbeke D., Middelburg J. J., Soetaert K., et al. (2010). Role of macrofauna functional traits and density in biogeochemical fluxes and bioturbation. Mar. Ecol. Prog. Ser. 399 (January), 173–186. doi: 10.3354/meps08336
Cloern J. E., Abreu P. C., Carstensen J., Chauvaud L., Elmgren R., Grall J., et al. (2016). Human activities and climate variability drive fast-paced change across the world's estuarine–coastal ecosystems. Global Change Biol. 22 (2), 513–529. doi: 10.1111/gcb.13059
Crespo D., Grilo T. F., Baptista J., Coelho J. P., Lillebø A. I., Cássio F., et al. (2017). New climatic targets against global warming: will the maximum 2° c temperature rise affect estuarine benthic communities? Sci. Rep. 7 (1), 1–14. doi: 10.1038/s41598-017-04309-0
da Silva Vianna B., Miyai C. A., Augusto A., Costa T. M. (2020). Effects of temperature increase on the physiology and behavior of fiddler crabs. Physiol. Behav. 215, 112765. doi: 10.1016/j.physbeh.2019.112765
Dolbeth M., Babe O., Costa D. A., Mucha A. P., Cardoso P. G., Arenas F. (2021). Benthic estuarine communities' contribution to bioturbation under the experimental effect of marine heatwaves. Sci. Rep. 11 (1), 1–11. doi: 10.1038/s41598-021-90720-7
Ehrnsten E., Norkko A., Müller-Karulis B., Gustafsson E., Gustafsson B. G. (2020). The meagre future of benthic fauna in a coastal sea–benthic responses to recovery from eutrophication in a changing climate. Global Change Biol. 26 (4), 2235–2250. doi: 10.1111/gcb.15014
Elmgren R., Hill C. (1997). Ecosystem function at low biodiversity–the Baltic example. Mar. biodivers.: patterns process., 319–336. doi: 10.1017/CBO9780511752360.015
Fox M. D., Cohen A. L., Rotjan R. D., Mangubhai S., Sandin S. A., Smith J. E., et al. (2021). Increasing coral reef resilience through successive marine heatwaves. Geophys. Res. Lett. 48 (17), e2021GL094128. doi: 10.1029/2021GL094128
Frölicher T. L., Fischer E. M., Gruber N. (2018). Marine heatwaves under global warming. Nature 560 (7718), 360–364. doi: 10.1038/s41586-018-0383-9
Frölicher T. L., Laufkötter C. (2018). Emerging risks from marine heat waves. Nat. Commun. 9 (1), 1–4. doi: 10.1038/s41467-018-03163-6
Gammal J., Järnström M., Bernard G., Norkko J., Norkko A. (2019). Environmental context mediates biodiversity–ecosystem functioning relationships in coastal softsediment habitats. Ecosystems 22, 137–151. doi: 10.1007/s10021-018-0258-9
Gillooly J. F., Brown J. H., West G. B., Savage V. M., Charnov E. L. (2001). Effects of size and temperature on metabolic rate. science 293 (5538), 2248–2251. doi: 10.1126/science.10619
Glud R. N. (2008). Oxygen dynamics of marine sediments. Mar. Biol. Res. 4 (4), 243–289. doi: 10.1080/17451000801888726
Göbeler N., Norkko A., Norkko J. (2022). Ninety years of coastal monitoring reveals baseline and extreme ocean temperatures are increasing off the Finnish coast. Commun. Earth Environ. 3 (1), 1–11. doi: 10.1038/s43247-022-00545-z
Griffiths J. R., Kadin M., Nascimento F. J. A., Tamelander T., Törnroos A., Bonaglia S., et al. (2017). The importance of benthic–pelagic coupling for marine ecosystem functioning in a changing world. Global Change Biol. 23 (6), 2179–2196. doi: 10.1111/gcb.13642
Gruber N., Boyd P. W., Frölicher T. L., Vogt M. (2021). Biogeochemical extremes and compound events in the ocean. Nature 600 (7889), 395–407. doi: 10.1038/s41586-021-03981-7
Hale R., Mavrogordate M. N., Tolhurst T. J., Solan M. (2014). Characterizations of how species mediate ecosystem properties require more comprehensive functional effect descriptors. Sci. Rep. 4, 6463. doi: 10.1038/srep06463
Harvey B. P., Gwynn-Jones D., Moore P. J. (2013). Meta-analysis reveals complex marine biological responses to the interactive effects of ocean acidification and warming. Ecol. Evol. 3 (4), 1016–1030. doi: 10.1002/ece3.516
Hobday A. J., Alexander L. V., Perkins S. E., Smale D. A., Straub S. C., Oliver E. C., et al. (2016). A hierarchical approach to defining marine heatwaves. Prog. Oceanogr. 141, 227–238. doi: 10.1016/j.pocean.2015.12.014
Hobday A. J., Oliver E. C. J., Gupta A. S., Benthuysen J. A., Burrows M. T., Donat M. G., et al. (2018). Categorizing and naming marine heatwaves. Oceanography 31 (2), 162–173. doi: 10.5670/oceanog.2018.205
Horwitz R., Norin T., Watson S. A., Pistevos J. C., Beldade R., Hacquart S., et al. (2020). Near-future ocean warming and acidification alter foraging behaviour, locomotion, and metabolic rate in a keystone marine mollusc. Sci. Rep. 10 (1), 1–11. doi: 10.1038/s41598-020-62304-4
IPCC (2021). Summary for Policymakers. In: Climate Change 2021: The Physical Science Basis. In Masson-Delmotte V., Zhai P., Pirani A., Connors S. L., Péan C., Berger S., et al eds. Contribution of Working Group I to the Sixth Assessment Report of the Intergovernmental Panel on Climate Change. Cambridge University Press.
Kauppi L., Bernard G., Bastrop R., Norkko A., Norkko J. (2018). Increasing densities of an invasive polychaete enhance bioturbation with variable effects on solute fluxes. Sci. Rep. 8 (1), 1–12. doi: 10.1038/s41598-018-25989-2
Kauppi L., Norkko J., Ikonen J., Norkko A. (2017). Seasonal variability in ecosystem functions: quantifying the contribution of invasive species to nutrient cycling in coastal ecosystems. Mar. Ecol. Prog. Ser. 572, 193–207. doi: 10.3354/meps12171
Kauppi L., Norkko A., Norkko J. (2015). Large-Scale species invasion into a low-diversity system: spatial and temporal distribution of the invasive polychaetes marenzelleria spp. in the Baltic Sea. Biol. Invasion. 17 (7), 2055–2074. doi: 10.1007/s10530-015-0860-0
Kauppi L., Villnäs A. (2022). Marine heatwaves of differing intensities lead to distinct patterns in seafloor functioning. Proc. R. Soc. B 289 (1986), 20221159. doi: 10.1098/rspb.2022.1159
Kristensen E., Andersen F. Ø., Blackburn T. H. (1992). Effects of benthic macrofauna and temperature on degradation of macroalgal detritus: the fate of organic carbon. Limnol. Oceanogr. 37 (7), 1404–1419. doi: 10.4319/lo.1992.37.7.1404
Kristensen E., Penha-Lopes G., Delefosse M., Valdemarsen T., Quintana C. O., Banta G. T. (2012). What is bioturbation? the need for a precise definition for fauna in aquatic sciences. Mar. Ecol. Prog. Ser. 446, 285–302. doi: 10.3354/meps09506
Lohrer A. M., Thrush S. F., Gibbs M. M. (2004). Bioturbators enhance ecosystem function through complex biogeochemical interactions. Nature 431 (7012), 1092–1095. doi: 10.1038/nature03042
Maire O., Duchêne J. C., Grémare A., Malyuga V. S., Meysman F. J. R. (2007). A comparison of sediment reworking rates by the surface deposit-feeding bivalve Abra ovata during summertime and wintertime, with a comparison between two models of sediment reworking. J. Exp. Mar. Biol. Ecol. 343, 21–36. doi: 10.1016/j.jembe.2006.10.052
Oliver E. C., Benthuysen J. A., Darmaraki S., Donat M. G., Hobday A. J., Holbrook N. J., et al. (2021). Marine heatwaves. Annu. Rev. Mar. Sci. 13, 313–342. doi: 10.1146/annurev-marine-032720-095144
Ouellette D., Desrosiers G., Gagne J. P., Gilbert F., Poggiale J. C., Blier P. U., et al. (2004). Effects of temperature on in vitro sediment reworking processes by a gallery biodiffusor, the polychaete Neanthes virens. Mar. Ecol. Prog. Ser. 266, 185–193. doi: 10.3354/meps266185
Pansch C., Scotti M., Barboza F. R., Al-Janabi B., Brakel J., Briski E., et al. (2018). Heat waves and their significance for a temperate benthic community: A near-naturalexperimental approach. Global Change Biol. 24, 4357–4367. doi: 10.1111/gcb.14282
Pascal L., Maire O., Deflandre B., Romero-Ramirez A., Grémare A. (2019). Linking behaviours, sediment reworking, bioirrigation and oxygen dynamics in a soft-bottom ecosystem engineer: The mud shrimp Upogebia pusilla (Petagna 1792). J. Exp. Mar. Biol. Ecol. 516, 67–78. doi: 10.1016/j.jembe.2019.05.007
Presley B., Claypool G. (1971). Techniques for analyzing interstitial water samples. Part 1 66, 1749–1755.
Redfern J. C., Foggo A., Mieszkowska N. (2021). Handling the heat: Responses of two congeneric limpet species to environmental temperature differences. J. Exp. Mar. Biol. Ecol. 536, 151500. doi: 10.1016/j.jembe.2020.151500
Reed D. C., Schmitt R. J., Burd A. B., Burkepile D. E., Kominoski J. S., McGlathery K. J., et al. (2022). Responses of coastal ecosystems to climate change: Insights from long-term ecological research. BioScience 72 (9), 871–888. doi: 10.1093/biosci/biac006
Smale D. A., Wernberg T., Oliver E. C., Thomsen M., Harvey B. P., Straub S. C., et al. (2019). Marine heatwaves threaten global biodiversity and the provision of ecosystem services. Nat. Climate Change 9 (4), 306–312. doi: 10.1038/s41558-019-0412-1
Snelgrove P. V. (1999). Getting to the bottom of marine biodiversity: sedimentary habitats: ocean bottoms are the most widespread habitat on earth and support high biodiversity and key ecosystem services. BioScience 49 (2), 129–138. doi: 10.2307/1313538
Solan M., Bennett E. M., Mumby P. J., Leyland J., Godbold J. A. (2020). Benthic-based contributions to climate change mitigation and adaptation. Philos. Trans. R. Soc. B 375 (1794), 20190107. doi: 10.1098/rstb.2019.0107
Solan M., Cardinale B. J., Downing A. L., Engelhardt K. A. M., Ruesink J. L., Srivastava D. S. (2004). Extinction and ecosystem function in the marine benthos. Science 306, 1177–1180. doi: 10.1126/science.1103960
Tamelander T., Spilling K., Winder M. (2017). Organic matter export to the seafloor in the Baltic Sea: Drivers of change and future projections. Ambio 46 (8), 842–851. doi: 10.1007/s13280-017-0930-x
Thrush S. F., Dayton P. K. (2002). Disturbance to marine benthic habitats by trawling and dredging: implications for marine biodiversity. Annu. Rev. Ecol. syst. 33, 449–473. doi: 10.1146/annurev.ecolsys.33.010802.150515
Vaquer-Sunyer R., Duarte C. M. (2011). Temperature effects on oxygen thresholds for hypoxia in marine benthic organisms. Global Change Biol. 17 (5), 1788–1797. doi: 10.1111/j.1365-2486.2010.02343.x
Verdelhos T., Marques J. C., Anastácio P. (2015). Behavioral and mortality responses of the bivalves Scrobicularia plana and Cerastoderma edule to temperature, as indicator of climate change's potential impacts. Ecol. Indic. 58, 95–103. doi: 10.1016/j.ecolind.2015.05.042
Wernberg T., Smale D. A., Tuya F., Thomsen M. S., Langlois T. J., De Bettignies T., et al. (2013). An extreme climatic event alters marine ecosystem structure in a global biodiversity hotspot. Nat. Climate Change 3 (1), 78–82. doi: 10.1038/nclimate1627
Woodin S., Volkenborn N., Pilditch C., Lohrer A. M., Wethey D. S., Hewitt J. E., et al. (2016). Same pattern, different mechanism: Locking onto the role of key species in seafloor ecosystem process. Sci. Rep. 6, 26678. doi: 10.1038/srep26678
Keywords: benthic macrofauna, bioturbation, ecosystem functioning, soft sediment, Baltic Sea, climate change
Citation: Kauppi L, Göbeler N, Norkko J, Norkko A, Romero-Ramirez A and Bernard G (2023) Changes in macrofauna bioturbation during repeated heatwaves mediate changes in biogeochemical cycling of nutrients. Front. Mar. Sci. 9:1070377. doi: 10.3389/fmars.2022.1070377
Received: 14 October 2022; Accepted: 28 December 2022;
Published: 16 January 2023.
Edited by:
Agneta Andersson, Umeå University, SwedenReviewed by:
Sabine Dittmann, Flinders University, AustraliaJan Marcin Weslawski, Institute of Oceanology, Polish Academy of Sciences, Poland
Regan Nicholaus, Mbeya University of Science and Technology, Tanzania
Copyright © 2023 Kauppi, Göbeler, Norkko, Norkko, Romero-Ramirez and Bernard. This is an open-access article distributed under the terms of the Creative Commons Attribution License (CC BY). The use, distribution or reproduction in other forums is permitted, provided the original author(s) and the copyright owner(s) are credited and that the original publication in this journal is cited, in accordance with accepted academic practice. No use, distribution or reproduction is permitted which does not comply with these terms.
*Correspondence: Laura Kauppi, bGF1cmEua2F1cHBpQGhlbHNpbmtpLmZp
†These authors have contributed equally