 Kristoffer Stedt
 Gunilla B. Toth
 Johan Davegård2
 Henrik Pavia
 Sophie Steinhagen
- 1Tjärnö Marine Laboratory, Department of Marine Sciences, University of Gothenburg, Strömstad, Sweden
- 2Independent researcher, Gothenburg, Sweden
There is an increasing interest in the cultivation of seaweeds for food and feed, and the seaweed aquaculture industry is rapidly developing. The nutritional status of the seaweeds is important to ensure a good quality crop. Cost-efficient and straightforward methods for farmers to analyze their crop are essential for the successful development of the industry. In this study, we developed non-destructive, labor- and cost-efficient models to estimate the nitrogen content in the crop seaweed Ulva fenestrata by color image analysis. We quantified tissue nitrogen content and thallus color in sea-farmed seaweed every week throughout a whole cultivation season (15 consecutive weeks) and analyzed data with linear regression models. We showed that color image analysis accurately estimated the nitrogen content in the seaweed (R2 = 0.944 and 0.827 for fresh tissue and dried powder, respectively), and through tenfold cross validation we showed that the developed models were robust and precise. Based on these models, we developed a web-based application that automatically analyzes the nitrogen content of U. fenestrata. Furthermore, we produced a color guide that can easily be brought to the farm for onsite crude estimation of the nitrogen content of U. fenestrata. Our results demonstrate that color can be a powerful tool for seaweed farmers (and researchers) to estimate seaweeds’ nutritional status. We anticipate that similar models can be developed for other commercially interesting seaweed species.
Introduction
In recent years there has been an increasing interest in the cultivation of seaweeds for food and feed. The global seaweed market is increasing exponentially and tripled in production during the last 20 years, reaching 32 million tonnes produced seaweeds annually (FAO, 2018; Duarte et al., 2022). Today, nearly 99% of the global seaweed production is produced in Eastern Asia (FAO, 2018), but as the European Commission’s Bioeconomy strategy and Green Deal is implemented (European Commission, 2018; European Commission, 2020a; European Commission, 2020b; European Commission, 2020c), the European seaweed aquaculture industry is expected to develop rapidly (Campbell et al., 2019; Araújo et al., 2021). Apart from boosting economic growth by investments in coastal communities and new employments (Barbier et al., 2019; Araújo et al., 2021), seaweed aquaculture is a sustainable alternative to traditional farming of land crops (Hasselström et al., 2018; Gephart et al., 2021; Stedt et al., 2022a). However, as for all new industries there are challenges and obstacles to overcome. For example, for food and feed purposes the nitrogen (N) content of the seaweeds is essential, as it directly correlates to the protein content (Angell et al., 2016; Biancarosa et al., 2017). However, the methods to measure nitrogen in biomass often requires laboratory procedures that are time consuming, expensive, and labor intensive. There is thus a need to develop alternative methods to estimate the nitrogen content of cultivated seaweeds that are cheap, rapid, and straightforward.
The color of seaweed thallus has been related to tissue nitrogen content (e.g. Nagler et al., 2003; Yu and Yang, 2008; Robertson-Andersson et al., 2009; Ashkenazi et al., 2022; Stedt et al., 2022a). Nitrogen is a major component of the chlorophyll molecule (Tumbo et al., 2002), and changes in chlorophyll content alters the color of the seaweed thallus (Robertson-Andersson et al., 2009). Therefore, the color of the seaweed thallus could possibly be used to give an estimation of the seaweed’s nitrogen content. We have previously reported that Ulva fenestrata Postels and Ruprecht with higher nitrogen content are darker, and more olive-green, as compared to seaweeds with lower nitrogen content (Stedt et al., 2022b; Steinhagen et al., 2022). Color image analysis that does not require any laboratory or technical skills could potentially provide a rapid and cost-efficient method to determine nitrogen content in seaweed tissues. For cultivated land plants, e.g. tomato seedlings (Mercado-Luna et al., 2010), sorghum (Zhang et al., 2022), quinoa and amaranth leaves (Riccardi et al., 2014), and paddy crops (Tewari et al., 2013), color image analysis has been used to develop models that assess their nitrogen content. However, to our knowledge, no models based on color image analysis have so far been developed for the quantitative estimation of nitrogen content in seaweeds.
The objective of this study was to develop a quick and easy-to-use model that estimates the nitrogen content (and hence protein content as it is correlated to the nitrogen content (Angell et al., 2016)) in the green seaweed U. fenestrata based on color image analysis. We did this by sampling sea cultivated U. fenestrata every week for 15 consecutive weeks during a full cultivation season of the crop (Steinhagen et al., 2022). We used digital images of both the fresh seaweed thallus and dried seaweed powder to obtain their color components. Simple and multiple regression analysis with the color components as independent variables and the true nitrogen content as the dependent variable were then tested and verified to find the best-fitting models. From these models, we aimed to develop a web-based image application intended to be used as a future practical tool for seaweed farmers and researchers to estimate the physiological status based on the nitrogen content of their crop. Our second objective was to produce a color guide for rapid and easy estimation of nitrogen content in U. fenestrata in the field. We did this by matching the seaweeds’ color to the closest Pantone® uncoated matt color code.
Materials and methods
Seaweed biomass and taxonomic identification
Vegetative thallus tissue of U. fenestrata were collected from a sea-based cultivation (2 ha; 100 x 200 m) located in the Koster archipelago (Skagerrak), Sweden (58°51’34.0”N, 11°04′06.2”E). Details on the seafarm and cultivation conditions can be found in Steinhagen et al. (2021); Steinhagen et al. (2022). Molecular identification of the algal material used in the present study has been described in detail by Toth et al. (2020) (GenBank accession numbers: MN240309, MN240310, MN240311).
U. fenestrata was seeded to cultivation twines and deployed in the seafarm at the 21st of September 2021, following the procedure described in Steinhagen et al. (2022). To obtain biomass with different nitrogen content, five replicates of U. fenestrata were harvested every week, at 15 defined consecutive time points, starting the 8th of March 2022 (Supplementary material 1; Table S1). This sampling procedure allowed for seaweed nitrogen content ranging from 0.54 to 5.22% dw (Supplementary material 1; Table S1).
Color determination
After harvest, seaweeds were brought to Tjärnö Marine Laboratory (TML, 58°52′33.7′′N 11°08′44.9′′E) where they were placed on a lightning table and photographed using a Canon EOS400D digital camera (1/25, F22, ISO400). For each image, a representative part of the seaweed thallus was analyzed for the mean of each pixel (0 – 255) for the three band colors red (R), green (G), and blue (B) (RGB-values), using a web-based image color summarizer (Krzywinski, 2022). The mean of the R, G, and B values, often referred to as intensity (I), was calculated using the equation:
After lyophilization, the seaweeds were homogenized into a fine powder. The powder was attached to transparent tape to allow for even distribution and representative pictures of the powder. The powder was photographed and analyzed following the same protocol as described for fresh tissue.
Furthermore, alternative representations of the RGB color model were analyzed as HSV (hue, saturation, value), LCH (lightness, chroma, hue), and Lab (lightness, visual perception of red-green chroma, visual perception of blue-yellow chroma). These results can be found in the Supplementary material 1.
To develop the color guide, we arranged the seaweeds into six different groups based on their nitrogen content, with one percentage point between each group (first group: 0 – 1% dw N, last group: 5 – 6% dw N). We then matched the R, G, and B values of each group to the nearest possible Pantone® uncoated matt color code using the Pantone® Connect color converter (Pantone®, 2022) and the Pantone® color print formula guide.
Nitrogen tissue content
The total nitrogen content was analyzed by combustion using a GSL elemental analyzer coupled to an isotope-ratio mass spectrometer (EA-IRMS, 20 – 22, Sercon Ltd., Crewe UK).
Regression models and model performances
The relationship between the color components and seaweed nitrogen content was analyzed with linear regression models, using Student’s t-test at 95% confidence levels. The color components (R, G, B, and I) were analyzed separately as single variables in simple linear regressions, and together in multiple regression models. Furthermore, the performance of the models was evaluated with tenfold cross validation to estimate the accuracy of the models. All data were analyzed in RStudio (v. 4.0.4). Based on the best-fitting models, a web-based application was built in Python (v. 3.10.8) using Dash (v. 2.3.1), and launched on Heroku, that analyzes the nitrogen content of U. fenestrata from uploaded images (Stedt and Davegård, 2022; Supplementary material 2).
Results
Regression of color and seaweed nitrogen content from fresh biomass
Negative linear relationships were observed between nitrogen content and the three band colors R (F1, 73 = 719, p< 0.001), G (F1, 73 = 498, p< 0.001), B (F1, 73 = 1098, p< 0.001), as well as for I (F1, 73 = 1067, p< 0.001). The determination coefficients (R2) were 0.908, 0.872, 0.938, and 0.936, respectively (Figure 1 and Table S2).
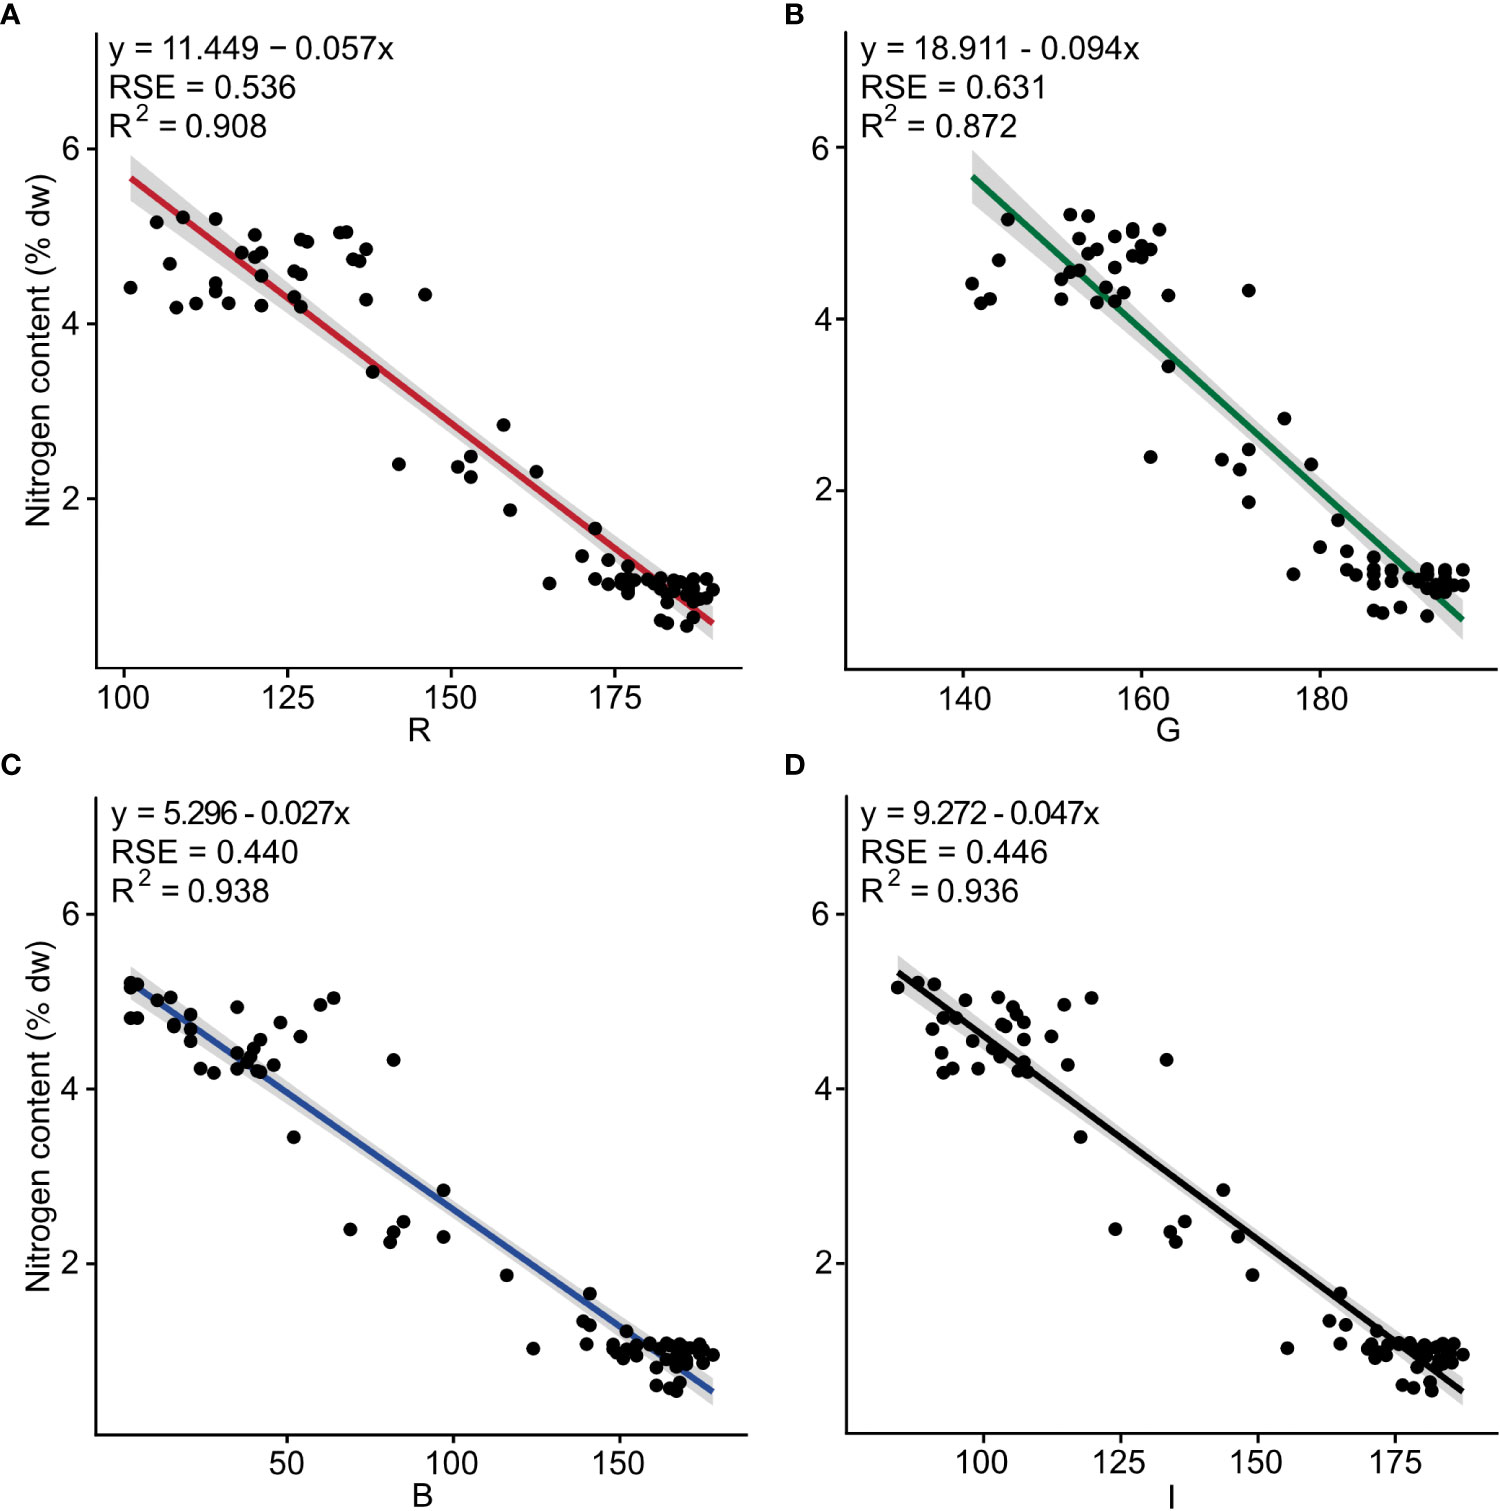
Figure 1 Nitrogen content (% dw) as a function of the independent color variables (A) red (R), (B) green (G), (C) blue (B) and (D) intensity (I) for fresh tissue of Ulva fenestrata (n = 75). The model, its residual standard error (RSE) and determination coefficient (R2) are displayed in the top left corner.
The multiple linear regression for nitrogen content and the color combination R + G + B showed a significant regression, where all band colors significantly affected the model (Table 1A). The model from the multiple linear regression was y = 3.782 - (0.034*R) + (0.035*G) - (0.021*B) (Table 1A and Table S3).
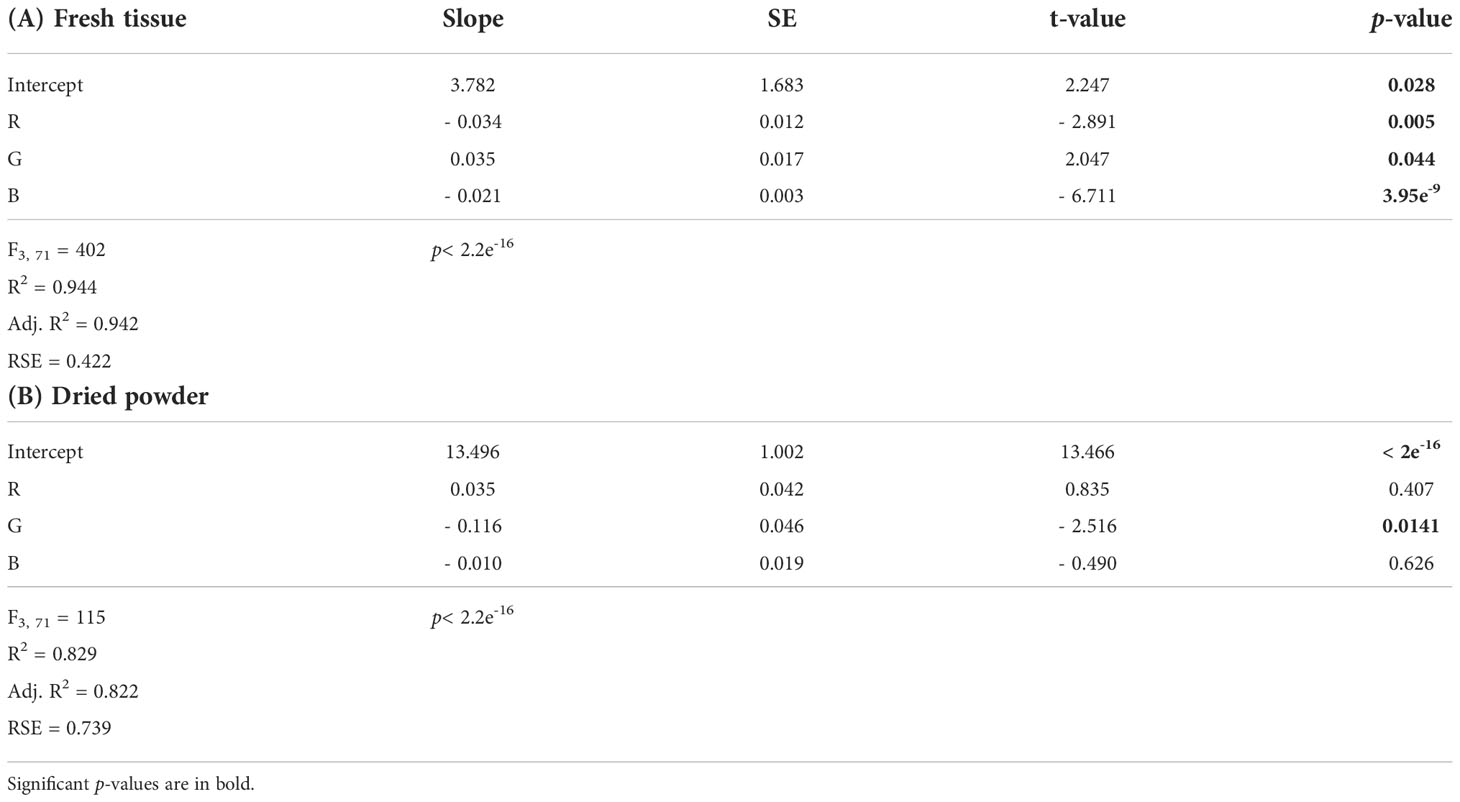
Table 1 Output from the multiple linear regression models for nitrogen content as a function of the independent color variables R + G + B for (A) fresh tissue and (B) dried powder of Ulva fenestrata.
The trained models from the tenfold cross validation were identical to the original models from the collected data, while the R2 from the trained models were even higher than from the original models (Table 2A). The final models from the tenfold cross validation verified that all the original models were robust and precise.
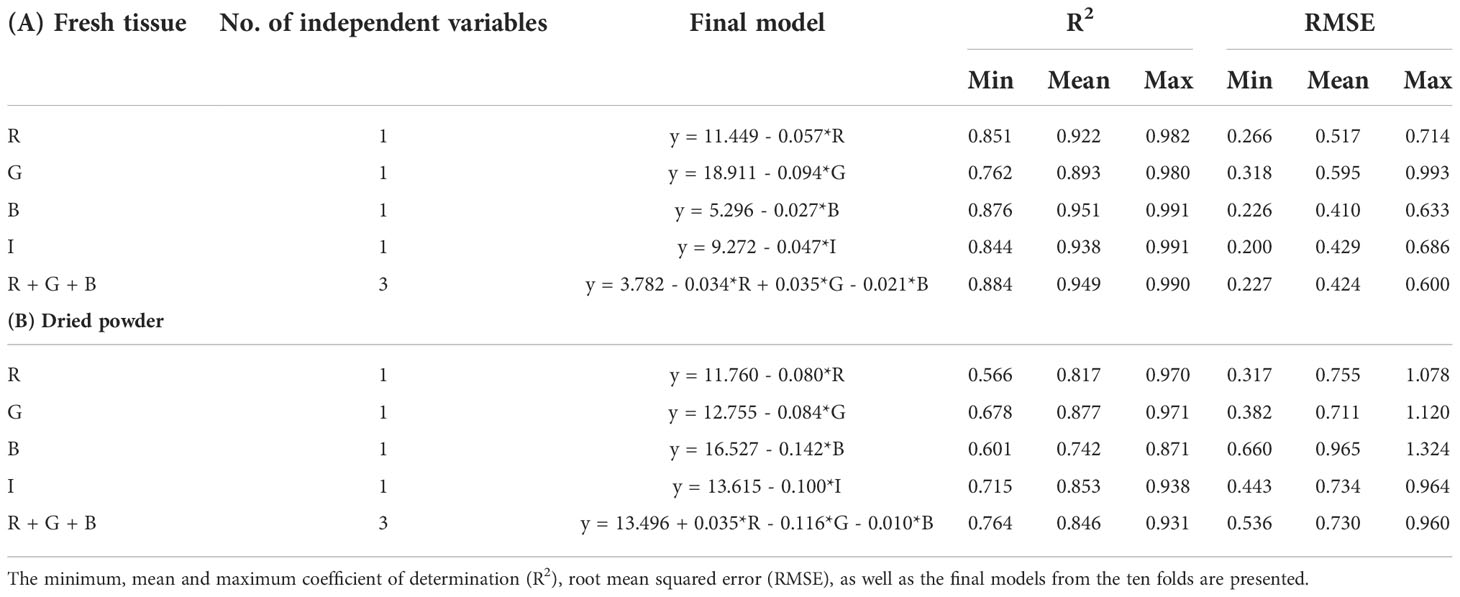
Table 2 Tenfold cross validation of the different models for (A) fresh tissue, and (B) dried powder of Ulva fenestrata.
Regression of color and seaweed nitrogen content from dried seaweed powder
Negative linear relationships were observed between nitrogen content and the three band colors R (F1, 73 = 311, p< 0.001), G (F1, 73 = 349, p< 0.001), B (F1, 73 = 164, p< 0.001), as well as for I (F1, 73 = 334, p< 0.001). The determination coefficient (R2) was 0.810, 0.827, 0.692, and 0.821, respectively (Figure 2 and Table S4).
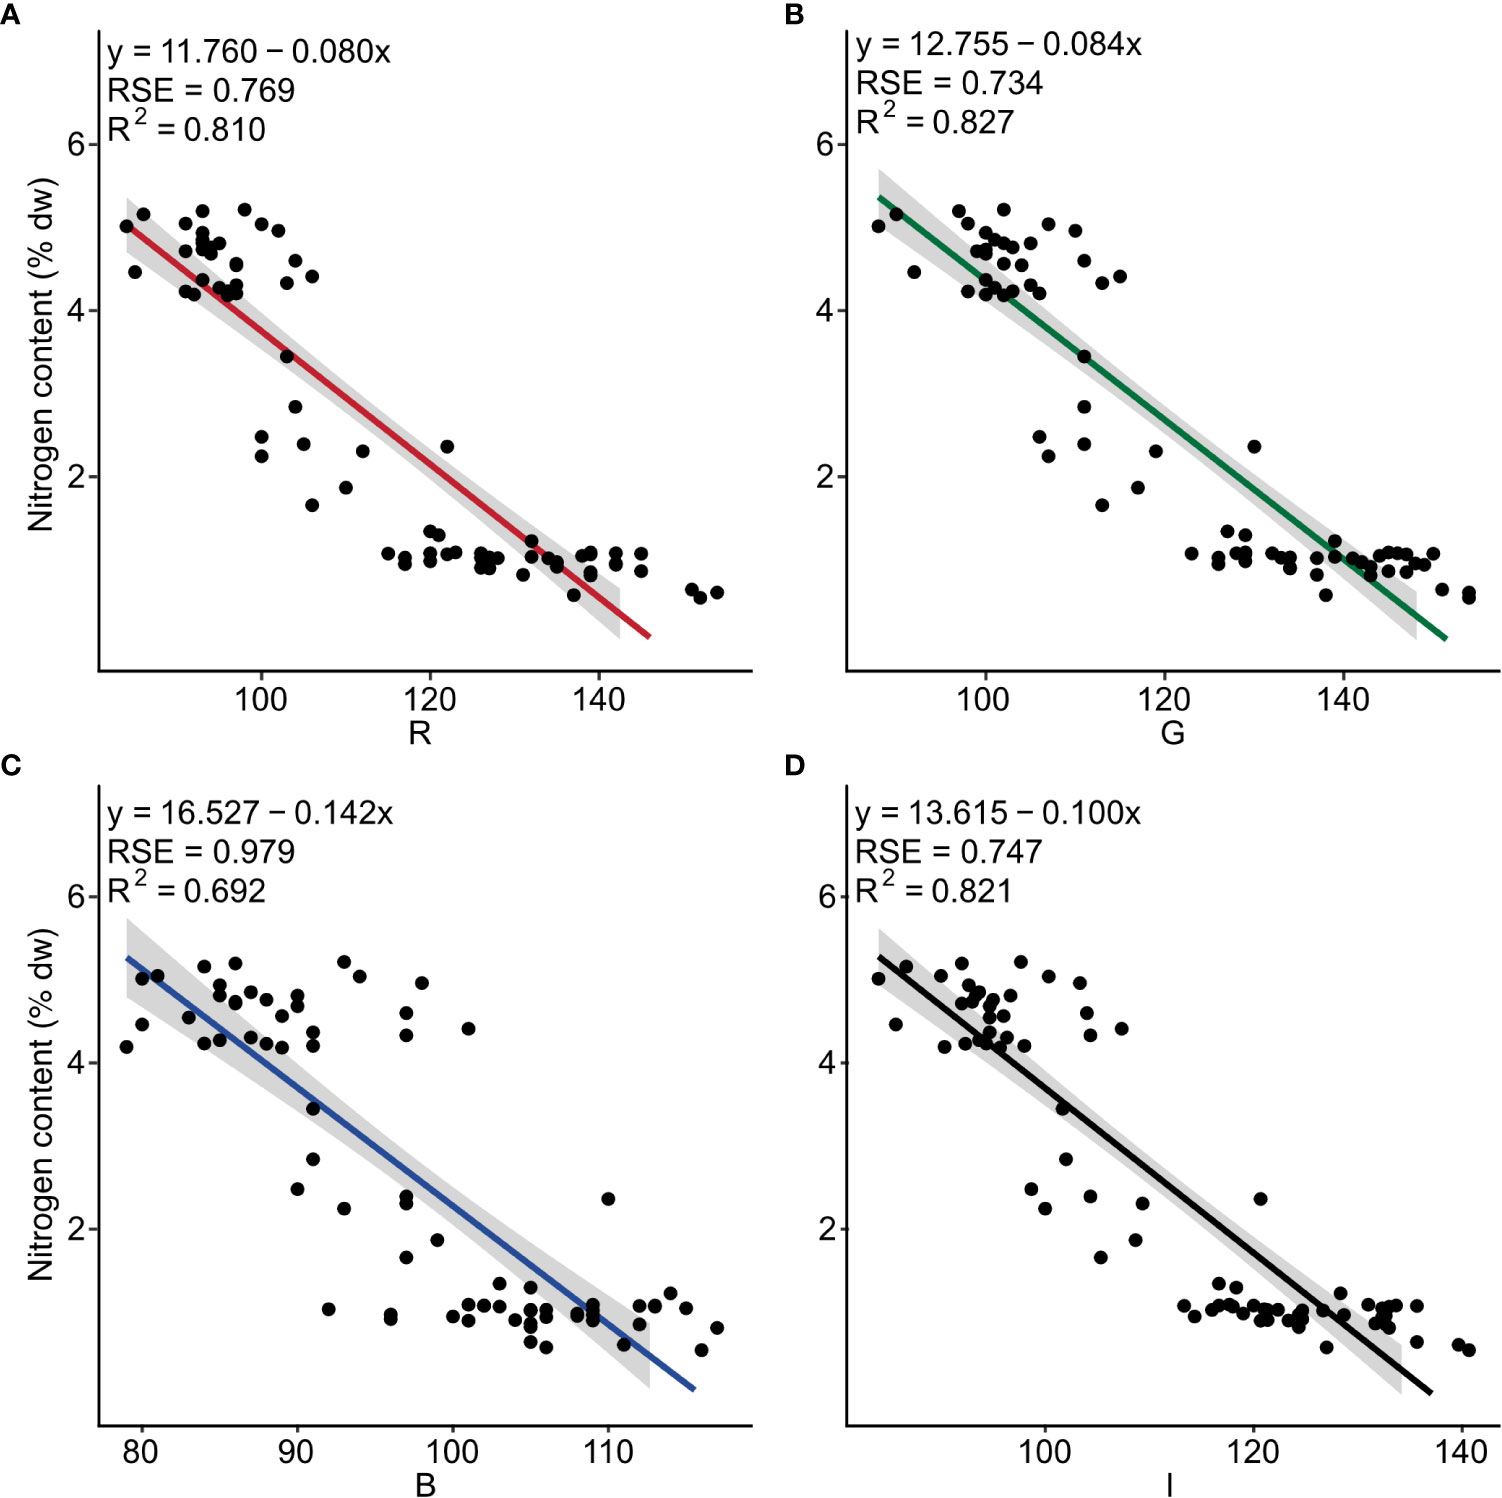
Figure 2 Nitrogen content (% dw) as a function of the independent color variables (A) red (R), (B) green (G), (C) blue (B) and (D) intensity (I) for dried powder of Ulva fenestrata (n = 75). The model, its residual standard error (RSE) and determination coefficient (R2) are displayed in the top left corner.
The multiple linear regression for nitrogen content and the color combination R + G + B showed a significant regression for the model y = 13.496 + (0.035*R) - (0.116*G) - (0.010*B) (Table 1B and Table S3). However, only the color variable G was significantly affecting the model (Table 1B), resulting in the best-fitting model being the simple linear model for G (as seen in Figure 2B).
The trained models from the tenfold cross validation were identical to the original models from the collected data, while the R2 from the trained models were even higher than from the original models (Table 2B). The final models from the tenfold cross validation verified that all the original models were robust and precise.
Color guide
As described by the linear regression models, the color of the seaweed tissue showed a transition between pale nitrogen starved tissue to deep colored nitrogen replete tissue (Figures 3A, B). For fresh tissue, the Pantone® color system cannot distinguish between 3 – 5% dw N content. While for dried powder the Pantone® color system cannot distinguish between 2 – 4% dw N content.
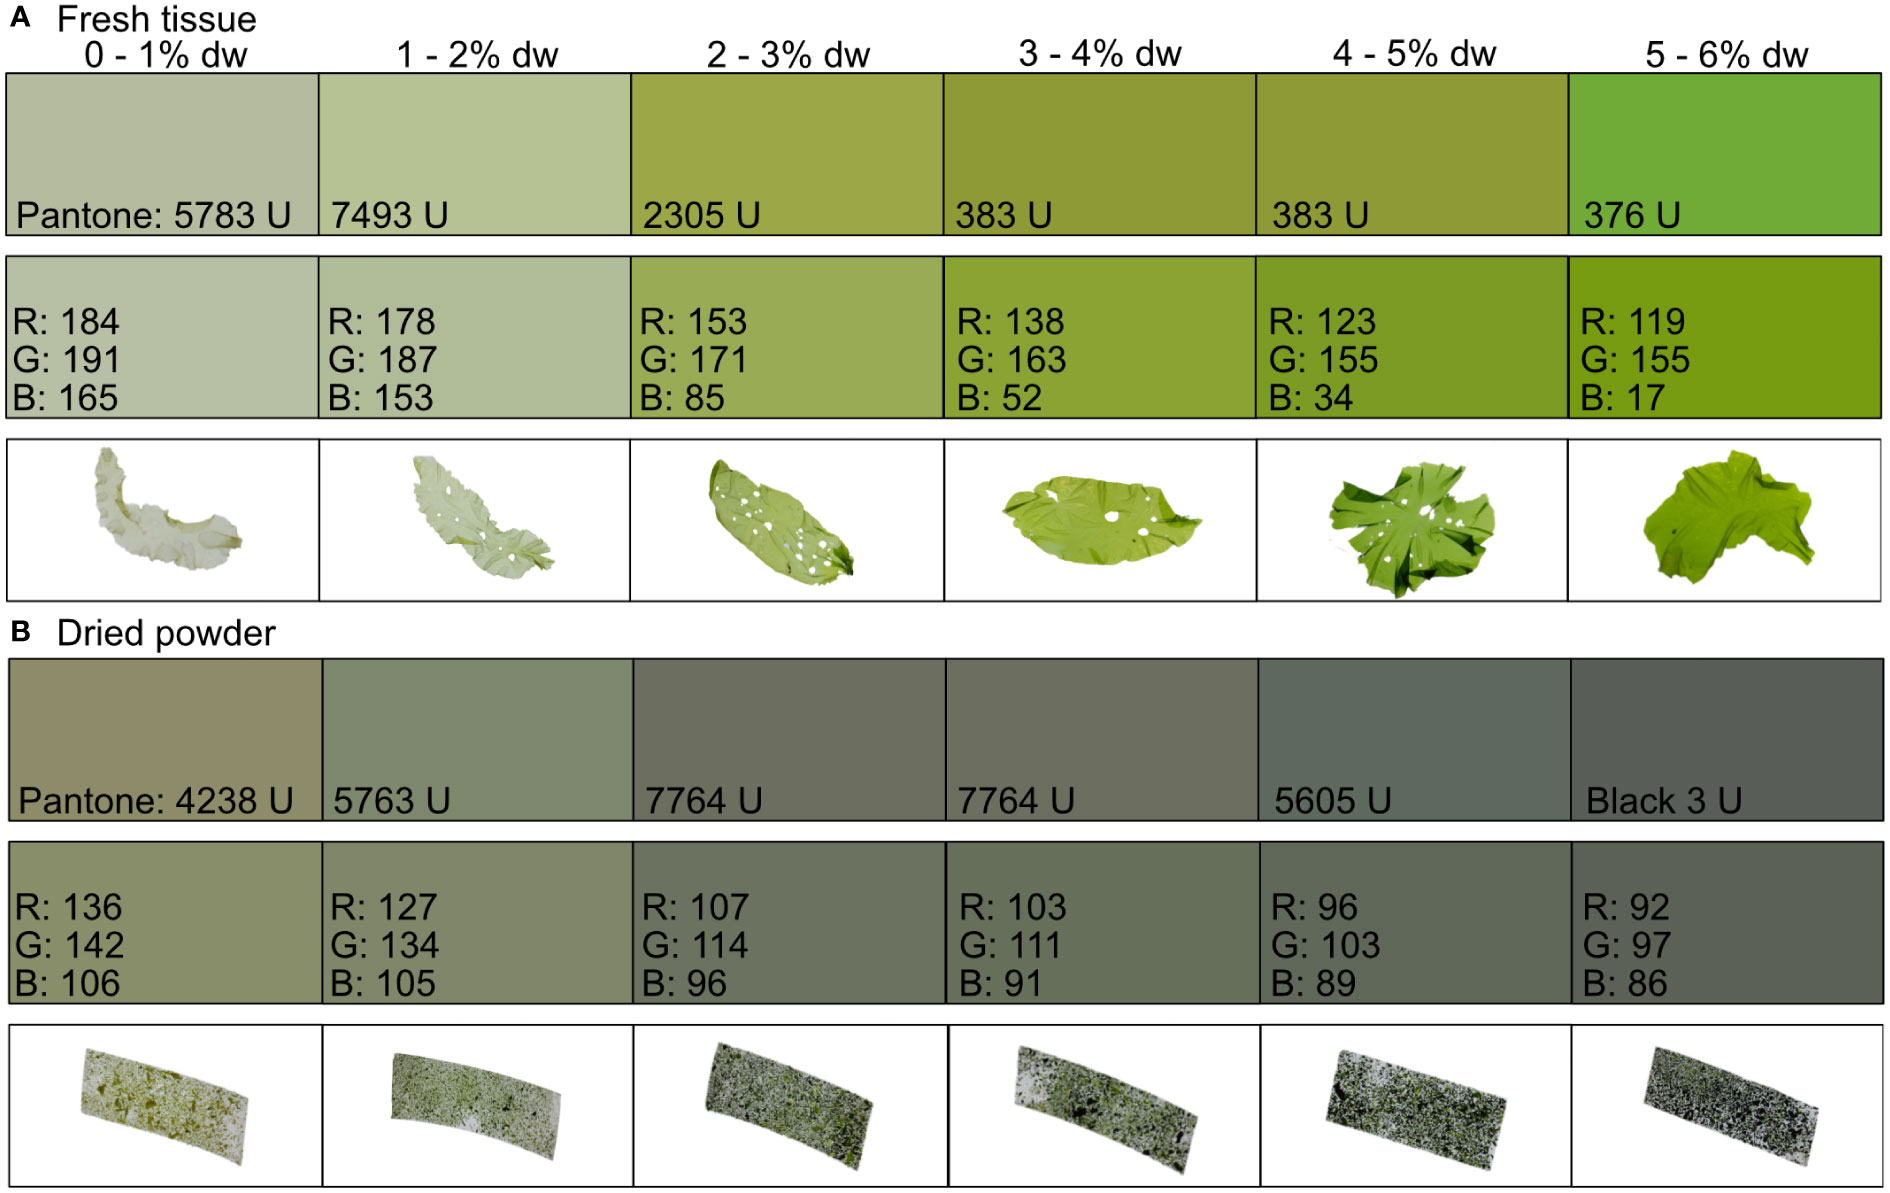
Figure 3 Color guide with the matched Pantone® uncoated matt color to the red (R), green (G), and blue (B) values of the (A) fresh tissue and (B) dried powder of Ulva fenestrata divided into six different groups based on its nitrogen content (% dw).
Discussion
The nutritional status of seaweeds is important for any seaweed business aiming to provide high quality biomass for food and feed applications. The biomass composition is dependent on seasonal conditions, and therefore harvest time play a crucial role for the quality of the seaweed crop (Steinhagen et al., 2022). In this study we developed a rapid and cost-efficient tool to assess the nitrogen content (and hence protein content (Angell et al., 2016)) of the commercially interesting seaweed U. fenestrata by color image analysis. We showed that the three band colors R, G, and B were highly correlated to the nitrogen content in both fresh tissue (R2 = 0.872 – 0.944) and dried powder (R2 = 0.692 – 0.829), and that the linear regression models to estimate U. fenestrata nitrogen tissue content were robust and precise. Additionally, we developed a web-based application that automatically estimates the nitrogen content of U. fenestrata from uploaded images (https://www.seaweed-nitrogen.com, Supplementary material 2).
For many land plants, linear regression models based on color image analysis have been developed to estimate the physiological status and nitrogen content of the plants (e.g. Mercado-Luna et al., 2010; Tewari et al., 2013; Riccardi et al., 2014; Zhang et al., 2022). Even though changes in seaweed thallus color due to changes in tissue nitrogen content have been widely reported for seaweeds (Nagler et al., 2003; Yu and Yang, 2008; Robertson-Andersson et al., 2009; Ashkenazi et al., 2022; Stedt et al., 2022a, 2022b), no previous studies have to our knowledge developed models to quantitatively assess the nitrogen status of seaweeds based on color. Our study showed that all the three band colors R, G, and B can be used in simple and multiple linear regression models to predict the nitrogen content of the seaweed. For fresh tissue, all models could accurately predict the nitrogen content, however, the best-fitting model was developed through multiple linear regression with all the three band colors included. For dried powder, the simple regression using the band color G was the most accurate model to predict the nitrogen content. For future studies, the analysis of phosphorus (P) in the seaweed tissue could be included to make predictions on the N:P ratio of the seaweed.
Even though most of the data points from this study were clustered below 2% dw N and above 4% dw N, the data points between 2 – 4% dw N showed a low residual from the linear regression line. Furthermore, the tenfold cross validation validated the models when tested on previously unseen data. The few data points between 2 – 4% dw N can be explained by a rapid decrease in nitrogen content between sampling point six (13th of April 2022) and seven (20th of April 2022). This corresponds well to previous studies on the same strain of U. fenestrata, where higher temperatures and irradiances resulted in decreased nitrogen tissue content (Toth et al., 2020; Steinhagen et al., 2022).
The color guide developed in our study can be used by seaweed farmers to rapidly assess the nitrogen content of their seaweeds when in the field. Therefore, we provide a representative color scheme (Figure 3). Seaweed farmers could either print the guide or use the Pantone®, or R, G, and B values, to make their own guide, and then simply place their cultivated U. fenestrata on it to assess the tissue nitrogen content of the seaweed. Similarly, we provide a guide for dried seaweed powder (Figure 3). However, for nitrogen values that cannot be distinguished with the color guide (3 – 5% for fresh tissue and 2 – 4% for dried tissue), using the linear regression models will result in more accurate estimations.
Conclusion
In conclusion, this study showed that color image analysis accurately estimates the nitrogen content of U. fenestrata, and that the models are robust and precise (R2 = 0.944 and 0.827 for fresh tissue and dried powder, respectively). Using the models and our web-based color-to-nitrogen image application, will allow seaweed farmers to assess the nitrogen content (and hence protein content) of their crop quickly and cost-efficiently without having to use time-consuming and expensive laboratory procedures. These tools will help seaweed farmers to overcome some of the obstacles when producing sustainable and high-quality food and feed in the rapidly developing seaweed aquaculture industry. Similar models can easily be developed using the same method as described in this study for other commercial interesting seaweed species.
Data availability statement
The original contributions presented in the study are included in the article/Supplementary Material. Further inquiries can be directed to the corresponding author.
Author contributions
KS: Conceptualization, data curation, formal analysis, investigation, methodology, project administration, software, validation, visualization, writing – original draft & review & editing. GT: Investigation, supervision, writing – review & editing. JD: Data curation, software, visualization, writing – review & editing. HP: Funding acquisition, resources, supervision, writing – review & editing. SS: Conceptualization, investigation, methodology, project administration, resources, writing – original draft & review & editing. All authors contributed to the article and approved the submitted version.
Funding
This study was supported by the Formas-funded projects CirkAlg (Grant no. 2018-01839), and BlueGreen (Grant no. 2021-02340).
Acknowledgments
The authors would like to thank Swantje Enge for assistance at the seafarm, and Rådman och Fru Ernst Collianders stiftelse för välgörande ändamål for financing of the web-based application. Furthermore, the authors are grateful to Arthur Wessman and David Wessman for fruitful discussions about the web-based application.
Conflict of interest
The authors declare that the research was conducted in the absence of any commercial or financial relationships that could be construed as a potential conflict of interest.
Publisher’s note
All claims expressed in this article are solely those of the authors and do not necessarily represent those of their affiliated organizations, or those of the publisher, the editors and the reviewers. Any product that may be evaluated in this article, or claim that may be made by its manufacturer, is not guaranteed or endorsed by the publisher.
Supplementary material
The Supplementary Material for this article can be found online at: https://www.frontiersin.org/articles/10.3389/fmars.2022.1081870/full#supplementary-material
References
Angell A. R., Mata L., de Nys R., Paul N. A. (2016). The protein content of seaweeds: a universal nitrogen-to-protein conversion factor of five. J. Appl. Phycol. 28 (1), 511–524. doi: 10.1007/s10811-015-0650-1
Araújo R., Vázquez Calderón F., Sánchez López J., Azevedo I. C., Bruhn A., Fluch S., et al. (2021). Current status of the algae production industry in europe: an emerging sector of the blue bioeconomy. Front. Mar. Sci. 7 (1247). doi: 10.3389/fmars.2020.626389
Ashkenazi D. Y., Segal Y., Ben-Valid S., Paz G., Tsubery M. N., Salomon E., et al. (2022). Enrichment of nutritional compounds in seaweeds via abiotic stressors in integrated aquaculture. Innovative Food Sci. Emerging Technol. 80, 103067. doi: 10.1016/j.ifset.2022.103067
Barbier M., Charrier B., Araujo R., Holdt S., Jacquemin B., Rebours C. (2019). Pegasus - phycomorph European guidelines for a sustainable aquaculture of seaweeds. Eds. Barbier M., Charrier B. (Roscoff, France: COST Action FA1406).
Biancarosa I., Espe M., Bruckner C., Heesch S., Liland N., Waagbø R., et al. (2017). Amino acid composition, protein content, and nitrogen-to-protein conversion factors of 21 seaweed species from Norwegian waters. J. Appl. phycol. 29 (2), 1001–1009. doi: 10.1007/s10811-016-0984-3
Campbell I., Macleod A., Sahlmann C., Neves L., Funderud J., Oyerland M., et al. (2019). The environmental risks associated with the development of seaweed farming in Europe - prioritizing key knowledge gaps. Front. Mar. Sci. 6 (107). doi: 10.3389/fmars.2019.00107
D. Tumbo S., G. Wagner D., H. Heinemann, P. (2002). On–the–go sensing of chlorophyll status in corn. Transactions of the ASAE 45 (4), 1207. doi: 10.13031/2013.9929
Duarte C. M., Bruhn A., Krause-Jensen D. (2022). A seaweed aquaculture imperative to meet global sustainability targets. Nat. Sustainability 5 (3), 185–193. doi: 10.1038/s41893-021-00773-9
European Commission (2018). A sustainable bioeconomy for Europe: strengthening the connection between economy, society and the environment. communication from the commission to the European parliament, the council, the European economic and social committee and the committee of the regions (Brussels: European Commission).
European Commission (2020a). EU Biodiversity strategy for 2030. bringing nature back into our lives. communication from the commission to the European parliament, the council, the European economic and social committee and the committee of the regions (Brussels: European Commission).
European Commission (2020b). A farm to fork strategy for a fair, healthy and environmentally-friendly food system. communication from the commission to the European parliament, the council, the European economic and social committee and the committee of the regions (Brussels: European Commission).
European Commission (2020c). A new circular economy action plan for a cleaner and more competitive europe. communication from the commission to the European parliament, the council, the European economic and social committee and the committee of the regions (Brussels: Euoropean Commission).
FAO (2018). “The global status of seaweed production, trade and utilization,” in Globefish research programme. (Rome: Food and Agriculture Organization of the United Nations (FAO)) 124, 120.
Gephart J. A., Henriksson P. J. G., Parker R. W. R., Shepon A., Gorospe K. D., Bergman K., et al. (2021). Environmental performance of blue foods. Nature 597 (7876), 360–365. doi: 10.1038/s41586-021-03889-2
Hasselström L., Visch W., Grondahl F., Nylund G. M., Pavia H. (2018). The impact of seaweed cultivation on ecosystem services - a case study from the west coast of Sweden. Mar. pollut. Bull. 133, 53–64. doi: 10.1016/j.marpolbul.2018.05.005
Krzywinski M. (2022) Image color summarizer 0.76 [Online] (Vancouver, Canada: Canada’s Michael Smith Genome Sciences Centre). Available at: http://mkweb.bcgsc.ca/color-summarizer (Accessed 12 October 2022).
Mercado-Luna A., Rico-Garcia E., Lara-Herrera A., Soto-Zarazua G., Ocampo-Velazquez R., Guevara-Gonzalez R., et al. (2010). Nitrogen determination on tomato (Lycopersicon esculentum mill.) seedlings by color image analysis (RGB). Afr. J. Biotechnol. 9 (33), 5326–5332.
Nagler P. L., Glenn E. P., Nelson S. G., Napolean S. (2003). Effects of fertilization treatment and stocking density on the growth and production of the economic seaweed gracilaria parvispora (Rhodophyta) in cage culture at Molokai, Hawaii. Aquaculture 219 (1), 379–391. doi: 10.1016/S0044-8486(02)00529-X
Pantone® (2022) Pantone® connect [Online]. Available at: https://www.pantone.com/pantone-connect (Accessed 12 October 2022).
Riccardi M., Mele G., Pulvento C., Lavini A., d'Andria R., Jacobsen S. E. (2014). Non-destructive evaluation of chlorophyll content in quinoa and amaranth leaves by simple and multiple regression analysis of RGB image components. Photosynthesis Res. 120 (3), 263–272. doi: 10.1007/s11120-014-9970-2
Robertson-Andersson D. V., Wilson D. T., Bolton J. J., Anderson R. J., Maneveldt G. W. (2009). Rapid assessment of tissue nitrogen in cultivated Gracilaria gracilis (Rhodophyta) and Ulva lactuca (Chlorophyta). Afr. J. Aquat. Sci. 34 (2), 169–172. doi: 10.2989/ajas.2009.34.2.7.894
Stedt K., Davegård J. (2022) Color-to-nitrogen image application for ulva fenestrata [Online]. Available at: https://www.seaweed-nitrogen.com (Accessed 27 October 2022).
Stedt K., Steinhagen S., Trigo J. P., Kollander B., Undeland I., Toth G. B., et al. (2022a). Post-harvest cultivation with seafood process waters improves protein levels of ulva fenestrata while retaining important food sensory attributes. Front. Mar. Sci. 9. doi: 10.3389/fmars.2022.991359
Stedt K., Trigo J. P., Steinhagen S., Nylund G. M., Forghani B., Pavia H., et al. (2022b). Cultivation of seaweeds in food production process waters: evaluation of growth and crude protein content. Algal Res. 63, 102647. doi: 10.1016/j.algal.2022.102647
Steinhagen S., Enge S., Cervin G., Larsson K., Edlund U., Schmidt A. E. M., et al. (2022). Harvest time can affect the optimal yield and quality of sea lettuce (Ulva fenestrata) in a sustainable sea-based cultivation. Front. Mar. Sci. 9. doi: 10.3389/fmars.2022.816890
Steinhagen S., Enge S., Larsson K., Olsson J., Nylund G. M., Albers E., et al. (2021). Sustainable large-scale aquaculture of the northern hemisphere sea lettuce, Ulva fenestrata, in an off-shore seafarm. J. Mar. Sci. Eng. 9 (6), 615. doi: 10.3390/jmse9060615
Tewari V. K., Arudra A. K., Kumar S. P., Pandey V., Chandel N. S. (2013). Estimation of plant nitrogen content using digital image processing. Agric. Eng. International: CIGR J. 15 (2), 78–86.
Toth G. B., Harrysson H., Wahlstrom N., Olsson J., Oerbekke A., Steinhagen S., et al. (2020). Effects of irradiance, temperature, nutrients, and pCO(2) on the growth and biochemical composition of cultivated Ulva fenestrata. J. Appl. Phycol. 32, 3243–3254. doi: 10.1007/s10811-020-02155-8
Tumbo S., Wagner D., Heinemann P. (2002). On–the–go sensing of chlorophyll status in corn. Transactions of the ASAE 45 (4), 1207. doi: 10.13031/2013.9929
Yu J., Yang Y.-F. (2008). Physiological and biochemical response of seaweed gracilaria lemaneiformis to concentration changes of n and p. J. Exp. Mar. Biol. Ecol. 367 (2), 142–148. doi: 10.1016/j.jembe.2008.09.009
Keywords: color image analysis, web-based application, regression, RGB, nitrogen content correlation, seaweed, protein content, ulva
Citation: Stedt K, Toth GB, Davegård J, Pavia H and Steinhagen S (2022) Determination of nitrogen content in Ulva fenestrata by color image analysis – a rapid and cost-efficient method to estimate nitrogen content in seaweeds. Front. Mar. Sci. 9:1081870. doi: 10.3389/fmars.2022.1081870
Received: 27 October 2022; Accepted: 18 November 2022;
Published: 02 December 2022.
Edited by:
Rafael R. Robaina, University of Las Palmas de Gran Canaria, SpainReviewed by:
Alejandro H. Buschmann, University of Los Lagos, ChileDiana Pacheco, University of Coimbra, Portugal
Copyright © 2022 Stedt, Toth, Davegård, Pavia and Steinhagen. This is an open-access article distributed under the terms of the Creative Commons Attribution License (CC BY). The use, distribution or reproduction in other forums is permitted, provided the original author(s) and the copyright owner(s) are credited and that the original publication in this journal is cited, in accordance with accepted academic practice. No use, distribution or reproduction is permitted which does not comply with these terms.
*Correspondence: Kristoffer Stedt, a3Jpc3RvZmZlci5zdGVkdEBndS5zZQ==