 Xiuli Yan1*
 Jin-Yu Terence Yang2
 Min Nina Xu3
 Ehui Tan3Zhenzhen Zheng3Wenbin Zou2Minhan Dai2
 Shuh-Ji Kao2,3*
- 1Guangdong Provincial Key Laboratory of Marine Disaster Prediction and Prevention, Institute of Marine Sciences, Shantou University, Shantou, China
- 2State Key Laboratory of Marine Environmental Science, College of Ocean and Earth Sciences, Xiamen University, Xiamen, China
- 3State Key Laboratory of Marine Resource Utilization in South China Sea, Hainan University, Haikou, China
The supply of nitrogen (N) from various external and internal sources into the euphotic zone, e.g., atmospheric N deposition (AND), upwelling, lateral intrusion, and remineralization, modulates the biogeochemical and climatic roles of oligotrophic oceans and complicates N dynamics in the upper water column (≤200 m). However, our ability to resolve the mechanisms controlling upper-ocean N cycling is limited by the lack of high-resolution vertical observations. Here, we analyzed concentrations and dual isotopes of nitrate (NO3–) in the upper 200 m of the oligotrophic South China Sea. By examining dual isotopic signatures of NO3– (δ15NNO3 and δ18ONO3) and multiple associated parameters vertically throughout the upper water column, we resolved the dominant N sources and processes, including AND/N2-fixation, assimilative fractionation, and nitrification, and quantitatively evaluated their contributions in the vertical distribution of NO3–, which can be separated into the Δδ18ONO3-positive (δ18ONO3−obs−δ18ONO3−200m>0) and Δδ18ONO3-negative layers (δ18ONO3−obs−δ18ONO3−200m<0) according to the deviation in δ18ONO3 at a given depth (δ18ONO3-obs) from that at 200 m (δ18ONO3-200m). In the Δδ18ONO3-positive layer, the NO3– assimilated by phytoplankton was largely sourced from nitrification (39 ± 11%) and AND/N2 fixation (17-28%), whereas these two processes accounted for 17 ± 10% and 7 ± 6% of the total NO3– pool in the Δδ18ONO3-negative layer. Considering a substantial contribution of the regenerated (nitrification-sourced) NO3– to the total NO3– pool especially in the Δδ18ONO3-positive layer, caution should be taken that the new production assessed by the rates of NO3– uptake may be significantly overestimated in the SCS. These findings not only highlight the importance of these biogeochemical processes to NO3– dynamics in the upper water column of marginal seas, but also with important implications for the estimation of biological carbon pump and/or the f-ratio.
1. Introduction
Nitrogen (N) supply limits productivity in the ocean (Moore et al., 2013), thereby connecting the N cycle with marine carbon sequestration (Falkowski, 1997; Buchanan et al., 2021). In oligotrophic regions, regenerated N is the main N source for phytoplankton growth in surface waters (<100 m), since inputs of subsurface (100-200 m) nitrate (NO3–) supply are generally limited by strong stratification (Yool et al., 2007; Van Oostende et al., 2017). However, in marginal seas, while diapycnal fluxes of N to the N-replete layer are sufficient to support the levels of export production, additional external sources of N from atmospheric N deposition/N2 fixation (AND/N2 fixation) can stimulate phytoplankton growth in the N-depleted layer (Kao et al., 2012; Du et al., 2017; Lu et al., 2019). In addition, lateral transport also influences N dynamics in the euphotic zone, as different water masses vary in their relative concentrations of N compounds and microbial communities that alter N dynamics physically and biologically (Du et al., 2013; Xu et al., 2018). Therefore, the co-influence of various external N sources and their differing magnitudes make N dynamics more complicated in the upper ocean of marginal seas (Kao et al., 2012; Liu et al., 2020).
The South China Sea (SCS) is one of the largest marginal seas in the world, with an area of 3.5×10⁶ km2. It is a typical stratified and oligotrophic oceanic regime, showing extremely low N:P ratios (0.4-4.4) in surface waters (<60 m), and thus low levels of biomass primarily due to N limitation (Chen et al., 2004; Du et al., 2017). Although many studies have found various N sources involved in biological production within the upper ocean, such as diapycnal transport, lateral transport, AND/N2 fixation (Kao et al., 2012; Du et al., 2013; Yang et al., 2014; Du et al., 2017; Yang et al., 2017; Lu et al., 2019), it remains unclear how these sources and subsequent processes imprint on the N cycle of the upper water column of the SCS. These processes contribute to the complexity of N dynamics in the region over temporal and spatial scales. Seasonally, reactive N deposition to the SCS varies from 48 ± 34 μmol N/m2/d in July to 99 ± 78 μmol N/m2/d in September (Yang et al., 2014). Regionally, the depth-integrated N2 fixation rates vary from 50 ± 10 μmol N/m2/d in the basin to 463 ± 260 μmol N/m2/d in the Kuroshio-affected region (Lu et al., 2019). In oligotrophic water column, the vertical diapycnal N flux is three orders of magnitude larger in the nutrient-replete layer relative to the nutrient-depleted layer (Du et al., 2017). This study aims to decipher the N dynamics of multiple external sources and internal processes by using a NO3– dual isotopic approach (δ15NNO3 and δ18ONO3), which serves as an integral tracer of the N pool in the upper water column of the SCS. These results contribute to our understanding of N dynamics in marginal seas, and benefit the development and parameterization of N-driven physical-biogeochemical models.
The δ15NNO3 and δ18ONO3 provide useful constraints on its source (Sigman et al., 2005; Rafter and Sigman, 2016; Yang et al., 2022) and can be used to explore relevant N cycling processes (Emeis et al., 2010; Fawcett et al., 2015; Buchanan et al., 2021). The first study to utilize a dual isotopic approach (δ15N and δ13C) in the region focused on evaluating the role of N sources in zooplankton nutrition in the Vietnamese upwelling area (Loick et al., 2007). Additional work by Yang et al. (2017) examined N cycling using δ15N in NO3– and particulate phases in the northern SCS. However, these two isotope studies had difficulty assessing the influence of nitrification (a common process in the euphotic zone) due to the lack of δ18ONO3 measurements. Recently, two studies have illustrated the spatial variations of NO3– sources and N cycling in the SCS using both δ15NNO3 and δ18ONO3 (Chen et al., 2019; Yang et al., 2022); however, they mainly focused on the whole water column, with only 2-4 measurable isotope samples in the top 200 m. Thus, it is difficult to make a comprehensive assessment of NO3– dynamics within the upper ocean. In this study, we performed high-resolution vertical observation of the concentrations and dual isotopic composition of NO3–, in order to decipher the critical elements influencing NO3– dynamics in the upper water column of the SCS including the relative importance of external N sources and internal processes to NO3– uptake and assimilative fractionation.
2. Materials and methods
2.1. Study area
The circulation patterns in the SCS vary seasonally as a function of the East Asia monsoon (Figure 1A). In winter, the northeast monsoon pushes the SCS Warm Current southwestward and drives a basin-wide cyclonic gyre (Hu et al., 2000; Liu et al., 2016). In summer, the SCS Warm Current shifts northeastward and the basin-wide cyclonic gyre shifts eastward under the influence of southwesterly monsoon (Liu et al., 2016). The surface water mass in the SCS changes based on the extent of intrusion of the Kuroshio Current through the Luzon Strait, which varies both throughout the year and over decadal time scales (Hu et al., 2000; Yuan et al., 2006; Nan et al., 2015). Previous studies showed lateral Kuroshio intrusion influences not only the heat and salt of the SCS, but also N and carbon biogeochemical cycles due to high dissolved organic carbon and low nutrient concentrations in the Kuroshio waters (Du et al., 2013; Nan et al., 2015; Wu et al., 2015).

Figure 1 (A) Study area and sampling stations in the SCS. Surface circulation patterns are shown with arrows synthesized from previous studies (Yuan et al., 2006; Nan et al., 2015; Liu et al., 2016): summertime surface currents (cyan), wintertime surface currents (white dashed), and the Kuroshio Current (black). The color bar indicates water depth. (B) Potential temperature-salinity diagram for all stations. The red and black triangles indicate typical SCS water and coastal water, respectively. The gray triangles represent the Kuroshio Current. (C–H) Depth and isopycnal profiles for all samples with NO3– concentrations ≥0.5 μmol/L: NO3– concentrations (C), δ15NNO3 (D), δ18ONO3 (E), N* (F), Δ(15-18) (G), and N/P ratio (H).
2.2. Field sample collections
Water samples were collected in the SCS onboard the R/V Dongfanghong II during March 2013, June 2014, May-June 2016, and onboard the R/V TAN KAH KEE during June 2017 (Figure 1A). Seawater was collected for analysis of the concentrations and isotopic composition of NO3− at 5-32 layers from the surface (5 m) to 200 m using 12 L Niskin bottles attached to a Seabird SBE-911 plus CTD-rosette sampling system. More details of the sampling layers/intervals in each station can be found in the Supplementary Table 1 and the datasets. Unfiltered seawater samples were collected in 125 mL acid-washed high-density polyethylene bottles that were rinsed thoroughly with in situ seawater prior to filling. Water samples were immediately frozen on board at –20 °C until analysis.
2.3. Concentration and isotopic analysis of nitrate
The concentrations of NO3− and nitrite (NO2−) were measured using a Four-channel Continuous Flow Technicon AA3 Auto-Analyzer (Bran-Luebbe), with detection limits of 0.07 μmol/L for NO3− and 0.02 μmol/L for NO2− (Dai et al., 2008; Du et al., 2013).
The values of δ15NNO3 and δ18ONO3 (for samples with NO3− concentrations ≥ 0.5 μmol/L) were determined by the denitrifier method (Sigman et al., 2001; Casciott et al., 2002). Briefly, denitrifying bacteria lacking nitrous oxide (N2O) reductase were used to quantitatively convert NO3− in samples to N2O. Subsequently, the isotopic compositions of N2O were measured via GasBench II-IRMS (Thermo Scientific DELTA V advantage) equipped with an on-line extraction and purification system. Four internationally recognized NO3− reference materials (International Atomic Energy Agency (IAEA)-NO3−: δ15N = 4.7‰ and δ18O = 25.6‰, U.S. Geological Survey (USGS)-34: δ15N = –1.8‰ and δ18O = –27.9‰, USGS-35: δ18O = 57.5‰ and USGS-32: δ15N = 180‰) were used for δ15N and δ18O calibration (Böhlke et al., 2003). One of the NO3− reference materials (IAEA-NO3−) was run in parallel to monitor bacterial conversion efficiency and mass spectrometer drift. In terms of sample replicates, the analytical precision of δ15NNO3 and δ18ONO3 measurements as better than ±0.2‰ and ±0.5‰, respectively (Yan et al., 2017; Yan et al., 2019). To avoid the influence of NO2− on δ15NNO3 and δ18ONO3 values, all samples were treated with sulfamic acid (Sigma, guaranteed reagent) to remove pre-existing NO2− following the procedure in Granger and Sigman (2009).
3. Results
3.1. Hydrological characteristics
From Figure 1B, we can see all potential temperature-salinity profiles merge at a salinity of 34.4 and temperature of 13 °C, suggesting the same subsurface water (~200 m) source among these stations. Generally, as the potential density anomaly (σϴ=σ−1000, unit: kg/m3) decreased toward the surface (~5 m), the potential temperature rose while the salinity first increased and then decreased. However, distinct hydrological differences were found between offshore SCS water measured at the South-East Asian Time-series Study (SEATS) station, the Kuroshio Current and coastal water (station X5, σϴ<25.5). At the same isopycnal surface, the Kuroshio Current had the highest potential temperature and salinity, followed by SEATS, and the coastal water. The hydrological characteristics at most stations were controlled by the isopycnal mixing between the Kuroshio Current and the coastal water. Thus, due to greater influence from Kuroshio intrusion near the Luzon Strait, datapoints were more scattered and skewed toward the typical Kuroshio characteristics in spring relative to those in summer.
3.2. Vertical distributions of nitrate and its isotopic composition
The vertical profiles showed NO3– concentrations increased with increasing water depth (Figure 1C), with values ranging from 5.2 to 21.9 μmol/L. The lowest values (~0.1 μmol/L) were found mostly at depths of <50 m, while the highest values appeared at 200 m. Thus, the vertical gradients of NO3– differed among stations. For example, at stations TS2, B5 and BC1 near the Luzon Strait, which were more influenced by Kuroshio intrusion, NO3– concentrations were lower and varied within a narrow range of 0.1-8.0 μmol/L. However, at the southernmost station C1 where upwelling appeared, the NO3– concentration showed a steep gradient, changing from 0.2 μmol/L at 50 m depth to a maximum of 21.9 μmol/L at 200 m. Clearly, the vertical distributions of NO3– concentrations exhibited distinct north-to-south differences. By defining the nitracline depth as that where NO3– concentrations reached 2.0 μmol/L (Wilson and Coles, 2005), we found it ranged between 24-154 m, with a mean value of 77 ± 30 m (n=22, Table 1). The nitracline depths at stations near the Luzon Strait were the deepest due to the influence of warm, nutrient-depleted waters from Kuroshio intrusion.
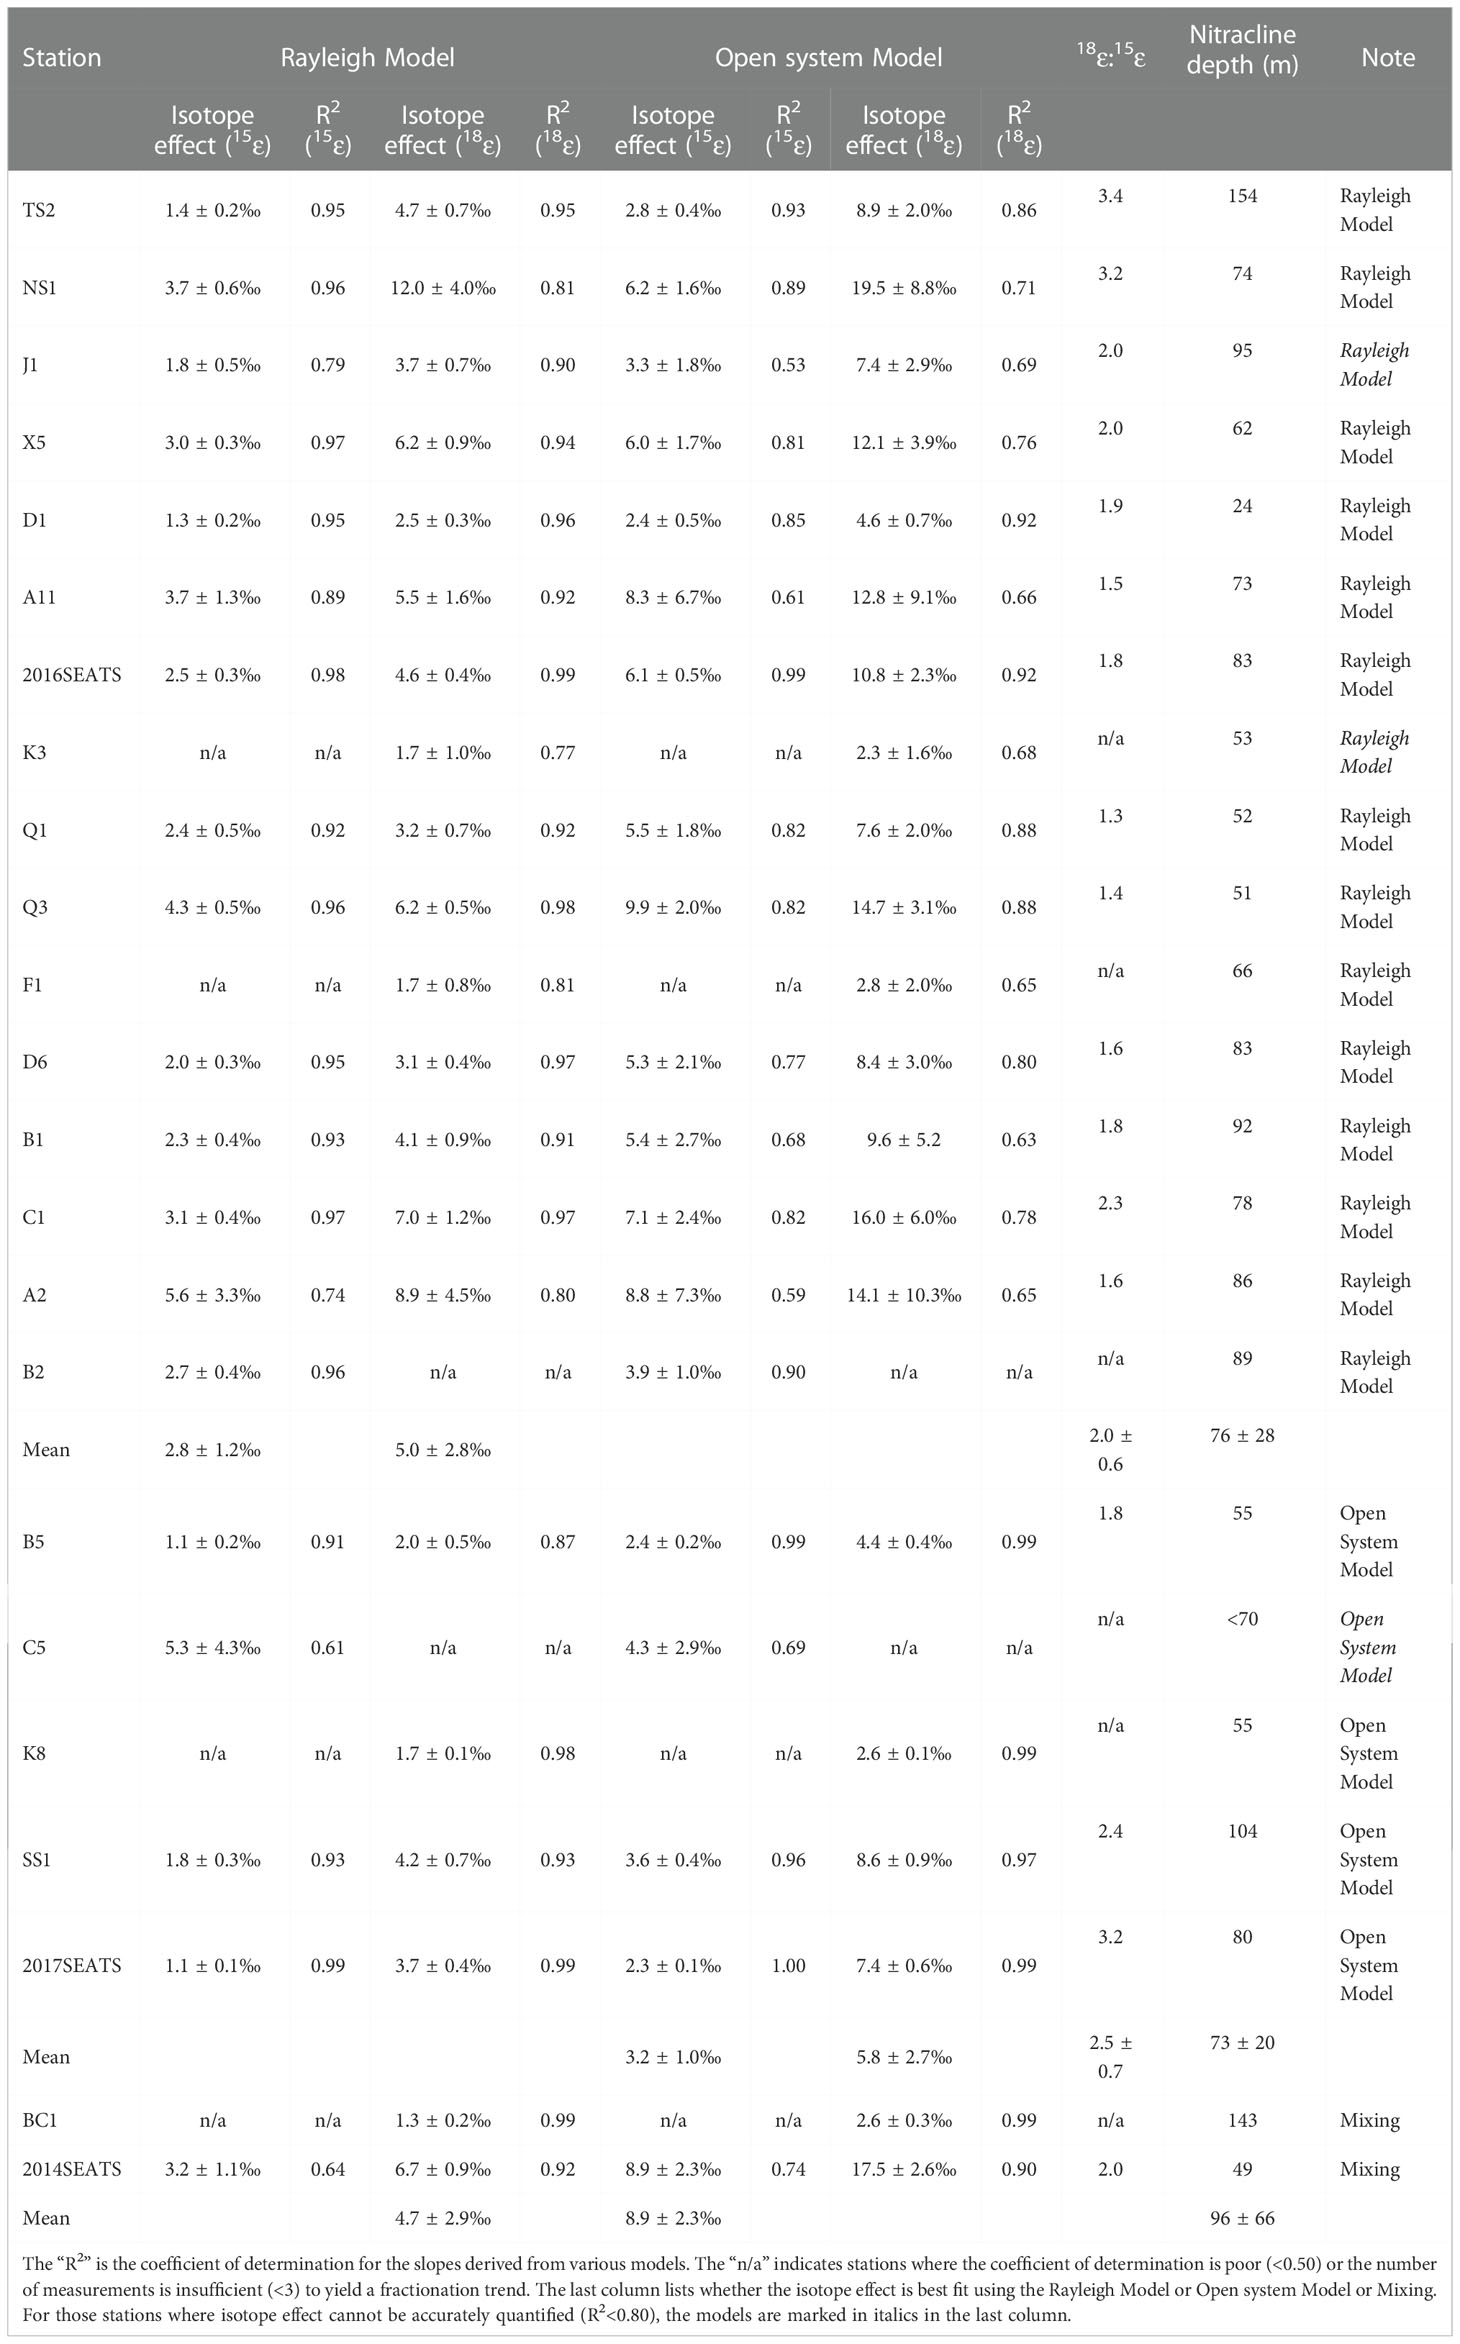
Table 1 The isotope effect of NO3– assimilation estimated from the Rayleigh Model and the Open system Model at appropriate stations.
The δ15NNO3 values showed strong gradients above the nitracline (<125 m), but weaker gradients below the nitracline (Figure 1D). They generally fell within a narrow range of 3.4-5.7‰ below the nitracline; however, they became enriched upward toward the surface (6.4-13.3‰, ~20 m), accompanied by lower NO3– concentrations. For example, at station A11, δ15NNO3 reached a maximum of 13.3‰ at 70 m. However, the site with the shallowest nitracline (station D1) had a weaker δ15NNO3 gradient varying between 4.9-7.0‰ (Table 1). In addition, the δ15NNO3 values at several stations (A2, Q1, B5 and C1) showed minima (2.1‰, 3.5‰, 3.3‰, and 4.9‰, respectively) at 75-125 m depths.
The δ18ONO3 values were relatively constant below the nitracline but increased sharply from depths of 100-125 m toward ~20 m (Figure 1E), and δ18ONO3 variability (5.2-22.5‰) was larger than that of δ15NNO3 above the nitracline. The maximum values of δ18ONO3 above the nitracline differed among stations. At stations NS1 and C1, δ18ONO3 reached maximum values of 19.0‰ and 22.6‰, respectively, around a depth of 75 m. However, δ18ONO3 maxima were observed at shallower depths (24-55 m) at stations D1 and B5, reaching only 5.8‰ and 5.2‰, respectively. Spatially, δ18ONO3 values in the southern stations (SS1, B1, B2, A2 and C1) were mostly higher than that at stations further north, especially at depths from 90-150 m. Notably, the vertical distribution patterns of δ18ONO3 did not with synchronous change of δ15NNO3. The δ18ONO3 values had an overall range of 0.9-22.6‰, which was twice the range of δ15NNO3 (2.1-13.3‰). Moreover, the minimum δ18ONO3 values did not occur in the subsurface waters (75-125 m) at stations A2, Q1 and B5.
4. Discussion
4.1. Significance of external N inputs revealed by N* and Δ(15-18)
In the subsurface near the nitracline where regeneration occurs intensively, NO3– was depleted in δ15N, with lower δ15NNO3 (2.1-4.9‰) found at stations 2014SEATS, SS1, B5, Q1, J1, and C1 relative to other stations (Figure 1D). Such a negative shift in δ15NNO3 near the nitracline suggests an external input of isotopically light N likely derived from AND/N2 fixation. Here, a quasi-conservative tracer N* (N*=[NO3–]–16×[PO43–]) (Gruber and Sarmiento, 1997; Deutsch et al., 2001), is used as an indicator to reflect external N inputs (i.e. AND/N2 fixation) since the non-Redfieldian addition of external N can increase seawater N* (Sigman et al., 2005; Yoshikawa et al., 2015). Although N* is negative throughout the upper 200 m water column (Figure 1F), an upward increase in N* is evident from 1000 m toward the surface (<100 m) (Supplementary Figure 1A), providing evidence of the effects of external N inputs supplying excess N in the subsurface waters between 100-200 m (Kim et al., 2014; Yang et al., 2022).
The cumulative signal of AND/N2 fixation on the subsurface NO3– pool (100-200 m) can also be elucidated by using a complementary tracer, Δ(15–18) (=δ15NNO3 – δ18ONO3) (Rafter et al., 2013; Yoshikawa et al., 2018). Our results show that Δ(15–18) values vary widely between –11.6‰ and 3.5‰, with larger variations above the nitracline (–0.9 ± 3.3‰, n=41) than below the nitracline (1.1 ± 1.7‰, n=142) (Figure 1G). These Δ(15–18) values are also consistent with previous reports from the SCS (–0.5~4.0‰; Yang et al., 2022) and the western subtropical gyre of North Pacific (0.9 ± 1.3‰; Yoshikawa et al., 2018). Overall, Δ(15–18) values remain nearly constant below the nitracline but decreased upward to ~20 m (Figure 1G and Supplementary Figure 1B). The decreasing trend is well explained by the accumulation of AND/N2 fixation (Tuerena et al., 2021; Yang et al., 2022) since both featured negative δ15N values mostly falling between –10‰ and 0‰ (Knapp et al., 2008; Yang et al., 2014; Shi et al., 2021). Isotopically light δ15NNO3 relative to δ18ONO3, which is influenced by δ18O in H2O and O2 via nitrification, may thus cause a negative shift in Δ(15–18). Several independent lines of evidences have been reported to support the significance of external N inputs around the study area, with total AND rates of 50-90 mmol N/m2/yr (Yang et al., 2014; Shi et al., 2021) and depth-integrated N2 fixation rates of 18.2-169.0 mmol N/m2/yr in the SCS (Lu et al., 2019). Accordingly, both AND and N2 fixation potentially contribute to the negative shift in Δ(15–18) with the same order of magnitude. Alternatively, the negative shift in Δ(15–18) can also result from internal processes, such as the coupling of incomplete NO3– assimilation and remineralization of newly fixed organic N and subsequent nitrification (Yoshikawa et al., 2018; Yang et al., 2022). Therefore, external N inputs from AND/N2 fixation resulted in the upward increases in N* and decreases in Δ(15–18), confirming the significance of AND/N2 fixation on modulating N dynamics in the upper water column of the SCS.
4.2. Nitrate isotopes reveal dominant N cycling processes
4.2.1. Nitrate assimilation and its isotope fractionation
NO3– assimilation is an important N cycling process in the euphotic zone, especially near the chlorophyll maximum (Rafter and Sigman, 2016; Wan et al., 2018; Tuerena et al., 2021). In our study area, NO3– uptake was evidenced by upward NO3– depletion and the synchronous elevation in δ15NNO3 and δ18ONO3 in the top 100 m (Figures 1C–1E) caused by the preferential uptake of 14N and 16O in the NO3– pool by phytoplankton (Granger et al., 2004; Sigman and Fripiat, 2018). This isotope shift was also supported by the highest NO3– uptake rates (56.8-132.7 nmol N/L/d) near nitracline at stations D1, 2014SEATS and NS1 (Wan et al., 2018, Tables 1, 2). The upward pattern of decreasing N/P ratios toward the surface (~20 m) further confirms NO3– assimilation by photosynthesis with removal of N and P at the Redfield ratio resulting in a decrease in the residual N/P ratios when N* was negative (Figures 1F, H, Supplementary Figure 1A) (Deutsch and Weber, 2012). Therefore, NO3– uptake was the dominant process modifying the vertical variations of δ15NNO3 and δ18ONO3 in the euphotic zone (Rafter and Sigman, 2016; Peng et al., 2018).
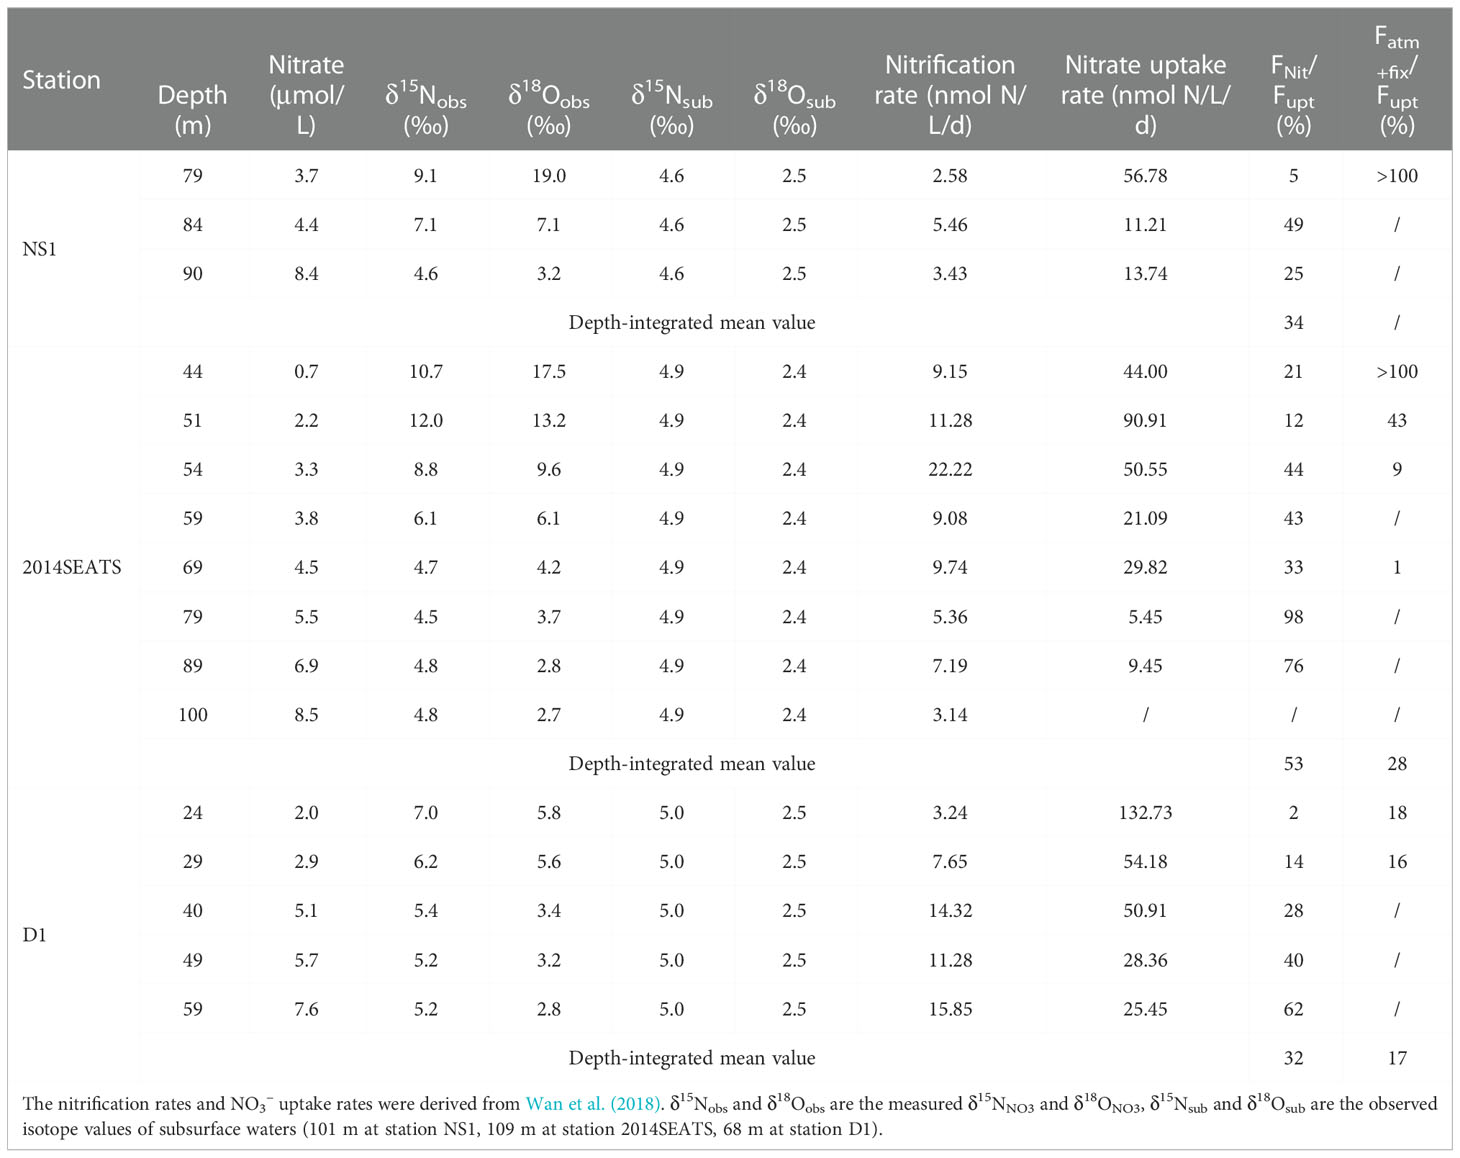
Table 2 Summary of nitrification rates, NO3– uptake rates, the contributions of nitrification to NO3– uptake (Fnit/Fupt), and the contributions of external N inputs to NO3– uptake (Fatm-fix/Fupt) in the Δδ18ONO3-positive layer.
To evaluate the fractionation factor of NO3– assimilation, we plotted δ15NNO3 or δ18ONO3 against the natural logarithm of NO3– concentrations (Figures 2A, B). The isotope effect of NO3– assimilation generally follows Eq. (1) according to the Rayleigh model (closed-system) and follows Eq. (2) using an open-system model (Umezawa et al., 2014; Sigman and Fripiat, 2018).
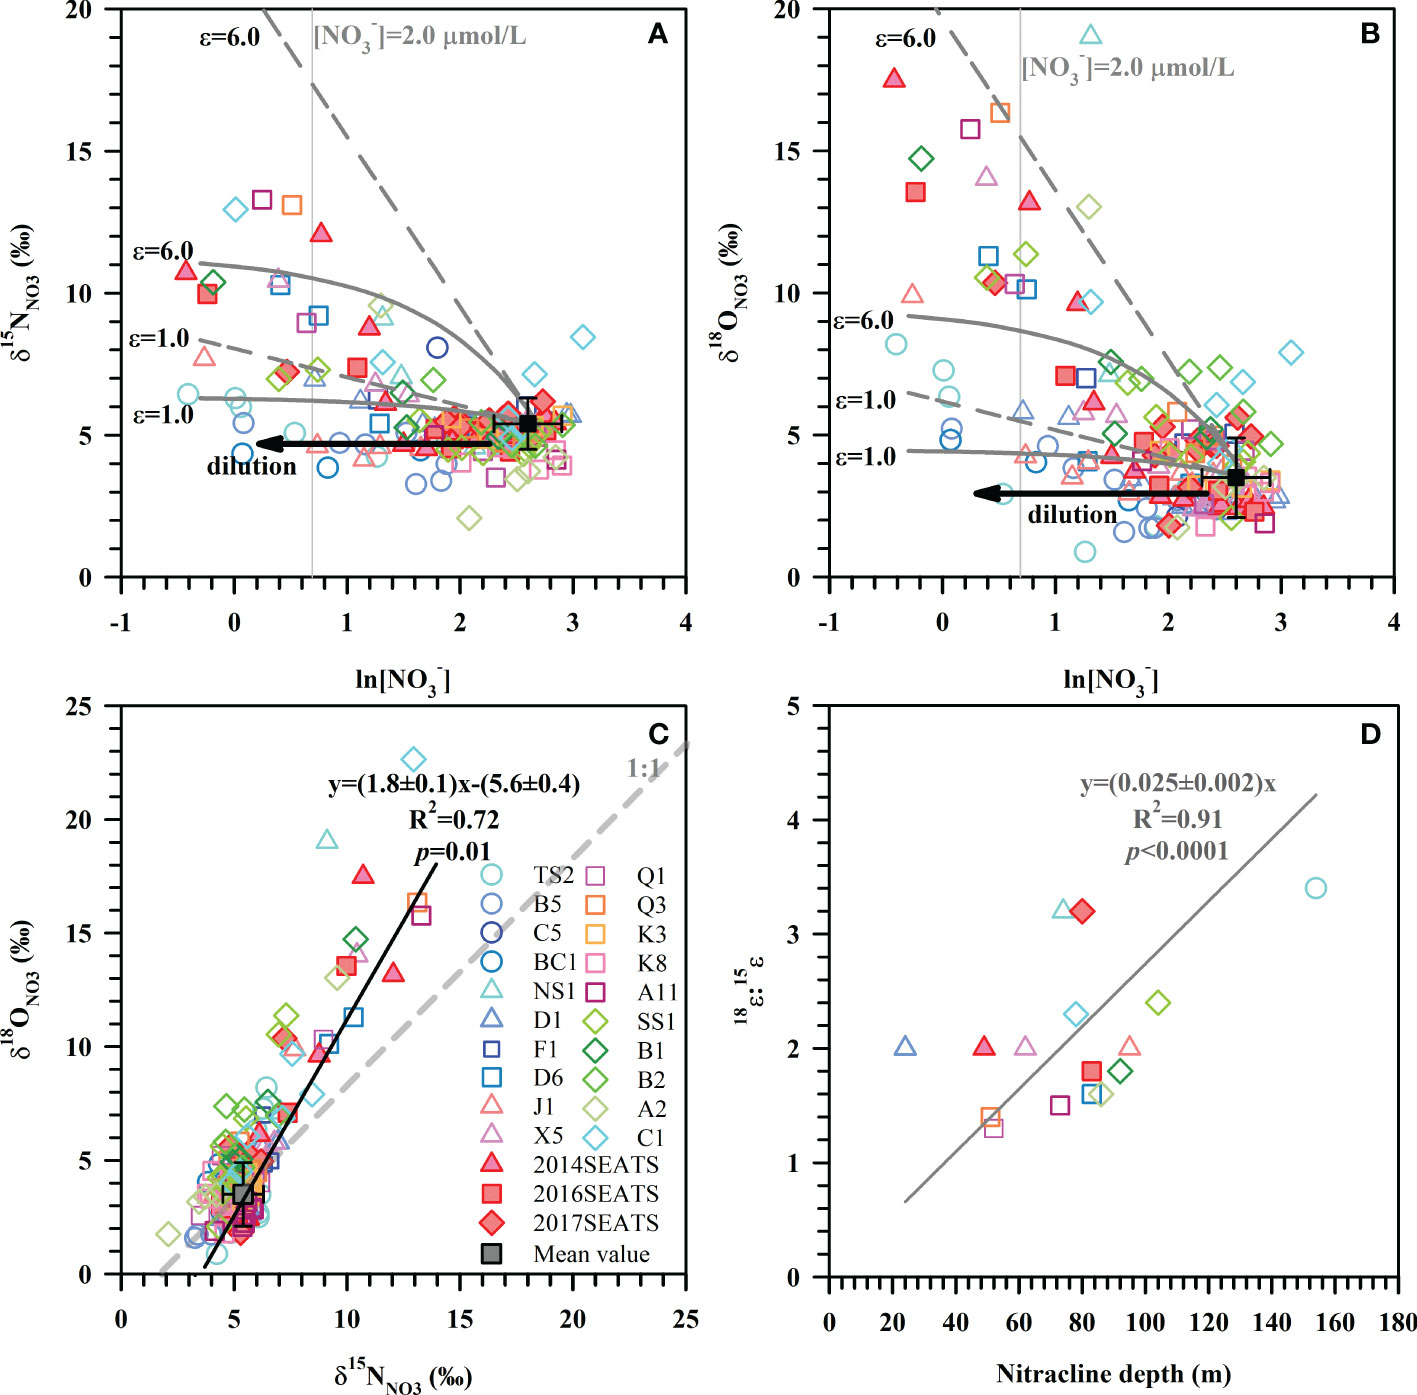
Figure 2 Values of δ15NNO3 (A) and δ18ONO3 (B) versus the natural logarithm of [NO3–] for all stations. These data overlay models of NO3– uptake based on the average NO3– concentration and isotope at a depth of 200 m (black square, [NO3–]=14.8 ± 4.0 μmol/L, δ15NNO3 = 5.4 ± 0.9‰, δ18ONO3 = 3.5 ± 1.4‰, n=23). The straight dashed lines represent the Rayleigh model while the concave-down lines represent the Open system model. The black arrows represent the dilution effect of Kuroshio intrusion with low concentrations of NO3–. The gray vertical lines denote the nitracline of 2.0 μmol/L. (C) The relationship between 18ϵ:15ϵ ratios and the nitracline depth. (D) Scatter plot of δ18ONO3 versus δ15NNO3 for all stations. The solid line is the best fitting curve for all datapoints. The gray dashed line represents a 1:1 NO3– isotope assimilation trend.
where f is the residual fraction of NO3– in the water column from the initial NO3– concentration, and ϵ is the isotope effect (in ‰ units) for NO3– assimilation.
Our results show that samples enriched in δ15NNO3 and δ18ONO3 can be better explained by the combination of the Rayleigh model and the Open system model than solely by the Rayleigh model or the Open system model (Figures 2A, B). An isotope effect of 1.0-6.0‰ produced by the Rayleigh model can explain the majority of the increase in δ15NNO3 and δ18ONO3. Yet, for those stations near the Luzon Strait, the Open system model better predicts isotope behavior. Although the above estimated ranges were close to the typical isotope fractionation induced by phytoplankton in culture (1.4-21.0‰) (Waser et al., 1998; Needoba et al., 2003; Granger et al., 2004) and field studies (4-11.9‰) (DiFiore et al., 2010; Rohde et al., 2015; Rafter and Sigman, 2016), they exhibit large variations that are associated with ambient environmental conditions (e.g., light intensity) and phytoplankton species composition (Needoba and Harrison, 2004; DiFiore et al., 2010; Rohde et al., 2015). Below we estimate the isotope effect specifically for each station since they may have experienced different hydrological conditions and/or different plankton community structures (Rafter & Sigman, 2016).
Here, the isotope effect was estimated for stations with obvious NO3– drawdown and sufficient measurements (≥3) to yield a fractionation trend. These calculations assumed that subsurface (~200 m) NO3– is the only NO3– source available for phytoplankton assimilation. The isotope effect yielded by the slope of the regression for the individual station is estimated (Table 1). Average isotope effects of 2.8 ± 1.2‰ (n=14) for 15ϵ and 5.0 ± 2.8‰ (n=15) for 18ϵ were obtained from 16 of the 23 stations using the Rayleigh model. The isotope effect was close to the mean isotope effect based on the Open system model (7 of the 23 stations), which yielded 3.2 ± 1.0‰ (n=4) for 15ϵ and 5.8 ± 2.7‰ (n=4) for 18ϵ. These values fall well within the overall isotope effect estimates of 1.0-6.0‰ in Figures 2A, B and 2.2-6.2‰ derived from culture studies (Needoba et al., 2003). Noteworthy is the N and O isotope effect at stations near the Luzon Strait that yielded lower values of 1.1-3.1‰ and 1.3-4.7‰ (Table 1), respectively. This may be a consequence of NO3–depleted water supplied to the surface (<100 m) from Kuroshio Current. When NO3–depleted Kuroshio Current waters mixes with NO3–replete SCS waters, it reduces NO3– concentration of the remaining N pool (Du et al., 2013) without changing its isotopic composition (Deutsch et al., 2004). Similarly, the relatively low isotopic values (δ15NNO3<5.4‰, δ18ONO3<3.5‰) that failed to yield a fractionation trend can also be explained by the dilution effect from the Kuroshio Current.
4.2.2. Nitrification
The ratio of O:N isotope effects (18ϵ:15ϵ) was 2.0 ± 0.6 (n=13) derived from the Rayleigh model and 2.5 ± 0.7 (n=3) from the Open system model (Table 1), showing disproportionate change in 15ϵ and 18ϵ. Such a high 18ϵ:15ϵ ratio differs from many field and culture studies that found a nearly equivalent isotope effect in N and O (Granger et al., 2008; Rohde et al., 2015; Rafter and Sigman, 2016). The input of newly fixed N from N2 fixation can lower 15ϵ by introducing isotopically light N into the NO3– pool, which may partially explain the lower 15ϵ relative to 18ϵ. Nevertheless, similarly high 18ϵ:15ϵ ratios have been reported for marine diatom Thalassiosira weissflogii (18ϵ:15ϵ=1.4), and as high as 2.0 for cultured heterotrophic α-proteobacterial strains (Granger et al., 2010; Karsh et al., 2014). Additionally, our findings compare well with the slope of 1.8 ± 0.1 (R2 = 0.72, p=0.01) derived from the scatter plot of δ18ONO3 versus δ15NNO3 (Figure 2C). Such a positive shift in δ18ONO3 relative to δ15NNO3 can result from nitrification in recycled NO3– (Wankel et al., 2009), is consistent with the reported nitrification rates in the study area (Wan et al., 2018; Xu et al., 2018). Moreover, such positive deviations are more evident at stations where the nitracline was deeper (Table 1), as indicated by the positive correlation between 18ϵ:15ϵ ratios and nitracline depth (Figure 2D). This supports the idea that nitrification contributed to the high 18ϵ:15ϵ ratios since the influence of nitrification increased with increasing water depth and the lessening of photoinhibition for nitrifiers (Wan et al., 2018). However, nitrification still cannot explain the majority of the highest δ15NNO3 and δ18ONO3 values measured (Figure 2C), revealing that NO3– assimilation was the main process regulating N cycling in the upper ocean, followed by nitrification. Therefore, the isotope effect in this study was a conservative estimate since the influence of nitrification and N2 fixation cannot be separated from NO3– uptake.
4.3. Relative importance of nitrification and external N inputs
The above discussion implies the importance of external N inputs from AND/N2 fixation on the N pool in the upper ocean. Meanwhile, the relative importance of external N inputs and internal processes, which could be imprinted on NO3– isotope values, may differ vertically throughout the water column. However, the relative importance of these inputs is difficult to assess accurately without high-resolution sampling. Below we separated the water column of each station (those with high-resolution vertical sampling during 2014 and 2017 cruises) into a δ18ONO3-based two-layer structure, according to the deviation in δ18ONO3 at a given depth (δ18ONO3-obs) from that at 200 m (δ18ONO3-200m). Samples with a negative deviation (δ18ONO3-obs< δ18ONO3-200m) were assigned to the Δδ18ONO3-negative layer; otherwise, they were categorized as part of the Δδ18ONO3-positive layer (δ18ONO3-obs > δ18ONO3-200m). Then the relative importance of various processes contributing to the isotope shifts in the Δδ18ONO3-positive and Δδ18ONO3-negative layers of those stations was assessed quantitatively.
4.3.1. The Δδ18ONO3-positive layer
In the Δδ18ONO3-positive layer where NO3– uptake dominated, the contribution of nitrification to NO3– uptake (Fnit/Fupt) was calculated directly from the reported nitrification to NO3– uptake rates at stations NS1, 2014SEATS and D1 (Wan et al., 2018). The results show that nitrification accounted for 2-98% of the NO3– uptake and its contribution increased with water depth in this layer (Table 2). To eliminate the influence of different sampling resolutions, Fnit/Fupt was first linearly interpolated at 1 m intervals, and then the mean depth-integrated value was calculated. Results show that the depth-integrated Fnit/Fupt was 34%, 53% and 32% for stations NS1, 2014SEATS and D1, respectively, with a mean of 39 ± 11% (n=3), confirming the importance of nitrification in supporting phytoplankton growth (Wan et al., 2018). Noteworthy, new production assessed by the NO3– uptake rates may be overestimated in this layer due to a substantial proportion of the NO3– assimilated by phytoplankton was produced from nitrification. The cumulative NO3– from nitrification should be considered as regenerated N rather new N (Dugdale and Goering, 1967). This finding has important implications for biological carbon pump and carbon cycling in the vast marginal seas.
To estimate the relative importance of AND/N2 fixation to NO3– uptake (Fatm+fix/Fupt), a simplified one-dimensional model based on a N isotope mass balance (Bourbonnais et al., 2009) was applied (Supplementary Figure 2). Details of the calculations are provided in the Supplementary Text 1. Results show that Fatm+fix/Fupt was up to 100% at 79 m for station NS1 and at 44 m for station 2014SEATS (Table 2), suggesting the predominant role of external N inputs in supporting marine productivity at low-N depths. This is also consistent with the fact that extremely low diapycnal NO3– fluxes in the nutrient-depleted layer are observed in the SCS (Du et al., 2017). Combined with the very low Fnit/Fupt at these depths, our results also indicate that external N inputs from AND/N2 fixation are rapidly consumed by phytoplankton without being remineralized. However, Fatm+fix/Fupt decreased rapidly with depth at stations 2014SEATS and D1, along with the increasing contribution of nitrification. The mean depth-integrated of Fatm+fix/Fupt was 28% and 17% at these two stations, respectively, which is lower than the proportion of nitrification (39 ± 11%). This suggests that nitrification and external N inputs make a significant contribution to NO3– uptake (~50%) in the upper water column (Bourbonnais et al., 2009; Yang et al., 2022).
4.3.2. The Δδ18ONO3-negative layer
In the Δδ18ONO3-negative layer, where NO3– uptake was limited by light and nitrification became more important, we estimated the proportion of regenerated NO3– (freg/tot) following the method mentioned by Granger et al. (2013) and Tuerena et al. (2021). Details of calculations are provided in the Supplementary Text 2. Results showed that freg/tot ranged from 0-86% in the Δδ18ONO3-negative layer (Table 3), with large vertical and spatial variability. The highest depth-integrated mean proportion of 34% was observed at station C1 while the lowest fractions of 2-4% occurred at stations 2014SEATS and B1. Overall, the depth-integrated freg/tot was 17 ± 10% (n=10), revealing that on average ~17% of the NO3– pool was regenerated from nitrification in the Δδ18ONO3-negative layer. This is consistent with many other field studies (15-27%, Wankel et al., 2007; Tuerena et al., 2021) and model results (~50%, Yool et al., 2007), indicating that nitrification plays a substantial role in the NO3– pool and its δ15NNO3 and δ18ONO3 signatures, as well as in oceanic productivity. Additionally, freg/tot in the Δδ18ONO3-negative layer varies greatly vertically, generally increasing then decreasing with depth, and peaking at 123 ± 21 m (n=9) (Table 3). This is consistent with reported nitrification rates that peaked at around 50-100 m (Wan et al., 2018; Xu et al., 2018), further confirming the significance of nitrification in regulating the size of the NO3– pool and its dynamics in the Δδ18ONO3-negative layer, where low light intensity and abundant NO3– enhanced the success of nitrifiers (Wan et al., 2018; Marconia et al., 2019).
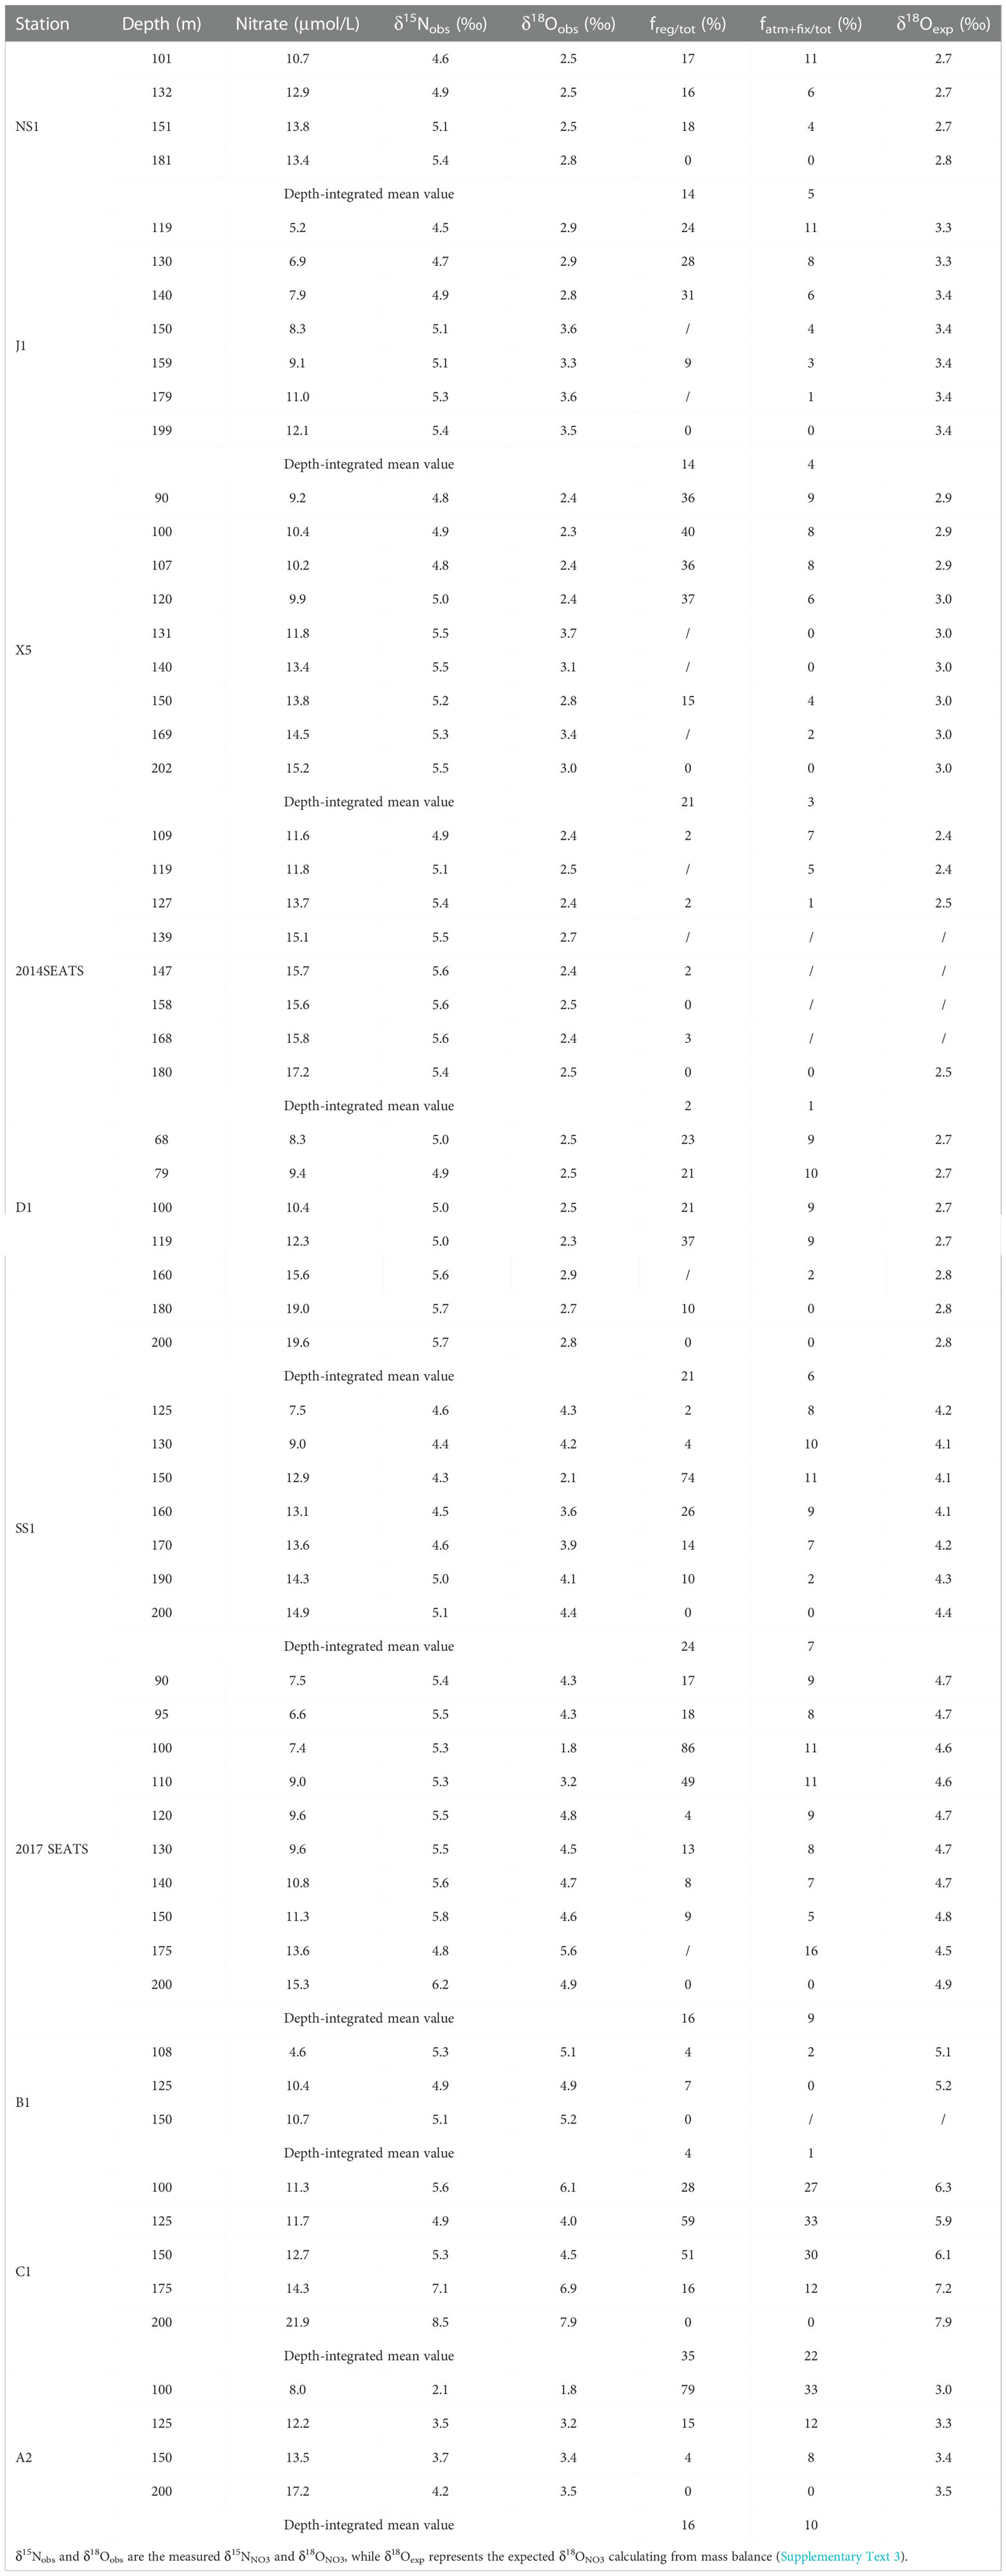
Table 3 Summary of the proportions of regenerated NO3– (freg/tot) and external N inputs from AND/N2 fixation (fatm-fix) in the Δδ18ONO3-negative layer.
To assess the relative contributions of external N inputs to the NO3– pool (fatm-fix/tot), a two-end-member mass and isotope balance was used following Yang et al. (2022). Details of the calculation are provided in the Supplementary Text 3. A vertically decreasing trend in fatm-fix/tot was observed at most stations (Table 3), consistent with observations in the Atlantic Ocean (Knapp et al., 2008). fatm-fix/tot also varied spatially, with higher proportions (8-33%) at southern stations (C1, A2) near the Nansha Island than northern stations (1-16%), implying a greater accumulation of external N in the south. The deeper nitracline in the southern SCS may hinder upwelling of subsurface (~200 m) NO3–, and thus favor the growth of diazotrophs, which would lead to higher fatm-fix/tot. The depth-integrated mean value of fatm-fix/tot was 7 ± 6% (1-22%, n=10) in the Δδ18ONO3-negative layer, slightly lower than in the Δδ18ONO3-positive layer (17-28%) but comparable to the previously reported proportion of 1-22% (Wong et al., 2007; Lu et al., 2019; Yang et al., 2022). Taken together, the above results imply the importance of AND/N2 fixation to the total NO3– pool in the upper ocean, although their average contribution is lower than that supplied by nitrification (Knapp et al., 2008; Bourbonnais et al., 2009; Tang et al., 2019).
By deducting the total NO3– contribution of nitrification (17 ± 10%) and external N inputs (7 ± 6%), we can obtain the average contribution of upwelled NO3– to the total NO3– pool as 76 ± 12% in the Δδ18ONO3-negative layer. Therefore, δ15NNO3 and δ18ONO3 signature in the Δδ18ONO3-negative layer were similar to that at 200 m (Figures 1D, 1E), but also under the co-influence of nitrification and external N inputs. This finding suggests the complicated of N dynamics in the upper ocean of marginal seas with variable contributions from various N sources and processes.
5. Conclusions
All information collected regarding NO3– dynamics, external sources and processes in the upper water column of the SCS was assembled into a conceptual diagram (Figure 3). Vertically, NO3– concentrations increased with depth while its δ15NNO3 and δ18ONO3 covaried becoming higher towards the surface (<20 m) due to phytoplankton assimilation. The isotope effect during NO3– uptake was 2.8 ± 1.2‰ (n=14) for N and 5.0 ± 2.8‰ (n=15) for O, deduced from the Rayleigh model, with a ratio of 2.0 ± 0.6 (O/N, n=13). This high O/N ratio was attributable to nitrification and/or N2 fixation. At the depth of ~100 m at some stations, a negative shift in δ15NNO3 deviated significantly from the vertical pattern of δ18ONO3, suggesting an addition of isotopically light N. The relative contributions of external N sources and internal processes was assessed by taking advantage of high-resolution observations, revealing clear vertical variations in their contributions in the δ18ONO3-based two-layer structure. In the Δδ18ONO3-positive layer, the NO3– assimilated by phytoplankton were largely sourced from nitrification (39 ± 11%) and AND/N2 fixation (17-28%). In the Δδ18ONO3-negative layer, the proportions of regenerated NO3– and external N inputs to the total NO3– pool were 17 ± 10% and 7 ± 6% (n=10), respectively. These findings suggests that in addition to upwelled NO3– from subsurface waters (~200 m), nitrification and external N sources (AND/N2 fixation) also play an important role in modulating the NO3– pool, affecting its isotopic signatures and cycling dynamics in the upper water column of the SCS.
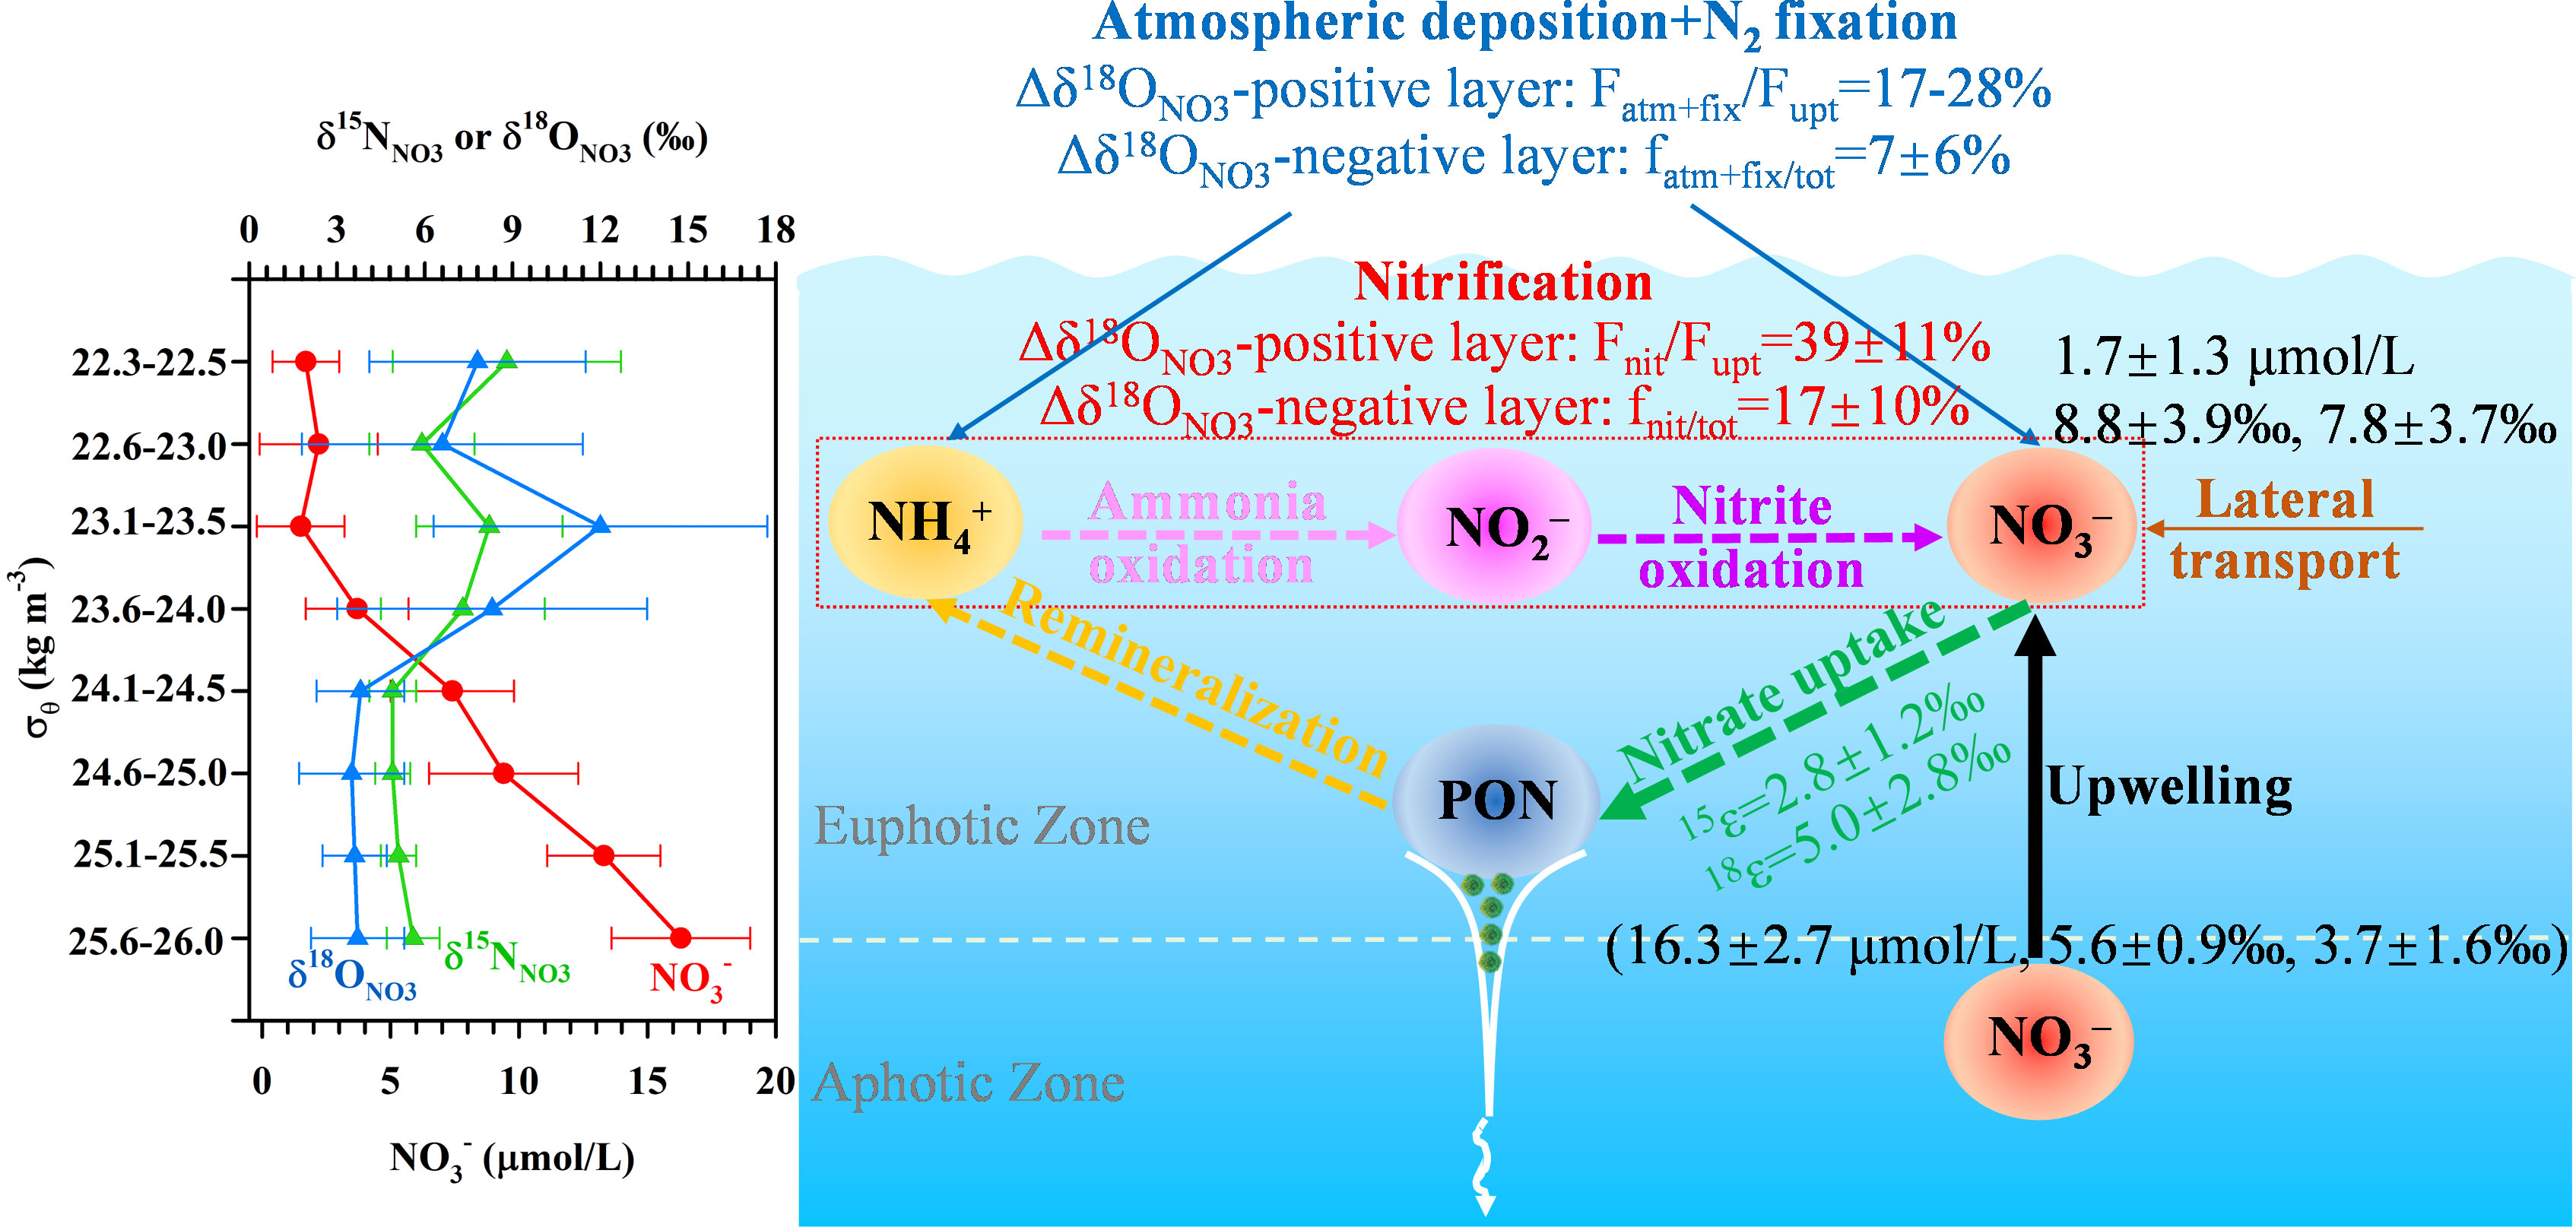
Figure 3 Conceptual diagram for NO3– dynamics in the upper water column of the SCS.
Data availability statement
The datasets presented in this study can be found in online repositories. The names of the repository/repositories and accession number(s) can be found below: the Zenodo deposit, https://www.zenodo.org/record/7219590 (Doi: 10.5281/zenodo.7219590).
Author contributions
S-JK and MD supervised and conceived this work. J-YY, MX, ET, ZZ and WZ contributed to the sample collection. XY conducted chemical and data analysis and wrote the manuscript. S-JK, XY and J-YY reviewed and edited the manuscript. All authors contributed to the article and approved the submitted version.
Funding
This research was supported by the National Natural Science Foundation of China (NSFC 42176046, 42106048, 41890802, 92058204, 41721005), the Basic and Applied Basic Research Foundation of Guangdong Province (2019A1515010611), the State Key Laboratory of Marine Resource Utilization in South China Sea (Hainan University; MRUKF2021017), and the Shantou University Scientific Research Foundation for Talents (NTF18013).
Acknowledgments
We are grateful to Lifang Wang, Tao Huang, Qiao Wu and Xianhui Wan for his assistance in sample collection and measurement during the cruise.
Conflict of interest
The authors declare that the research was conducted in the absence of any commercial or financial relationships that could be construed as a potential conflict of interest.
Publisher’s note
All claims expressed in this article are solely those of the authors and do not necessarily represent those of their affiliated organizations, or those of the publisher, the editors and the reviewers. Any product that may be evaluated in this article, or claim that may be made by its manufacturer, is not guaranteed or endorsed by the publisher.
Supplementary material
The Supplementary Material for this article can be found online at: https://www.frontiersin.org/articles/10.3389/fmars.2022.1104135/full#supplementary-material
References
Böhlke J. K., Mroczkowski S. J., Coplen T. B. (2003). Oxygen isotopes in nitrate: new reference materials for 18O:17O:16O measurements and observations on nitrate-water equilibration. Rapid Commun. Mass Spectrometry 17 (16), 1835–1846. doi: 10.1002/rcm.1123
Bourbonnais A., Lehmann M. F., Waniek J. J., Schulz-Bull D. E. (2009). Nitrate isotope anomalies reflect N2 fixation in the Azores front region (subtropical NE Atlantic). J. Geophysical Res. 114 (C3), C03003. doi: 10.1029/2007jc004617
Buchanan P. J., Aumont O., Bopp L., Mahaffey C., Tagliabue A. (2021). Impact of intensifying nitrogen limitation on ocean net primary production is fingerprinted by nitrogen isotopes. Nat. Communication 12 (1), 6214. doi: 10.1038/s41467-021-26552-w
Casciott K. L., Sigman D. M., Hastings M. G., Bohlke J. K., Hilkert A. (2002). Measurement of the oxygen isotopic composition of nitrate in seawater and freshwater using the denitrifier method. Analytical Chem. 74 (19), 4905–4912. doi: 10.1021/ac020113w
Chen Y.-l. L., Chen H.-Y., Karl D. M., Takahashi M. (2004). Nitrogen modulates phytoplankton growth in spring in the south China Sea. Continental Shelf Res. 24, 527–541. doi: 10.1016/j.csr.2003.12.006
Chen F., Zhou X., Lao Q., Wang S., Jin G., Chen C., et al. (2019). Dual isotopic evidence for nitrate sources and active biological transformation in the northern south China Sea in summer. PLoS One 14 (1), e0209287. doi: 10.1371/journal.pone.0209287
Dai M., Wang L., Guo X., Zhai W., He B., Kao S. J. (2008). Nitrification and inorganic nitrogen distribution in a large perturbed river/estuarine system: the pearl river estuary, China. Biogeosciences 5, 1227–1244. doi: 10.5194/bg-5-1227-2008
Deutsch C., Gruber N., Key R. M., Sarmiento J. L., Ganachaud A. (2001). Denitrification and N2 fixation in the pacific ocean. Global Biogeochemical Cycles 15 (2), 483–506. doi: 10.1029/2000gb001291
Deutsch C., Sigman D. M., Thunell R. C., Meckler A. N., Haug G. H. (2004). Isotopic constraints on glacial/interglacial changes in the oceanic nitrogen budget. Global Biogeochemical Cycles 18 (4), GB4012. doi: 10.1029/2003GB002189
Deutsch C., Weber T. (2012). Nutrient ratios as a tracer and driver of ocean biogeochemistry. Annu. Rev. Mar. Sci. 4 (1), 113–141. doi: 10.1146/annurev-marine-120709-142821
DiFiore P. J., Sigman D. M., Karsh K. L., Trull T. W., Dunbar R. B., Robinson R. S. (2010). Poleward decrease in the isotope effect of nitrate assimilation across the southern ocean. Geophysical Res. Lett. 37 (17), L17601. doi: 10.1029/2010GL044090
Dugdale R., Goering J. (1967). Uptake of new and regenerated forms of nitrogen in marine production. Limnology Oceanography 12, 196–206. doi: 10.4319/lo.1967.12.2.0196
Du C., Liu Z., Dai M., Kao S. J., Cao Z., Zhang Y., et al. (2013). Impact of the kuroshio intrusion on the nutrient inventory in the upper northern south China Sea: insights from an isopycnal mixing model. Biogeosciences 10 (10), 6419–6432. doi: 10.5194/bg-10-6419-2013
Du C., Liu Z., Kao S. J., Dai M. (2017). Diapycnal fluxes of nutrients in an oligotrophic oceanic regime: The south China Sea. Geophysical Res. Lett. 44 (11), 510–511, 518. doi: 10.1002/2017gl074921
Emeis K.-C., Mara P., Schlarbaum T., Möbius J., Dähnke K., Struck U., et al. (2010). External n inputs and internal n cycling traced by isotope ratios of nitrate, dissolved reduced nitrogen, and particulate nitrogen in the eastern Mediterranean Sea. J. Geophysical Res. 115 (G4), GB04041. doi: 10.1029/2009jg001214
Falkowski P. (1997). Evolution of the nitrogen cycle and its influence on the biological sequestration of CO2 in the ocean. Nature 387 (6630), 272–275. doi: 10.1038/387272a0
Fawcett S. E., Ward B. B., Lomas M. W., Sigman D. M. (2015). Vertical decoupling of nitrate assimilation and nitrification in the Sargasso Sea. Deep Sea Res. Part I: Oceanographic Res. Papers 103, 64–72. doi: 10.1016/j.dsr.2015.05.004
Granger J., Prokopenko M. G., Mordy C. W., Sigman D. M. (2013). The proportion of remineralized nitrate on the ice-covered eastern Bering Sea shelf evidenced from the oxygen isotope ratio of nitrate. Global Biogeochemical Cycles 27 (3), 962–971. doi: 10.1002/gbc.20075
Granger J., Sigman D. M. (2009). Removal of nitrite with sulfamic acid for nitrate n and O isotope analysis with the denitrifier method. Rapid Commun. Mass Spectrometry 23 (23), 3753–3762. doi: 10.1002/rcm.4307
Granger J., Sigman D. M., Lehmann M. F., Tortell P. (2008). Nitrogen and oxygen isotope fractionation during dissimilatory nitrate reduction by denitrifying bacteria. Limnology Oceanography 53 (6), 2533–2545. doi: 10.4319/lo.2008.53.6.2533
Granger J., Sigman D. M., Needoba J. A., Harrison P. J. (2004). Coupled nitrogen and oxygen isotope fractionation of nitrate during assimilation by cultures of marine phytoplankton. Limnology Oceanography 49 (5), 1763–1773. doi: 10.4319/lo.2004.49.5.1763
Granger J., Sigman D. M., Rohde M. M., Maldonado M. T., Tortell P. D. (2010). N and O isotope effects during nitrate assimilation by unicellular prokaryotic and eukaryotic plankton cultures. Geochimica Cosmochimica Acta 74 (3), 1030–1040. doi: 10.1016/j.gca.2009.10.044
Gruber N., Sarmiento J. L. (1997). Global patterns of marine nitrogen fixation and denitrification. Global Biogeochemical Cycles 11 (2), 235–266. doi: 10.1029/97GB00077
Hu J., Kawamura H., Hong H., Qi Y. (2000). A review on the currents in the south China Sea: Seasonal circulation, south China Sea warm current and kuroshio intrusion. J. Oceanography 56 (6), 607–624. doi: 10.1023/a:1011117531252
Kao S. J., Terence Yang J. Y., Liu K. K., Dai M., Chou W. C., Lin H. L., et al. (2012). Isotope constraints on particulate nitrogen source and dynamics in the upper water column of the oligotrophic south China Sea. Global Biogeochemical Cycles 26 (2), GB2033. doi: 10.1029/2011GB004091
Karsh K. L., Trull T. W., Sigman D. M., Thompson P. A., Granger J. (2014). The contributions of nitrate uptake and efflux to isotope fractionation during algal nitrate assimilation. Geochimica Cosmochimica Acta 132, 391–412. doi: 10.1016/j.gca.2013.09.030
Kim I.-N., Lee K., Gruber N., Karl D. M., Bullister J. L., Yang S., et al. (2014). Increasing anthropogenic nitrogen in the north pacific ocean. Science 346 (6213), 1102–1106. doi: 10.1126/science.1258396
Knapp A. N., DiFiore P. J., Deutsch C., Sigman D. M., Lipschultz F. (2008). Nitrate isotopic composition between Bermuda and Puerto Rico: Implications for N2 fixation in the Atlantic ocean. Global Biogeochemical Cycles 22 (3), GB3014. doi: 10.1029/2007GB003107
Liu S. M., Ning X., Dong S., Song G., Wang L., Altabet M. A., et al. (2020). Source versus recycling influences on the isotopic composition of nitrate and nitrite in the East China Sea. J. Geophysical Research: Oceans 125 (8), e2020JC016061. doi: 10.1029/2020jc016061
Liu Z., Zhao Y., Colin C., Stattegger K., Wiesner M. G., Huh C.-A., et al. (2016). Source-to-sink transport processes of fluvial sediments in the south China Sea. Earth-Science Rev. 153, 238–273. doi: 10.1016/j.earscirev.2015.08.005
Loick N., Dippner J., Doan H. N., Liskow I., Voss M. (2007). Pelagic nitrogen dynamics in the Vietnamese upwelling area according to stable nitrogen and carbon isotope data. Deep Sea Res. Part I: Oceanographic Res. Papers 54 (4), 596–607. doi: 10.1016/j.dsr.2006.12.009
Lu Y., Wen Z., Shi D., Lin W., Bonnet S., Dai M., et al. (2019). Biogeography of N2 fixation influenced by the Western boundary current intrusion in the south China Sea. J. Geophysical Research: Oceans 124 (10), 6983–6996. doi: 10.1029/2018jc014781
Marconia D., Weiganda M. A., Sigmana D. M. (2019). Nitrate isotopic gradients in the north Atlantic ocean and the nitrogen isotopic composition of sinking organic matter. Deep-Sea Res. Part I 145, 109–124. doi: 10.1016/j.dsr.2019.01.010
Moore C. M., Mills M. M., Arrigo K. R., Berman-Frank I., Bopp L., Boyd P. W., et al. (2013). Processes and patterns of oceanic nutrient limitation. Nat. Geosci. 6 (9), 701–710. doi: 10.1038/ngeo176
Nan F., Xue H., Yu F. (2015). Kuroshio intrusion into the south China Sea: A review. Prog. Oceanography 137, 314–333. doi: 10.1016/j.pocean.2014.05.012
Needoba J. A., Harrison P. J. (2004). Influence of low light and a light:dark cycle on NO3- uptake, intracellular NO3-, and nitrogen isotope fractionation by marine phytoplankton. J. Phycology 40 (3), 505–516. doi: 10.1111/j.1529-8817.2004.03171.x
Needoba J. A., Waser N. A., Harrison P. J., Calvert S. (2003). Nitrogen isotope fractionation in 12 species of marine phytoplankton during growth on nitrate. Mar. Ecol. Progresss Serises 255, 81–91. doi: 10.3354/meps255081
Peng X., Fawcett S. E., van Oostende N., Wolf M. J., Marconi D., Sigman D. M., et al. (2018). Nitrogen uptake and nitrification in the subarctic north Atlantic ocean. Limnology Oceanography 63 (4), 1462–1487. doi: 10.1002/lno.10784
Rafter P. A., DiFiore P. J., Sigman D. M. (2013). Coupled nitrate nitrogen and oxygen isotopes and organic matter remineralization in the southern and pacific oceans. J. Geophysical Research: Oceans 118 (10), 4781–4794. doi: 10.1002/jgrc.20316
Rafter P. A., Sigman D. M. (2016). Spatial distribution and temporal variation of nitrate nitrogen and oxygen isotopes in the upper equatorial pacific ocean. Limnology Oceanography 61 (1), 14–31. doi: 10.1002/lno.10152
Rohde M. M., Granger J., Sigman D. M., Lehmann M. F. (2015). Coupled nitrate n and O stable isotope fractionation by a natural marine plankton consortium. Front. Mar. Sci. 2 (28). doi: 10.3389/fmars.2015.00028
Shi G., Ma H., Zhu Z., Hu Z., Chen Z., Jiang S., et al. (2021). Using stable isotopes to distinguish atmospheric nitrate production and its contribution to the surface ocean across hemispheres. Earth Planetary Sci. Lett. 564, 116914. doi: 10.1016/j.epsl.2021.116914
Sigman D. M., Casciott K. L., Andreani M., Barford C., Galanter M., Bohlke J. K. (2001). A bacterial method for the nitrogen isotopic analysis of nitrate in seawater and freshwater. Analytical Chem. 73 (17), 4145–4153. doi: 10.1021/ac010088e
Sigman D. M., Fripiat F. (2019). “Nitrogen isotopes in the ocean,” in Encyclopedia of ocean sciences, 3rd ed. Ed. Cochran J. K., Bokuniewicz H. J., Yager P. L., (Oxford: Academic Press). 263–278. doi: 10.1016/b978-0-12-409548-9.11605-7
Sigman D. M., Granger J., DiFiore P. J., Lehmann M. M., Ho R., Cane G., et al. (2005). Coupled nitrogen and oxygen isotope measurements of nitrate along the eastern north pacific margin. Global Biogeochemical Cycles 19 (4), GB4022. doi: 10.1029/2005GB002458
Tang W., Wang S., Fonseca-Batista D., Dehairs F., Gifford S., Gonzalez A. G., et al. (2019). Revisiting the distribution of oceanic N2 fixation and estimating diazotrophic contribution to marine production. Nat. Communication 10 (1), 831. doi: 10.1038/s41467-019-08640-0
Tuerena R. E., Hopkins J., Ganeshram R. S., Norman L., de la Vega C., Jeffreys R., et al. (2021). Nitrate assimilation and regeneration in the barents Sea: insights from nitrate isotopes. Biogeosciences 18 (2), 637–653. doi: 10.5194/bg-18-637-2021
Umezawa Y., Yamaguchi A., Ishizaka J., Hasegawa T., Yoshimizu C., Tayasu I., et al. (2014). Seasonal shifts in the contributions of the changjiang river and the kuroshio current to nitrate dynamics in the continental shelf of the northern East China Sea based on a nitrate dual isotopic composition approach. Biogeosciences 11 (4), 1297–1317. doi: 10.5194/bg-11-1297-2014
Van Oostende N., Fawcett S. E., Marconi D., Lueders-Dumont J., Sabadel A. J. M., Woodward E. M. S., et al. (2017). Variation of summer phytoplankton community composition and its relationship to nitrate and regenerated nitrogen assimilation across the north Atlantic ocean. Deep Sea Res. Part I: Oceanographic Res. Papers 121, 79–94. doi: 10.1016/j.dsr.2016.12.012
Wankel S. D., Kendall C., Paytan A. (2009). Using nitrate dual isotopic composition (δ15N and δ18O) as a tool for exploring sources and cycling of nitrate in an estuarine system: Elkhorn Slough, California. J. Geophysical Res. 114 (G1), G01011. doi: 10.1029/2008jg000729
Wankel S. D., Kendall C., Pennington J. T., Chavez F. P., Paytan A. (2007). Nitrification in the euphotic zone as evidenced by nitrate dual isotopic composition: Observations from Monterey bay, California. Global Biogeochemical Cycles 21 (2), GB2009. doi: 10.1029/2006gb002723
Wan X. S., Sheng H. X., Dai M., Zhang Y., Shi D., Trull T. W., et al. (2018). Ambient nitrate switches the ammonium consumption pathway in the euphotic ocean. Nat. Communication 9 (1), 915. doi: 10.1038/s41467-018-03363-0
Waser N., Harrison P., Nielsen B., Calvert S., Turpin D. (1998). Nitrogen isotope fractionation during the uptake and assimilation of nitrate, nitrite, ammonium, and urea by a marine diatom. Limnology Oceanography 43 (2), 215–224. doi: 10.4319/lo.1998.43.2.0215
Wilson C., Coles V. J. (2005). Global climatological relationships between satellite biological and physical observations and upper ocean properties. J. Geophysical Res. 110 (C10), C10001. doi: 10.1029/2004jc002724
Wong G. T. F., Tseng C.-M., Wen L.-S., Chung S.-W. (2007). Nutrient dynamics and n-anomaly at the SEATS station. Deep Sea Res. Part II: Topical Stud. Oceanography 54 (14), 1528–1545. doi: 10.1016/j.dsr2.2007.05.011
Wu K., Dai M., Chen J., Meng F., Li X., Liu Z., et al. (2015). Dissolved organic carbon in the south China Sea and its exchange with the Western pacific ocean. Deep Sea Res. Part II: Topical Stud. Oceanography 122, 41–51. doi: 10.1016/j.dsr2.2015.06.013
Xu M. N., Zhang W., Zhu Y., Liu L., Zheng Z., Wan X. S., et al. (2018). Enhanced ammonia oxidation caused by lateral kuroshio intrusion in the boundary zone of the northern south China Sea. Geophysical Res. Lett. 45, 6585–6593. doi: 10.1029/2018GL077896
Yang J.-Y., Hsu S.-C., Dai M., Hsiao S.-Y., Kao S.-J. (2014). Isotopic composition of water-soluble nitrate in bulk atmospheric deposition at dongsha island: sources and implications of external n supply to the northern south China Sea. Biogeosciences 11 (7), 1833–1846. doi: 10.5194/bg-11-1833-2014
Yang J.-Y. T., Kao S.-J., Dai M., Yan X., Lin H.-L. (2017). Examining n cycling in the northern south China Sea from n isotopic signals in nitrate and particulate phases. J. Geophysical Research: Biogeosciences 122 (8), 2118–2136. doi: 10.1002/2016JG003618
Yang J.-Y. T., Tang J.-M., Kang S., Dai M., Kao S.-J., Yan X., et al. (2022). Comparison of nitrate isotopes between the south China Sea and Western north pacific ocean. J. Geophysical Research: Oceans 127, e2021JC018304. doi: 10.1029/2021JC018304
Yan X., Wan X. S., Liu L., Xu M. N., Tan E., Zheng Z., et al. (2019). Biogeochemical dynamics in a eutrophic tidal estuary revealed by isotopic compositions of multiple nitrogen species. J. Geophysical Research: Biogeosciences 124 (7), 1849–1864. doi: 10.1029/2018jg004959
Yan X., Xu M. N., Wan X. S., Yang J.-Y. T., Trull T. W., Dai M., et al. (2017). Dual isotope measurements reveal zoning of nitrate processing in the summer changjiang (Yangtze) river plume. Geophysical Res. Lett. 44 (24), 12289–12297. doi: 10.1002/2017GL075951
Yool A., Martin A. P., Fernandez C., Clark D. R. (2007). The significance of nitrification for oceanic new production. Nature 447 (7147), 999–1002. doi: 10.1038/nature05885
Yoshikawa C., Makabe A., Matsui Y., Nunoura T., Ohkouchi N. (2018). Nitrate isotope distribution in the subarctic and subtropical north pacific. Geochemistry Geophysics Geosystems 19, 2212–2214. doi: 10.1029/2018GC007528
Yoshikawa C., Makabe A., Shiozaki T., Toyoda S., Yoshida O., Furuya K., et al. (2015). Nitrogen isotope ratios of nitrate and n* anomalies in the subtropical south pacific. Geochemistry Geophysics Geosystems 16 (5), 1439–1448. doi: 10.1002/2014gc005678
Keywords: nitrogen dynamcis, South China Sea (SCS), nitrification, external nitrogen source, nitrogen isotope (δ15N), nitrogen uptake
Citation: Yan X, Yang J-YT, Xu MN, Tan E, Zheng Z, Zou W, Dai M and Kao S-J (2022) Isotope constraints on nitrogen dynamics in the upper water column of the South China Sea. Front. Mar. Sci. 9:1104135. doi: 10.3389/fmars.2022.1104135
Received: 21 November 2022; Accepted: 05 December 2022;
Published: 16 December 2022.
Edited by:
Xianbiao Lin, Ocean University of China, ChinaCopyright © 2022 Yan, Yang, Xu, Tan, Zheng, Zou, Dai and Kao. This is an open-access article distributed under the terms of the Creative Commons Attribution License (CC BY). The use, distribution or reproduction in other forums is permitted, provided the original author(s) and the copyright owner(s) are credited and that the original publication in this journal is cited, in accordance with accepted academic practice. No use, distribution or reproduction is permitted which does not comply with these terms.
*Correspondence: Xiuli Yan, eWFueGxAc3R1LmVkdS5jbg==; Shuh-Ji Kao, c2prYW9AeG11LmVkdS5jbg==