 Chunxue Yang
 Clément Bricaud
 Marie Drévillon
 Andrea Storto
 Alessio Bellucci
 Rosalia Santoleri
- 1Institute of Marine Sciences, National Research Council of Italy, Rome, Italy
- 2Mercator Ocean International, Ramonville-Saint-Agne, France
- 3Institute of Atmospheric Sciences and Climate, National Research Council of Italy, Bologna, Italy
The role of eddies in the North Atlantic decadal variability is investigated in this study by using two ocean reanalyses, including an eddy permitting (or eddy poor) reanalysis with horizontal resolution of 0.25 degree and 75 vertical levels and an eddy resolving (or eddy rich) reanalysis with horizontal resolution of 1/12 degree and 50 vertical levels. The prominent mid-1990s warming and post-2005 cooling trend as part of the North Atlantic decadal variability is well displayed in both reanalyses with no significant difference between them. The main driver of the mid-1990s warming and post-2005 cooling trend is the increase and reduction of the meridional ocean heat transport showing similar patterns in both reanalyses. The relative contribution of the heat transport anomalies from eddies to the total heat transport anomalies is slightly larger in eddy resolving than in eddy permitting ocean reanalysis. However, the total mean ocean meridional heat transport increases by 10% in eddy resolving reanalysis with respect to eddy permitting reanalysis and is mainly due to the associated increase of the mean states (temperature and velocity). Therefore, the increase of eddy population due to the increase of horizontal resolution, found by comparing the two datasets, does not affect the MHT anomalies significantly and, consequently, the North Atlantic decadal variability. It is found that the importance of the model horizontal resolution for the North Atlantic decadal variability depends on the interaction between the eddies (small scale) and the mean state (large scale) at decadal time scales. Although the fast increase of computational power will allow soon for eddy-resolving predictions, the need to use high resolution modeling tools for decadal predictions depends on the importance of initialization methods and the interaction between small scale and large-scale variabilities. This study has pivotal implications for the development of North Atlantic decadal prediction systems.
Introduction
The North Atlantic is an important region displayed with prominent decadal variability phenomena. Robson et al. (2016) show that the rapid warming in the mid-1990s and cooling from 2005 to 2016 in the eastern subpolar gyre region (SPG) are part of the decadal variability in the North Atlantic. In terms of the mid-1990s rapid warming, several studies have been devoted to study the oceanic and atmospheric processes that are responsible for this abrupt climate change by using observations, climate model simulations and decadal prediction experiments (Robson et al., 2012, 2016; Yeager et al., 2012; Delworth et al., 2016). Ocean reanalyses for the first time are used to study the mid-1990s rapid warming by Yang et al. (2016). The role of data assimilation is investigated therein, showing that the ingestion of observations through data assimilation improves the mean state of the North Atlantic, while the mid-1990s rapid warming event is well represented in both control run (without data assimilation) and ocean reanalysis.
The mechanisms that are responsible for the mid-1990s warming have been proposed in an extensive body of studies (Haìtuìn et al., 2005; Bersch et al., 2007; Sarafanov et al., 2008; Herbaut and Houssais, 2009; Häkkinen et al., 2011; Robson et al., 2012, 2016; Yeager et al., 2012; Delworth et al., 2016; Yang et al., 2016). One of the main drivers of Atlantic variability is the North Atlantic Oscillation (NAO) showing an abrupt change between winters of 1994/1995 and 1995/1996 from a positive to a negative phase. The advection of warm water due to the gyre circulation and the strengthening of the Atlantic Meridional Overturning Circulation (AMOC) accompanied by increasing Meridional Heat Transport (MHT) that results from the change of the NAO are responsible for the mid-1990s rapid warming in the SPG region (Haìtuìn et al., 2005; Bersch et al., 2007; Sarafanov et al., 2008; Robson et al., 2012, 2016; Yeager et al., 2012; Delworth et al., 2016; Yang et al., 2016). A recent study by Robson et al. (2016) shows a reversal in the North Atlantic temperatures trend, turning from warming to cooling around 2005, and the concomitant weakening of the ocean circulation associated with a reduction of MHT due to the occurrence of low-density surface waters in the Labrador Sea. The mid-1990s warming and post 2005 cooling in the North Atlantic are prominent manifestations of decadal variability in the North Atlantic Ocean, where changes in the MHT play a significant role. This prominent decadal variability is also demonstrated in the sea level change in the North Atlantic (Chafik et al., 2019). There is indeed evidence of significant predictability in the North Atlantic sector displayed by decadal prediction experiments, associated with the use of ocean analyses as initialization products (Matei et al., 2012; Bellucci et al., 2013, 2015; Polkova et al., 2019a,b).
Along with numerical and technological developments, the spatial and temporal resolution of climate models has been increasing (Haarsma et al., 2016), allowing the delivery of eddy- resolving (e.g., 1/12 degree resolution) global datasets for large scale climate studies. The primary question we would like to address in this study is the relative role of eddies in the North Atlantic decadal climate variability. More specifically we investigate the contribution of mesoscale ocean eddies to the MHT variability, which in turn drives the decadal climate changes recently observed in the North Atlantic.
The contribution of eddies to the ocean MHT has been investigated in several studies (Roemmich and Gilson, 2001; Jayne and Marotzke, 2002; Qiu and Chen, 2005; Aoki et al., 2013; Treguier et al., 2017; Zhao et al., 2018; Docquier et al., 2019; Sun et al., 2019; Delman and Lee, 2020). For example, a latest estimation using Argo and altimetry observations shows that the eddy heat transport is mainly located within the top 1,000 m and accounts for half of the total heat transport at 45°S and one third at 35°N (Sun et al., 2019). Model studies show that with the increase of model resolution the total MHT increases (Treguier et al., 2012; Grist et al., 2018; Docquier et al., 2019), mainly due to the change of time-mean circulation rather than the eddy component (Treguier et al., 2012). However, previous studies have mainly focused on the role of eddies in the climatology of the total MHT at a certain time period. The impact of model resolution on the MHT variability that is responsible to the North Atlantic decadal variability has been overlooked to the best of the authors’ knowledge. Additionally, the eddy MHT has been explored by using either observations or numerical model simulations. In this study our goal is to investigate the role of eddies in the Atlantic MHT variability by using ocean reanalyses at different model resolutions (1/4 and 1/12 degree).
Ocean reanalyses have been used in several climate studies (Storto et al., 2016; Yang et al., 2016) and climate change monitoring owing to their temporal and spatial consistency of data coverage and dynamically consistent estimates of the ocean states compared to either observations or climate models. Complementing ocean general circulation models with data assimilation has indeed shown to greatly improve the representation of eddies (population, life and extension) with respect to free-run models even in eddy-permitting comparisons in the North Atlantic (Cipollone et al., 2017). Likewise, transports representation has been demonstrated to be better reproduced than in ocean simulations (Jackson et al., 2016, 2018). This study will shed light on the importance of eddy-induced MHT in the large-scale climate variability.
Data and Methods
In this study we use two sets of global ocean reanalyses produced by Mercator Ocean International including the Global Ocean Reanalysis 2 version 4 (GLORYS2V4, hereafter G4, Storto et al., 2019) at ¼ degree (eddy permitting), and the Global Ocean Reanalysis 12 version 1 (GLORYS12V1, hereafter G12, Lellouche et al., 2021) at 1/12 degree horizontal resolution (eddy resolving), both covering the period from 1993 to 2016. A robust validation of these products can be found in quality information documents (Garric and Parent, 2017; Drèvillon et al., 2021a).
The details of the production of G4 are given in Garric and Parent (2018). Here we provide a brief introduction of G4. The ocean dynamic model of the G4 is the Nucleus for European Models of the Ocean version 3.1 (NEMO 3.1, Madec, 2008) coupled with the thermodynamic-dynamic Louvain-la Neuve Sea Ice Model version 2 (LIM2, Fichefet and Morales Maqueda, 1997). The horizontal grid of NEMO is based on a tripolar grid with ¼ degree of horizontal resolution and 75 depth levels. The momentum, heat and freshwater fluxes driving the ocean are calculated based on Large and Yeager (2004) bulk formulas by using atmospheric variables from the ECMWF ERA-Interim atmospheric reanalysis (Dee et al., 2011). The initial conditions are from the United Kingdom Met office EN4 objective analyses (Good et al., 2013) version 4.0.2 for temperature and salinity and the sea ice initial conditions come from National Snow and Ice Data Center (NSDIC) bootstrap products (Comiso, 2000). The data assimilation scheme is the reduced order Kalman filter based on the SEEK formulation (Pham et al., 1998), named as Système d’Assimilation Mercator version 2 (SAM2) and a three-dimensional variational (3D-Var) bias correction scheme is used to correct large-scale temperature and salinity biases (Lellouche et al., 2018). The surface observations assimilated into G4 include satellite-based sea level anomaly and SST and temperature and salinity profiles from CORA 4.1 in situ database provided by the Copernicus Marine Environment Monitoring Service (CMEMS) (Szekely et al., 2015). Sea ice concentrations from IFREMER/CERSAT products (Ezraty et al., 2007) are also assimilated.
The main difference between G12 and G4 is the resolution of the ocean model. As G4, the ocean model of G12 is based on NEMO 3.1 but with the horizontal resolution of 1/12 degree and 50 vertical levels. Further to the resolution, the two reanalyses differ for the precipitation dataset toward which the atmospheric fluxes are corrected (PMWC and GPCPV2.2 for G4 and G12, respectively). The initial conditions and restoring climatology for Gibraltar and Bab-El-Mandeb straits come from EN4.2.0 for G12 and EN4.0.2 for G4 respectively. Details of the G12 configuration are described in Drèvillon et al. (2021a) and the detailed differences between G4 and G12 are described in Drèvillon et al. (2021b).
The method to calculate the eddy component of MHT follows the traditional scale separation approach, as schematized below:
in which T represents ocean temperature and v represents ocean meridional velocity. The and are time mean of v and T for the whole time period (1993–2016); and v′ and T′ are the deviation from the time mean. We follow Crosnier et al. (2001), and use 5-day fields, in order to secure an accurate estimate of MHT. The decomposition of vT for calculating MHT is as follows:
Therefore, the total MHT and decomposition of MHT are calculated according to Equation 4:
The quantities ρ0 and Cp are seawater density (1,020kgm−3) and heat capacity (4,000Jkg−1C−1), respectively.v and T are the meridional velocity and ocean temperature as stated in Equation 1. H is the ocean depth, and λE and λW are the longitude of the eastern and western boundaries of the ocean basin. On the right-hand side of Equation 1, the first term () represents the contribution of the mean advection of mean temperature, the second term () represents the anomalous advection of mean temperature, the third term ()is the mean advection of temperature anomalies and the last term (v′T′) is the contribution of co-variation of anomalous current and anomalous temperature (eddy covariance) to the total ocean MHT.
For simplicity, we omit the integration symbols in the heat transport equation (Equations 5–7). The mean meridional heat transport for the whole time period (1993–2016) is composed of and , described as below:
The anomaly MHT respect to the mean for the period of 1993–2016 and the decomposition becomes:
in which the first term on the right side is canceled by the fifth term, and the sixth and seventh terms are 0. Then for the anomalies we have
The eddy explained variances (EEV) are calculated as
in which MHTT indicates the total Meridional Heat Transport (MHT), MHTL
means the MHT contributed by large scale processes and var is the variance function.
Results
The North Atlantic Decadal Variability
First, we calculated the climatology (Figure 1) of the upper 700 m averaged temperature (T700) in the North Atlantic Ocean in two ocean reanalyses G4 (1/4 degree horizontal resolution), G12 (1/12 degree horizontal resolution) and EN4 objective analysis (EN4.2.1, 1 degree resolution). EN4 objective analysis is from United Kingdom Met Office (Good et al., 2013). Climatological maps of T700 show that in the North Atlantic Ocean, the upper ocean is generally warmer in G12 than in G4 (Figure 1D). Meanwhile, the mean climatology of T700 in G4 and G12 (Figures 1E,F) is warmer than EN4. Due to the prominent decadal signal in the eastern SPG region, we have calculated the time series of T700 in all three datasets over the box (35°N–65°N, 10°W–50°W) following Robson et al. (2016) for the period 1993–2016. It shows that in the eastern SPG region T700 is warmer in G12 than G4 by 0.16°C and EN4 by 0.27°, respectively (Figure 1G).
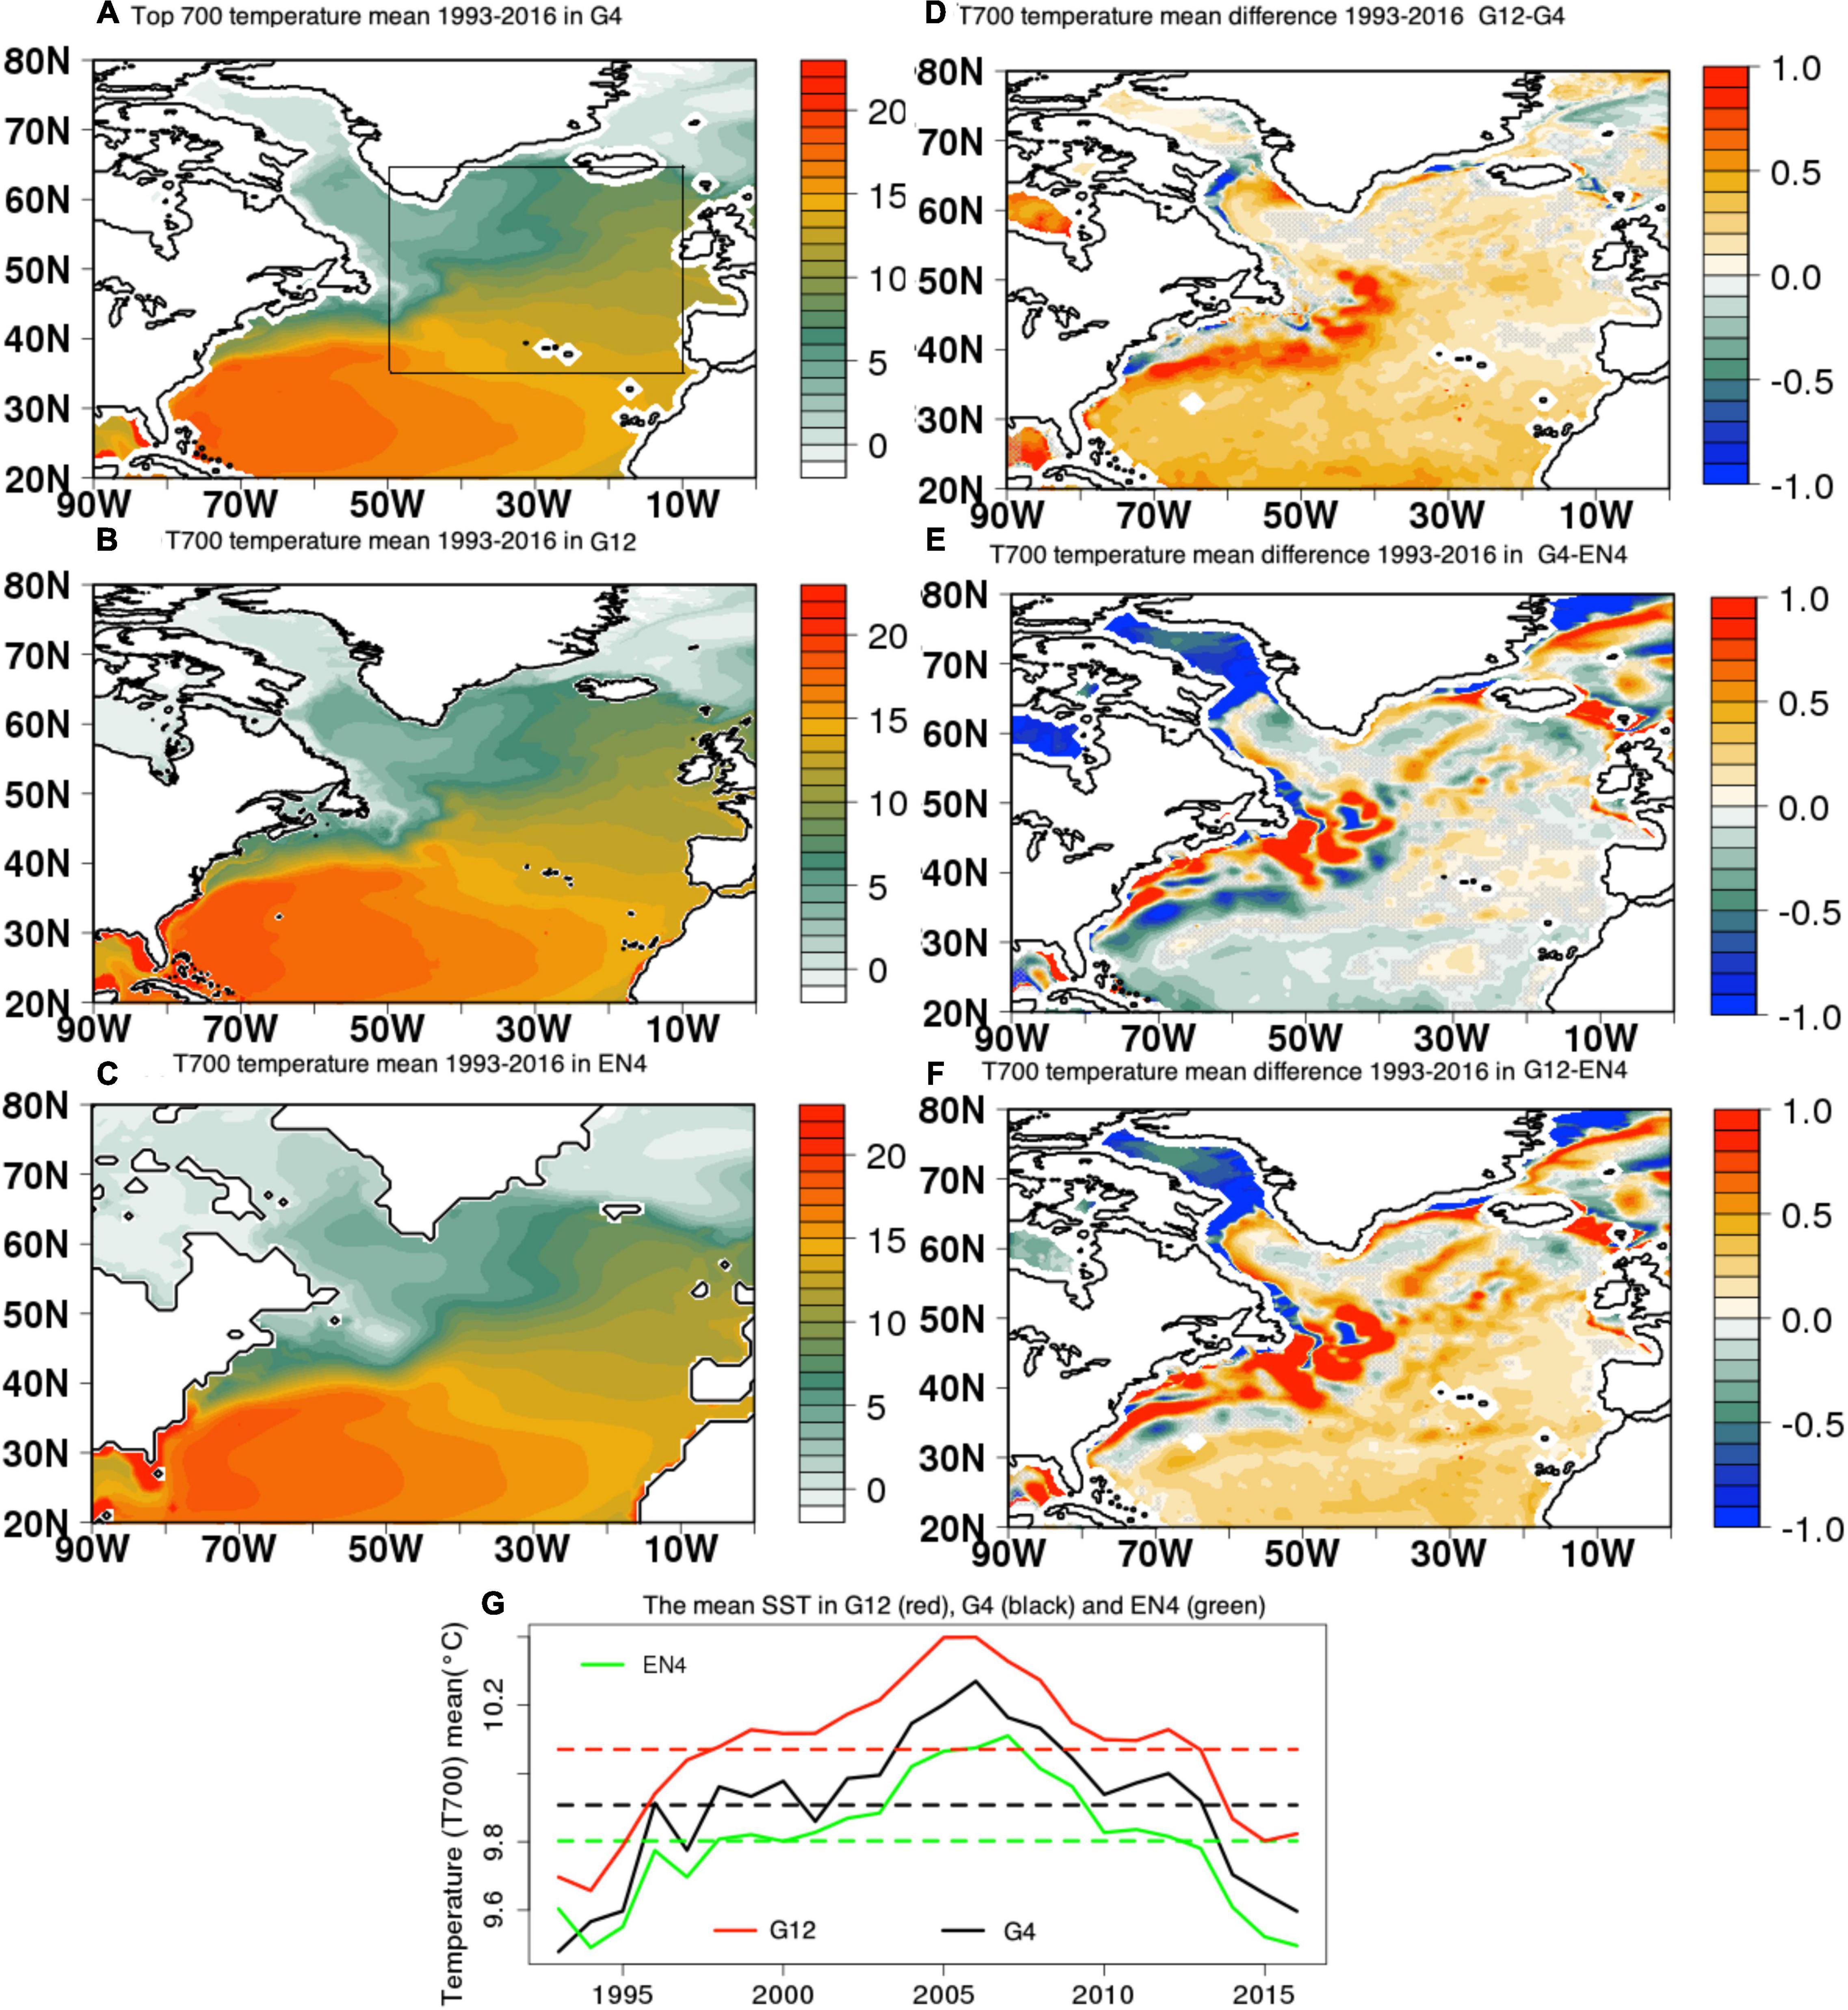
Figure 1. The mean climatology of top 700 m (T700) temperature computed for the 1993–2016 period (A) in G4, (B) in G12, (C) in EN4, (D) the difference between G12 and G4, (E) the difference between G4 and EN4, (F) the difference between G12 and EN4, (G) The T700 averaged in the box area shown in panel (A). Areas with differences that do not pass t-test 95% confidence interval are marked with light gray crosses.
The linear trend associated with the T700, calculated over for the (1993–2004) and (2005–2016) periods from G4, G12 and EN4, are shown in Figures 2A–F. A prominent warming trend during the period of 1993–2004 and a cooling trend during the period of 2005–2016 in the eastern North Atlantic subpolar gyre region is evident in both G4 and G12 reanalyses, and as well as in EN4. Here the linear trend of T700 is based on yearly data. The time series of the annual mean T700 anomaly (Figure 2G), computed with respect to the 1993–2016 baseline and basin averaged over the (35°N–65°N, 50°W–10°W) box in the subpolar gyre (as indicated in Figures 2A–F), shows a consistent linear warming before 2005 and cooling trend after 2005. G4 and G12 show consistent results with EN4, an observation-only estimates, which has been used in previous studies (see Robson et al., 2016) in terms of temperature variability in the North Atlantic Ocean. The distribution of warming and cooling signals is slightly different in G12, G4, and EN4 mainly due to the representation of eddy features of the ocean state. However, the temporal variability is very similar in G12, G4 and EN4 (Figures 1G, 2G). The increase of horizontal resolution alters the mean state of the ocean in terms of temperature (Figure 1) most likely due to better representation of the eddy features in high resolution reanalyses.
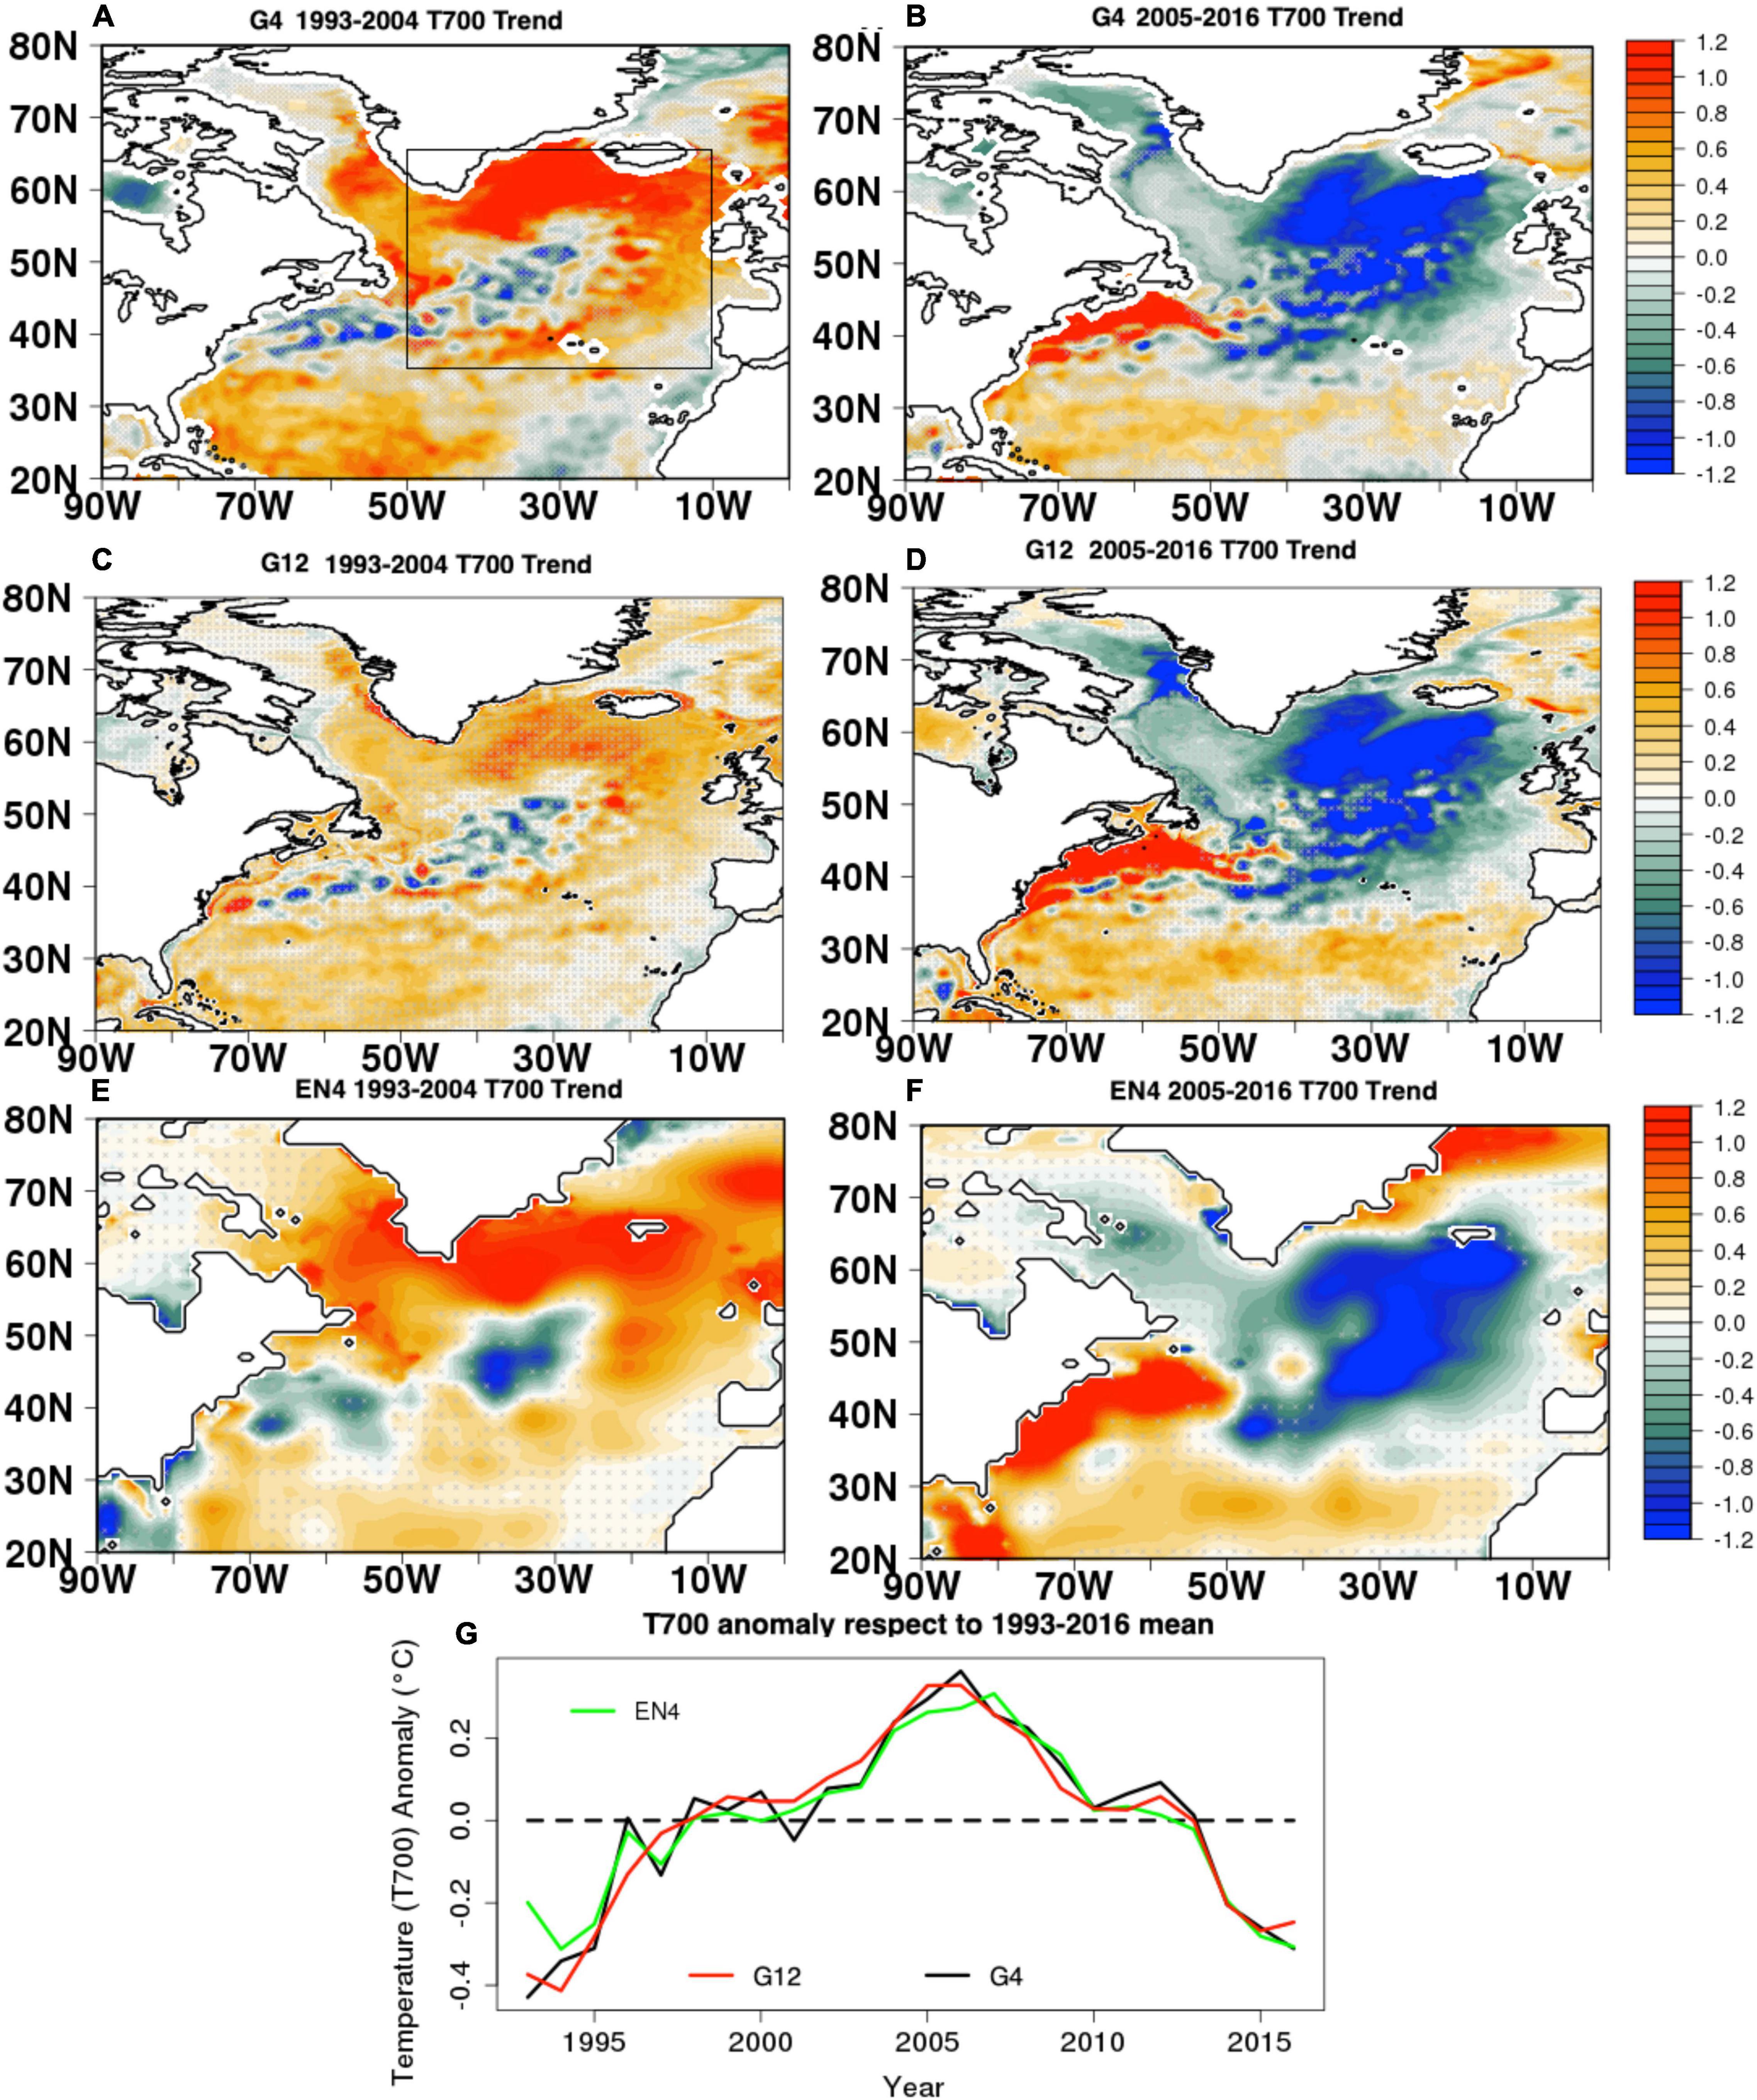
Figure 2. Top 700 temperature (T700) linear trend (unit: °C per decade) (A) from 1993–2004 in G4, (B) from 2005 to 2016 in G4, (C) from 1993–2004 in G12, (D) from 2005 to 2016 in G12, (E) from 1995–2016 in EN4, (F) from 2005–2016 in EN4 and (G) T700 anomaly respect to 1993–2016 mean averaged in the boxed regions (35 N–65 N. 10 W–50 W) shown in panel (A) for G4 (black), G12 (red) and EN4 (green). In panels (A–F) regions that do not pass t-test 95% confidence interval are marked with light gray cross.
In order to have a more in-depth view on the impact of the resolution, we analyzed the eddy kinetic energy (EKE) in G4 and G12 (Figure 3). At the surface, the mean EKE displays a larger amplitude in G12 than in G4. The eddy active areas in G12 extend further north and east compared to G4 and the amplitude of EKE is stronger in the North Atlantic current pathway in G12 than in G4 (Figure 3C). In order to inspect the subsurface structure of EKE in the two reanalyses (Figure 3) we select a meridional section at 40°W, a region where the surface signature of the EKE shows a wide latitudinal extent in both G4 and G12. The subsurface EKE in G12 is stronger and its signature penetrates deeper than in G4 (Figure 3F). As for the temperature, the average EKE in the box shown in Figure 2 (35°N–65°N, 10°W–50°W) for the top 700 m shows that EKE increases by 30% in G12 compared to G4 (not shown here). The EKE difference in G12 and G4 implies that the model resolution has an impact on the eddy activity (increasing of EKE) in contrast to the minor impact on the T700 variability.
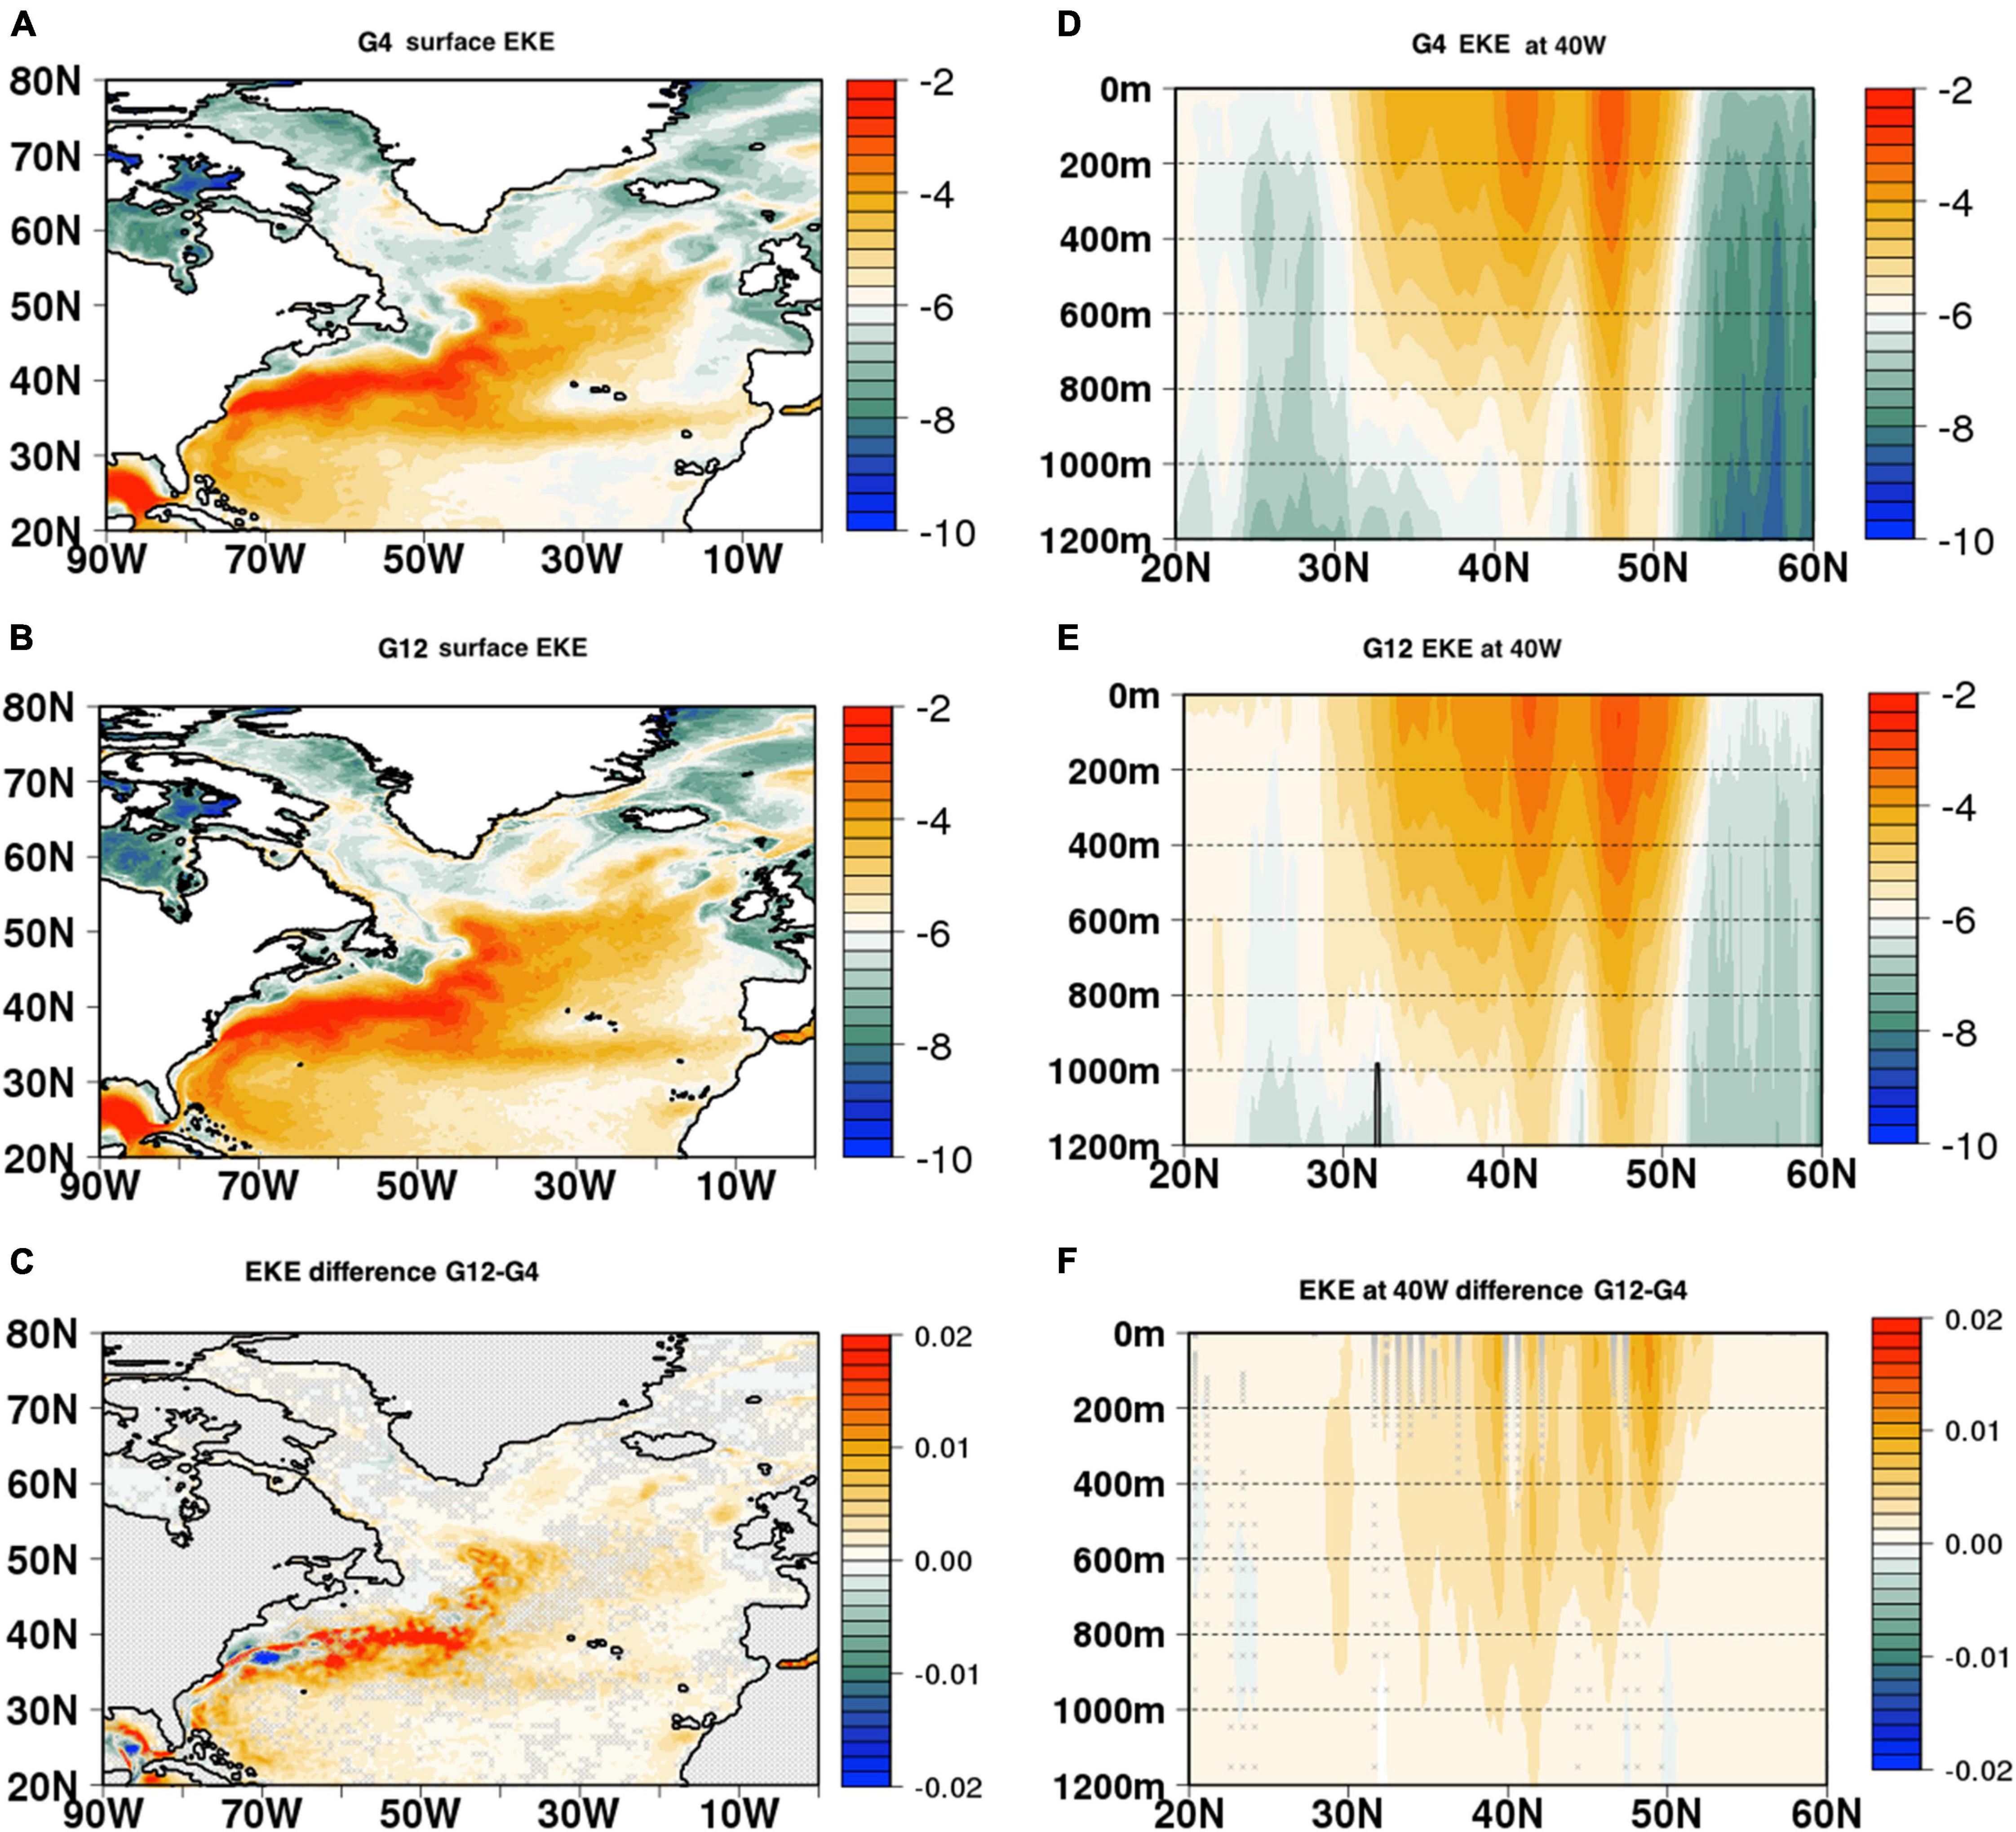
Figure 3. Eddy kinetic energy (EKE) climatology (1993–2016) in (A) G4 and (B) G12 at the surface, (C) the surface EKE difference between G12 and G4, (D) EKE at 40°W in G4, (E) EKE at 40°W in G12 (F) the difference between G12 and G4 from surface to 1,200 m at 40°W. The analysis is based on monthly data. In panels (E,F) areas with values that do not pass t-test 95% confidence interval are indicated with light gray crosses (Unit: log m2/s2 for EKE and m2/s2 for EKE differences).
The North Atlantic Meridional Ocean Heat Transport
As previous studies have shown, decadal variability in the North Atlantic Ocean (including episodes such as the mid-1990s warming and the post-2005 cooling in the subpolar gyre region) is largely associated with changes in the meridional ocean heat transport (Robson et al., 2016; Yang et al., 2016).
First, we have investigated the total mean MHT in G12 and G4 for the whole time period (1993–2016). The total mean MHT () (Figure 4) in G12 is larger than in G4 especially at eddy active latitudinal bands (35°N–40°N), where the eddy heat transport is the largest (Treguier et al., 2017), implying that with the increase of spatial horizontal resolution, the total mean MHT increases (Figure 4, black lines). The increase of total mean MHT is not only located at the eddy active regions but over the whole North Atlantic basin (here 30°N–60°N). The decomposition of the total mean MHT shows that the main contributor to the increase in G12 comes from the time mean field ( for all latitude bands. The mean contribution of the mean field for the time period 1993–2016 (calculated as ) to the total MHT () shows a 10% increase from 669 TW in G4 to 738 TW in G12 at 40°N. The differences between G12 and G4 in terms of the attribution to the eddy covariance contribution to the total MHT plays a minor role (red lines), and the mean eddy covariance contribution (calculated as ) to the total MHT at 40°N for the whole time period (1993–2016) increases from 43 ± 6 TW in G4 to 46 ± 10 TW in G12. This finding is consistent with previous studies (Hecht and Smith, 2008; Treguier et al., 2012) showing that the total mean MHT increases with enhanced horizontal resolution due to the change of the time mean field instead of the change of eddy component and the change of representation of bathymetry, air-sea flux with resolution contribute to the change of the mean state. As shown in Figure 1, the mean T700 in G12 is warmer than in G4, supporting that the time-mean field () difference is one of the main factors that is responsible for the total increase of MHT.
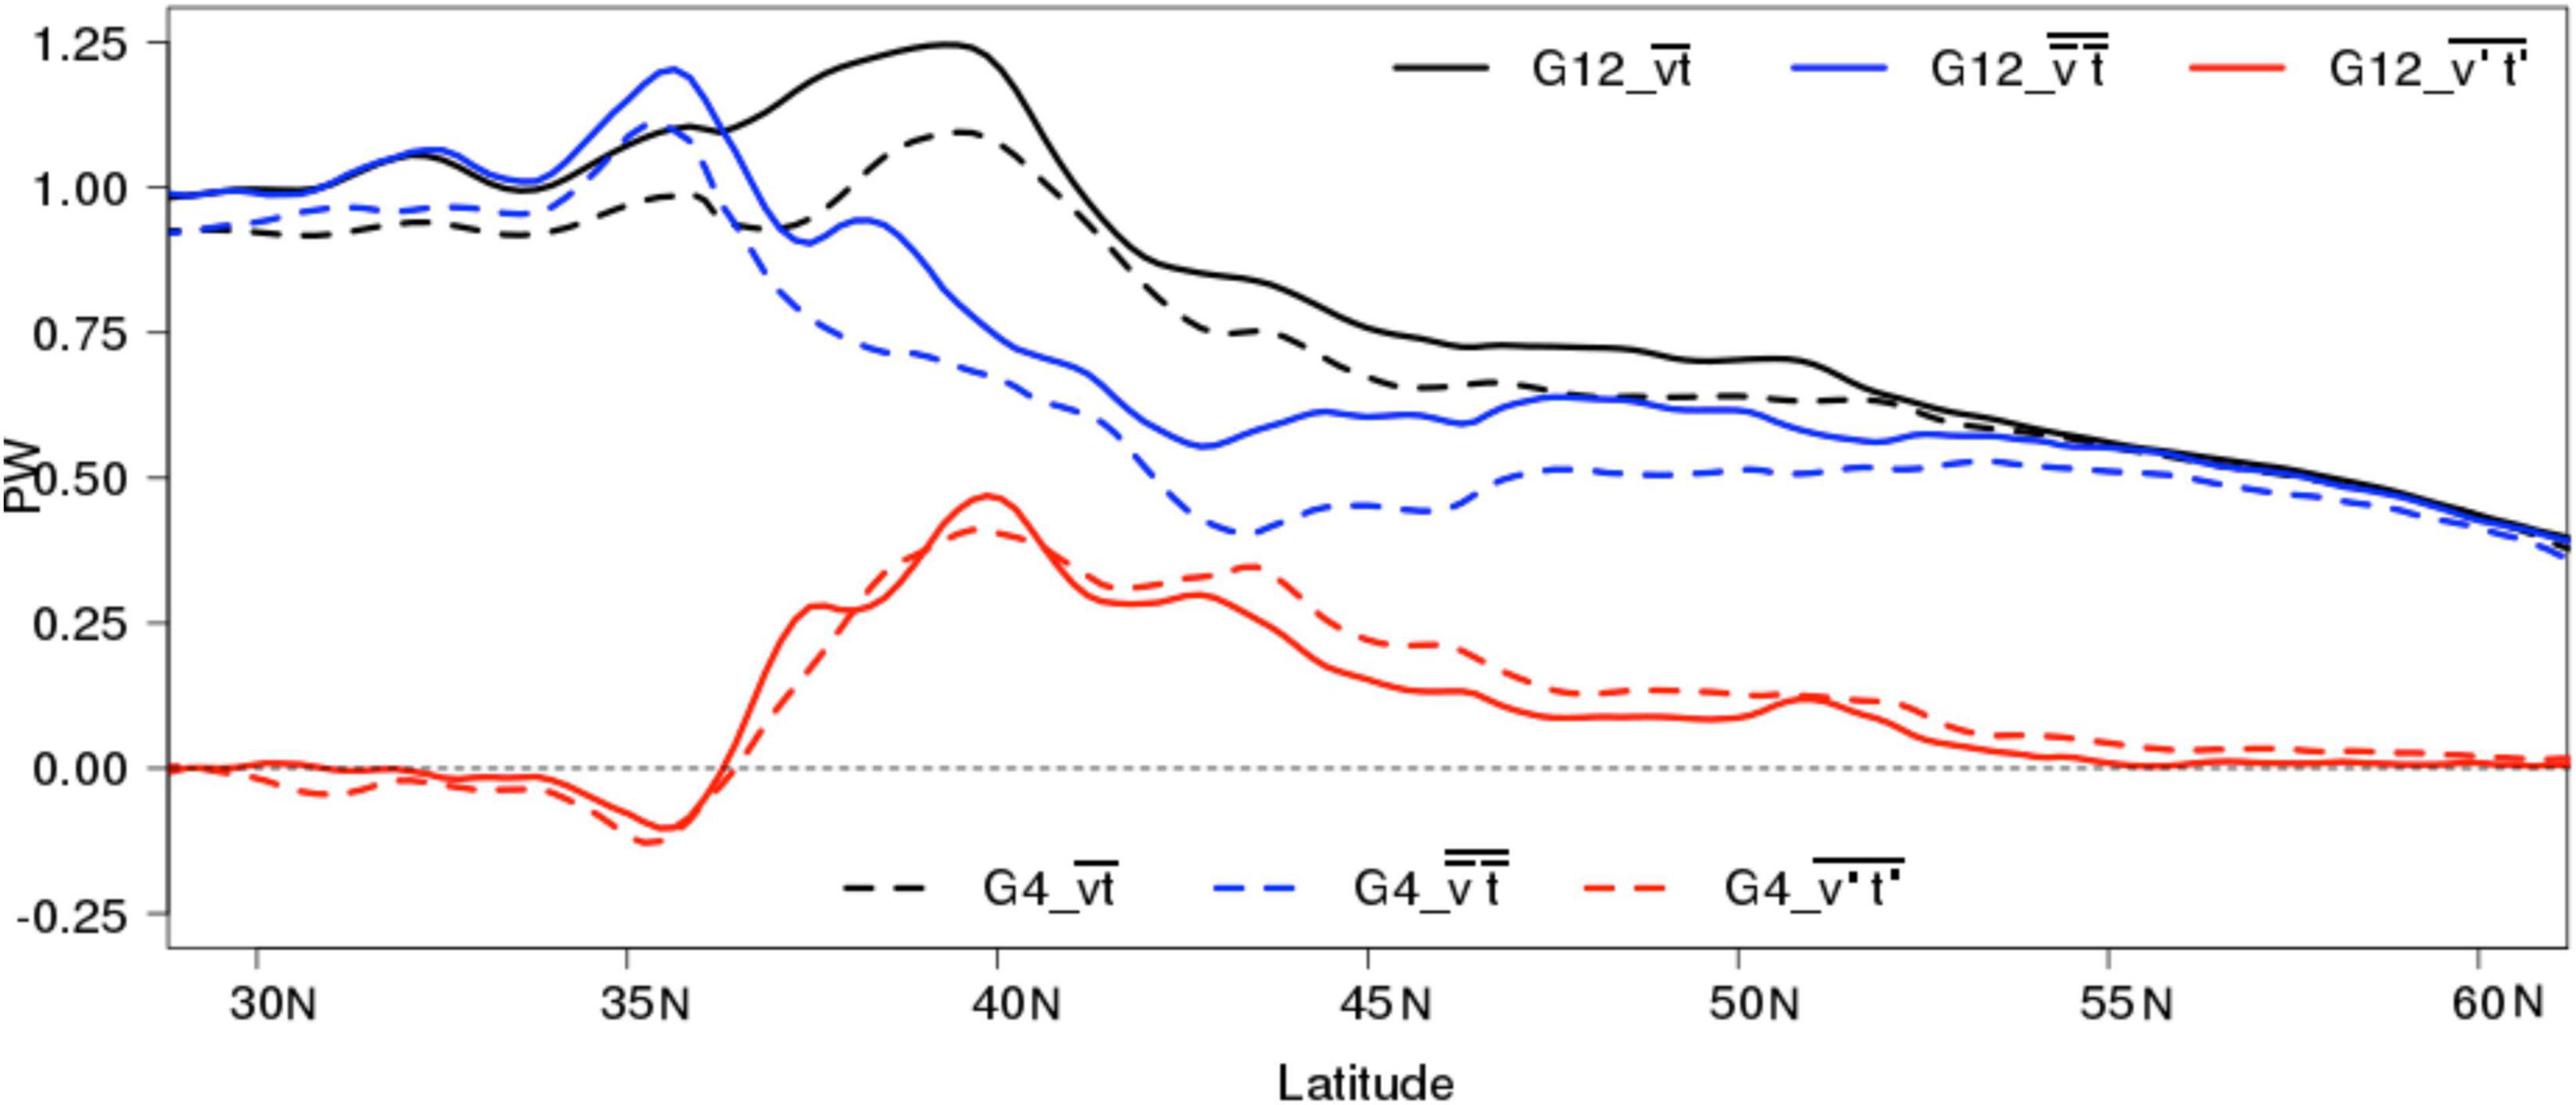
Figure 4. Total mean meridional heat transport (, black lines) and decomposition ( blue lines and red lines) in G4 (dashed lines) and G12 calculated with 5-day data.
The impact of the resolution on the mean state of the meridional mass transport in terms of meridional velocity () is assessed through first Atlantic Meridional Overturning Circulation (AMOC) stream function. Supplementary Figures 1, 2 shows that the mean AMOC in G12 is stronger than in G4. Observations from the 26°N RAPID array (Srokosz and Bryden, 2015) for the 2005–2016 period yield a 16.8 Sv estimate, while G4 and G12 display a 16.3 Sv and 17.4 Sv amplitude, respectively. The mean gyre circulation (diagnosed via the barotropic stream function) slightly strengthens (Supplementary Figure 3) with the increase of horizontal resolution, meaning that the mean meridional velocity field () increases with horizontal resolution along with mean temperature field () increases corroborating the evidence that the time mean ocean states () increase is the main factor for the total MHT increases.
The MHT anomalies that drive the mid-1990s warming and post-2005 cooling trend in the North Atlantic Ocean in G4 and G12 are calculated by subtracting the mean climatology from 1993–2016 and the decomposition of the MHT anomalies is shown in Figure 5. A prominent increase and reduction of MHT in G4 and G12, consistent with the mid-1990s warming and post-2005 cooling trend of T700 in the North Atlantic Ocean, is evident. The decline of the MHT in G4 begins around year 2005, in the 45°N–50°N latitude range and extends to the subtropical regions with time. In G12, instead, the reduction of MHT starts around year 2007 in the mid-latitudes and has a sharper decrease around 2008/2009, extending to the subtropical region. The difference between MHT anomalies in G12 and G4 shows that MHT anomalies have a stronger variability in G12 compared to G4. The decomposition (Figure 5) of the MHT evolution reveals that the anomalous advection of mean temperature () is the main contributor to the MHT anomalies in both G4 and G12. The advection of temperature anomalies due to the mean flow () plays a minor role in the MHT variability in both reanalyses. Despite the smaller contribution to the total MHT variability compared with the change of ocean circulation, the eddy-eddy correlation term (v′T′) shows similar variability to the total MHT change, and contributes to the mid-1990’s warming and the post-2005 cooling.
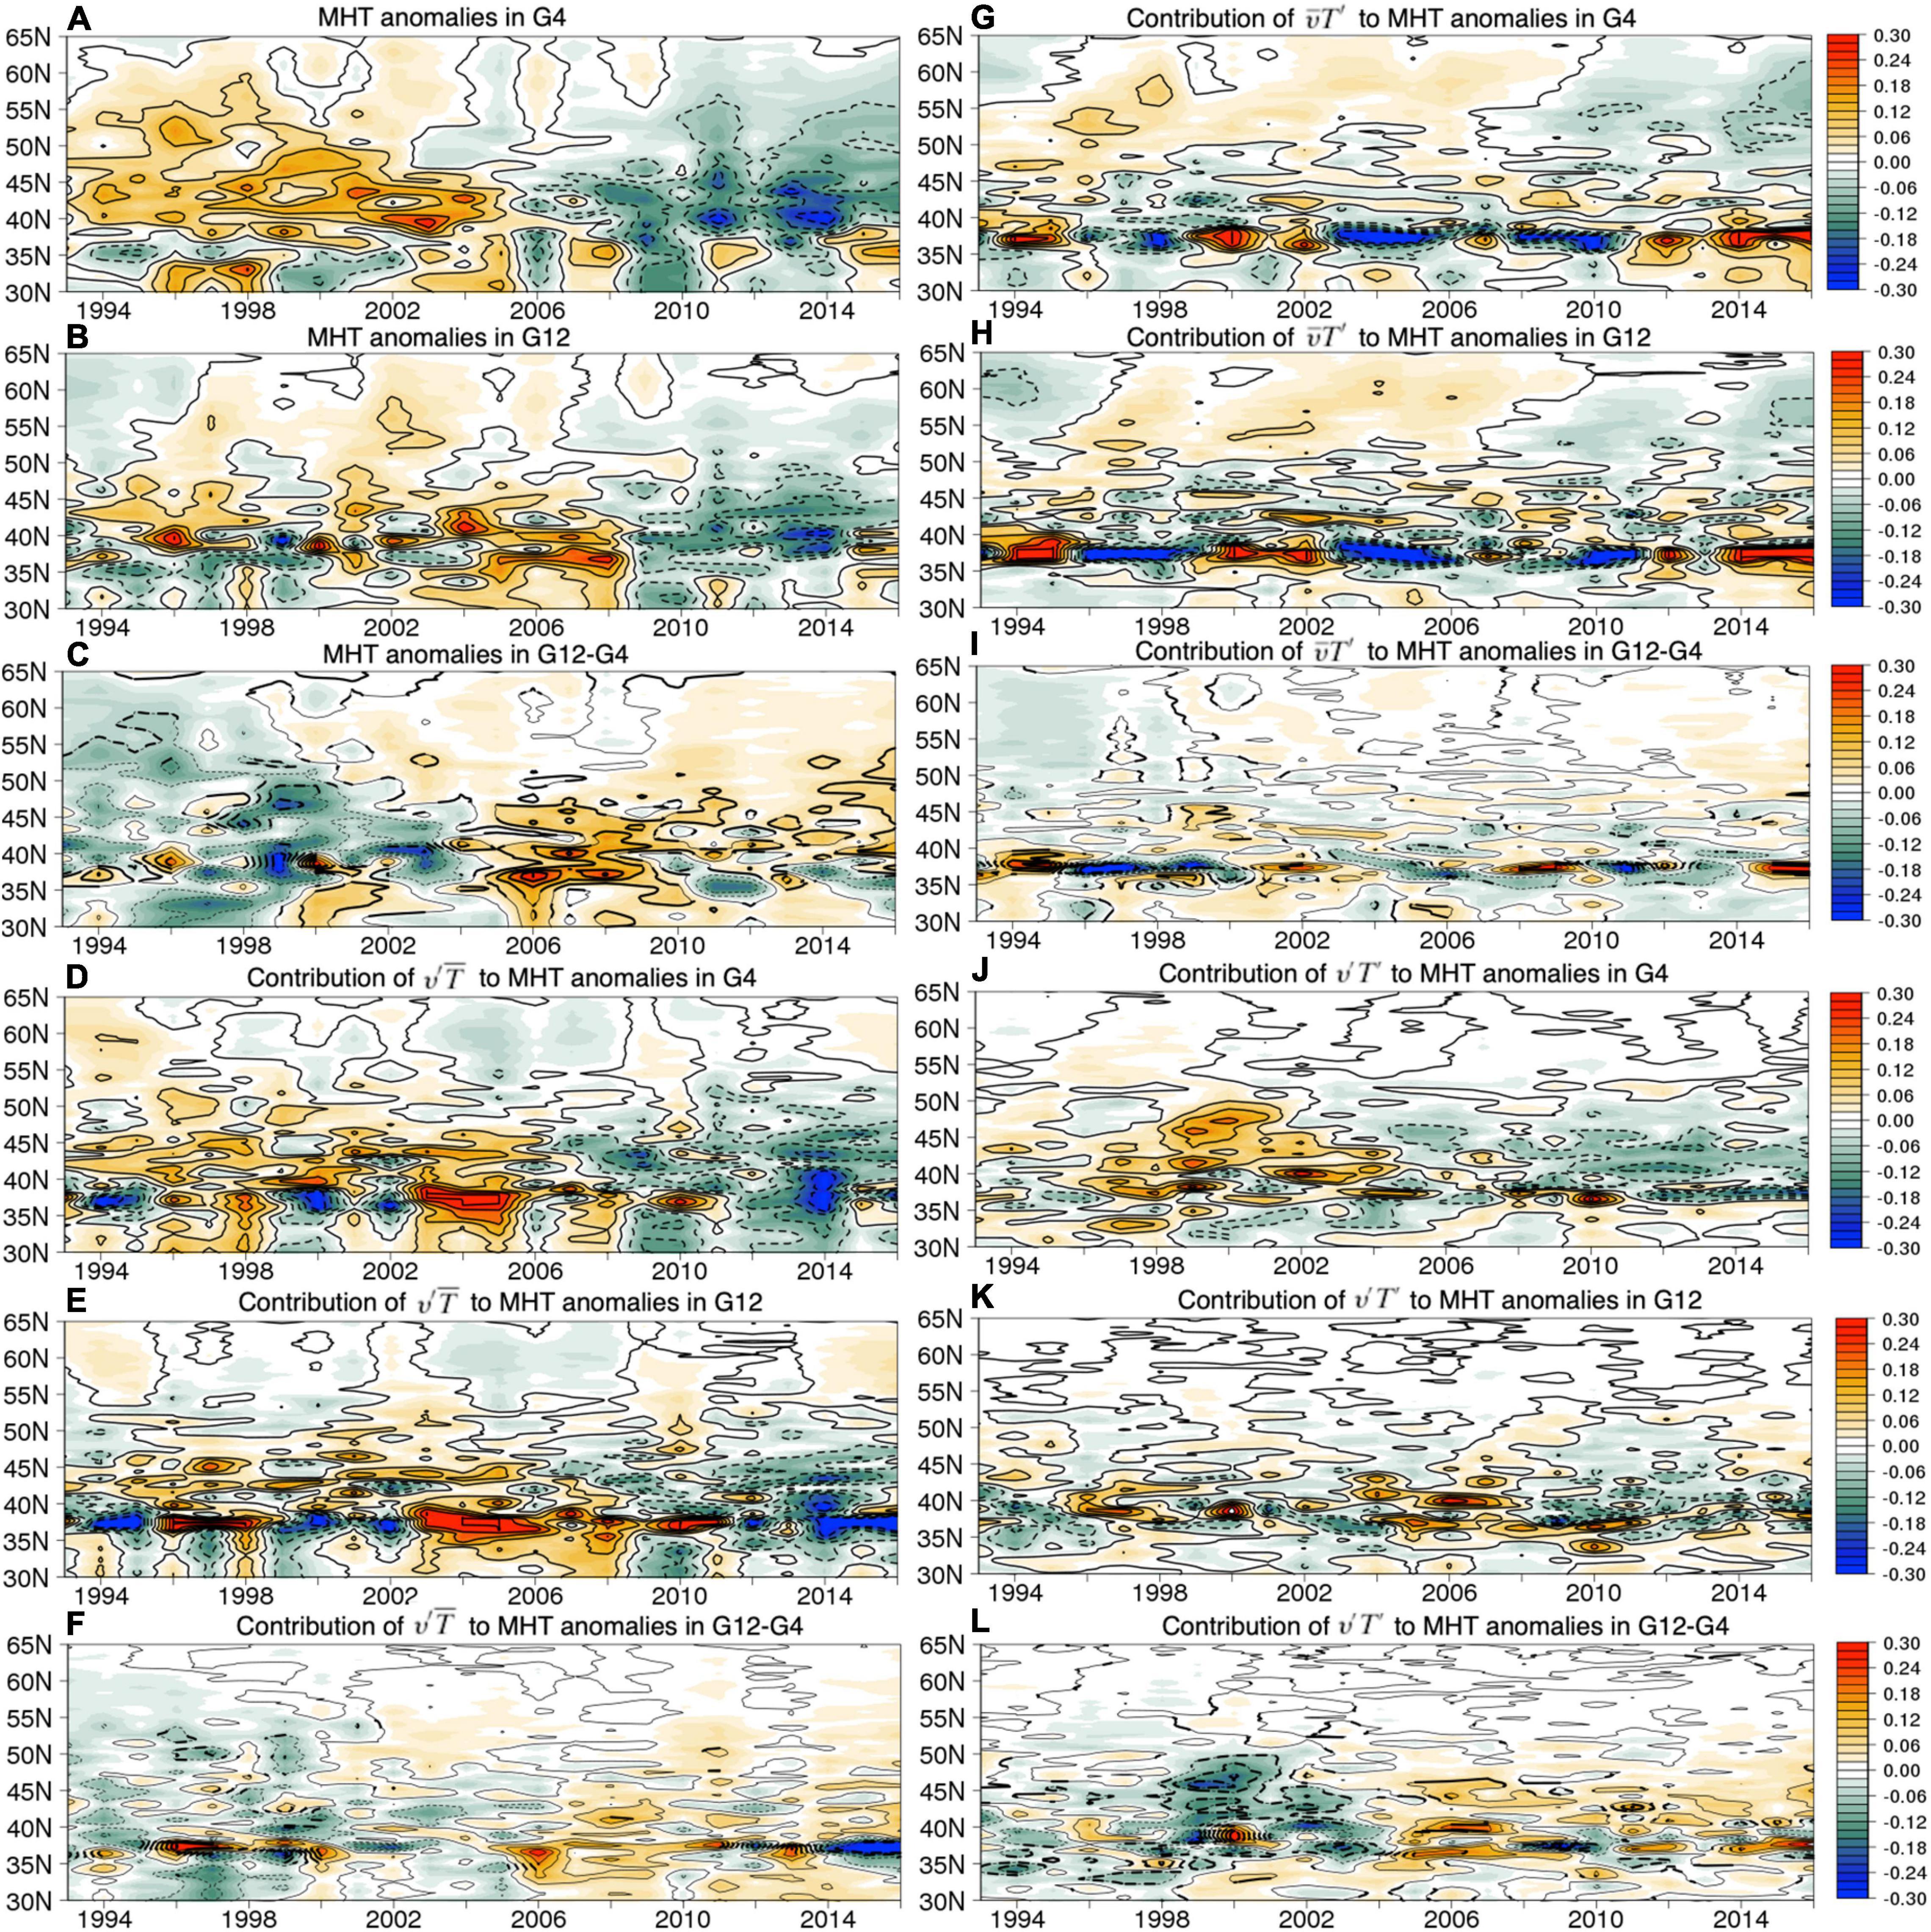
Figure 5. Meridional heat transport anomaly and decomposition T′, () in G4 (A,D,G,J) and in G12 (B,E,H,K) calculated with 5-day data. (unit: PW) The differences between G12-G4 are shown in panels (C,F,I,L), and areas with values that pass t-test 95% confidence interval are indicated in thick contours.
In order to further investigate the role of eddies in the MHT, we separate the whole field (T and v) into large scale and eddy scale processes (calculated by subtracting the large scale from the full field) by applying a Shapiro spatial filter with a 10 degree frame window following Zhao et al. (2018). The MHT anomalies, MHT anomalies induced by large scale and MHT anomalies induced by mesoscale processes are shown in Figure 6. The major contribution of the MHT anomalies are induced by large scale processes in both G4 and G12. However, eddies contribute to both MHT warming and cooling anomalies that are related to the decadal variability. The variance of MHT (Figure 7A) shows that the eddy activity is mainly located in the 35°N to 45°N latitudes band for both G12 and G4. However, in G12 the largest variance is localized at around 38°N, while in G4 the variance is overall weaker than in G12 but spread across a wider latitude band. The eddy-explained variance (see section “Data and Methods”) in MHT anomalies in both G4 and G12 (Figure 7B), confirms that over the 35°N–45°N latitudes band the eddies are very active in both G4 and G12, consistent with Figure 4A. The most prominent difference between G4 and G12 is at higher latitudes (45°N–55°N) where eddies explained more variances in G12 than G4 (Figure 7B). Further analysis (Figure 7C) focusing on the warming period, 1993–2004 (cold period from 2005–2016 is not shown because they are out of phase to have zero sum for anomalies), shows that large scale processes contribute more to the mean heat transfer anomalies for the warming and cooling period in G4 than in G12. On the other hand, eddies contribute relatively more to the mean heat transfer anomalies in G12 than in G4.
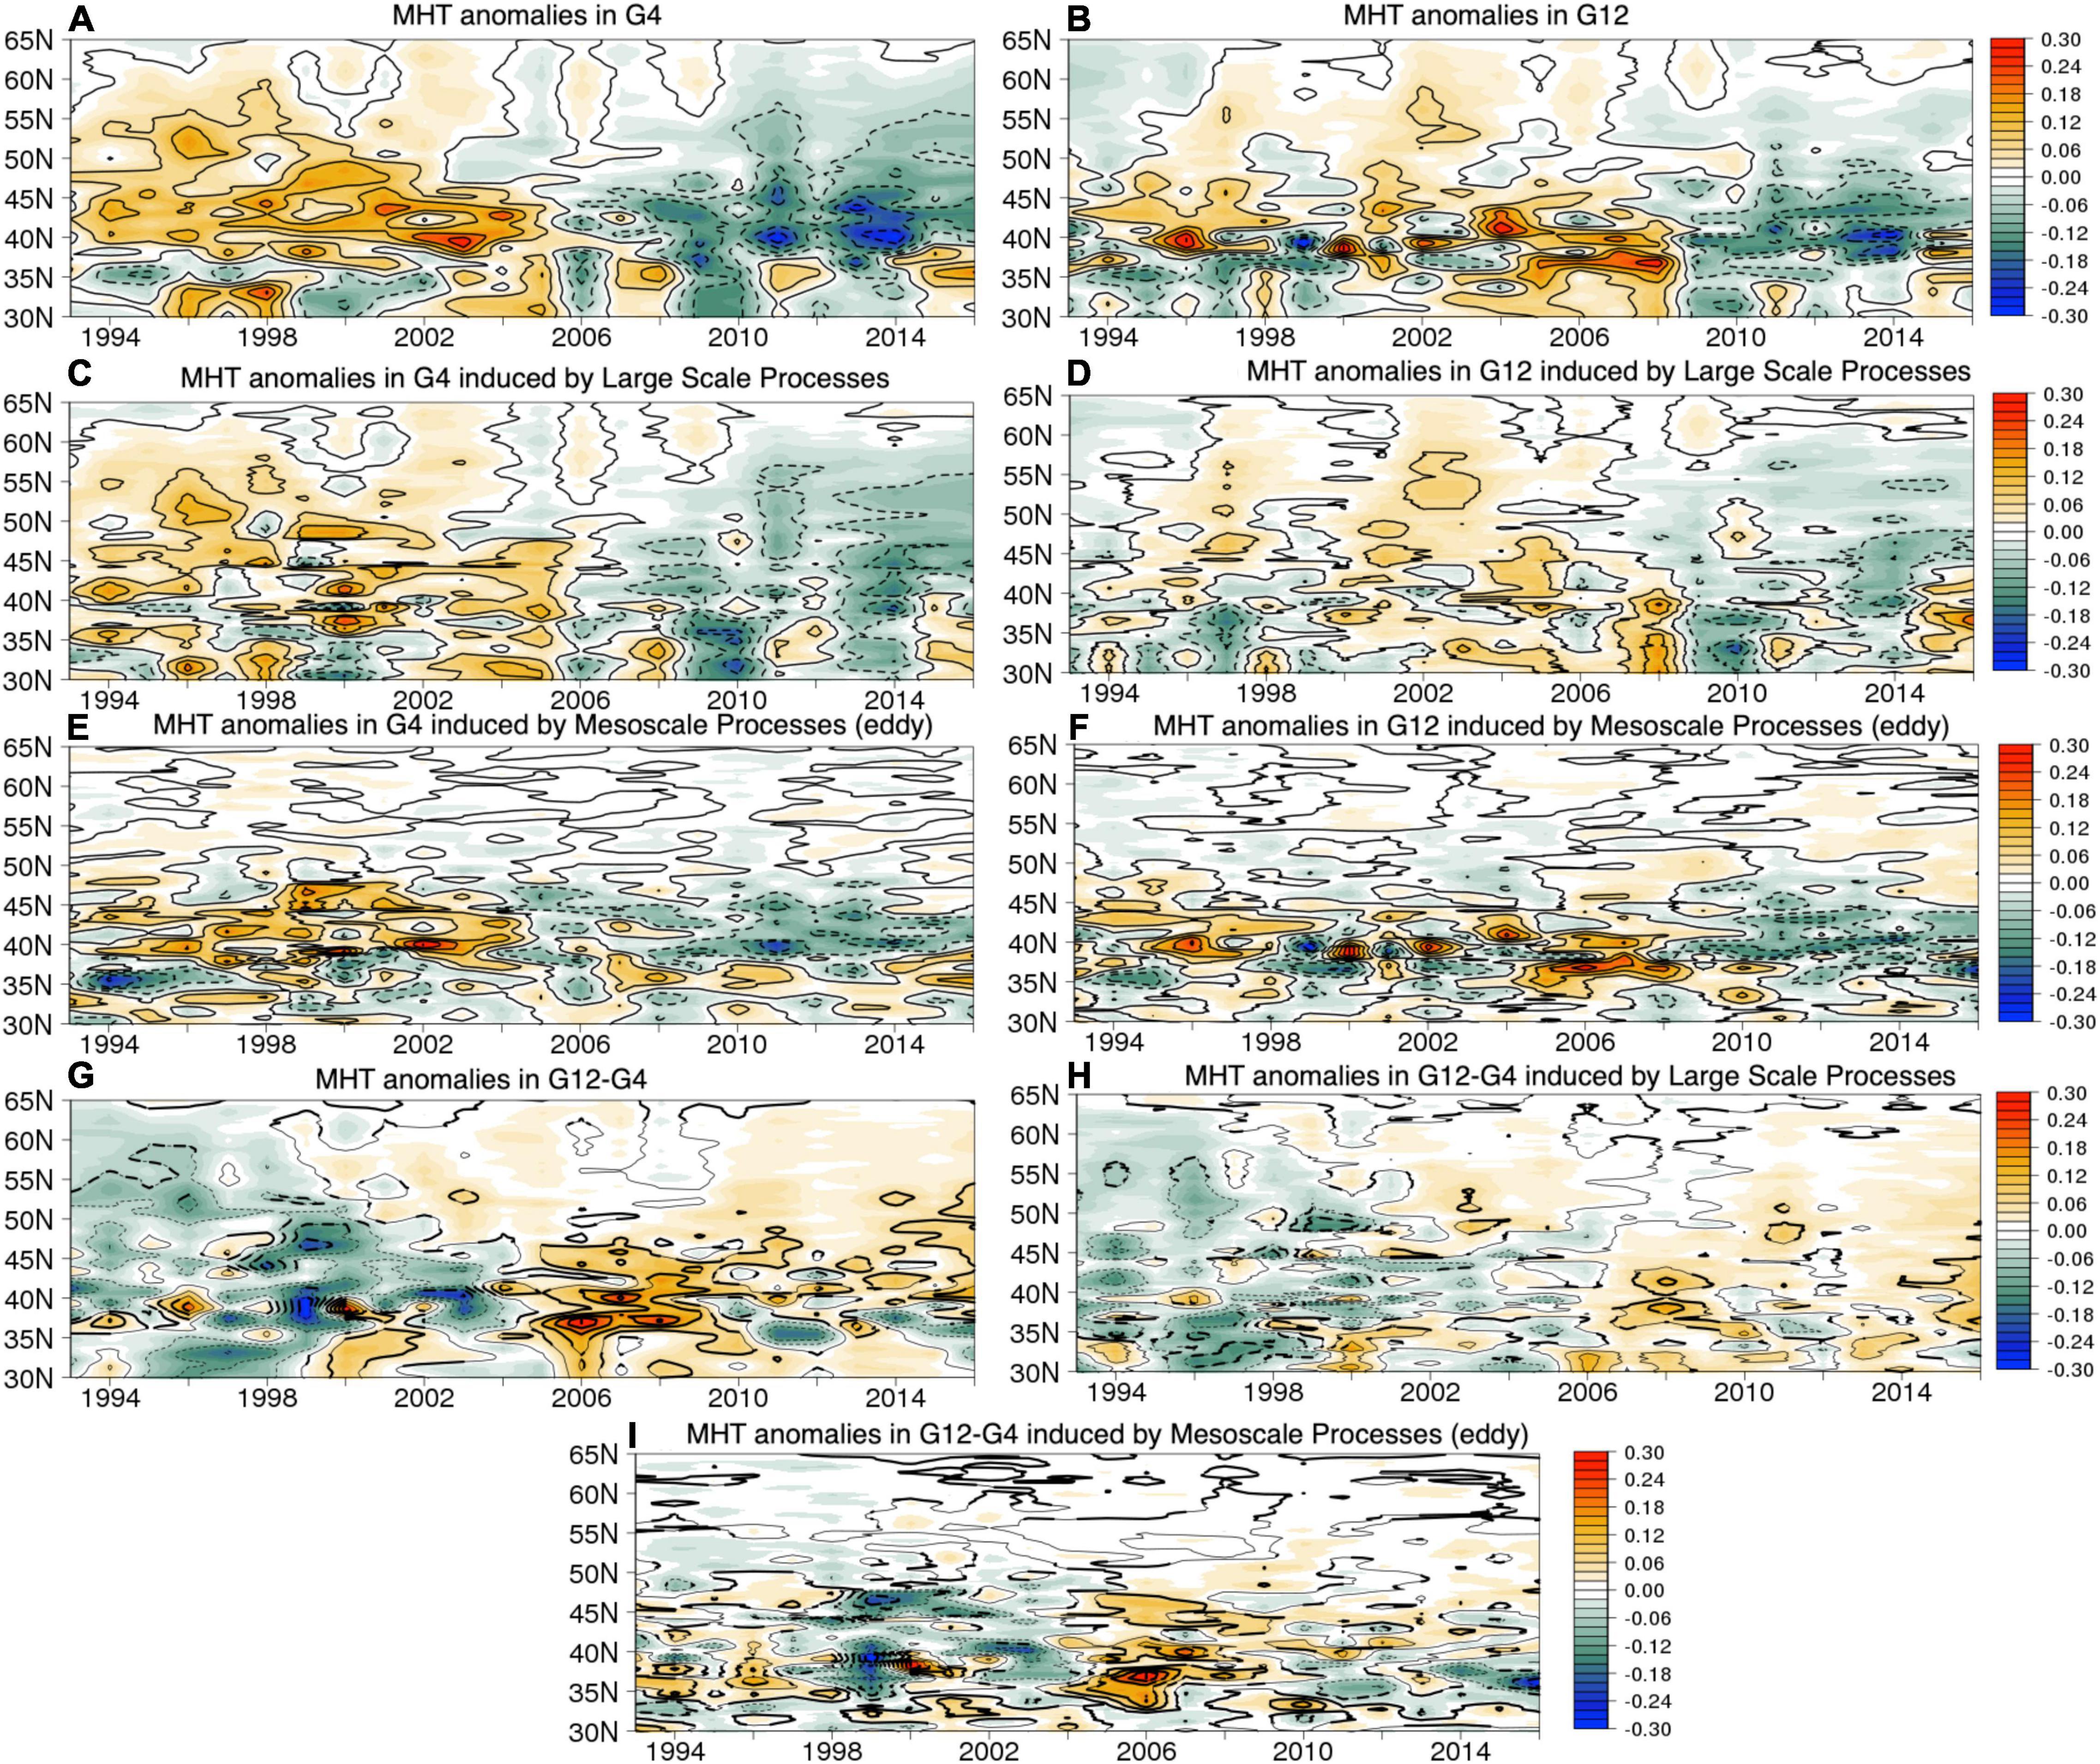
Figure 6. Meridional heat transport anomaly and the anomalies induced by large scale process and mesoscale processes in G4 (A,C,E) and G12 (B,D,F), differences between G4 and G12 (G,H,I) calculated with 5-day data. In panels (G,H,I), areas with values that pass t-test 95% confidence interval are indicated in thick contours (unit: PW).
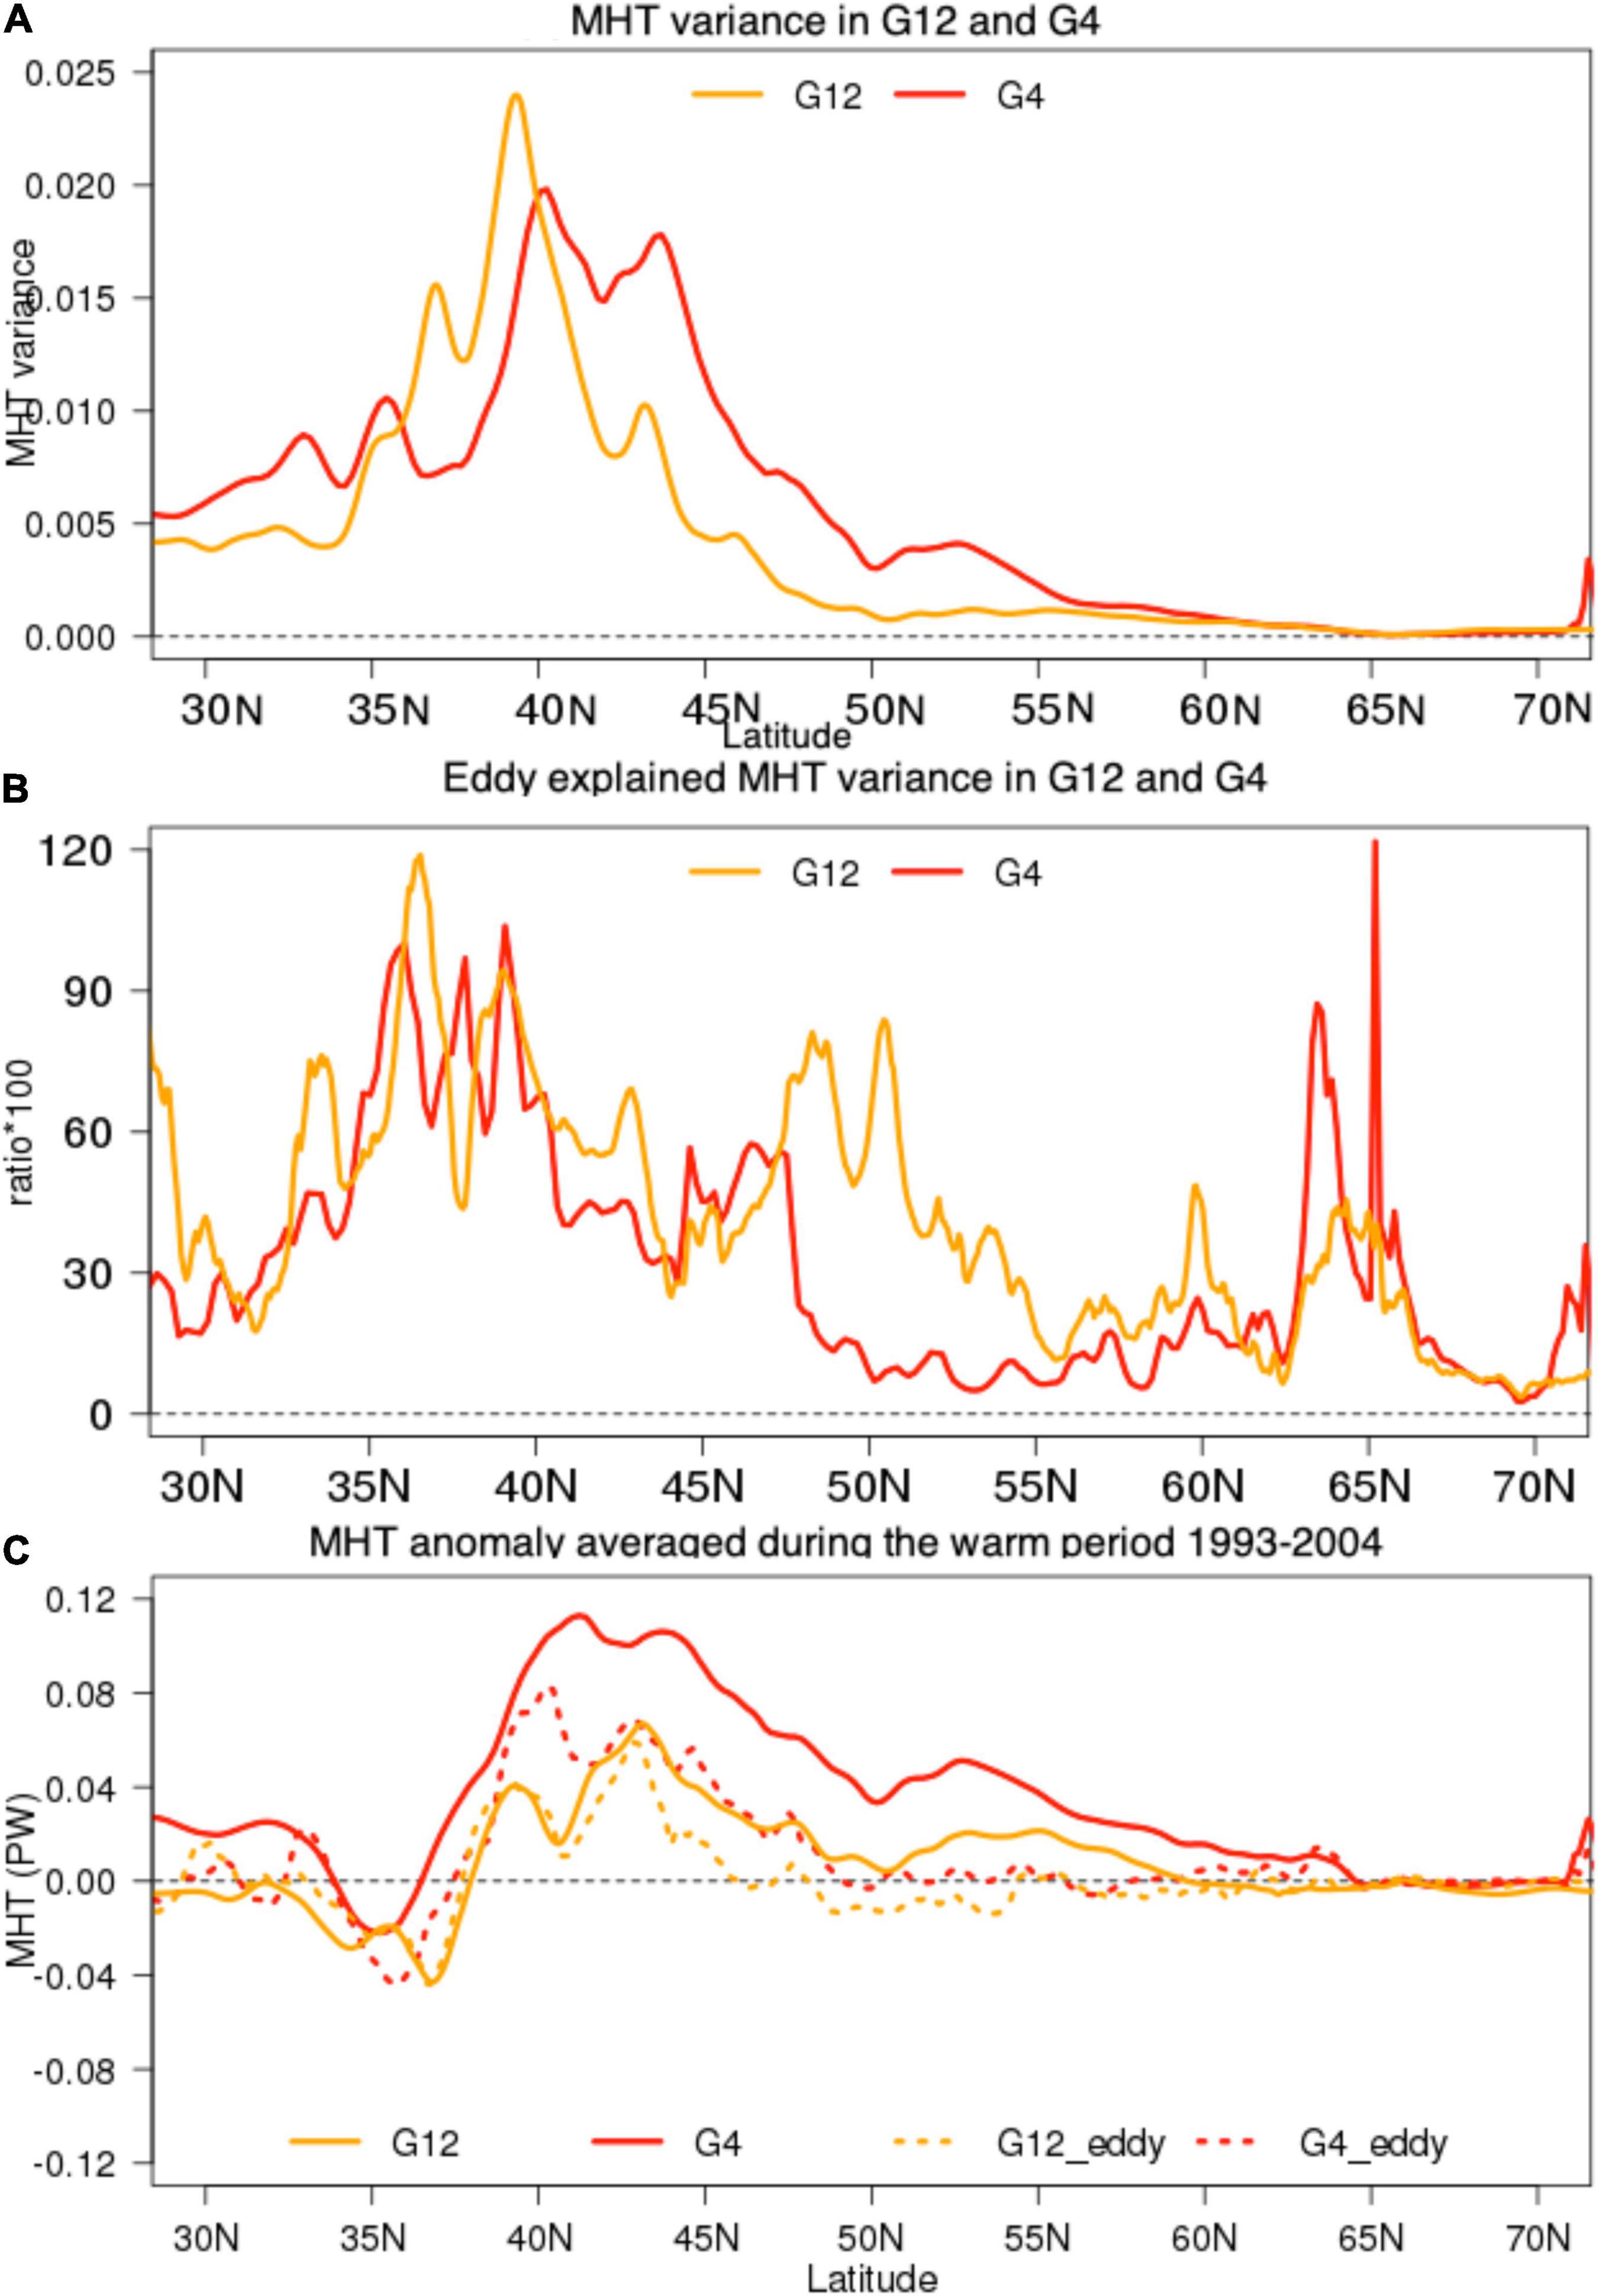
Figure 7. (A) The temporal variance of MHT anomalies in G4 and G12 (B) Eddy explained MHT variance in G4 and G12 calculated as shown in Equation 8. The values have been multiplied by 100. (C) MHT anomalies averaged for the warm period (1993–2004) and the contribution from meso-scale eddies.
In general, the MHT variability in G12 and G4 show similar evolutions, especially during warming and the post-2005 cooling phase, with slightly larger amplitudes in G4. The contribution associated with different components (, and v′T′) of the total MHT anomalies in both G4 and G12 is very similar, with the anomalous advection of mean temperature as the lead contributor, followed by the eddy-eddy correlation term, and finally the mean advection of temperature anomalies as the smallest contributor. This indicates that the North Atlantic decadal variability, here mid-1990s warming and post-2005 cooling period, is reproduced in both eddy-permitting (G4) and the eddy-resolving (G12) reanalyses, associated with the increase and decrease of the poleward heat transport. The relative role of eddies in terms of the contribution to the MHT anomalies is slightly more prominent in the eddy-resolving reanalysis (G12) compared with the eddy-permitting reanalysis (G4), especially at higher latitude (45°N–55°N).
Conclusion and Discussion
In this study we investigate the role of eddies in the North Atlantic decadal variability by using two ocean reanalysis products with different spatial resolutions. One reanalysis (G4) features a 1/4 degree horizontal resolution (eddy-permitting) and 75 vertical levels while the other one (G12) features a 1/12 degree horizontal resolution (eddy-resolving) and 50 vertical levels. Here we focus on the mid-1990s warming and post-2005 cooling in the North Atlantic Ocean as part of the North Atlantic decadal variability (Robson et al., 2016). The results show that both ocean reanalyses represent the prominent mid-1990s warming and post-2005 cooling trend (Top 700 m temperature, Figure 1) in the North Atlantic with minor differences between the two reanalyses. A linear warming trend of 0.48°C in G4, 0.53°C in G12 for the mid-1990s period, and a cooling trend of −0.54°C in G4 and −0.53°C for G12 per decade for the post-2005 period suggests a minor role of spatial resolution on the inter-annual variability. However, the mean state of the North Atlantic Ocean does change after increasing the horizontal resolution, as revealed by comparing climatological patterns of T700, ocean circulation and EKE (the latter, both at surface and sub-surface) in G4 and G12.
The analysis of the poleward ocean heat transport shows a similar variability of the total MHT signal in both G4 and G12. The main contributor to the total MHT change in both reanalyses is the anomalous advection of mean temperature () associated with the weakening of the AMOC strength (Supplementary Figures 1, 2) and North Atlantic gyre circulation (Supplementary Figure 3) consistent with previous studies (Msadek et al., 2014). The quantitative analysis of the eddy contribution to the total MHT variability, which is the focus of this study, shows that the contribution of eddy MHT to the total MHT variability is slightly larger in the eddy-resolving than in the eddy-permitting reanalysis. Additionally, G12 shows a 10% increase in the total mean MHT compared to G4 and the decomposition of the total MHT suggests that the main factor is the increase of mean circulation and mean temperature, as also discussed in other studies (Hecht and Smith, 2008; Treguier et al., 2012).
Overall, our intercomparison of G12 and G4 shows that the change in the resolution mostly affects the climatological features, while the decadal variability signal is relatively less affected with eddies playing slightly larger role in G12. However, the increases of resolution has a larger impact on the poleward heat transport at the higher latitude. One point in this study we have to bear in mind is that G12 has higher horizontal resolution but lower vertical resolution compared with G4. Thus, with the future new 1/12 degree ocean reanalyses (G12) the results could be slightly different.
The implications of this study go beyond the North Atlantic mid-1990s and post-2005 cooling event. The North Atlantic displays prominent decadal fluctuations. Understanding the underlying mechanisms and improving the skill of decadal predictions in the North Atlantic sector is a very active and promising area of research for the climate prediction community. Previous studies have shown that an accurate initialization of the ocean state is key for making skillful predictions of the North Atlantic variability (Msadek et al., 2014) and ocean reanalyses have been used as initial conditions for decadal prediction experiments (Bellucci et al., 2013, 2015). This study confirms the reliability of ocean reanalyses as initial conditions for decadal predictions even with eddy-permitting (and eddy rich) resolution.
The fast development of computational power will pave the way to high-resolution decadal prediction systems. However, the importance of model resolution needs to be evaluated in order to optimize the usage of the resources. This study focusing on the North Atlantic Ocean shows that the increase of resolution affects the mean state of the ocean but has no significant impacts on the decadal scale variability. However, the interaction between eddies (small scale) and the mean state (large scale) needs to be explored further in order to understand the importance and usefulness of high resolution for decadal predictions and initialization strategies, which will be a vital research area that the climate community needs to pursue in the coming years or decades in order to improve decadal prediction skill.
Data Availability Statement
Publicly available datasets were analyzed in this study. This data can be found here: https://resources.marine.copernicus.eu/product-detail/GLOBAL_MULTIYEAR_PHY_001_030/INFORMATION; https://resources.marine.copernicus.eu/product-detail/GLOBAL_REANALYSIS_PHY_001_031/INFORMATION.
Author Contributions
CY designed the study and wrote the initial manuscript. CY and CB conducted the analyses. All authors contributed to the interpretation of the results and to the improvement of the manuscript.
Funding
This study was funded by EU cost action (Earth System Science and Environmental Management ES1402, Evaluation of Ocean Syntheses), and Copernicus Marine Environment Monitoring Service (CMEMS) Contract (GLO-RAN-Lot 6). The computing resource is funded by CINECA ISCRA project (PRORP_HP10C2FG9V).
Conflict of Interest
The authors declare that the research was conducted in the absence of any commercial or financial relationships that could be construed as a potential conflict of interest.
Publisher’s Note
All claims expressed in this article are solely those of the authors and do not necessarily represent those of their affiliated organizations, or those of the publisher, the editors and the reviewers. Any product that may be evaluated in this article, or claim that may be made by its manufacturer, is not guaranteed or endorsed by the publisher.
Acknowledgments
We would like to thank Daniele Ciani and two reviewers for their useful comments to improve the manuscript. Reanalyses data are available in CMEMS data portal and EN4 is public available in United Kingdom Met office data portal (https://www.metoffice.gov.uk/hadobs/en4/).
Supplementary Material
The Supplementary Material for this article can be found online at: https://www.frontiersin.org/articles/10.3389/fmars.2022.781788/full#supplementary-material
References
Aoki, K., Minobe, S., Tanimoto, Y., and Sasai, Y. (2013). Southward eddy heat transport occurring along southern flanks of the kuroshio extension and the gulf stream in a 1/108 global ocean general circulation model. J. Phys. Oceanogr. 43, 1899–1910. doi: 10.1175/JPO-D-12-0223.1
Bellucci, A., Gualdi, S., Masina, S., Storto, A., Scoccimarro, E., Cagnazzo, C., et al. (2013). Decadal climate predictions with a coupled OAGCM initialized with oceanic reanalyses. Clim. Dyn. 40:1483. doi: 10.1007/s00382-012-1468-z
Bellucci, A., Haarsma, R., Gualdi, S., Athanasiadis, P. J., Caian, M., Cassou, C., et al. (2015). An assessment of a multi-model ensemble of decadal climate predications. Clim. Dyn. 44:2787. doi: 10.1007/s00382-014-2164-y
Bersch, M., Yashayaev, I., and Koltermann, K. P. (2007). Recent changes of the thermohaline circulation in the subpolar North Atlantic. Ocean Dyn. 57, 223–235. doi: 10.1007/s10236-007-0104-7
Chafik, L., Nilsen, J. E. Ø, Dangendorf, S., Reverdin, G., and Frederikse, T. (2019). North atlantic ocean circulation and decadal sea level change during the altimetry era. Sci. Rep. 9:1041. doi: 10.1038/s41598-018-37603-6
Cipollone, A., Masina, S., Storto, A., and Iovino, D. (2017). Benchmarking the mesoscale variability in global eddy-permitting numberical systems. Ocean Dyn. 67:1313. doi: 10.1007/s10236-017-1089-5
Comiso, J. C. (2000). Updated 2015. Bootstrap Sea Ice Concentrations from Nimbus-7 SMMR and DMSP SSM/I-SSMIS, Version 2. Boulder, CO: NASA National Snow and Ice Data Center Distributed Active Archive Center, doi: 10.5067/J6JQLS9EJ5HU
Crosnier, L., Barnier, B., and Treguier, A. M. (2001). Aliasing inertial oscillations in a 1/6° Atlantic circulation model: impact on the mean meridional heat transport. Ocean Model. 3, 21–31.
Dee, D. P., Uppala, S. M., Simmons, A. J., Berrisford, P., Poli, P., Kobayashi, S., et al. (2011). The ERA-Interim reanalysis: configuration and performance of the dataassimilation system.Q. J. R. Meteorol. Soc. 137, 553–597. doi: 10.1002/qj.828
Delman, A., and Lee, T. (2020). A new method to assess mesoscale contributions to meridional heat transport in the North Atlantic Ocean. Ocean Sci. 16, 979–995. doi: 10.5194/os-16-979-2020
Delworth, T. L., Zeng, F., Vecchi, G. A., Yang, X., Zhang, L., and Zhang, R. (2016). The North Atlantic Oscillation as a driver of rapid climate change in the Northern Hemisphere. Nat. Geosci. 9, 509–513. doi: 10.1038/NGEO2738
Docquier, D., Grist, J. P., Roberts, M. J., Roberts, C. D., Semmler, T., Ponsoni, L., et al. (2019). Impact of model resolution on Arctic sea ice and North Atlantic Ocean heat transport. Clim. Dyn. 53, 4989–5017. doi: 10.1007/s00382-019-04840-y
Drévillon, M., Fernandez, E., and Lellouche, J.-M. (2021a). Product User Manual for the Global Ocean Physical Multi Year Product Global_Multiyear_Phy_001_030. Available online at: https://catalogue.marine.copernicus.eu/documents/PUM/CMEMS-GLO-PUM-001-030.pdf (accessed January 20, 2020).
Drévillon, M., Lellouche, J.-M., Reìgnier, C., Garric, G., Bricaud, C., Hernandez, O., et al. (2021b). Quality Information Document for Global Ocean Reanalysis Products Global_Reanalysis_Phy_001_030. Available online at: https://catalogue.marine.copernicus.eu/documents/QUID/CMEMS-GLO-QUID-001-030.pdf (accessed January 20, 2020).
Ezraty, R., Girard-Ardhuin, F., Piollé, J. F., Kaleschke, L., and Heygster, G. (2007). Arctic and Antarctic Sea Ice Concentration and Arctic Sea Ice Drift Estimated from Special Sensor Microwave Data, User’s Manuel Version 2.1. IFREMER CERSAT Document. 22, 2.1 Edn. Brest: Département d Océanographie Physique et Spatiale, IFREMER.
Fichefet, T., and Morales Maqueda, M. A. (1997). Sensitivity of a global sea ice model to the treatment of ice thermodynamics and dynamics. J. Geophys. Res. 102, 12609–12646. doi: 10.1029/97jc00480
Garric, G., and Parent, L. (2017). Quality Information Document for Global 1330 Ocean Reanalysis Products Global-Reanalysis-Phy-001-025. Available online at: https://catalogue.marine.copernicus.eu/documents/QUID/CMEMS-GLO-QUID-001-025.pdf (accessed January 20, 2020).
Garric, G., and Parent, L. (2018). Product User Manual for Global Ocean Reanalysis Products Global-Reanalysis-Phy-001-025. Available online at: https://catalogue.marine.copernicus.eu/documents/PUM/CMEMS-GLO-PUM-001-025.pdf (accessed January 20, 2020).
Good, S. A., Martin, M. J., and Rayner, N. A. (2013). EN4: quality controlled ocean temperature and salinity profiles and monthly objective analyses with uncertainty estimates. J. Geophys. Res. Oceans 118, 6704–6716. doi: 10.1002/2013JC009067
Grist, J. P., Josey, S. A., New, A. L., Roberts, M., Koenigk, T., and Iovino, D. (2018). Increasing atlantic ocean heat transport in the latest generation coupled ocean-atmosphere models: the role of air-sea interaction. J. Geophys. Res. Oceans 23, 8624–8637. doi: 10.1029/2018jc014387
Haarsma, R. J., Roberts, M. J., Vidale, P. L., Senior, C. A., Bellucci, A., Bao, Q., et al. (2016). High resolution model intercomparison project (HighResMIPv1.0) for CMIP6. Geosci. Model Dev. 9, 4185–4208. doi: 10.5194/gmd-9-4185-2016
Häkkinen, S., Rhines, P. B., and Worthen, D. L. (2011). Warm and saline events embedded in the meridional circulation of the northern North Atlantic. J. Geophys. Res. 116:C03006.
Haìtuìn, H., Sando, A. B., Drange, H., Hansen, B., and Valdimarsson, H. (2005). Influence of the Atlantic subpolar gyre on the thermohaline circulation. Science 309, 1841–1844. doi: 10.1126/science.1114777
Hecht, M. W., and Smith, R. D. (2008). “Toward a physical understanding of the North Atlantic: a review of model studies in an eddying regime,” in Oceano Modeling in an Eddying Regime, Geophysical Monograph Series, Vol. 177, eds M. W. Hecth and H. Hasumi (Washington, DC: American Geophysical Union), 213–239. doi: 10.1029/177GM15
Herbaut, C., and Houssais, M. N. (2009). Response of the eastern North Atlantic subpolar gyre to the North Atlantic Oscillation. Geophys. Res. Lett. 36:L17607. doi: 10.1029/2009GL039090
Jackson, L. C., Peterson, K. A., Roberts, C. D., and Wood, R. A. (2016). Recent slowing of Atlantic overturning circulation as a recovery from earlier strengthening. Nat. Geosci. 9, 518–522. doi: 10.1038/ngeo2715
Jackson, L., Dubois, C., Masina, S., Storto, A., and Zuo, H. (2018). Atlantic meridional overturning circulation. in copernicus marine service ocean state report, issue 2. J. Operat. Oceanogr. 11(Suppl.1), S65–S66. doi: 10.1080/1755876X.2018.1489208
Jayne, S. R., and Marotzke, J. (2002). The oceanic eddy heat transport. J. Phys. Oceanogr. 32, 3328–3345.
Large, W., and Yeager, S. (2004). Diurnal To Decadal Global Forcing For Ocean And Seaice Models: The Data Sets And Climatologies. Technical Report TN-460 + STR. Boulder, CO: National Center for Atmospheric Research.
Lellouche, J. M., Greiner, E., Bourdallé-Badie, R., Garric, G., Melet, A., Drevillon, M., et al. (2021). The copernicus global 1/12° oceanic and sea ice glorys12 reanalysis. Front. Earth Sci. 9:698876. doi: 10.3389/feart.2021.698876
Lellouche, J. M., Greiner, E., Le Galloudec, O., Garric, G., Regnier, C., Drevillon, M., et al. (2018). Recent updates on the Copernicus Marine Service global ocean 1323 monitoring and forecasting real-time 1/12 high resolution system. Ocean Sci. 14, 1093–1126. doi: 10.5194/os-14-1093-2018
Madec, G. (2008). NEMO Ocean Engine: Note Du Pôle De Modélisation. Guyancourt: Institut Pierre-Simon Laplace(IPSL).
Matei, D., Pohlmann, H., Jungclaus, J., Muller, W., Haak, H., and Marotzket, J. (2012). Two tales of initializing decadal climate prediction experiments with the ECHAM5/MPI-OM model. J. Clim. 25, 8502–8523. doi: 10.1175/jcli-d-11-00633.1
Msadek, R., Delworth, T. L., Rosati, A., Anderson, W., Vecchi, G., Chang, Y.-S., et al. (2014). Predicting a decadal shift in North Atlantic climate variability using the GFDL forecast system. J. Clim. 27, 6472–6496.
Pham, D., Verron, J., and Roubaud, M. (1998). A singular evolutive extended Kalman filter for data assimilation in oceanography. J. Mar. Syst. 16, 323–340. doi: 10.1016/s0924-7963(97)00109-7
Polkova, I., Brune, S., Kadow, C., Romanova, V., Gollan, G., Baehr, J., et al. (2019a). Initialization and ensemble generation for decadal climate predictions: a comparison of different methods. J. Adv. Modeling Earth Syst. 11, 149–172. doi: 10.1029/2018ms001439
Polkova, I., Kohl, A., and Stammer, D. (2019b). Climate-mode initialization for decadal climate predictions. Clim. Dyn. 53, 7097–7111. doi: 10.1007/s00382-019-04975-y
Qiu, B., and Chen, S. (2005). Eddy-induced heat transport in the subtropical north pacific from argo, tmi, and altimetry measurements. J. Phys. Oceanogr. 35, 458–473. doi: 10.1175/jpo2696.1
Robson, J. I., Sutton, R., Lohmann, K., Smith, D., and Palmer, M. D. (2012). Causes of the rapid warming of the North Atlantic Ocean in the mid-1990s. J. Clim. 25, 4116–4134.
Robson, J., Ortega, P., and Sutton, R. (2016). A reversal of climatic trends in the North Atlantic since 2005. Nat. Geosci. 9, 513–517. doi: 10.1038/ngeo2727
Roemmich, D., and Gilson, J. (2001). Eddy transport of heat and thermocline waters in the north pacific: a key to interannual/decadal climate variability? J. Phys. Oceanogr. 31, 675–687.
Sarafanov, A., Falina, A., Solov, A., and Demidov, A. (2008). In- tense warming and salinification of intermediate waters of southern origin in the eastern subpolar North Atlantic in the 1990s to mid-2000s. J. Geophys. Res. 113:C12022.
Srokosz, M. A., and Bryden, H. L. (2015). Observing the Atlantic meridional overturning circulation yields a decade of inevitable surprises. Science 348:1255575. doi: 10.1126/science.1255575
Storto, A., Masina, S., Simoncelli, S., Iovino, D., Cipollone, A., Drevillo, M., et al. (2019). The added value of the multi-system spread information for ocean heat content and steric sea level investigations in the CMEMS GREP ensemble reanalysis product. Clim. Dyn. 53, 287–312. doi: 10.1007/s00382-018-4585-5
Storto, A., Yang, C., and Masina, S. (2016). Sensitivity of global ocean heat content from reanalyses to the atmospheric reanalysis forcing: a comparative study. Geophys. Res. Lett. 43, 5261–5270. doi: 10.1002/2016GL068605
Sun, B., Liu, C., and Wang, F. (2019). Global meridional eddy heat transport inferred from Argo andaltimetry observations. Sci. Rep. 9:1345.
Szekely, T., Gourrion, J., Brion, E., Von Schuckmann, K., Reverdin, G., Grouazel, A., et al. (2015). “CORA4.1: a delayed-time validated temperature and salinity profiles and timeseries product,” in Proceeding of the 7th EuroGOOS International Conference, 28-20 October, 2014, Lisbon.
Treguier, A. M., Deshayes, J., Lique, C., Dussin, R., and Molines, J. M. (2012). Eddy contributions to the meridional transport of salt in the North Atlantic. J. Geophys. Res. 117:C05010. doi: 10.1029/2012JC007927
Treguier, A. M., Lique, C., Deshayes, J., and Molines, J. M. (2017). The North Atlantic eddy heat transport and its relation with the vertical tilting of the gulf stream axis. J. Phys. Oceanogr. 47, 1281–1289. doi: 10.1175/JPO-D-16-0172.1
Yang, C., Masina, S., Bellucci, A., and Storto, A. (2016). The rapid warming of the north atlantic ocean in the mid-1990s in an eddy-permitting ocean reanalysis (1982–2013). J. Clim. 29, 5417–5430. doi: 10.1175/JCLI-D-15-0438.1
Yeager, S., Karspeck, A., Danabasoglu, G., Tribbia, J., and Teng, H. (2012). A decadal prediction case study: late twentieth-century North Atlantic Ocean heat content. J. Clim. 25, 5173–5189. doi: 10.1175/JCLI-D-11-00595.1
Keywords: eddies, North Atlantic, decadal variability, reanalyses, meridional heat transport, eddy-large scale interaction
Citation: Yang C, Bricaud C, Drévillon M, Storto A, Bellucci A and Santoleri R (2022) The Role of Eddies in the North Atlantic Decadal Variability. Front. Mar. Sci. 9:781788. doi: 10.3389/fmars.2022.781788
Received: 23 September 2021; Accepted: 03 January 2022;
Published: 08 February 2022.
Edited by:
Sergio M. Vallina, Spanish Institute of Oceanography (IEO), SpainReviewed by:
Emilio Hernandez-Garcia, Institute of Interdisciplinary Physics and Complex Systems, Spanish National Research Council (CSIC), SpainAntonio Bonaduce, Nansen Environmental and Remote Sensing Center (NERSC), Norway
Copyright © 2022 Yang, Bricaud, Drévillon, Storto, Bellucci and Santoleri. This is an open-access article distributed under the terms of the Creative Commons Attribution License (CC BY). The use, distribution or reproduction in other forums is permitted, provided the original author(s) and the copyright owner(s) are credited and that the original publication in this journal is cited, in accordance with accepted academic practice. No use, distribution or reproduction is permitted which does not comply with these terms.
*Correspondence: Chunxue Yang, Y2h1bnh1ZS55YW5nQGNuci5pdA==