 Cristina Serena Russo
 Jennifer Veitch1,2
 Giles Fearon
- 1Egagasini Node, South African Environmental Observation Network (SAEON), Cape Town, South Africa
- 2Nansen Tutu Center, Department of Oceanography, University of Cape Town, Cape Town, South Africa
- 3Council for Scientific and Industrial Research (CSIR), Cape Town, South Africa
A regional assessment of three global ocean reanalysis products is presented for southern Africa’s major oceanographic features. The reanalyses include Mercator Ocean’s Global Reanalysis (GLORYS), the Commonwealth Scientific and Industrial Research Organisation’s (CSIRO) Bluelink Reanalysis (BRAN) and the Fleet Numerical Meteorology and Oceanography Center’s (FNMOC) global Hybrid Coordinate Ocean Model (HYCOM) reanalysis. The aim is to provide modelers with sufficient information for selecting the appropriate product for use as boundary conditions to force their regional ocean models, as well as to provide marine industries, relevant government agencies and academics with insight into the optimal reanalysis product for their purposes. The reanalyses are compared to both assimilated and independent observational datasets spanning various regions within the southern African marine environment. While all reanalysis products reproduce the eastern and western boundary current systems surrounding southern Africa, limitations exist. BRAN outperforms the other reanalyses in its representation of the Mixed Layer Depth, contributing to its good representation of coastal SSTs in the Benguela upwelling system, whereas GLORYS and HYCOM’s misrepresented MLD result in significant warm biases in this region. The Angola-Benguela Frontal Zone and it’s variability is best reproduced by BRAN and HYCOM. The Agulhas Current system’s major components are well reproduced by both GLORYS and BRAN. HYCOM, however, simulates considerably more early retroflections than are observed which have resulted in its mean eastward location. While all the reanalyses overestimate the occurrence of Agulhas meanders, GLORYS and BRAN resolve the associated variability best. Agulhas Current transport is best resolved by GLORYS, unlike BRAN and HYCOM which largely overestimate the magnitude of its south-westward flow, linked to their misrepresentation of the Current’s vertical structure. The bay-scale and nearshore evaluations highlighted issues pertaining to the resolution of the reanalyses and their use at such a small scale. The reanalyses are limited by their resolution, as well as by their misrepresentation of submesoscale processes or lack thereof, prompting the need for the development of regional downscaled models in and around the southern African oceans based on the global ocean reanalysis products.
Introduction
Historically, the extratropical Southern Hemisphere has been subject to considerably lower quality and quantity of oceanographic observations than the extratropical Northern Hemisphere (Ciasto and Thompson, 2008). While concerted efforts have been made to increase such observations in and around South Africa’s oceans (Beal et al., 2015; Kersalé et al., 2018; McMonigal et al., 2020), the absence of a comprehensive regional oceanographic observation system is still palpable. Typically, regions deficient in observational data rely on global model output but their performance is not always geographically uniform (Holt et al., 2017; de Souza et al., 2020). This is particularly relevant in coastal and shelf sea regions such as those found within southern African waters.
The marine environment surrounding southern Africa is characterized by a variety of oceanographic processes and features (Carr et al., 2021). The west coast is dominated by one of the four major eastern boundary upwelling systems of the world – the Benguela upwelling system, which contributes significantly to the global fisheries catch (Hutchings et al., 2009). This region is dominated by seasonally variable upwelling which is controlled by the South Atlantic Atmospheric Anticyclone. In contrast, the east and south coasts are dominated by the largest western boundary current in the Southern Hemisphere – the Agulhas Current system, which facilitates an inter-ocean exchange of heat, salt and energy through a major leakage (Agulhas leakage) from the Indian to the Atlantic Ocean (Beal et al., 2011). This leakage has been found to have considerable influence on global climate as well as climate change (Lutjeharms et al., 1992; Beal et al., 2011). In its mean state, the Agulhas Current system comprises of the Agulhas Current located along South Africa’s east and south coasts, the Agulhas Retroflection (AR), located just south of Cape Town, and the Agulhas Return Current observed meandering into the Indian Ocean at approximately 39°S (ARC; Figure 1). The proximity of an eastern boundary current to a western boundary current makes the southern Africa marine environment unique and dynamically diverse (Veitch and Penven, 2017; Carr et al., 2021). This makes it essential for global models to accurately simulate the dynamics of such a globally significant region. These contrasting dynamics are also what makes this region particularly challenging to simulate.
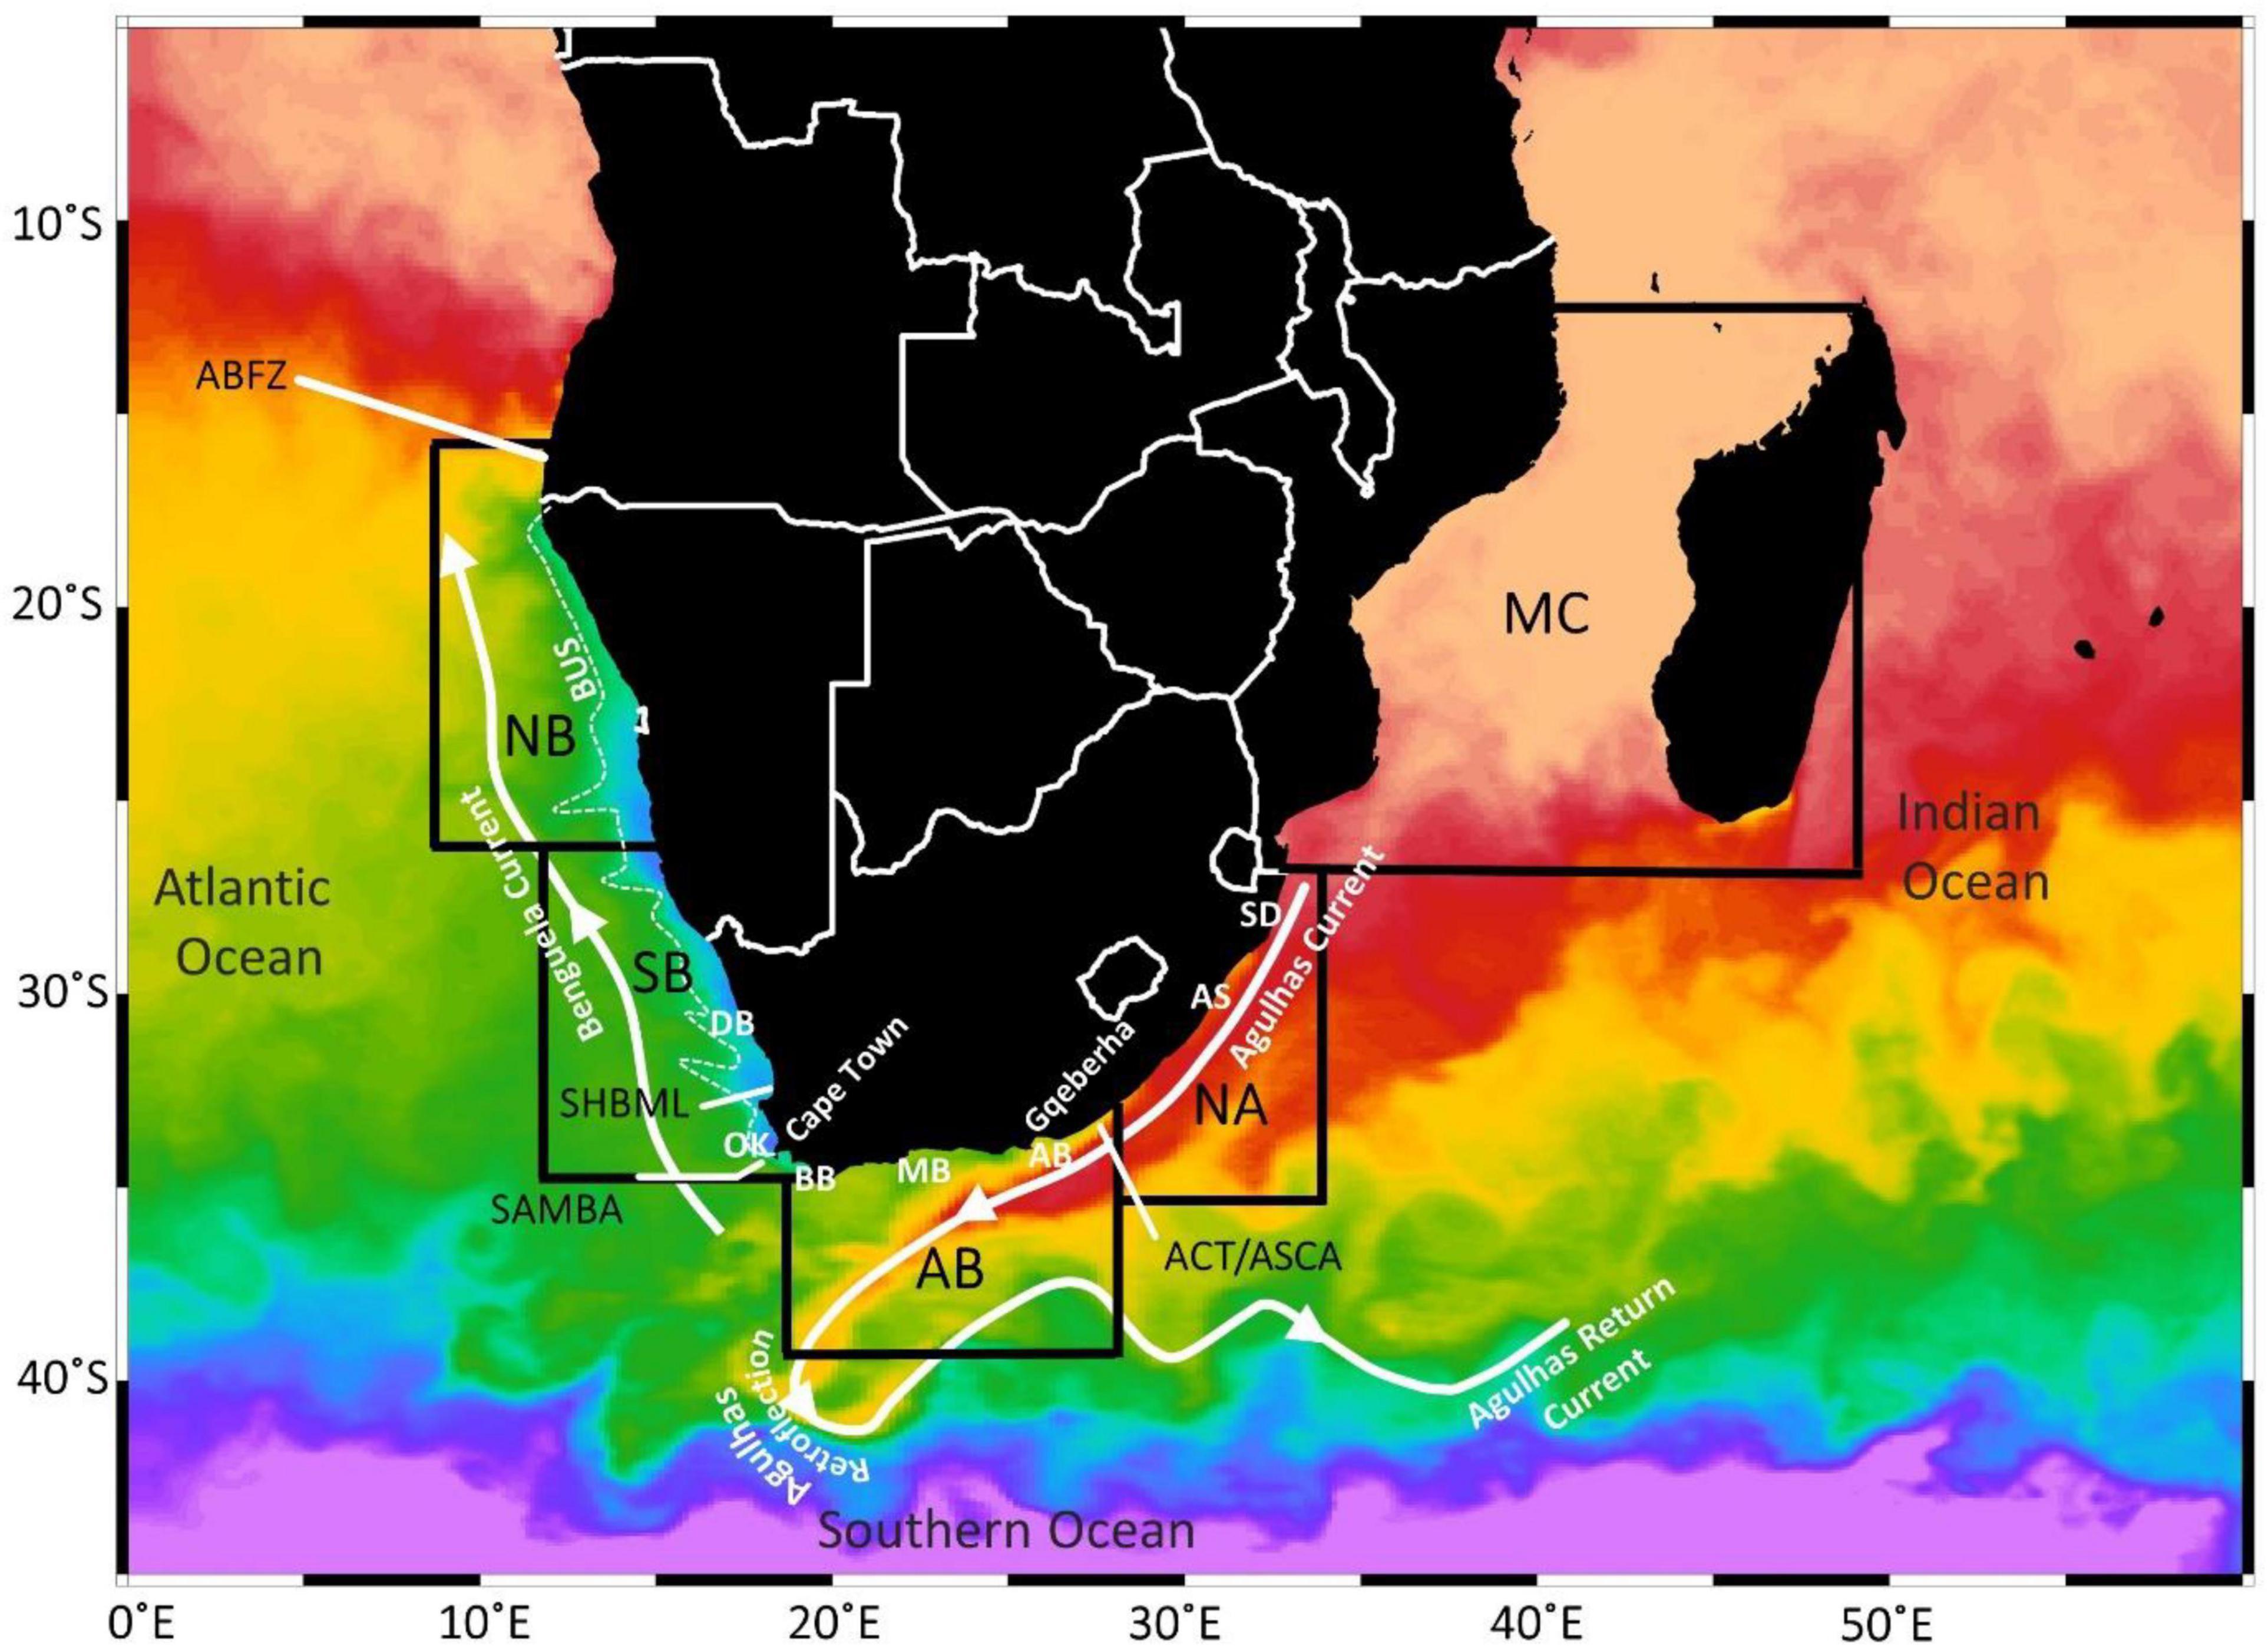
Figure 1. OSTIA Sea Surface Temperature (2020-02-05) over the southern African marine environment. The black boxes delineate the five subregions of the Northern Benguela (NB), the Southern Benguela (SB), the Agulhas Bank (AB), the Northern Agulhas (NA) and the Mozambique Channel (MC). The map depicts the locations for the Angola Benguela Frontal Zone (ABFZ), the St Helena Bay Monitoring Line (SHBML), the South Atlantic Meridional overturning circulation Basin-wide Array (SAMBA), the Agulhas Current Time-Series Experiment (ACT), the Agulhas System Climate Array (ASCA). The UTRs are located in Doringbaai (DB), Oudekraal (OK), Betty’s Bay (BB), Mossel Bay (MB), Algoa Bay (AB), Aliwal Shoal (AS), and Sodwana (SD).
Global ocean reanalysis products provide estimates for the long-term evolution of the state of the ocean by providing long term physical and biogeochemical ocean characteristics at a global scale (Verezemskaya et al., 2021). These reanalysis products optimally assimilate various in situ and satellite ocean observations into an ocean general circulation model which can potentially provide more accurate estimates of the ocean state and its variability relative to estimates solely based on observations or models which exclude data assimilation (Verezemskaya et al., 2021). Nevertheless, these global reanalysis products encounter inherent inaccuracies at regional scales which combined with the absence of a comprehensive regional oceanographic observation system has resulted in a growing demand for regional ocean models in southern Africa. These regional models are developed specifically to represent local processes and features generally absent from global simulations. A multistep process is used in the development of such a model which includes but is not limited to the incorporation of region-specific high-resolution bathymetry, a selection of suitable physical processes, definitions of model parameterizations and numerical schemes, as well as relevant forcing fields and appropriate boundary conditions (de Souza et al., 2020). In addition to providing boundary conditions to regional models, global ocean reanalysis products are often used directly to inform both scientific and industrial studies within the southern African region, often with little assessment of their suitability for the intended use.
This study presents a regional assessment of three global ocean reanalysis products for southern Africa’s Oceans. The aim is to provide modelers with sufficient information for selecting the appropriate global reanalysis product to use as boundary conditions to force their regional ocean models as well as to provide marine industries, relevant government agencies and academics with insight into the optimal reanalysis product for their purposes. The reanalysis products evaluated herein are the Mercator Ocean’s Global Reanalysis (GLORYS), the Commonwealth Scientific and Industrial Research Organisation’s (CSIRO) Bluelink Reanalysis (BRAN) and the Fleet Numerical Meteorology and Oceanography Center’s (FNMOC) global Hybrid Coordinate Ocean Model (HYCOM) reanalysis. These products are evaluated against a variety of observational datasets, ranging from satellite data to in situ datasets originating from various regions within the southern African ocean.
Datasets
Ocean Reanalysis Products
This study evaluates the three main reanalysis products that are commonly used in the field of marine science in the southern hemisphere. While each of the products is eddy-resolving within the southern African region that is the focus of this intercomparison, with horizontal resolutions of between ∼7 and 11 km, the several important differences that distinguish them are described below.
Mercator Ocean’s Global Reanalysis
The results from Mercator Ocean’s GLORYS12V1, hereafter referred to as GLORYS, will be evaluated in this study. GLORYS spans January 1993 to December 2019 and is generated using the Nucleus for European Modelling of the Ocean (NEMO) ocean model version 3.1. and is driven at the surface by the European Centre for Medium-Range Weather Forecasts’ (ECMWF) ERA-Interim reanalysis, as well as ERA5 from 2019-01-01 (Lellouche et al., 2019; Fernandez and Lellouche, 2021). It has a 1/12° horizontal resolution with 50 vertical layers. Observational data are assimilated using a reduced-order Kalman Filter scheme. The observational data includes delayed-time along track sea level anomaly data from all altimetric satellites, satellite Sea Surface Temperature (SST), Centre ERS d’Archivage et de Traitement (CERSAT) Sea Ice Concentration as well as in situ temperature and salinity profiles from the Coriolis Ocean database ReAnalysis (CORA), further details can be found in Supplementary Table 1. GLORYS data is available from the CMEMS website: http://marine.copernicus.eu/.
Commonwealth Scientific and Industrial Research Organisation’s Bluelink Reanalysis
BRAN2020 (hereafter referred to as BRAN), is the reanalysis product from Bluelink – a collaborative initiative between the Australian Department of Defence, Bureau of Meteorology and CSIRO, covers the period from January 1993 to December 2019 and incorporates updates which have resulted in a considerable improvement in accuracy to its predecessors (Chamberlain et al., 2021). These updates include a new two-step multiscale ensemble optimal interpolation data assimilation process and the utilization of new data products which have greater spatial coverage and fewer gaps. The observational data assimilated into BRAN include delayed-time along track sea level anomaly data, satellite SST data, as well as in situ temperature and salinity observations from the CORA database and from the near-real time database maintained at the Australia Bureau of Meteorology (Supplementary Table 1; Chamberlain et al., 2021). The model configuration used is the Ocean Forecasting Australian Model, version 3 (OFAM3; Oke et al., 2013) which is forced with atmospheric conditions from Japanese 55-year Reanalysis (JRA-55; Kobayashi et al., 2015). OFAM3 is a near-global, eddy-resolving, z* configuration of the Geophysical Fluid Dynamics Laboratory’s Modular Ocean Model (MOM) version 5. BRAN has a 1/10° horizontal resolution with 51 vertical layers. The upper 100 m has 14 layers, with 19 layers between 100 and 500 m, 6 layers between 500 and 1,000 m, and a final 12 layers deeper than 1,000 m. BRAN data is publicly available at https://doi.org/10.25914/6009627c7af03.
Fleet Numerical Meteorology and Oceanography Center’s Reanalysis – Hybrid Coordinate Ocean Model
FNMOC’s global reanalysis product, hereafter referred to as HYCOM, is based on the Hybrid Coordinate Ocean Model (HYCOM) which is forced with atmospheric conditions from the National Centers for Environmental Prediction (NCEP) Climate Forecast System Reanalysis (CFSR) and Climate Forecast System Version 2 (CFSv2) from 2011-04-01. Observational data, such as satellite altimeter observations, satellite and in situ SST observations, as well as in situ vertical temperature and salinity profiles from XBTs, Argo floats and moored buoys (detailed in Supplementary Table 1) are assimilated into HYCOM using the Navy Coupled Ocean Data Assimilation system (NCODA; Cummings, 2005; Cummings and Smedstad, 2013, 2014). The results from HYCOM experiment GLBv0.08 version 53.X, covering the period from January 1994 to December 2015, are evaluated in this study. HYCOM has a horizontal resolution of 1/12° between 40°S and 40°N, 1/25° poleward of these latitudes with 41 vertical layers. HYCOM is accessible from: https://www.hycom.org/dataserver.
Observational Datasets
The reanalysis products are evaluated against in situ and satellite datasets which are described below. It is however, important to note that many of these datasets have been assimilated into the reanalysis products and therefore a relatively high degree of agreement is expected between them.
Operational Sea Surface Temperature and Sea Ice Analysis
The Operational Sea Surface Temperature and Sea Ice Analysis (OSTIA) product is produced by the United Kingdom Meteorological Office and distributed by CMEMS at http://marine.copernicus.eu/. This is a daily gap-free (level 4) product of global foundation SST and ice concentration (Good et al., 2020). For the purpose of this study, only the foundation SST is used. It has a 1/20° horizontal resolution spanning the period from January 1981 to the present. It is a combination of in situ data from drifting and moored buoys, as well as satellite data from sensors such as the AVHRR, Advanced ATSR, AMSRE, Spinning Enhanced Visible and Infrared Imager (SEVIRI), and the Tropical Rainfall Measuring Mission Microwave Imager (TMI).
High Resolution Sea Surface Temperature Extraction
The high resolution (1 km) SST extraction product is derived from the Moderate Resolution Imaging Spectroradiometer (MODIS) aboard the Aqua and Terra satellites. Data from the AVHRR, NOAA and Polar Orbiting Environmental Satellite (POES) have also been included from January 2000 to December 2003. AVHRR SST retrievals were adjusted to account for the bias that results from the difference in equator crossing times between the NOAA and EOS platforms. Data from swath granules were extracted for the geographical region covering 32–40° S, 16–28° E and mapped to a rectangular projection containing 96 pixels × 96 pixels per degree. In the l2gen NASA Ocean Biology Processing Group SST processing chain, each MODIS SST pixel is subjected to a series of quality tests to detect the influence of the swath edge, sunglint, cloud, or aerosols and assigned a quality level of 0–4, with 0 being uncompromised and 1–4 representing a decreasing level of confidence in valid SST pixel retrieval. The MODIS/AVHRR decision tree for cloud classification is very conservative and often misclassifies cloud-free pixels in the proximity of cloud and strong geophysical frontal zones. To improve the retrieval of valid SST data, a statistical method was employed whereby each pixel was tested for validity, by confirming that the absolute value of the difference between the measured SST value and a 5-day average of all available MODIS SST pixels at that location was within 1.5 times its climatological monthly standard deviation. A significant reduction in sampling error is achieved through the production of daily average composites from the resultant day and night SST retrievals.
Satellite Altimetry Data – Copernicus Marine Environment Monitoring Service
The daily delayed-time satellite altimetry data, produced and distributed by CMEMS at http://marine.copernicus.eu/, has a 1/4° horizontal resolution spanning the period from January 1993 to the present (Pujol and Mertz, 2019). It consists of daily gridded sea level anomalies and derived variables which are computed with respect to a 20-year (1993–2012) mean (Rio et al., 2014). Only the Absolute Dynamic Topography (ADT) and geostrophic velocity components datasets are considered herein.
Coriolis Ocean Dataset for Reanalysis
The Coriolis Ocean Dataset for Reanalysis (CORA) product, produced by Coriolis and distributed by CMEMS at http://marine.copernicus.eu/, includes gridded objective analysis fields of temperature and salinity. CORA version 5.2 is a global dataset of in situ temperature and salinity measurements which covers the period January 1990 to June 2020 (Szekely et al., 2019). CORA comprises a variety of observational data from platforms including Argo floats, fixed moorings, gliders, drifters, sea mammals as well as from CTDs and XBTs aboard research vessels (Szekely et al., 2019). It is important to note that none of the in situ datasets (SAMBA, SHBML, ACT, and ASCA) used in this evaluation form part of the CORA dataset.
Agulhas Current Time-Series Experiment
The Agulhas Current Time-Series Experiment (ACT) consists of 12-hourly gridded cross-sectional velocity data (April 2010 to February 2013) based on in situ current meter measurements (Beal et al., 2015). The data are accessible from the Rosenstiel School of Marine and Atmospheric Sciences’ Beal lab at https://beal-agulhas.rsmas.miami.edu/data-and-products/index.html. The mooring array, described in greater detail in Beal et al. (2015), was deployed along the TOPEX/Jason satellite ground track 96 (Figure 1) and consisted of seven current meter moorings and four Current and Pressure recording Inverted Echo Sounders (CPIES).
Agulhas System Climate Array
The Agulhas System Climate Array (ASCA) consists of 20-hourly gridded cross-sectional velocity data (April 2016 to June 2018) based on in situ current meter measurements (Gunn et al., 2020; McMonigal et al., 2020). The data are accessible from the Rosenstiel School of Marine and Atmospheric Sciences’ Beal lab at https://beal-agulhas.rsmas.miami.edu/data-and-products/index.html. ASCA, the continuation and expansion of ACT, is an international collaborative oceanographic project where a mooring array, deployed along the TOPEX/Jason satellite ground track 96, was designed to provide long term observations of Agulhas Current’s volume, temperature, and salinity transports (McMonigal et al., 2020). The mooring array consists of two shelf and seven full-depth tall moorings which are outfitted with acoustic Doppler current profilers (AD), current meters and microCATs. The moorings are interspersed with five CPIES which also extend the array to 300 km offshore (McMonigal et al., 2020).
South Atlantic Meridional Overturning Circulation Basin-Wide Array
The South Atlantic Meridional overturning circulation Basin-wide Array (SAMBA1) is an in situ mooring array that provides a unique opportunity to observe the inter-ocean and coastal-ocean exchanges taking place along 34.5°S for a sustained period. SAMBA was initiated in 2013 with the deployment of four CPIES and this was followed by the addition of four deep sea moorings (M7, M8, M9, and M10) extending from the continental shelf edge to 15° E, and two shallow water moorings (M3 and M4) in 2014 (Kersalé et al., 2018). The four deep sea moorings are located along 34.5°S at the 1,000, 2,000, 3,000, and 4,500 m isobaths, respectively. Each mooring is equipped with a 75 kHz upward facing ADCPs located at approximately 500 m depth which records current speed and direction from approximately 500 to 50 m (Carr, 2018). For the purpose of this study the current data spanning from July 2014 to October 2018 are used.
St Helena Bay Monitoring Line
The St Helena Bay Monitoring Line (SHBML) is a 187 km long transect consisting of 12 stations and is orientated perpendicular to the coast, starting just off Eland’s Bay (Lamont et al., 2015). The dataset consists of vertical sections of temperature, salinity, and oxygen which were sampled on a monthly basis starting from April 2000 to December 2011 via Conductivity-Temperature-Depth (CTD) casts (Lamont et al., 2015). For the purpose of this study only the temperature and salinity data are used. The SHBML data can be accessed via the South African Data Centre for Oceanography (SADCO2).
Coastal Underwater Temperature Recorders
The South African Coastal Temperature Network’s (SACTN) in situ coastal ocean temperature records are located at 129 sites scattered along the South African coastline. These daily records span from 1972 to 2017 and of these 129 sites, 49 were measured using underwater temperature recorders (UTRs) and the remaining 80 were measured using hand-held thermometers. Only six of the UTR sites at varying depths were used, two of which are located on the west coast, two on the south coast and two on the east coast (Figure 1). The locations include (from west to east) Doringbaai (DB), Oudekraal (OK), Betty’s Bay (BB), Mossel Bay (MB), Aliwal Shoal (AS), and Sodwana (SD). The SACTN UTR records used in this study were maintained by the South African Department of Forestry, Fisheries and the Environment and by Ezemvelo KwaZulu-Natal Wildlife (EKZNW).
Algoa Bay Hydrographic Records
The Algoa Bay Sentinel Site (ABSS) is the most comprehensive coastal observation network in South Africa. Part of the South African Environmental Observation Network’s (SAEON) contribution to the ABSS has been the deployment of ADCPs and UTRs in the region. SAEON’s Elwandle Node have produced and curated the hydrographic temperature and current records at various sites in Algoa Bay. Only a portion of the available data has been used for this study with the ADCPs are located at Cape Recife and Bird Island, whereas the UTRs are located at St Croix and at the Algoa Bay mouth.
Results and Discussion
For the purpose of this study, all reanalysis products have been regridded to match the spatial resolution of the respective observational datasets.
Large Scale
The performance of the reanalysis products is evaluated within the region between 5–45°S, and 0–60°E, covering the southern African marine environment (Figure 1). The reanalysis data were co-located in time and space to coincide with the respective observational datasets. The reanalysis products were evaluated over the period from January 1993 to December 2019 apart from HYCOM, which was evaluated over the period from January 1994 to December 2015. The effect of evaluating HYCOM over a different period to the other reanalysis products is presumed to be negligible based on the large temporal coverage of all datasets.
Surface Characteristics
While the OSTIA SST anomaly bias in BRAN is low everywhere (<∼0.5°C, except in the region of the Agulhas Return Current), all three global reanalysis products have largest SST biases (Figure 2) within the Benguela coastal upwelling regime and in the region of the Agulhas Return Current (ARC). The former is likely related to atmospheric forcing products that do not sufficiently capture the nearshore wind-field, or a mixed layer depth that is too deep. On the other hand, given that the ARC is characterized by an intense front with quasi-stationary meanders, the alternating cool (negative) and warm (positive) biases in that region suggest that they are related to model inaccuracies in its position and/or the position of its standing meanders. This is particularly evident in HYCOM (Figure 2c), where a band of underestimated SSTs lies north of a band of overestimated SSTs for the length of the ARC, suggesting a southward offset of the positive meridional SST gradient that characterizes it. GLORYS is the only model that produces a significant warm bias (>1°C) within the Agulhas Current. This could be related to the misrepresentation of the position of the Agulhas Current as it flows alongside the coast, but also as it veers away from the coast as it approaches the Agulhas Bank.
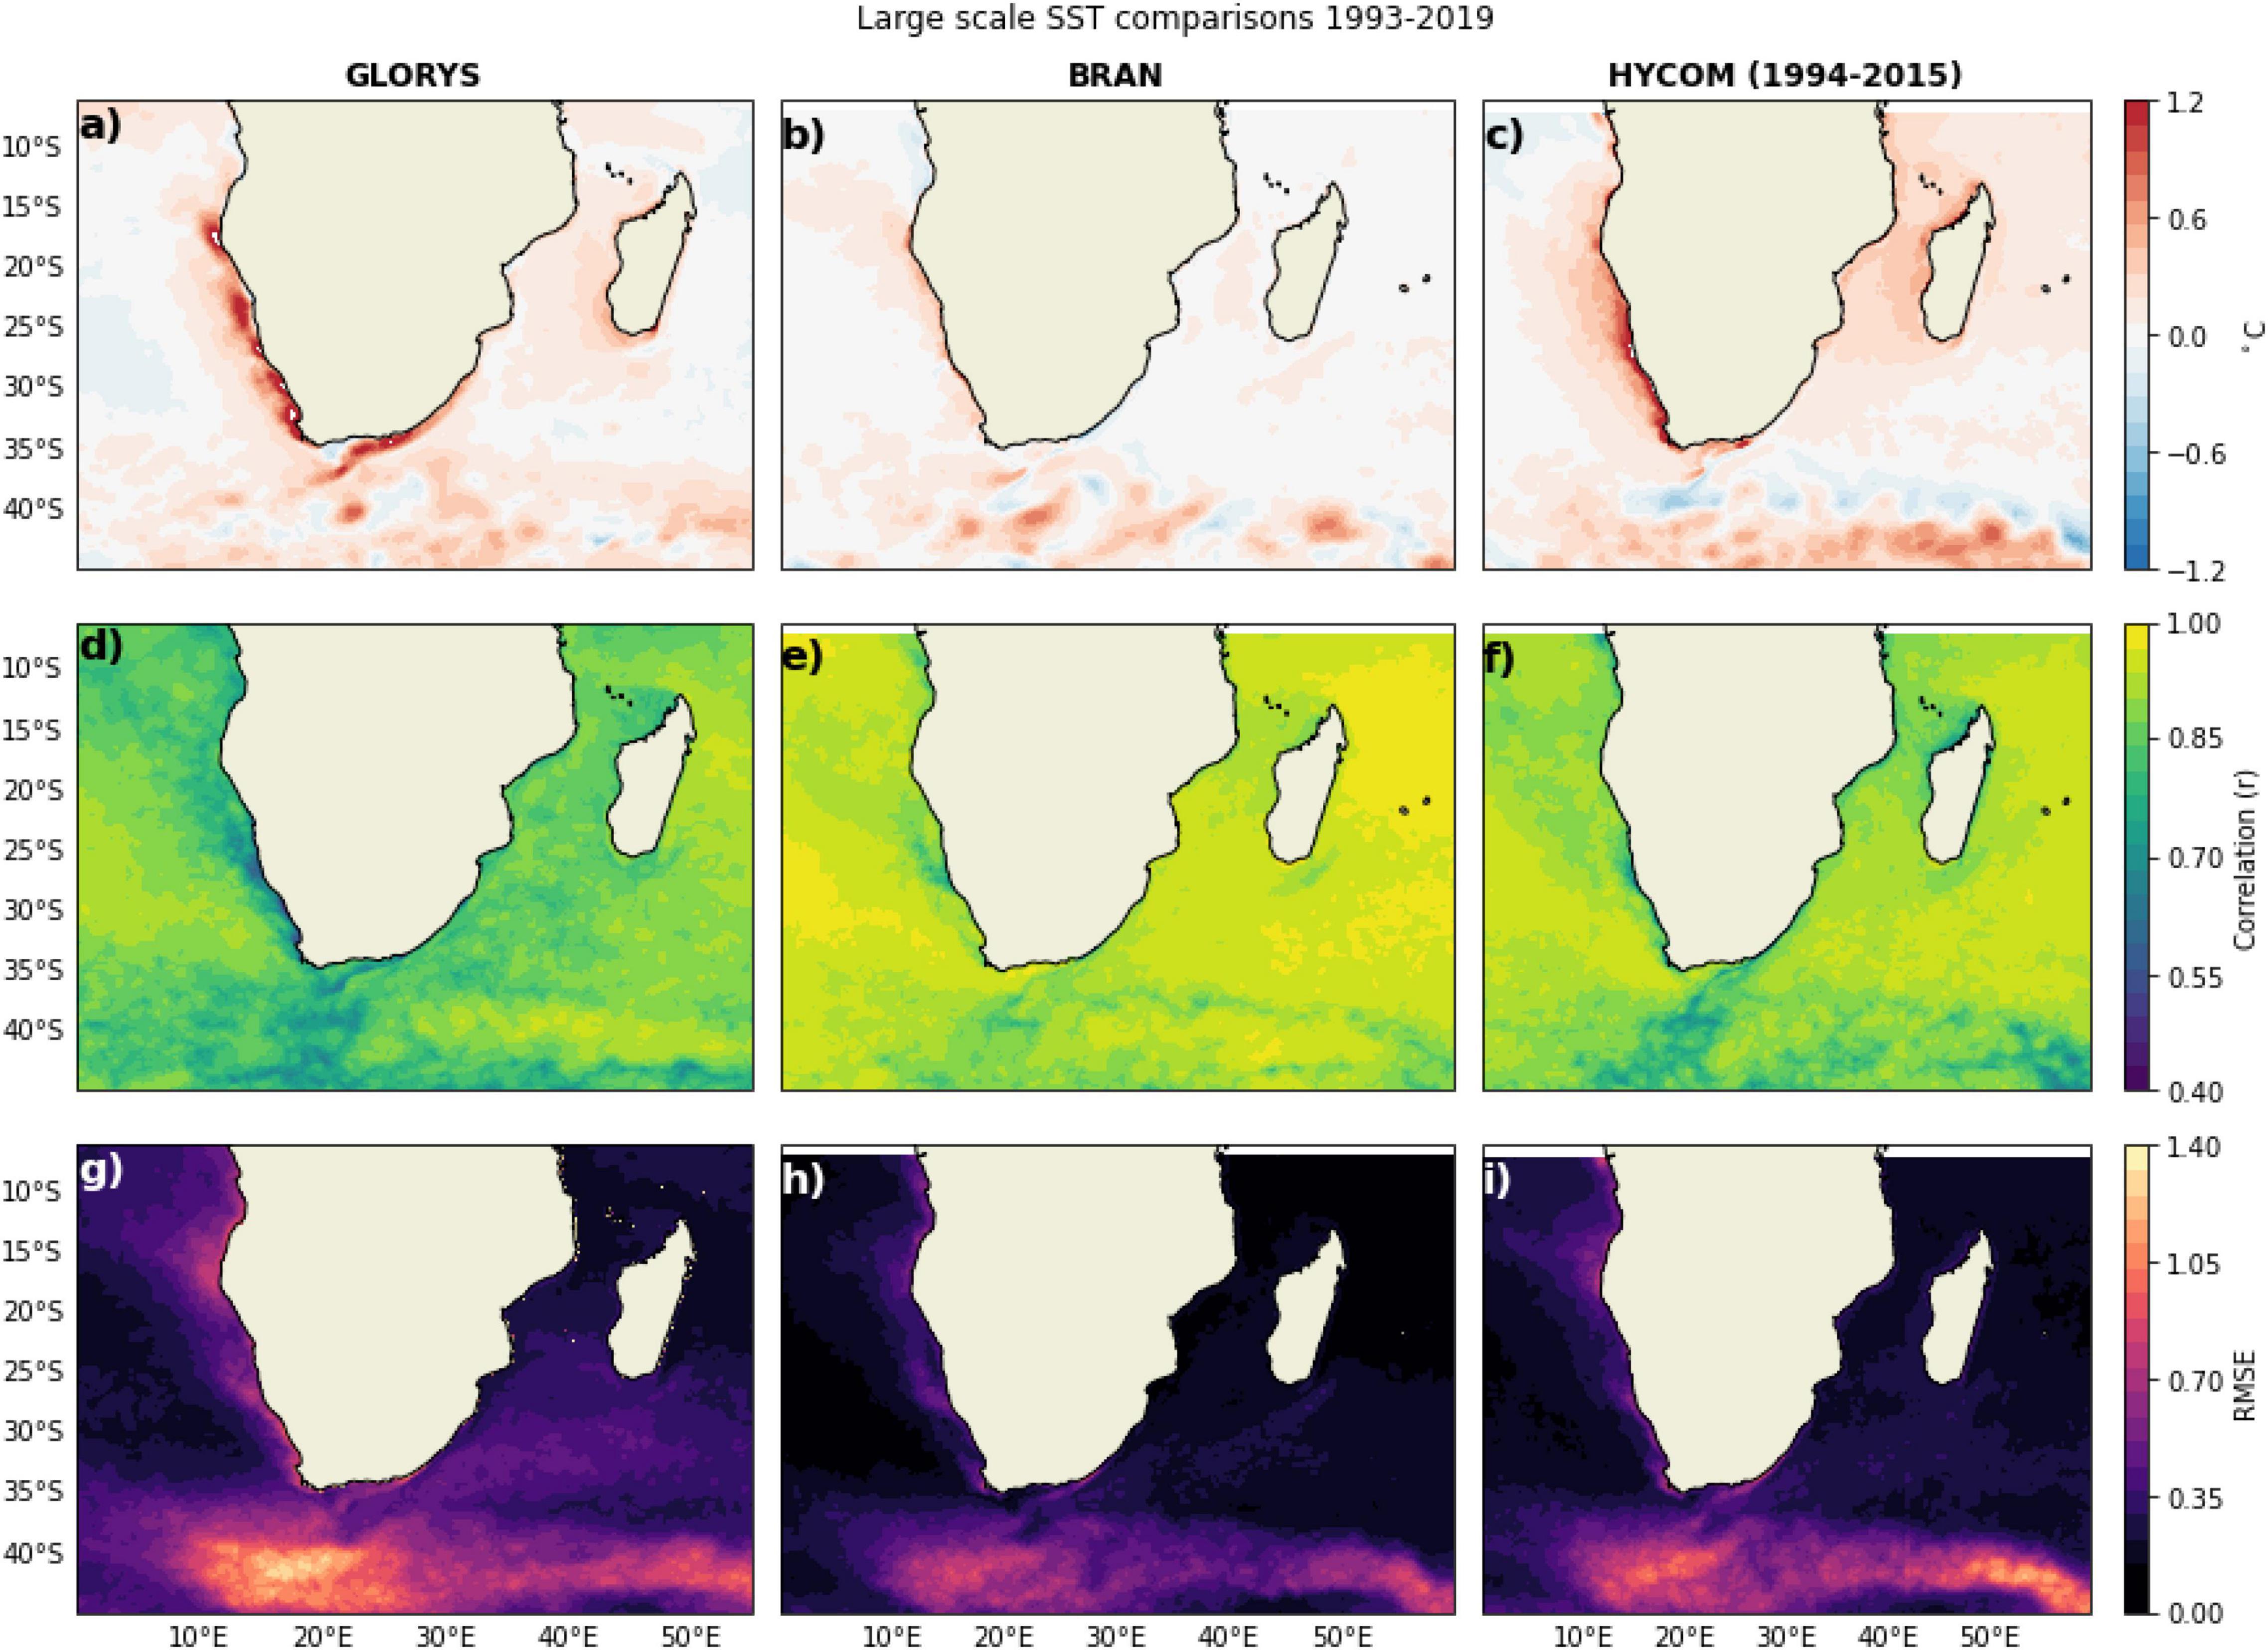
Figure 2. Maps of monthly L4 OSTIA Sea Surface Temperature (a–c) anomaly bias, (d–f) correlation, and (g–i) root mean square error for GLORYS, BRAN, and HYCOM.
The extent to which each of these models captures overall SST variability is shown in the maps of correlation and RMSE (Figure 2). Highest correlations and lowest RMSE values are produced in BRAN, with variability in the upwelling regime, associated with the upwelling front, and intense frontal region associated with the ARC being captured less well (lower correlations and higher RMSEs). Correlations and RMSE values suggest that, similarly, GLORYS and HYCOM perform worse in these regions associated with intense SST fronts. Given that various satellite SST products display a high degree of variance in the vicinity of these intense frontal zones (Carr et al., 2021), it is not surprising that all of the model products perform worse in these regions.
The modeled seasonal cycle of SST, presented in plots of spatially averaged SST for each of the predefined subregions (Mozambique Channel: MC, Northern Agulhas: NA, Agulhas Bank: AB, Southern Benguela: SB, and the Northern Benguela: NB) in Figures 3A–E, shows that each model correctly reproduces the seasonal cycle in each: highest SSTs in January and lowest in August. Similarly, the interannual variability of the average SST in these subregions is well reproduced in each model (Figures 3F–J) and is confirmed by the high correlations and low RMSEs of their SST anomalies compared with satellite.
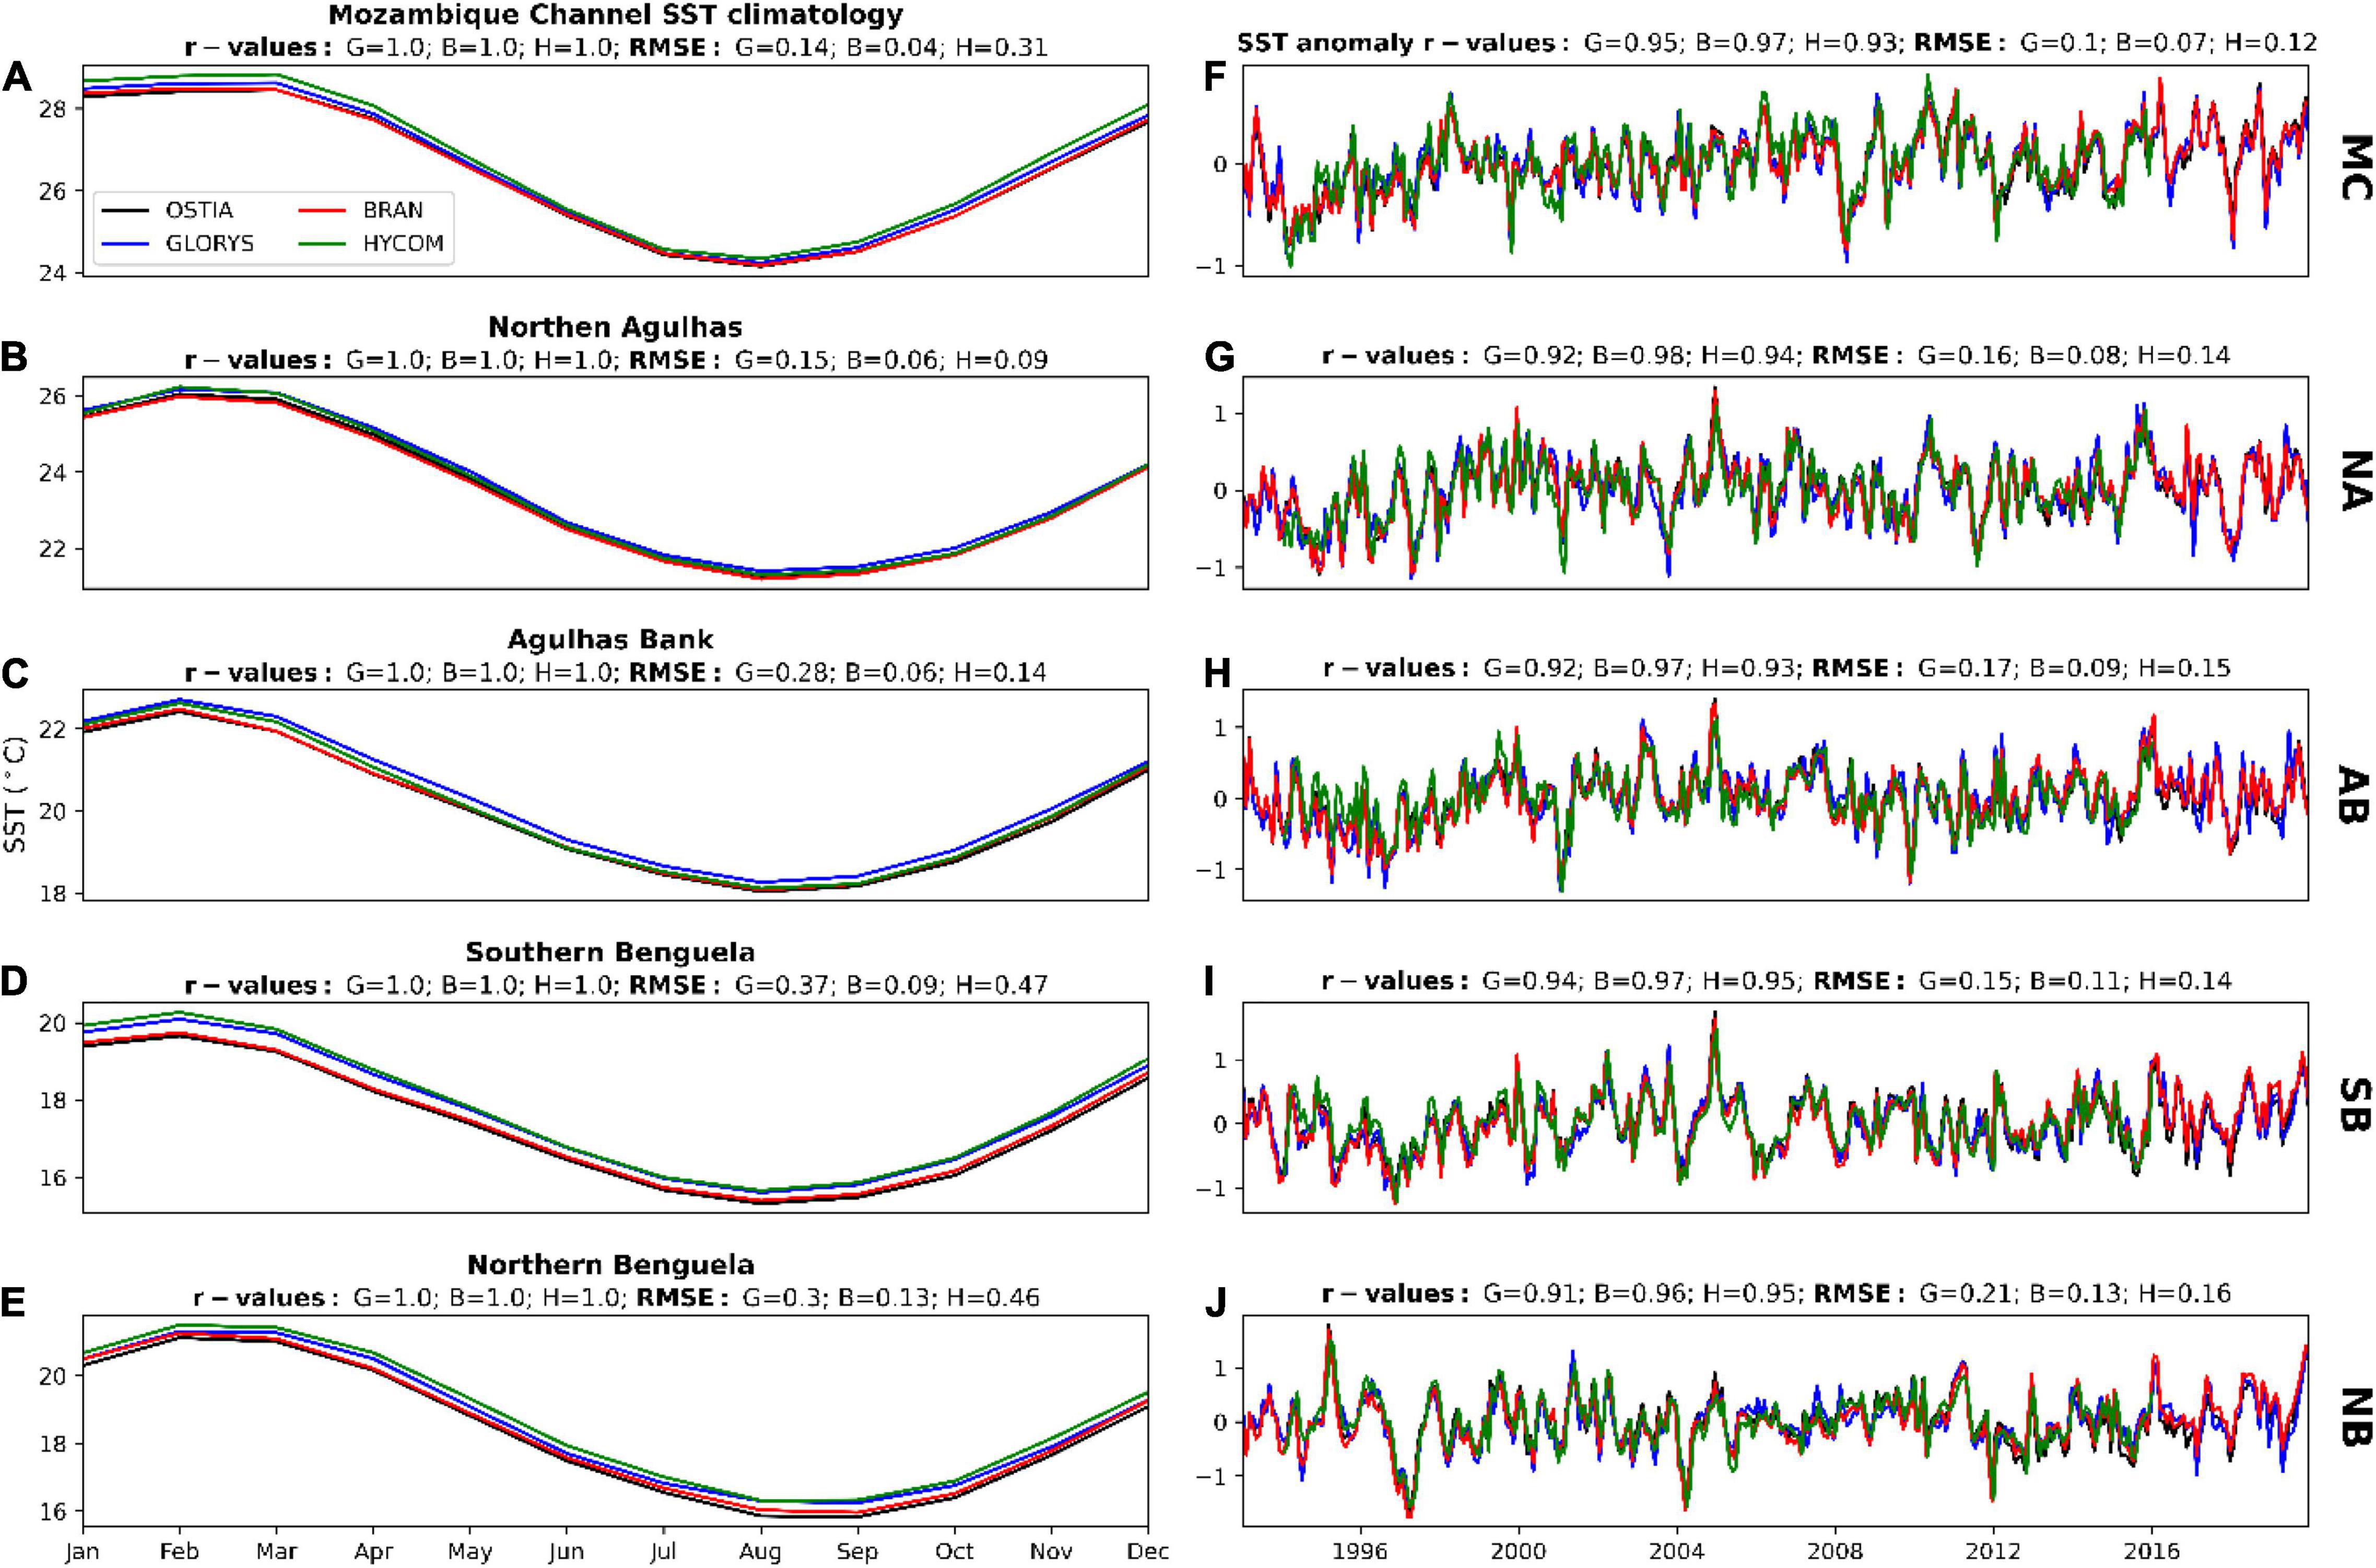
Figure 3. (A–E) Monthly SST climatology and (F–J) time-series of monthly SST anomaly (annual cycle removed) for the reanalysis products and the OSTIA satellite SST for the five different regions which include the Mozambique Channel (MC), Northern Agulhas (NA), Agulhas Bank (AB), Southern Benguela (SB), and the Northern Benguela (NB) regions.
Satellite SST is a spatially and temporally cohesive dataset that provides a convenient benchmark to which the output of global models can be compared. However, it has been shown by Carr et al. (2021) that various satellite products show a high level of disagreement in regions of intense SST fronts, which are abound around the coastline of southern Africa: the Benguela upwelling front, the Angola-Benguela Front, the Agulhas Retroflection and Return Current. For this reason, and that it is these satellite products that are assimilated into models, evaluations should be interpreted with caution.
Lines of constant SSH of the time-averaged (1993–2019 for daily GLORYS, BRAN and the satellite altimetry data and 1994–2015 for HYCOM) daily SSH field (Figure 4) are used as a proxy for surface geostrophic currents: where they are close together, the current is strong and where they are further apart the current is weaker. The lines of constant SSH in Figures 4B,C suggest that GLORYS and BRAN simulate a very well-defined ARC (∼39°S) similar to that present in the satellite data. In contrast, the ARC does not appear as well defined in HYCOM (Figure 4D). However, the two characteristic quasi-stationary ARC meanders (Boebel et al., 2003b) are only well reproduced in GLORYS, whereas they are not as distinctive in BRAN and HYCOM (Figure 4).
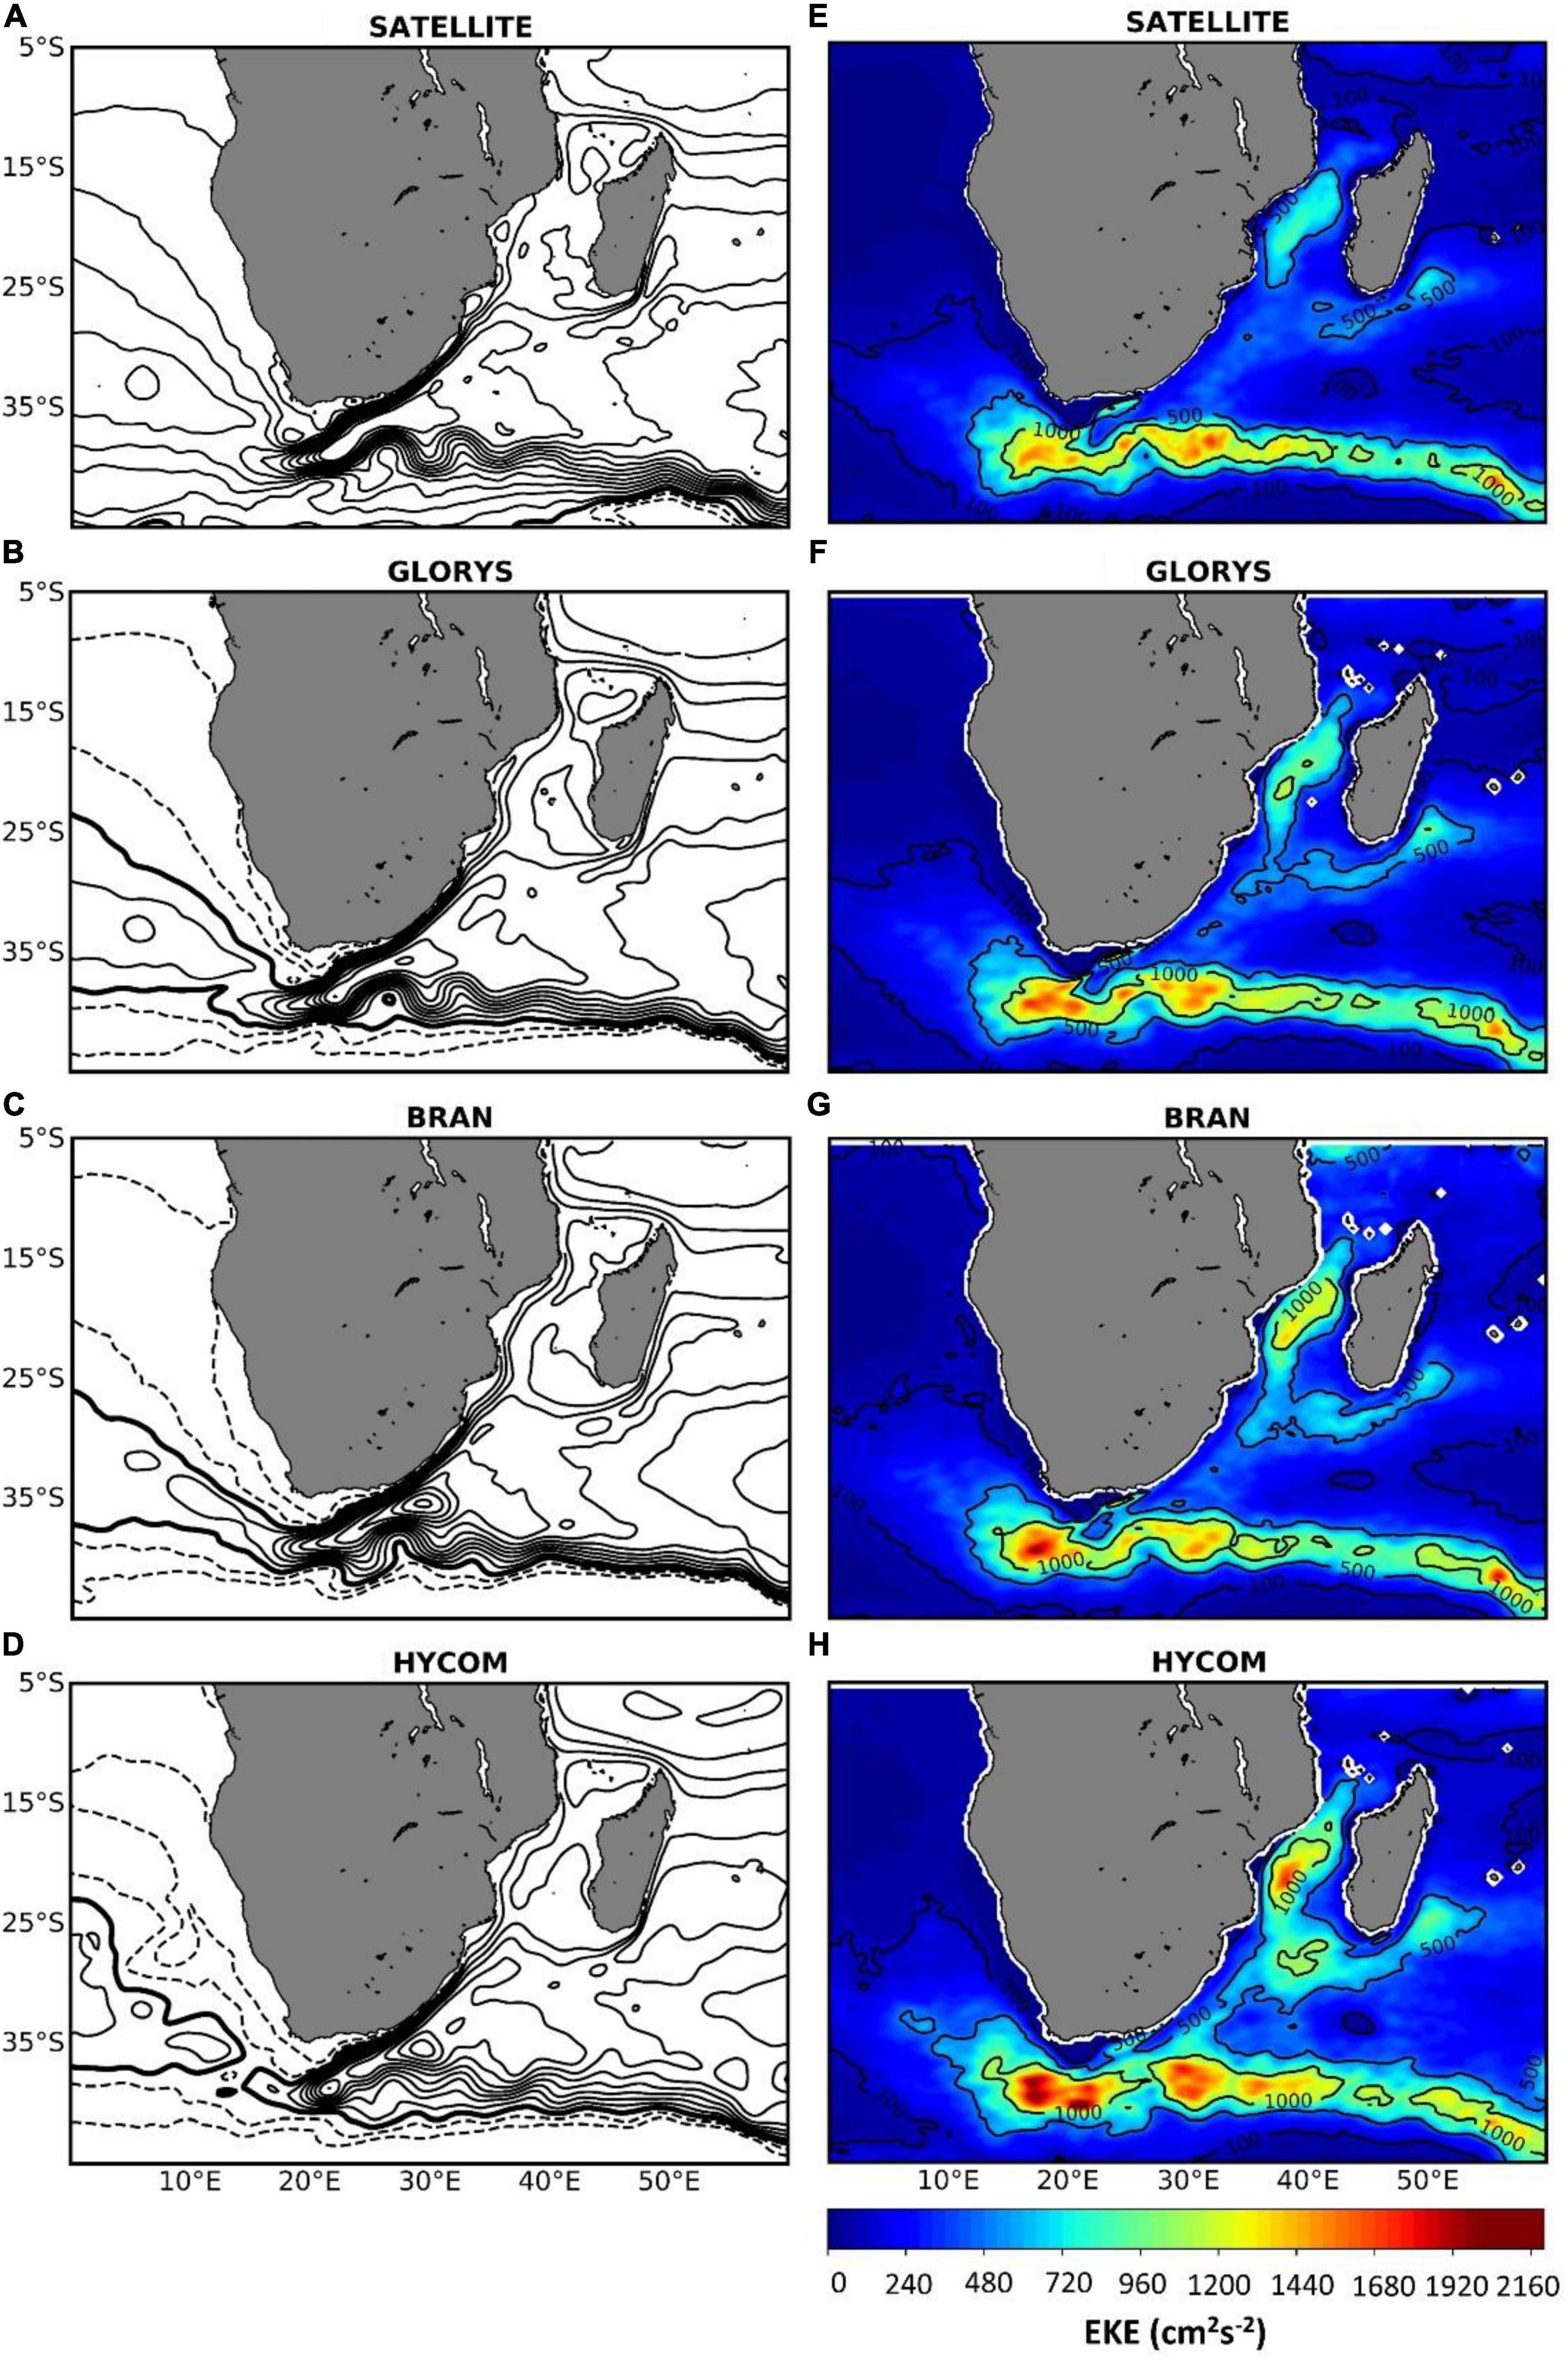
Figure 4. (A–D) Contour maps of mean daily Sea Surface Height (SSH) with equally spaced contours and the 0 m contour in bold. (E–H) Maps of Eddy Kinetic Energy (EKE) calculated from daily satellite altimetry data and reanalysis products, with the 100, 500, and 1,000 cm2s–2 contours emphasized.
The EKE is an important variable to consider when evaluating numerical ocean models and data assimilation systems because it is used as a proxy for mesoscale variability which allows for a spatial overview accentuating regions of low and high mesoscale variability (Backeberg et al., 2014; Braby et al., 2020). Here we compare satellite-derived with model derived EKE (based on the geostrophic surface current field). The reanalysis product is regridded onto the lower resolution satellite data and the surface geostrophic currents are calculated. The corresponding EKE is calculated using the following formula:
where – and – are the difference between the daily geostrophic velocity components with their respective daily climatological means (Santora et al., 2012).
While reanalysis products successfully reproduce many aspects of the Agulhas Current system, they tend to either overestimate or underestimate the frequency and size of the source region eddies as well as the associated EKE levels (Durgadoo et al., 2013; Backeberg et al., 2014; Loveday et al., 2014). EKE and the associated ocean mesoscale eddies exhibit a complicated relationship to atmospheric forcing (Patara et al., 2016). Therefore, it is suggested that the different atmospheric forcing of the three reanalysis products would affect the respective EKE.
All of the global reanalysis products reproduce higher EKEs in the Agulhas Retroflection region, the Agulhas Return Current, within the Mozambique Channel, in a corridor from the southeast of Madagascar toward the African continent and a small region of high EKEs associated with the detachment of the Agulhas Current from the coast as it approaches the Agulhas Bank (Figures 4G,H). The general pattern of regions of high EKE in all models therefore match the satellite-derived EKEs well. However, all models tend to overestimate EKE within the Mozambique Channel and in the corridor between southeast Madagascar to the African continent. Cyclonic eddies are known to form just north of Madagascar (Collins et al., 2014), whereas dipole eddy pairs have been regularly observed to form just south of Madagascar (Ridderinkhof et al., 2013). Therefore, it is likely that all of the reanalysis products overestimate the number of simulated cyclonic eddies north of Madagascar as well as the number of simulated dipole eddy pairs that form south of Madagascar.
The EKE along South Africa’s east coast is overestimated by all the reanalysis products which suggest that they produce a relatively less stable northern Agulhas Current than is observed in the satellite data (Figures 4E–H). This is most likely as a result of relatively higher mesoscale activity produced in the reanalysis products, which in this region consists majorly of Agulhas Meanders (Lutjeharms and Roberts, 1988) and Durban Eddies (Guastella and Roberts, 2016) – two types of cyclonic eddies, formed in this region, that propagate downstream along the inshore edge of the Agulhas Current. All models reproduce the position of high EKEs associated with the Agulhas Retroflection, but differences exist in their magnitudes. All of the reanalyses produce higher EKE in the retroflection region than is observed (Figures 4E–H). This higher EKE is likely to be as a result of a more variable retroflection location produced in the reanalyses than is observed in the satellite data. This is confirmed by the higher variance of the reanalyses’ retroflection longitudes in comparison to that of the satellite data, the details of which are further discussed in the “Agulhas Retroflection” section.
A similar spread of relatively high EKE in the South Atlantic Ocean, stretching northward into the Southern Benguela region and westward into the Cape Cauldron and is highlighted by the 100 cm2s–2 contour in Figures 4E–H. This region of intense turbulence is relatively smaller in the satellite-derived EKEs. This relatively higher mesoscale activity of the reanalysis products could be as a result of increased simulation and propagation of eddies and Agulhas Rings, as well as the increased occurrence of Agulhas filaments and jet currents. The relatively higher EKE of the reanalysis products in the Southern Benguela region could result in a suppressive effect on biological production (Gruber et al., 2011; Lachkar and Gruber, 2012).
Water Column
Given that specific oceanographic processes and features dominate the different regions of the southern African marine environment (Carr et al., 2021), the vertical structure of the water column will be assessed with regards to the five regions highlighted in Figure 1. The performance of the reanalysis products in reproducing the vertical structure of the water column is evaluated against the observational gridded monthly CORA dataset through the analysis of temperature and salinity profiles, as well as through a water mass analysis conducted in the specific regions (Figure 5). The depth, salinity, and temperature of the reanalysis products and the observational CORA datasets are converted to pressure (p), Absolute Salinity (SA) and Conservative Temperature (Θ), respectively, using the functions from the Gibbs SeaWater (GSW) Oceanographic Toolbox of TEOS-10 (McDougall and Barker, 2011). While only GLORYS and BRAN assimilate the CORA dataset, the majority of the vertical profiles making up the CORA dataset are from Argo floats which have been assimilated into all of the reanalysis, suggesting that any bias is expected to be negligible.
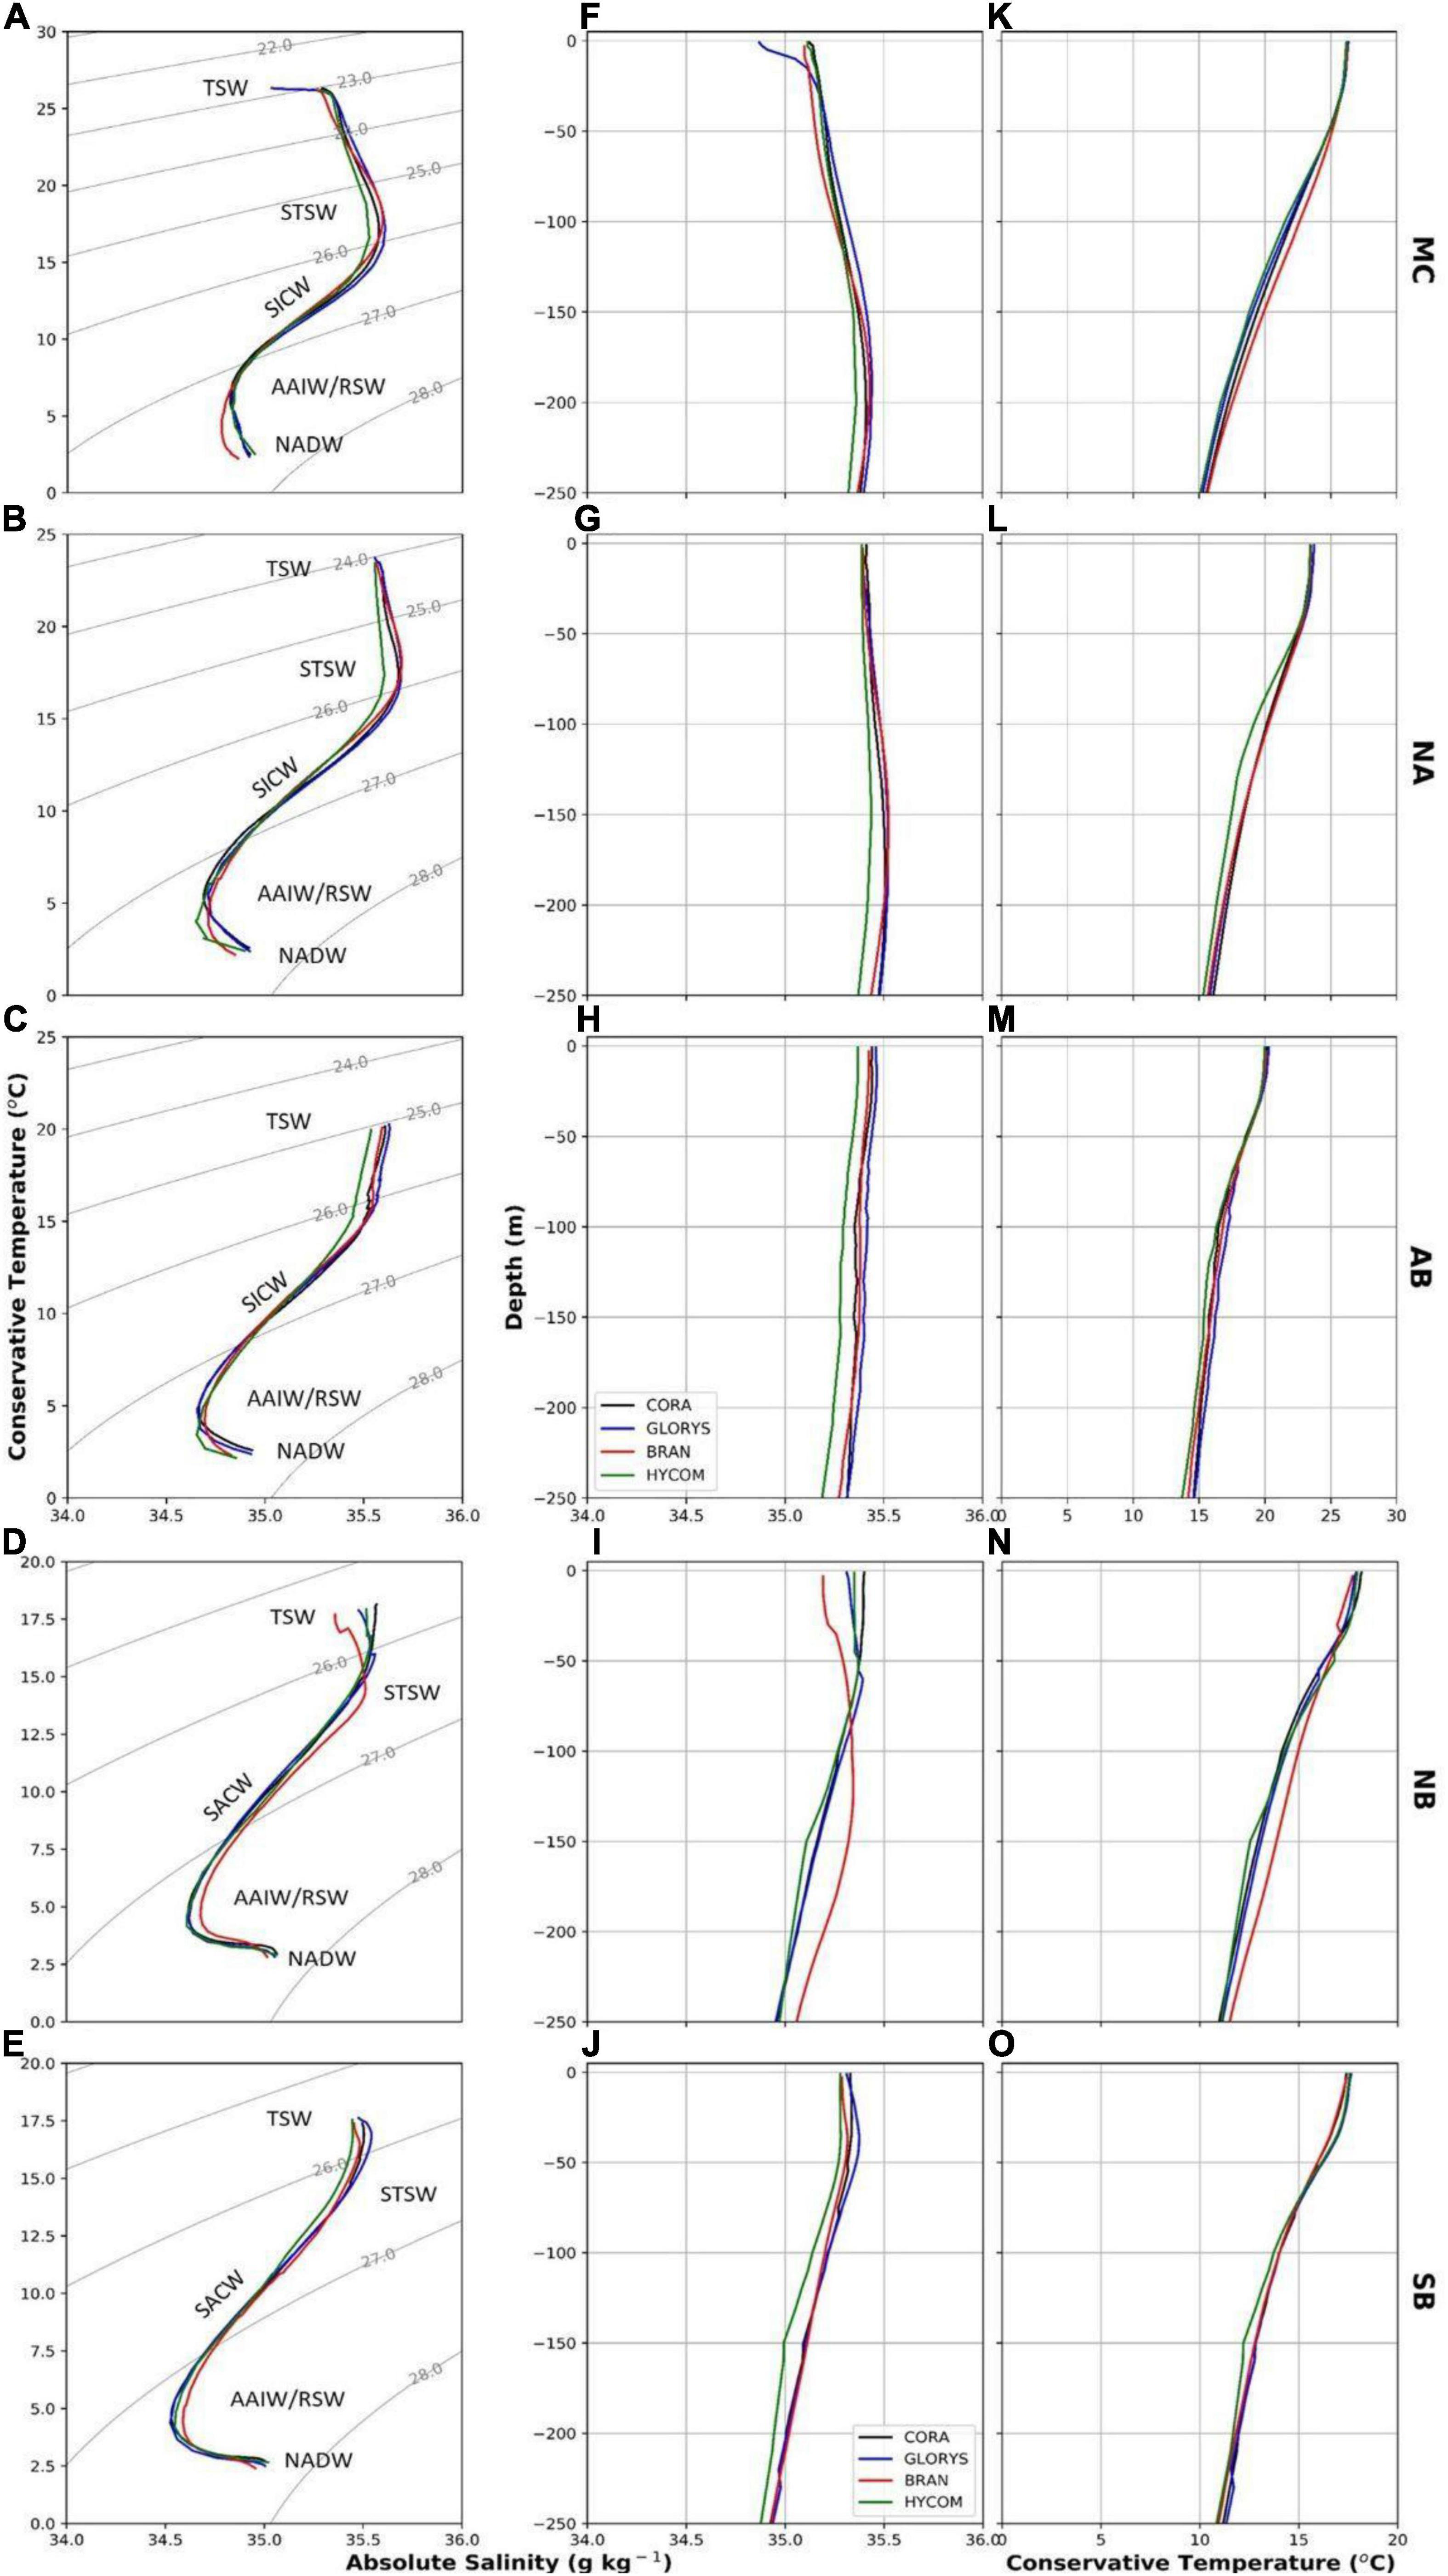
Figure 5. Vertical water column analysis for the CORA (black), GLORYS (blue), BRAN (red), and HYCOM (green) datasets along the southern African coastline in the Mozambique Channel (MC), Northern Agulhas (NA), Agulhas Bank (AB), Northern Benguela (NB), and Southern Benguela (SB) regions. The figure consists of latitudinally and longitudinally averaged (A–E) Conservative Temperature-Absolute Salinity plots, (F–J) Absolute Salinity profiles and (K–O) Conservative Temperature profiles.
The reanalysis products reproduce the observed vertical structure of the water column throughout the southern African marine environment reasonably well; however, temperature appears to be considerably better resolved than salinity (Figure 5). The temperature variability is captured best by the reanalyses within the upper 50 m of the water column, with r-values ranging between 0.6 and ∼1. Overall, GLORYS outperforms the other reanalyses showing smaller biases for both temperature and salinity throughout the water column (Figure 5). The three east coast regions (MC, NA, and AB; Figures 5A–C) are dominated by the same water masses which consist of Tropical Surface Water (TSW), Subtropical Surface Water (STSW), South Indian Central Water (SICW), Antarctic Intermediate Water (AAIW), Red Sea Water (RSW) and North Atlantic Deep Water (NADW; Lutjeharms et al., 1986; Jackson et al., 2012; Ullgren et al., 2012). In comparison, the west coast regions (NB and SB; Figures 5D,E) are dominated by Tropical Surface Water (TSW), Subtropical Surface Water (STSW), South Atlantic Central Water (SACW), Antarctic Intermediate Water (AAIW), and North Atlantic Deep Water (NADW; Shannon, 2001).
In the MC region (Figure 5A), GLORYS produces particularly less saline TSW (relatively high RMSE of 0.3; Supplementary Figure 2P), while HYCOM produces less saline STSW. HYCOM and BRAN simulate less saline SICW, whereas in GLORYS they are more saline. Given that the Θ-SA plots are latitudinally and longitudinally averaged, the two intermediate water masses (AAIW and RSW) become indistinguishable. GLORYS and HYCOM reproduce the observed intermediate and deep waters reasonably well, with near-zero RMSE values, whereas they are considerably less saline in BRAN, with relatively high RMSE values ranging between 0.05 and 0.1 (Supplementary Figure 2P). In the NA region, GLORYS and BRAN simulate TSW and STSW that are more saline than those observed, whereas they are less saline in HYCOM (Figure 5B). HYCOM and BRAN produce fresher SICW than those observed, whereas GLORYS reproduces them well. While GLORYS reproduces the observed intermediate and deep waters relatively well (low RMSE values; Supplementary Figure 2), BRAN and HYCOM both produce slightly cooler and more saline intermediate waters as well as less saline deep waters. Further southeast, in the AB region, GLORYS and BRAN produce TSW and STSW that are more saline in comparison to what is observed, whereas in HYCOM they are particularly less saline (Figure 5C). All the reanalyses produce SICW that is warmer and less saline than what is observed. GLORYS reproduces the observed intermediate waters well, whereas HYCOM and BRAN produce cooler and more saline intermediate waters. With regards to the deep waters, GLORYS reproduces them well, whereas BRAN and HYCOM simulate them to be cooler and less saline.
The TSW and STSW of the SB region are cooler and less saline in HYCOM and BRAN, whereas GLORYS reproduces them well. With regards to the SACW, GLORYS and HYCOM simulate these well, whereas they are more saline in BRAN (Figure 5E). GLORYS and HYCOM reproduce the observed AAIW and NADW reasonably well, whereas BRAN produces AAIW which is more saline and NADW that is cooler and less saline. Further upstream in the NB region (Figure 5D), all the reanalyses struggle to reproduce the observed TSW, as they are less saline in the reanalyses. GLORYS and HYCOM reproduce the remaining observed water masses particularly well. In contrast, BRAN (relatively high RMSE values for both temperature and salinity throughout the water column; Supplementary Figures 2I,S) produces more saline STSW, SACW, and AAIW, whereas the NADW is less saline.
Average temperature and salinity profiles for the upper 250 m of the water column of each subregion are shown in Figures 5F–O. In the Mozambique Channel (MC), where the temperatures in the upper ∼30 m are approximately homogeneous is indicative of the mixed layer (Figure 5K). In this layer, all models converge and agree well with observations with respect to temperature, however, GLORYS is much fresher and BRAN, also fresher, but less so (Figures 5F,K). All models become more saline with depth until ∼150 m (Figure 5F). In the Northern Agulhas (NA; Figures 5G,L) subregion, largest deviations from observations occur in HYCOM (too fresh and too cool below the mixed layer), while BRAN and GLORYS converge well with in situ observations. On the Agulhas Bank (AB; Figures 5H,M), the salinity decreases with depth throughout the water column for all models and is consistent with observations, though HYCOM produces consistently too fresh waters. In the Southern Benguela subregion (SB; Figures 5J,O), all models reproduce an increasing salinity with depth in the mixed layer, below which salinity decreases with depth. While all models generally converge and agree well with the temperature profile in this region, the salinity of BRAN and HYCOM is underestimated in the mixed layer and overestimated just at the base of the mixed layer for GLORYS. Beneath the mixed layer, HYCOM continues to underestimate salinity, while BRAN and GLORYS are close to observations. In the Northern Benguela (NB; Figures 5I,N) subregion, largest deviations from observations occur in BRAN with too fresh and slightly too cool waters in the mixed layer and too saline and too warm waters at greater depth. The compensating effect of too warm (too cold)/too salty (too fresh) on the resulting density profile will likely lead to a more accurately reproduced stratification.
Regional and Shelf-Scale
The Agulhas Current System
The Agulhas Current is the largest and strongest WBC in the Southern Hemisphere, flowing south-westward from 27 to 40°S (Quilfen et al., 2018) and forms the intensified western limb of the South Indian Ocean subtropical gyre (Imawaki et al., 2013) with a mean volume transport of −75 Sv (McMonigal et al., 2020). The AR region, located between 18 and 20°E, is where the Agulhas Current undergoes a direction change and flows eastward back into the Indian Ocean as the Agulhas Return Current (ARC; Figure 1). Agulhas leakage, which takes place in the AR region has been linked with a more westward location of the AR (van Sebille et al., 2009).
While the Agulhas Current generally retroflects between 15 and 20°E (Russo et al., 2021), it has been found to retroflect on occasion east of 20.03°E. Events such as these are known as early retroflections and have taken place in 1999, 2000/2001, 2008, 2011, and 2019 (Krug et al., 2014; Russo et al., 2021). Early retroflections can influence inter-basin exchange as they generally coincide with the shedding of large Agulhas Rings into the Atlantic (de Ruijter et al., 2004; Dencausse et al., 2010). In addition, early retroflections can have detrimental impacts on the biological productivity on the Agulhas Bank as a result of an offshore advection of highly productive shelf water which is ultimately lost to the surrounding ocean (Roberts and Mullon, 2010). Studies have found the triggering mechanism for early retroflections to be the interaction between large Agulhas meanders/Natal Pulses (diameter >400 km) with the northward extensions of the meanders in the ARC, which short-circuits the Agulhas Current’s flow, limiting its south-westward extension (Lutjeharms, 1989; Biastoch et al., 2008; Russo et al., 2021).
Agulhas meanders, also known as Natal Pulses, are large offshore meanders of the Agulhas Current which are associated with cyclonic circulation, as well as a cold core eddy inshore of the meander. By all accounts, they represent the dominant form of variability in the otherwise stable flow of the northern Agulhas Current (Lutjeharms et al., 2001; Elipot and Beal, 2015; Malan et al., 2018). The frequency at which they occur is erratic, with some studies observing no large meander events in a 2 year period (Beal et al., 2015) and others observing from 1.7 (Krug et al., 2014) to as many as 6 per year (de Ruijter et al., 1999). They are associated with temporary inshore current reversals (Roberts et al., 2010), the uplift of nutrient-rich water onto the shelf which has been found to stimulate positive ecosystem responses (Jackson et al., 2012; Goschen et al., 2015; Pivan et al., 2016; Russo et al., 2019), and on occasion, they have been found to influence retroflection dynamics triggering early retroflection events (Lutjeharms and van Ballegooyen, 1988).
The Agulhas Current system not only influences the local climate, including rainfall and extreme events (Nkwinkwa Njouodo et al., 2018), as well as the physical and biological activities of its adjacent shelf system (Beckley and van Ballegooyen, 1992; Barlow et al., 2010; Russo et al., 2019) but as it forms a major component of the global thermohaline circulation, it has been found to influence also global climate and subsequently climate change (Beal et al., 2011). Given its significance in global circulation, it is important that global reanalysis products accurately simulate it. Unfortunately, prominent features, such as Agulhas meanders and the AR remain poorly resolved in numerical ocean models (Tsugawa and Hasumi, 2010; Braby et al., 2016). This section investigates the extent to which the reanalysis products reproduce the observed Agulhas Current system, as well as the features pertaining to it.
Agulhas Transport
Two separate daily volume transport time-series have been constructed using current data from the ACT and ASCA (Figures 6A,B) datasets. While all three products are evaluated against the ACT data, given that the ASCA data begins in 2016 and that HYCOM ends in 2015, only GLORYS and BRAN will be included in the ASCA analysis. The u- and v-velocity components have been transformed into along- and cross-shelf components, and the respective transports have been calculated using the along-shelf velocity components.
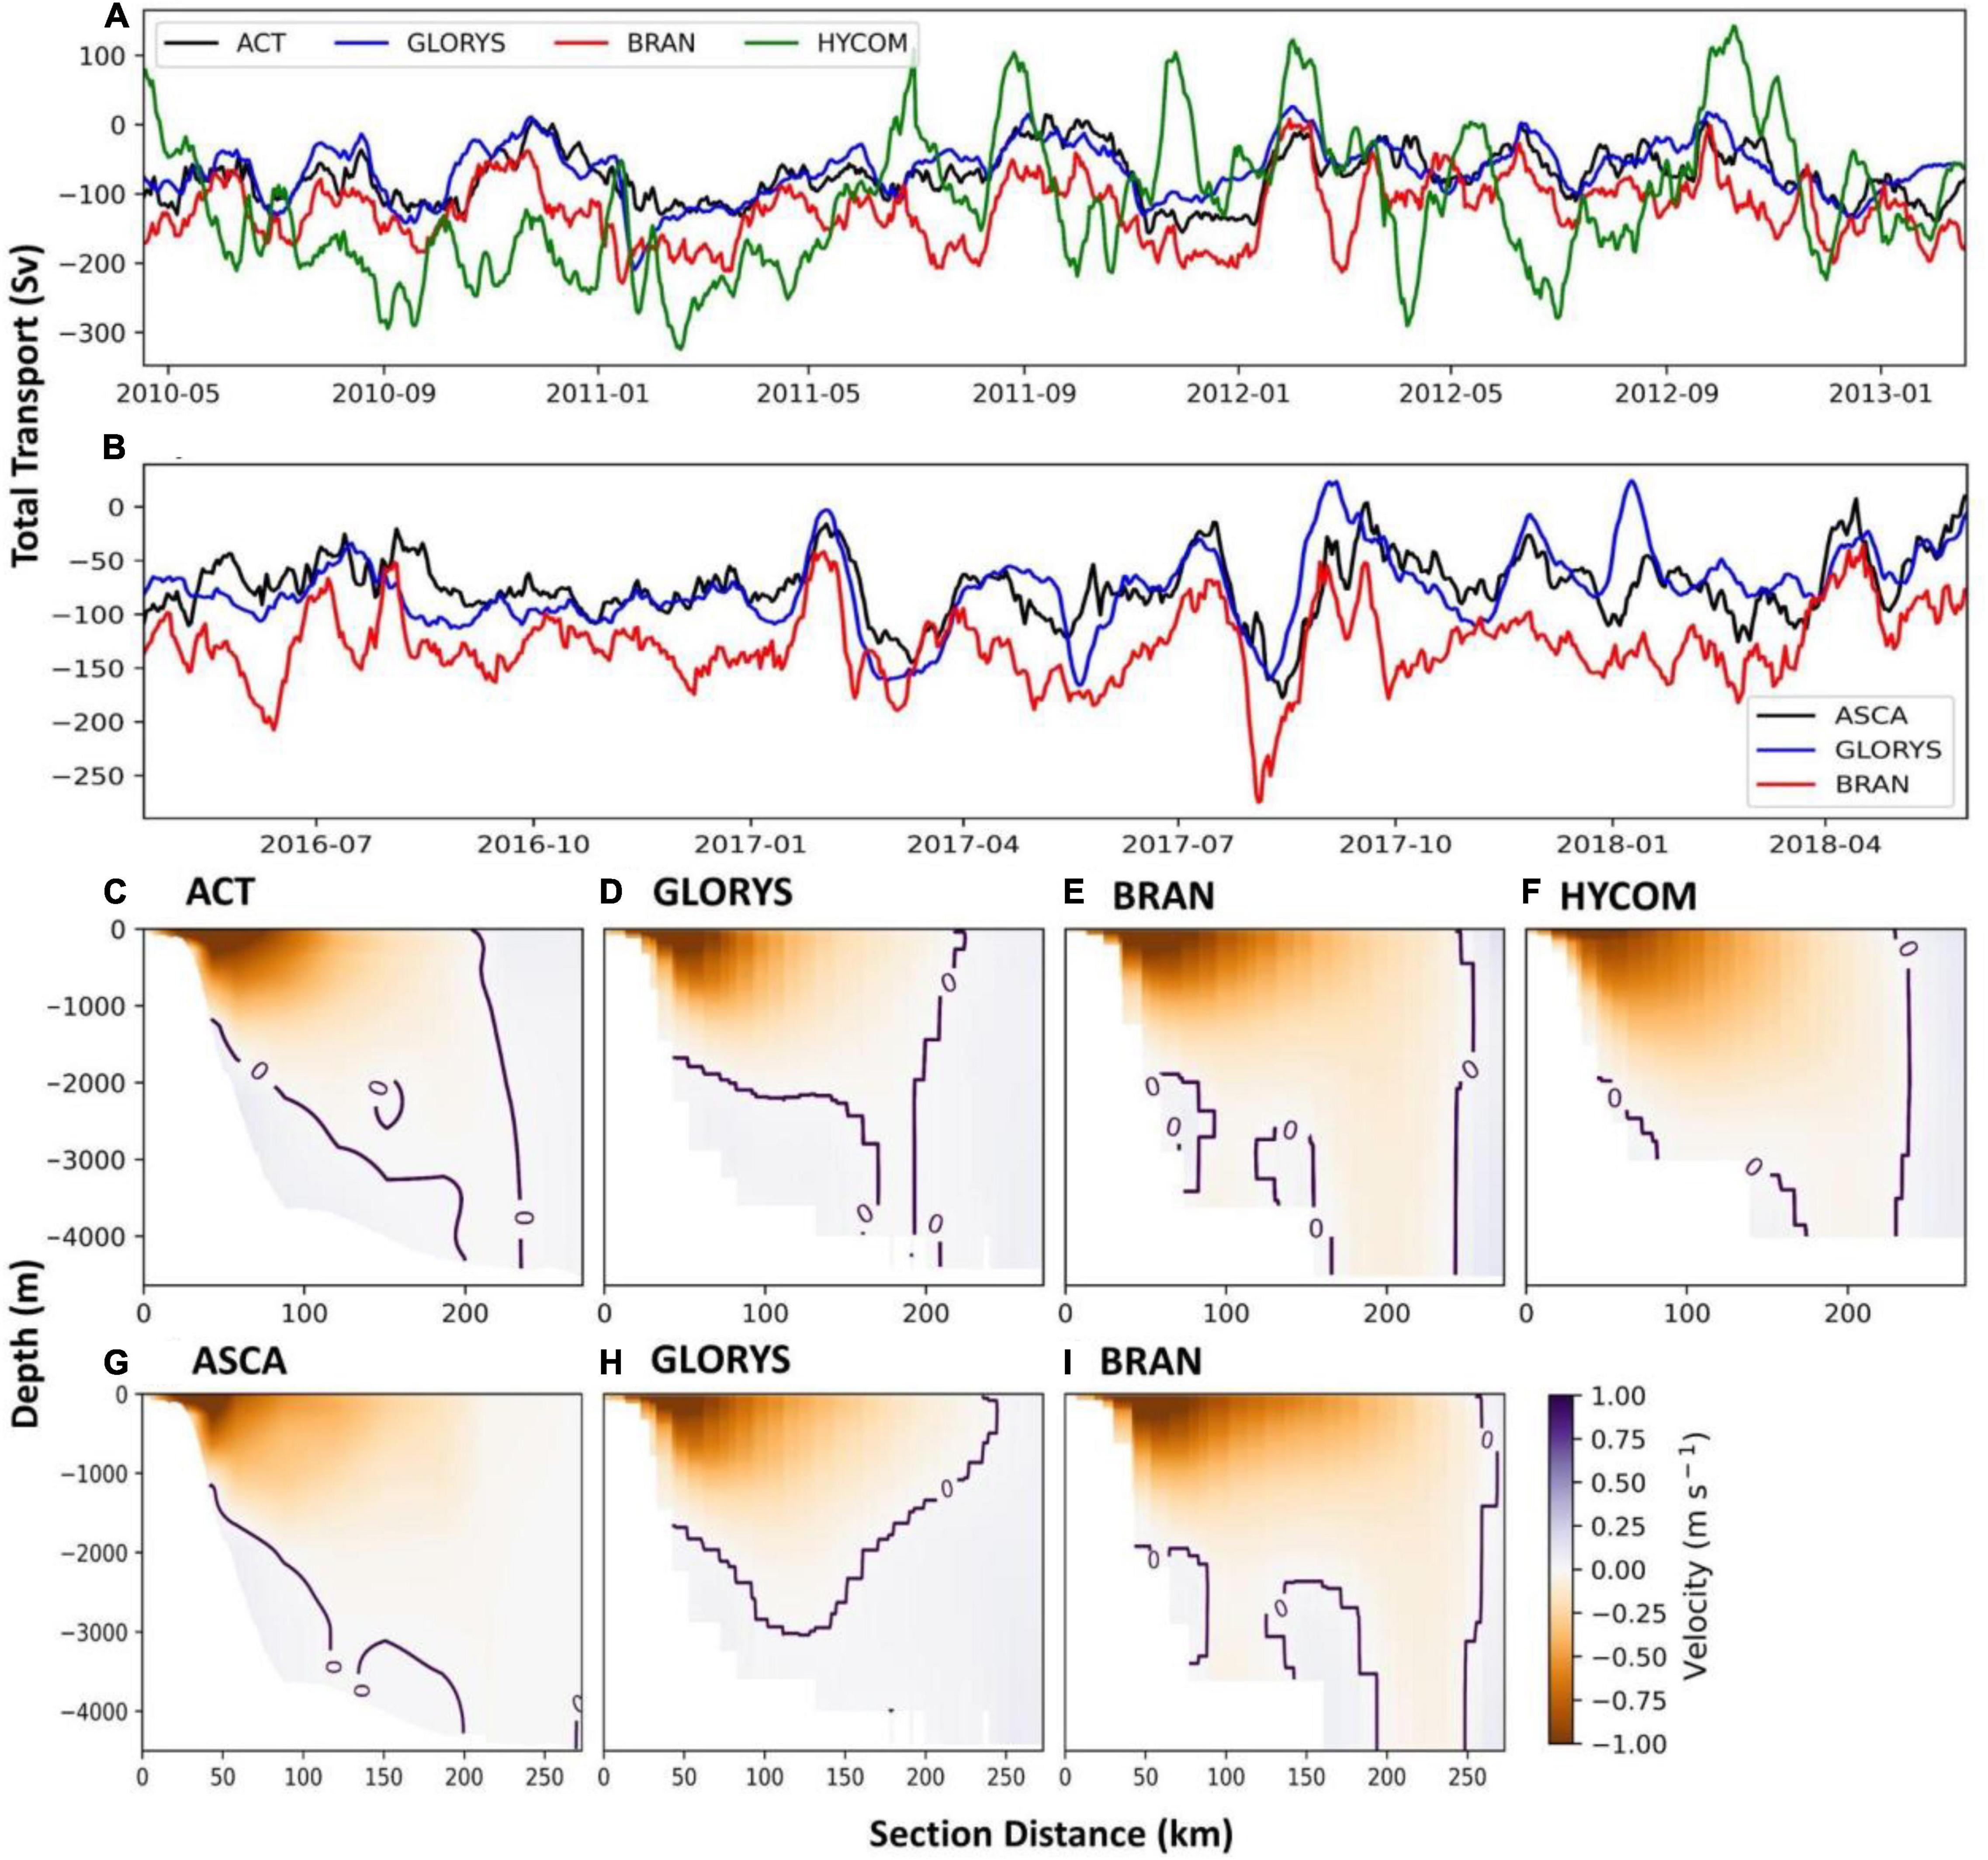
Figure 6. (A,B) Time-series of total daily alongshore transports (calculated through the vertical sections) for GLORYS, BRAN, HYCOM and the in situ ACT and ASCA data, respectively. Mean sectional alongshore velocity evaluations of the reanalyses against the (C–F) ACT and the (G–I) ASCA datasets. Negative (positive) values indicate south-westward (north-eastward) flow.
The components pertaining to the mean velocity structure of the Agulhas Current are captured fairly well by the reanalysis products – all of which simulate the Agulhas Current’s south-westward flow, as well as the north-eastward flow of the Agulhas Undercurrent, albeit to varying extents (Figures 6C–I). Overall, these features and the observed total transport time-series are reproduced best in GLORYS. In contrast, BRAN and HYCOM produce a wider Agulhas Current, narrower Agulhas Undercurrent and overestimate the offshore north-eastward flow (Figures 6E,F,I). Variations like these can have implications on the total transports calculated through the sections. The mean and standard error for the total observational transports calculated for ACT and ASCA are −74.54 ± 1.15 Sv and −73.18 ± 1.1 Sv, respectively, comparing well with those calculated by Beal et al. (2015) and McMonigal et al. (2020). They do not equal those of Beal et al. (2015) and McMonigal et al. (2020) because they use a more sophisticated method to identify the borders of the current to calculate the transport, whereas fixed sections are used in this study. The south-westward flow of the Agulhas Current is slightly underestimated by GLORYS in the ACT analysis with a mean of −65.83 ± 1.25 Sv, whereas it overestimates it in ASCA analysis with a mean of −75.63 ± 1.29 Sv. In contrast, BRAN overestimates the Agulhas Current’s transport in both the ACT and ASCA analyses, with mean transports of −123.69 ± 1.43 Sv and −128.56 ± 1.26 Sv, respectively. Similarly, but to a lesser extent, HYCOM also overestimates the ACT transport with a mean of −116.27 ± 2.68 Sv.
While HYCOM simulates a relatively larger and stronger Agulhas Current, it overestimates the variability through its simulation of more Agulhas meanders than observed (Figures 7D,G), producing a more variable total transport time-series which does not correlate well (r-value = 0.17, RMSE = 97.44) with the observations (Figure 6A). Despite BRAN’s overestimation (noting that negative values indicate south-westward transport) of the Agulhas Current’s overall transport, the variability in the daily transport is well captured with r-values of 0.72 and 0.61 (p-values << 0.05) but still with relatively higher RMSE values of 58.81 and 62.63 for the ACT and ASCA data, respectively (Figures 6A,B). GLORYS captures the variability of the transport time-series best with high r-values of 0.75 and 0.64 (p-values << 0.05) and relatively low RMSE values of 28.98 and 28.56 for the ACT and ASCA data, respectively (Figures 6A,B).
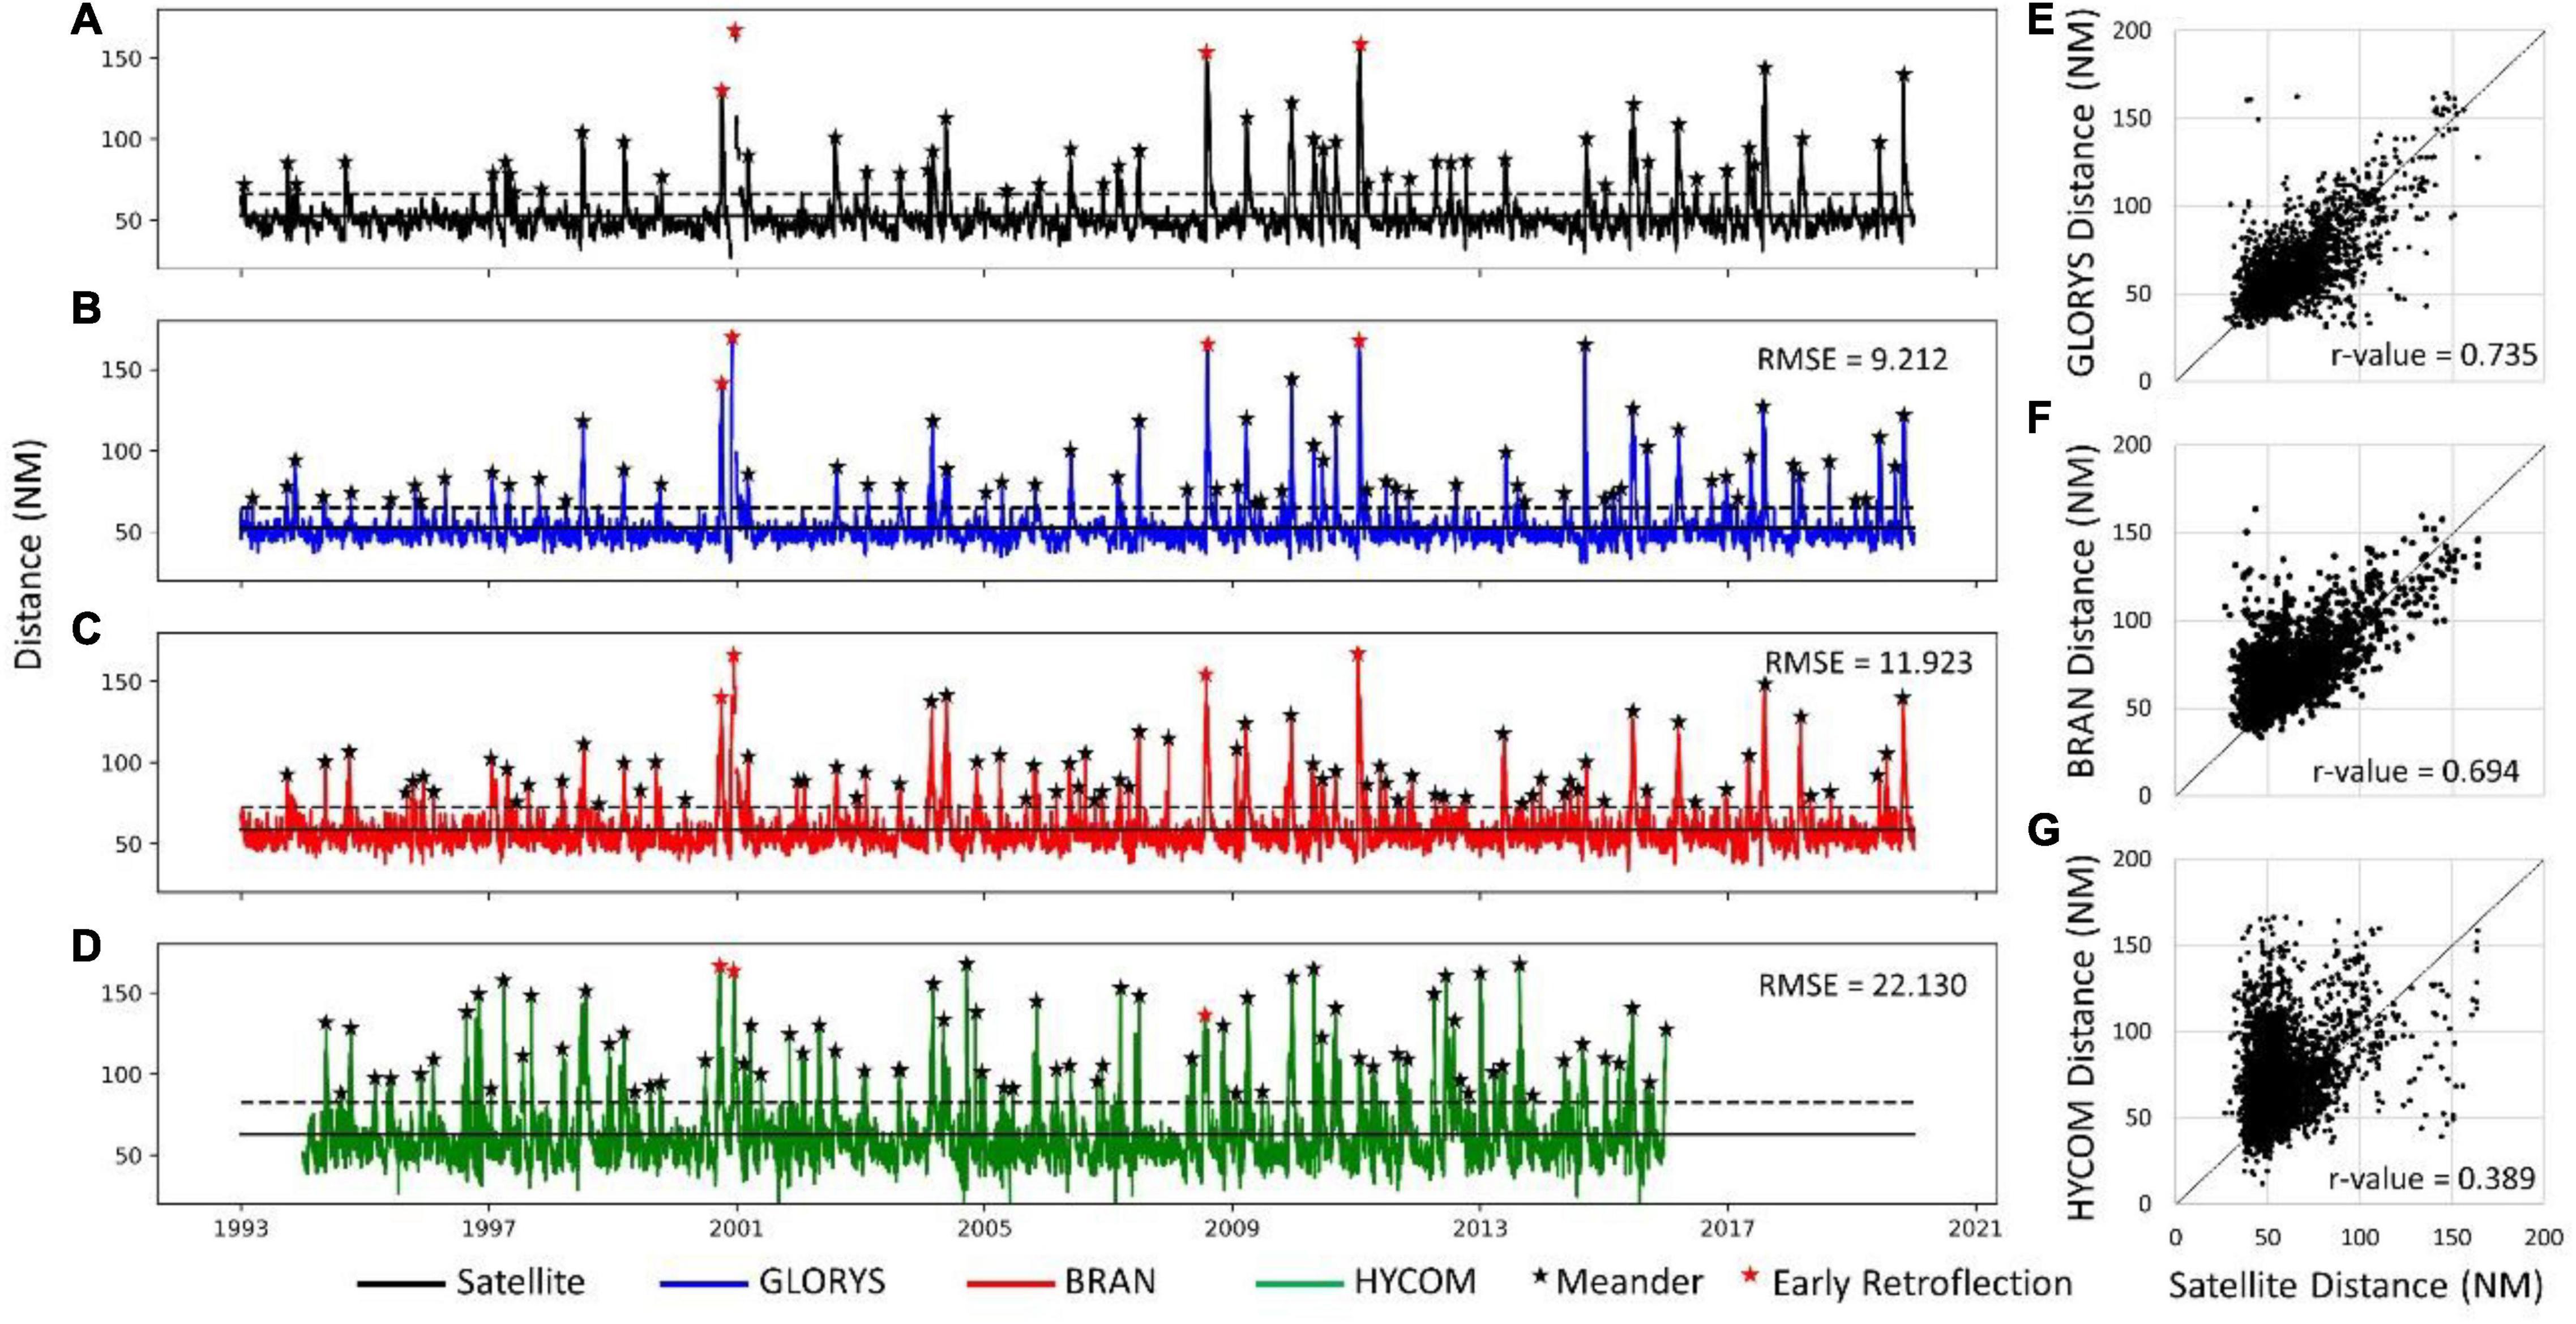
Figure 7. (A–D) Daily distance between the Agulhas Current’s core and Gqeberha used as a proxy to investigate the passage of Agulhas Meanders. The red stars highlight early retroflection events (where the retroflection is east of 22.54°E), and the black stars highlight the meander events. The solid black line indicates the mean distance, and the dashed black line indicates one standard deviation offshore from the mean. (E–G) Scatter plots of model distance versus satellite distance.
Agulhas Meanders
For the evaluation of Agulhas Meanders, the daily location of the Agulhas Current’s core is obtained by applying the Location of the Agulhas Current Core and Edges (LACCE) algorithm (Russo et al., 2021) to all the reanalysis products and the observational CMEMS satellite altimetry dataset, from which the Agulhas Retroflection (AR) and Agulhas meanders can be further investigated. The ability of the reanalysis products to simulate Agulhas Meanders is investigated by calculating the distance along a fixed transect between the Current’s core and Gqeberha, located along South Africa’s east coast (Figure 1). While these meanders generally originate north of 30°S (Malan et al., 2018), by the time they reach the region offshore of Gqeberha they have grown considerably in their offshore extent, making them easier to detect. Any offshore deviations in the Agulhas Current’s path which exceed one standard deviation from the mean distance are associated with meander events (Krug et al., 2014).
Of all the reanalysis products, GLORYS (r-value = 0.735, RMSE = 9.212) and BRAN (r-value = 0.694, RMSE = 11.923) reproduce the observed daily distance of the Agulhas Current’s core relatively well, while HYCOM (r-value = 0.389, RMSE = 22.130) does not (Figure 7). Overall, HYCOM was found to largely overestimate the distance between Gqeberha and the Agulhas Current’s core. The satellite data indicates that the Agulhas Current is on average located 52.74 ± 13.44 NM from Gqeberha. GLORYS was found to closely agree with the observational data with a mean distance of 52.46 ± 12.27 NM, while both BRAN and HYCOM overestimated it with average distances of 58.52 ± 13.35 NM and 63.06 ± 19.50 NM, respectively.
The satellite data suggests that on average, 1.8 meanders occur per year, comparing fairly well with the 1.7 meanders per year calculated by Krug et al. (2014). It is important to note that Krug et al. (2014) calculated this over a shorter period (1992–2012) and it was calculated at a location slightly further upstream. In comparison, the reanalysis products appear to overestimate the number of meanders passing through the Gqeberha transect with GLORYS identifying 2.5 meanders per year, BRAN identifying 2.9 meanders per year and HYCOM identifying 3.4 meanders per year.
The over-estimation of Agulhas Current meanders in the reanalysis products is consistent with their over-estimation of EKE in over the northern Agulhas Current (Figures 4E–H), pointing to inadequately resolved energy dissipation processes in the models. This could have implications further downstream impacting on the Agulhas Retroflection’s position, as well as the associated Indo-Atlantic heat and salt exchange, which could ultimately impact global climate (Braby et al., 2016).
Agulhas Retroflection
The Agulhas Retroflection has been identified as the westernmost co-ordinate pair of the LACCE identified core, as was similarly done by Russo et al. (2021). The mean and standard deviation for the observational retroflection longitude is 17.48°E ± 2.53° (Figure 8E). Of all the reanalysis products, GLORYS [r-value (p-value << 0.05) = 0.857, RMSE = 3.056] and BRAN [r-value (p-value << 0.05) = 0.815, RMSE = 3.152] reproduce the observed daily retroflection longitude best albeit slightly further west. The mean and standard deviation for the retroflection’s longitude for GLORYS is 16.89°E ± 2.64° and for BRAN it is 16.79°E ± 2.68° (Figure 8E). In contrast, HYCOM [r-value (p-value << 0.05) = 0.503, RMSE = 3.718] produces a retroflection that overall is located further east, with a mean longitude and standard deviation of 18.81°E ± 2.97° (Figure 8E). HYCOM, which produces the highest EKE pattern in the retroflection region (Figure 4), has the most variable retroflection location (σ2 = 8.81). It is followed by BRAN (σ2 = 7.21) and then by GLORYS (σ2 = 6.99) which best captures the variability of the satellite-derived retroflection location (σ2 = 6.41). The relationship between the location of the Agulhas Retroflection and Agulhas leakage has been investigated previously by van Sebille et al. (2009) who found that a more westward location of the Retroflection can be linked to increased Agulhas leakage in the form of Indo-Atlantic transport. van Sebille et al. (2009) describe two mechanisms relating a more retroflection location with increase Agulhas leakage. Firstly, a westerly located zonal jet is more unstable than easterly located one (Gill et al., 1974), therefore when the retroflection is located further west, there is a larger possibility for instabilities to grow and Agulhas rings to pinch off. Secondly, a more westerly located retroflection results in rings to be released farther into the Atlantic Ocean where there is a smaller possibility of being reabsorbed into the Agulhas Current (Pichevin et al., 2009). As a result, it is possible that BRAN and GLORYS simulate more Agulhas leakage than is observed, while the opposite would be true for HYCOM (Figure 8). However, further investigation, specifically focussed on Agulhas leakage, would be required to definitively conclude this.
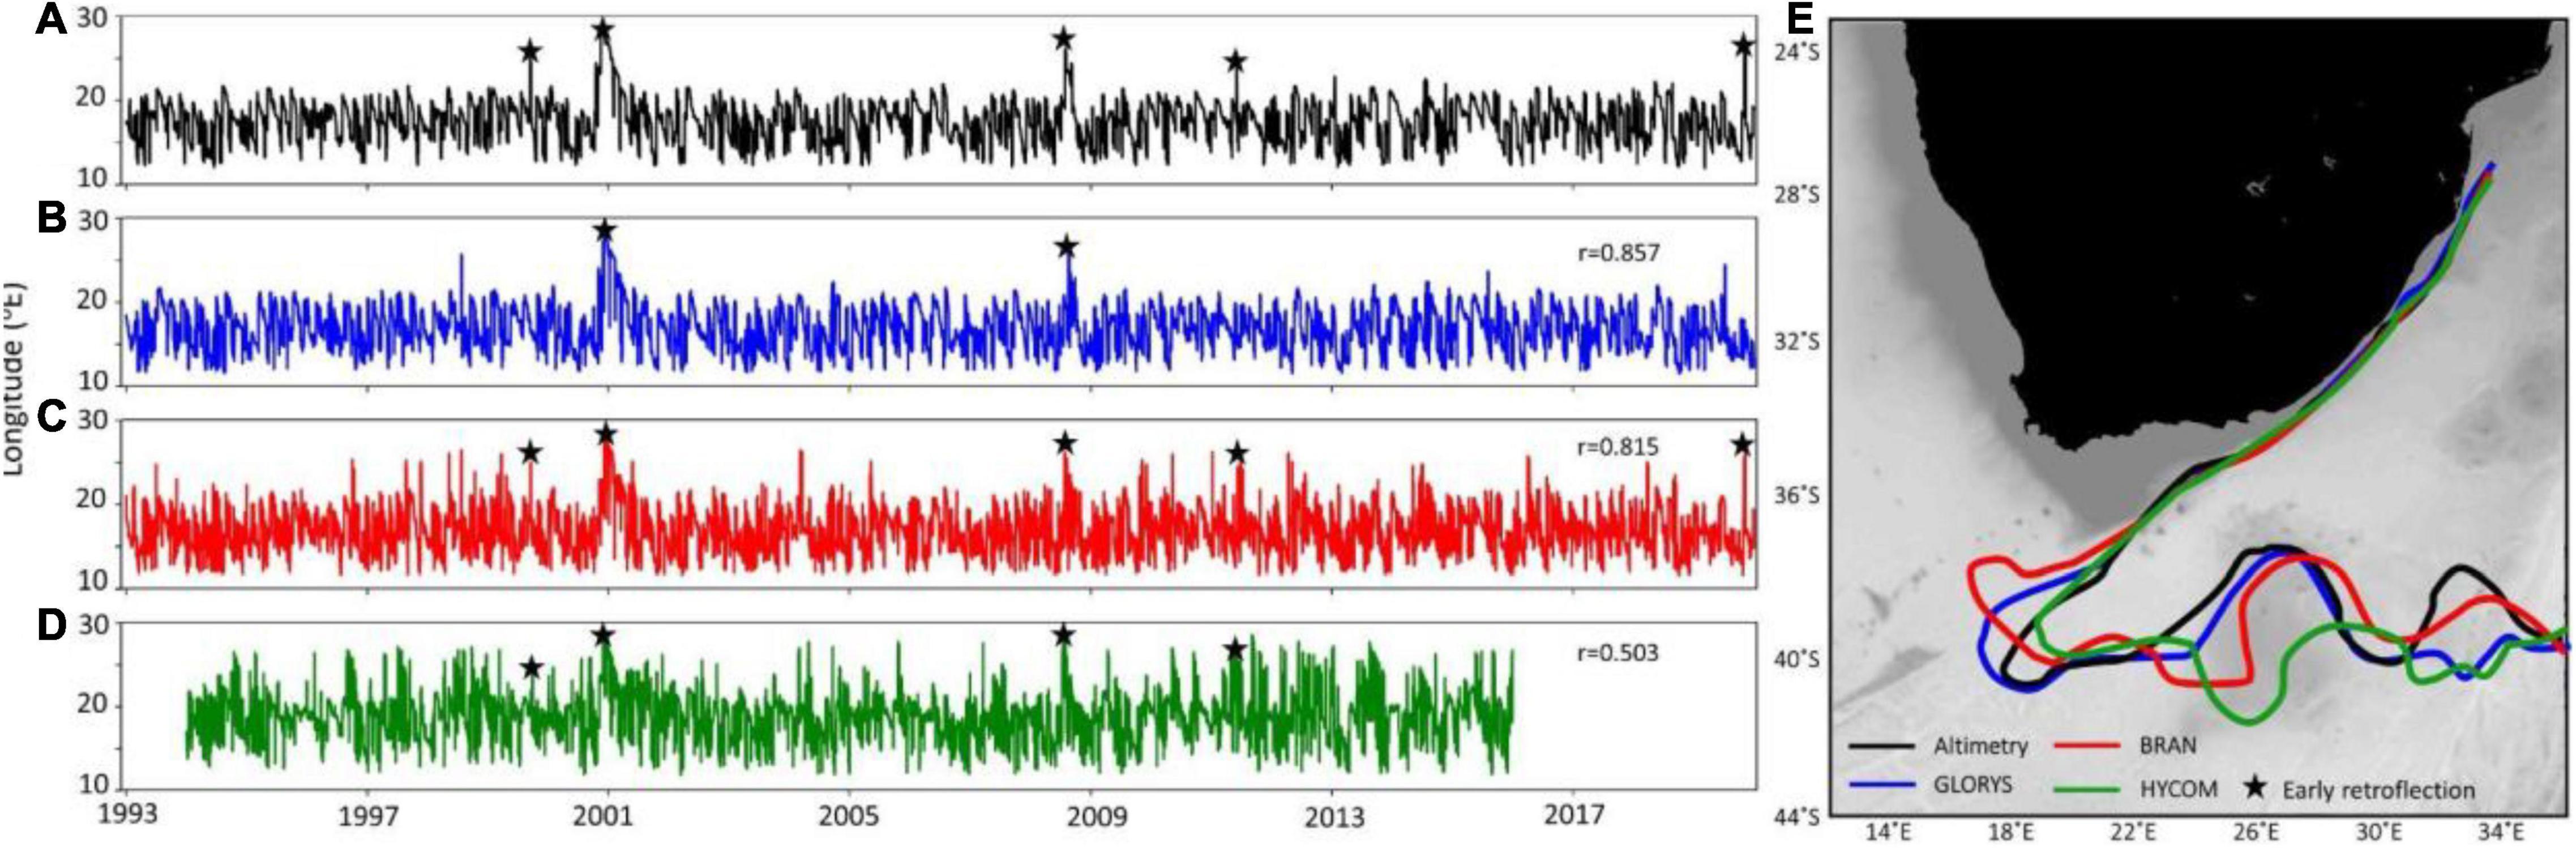
Figure 8. The daily Agulhas Retroflection longitude for (A) the satellite altimetry data, (B) GLORYS, (C) BRAN and (D) HYCOM. (E) Map illustrating the average position of the Agulhas Current for each dataset. The black stars represent the previously documented early retroflection events of 1999, 2000/2001, 2008, 2011, and 2019.
An early retroflection is an event in which the Agulhas Current ‘short circuits’ and retroflects more easterly (east of 22.54°E; Russo et al., 2021) than usual. Previously documented early retroflections have taken place in 1999, 2000/2001, 2008, 2011, and 2019 (Krug et al., 2014; Russo et al., 2021), are demarcated by the black stars in Figure 8. In addition to their influences on Agulhas Leakage, events such as these can also have a detrimental impact on the biological productivity of the Agulhas Bank in which highly productive shelf water is advected offshore and lost to the surrounding ocean, resulting in poor recruitment and consequently poor annual catches (Roberts and Mullon, 2010). While all of the reanalysis products reproduce the most extreme of the early retroflection events (2000/2001 and 2008), HYCOM and BRAN reproduces the 1999 and 2011 events and BRAN reproduces the 2019 early retroflection event (Figures 8A–D). In addition, HYCOM simulates considerably more early retroflection events than are observed.
The Benguela Upwelling System
The Benguela upwelling system (BUS; Figure 1) spans the west coast of southern Africa, from Angola in the north to South Africa in the south. It is one of the world’s major eastern boundary current systems, whose coastal upwelling regime contributes significantly to the global fish-catch. Coastal upwelling within the BUS can be divided into distinct northern and southern regimes, separated by the intense and perennial Lűderitz upwelling cell at ∼27°S (Veitch et al., 2009). A strong seasonal cycle dominates the southern Benguela, with upwelling occurring during austral summer months (October – March), while north of Lűderitz the seasonal cycle is weaker with stronger upwelling during winter months (April – September) (Veitch et al., 2009).
Unlike other systems of its kind, both its northern and southern boundaries are characterized by intense frontal systems due to their proximity to tropical regimes. At the northern boundary, the cold waters of the northern BUS meet the southward flowing tropical Angola Current, manifesting as a robust meridional front known as the Angola-Benguela Frontal Zone (ABFZ). Situated between 15–18°S and intensified during April and December (Koseki et al., 2018), its position is thought to be controlled by the wind stress curl and its intensity by the upwelling favorable wind stress (Colberg and Reason, 2006). The ABFZ is the gateway to interactions with the equatorial and tropical Atlantic that occur in the form of coastally trapped waves that can impact the local weather and marine ecosystems (Illig and Bachèlery, 2019). Extreme southward excursions of the ABFZ and therefore anomalous warming in the northern Benguela occur during Benguela Niňo (Florenchie et al., 2003, 2004; Rouault et al., 2017) events that are episodic and impact fisheries in the northern Benguela as well as rainfall in Namibia and Angola. Many of these events are thought to be related to wind stress relaxation in the western equatorial Atlantic that trigger a Kelvin wave that travels along the equator and southward along the African continent (e.g., Rouault et al., 2017; Imbol Koungue et al., 2019), while other studies have shown that local atmospheric forcing might also play a role (Richter et al., 2010).
An intense shelf-edge jet at the southern boundary is produced by the extreme transition and associated density gradient between the cool upwelling waters on the shelf and the warm waters of the Agulhas leakage further offshore. The jet is present throughout the year (Veitch et al., 2017) but intensifies during the upwelling season in austral summer and is modulated by the highly variable warm offshore waters. Offshore, beyond the shelf-edge in the southern Benguela within the Cape Basin, is a region of intense turbulence that has come to be known as the Cape Cauldron (Boebel et al., 2003a). The turbulence, which includes submesoscale processes, arises from the interaction between the Benguela Current and upwelling front with mesoscale features associated with Agulhas leakage, namely eddies, rings and filaments.
Coupled global circulation models are notoriously bad at accurately resolving sea surface temperatures in eastern boundary upwelling systems, with warm biases of 2°C being common, but are much greater in the Peruvian and Benguela systems (Richter, 2015; Small et al., 2015; Koseki et al., 2018). These biases are thought to be related to several factors including poorly resolved coastal winds, too coarse model resolution, poorly resolved cloud dynamics and the sharp thermocline associated with eastern boundaries (Richter, 2015). Indeed, Section “Surface Characteristics” shows that all reanalysis products evaluated are characterized by persistent warm biases within the Benguela upwelling regime that range from less than 0.5°C on average for BRAN to more than 1.5°C for GLORYS and HYCOM. In this section, we focus more explicitly on the extent to which these products capture the turbulence in the Cape Basin, as well as the intensity and variability of the frontal boundaries of the BUS.
Cape Basin
While each of the models fairly accurately simulates the higher surface turbulence within the Cape Basin than in other parts of the BUS (Figure 4), all overestimate the spatial extent of these higher EKEs that are associated with Agulhas leakage. Using current data from mooring M10 (34.51°S, 14.98°E; within the Cape Basin) of the SAMBA array (Figures 1, 9), we interrogate the success of each model at resolving the mean flow and variability in the upper 450 m of the water column as representative of how well the vertical structure of currents in the Cape Cauldron is simulated. Data from the M10 mooring spans 20-09-2014 to 10-04-2017 covering only a short period of the HYCOM dataset. We will therefore limit our analysis here to the GLORYS and BRAN model outputs that cover the whole period. Vertical velocity profiles from GLORYS and BRAN were co-located in time and space to coincide with the respective in situ data measurements at M10.
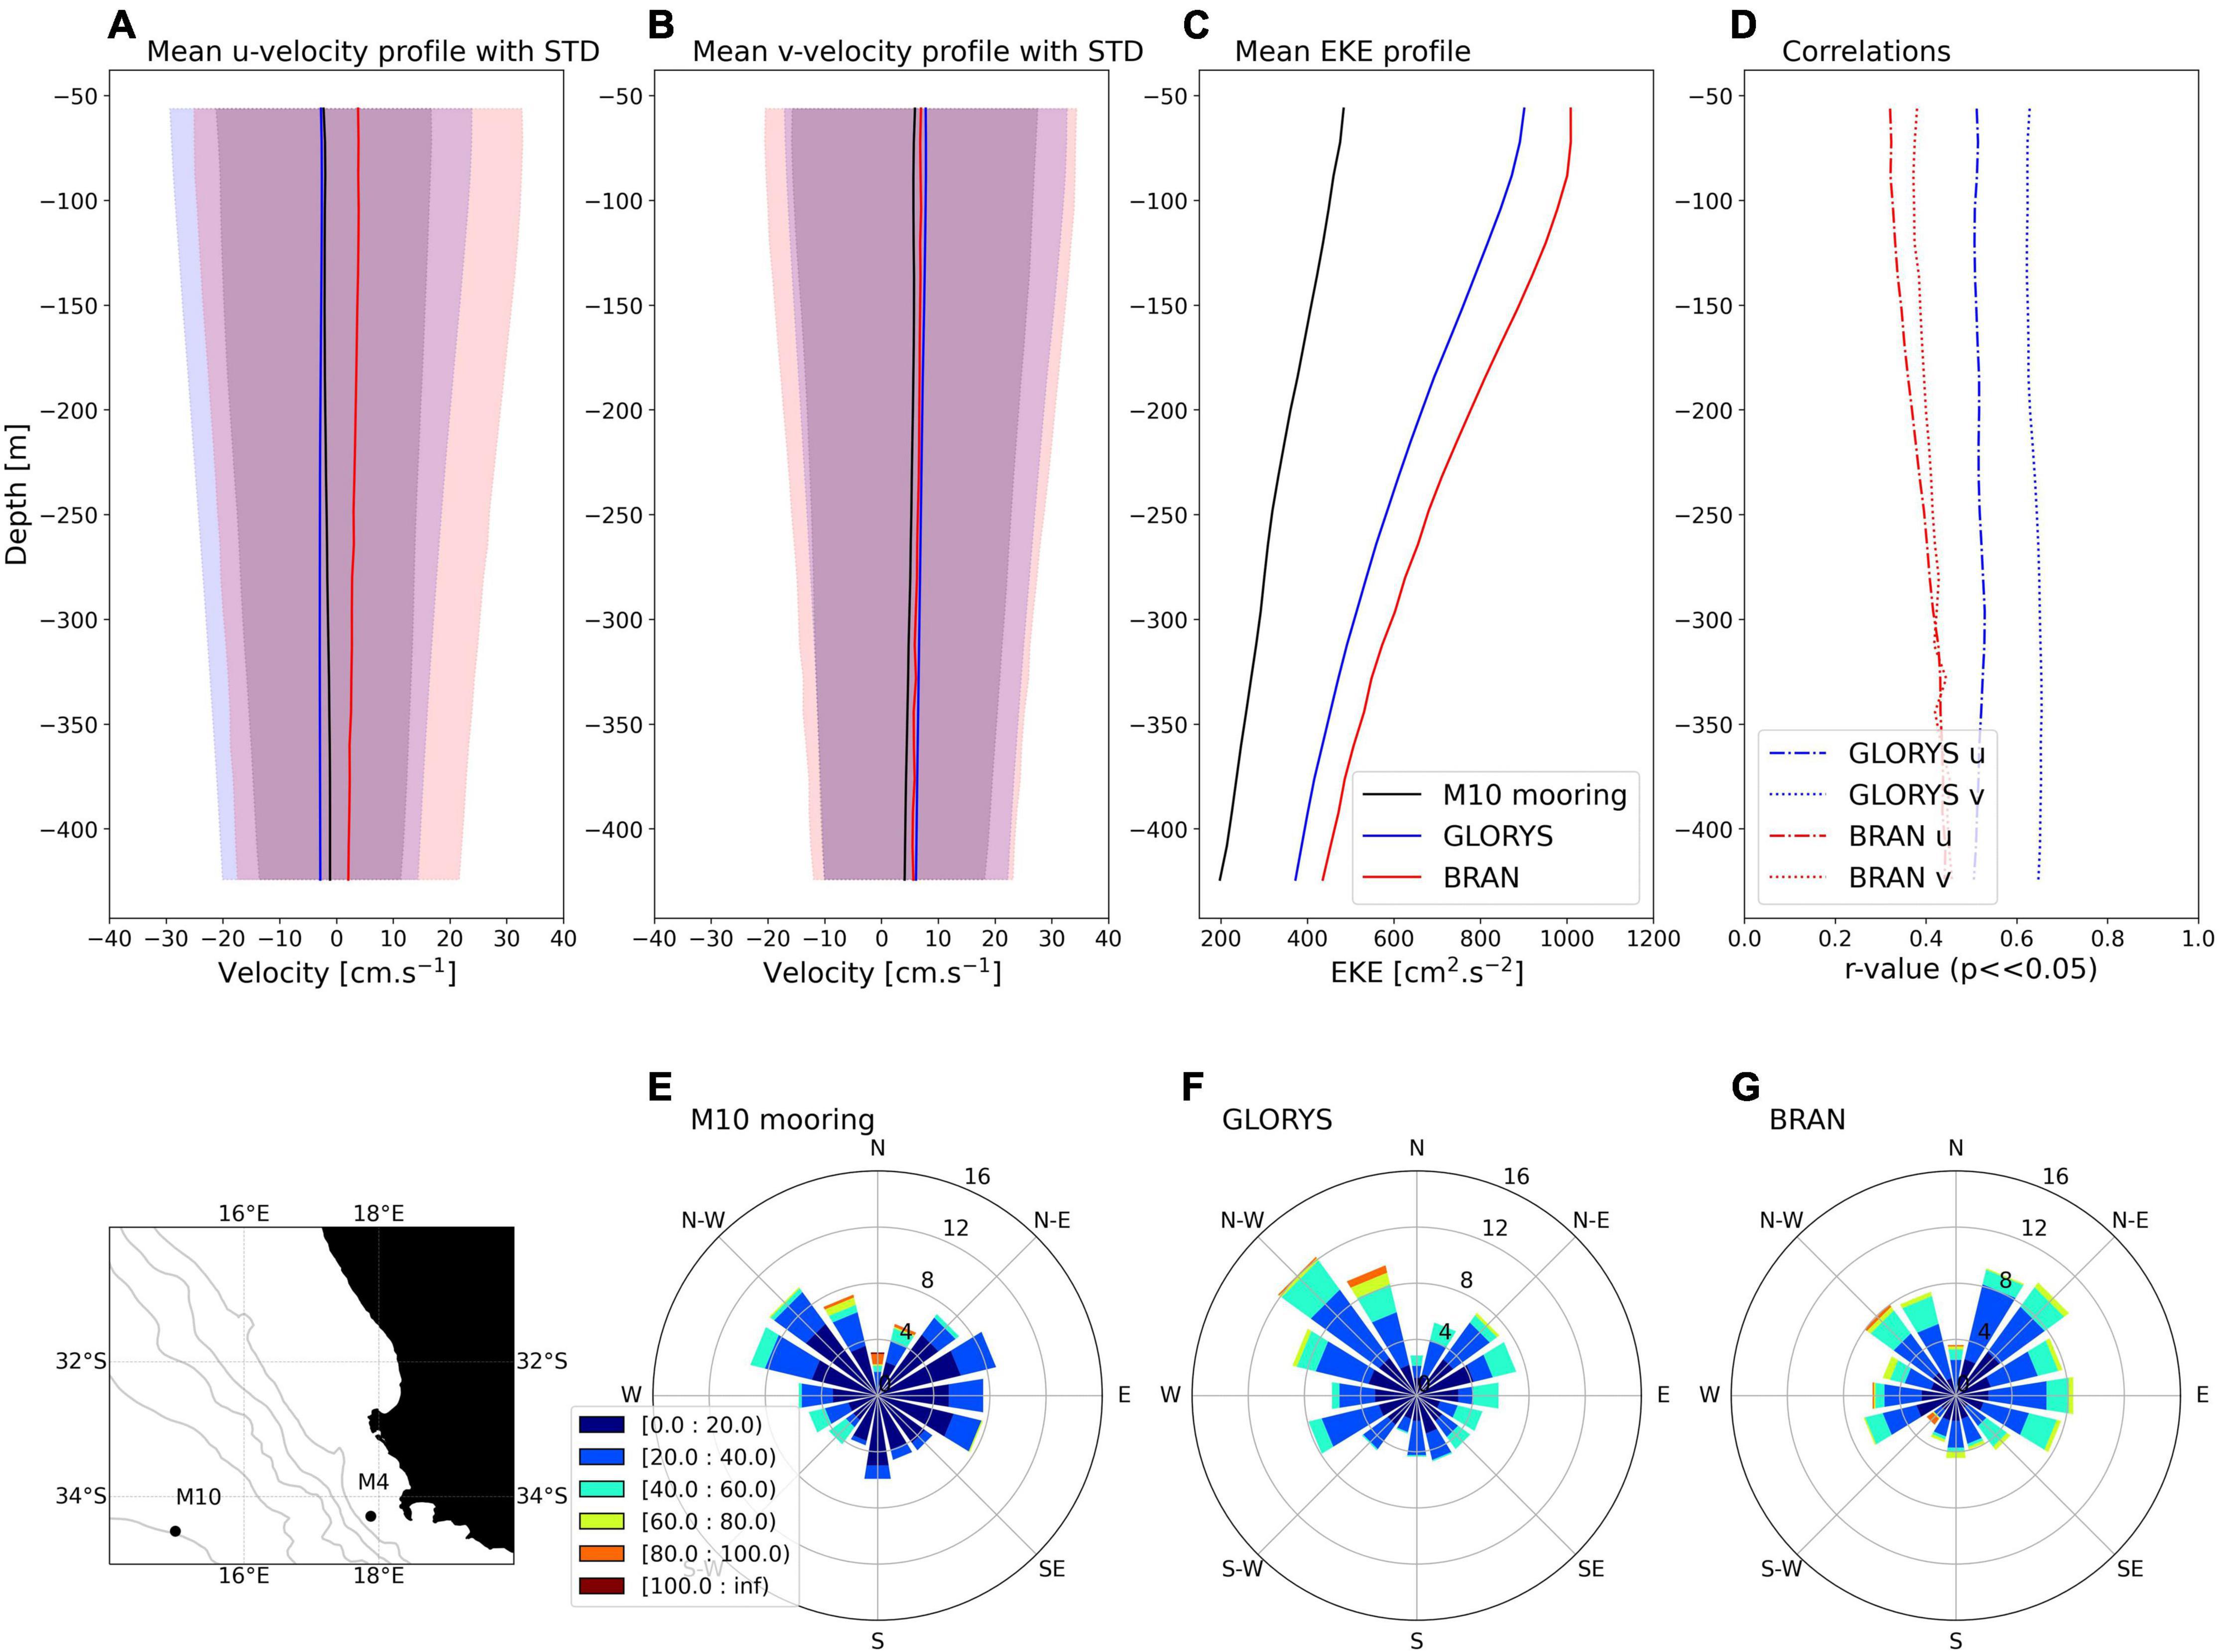
Figure 9. Mooring M10 profiles for the mean (A) u- and (B) v-velocity components. (C) EKE profiles. (D) Velocity correlations and (E–G) current roses based on velocities (in cm s–1) in the upper 400 m of the water column.
Relatively constant mean meridional and zonal flows characterize the upper ∼50–400 m of the water column (Figures 9A,B, respectively). The in situ data reveals that north-westward currents dominate somewhat, but with significant variability (Figure 9E) that is quantified in the values of EKE, that are much higher than expected for the oceanic regime of an eastern boundary current system (e.g., Plate 1 in Capet et al., 2008). Despite the fact that the mean current remains relatively constant with depth, turbulence (EKE) decreases with depth, implying that surface-enhanced mesoscale features are responsible for the larger deviations from the surface mean flow.
Given that the currents are relatively constant throughout the water column, as suggested in the mean profiles, but also from Hovmoller plots of daily zonal and meridional currents (not shown), an evaluation of the modeled depth averaged current regimes is appropriate in this region (Figures 9E–G). While GLORYS produces the dominant north-westward current, it displays much less directional variability and also produces north-eastward currents much more frequently than is observed and that are much faster than observed. Dominant currents in the BRAN model are north-eastward, with eastward and southward currents being quite common and fast, compared to the less frequently observed eastward currents in observations. BRAN does reproduce significant north-westward currents, but are secondary to its dominant eastward regime, that is consistent with the mean positive zonal velocities for BRAN (Figure 9A). While the observations suggest that current directions are very variable at this location (i.e., no particular direction dominates excessively: Figure 9E), currents directed close to northward tend to be much stronger. This pattern is likely related to submesoscale variability that is not captured sufficiently in the global models. The larger EKE reproduced in both the BRAN and GLORYS models (Figure 9C) reflects the large fluctuations between the dominant current regimes and is consistent with the suggestion made earlier that the models overestimate Agulhas leakage and associated mesoscale features.
Despite the extreme turbulence within this region, the daily-averaged u- and v- velocity components correlate significantly with observations, albeit with quite small r-values for BRAN (∼0.35 for u-velocity and ∼0.43 for v-velocity at the surface, increasing slightly and converging with depth) and higher values for GLORYS that are more or less consistent through the water column (∼0.5 for u-velocity and ∼0.6 for v-velocity). The fluctuations of the v-component are generally better reproduced in both BRAN and GLORYS, particularly so in GLORYS (Figure 9D), suggesting that zonal current fluctuations are the bigger challenge in this region for global models.
Southern Benguela Shelf
In the southern Benguela, the seasonal upwelling is characterized by narrow bands of cold water mostly confined to the shelf between Cape Agulhas and Cape Columbine. These particular features are often under-represented on L4 SST products and reanalysis datasets (Dufois et al., 2012; Carr et al., 2021), as illustrated in Figure 2. Since the high resolution satellite SST data are not assimilated, in its native resolution, into the reanalyses, it serves as an independent verification for the shelf-scale surface dynamics. The spatially averaged SST bias (reanalysis – high resolution SST) for the Southern Benguela shelf (SBS), the Cape Columbine upwelling cell, the Cape Peninsula upwelling cell (CP), the Overberg upwelling region (OV) and the Western Agulhas Bank (WAB) are represented in Figure 10. Each reanalysis correctly reproduces the seasonal cycle, with almost zero bias throughout the year over the WAB, a region of low spatio-temporal variability subject mostly to the seasonal solar insolation cycle and winter mixing in the presence of strong westerly winds. A divergence in the seasonal representivity of the reanalyses becomes clear when inspecting the bias over the SBS. Here, BRAN performs exceptionally well, representing the seasonal cycle with near zero bias, whereas it is clear that both HYCOM and GLORYS do not reproduce the expected seasonal upwelling signal. A closer inspection of the upwelling cells at OB and CP indicates a slight warm bias for BRAN in summer but very good performance at Cape Columbine. While all the reanalyses perform best during winter at the upwelling cell locations, a clear warm bias persists in summer for HYCOM and GLORYS.
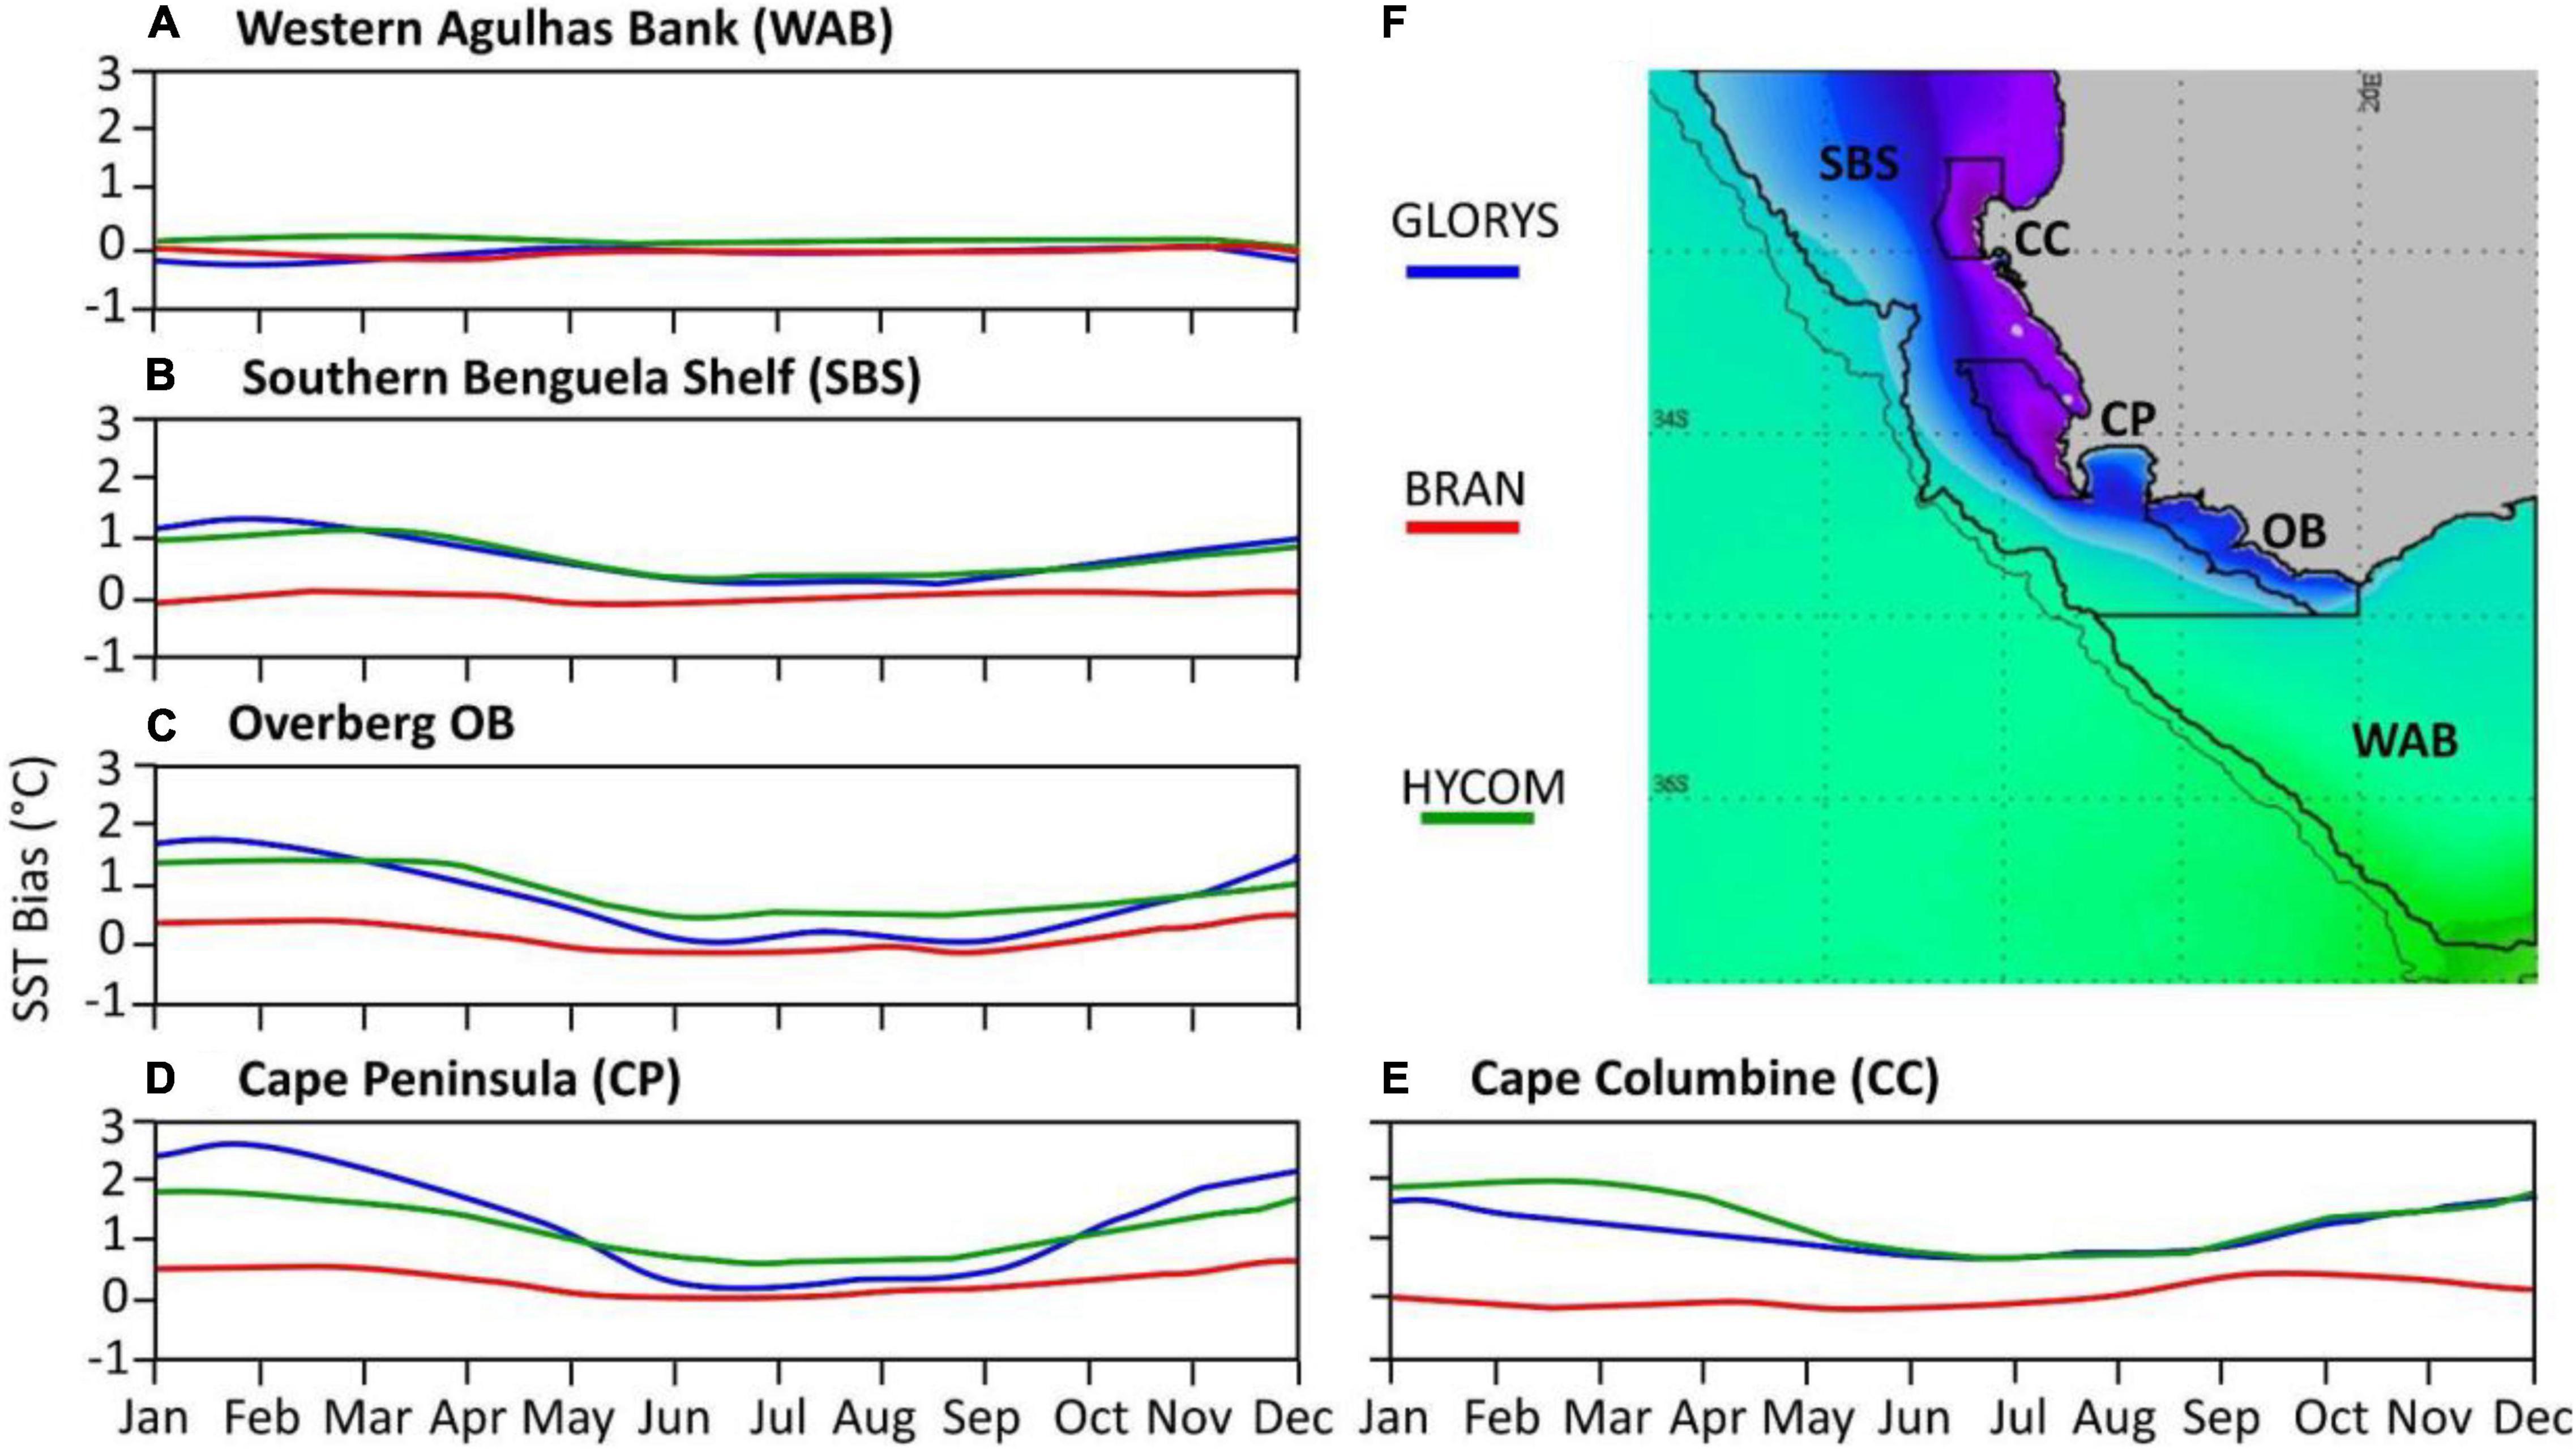
Figure 10. (A–E) Spatially averaged SST bias (reanalysis – high resolution SST) monthly climatologies. (F) Map of high resolution 1 km SST outlining upwelling regions and cells analyzed. The Southern Benguela shelf (SBS), the Cape Columbine upwelling cell, the Cape Peninsula upwelling cell (CP), the Overberg upwelling region (OV) and the Western Agulhas Bank (WAB).
The results from the comparison of the reanalysis products with nearshore UTRs around the coast at varying depths (Supplementary Figure 1), illustrate that the largest temperature anomalies for all products exist within the west coast upwelling regime, where all reanalyses overestimate temperatures, particularly during the upwelling season. While GLORYS tends to perform better than HYCOM and BRAN for the coastal upwelling center on the central southern Benguela shelf (off Doringbaai, DB in Figure 1) in terms of mean upwelling season temperatures, it does worst in terms of capturing the variability of the temperature, producing the lowest correlations on the west coast. All reanalyses perform better in the Agulhas Current system (from Mossel Bay eastward excluding Aliwal Shoal; Supplementary Figure 1), suggesting that all reanalyses have deficiencies in capturing the key dynamics associated with the BUS.
Compared with the OSTIA SST data, both GLORYS and HYCOM overestimate SSTs on the southern Benguela shelf by at least 1.5°C during the upwelling season, whereas BRAN reproduces SST in this region within about 0.5°C (Figure 2). Given the inherent inaccuracies of satellite-derived SSTs in intensely frontal coastal upwelling regions (Carr et al., 2021) and the fact that satellite SSTs are assimilated into these reanalysis products, we assess here the model derived temperatures relative to observations from the SHBML (Figure 1). The temperature biases in Figure 11 confirm that GLORYS and HYCOM both have a significant warm bias on the shelf that persists throughout the water column and is more intense during the summer upwelling season and in the vicinity of the coastal upwelling cell. The warm bias is much weaker in BRAN, stronger during winter months, does not persist throughout the water column and is not centered on the coastal upwelling cell. All models have a slight cool bias beyond the shelf-edge. The extent to which these differences in performance are related to the simulation of an accurate mixed layer depth (MLD) and water column structure are investigated here using climatological temperature data from the SHBML (Figure 11). The MLD is calculated using the method of de Boyer Montégut et al. (2004) which identifies it as the depth where a 0.2°C temperature change occurs relative to a reference depth of 10 m. Given the biases in model SSTs, one would expect errors in the simulated jet currents on the southern Benguela shelf that are primarily driven by density fronts that arise from cross-shelf temperature gradients. We investigate these both indirectly, using the SHBML temperature sections to infer alongshore currents, and directly using current data from mooring M4 (34.29°S, 17.88°E; on the shelf) of the SAMBA array (Figure 12).
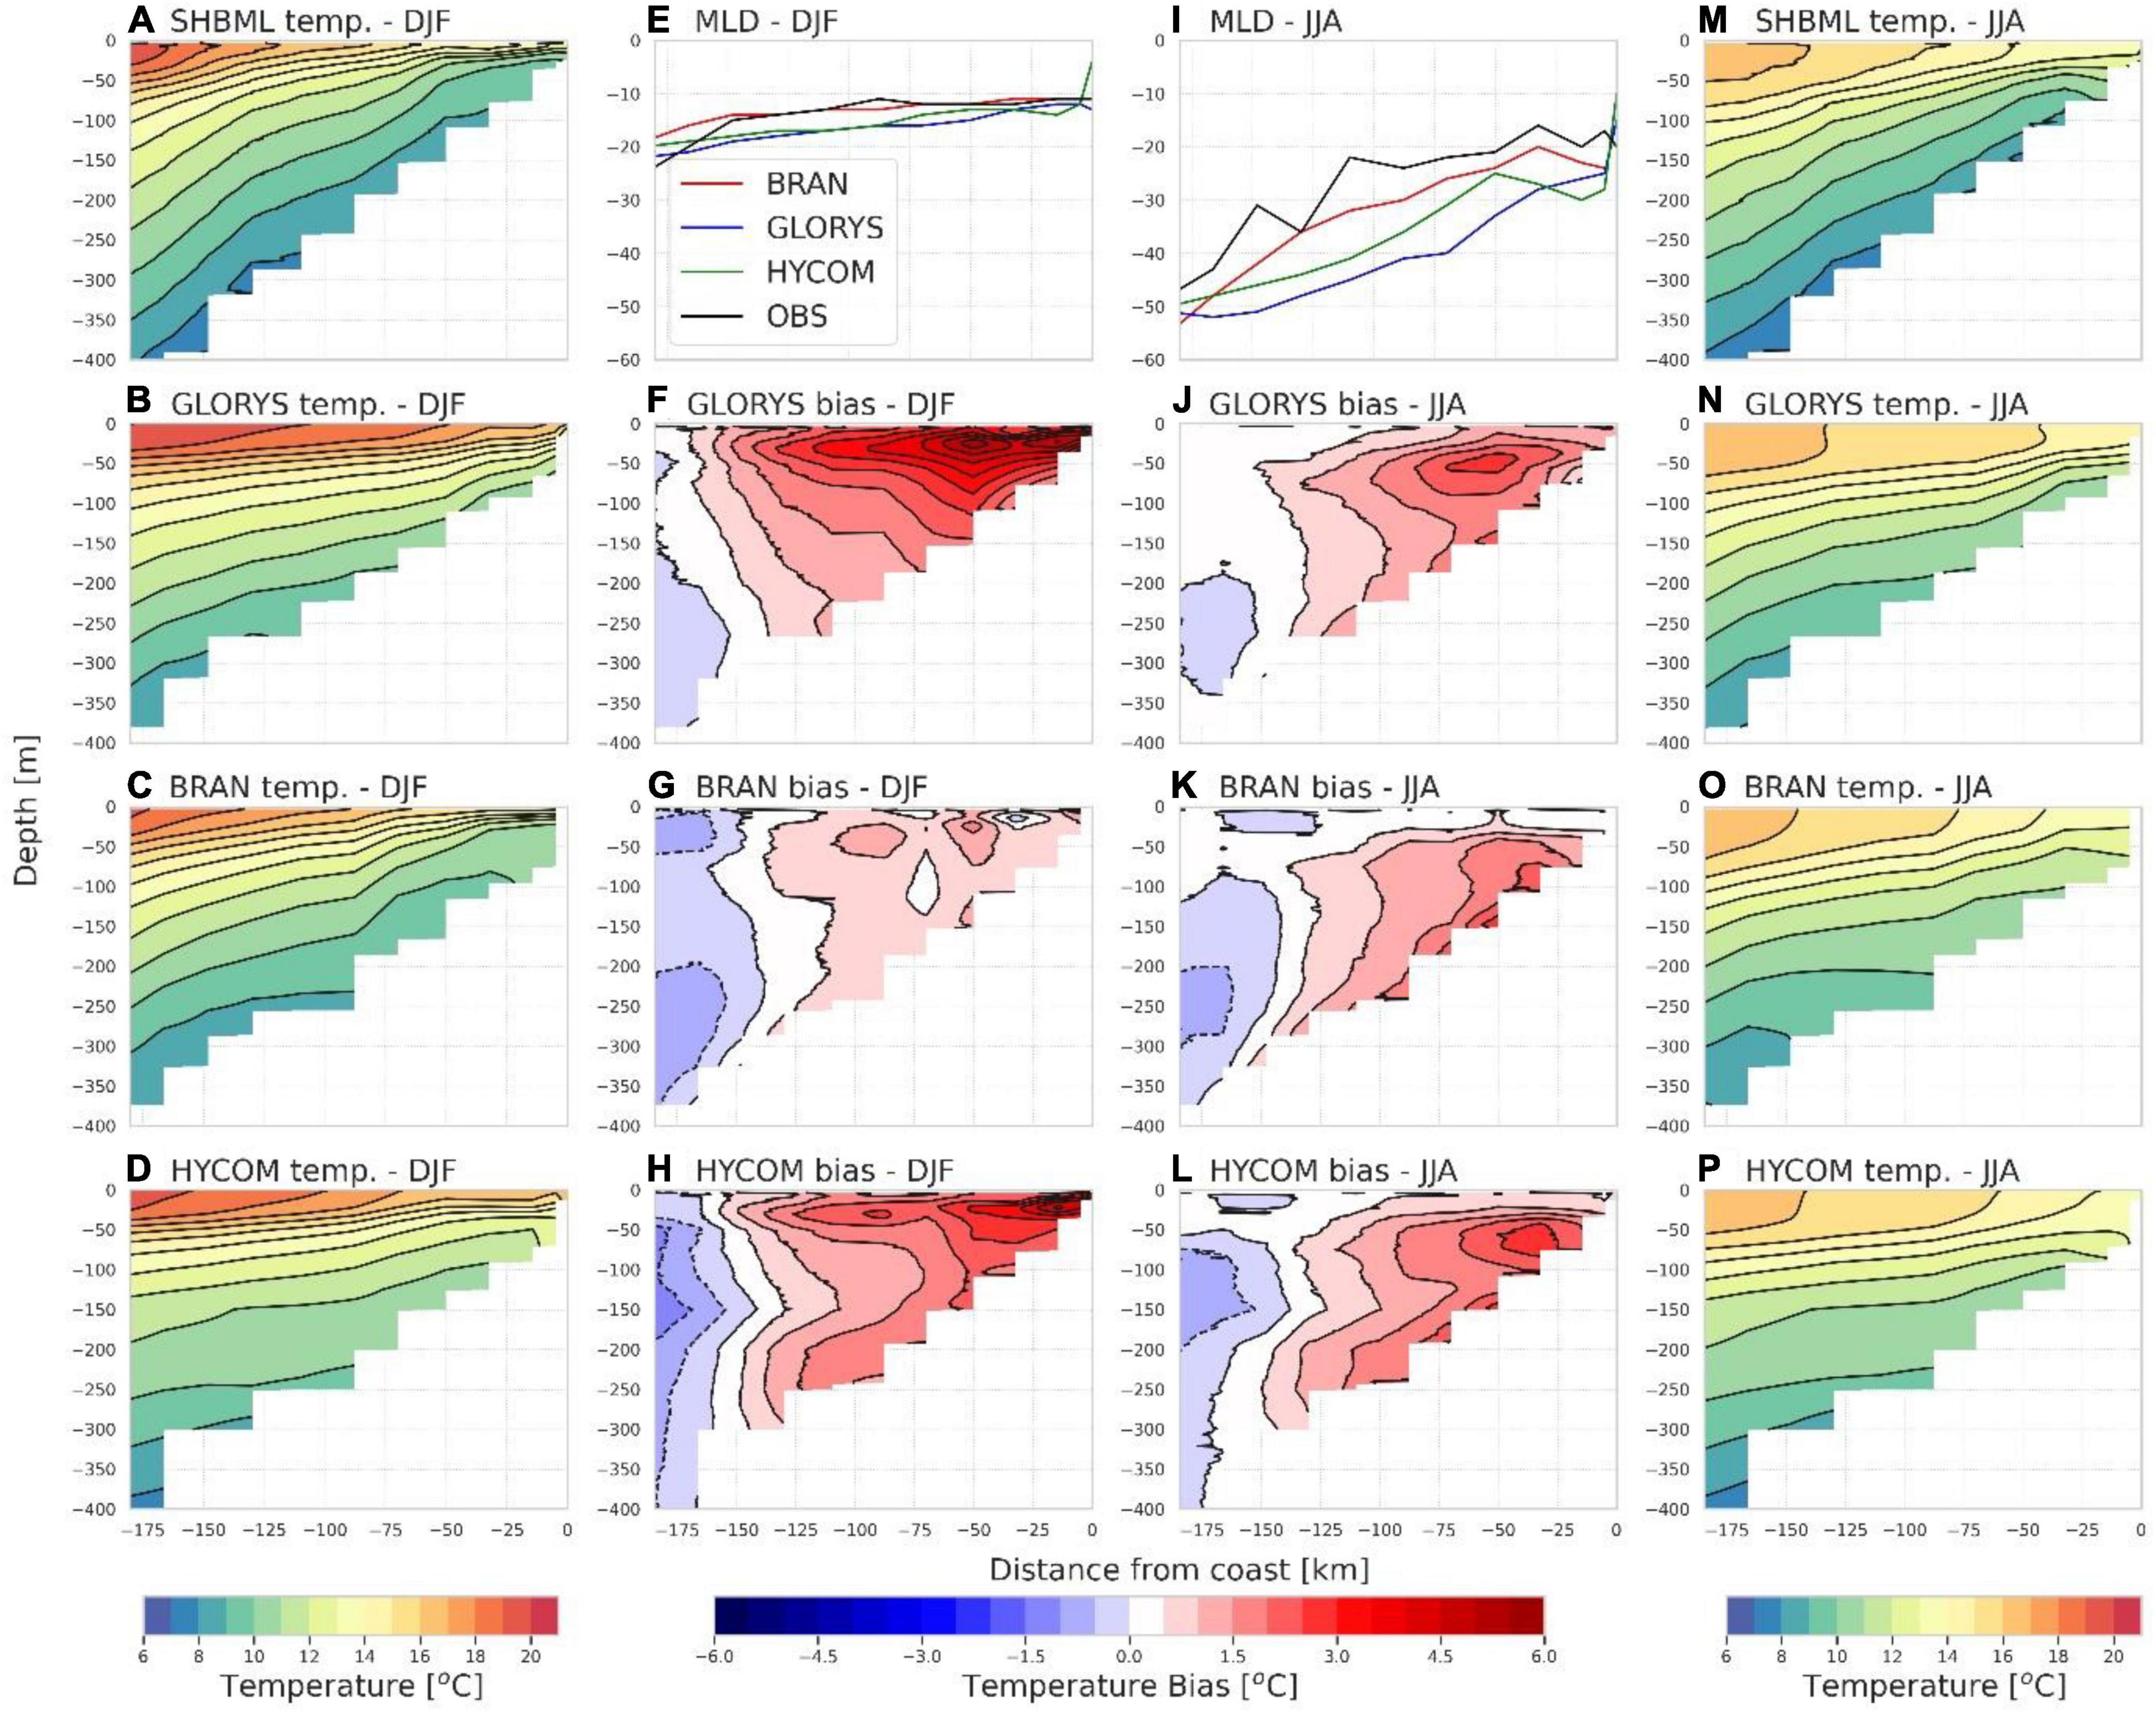
Figure 11. Seasonal mixed layer depths for the in situ (black), GLORYS (blue), BRAN (red), and HYCOM (green) datasets along the SHBML (E,I), temperature sections (A–D,M–P) and temperature biases: model minus in situ (F–H,J–L) along the SHBML for the in situ data and the reanalysis products.
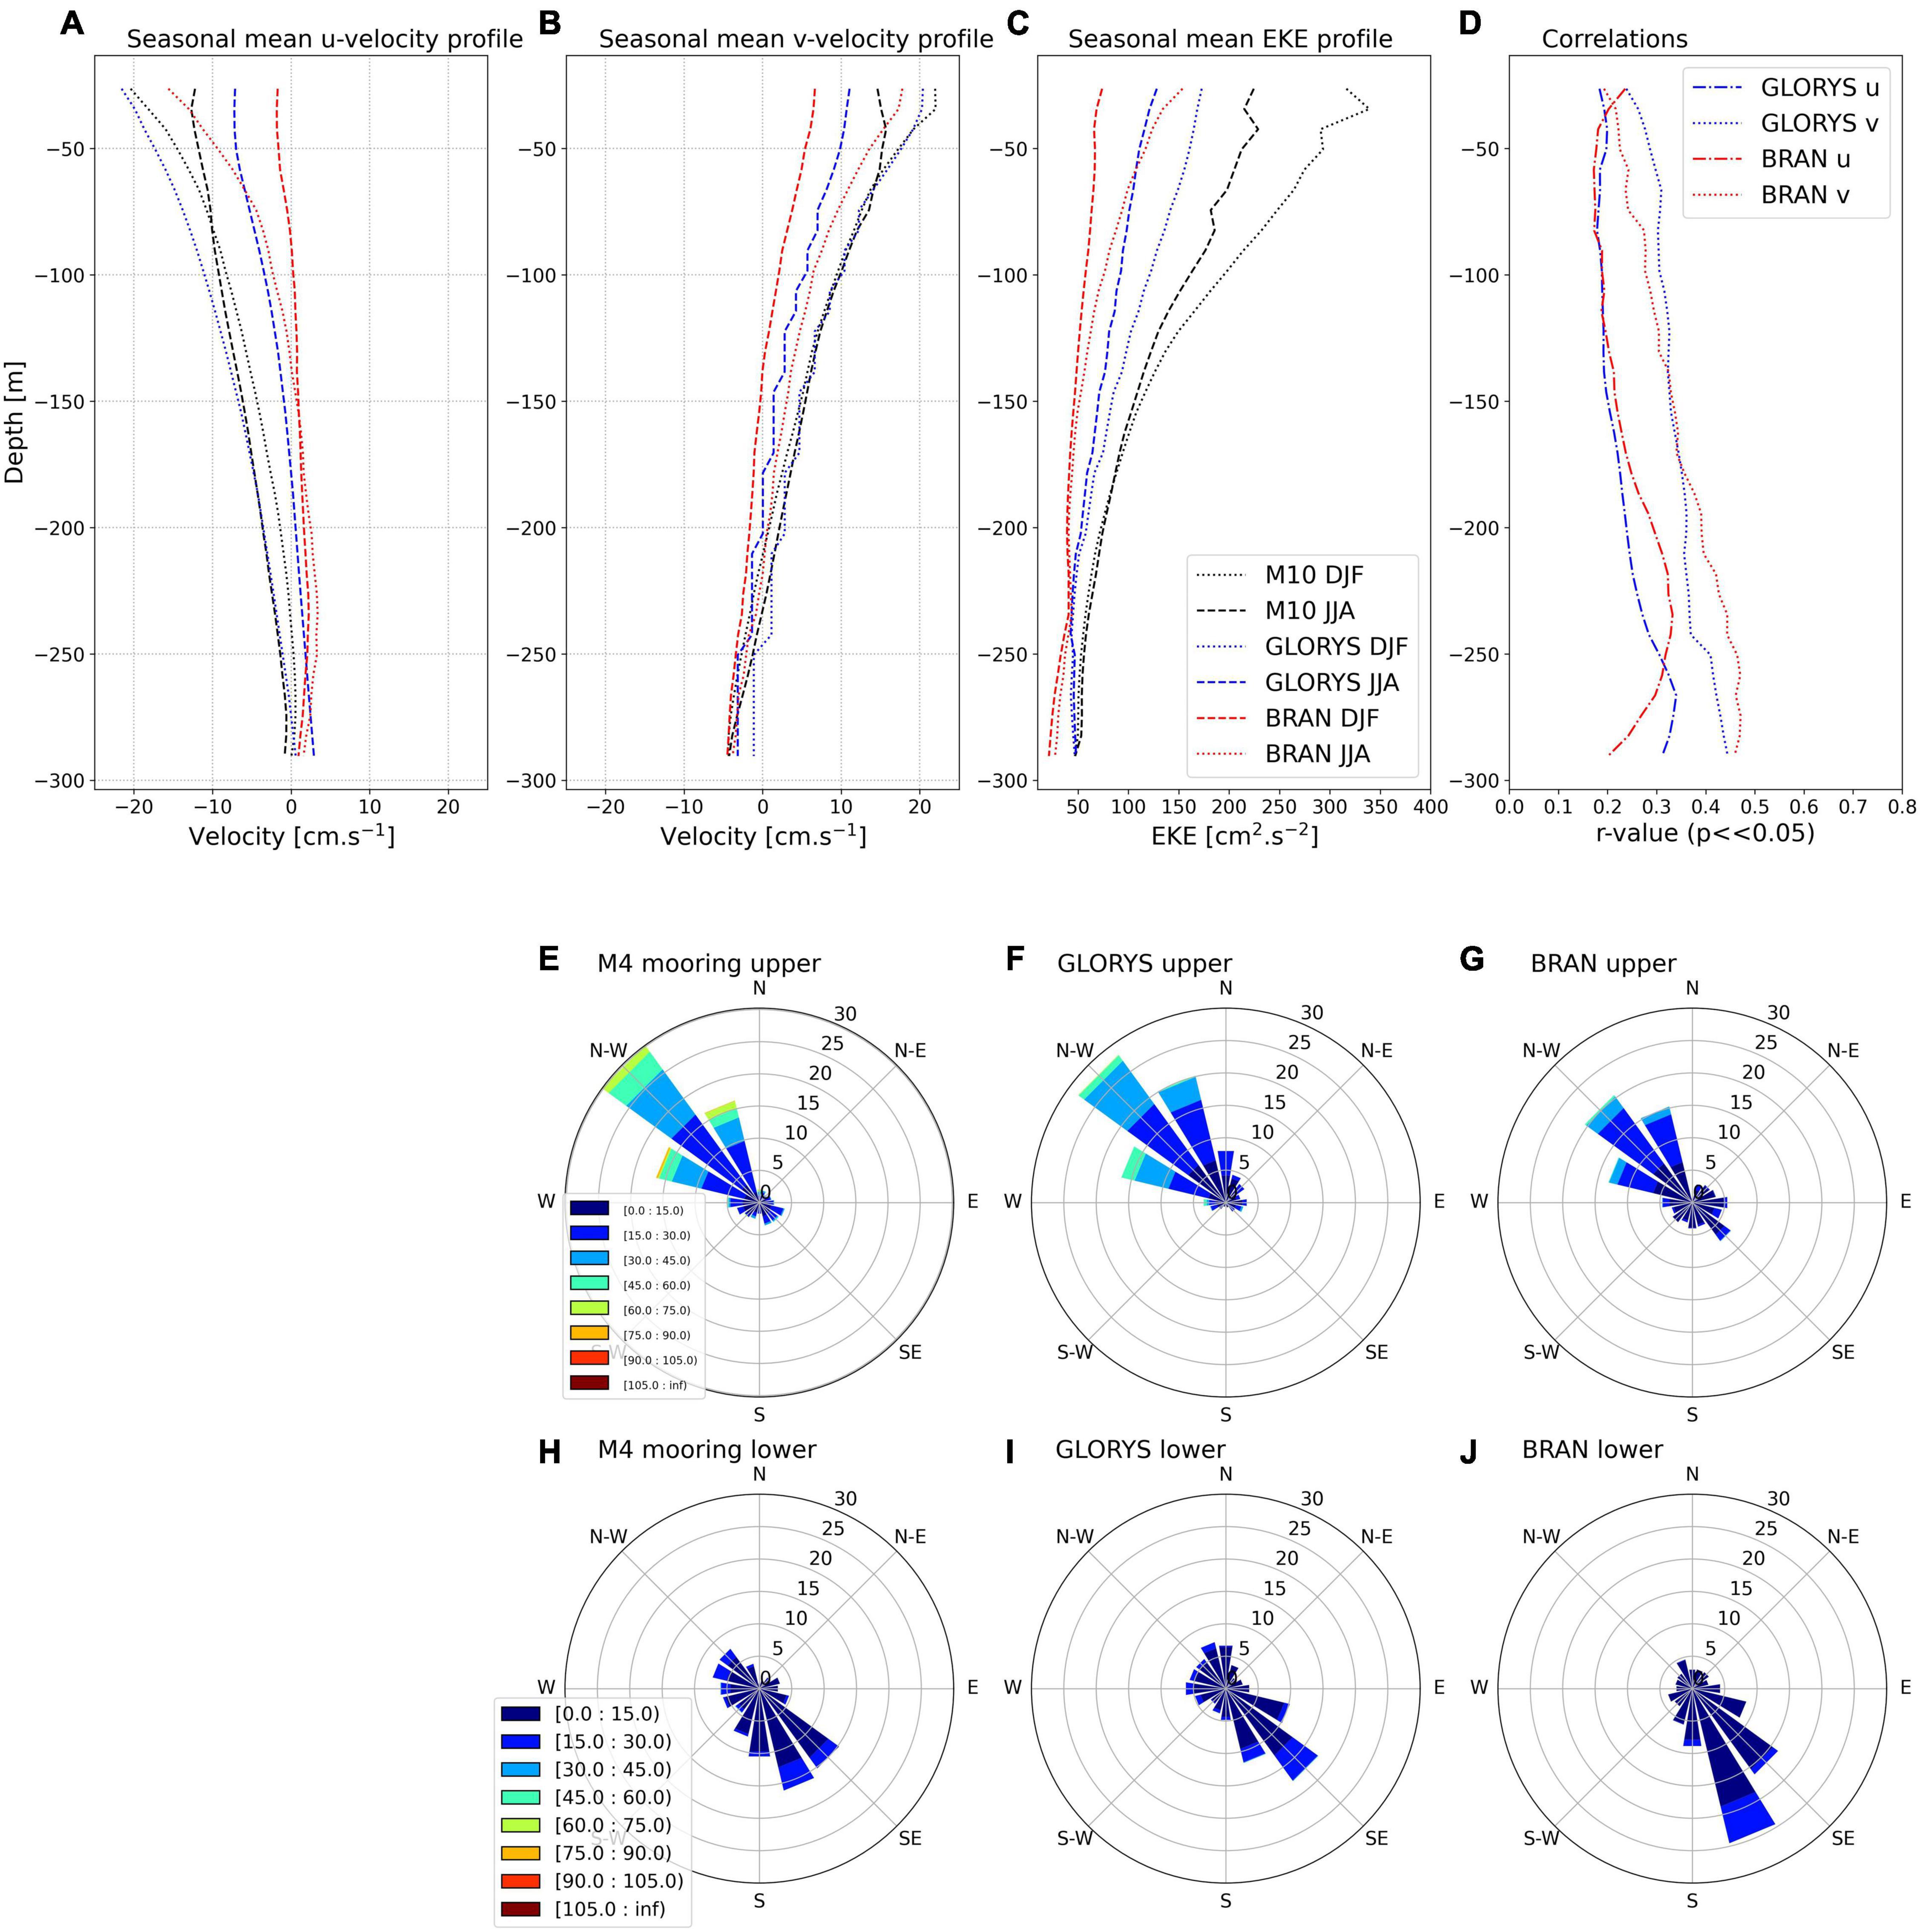
Figure 12. Mooring M4 (A,B) seasonal mean u- and v-velocity component profiles. (C) Seasonal EKE profiles. (D) Correlations. (E–G) Current roses (currents in cm/s) for the upper 100 m of the water column and (H–J) current roses for the lower 50 m of the water column.
The mixed layer depth across the SHBML is shallower during summer (December, January, and February) than during winter (June, July, and August) and, typical of eastern boundary systems, the mixed layer depth decreases toward the coast (Figures 11E,I). Offshore of the ∼300 m isobath, the isotherms tilt steeply upward toward the coast, indicative of the equatorward shelf-edge jet. This feature is present during both summer and winter months but is weaker during the latter season. Closer to the coast, isotherms tilt downward toward the coast; indicative of a poleward flow that is clearly present during winter (Figure 11M) but does not appear as well-defined in these observations during summer months. However, a net poleward flow manifests when averaging low frequency poleward motions with periodicities of ∼3 days on the inner shelf (Nelson, 1989). Given that the SHBML climatologies used here are based on cruise data from a number of years, it is likely that the net effect of the periodic poleward flows is not fully captured. The importance of the nearshore poleward flow and the equatorward jet lie in their contribution to retention processes within St Helena Bay (Penven et al., 2000) that are key to high productivity in this region.
Though BRAN produces the most accurate MLD during both summer and winter months inshore of the 300 m isobath, it converges best with observations during summer (Figure 11). The fact that it outperforms the other global models in the representation of the MLD is likely a contributing factor to its good representation of coastal SSTs: a too deep MLD, as in HYCOM and GLORYS, consistent with their persistent warm biases throughout the water column on the shelf, would lead to too warm water being upwelled. Other than HYCOM, each model reproduces the equatorward shelf-edge jet as suggested by the upward tilting isotherms over the shelf-edge, however, in each case its intensity is underestimated as indicated by less steep isotherms (Figure 11). This is consistent with the warm bias on the shelf and a cool and/or less warm bias further offshore (Figure 2), effectively reducing the negative temperature gradient that drives the jet; a feature that is particularly evident in HYCOM. Both BRAN and HYCOM reproduce the nearshore poleward current (indicated by the downward tilting isotherms inshore of ∼150 m isobath), similarly deep, and weak during winter months and in the case of HYCOM intense, shallow and close to the coast during summer. Though well-defined, the BRAN summer poleward flow is further offshore in water deeper than 100 m. The temperature sections in Figure 11 do not indicate the presence of a mean poleward flow in the GLORYS model.
We evaluate the shelf-edge currents in GLORYS and BRAN in more detail using daily-averaged data obtained from the M4 mooring spanning the period 01-12-2015 to 08-10-2018, which is not covered by the HYCOM data period. Vertical velocity profiles from GLORYS and BRAN were co-located in time and space to coincide with the respective in situ data measurements at M4. The M4 mooring was situated approximately above the 300 m isobath specifically to fully capture the shelf-edge jet, vertical structure, and variability at this location. The profiles of observed u- and v-velocity components (black dashed and dotted lines in Figures 12A,B, respectively) reveal that a distinct shear exists through the water column throughout the year: from more northward and westward at the surface, to southward at depths of greater than 250 m. A seasonal cycle is distinct in the upper 50 m of the water column, with northward flows being stronger during the summer upwelling season. In the upper 100 m of the water column, where the jet is strongest, the EKEs derived from observational data (dotted and dashed black lines in Figure 12C), are of the same order as the offshore EKEs (Figure 9C). Furthermore, EKEs are highest during summer months when the jet is also strongest. This suggests that baroclinic instabilities associated with the jet are the cause of these high EKEs, rather than deeper reaching mesoscale features associated with the Agulhas Retroflection as is the case in the Cape Basin.
Given the distinct current shear, current roses are plotted, from data averaged in the upper 100 m (Figures 12E–G) and lower 50 m (Figures 12H–J) for each dataset, respectively. Both BRAN and GLORYS capture the north-westward dominating current in the upper 100 m, but both underestimate its magnitude, which is consistent with the v-velocity profiles shown in Figure 12B. However, it should be noted that GLORYS performs relatively well during summer (DJF) months. The current roses, based on both observations and models (Figures 12E–G), show that variations of the dominant north-westward current tend to only be a few degrees eastward or westward, which suggests that the instabilities are not associated with eddies, rings or large-scale filaments and is consistent with the idea that the higher EKE over the shelf is linked to baroclinic instabilities of the jet itself. The lower magnitudes of the jet resolved in both models is consistent with the underestimated EKEs, due to reduced baroclinic instabilities. The observations at depths of greater than 250 m reveal a dominant poleward undercurrent (Figure 12H), although currents at this depth fluctuate relatively frequently to a more north-westward bearing. Both GLORYS and BRAN capture the poleward undercurrent however, BRAN does not capture the fluctuation to the northwest that is seen in observations (Figure 12H–J).
In general, the v-velocity component of both models correlates better with observations than the u-velocity component and also performs better during summer months when the shelf-edge jet is more intense with stronger signals. This implies that the representation of the jet itself, with a strong v-component, is better resolved in the models than the instabilities that are generated from its characteristically intense gradients and that dominate the u-velocity signal.
The Angola-Benguela Frontal Zone
The characteristically intense meridional SST gradient of the ABFZ defines the northern boundary of the BUS and the temperature anomaly within it is an indicator of episodic, and often catastrophic Benguela Niňo events. It is also a region that is well known for intense warm biases in global models. In this section, and considering this common warm bias, we compare modeled SSTs with OSTIA SST to inspect the degree to which each of the models capture the position and intensity of the ABFZ, as well as anomalously warm events within it, as a proxy for Benguela Niňos.
Each of the models capture the seasonal warming during austral summer months and cooling during winter (Figures 13A–D). However, the seasonal cycle is offset in GLORYS by a month relative to satellite observations, with coldest SSTs during July, rather than in August (Figures 13A,B), and also appears to last for longer. This manifests as alternating cool and warm biases of up to ±3°C throughout the region (Figure 13B) and a frontal gradient that is less intense for a longer period (Figure 13F). Biases do not exceed 1°C in BRAN (Figure 13C) and are always positive spanning the ABFZ region, suggesting little impact on the gradient that defines the front (Figure 13G). HYCOM’s seasonal SST biases (Figure 13D) are characterized by warmer waters, exceeding 1°C during winter in the northern Benguela, at the southern edge of the ABFZ, and in a band northward of this the biases are much smaller for much of the year (<0.5°C). This suggests the reduced intensity of the front in HYCOM in comparison to the observations (Figure 13E and H).
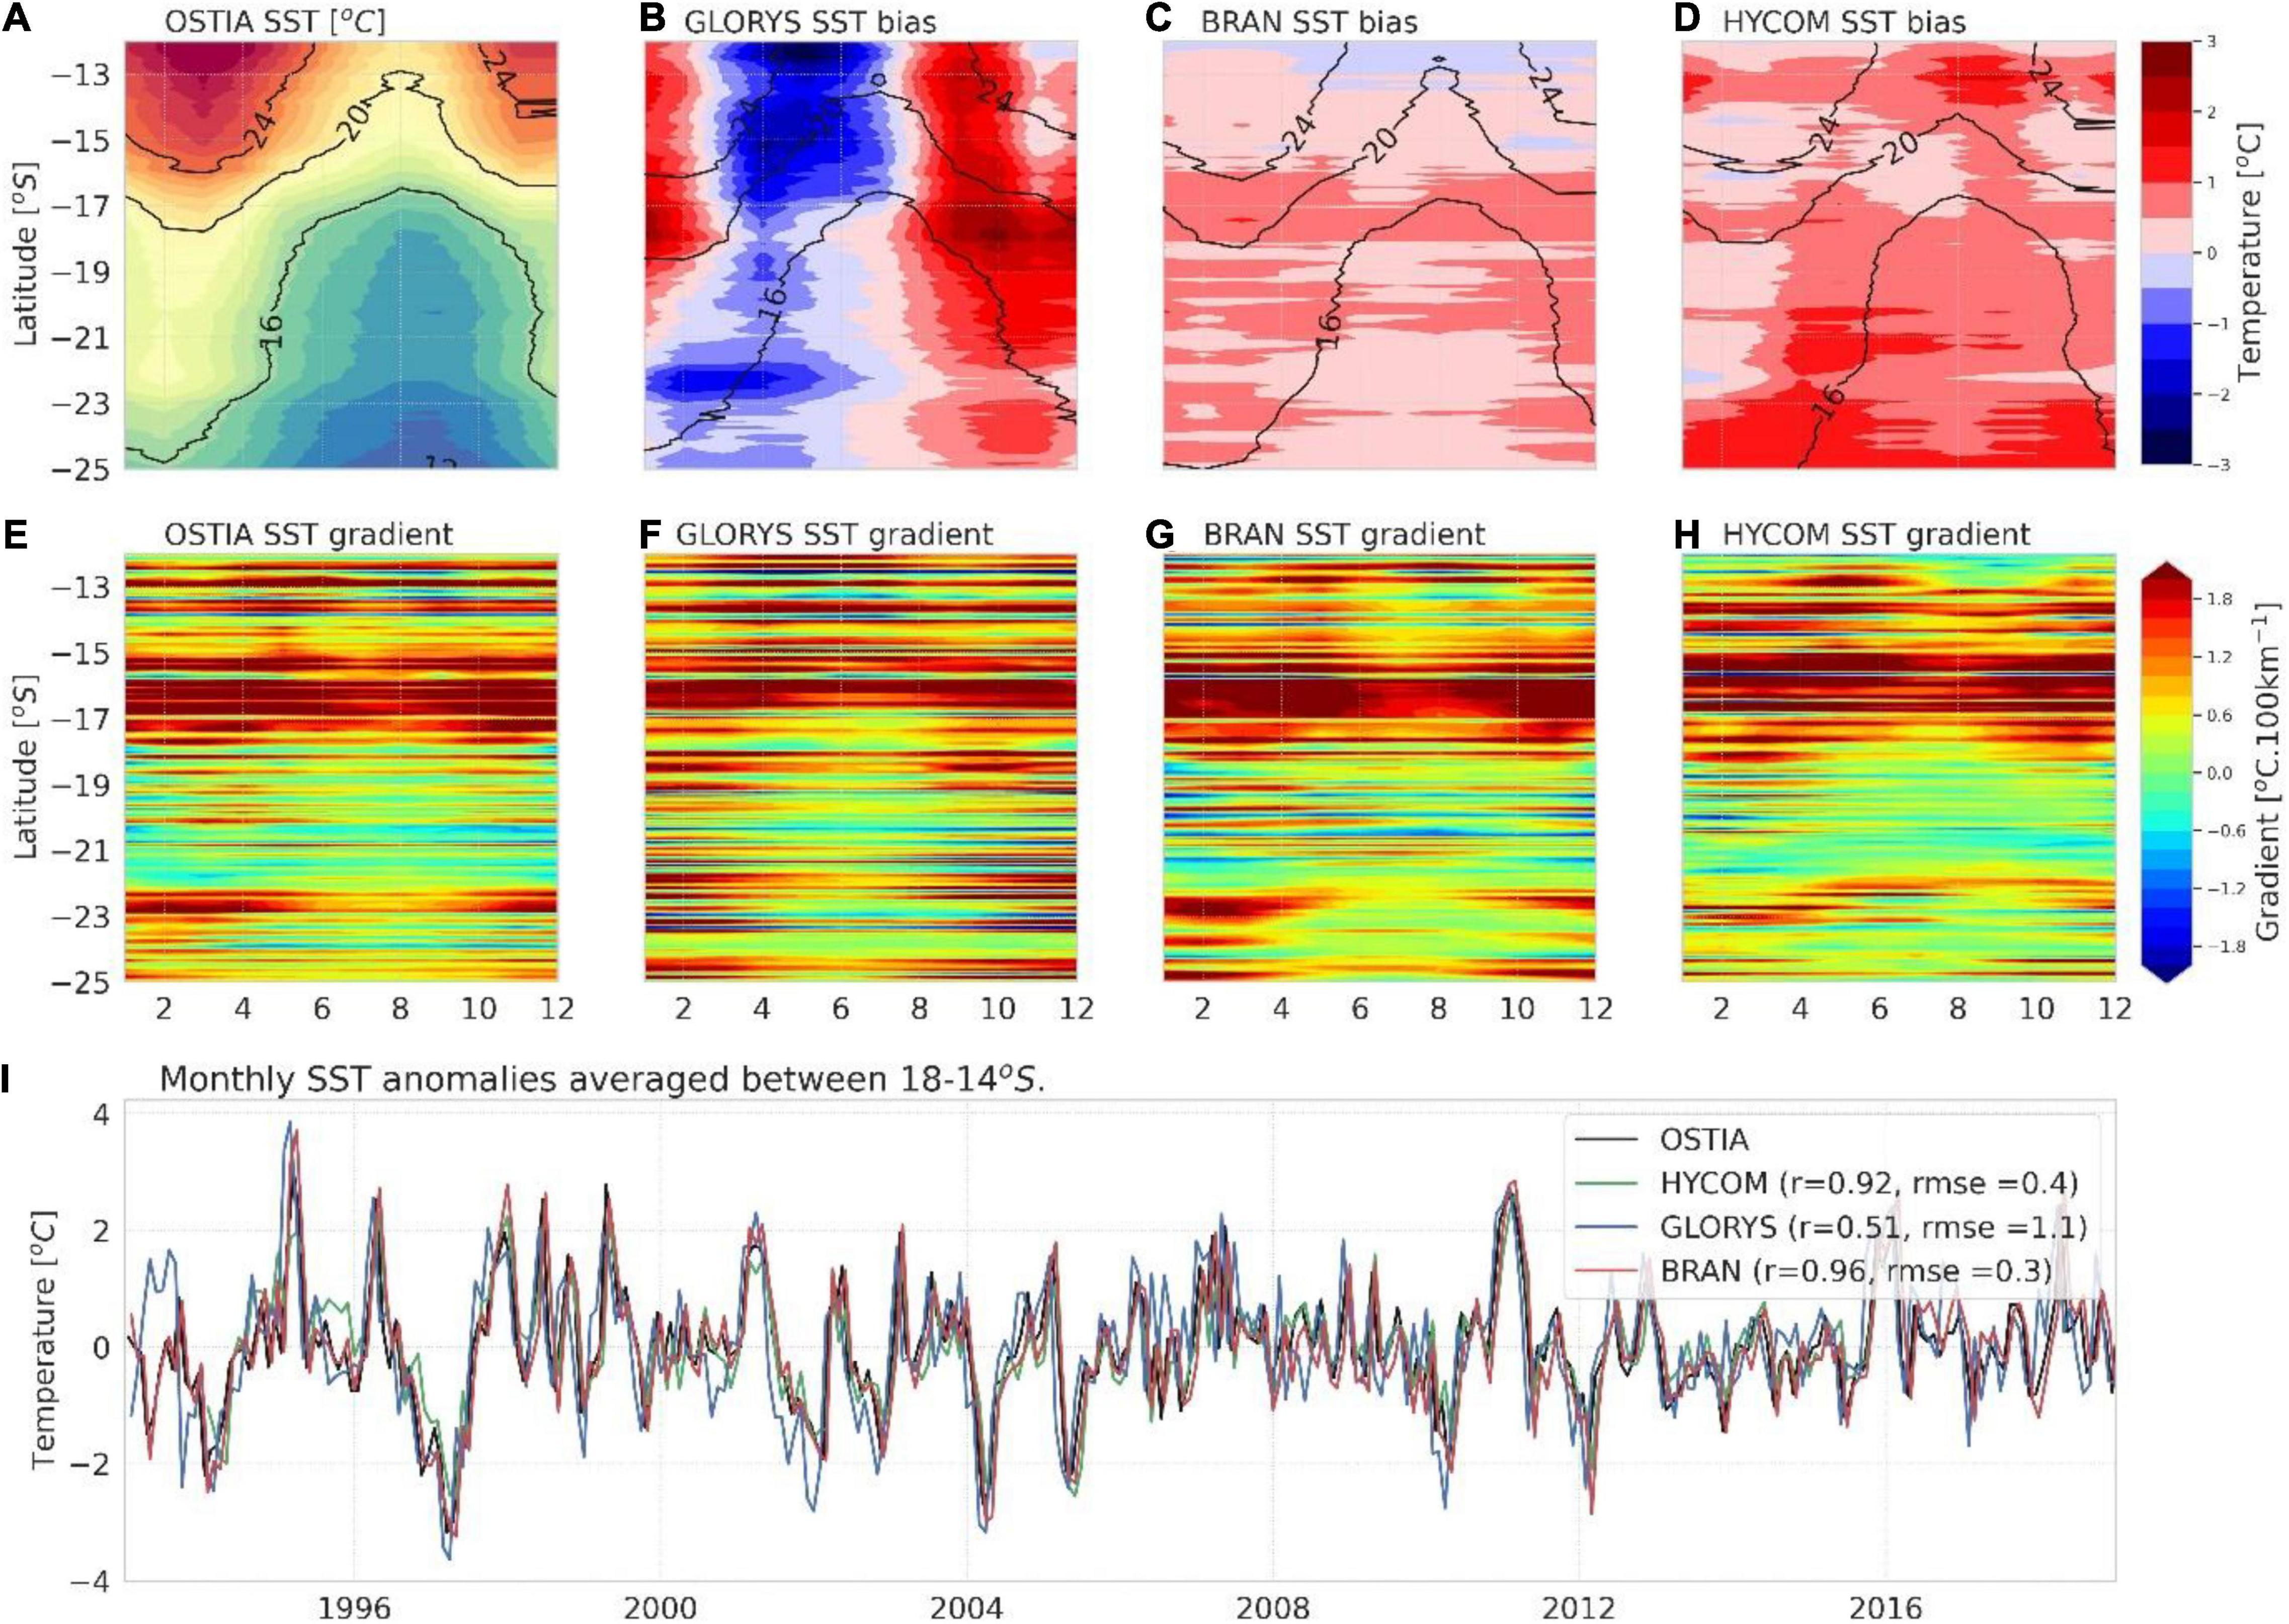
Figure 13. (A) Monthly climatology for OSTIA SST, (B–D) SST bias (reanalysis – OSTIA; contours represents the reanalyses’ monthly climatological mean SST), (E–H) SST meridional gradient and (I) monthly SST anomalies within the ABFZ. Each is based on average SSTs from the coast to approximately 50 km offshore.
To capture variability within the frontal zone and as an indicator also of Benguela Niňo events, the monthly SST anomalies averaged across the ABFZ (14–18°S) are plotted in Figure 13I. HYCOM and BRAN both correlate well with observations, with r-values of >0.9 (p << 0.05) and relatively low RMSE values (<0.5), while GLORYS deviates more from observations with a relatively high RMSE value of 1.1 and a r-value of 0.51 (p << 0.05). All the large Benguela Niňos, as well as the distinct cooling events (known as Bengula Niňas), are captured in the SST anomalies within the ABFZ of all of the models, with most distinct differences in both timing and magnitude evident being in the GLORYS model.
Nearshore and Bay-Scale
Algoa Bay
Algoa Bay, the most eastward of the various log-spiral bays on South Africa’s south coast, is situated where the Transkei shelf begins to widen into the Agulhas Bank and the Agulhas Current veers away from the coast in response. The intense current shear that characterizes the inshore edge of the Agulhas Current is responsible for the generation of cyclonic eddies (Lutjeharms et al., 2003a,b) that are associated with plumes of warm Agulhas Current water that have been observed to move into Algoa Bay (Goschen and Schumann, 1990).
Upwelling has been observed to occur on the inshore edge of the Agulhas Current (Lutjeharms et al., 2000), where the process of Ekman veering at the bottom boundary layer causes the uplift of colder bottom water at the shelf-edge and under favorable conditions, such as the presence of shear-edge eddies or at coastal upwelling sites such as Port Alfred (Lutjeharms, 2006), upstream of Algoa Bay. Cold water from the Port Alfred upwelling cell has been found to enter the eastern sector of Algoa Bay (Roberts, 2010). The direct impact of the Agulhas in driving coastal upwelling within Algoa Bay itself is not well understood, however, upwelling associated with Agulhas Meanders has been frequently observed (e.g., Roberts, 2010; Goschen et al., 2015) and has been shown to last longer and over a larger area than coastal upwelling (Roberts, 2010). Malan et al. (2018), have shown that meander events cause extreme horizontal shear that produces strong negative vorticity and enhanced upwelling, resulting in a decrease of subsurface temperatures at 100 m at the shelf edge.
Coastal upwelling off capes on the south coast primarily occur during summer months due to the predominant easterly winds (Schumann and Martin, 1991), the coastal upwelling centers in Algoa Bay being Cape Recife (Goschen and Schumann, 1995) and Woody Cape (the western- and eastern-most capes, respectively). Schumann (1998) has shown that while upwelling off Cape Recife is primarily a result of alongshore winds, off Woody Cape, it is both wind-driven and is primed by features associated with the Agulhas Current. The eastern Agulhas Bank is characterized by an intense summer thermocline (Schumann and Beekman, 1984) that gives rise to sharp upwelling fronts and SSTs that provide a good proxy for upwelling events (Schumann, 1999).
During the dominant south-westerly wind the surface currents of Algoa Bay flow downwind, with surface speeds of the order of 0.1 m/s closer to the coast and up to 0.5 m/s further offshore (Roberts, 1990). This is consistent with the results of a drift card study by Lutjeharms et al. (1986), in which dominant north-eastward (followed by south-westward) currents were observed in the central parts of the bay. Goschen and Schumann (1988) later observed that these tended to be barotropic. The north-easterly, upwelling favorable winds, correspond to a dominant southward flow in the deeper parts of Algoa Bay and strong alongshore flow along the coast, of up to 0.5 m/s (Roberts, 1990). More specifically in the eastern section of Algoa Bay coastal currents have been observed to be primarily barotropic and either eastward or westward, with wind forcing being the dominant driving force (Roberts, 2010). Deep current measurements in the western region of Algoa Bay, have demonstrated a predominantly south-westward flow (Schumann et al., 2005), which is consistent with the idea of Agulhas Current entrainment.
As one of South Africa’s largest, Algoa Bay provides a degree of shelter from the southern hemisphere’s most powerful western boundary current and is being utilized for offshore oil bunkering (ship refueling) operations, despite the fact that it is also home to several marine protected areas and important bird colonies. For these reasons, it is especially crucial that we have a good understanding of the ocean dynamics within the bay. In this section, we make use of SAEONs UTR and ADCP measurements to investigate the extent to which global models are able to capture the salient dynamics.
Temperatures
The UTR records spanning 4 years from 2010 to 2013, situated at the mouth of the bay and off the island of Saint Croix (BM and SCX in Figure 14, respectively) are used to assess the ability of the three global models at reproducing temperatures more influenced by nearshore dynamics (SCX with a water depth of ∼30 m) versus large-scale boundary dynamics (at BM with a water depth of ∼80 m). While the deeper mooring at BM provides a more-or-less complete time-series throughout the water column, allowing for an analysis of the vertical structure of the water column, the shallower-water station at SCX, unfortunately, has many gaps and so only the 20 m time-series is used here.
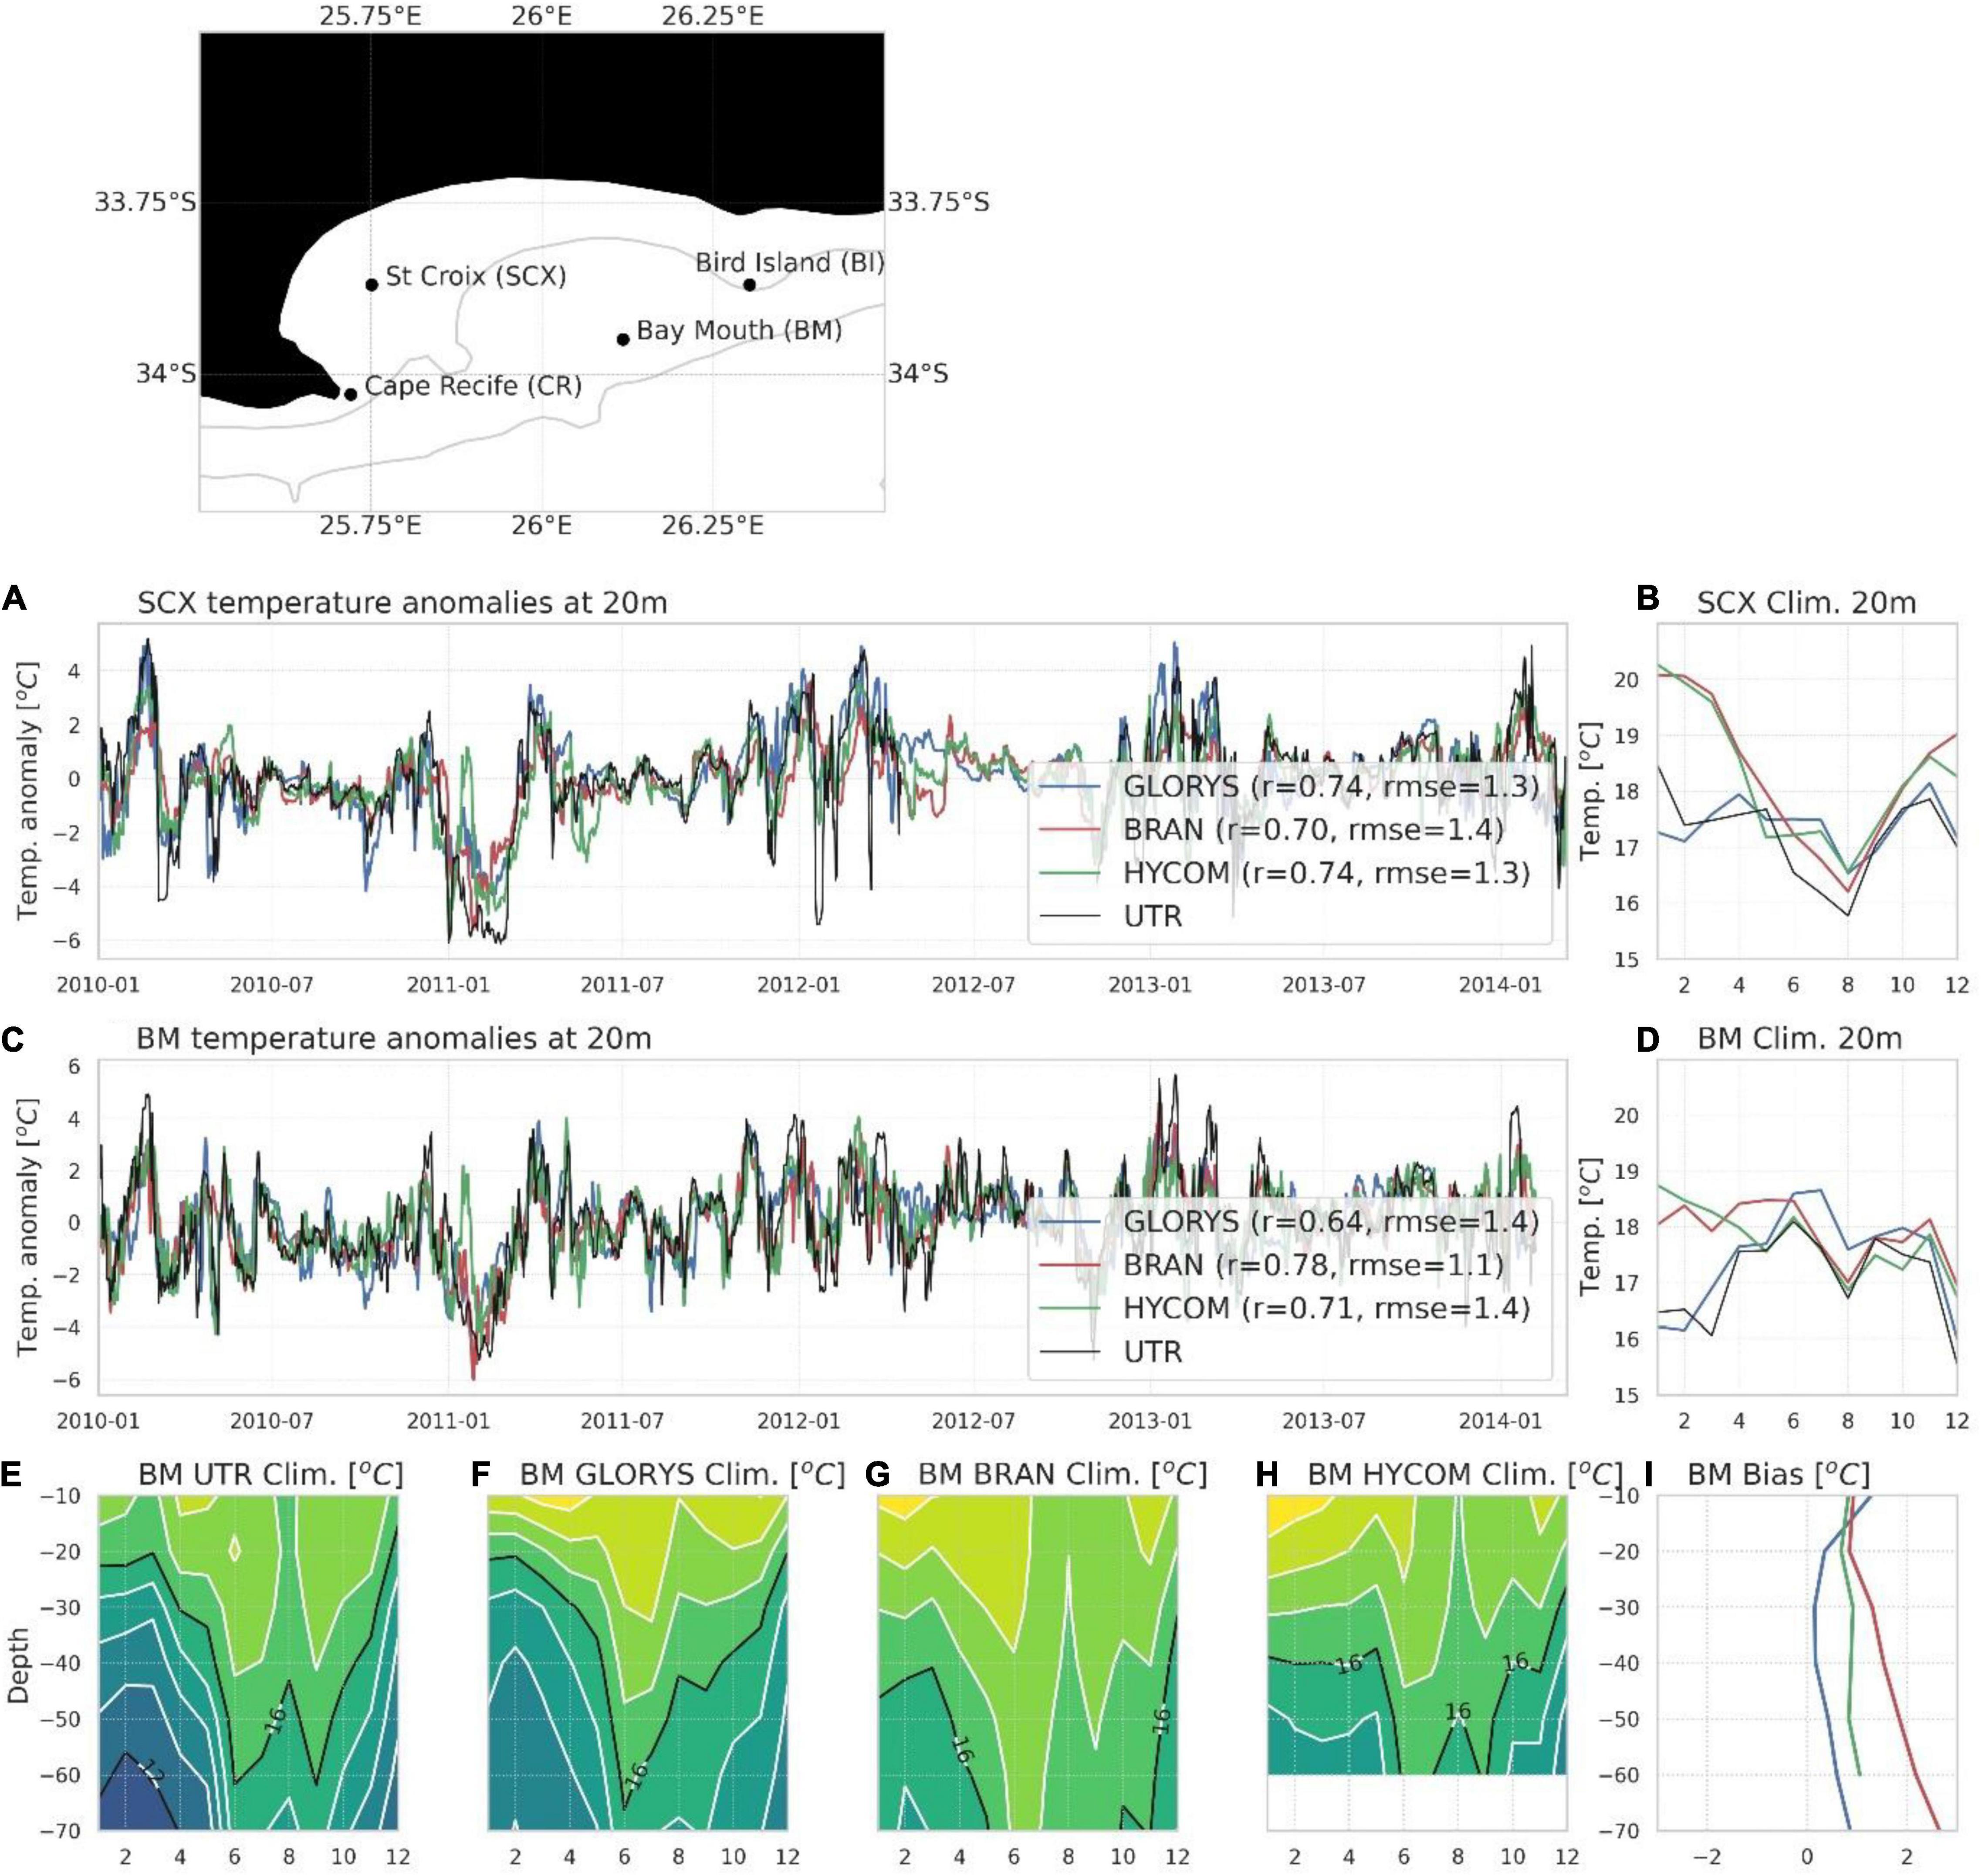
Figure 14. Daily temperature anomaly and monthly climatology at (A,B) St Croix (SCX) and the (C,D) Bay Mouth (BM). (E–H) Monthly climatological temperature-depth diagrams at the Bay Mouth for the in situ data and the reanalysis products. (I) Average temperature bias of the reanalysis products throughout the water column.
Neither mooring is situated within a coastal upwelling cell and we therefore do not expect a strong summer cooling signal in relation to the onset of upwelling favorable winds. However, the SCX UTR measurements reveal a distinct cooling during the month of December (black line in Figure 14B), a month after the windiest period in October and November (Schumann et al., 2005). This could be related to the westward advection of the cool water upwelled at the easternmost upwelling cell of Algoa Bay and/or from the prominent upwelling cell of Port Alfred. This cooling at SCX is well captured in the GLORYS model (blue line in Figure 14B), but it extends into January and February. On the other hand, BRAN and HYCOM simulate a much stronger seasonal cycle with distinctly warmer temperatures during summer months, suggesting that they are not capturing the westward advection of the cold upwelled water sufficiently. Offshore, at the BM mooring, a similar seasonal signal is captured in the observational data (black line in Figure 14D) at 20 m depth, but the slight cooling during summer months lasts longer (from November to March). This is consistent with the period of upwelling favorable winds, with the strongest temperature drop occurring the month after the period of strongest winds. This seasonal cooling pattern is again suggestive of cold upwelled waters being advected westward from their source regions at the coast. While GLORYS captures the full period of summer cooling, BRAN and HYCOM only capture the first part of the cooling after the strongest upwelling favorable winds. The fact that all models perform better at the offshore station, suggests that they do not sufficiently capture the nearshore currents that advect the cold upwelled waters westward, or that they underestimate coastal upwelling, or a combination of both.
The time-series of temperature anomalies at a depth of 20 m for the SCX and BM UTR (Figures 14A,C) show that episodic cooling and warming events at these mooring locations tend to be coupled. The cooling events prior to 2011 have been shown by Goschen et al. (2015) to be caused by upwelling associated with Agulhas Meanders, that is more wide-spread and persistent than coastal upwelling events. It is likely that the large cooling events after this are similarly related to Agulhas Meander events. Goschen et al. (2015) further observed that warm plumes associated with the movement of the meander can result in warm anomalies either before or after the cooling event. There is evidence of this in the UTR data at both moorings, whereby significant warm anomalies are present before or/and after a cool anomaly (Figures 14A,C). While there tends to be a warm bias in all models (most significantly in BRAN and HYCOM during summer months and only slightly in GLORYS for most months of the year), they all capture the temperature variability and all of these episodic events well as can be seen in Figures 14A,C.
The vertical structure of the water column from the UTR measurements at the BM mooring (Figure 14E) is consistent with previous findings of an intense summer thermocline that degrades during winter months. Cool water extends toward the surface during summer months, while solar warming at the surface intensifies the thermocline. The deep cool water is likely related to Ekman veering at the inshore edge of the Agulhas Current at the shelf-edge that is enhanced during summer months when the Agulhas Current intensifies (Krug and Tournadre, 2012). While all models capture the intensification of the enhanced summer thermocline, they all have a persistent warm bias throughout the water column that increases with depth, suggesting that the deep upwelling feature associated with the Agulhas Current is not well represented in the models, resulting in an underestimation of the intensity of the thermocline. This will impact the SST manifestation of upwelling, as well as the frontal intensities at the surface.
Currents
Depth averaged currents about 2 km off Cape Recife (CR in Figure 14), at the western-most edge of Algoa Bay and Bird Island (BI in Figure 14), some 10 km offshore at the eastern side, are investigated using ADCP current data spanning 25-11-2008 to 14-03-2013 and 3-12-2008 to 30-10-2014, respectively. Vertical velocity profiles from the reanalyses are co-located in both time and space with the in situ ADCP data from Bird Island and Cape Recife. Both ADCP and model data is averaged daily and gaps in the in situ data have been removed from the model datasets as well, so as to compare equivalent depth averaged current time-series data.
The dominant currents measured off Cape Recife are due southward with some variability that is confined to the southwest and southeast (Figure 15A), which is consistent with the findings of Goschen et al. (2015) who also used this dataset, but only for the 2009–2011 period. All of the models produce dominant south-westward currents with infrequent, but often strong (in the case of GLORYS and HYCOM) southward contributions and all models also produce, albeit infrequent, north-eastward currents that are not observed in the in situ data. (Figures 15B–D). Given that nearshore currents in this region tend to follow local bathymetry and orientation of the shoreline (Goschen and Schumann, 2015), the deficiency in the models could be related to poorly resolved topography.
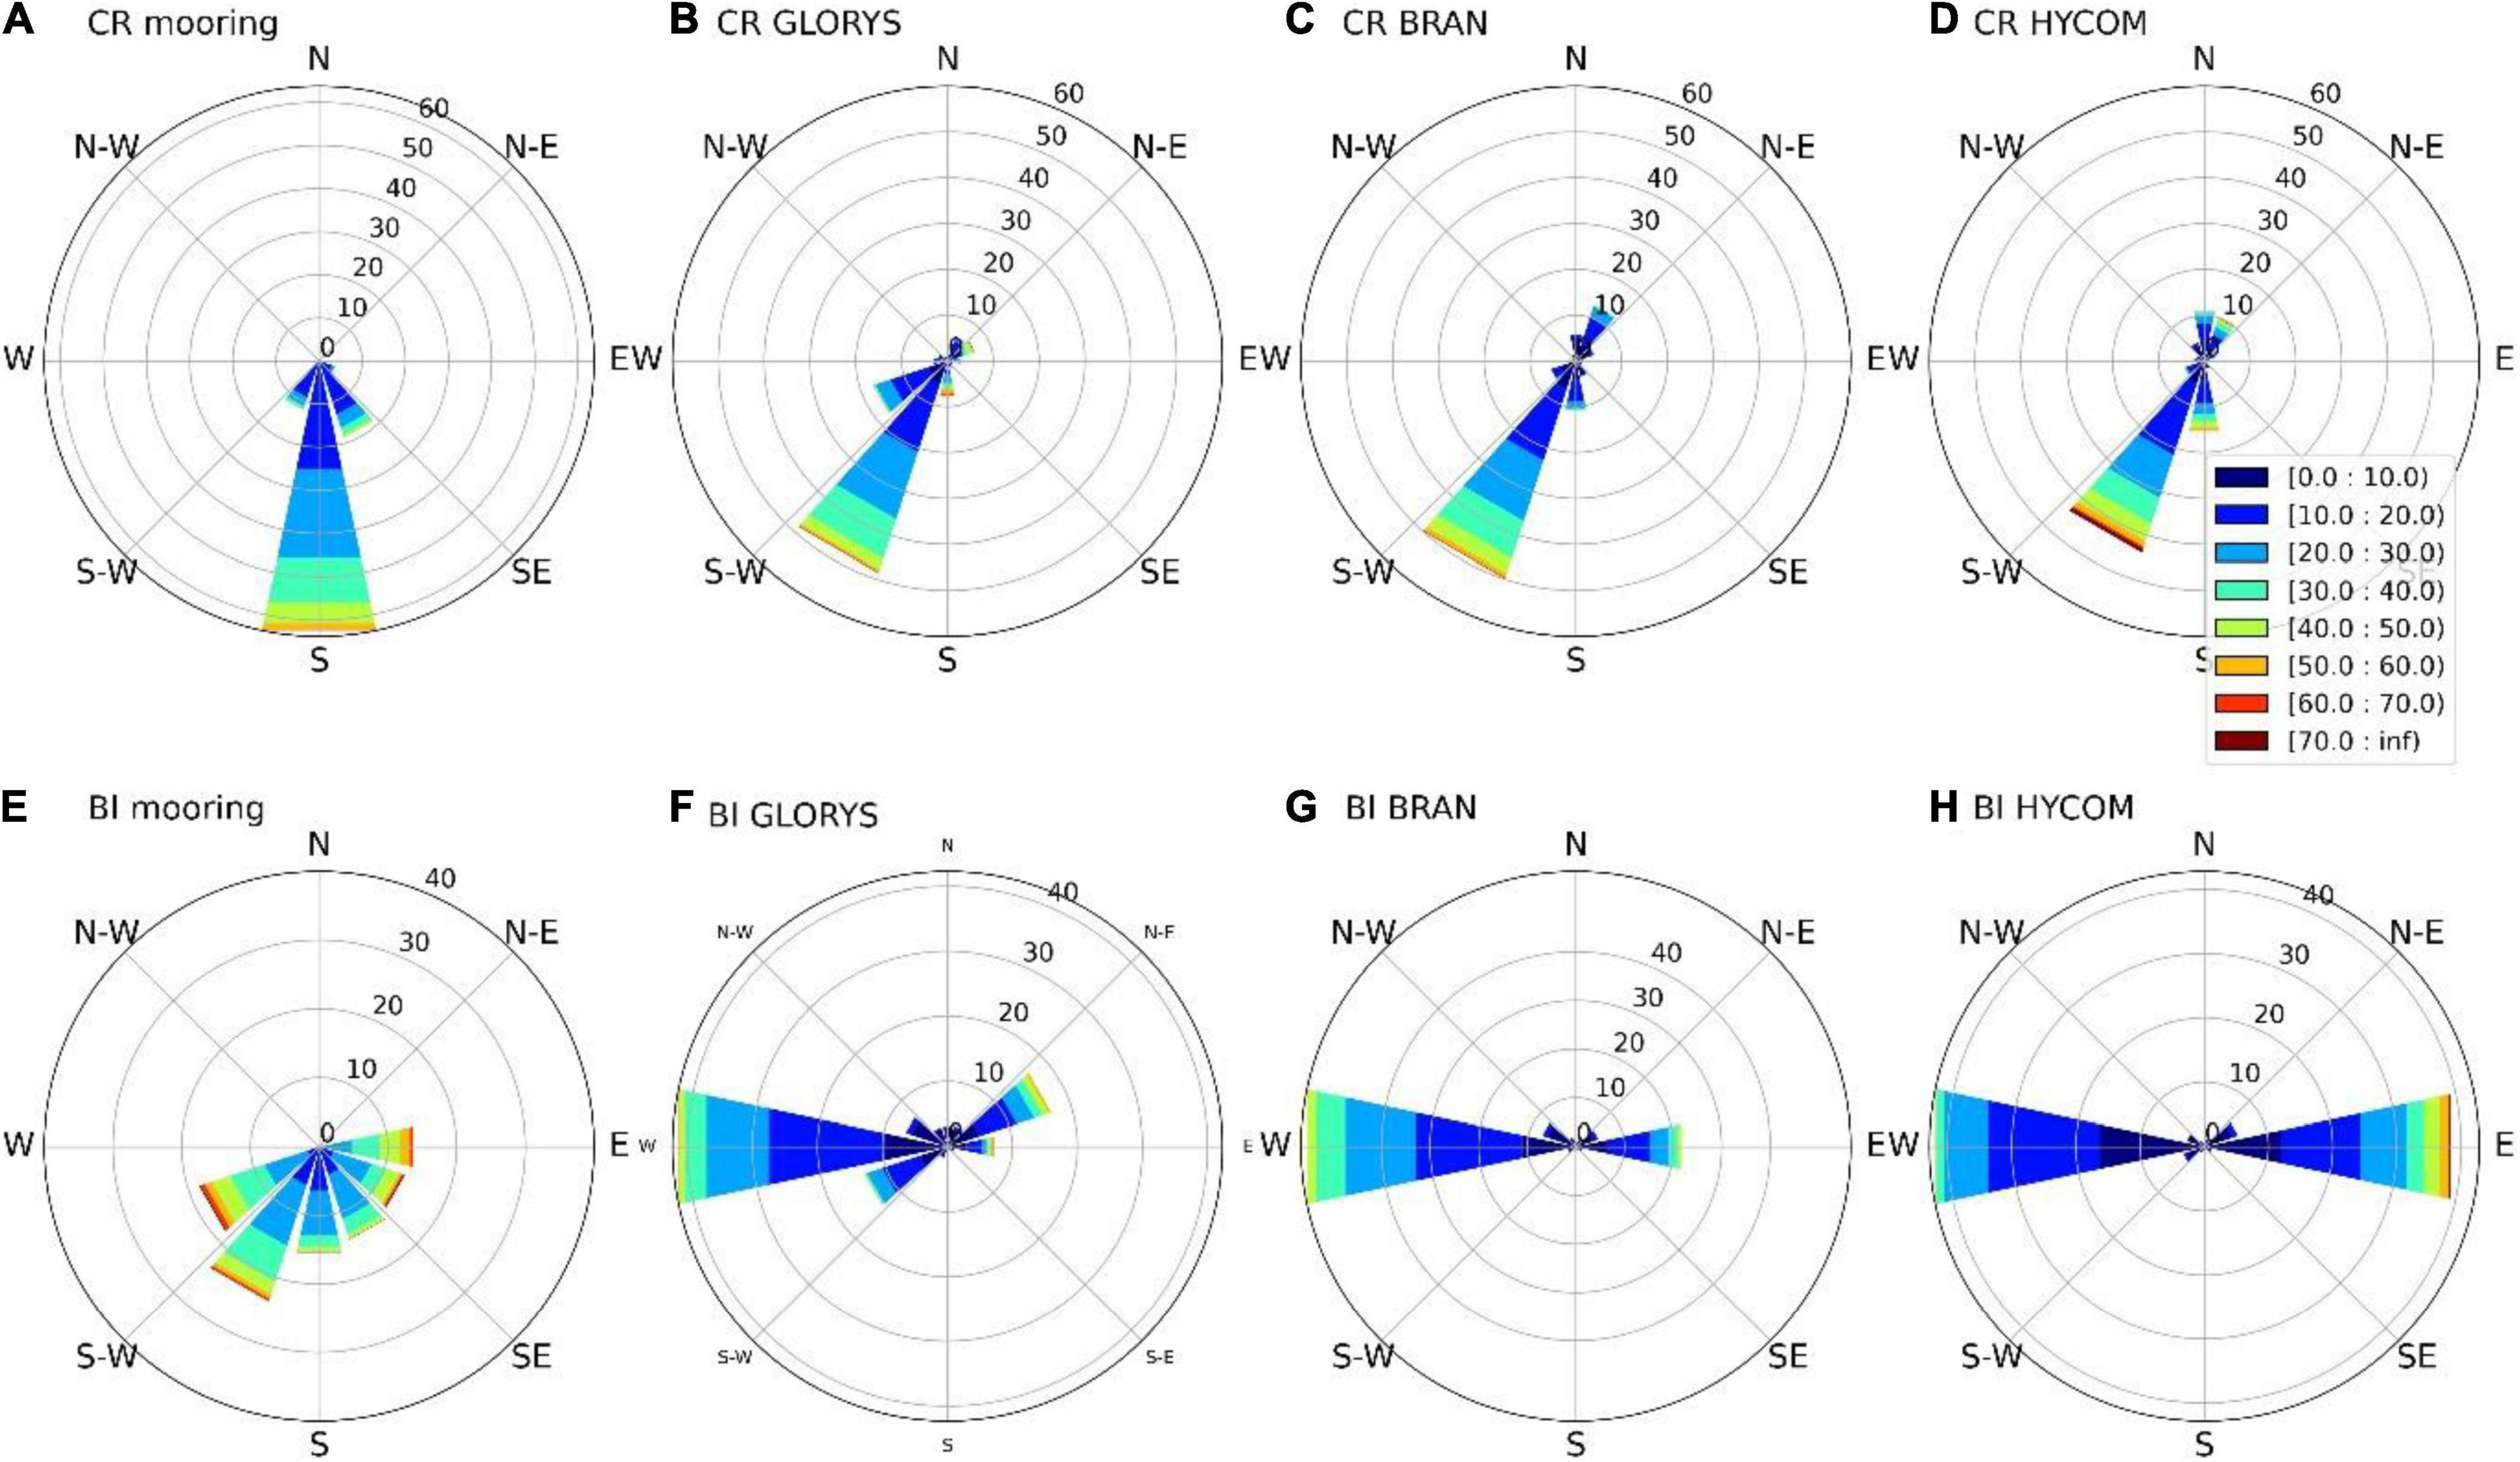
Figure 15. Current roses used to illustrate the depth-averaged ocean currents (in cm s–1) at (A–D) Cape Recife (CR) and at (E–H) Bird Island (BI) for the in situ data and reanalysis products.
The current rose in Figure 15E shows that the depth averaged currents measured off Bird Island are highly variable, ranging from due eastward to west-south-westward, with a slight dominance of south-westward. Current speeds can reach up to 0.5–0.6 m/s in any direction (Figure 15E). While Roberts (2010) observed primarily barotropic eastward or westward currents on the eastern side of Algoa Bay, his moorings were more coastal than the Bird Island mooring analyzed here and would not have captured the extreme variability in the more offshore region where the currents are influenced not only by processes driven by local winds but also by features associated with the Agulhas Current. All models produce weaker currents, and all display less variability in current direction (Figures 15F–H). BRAN and HYCOM produce only eastward and westward currents, which is similar to the current regime one might expect in the more coastal domain. The predominant current in GLORYS is westward, with significantly less frequent north-eastward to west-south-westward currents. However, an important consideration when evaluating the currents in this region is that being so small (less than the size of the model grid cells), Bird Island is not resolved in any of the models and therefore the complicated dynamics associated with it and in its vicinity will not be either.
Summary
The evaluation of three global ocean reanalysis products (GLORYS, BRAN, and HYCOM) in the context of southern Africa’s oceans has been conducted. This evaluation was performed not only to provide modelers with sufficient information for selecting the appropriate global reanalysis product to use as boundary conditions to force their regional ocean models as well as to provide marine industries, relevant government agencies and academics with insight into the optimal reanalysis product for their purposes. The products were evaluated against assimilated and independent observational datasets spanning various regions within the southern African marine environment.
All the reanalyses reproduce the large-scale circulation features reasonably well, capturing the eastern and western boundary current systems surrounding southern Africa. Nevertheless, the reanalysis products have their limitations in these systems. Evaluations of the reanalysis products against both in situ temperature data and the satellite SST revealed that both GLORYS and HYCOM have significant warm biases on the shelf in the Benguela upwelling system which intensifies during the summer upwelling season. Their misrepresentation of the MLD, such that it is deeper than observed, results in too warm water being upwelled which can be exacerbated by atmospheric forcing products that do not sufficiently capture the nearshore wind-field. BRAN, however, outperforms the other reanalyses in its representation of the MLD, contributing to its good representation of coastal SSTs. The equatorward shelf-edge jet of the southern Benguela is reproduced by GLORYS and BRAN, whereas the nearshore poleward flow is only captured by HYCOM and BRAN, albeit further offshore. While the ABFZ and its associated variability is reproduced best by BRAN (r-value = 0.96) and HYCOM (r-value = 0.92), all the reanalyses manage to capture the large Benguela Niňos and Niňas events.
The major components of the Agulhas Current system are well reproduced by both GLORYS and BRAN. Despite GLORYS and BRAN’s relative westward locations of their respective mean retroflection positions, they accurately reproduce the associated variability with r-values of 0.857 and 0.815, respectively. While all of the reanalysis products reproduce the most extreme early retroflection events of 2000/2001 and 2008, only HYCOM and BRAN reproduced the others. However, HYCOM produces considerably more early retroflections than have been observed and early retroflection events can be detrimental to the biological productivity of the Agulhas Bank (Roberts and Mullon, 2010). While both GLORYS and BRAN simulate a very well-defined Agulhas Return Current (ARC), only GLORYS reproduces the two quasi-stationary meanders characteristic of ARC (Boebel et al., 2003b). Although all the reanalyses overestimate the occurrence of Agulhas meanders, HYCOM more so than the others, GLORYS (r-value = 0.735) and BRAN (r-value = 0.694) best capture the associated variability. The Agulhas transport is best resolved by GLORYS, unlike BRAN and HYCOM which largely overestimate the magnitude of the south-westward flow, likely linked to misrepresentation of the current’s vertical structure.
The coastal and near-shore evaluations, which compare the reanalysis products to in situ UTR and ADCP data, revealed that all the reanalyses were not able to simulate the complicated dynamics associated with Bird Island in Algoa Bay. Since the island’s size is smaller than the size of the reanalyses’ grid cells, neither product registers the island and its associated dynamics, highlighting an issue for the use of these global reanalyses in the near-shore and coastal context. In the nearshore region of the Agulhas Current system, the reanalyses were not able to represent the deep upwelling feature associated with the current resulting in an underestimation of the intensity of the thermocline, impacting the manifestation of SSTs, as well as the intensities of the fronts at the surface. The reanalyses’ outputs are not ideal for direct use in the coastal region of Algoa Bay as they do not sufficiently capture the nearshore currents which is possibly the case in many of the other bays scattered along the southern African coastline.
While the results from this evaluation reveal that the large and regional scale features are considerably well resolved by the reanalyses, they are limited in their nearshore and bay-scale abilities. They are limited by their resolution as well as by their misrepresentation of submesoscale processes or lack thereof. This, however, does not rule out their value in the nearshore or at a bay-scale. Given the respective strengths of the different reanalyses at a large and regional-scale in the different current systems, specific reanalyses can be used to force the boundaries of regionally downscaled models in the appropriate region. The results from this evaluation prompt the need for the development of regional downscaled models in and around the southern African oceans which are based on the appropriate global ocean reanalysis product dependant on their region of study.
Data Availability Statement
The original contributions presented in the study are included in the article/Supplementary Material, further inquiries can be directed to the corresponding author.
Author Contributions
JV, GF, and CR contributed to conception and design of the study. CR, MC, and CW organized the database. CR, MC, JV, and CW performed the statistical analysis. CR wrote the first draft of the manuscript. CR, JV, and CW wrote sections of the manuscript. All authors contributed to manuscript revision, read, and approved the submitted version.
Conflict of Interest
The authors declare that the research was conducted in the absence of any commercial or financial relationships that could be construed as a potential conflict of interest.
Publisher’s Note
All claims expressed in this article are solely those of the authors and do not necessarily represent those of their affiliated organizations, or those of the publisher, the editors and the reviewers. Any product that may be evaluated in this article, or claim that may be made by its manufacturer, is not guaranteed or endorsed by the publisher.
Acknowledgments
We would like to thank the organizations responsible for producing and disseminating the global reanalysis products evaluated herein: Mercator Ocean for GLORYS, CSIRO for BRAN and FNMOC for HYCOM. We would also like to thank every institution involved in capturing, maintaining and disseminating the observational datasets used in this evaluation. To the United Kingdom Meteorological Office and Copernicus Marine Environment Monitoring Service (CMEMS) for the OSTIA dataset. To CMEMS for the satellite altimetry data. To Coriolis and CMEMS for the CORA dataset. To the University of Miami’s Rosenstiel School of Marine and Atmospheric Science’s Beal Lab for the gridded ACT and ASCA datasets. To the South African Department of Forestry, Fisheries and the Environment (DFFE) for the SAMBA and SHBML datasets. To DFFE and Ezemvelo KwaZulu-Natal Wildlife (EKZNW) for contributing raw data toward the SACTN dataset. And last but not least to South African Environmental Observation Network’s Elwandle Node for the Algoa Bay UTR and ADCP datasets. We thank Sian Seymour for proof reading the final draft.
Supplementary Material
The Supplementary Material for this article can be found online at: https://www.frontiersin.org/articles/10.3389/fmars.2022.837906/full#supplementary-material
Footnotes
References
Backeberg, B. C., Counillon, F., Johannessen, J. A., and Pujol, M. I. (2014). Assimilating along-track SLA data using the EnOI in an eddy resolving model of the Agulhas system. Ocean Dyn. 64, 1121–1136. doi: 10.1007/s10236-014-0717-6
Barlow, R. G., Lamont, T., Kyewalyanga, M., Sessions, H., and Morris, T. (2010). Phytoplankton production and physiological adaptation on the southeastern shelf of the Agulhas ecosystem. Cont. Shelf Res. 30, 1472–1486. doi: 10.1016/j.csr.2010.05.007
Beal, L. M., De Ruijter, W. P., Biastoch, A., and Zahn, R. (2011). On the role of the Agulhas system in ocean circulation and climate. Nature 472, 429–436. doi: 10.1038/nature09983
Beal, L. M., Elipot, S., Houk, A., and Leber, G. M. (2015). Capturing the transport variability of a western boundary jet: Results from the Agulhas Current Time-Series Experiment (ACT). J. Phys. Oceanogr. 45, 1302–1324. doi: 10.1175/JPO-D-14-0119.1
Beckley, L. E., and van Ballegooyen, R. C. (1992). Oceanographic conditions during three ichthyoplankton surveys of the Agulhas Current in 1990/91. S. Afr. J. Mar. Sci. 12, 83–93. doi: 10.2989/02577619209504693
Biastoch, A., Lutjeharms, J. R. E., Böning, C. W., and Scheinert, M. (2008). Mesoscale perturbations control inter-ocean exchange south of Africa. Geophys. Res. Lett. 35:2008GL035132. doi: 10.1029/2008GL035132
Boebel, O., Lutjeharms, J., Schmid, C., Zenk, W., Rossby, T., and Barron, C. (2003a). The Cape Cauldron: a regime of turbulent inter-ocean exchange. Deep Sea Res. 50, 57–86. doi: 10.1016/S0967-0645(02)00379-X
Boebel, O., Rossby, T., Lutjeharms, J., Zenk, W., and Barron, C. (2003b). Path and variability of the Agulhas Return Current. Deep Sea Res. Part II Top. Stud. Oceanogr. 50, 35–56. doi: 10.1016/S0967-0645(02)00377-6
Braby, L., Backeberg, B. C., Ansorge, I., Roberts, M. J., Krug, M., and Reason, C. J. (2016). Observed eddy dissipation in the Agulhas Current. Geophys. Res. Letts 43, 8143–8150. doi: 10.1002/2016GL069480
Braby, L., Backeberg, B., Krug, M., and Reason, C. (2020). Quantifying the impact of wind-current feedback on mesoscale variability in forced simulation experiments of the Agulhas Current using an eddy-tracking algorithm. J. Geophys. Res. Oceans 125:e2019JC015365. doi: 10.1029/2019JC015365
Capet, X., Colas, F., McWilliams, J. C., Penven, P., and Marchesiello, P. (2008). Eddies in eastern-boundary subtropical upwelling systems. Eddy Resolv. Ocean Model. Geophys. Monogr. Ser. 177, 131–148.
Carr, M. (2018). Investigating the local circulation of the southeast Cape Basin. Ph. D. thesis. Cape Town: University of Cape Town.
Carr, M., Lamont, T., and Krug, M. (2021). Satellite Sea Surface Temperature Product Comparison for the Southern African Marine Region. Rem. Sens. 13:1244. doi: 10.3390/rs13071244
Chamberlain, M. A., Oke, P. R., Fiedler, R. A., Beggs, H. M., Brassington, G. B., and Divakaran, P. (2021). Next generation of Bluelink ocean reanalysis with multiscale data assimilation: BRAN2020. Earth Syst. Sci. Data Discuss. 2021, 1–31. doi: 10.5194/essd-2021-194
Ciasto, L. M., and Thompson, D. W. (2008). Observations of large-scale ocean–atmosphere interaction in the Southern Hemisphere. J. Clim. 21, 1244–1259. doi: 10.1175/2007JCLI1809.1
Colberg, F., and Reason, C. J. C. (2006). A model study of the Angola Benguela Frontal Zone: Sensitivity to atmospheric forcing. Geophys. Res. Lett. 33:L19608. doi: 10.1029/2006GL027463
Collins, C., Hermes, J. C., and Reason, C. J. C. (2014). Mesoscale activity in the Comoros basin from satellite altimetry and a high-resolution ocean circulation model. J. Geophys. Res. Oceans 119, 4745–4760. doi: 10.1002/2014JC010008
Cummings, J. A. (2005). Operational multivariate ocean data assimilation. Q. J. R. Meteorol. Soc. 131, 3583–3604. doi: 10.1256/qj.05.105
Cummings, J. A., and Smedstad, O. M. (2013). “Variational data assimilation for the global ocean,” in Data Assimilation for Atmospheric, Oceanic and Hydrologic Applications, Vol. II, eds S. K. Park and L. Xu (Berlin: Springer), 303–343.
Cummings, J. A., and Smedstad, O. M. (2014). Ocean data impacts in global HYCOM. J. Atmos. Ocean Technol. 31, 1771–1791. doi: 10.1175/JTECH-D-14-00011.1
de Boyer Montégut, C., Madec, G., Fischer, A. S., Lazar, A., and Iudicone, D. (2004). Mixed layer depth over the global ocean: An examination of profile data and a profile-based climatology. J. Geophys. Res. Oceans 109:2004JC002378. doi: 10.1029/2004JC002378
de Ruijter, W. P. M., van Aken, H. M., Beier, E. J., Lutjeharms, J. R. E., Matano, R. P., and Schouten, M. V. (2004). Eddies and dipoles around South Madagascar: formation, pathways and large scale impact. Deep Sea Res. Part I Oceanogr. Res. Pap. 51, 383–400.
de Ruijter, W. P., Van Leeuwen, P. J., and Lutjeharms, J. R. (1999). Generation and evolution of Natal Pulses: Solitary meanders in the Agulhas Current. J. Phys. Oceanogr. 29, 3043–3055.
de Souza, J. M. A. C., Couto, P., Soutelino, R., and Roughan, M. (2020). Evaluation of four global ocean reanalysis products for New Zealand waters–A guide for regional ocean modelling. NZ. J. Mar. Freshw. Res. 55, 132–155. doi: 10.1080/00288330.2020.1713179
Dencausse, G., Arhan, M., and Speich, S. (2010). Spatio-temporal characteristics of the Agulhas current retroflection. Deep Sea Res. Part I Oceanogr. Res. Pap. 57, 1392–1405. doi: 10.1016/j.dsr.2010.07.004
Dufois, F., Penven, P., Whittle, C. P., and Veitch, J. (2012). On the warm nearshore bias in Pathfinder monthly SST products over Eastern Boundary Upwelling Systems. Ocean Model. 47, 113–118. doi: 10.1016/j.ocemod.2012.01.007
Durgadoo, J., Loveday, B., Reason, C., Penven, P., and Biastoch, A. (2013). Agulhas leakage predominantly responds to the Southern Hemisphere westerlies. J. Phys. Oceanogr. 43, 2113–2131.
Elipot, S., and Beal, L. M. (2015). Characteristics, energetics, and origins of Agulhas Current meanders and their limited influence on ring shedding. J. Phys. Oceanogr. 45, 2294–2314. doi: 10.1175/JPO-D-14-0254.1
Fernandez, E., and Lellouche, J. M. (2021). Product User Manual for the Global Ocean Physical Reanalysis product GLOBAL_REANALYSIS_PHY_001_030. Toulouse: EU Copernicus Marine Service.
Florenchie, P., Lutjeharms, J. R. E., Reason, C. J. C., Masson, S., and Rouault, M. (2003). The source of Benguela Niños in the South Atlantic Ocean. Geophys. Res. Lett. 30:1505. doi: 10.1029/2003GL017172
Florenchie, P., Reason, C. J. C., Lutjeharms, J. R. E., and Rouault, M. (2004). Evolution of interannual warm and cold events in the southeast Atlantic Ocean. J. Clim. 17, 2318–2334. doi: 10.1175/1520-0442(2004)017<2318:EOIWAC>2.0.CO;2
Gill, A. E., Green, J. S. A., and Simmons, A. J. (1974). Energy partition in the large-scale ocean circulation and the production of mid-ocean eddies. Deep Sea Res. 21, 499–528. doi: 10.1016/0011-7471(74)90010-2
Good, S., Fiedler, E., Mao, C., Martin, M. J., Maycock, A., Reid, R., et al. (2020). The current configuration of the OSTIA system for operational production of foundation sea surface temperature and ice concentration analyses. Rem. Sens. 12:720. doi: 10.3390/rs12040720
Goschen, W. S., and Schumann, E. H. (1988). Ocean current and temperature structures in Algoa Bay and beyond in November 1986. S. Afr. J. mar. Sci. 7, 101–116. doi: 10.2989/025776188784379198
Goschen, W. S., and Schumann, E. H. (1990). Agulhas Current variability and inshore structures off the Cape Province, South Africa. J. Geophys. Res. 95, 667–678. doi: 10.1029/JC095iC01p00667
Goschen, W. S., and Schumann, E. H. (1995). Upwelling and the occurrence of cold water around Cape Recife, Algoa Bay, South Africa. S. Afr. J. Mar. Sci. 16, 57–67. doi: 10.2989/025776195784156520
Goschen, W. S., Bornman, T. G., Deyzel, S. H. P., and Schumann, E. H. (2015). Coastal upwelling on the far eastern Agulhas Bank associated with large meanders in the Agulhas Current. Cont. Shelf Res. 101, 34–46. doi: 10.1016/j.csr.2015.04.004
Goschen, W., and Schumann, E. (2015). The physical oceanographic processes of Algoa Bay, with emphasis on the western coastal region, Report. SAEON ARMSCOR IMT 2015:3767. doi: 10.13140/RG.2.1.1823.3767
Gruber, N., Lachkar, Z., Frenzel, H., Marchesiello, P., Münnich, M., McWilliams, J. C., et al. (2011). Eddy-induced reduction of biological production in eastern boundary upwelling systems. Nat. Geosci. 4, 787–792.
Guastella, L. A., and Roberts, M. J. (2016). Dynamics and role of the Durban cyclonic eddy in the KwaZulu-Natal Bight ecosystem. Afri. J. Mar. Sci. 38(Suppl. 1), S23–S42. doi: 10.2989/1814232X.2016.1159982
Gunn, K. L., Beal, L. M., Elipot, S., McMonigal, K., and Houk, A. (2020). Mixing of subtropical, central, and intermediate waters driven by shifting and pulsing of the Agulhas Current. J. Phys. Oceanogr. 50, 3545–3560. doi: 10.1175/JPO-D-20-0093.1
Holt, J., Hyder, P., Ashworth, M., Harle, J., Hewitt, H. T., Liu, H., et al. (2017). Prospects for improving the representation of coastal and shelf seas in global ocean models. Geosci. Model Dev. 10, 499–523. doi: 10.5194/gmd-10-499-2017
Hutchings, L., Van der Lingen, C. D., Shannon, L. J., Crawford, R. J. M., Verheye, H. M. S., Bartholomae, C. H., et al. (2009). The Benguela Current: An ecosystem of four components. Prog. Oceanogr. 83, 15–32. doi: 10.1016/j.pocean.2009.07.046
Illig, S., and Bachèlery, M. L. (2019). Propagation of subseasonal equatorially-forced coastal trapped waves down to the Benguela upwelling system. Sci. Rep. 9, 1–10. doi: 10.1038/s41598-019-41847-1
Imawaki, S., Bower, A. S., Beal, L. M., and Qiu, B. (2013). “Western boundary currents,” in Ocean Circulation and Climate, eds G. Siedler, S. Griffies, J. Gould, and J. Church (Florida, FL: Academic Press), 305–338.
Imbol Koungue, R. A., Rouault, M., Illig, S., Brandt, P., and Jouanno, J. (2019). Benguela Niños and Benguela Niñas in forced ocean simulation from 1958 to 2015. J. Geophys. Res. Oceans 124, 5923–5951. doi: 10.1029/2019JC015013
Jackson, J. M., Rainville, L., Roberts, M. J., McQuaid, C. D., and Lutjeharms, J. R. E. (2012). Mesoscale bio-physical interactions between the Agulhas Current and the Agulhas Bank, South Africa. Cont. Shelf Res. 49, 10–24. doi: 10.1016/j.csr.2012.09.005
Kersalé, M., Lamont, T., Speich, S., Terre, T., Laxenaire, R., Roberts, M. J., et al. (2018). Moored observations of mesoscale features in the Cape Basin: characteristics and local impacts on water mass distributions. Ocean Sci. 14, 923–945. doi: 10.5194/os-14-923-2018
Kobayashi, S., Ota, Y., Harada, Y., Ebita, A., Moriya, M., Onoda, H., et al. (2015). The JRA-55 reanalysis: General specifications and basic characteristics. J. Meteorol. Soc. Jpn. Ser. II 93, 5–48. doi: 10.2151/jmsj.2015-001
Koseki, S., Keenlyside, N., Demissie, T., et al. (2018). Causes of the large warm bias in the Angola–Benguela Frontal Zone in the Norwegian Earth System Model. Clim. Dyn. 50, 4651–4670. doi: 10.1007/s00382-017-3896-2
Krug, M., and Tournadre, J. (2012). Satellite observations of an annual cycle in the Agulhas Current. Geophys. Res. Lett. 39:L15607. doi: 10.1029/2012GL052335
Krug, M., Tournadre, J., and Dufois, F. (2014). Interactions between the Agulhas Current and the eastern margin of the Agulhas Bank. Cont. Shelf Res. 81, 67–79. doi: 10.1016/j.csr.2014.02.020
Lachkar, Z., and Gruber, N. (2012). A comparative study of biological production in eastern boundary upwelling systems using an artificial neural network. Biogeosciences 9, 293–308. doi: 10.5194/bg-9-293-2012
Lamont, T., Hutchings, L., Van Den Berg, M. A., Goschen, W. S., and Barlow, R. G. (2015). Hydrographic variability in the S t. Helena Bay region of the southern Benguela ecosystem. J. Geophys. Res. Oceans 120, 2920–2944. doi: 10.1002/2014JC010619
Lellouche, J., Legalloudec, O., Regnier, C., Levier, B., Greiner, E., and Drevillon, M. (2019). “Quality Information Document,” in Copernicus Marine Environmental Monitoring Service (CMEMS) (Toulouse: EU Copernicus Marine Service), 2.
Loveday, B., Durgadoo, J., Reason, C., Biastoch, A., and Penven, P. (2014). Decoupling of the Agulhas leakage from the Agulhas Current. J. Phys. Oceanogr. 44, 1776–1797.
Lutjeharms, J. R. E. (1989). The role of mesoscale turbulence in the Agulhas Current system. Oceanogr. Ser. 50, 357–372. doi: 10.1016/S0422-9894(08)70196-X
Lutjeharms, J. R. E., and Roberts, H. R. (1988). The Natal pulse: An extreme transient on the Agulhas Current. J. Geophys. Res. 93, 631–645. doi: 10.1029/JC093iC01p00631
Lutjeharms, J. R. E., and van Ballegooyen, R. C. (1988). Anomalous upstream retroflection in the Agulhas Current. Science 240, 1770–1772. doi: 10.1126/science.240.4860.1770
Lutjeharms, J. R. E., Baird, D., and Hunter, I. T. (1986). Seeoppervlak dryfgedrag aan die Suid-Afrikaanse suidkus in 1979. S. Afri. J. Sci. 82, 324–326.
Lutjeharms, J. R. E., Boebel, O., and Rossby, T. (2003a). Agulhas cyclones. Deep Sea Res. II 50, 13–34. doi: 10.1016/S0967-0645(02)00378-8
Lutjeharms, J. R. E., Boebel, O., van der Vaart, P. C., de Ruijter, W. P., Rossby, T., and Bryden, H. L. (2001). Evidence that the Natal Pulse involves the Agulhas Current to its full depth. Geophys. Res. Lett. 28, 3449–3452. doi: 10.1029/2000GL012639
Lutjeharms, J. R. E., Cooper, J., and Roberts, M. (2000). Upwelling at the inshore edge of the Agulhas Current. Cont. Shelf Res. 20, 737–761. doi: 10.1016/S0278-4343(99)00092-8
Lutjeharms, J. R. E., De Ruijter, W. P. M., and Peterson, R. G. (1992). Interbasin exchange and the Agulhas retroflection; the development of some oceanographic concepts. Deep Sea Res. Part I Oceanogr. Res. Pap. 39, 1791–1807. doi: 10.1016/0198-0149(92)90029-S
Lutjeharms, J. R. E., Penven, P., and Roy, C. (2003b). Modelling the shear edge eddies of the southern Agulhas Current. Cont. Shelf Res. 23, 1099–1115. doi: 10.1016/S0278-4343(03)00106-7
Malan, N., Backeberg, B., Biastoch, A., Durgadoo, J. V., Samuelsen, A., Reason, C., et al. (2018). Agulhas Current Meanders facilitate shelf-slope exchange on the Eastern Agulhas Bank. J. Geophys. Res.Oceans 123, 4762–4778. doi: 10.1029/2017JC013602
McDougall, T. J., and Barker, P. M. (2011). Getting started with TEOS-10 and the Gibbs Seawater (GSW) oceanographic toolbox. Berlin: ResearchGate, 605–619.
McMonigal, K., Beal, L. M., Elipot, S., Gunn, K. L., Hermes, J., Morris, T., et al. (2020). The impact of meanders, deepening and broadening, and seasonality on Agulhas Current temperature variability. J. Phys. Oceanogr. 50, 3529–3544. doi: 10.1175/JPO-D-20-0018.1
Nelson, G. (1989). “Poleward Motion in the Benguela Area,” in Poleward Flows Along Eastern Ocean Boundaries. Coastal and Estuarine Studies (formerly Lecture Notes on Coastal and Estuarine Studies), Vol. 34, eds S. J. Neshyba, C. N. K. Mooers, R. L. Smith, and R. T. Barber (New York, NY: Springer), doi: 10.1007/978-1-4613-8963-7_10
Nkwinkwa Njouodo, A. S., Koseki, S., Keenlyside, N., and Rouault, M. (2018). Atmospheric signature of the Agulhas Current. Geophys. Res. Lett. 45, 5185–5193. doi: 10.1029/2018GL077042
Oke, P. R., Griffin, D. A., Schiller, A., Matear, R. J., Fiedler, R., Mansbridge, J., et al. (2013). Evaluation of a near-global eddy-resolving ocean model. Geosci. Model Dev. 6, 591–615. doi: 10.5194/gmd-6-591-2013
Patara, L., Böning, C. W., and Biastoch, A. (2016). Variability and trends in Southern Ocean eddy activity in 1/12 ocean model simulations. Geophys. Res. Lett. 43, 4517–4523. doi: 10.1002/2016GL069026
Penven, P., Claude, R. O. Y., De Verdière, A. C., and Largier, J. (2000). Simulation of a coastal jet retention process using a barotropic model. Oceanol. Acta 23, 615–634. doi: 10.1016/S0399-1784(00)01106-3
Pichevin, T., Herbette, S., and Floc’h, F. (2009). Eddy formation and shedding in a separating boundary current. J. Phys. Oceanogr. 39, 1921–1934. doi: 10.1175/2009JPO4151.1
Pivan, X., Krug, M., and Herbette, S. (2016). Observations of the vertical and temporal evolution of a natal pulse along the eastern Agulhas Bank. J. Geophys. Res. Oceans 121, 7108–7122. doi: 10.1002/2015JC011582
Pujol, M. I., and Mertz, F. (2019). Product user manual for sea level sla products. Toulouse: EU Copernicus Marine Service.
Quilfen, Y., Yurovskaya, M., Chapron, B., and Ardhuin, F. (2018). Storm waves focusing and steepening in the Agulhas current: Satellite observations and modeling. Rem. Sens. Env. 216, 561–571. doi: 10.1016/j.rse.2018.07.020
Richter, I. (2015). Climate model biases in the eastern tropical oceans: causes, impacts and ways forward. WIREs Clim. Change 6, 345–358. doi: 10.1002/wcc.338
Richter, I., Behera, S., Masumoto, Y., Taguchi, B., Komori, N., and Yamagata, T. (2010). On the triggering of Benguela Niños - remote equatorial vs. local influences. Geophys. Res. Lett. 37:L20604. doi: 10.1029/2010GL0444461
Ridderinkhof, W., Le Bars, D., Von, der Heydt, A. S., and De Ruijter, W. P. M. (2013). Dipoles of the south east Madagascar current. Geophys. Res. Lett. 40, 558–562. doi: 10.1002/grl.50157
Rio, M. H., Mulet, S., and Picot, N. (2014). Beyond GOCE for the ocean circulation estimate: synergetic use of altimetry, gravimetry, and in situ data provides new insight into geostrophic and Ekman currents. Geophys. Res. Lett. 41, 8918–8925. doi: 10.1002/2014GL061773
Roberts, M. J. (1990). Dispersion of a buoyant effluent discharged into the nearshore waters of Algoa Bay. M.Sc. thesis. Port Elizabeth: University of Port Elizabeth, 287.
Roberts, M. J. (2010). Coastal currents and temperatures along the eastern region of Algoa Bay, South Africa, with implications for transport and shelf-bay water exchange. Afri. J. Sci. 32, 145–161. doi: 10.2989/1814232X.2010.481153
Roberts, M. J., and Mullon, C. (2010). First Lagrangian ROMS–IBM simulations indicate large losses of chokka squid Loligo reynaudii paralarvae from South Africa’s Agulhas Bank. Afri. J. Mar. Sci. 32, 71–84. doi: 10.2989/18142321003714518
Roberts, M. J. Van der Lingen, C. D., and Whittle, C., and Van den Berg, M. (2010). Shelf currents, lee-trapped and transient eddies on the inshore boundary of the Agulhas Current, South Africa: their relevance to the KwaZulu-Natal sardine run. Afr. J. Sci., 32, 423–447. doi: 10.2989/1814232X.2010.512655
Rouault, M., Illig, S., Lubbecke, J., and Koungue, R. (2017). Origin, development and demise of the 2010–2011 Benguela Niño. J. Mar. Sys. 188, 39–48. doi: 10.1016/j.jmarsys.2017.07.007
Russo, C. S., Lamont, T., and Krug, M. (2021). Spatial and temporal variability of the Agulhas Retroflection: Observations from a new objective detection method. Rem. Sens. Env. 253:112239. doi: 10.1016/j.rse.2020.112239
Russo, C. S., Lamont, T., Tutt, G. C. O., van den Berg, M. A., and Barlow, R. G. (2019). Hydrography of a shelf ecosystem inshore of a major Western Boundary Current. Estuar. Coast. Shelf Sci. 228:106363. doi: 10.1016/j.ecss.2019.106363
Santora, J. A., Sydeman, W. J., Schroeder, I. D., Reiss, C. S., Wells, B. K., Field, J. C., et al. (2012). Krill space: a comparative assessment of mesoscale structuring in polar and temperate marine ecosystems. ICES J. Mar. Sci. 69, 1317–1327. doi: 10.1093/icesjms/fss048
Schumann, E. H. (1998). The coastal ocean off southeast Africa, including Madagascar. Sea 11, 557–582.
Schumann, E. H. (1999). Wind-driven mixed layer and coastal upwelling processes off the south coast of South Africa. J. Mar. Res. 57, 671–691. doi: 10.1357/002224099321549639
Schumann, E. H., and Beekman, L. J. (1984). Ocean temperature structures on the Agulhas Bank. Trans. R. Soc. South Afr. 45, 191–203. doi: 10.1080/00359198409519483
Schumann, E. H., and Martin, J. A. (1991). Climatological aspects of the coastal wind field at Cape Town, Port Elizabeth and Durban. S. Afr. Geogr. J. 73, 48–51. doi: 10.1080/03736245.1991.9713548
Schumann, E. H., Churchill, J. R. S., and Zaayman, H. J. (2005). Oceanic variability in the western sector of Algoa Bay, South Africa. Afri. J. Mar. Sci. 27, 65–80. doi: 10.2989/18142320509504069
Shannon, L. V. (2001). “Benguela Current,” in Encyclopedia of Ocean Sciences, eds J. H. Steele, S. A. Thorpe, and K. K. Turekian (Amsterdam: Academic Press).
Small, R. J., Curchitser, E., Hedstrom, K., Kauffman, B., and Large, W. G. (2015). The Benguela Upwelling System: Quantifying the Sensitivity to Resolution and Coastal Wind Representation in a Global Climate Model. J. Clim. 28, 9409–9432. doi: 10.1175/JCLI-D-15-0192.1
Szekely, T., Gourrion, J., Pouliquen, S., and Reverdin, G. (2019). The CORA 5.2 dataset for global in situ temperature and salinity measurements: data description and validation. Ocean Sci. 15, 1601–1614. doi: 10.5194/os-15-1601-2019
Tsugawa, M., and Hasumi, H. (2010). Generation and growth mechanism of the Natal Pulse. J. Phys. Oceanogr. 40, 1597–1612. doi: 10.1175/2010JPO4347.1
Ullgren, J. E., van Aken, H. M., Ridderinkhof, H., and De Ruijter, W. P. M. (2012). The hydrography of the Mozambique Channel from six years of continuous temperature, salinity, and velocity observations. Deep Sea Res. Part I Oceanogr. Res. Pap. 69, 36–50. doi: 10.1016/j.dsr.2012.07.003
van Sebille, E., Barron, C. N., Biastoch, A., van Leeuwen, P. J., Vossepoel, F. C., and de Ruijter, W. P. M. (2009). Relating Agulhas leakage to the Agulhas current retroflection location. Ocean Sci. 5, 511–521. doi: 10.5194/os-5-511-2009
Veitch, J. A., and Penven, P. (2017). The role of the Agulhas in the Benguela Current system: A numerical modeling approach. J. Geophys. Res. Oceans 122, 3375–3393. doi: 10.1002/2016JC012247
Veitch, J. A., Hermes, J., Lamont, T., Penven, P., and Dufois, F. (2017). Shelf-edge jet currents in the southern Benguela: a modelling approach. J. Mar. Sys. 188, 27–38. doi: 10.1016/j.jmarsys.2017.09.003
Veitch, J., Penven, P., and Shillington, F. (2009). The Benguela: A laboratory for comparative modeling studies. Prog. Oceanogr. 83, 296–302. doi: 10.1016/j.pocean.2009.07.008
Keywords: ocean reanalysis, model evaluation, Agulhas Current system, Benguela upwelling system, ocean observations, regional processes, regional dynamics
Citation: Russo CS, Veitch J, Carr M, Fearon G and Whittle C (2022) An Intercomparison of Global Reanalysis Products for Southern Africa’s Major Oceanographic Features. Front. Mar. Sci. 9:837906. doi: 10.3389/fmars.2022.837906
Received: 17 December 2021; Accepted: 11 February 2022;
Published: 11 March 2022.
Edited by:
Zhiyu Liu, Xiamen University, ChinaReviewed by:
Zhongya Cai, University of Macau, Macao SAR, ChinaJianing Wang, Institute of Oceanology (CAS), China
Weiwei Zhang, Xiamen University, China
Copyright © 2022 Russo, Veitch, Carr, Fearon and Whittle. This is an open-access article distributed under the terms of the Creative Commons Attribution License (CC BY). The use, distribution or reproduction in other forums is permitted, provided the original author(s) and the copyright owner(s) are credited and that the original publication in this journal is cited, in accordance with accepted academic practice. No use, distribution or reproduction is permitted which does not comply with these terms.
*Correspondence: Cristina Serena Russo, Y3Jpc3RpbmFzZXJlbmFydXNzb0BnbWFpbC5jb20=