 Zhongming Lu
 Liuqian Yu
 Jianping Gan
- 1Division of Environment and Sustainability, The Hong Kong University of Science and Technology, Hong Kong, Hong Kong SAR, China
- 2Division of Thrust of Earth, Ocean and Atmospheric Sciences, The Hong Kong University of Science and Technology, Guangzhou, China
- 3Southern Marine Science and Engineering Guangdong Laboratory, Zhuhai, China
Eutrophication-driven hypoxia is one of the reasons for the deterioration of coastal waters, especially those adjacent to densely inhabited urban cities. Thus, effective hypoxia management is urgently needed, and quantitative knowledge of factors controlling hypoxia is required. A case in point is the coastal water around Hong Kong, a megacity that has over 7.5 million residents and is located downstream of the large and nutrient-rich Pearl River. The Victoria Harbour (VH) is the core area of Hong Kong water and has been suffering from marine environment deterioration for years because of external biogeochemical influxes from adjacent waters and internal physical and biogeochemical responses. Three channels orienting from south to north (C1), southeast to northwest (C2), and west to east (C3) connect the VH to adjacent waters and serve as the primary exchange pathways for water mass and biogeochemical substances. Using observational data and a coupled physical–biogeochemical model, we showed that the northward transport of low dissolved oxygen (DO) water from the coastal transition zone by the shoreward bottom current mainly through C1 directly contributes to the hypoxia formation in VH. The external influx of anthropogenic nutrients and organic matter through C2 further enhances the bottom water hypoxia in VH by stimulating phytoplankton bloom and microbial consumption of oxygen in water columns and sediments. Although the horizontal oxygen influx to VH is weak, the comparatively strong vertical mixing in C3 facilitates the replenishment of bottom water in the VH, mitigating bottom hypoxia. Locally in the VH, sediment oxygen demand is the dominant biogeochemical contributor (~93%) to hypoxia formation, while the contribution of water column remineralization is relatively minor (~6-7%). In general, vertical diffusion serves as the largest source (~57%) of DO in the VH because of the strong vertical DO gradient, whereas vertical motion ranks the second largest source of DO (~24%) and serves as a critical physical factor regulating the oxygen budget of the entire VH. In the spatial constriction area where the vertical DO gradient is weak, the magnitude of vertical motion exceeds vertical diffusion to become the largest source of DO (~48%).
Highlights:
● Hypoxia in the VH is controlled externally by influx from the adjacent shelf and internally by local hydrodynamics and biogeochemical processes.
● External input of low-oxygen shoreward bottom flow from the adjacent shelf directly contributes to hypoxia in the VH.
● External influx of anthropogenic nutrients and organic matter from the Pearl River indirectly enhances hypoxia in VH.
1 Introduction
Hypoxia, also known as the “dead zone” where dissolved oxygen is insufficient to support aquatic life, has spread exponentially in coastal waters worldwide over the past decades. This global expansion of coastal hypoxia has increasingly attracted public attention and scientific interest because coastal hypoxia occurs near big cities adjacent to large rivers, such as the Hudson River (New York), Mississippi River (New Orleans), Changjiang River (Shanghai), Pearl River (Hong Kong), and Ganges River (Dhaka) and can lead to the mass mortality of marine organisms and degradation of marine ecosystems (Diaz and Rosenberg, 2008; Rabouille et al., 2008; Doney, 2010; Rabalais et al., 2014; Breitburg et al., 2018). Except some geographically-restricted basins and upwelling zones, most coastal hypoxic zones are caused by excessive anthropogenic delivery of nutrients and organic matter (OM) (Helly and Levin, 2004; Rabalais et al., 2010; Cai et al., 2011). Excessive nutrient input stimulates phytoplankton blooms in surface water and the accumulation of autochthonous OM in bottom water or sediments, which together with the external input of OM (or allochthonous OM), fuel aerobic remineralization and nitrification processes and consequently deplete dissolved oxygen (DO) in water columns (Dagg et al., 2007; Zhang et al., 2010; He et al., 2014; Rabalais et al., 2014). In addition to local eutrophication, the remote supply of low-DO water from a far field is an important contributor to a large coastal hypoxic zone (Wang et al., 2016; Qian et al., 2017). The relative importance of different sources to the regulation hypoxia often varies spatiotemporally, subject to the control of varying biophysical conditions. Therefore, a quantitative understanding of the relative contributions of various factors to coastal hypoxia formation is essential to the design of scientifically sound management plans for a specific ecosystem.
Hong Kong (HK) waters and adjacent shelves are in the subtropical northern South China Sea (NSCS; Figure 1A). The westerns side of HK waters are connected to the Pearl River Estuary and directly influenced by nutrient-rich freshwater discharge from the Pearl River (Zhai et al., 2005), which is the 17th largest river in the world; ~80% of discharge is generated from the river in the wet season (April–September; Dai et al., 2013). The southern sides of HK waters are linked to the shallow shelf of the NSCS (Figure 1A, Gan et al., 2010), also known as the coastal transition zone (CTZ) that borders the estuary and shelf and is jointly influenced by river plume and coastal upwelling (Li et al., 2020). Finally, the eastern sides of HK waters are represented by the semi-enclosed Mirs Bay, which neighbors the adjacent shelf through its southern entrance (Liu et al., 2018).
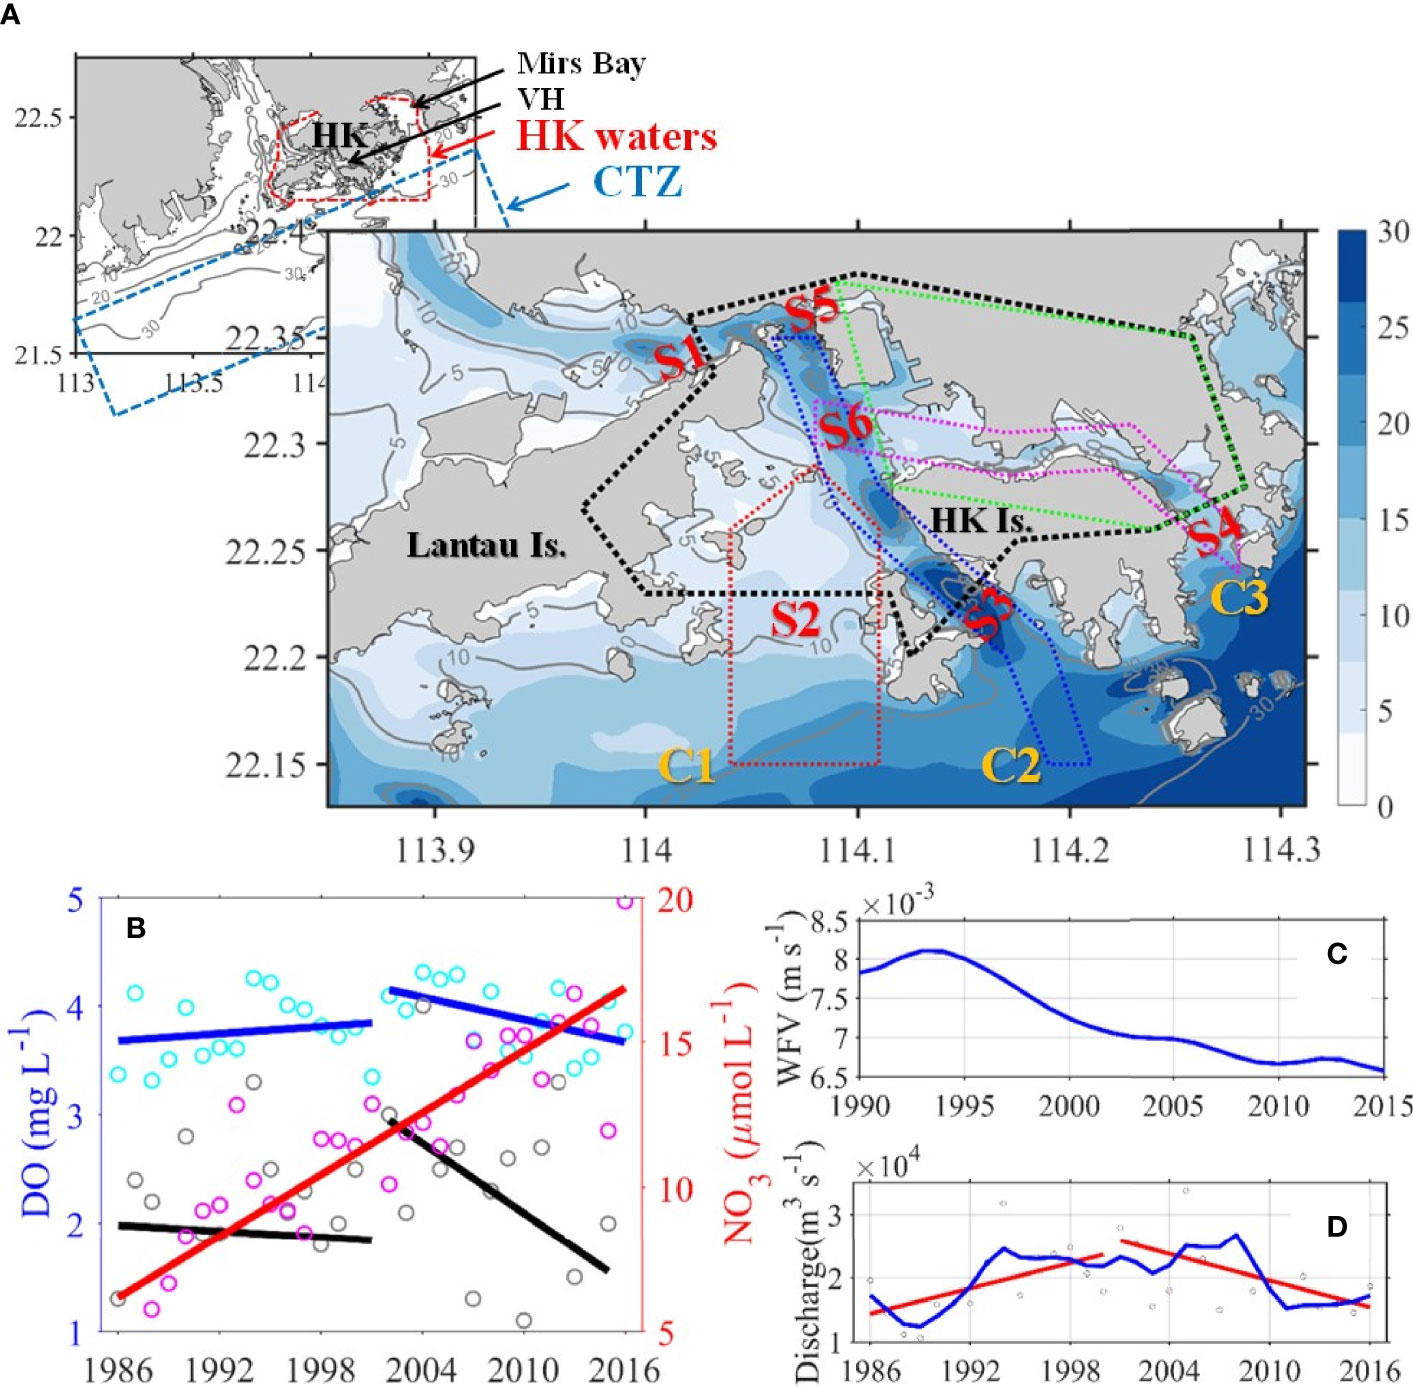
Figure 1 (A) Map with topography and isobaths (in meters) of the study area. In the upper left small map, the waters enclosed by red dashed line is the Hong Kong waters (HKW), the regions enclosed by blue dashed line represent the Coastal Transition Zone (CTZ). In the big map, the area enclosed with black and green dotted lines represents the Greater and Central Victoria Harbour (VH and CVH), respectively. The area enclosed with red, blue, and pink dotted lines indicates Channel 1–3 (also marked with C1-3 in yellow), respectively. S1-6 in red represents sections 1–6, respectively. (B) Time-series (1986–2016) of the surface NO3 (pink open circles represent the mean value of all stations, the red solid line is the trend lines by linear regression) and the bottom DO (cyan open circles represent the mean value of all stations, gray open circles represent the lowest value, blue and black solid lines are trend lines of mean and lowest values, respectively) in the CVH during summer (Jul. and Aug. average). (C) Summer mean wind friction velocity (blue solid line) of WGL (HKO). (D) Summer mean freshwater discharge of Pearl River (grey open circles represent mean value, the blue solid line represents smoothed time-series variation, red solid lines are trend lines), data were obtained from Gaoyao hydrological station.
Lying at the center of HK waters and surrounded by Hong Kong’s dense urban region, the Victoria Harbour (VH) has attracted considerable interest, specifically its water quality. The VH itself is a relatively small area (42 km2) compared with the total HK water area (1651 km2), and thus studies on physical and biogeochemical dynamics in the VH should consider the dynamics in its surrounding waters to reflect the influence of the highly diverse and spatially heterogeneous coastal system and investigate dynamic exchanges and nonlinear local responses to external inputs. Herein, we defined the conventionally recognized Victoria Harbour as the Central VH (CVH) and defined a broad area including the CVH and waters to the southwest of CVH as VH. Under this definition, the VH includes water area connecting the western, southern, and eastern boundaries of HK waters to the CVH through multiple channels. Specifically, channel 1 (C1) connects the VH with the CTZ from the south, channel 2 (C2) runs through the VH from southeast to northwest, and channel 3 (C3) runs through the CVH from west to east (Figure 1A).
The biophysical conditions of the VH and CVH are greatly affected by exchanges of water mass and biogeochemical substances between waters from the outer HK coastal waters and the adjacent estuary and shelf. The region along the coastline of the CVH is the social and economic center of Hong Kong. To maintain and improve the health of HK waters, the Harbour Area Treatment Scheme (HATS) Stage 1 and Stage 2A (https://www.cleanharbour.gov.hk/) were implemented in 2001 and 2015, respectively, to collect and treat 75% and 25% of sewage, respectively, before discharging them into the CVH. The bottom DO in the CVH increased by approximately by10% from 1986 to the full commission of HATS stage 1 in 2001, and thus the temporal variability in bottom DO has shown a decreasing trend since 2001 (Figure 1B).
Understanding the status, trend, and drivers of the DO dynamics in the VH requires the examination of waters in and around the VH, including waters surrounding HK that have unique characteristics. The CTZ waters in southwest HK are jointly controlled by the unique local topography, the Pearl River plume, and the highly variable coastal current (Lui and Chen, 2011; Liu and Gan, 2020). As a result, the CTZ waters have a relatively long residence time, which is driven by the convergence between the seaward-moving freshwaters from the estuary and the shoreward-moving wind-driven shelf circulation (Li et al., 2020). The fast development of industrial and agricultural activities and urbanization in the Pearl River Delta has discharged anthropogenic nutrients and OM into the Pearl River Estuary (PRE; Huang et al., 2003; Callahan et al., 2004; Harrison et al., 2008). Large amounts of riverine nutrients and OM accumulate in the CTZ, promoting severe eutrophication and hypoxia off the southwest HK water (Qian et al., 2018; Li et al., 2020; Yu et al., 2020). In the eastern HK water, Mirs Bay is greatly influenced by the intrusion of coastal waters from the adjacent shelf, where the cold and nutrient-rich deep water can reach the bay through wind-driven cross-shelf transport (Liu et al., 2018).
Although eutrophication and hypoxia in HK waters, including the VH, are long-standing problems (Yin and Harrison, 2007; Xu et al., 2008; Xu et al., 2010), systematic studies are still lacking, and interactive physical-biogeochemical processes controlling hypoxia in HK waters remain unclear. After examining long-term monitoring data collected by the Hong Kong Environmental Protection Department (HK EPD), Qian et al. (2018) suggested that eutrophication is the most plausible driver of hypoxia in the southwestern HK water. By using a process-oriented coupled physical-biogeochemical model, Li et al. (2020) found that the seaward plume and shoreward coastal current converge in the southwestern HK water and form positive cyclonic vorticity and negative divergence; the convergence then leads to long residence time, which facilitates phytoplankton blooming and bottom water hypoxia formation in the southwestern HK water. Using a similar physical-biogeochemical model, Yu et al. (2020) investigated the direct and indirect effects of river-delivered terrestrial OM on hypoxia formation off the PRE and quantified their importance to autochthonous OM in hypoxia development. They showed that riverine nutrients and terrestrial OM are equally important to hypoxia formation in the upstream CTZ, and riverine nutrients stimulating autochthonous OM production are the dominant biological contributors to hypoxia formation in downstream waters, such as HK waters.
The formation mechanism and controlling factors of hypoxia in the VH remain ambiguous. Some studies suggested that eutrophication and hypoxia are relatively weak in the CVH because of strong vertical mixing and high flushing rate (Yin and Harrison, 2007; Xu et al., 2010). One of the most important factors regulating water column mixing is wind force. However, the long-term time-series wind data recorded by the Hong Kong Observatory showed that the wind friction velocity in this area has been decreasing in the past two to three decades (Figure 1C), implying gradually weakening wind-induced vertical mixing. In addition, Xu et al. (2010) indicated that the high river discharge from the Pearl River during summer increases horizontal water velocity and decreases water residence time, consequently suppressing hypoxia formation. Yet, the Pearl River discharge has shown an overall decreasing trend since 2001 (Figure 1D). More importantly, nutrient concentration in river water has increased many times (Figure 1B), and such increase greatly stimulates phytoplankton growth inside and outside the VH.
Biogeochemical activities in the VH are expected to be jointly regulated by external and internal processes. Through observation and by using a calibrated 3D hydrodynamic model, Lee and Qu (2004) showed that a red tide event initiated in the northeast HK water (Mirs Bay) can be transported to the southern HK water by tidal current and wind. Similarly, the recurrently observed hypoxia in the VH in recent years not only may be contributed by local eutrophication due to external nutrient input but also may be directly and indirectly affected by the remote supply of low-DO water and OM. Quantitative knowledge of the relative importance of different regulating factors on hypoxia formation in the VH is lacking.
By combining long-term time-series monitoring data and process-oriented numerical model simulation, this study investigated the status and internal and external control mechanisms of hypoxia in the VH for the first time. The aims were as follows: 1) to explore the spatiotemporal distribution of hypoxia in the VH under the influence of local development, external input, and their synergic effects; 2) to quantify the relative contributions of different sources to hypoxia in the VH; and 3) to link the status of hypoxia in the VH with the changing environment and extend our understanding to a broader context.
2 Methods
This study presents a unique 30-year (1986–2016) monthly physical and biogeochemical data (salinity, temperature, chlorophyll, NO3, and DO) in the VH (www.epd.gov.hk). Sampling was performed at three layers (surface, middle, and bottom). The Hong Kong Observatory (HKO) provided the 1990–2015 hourly wind velocity measured at Waglan Island (WGL) located in the south of HK (http://www.weather.gov.hk). The monthly freshwater discharge based on hydrological station observations of the Pearl River from 1986 to 1999 was provided by Ji Chen (HKU), and the daily discharge data since 1999 were obtained from the Information Center of Water Resources (Bureau of Hydrology, the Ministry of Water Resources of PR China) (http://xxfb.hydroinfo.gov.cn/). The 53% of the total runoff flows into PRE through the upper outlets and the remaining 47% flows into the adjacent coastal water through the lower west outlets (Lu and Gan, 2015).
The physical–biogeochemical model was based on the Regional Ocean Modeling System (ROMS; Shchepetkin and McWilliams, 2005). The model domain links the HK water to the PRE and the adjacent shelf of the northern South China Sea with an orthogonal curvilinear grid system. The horizontal resolution of the model grid ranged from less than ~0.1 km in HK waters to ~1 km in the southern boundary. The model had 30 vertical terrain-following levels. The model used a level 2.5 turbulent closure scheme for vertical mixing (Mellor and Yamada, 1982), a third-order upwind-biased scheme for horizontal momentum advection, and a multidimensional positive definite advection transport algorithm (MPDATA) to approximate the advection terms of tracers. The details of model implementation can be found in the study of Liu and Gan (2020). The biological module was a nitrogen–phosphorus–phytoplankton–zooplankton–detritus ecosystem model adapted by Gan et al. (2014) from a pelagic N cycle model (Fennel et al., 2006). The module was further extended to include the dynamics of terrestrial dissolved and particulate OM by Yu et al. (2020).
The model was forced with spatially uniform but representative southwesterly (upwelling favorable) wind at a wind stress of 0.025 Pa in this process-oriented study. The river discharge was set at 18,400 m3 s−1, a typical summertime value, and diurnally varying solar radiation was implemented with a daily average value of 195 W m−2. Salinity (3 PSU), temperature (28.6°C), nitrate (NO3; 90 mmol m−3), ammonium (NH4; 6 mmol m−3), phosphate (PO4; 1.5 mmol m−3), and DO (90 mmol m−3) in the river water were adopted based on historical data. The initial conditions were derived from data collected by a far-field station. The tidal forcing and external lateral fluxes were implemented using a tidal-subtidal open boundary condition (Liu and Gan, 2020). The detailed model implementation and biophysical parameters can be found in the studies of in Li et al. (2020) and Yu et al. (2020).
The model was run for 50 days. We investigated the processes evolving in time and space, and time-series analyses were focused on the time period after day 25 (Supplementary Figure S1), when physical and biogeochemical conditions reached a quasi-steady state (Li et al., 2020; Liu and Gan, 2020). We then time-averaged the results from day 38 (neap tide) to day 45 (spring tide) to study subtidal responses.
3 Observed and Simulated Biophysical Characteristics
In summer, southwest monsoon prevails in the PRE, and the Pearl River discharge peaks in a year (Dai et al., 2013). Located in the southeast of the the PRE, HK waters receive a large amount of freshwater from the Pearl River through the northeastward propagation of river plume driven by the southwesterly monsoon (Gan et al., 2010). Figure 2 shows the comparison of observed and model-simulated surface salinity (averaged in the 1 m surface, same below), NO3, chlorophyll-a (Chla), and bottom DO (averaged in the 2 m bottom, same below). We averaged the observed data in July from 2010 to 2016 to reflect deteriorating eutrophication and hypoxia in coastal waters adjacent to HK waters in recent years (Lu et al., 2018; Li et al., 2020). Observations and model simulation showed that the surface salinity in the majority of the VH (from <15 PSU to ~30 PSU) was much lower than that in the open ocean, and the low-salinity water mainly covered the northwest and southwest of the VH (Figures 2A, E). Apart from the strong water column stratification caused by buoyancy input (Li et al., 2020), river water delivers large amounts of terrestrial biogenic substances, such as nutrients and OM. Observed and model-simulated NO3 distribution showed extremely high nutrient concentrations and strong west-to-east gradients (Figures 2B, F), reflecting the river contribution. A high nutrient concentration with a favorable hydrological condition likely stimulates phytoplankton bloom (Lu and Gan, 2015), as shown in Figures 2C, G. In a bloom area, DO level in the surface water is extremely high because of intense photosynthesis (Supplementary Figure S2), especially in southwest HK waters, which have favorable physical and biological conditions for phytoplankton growth (Lu and Gan, 2015).
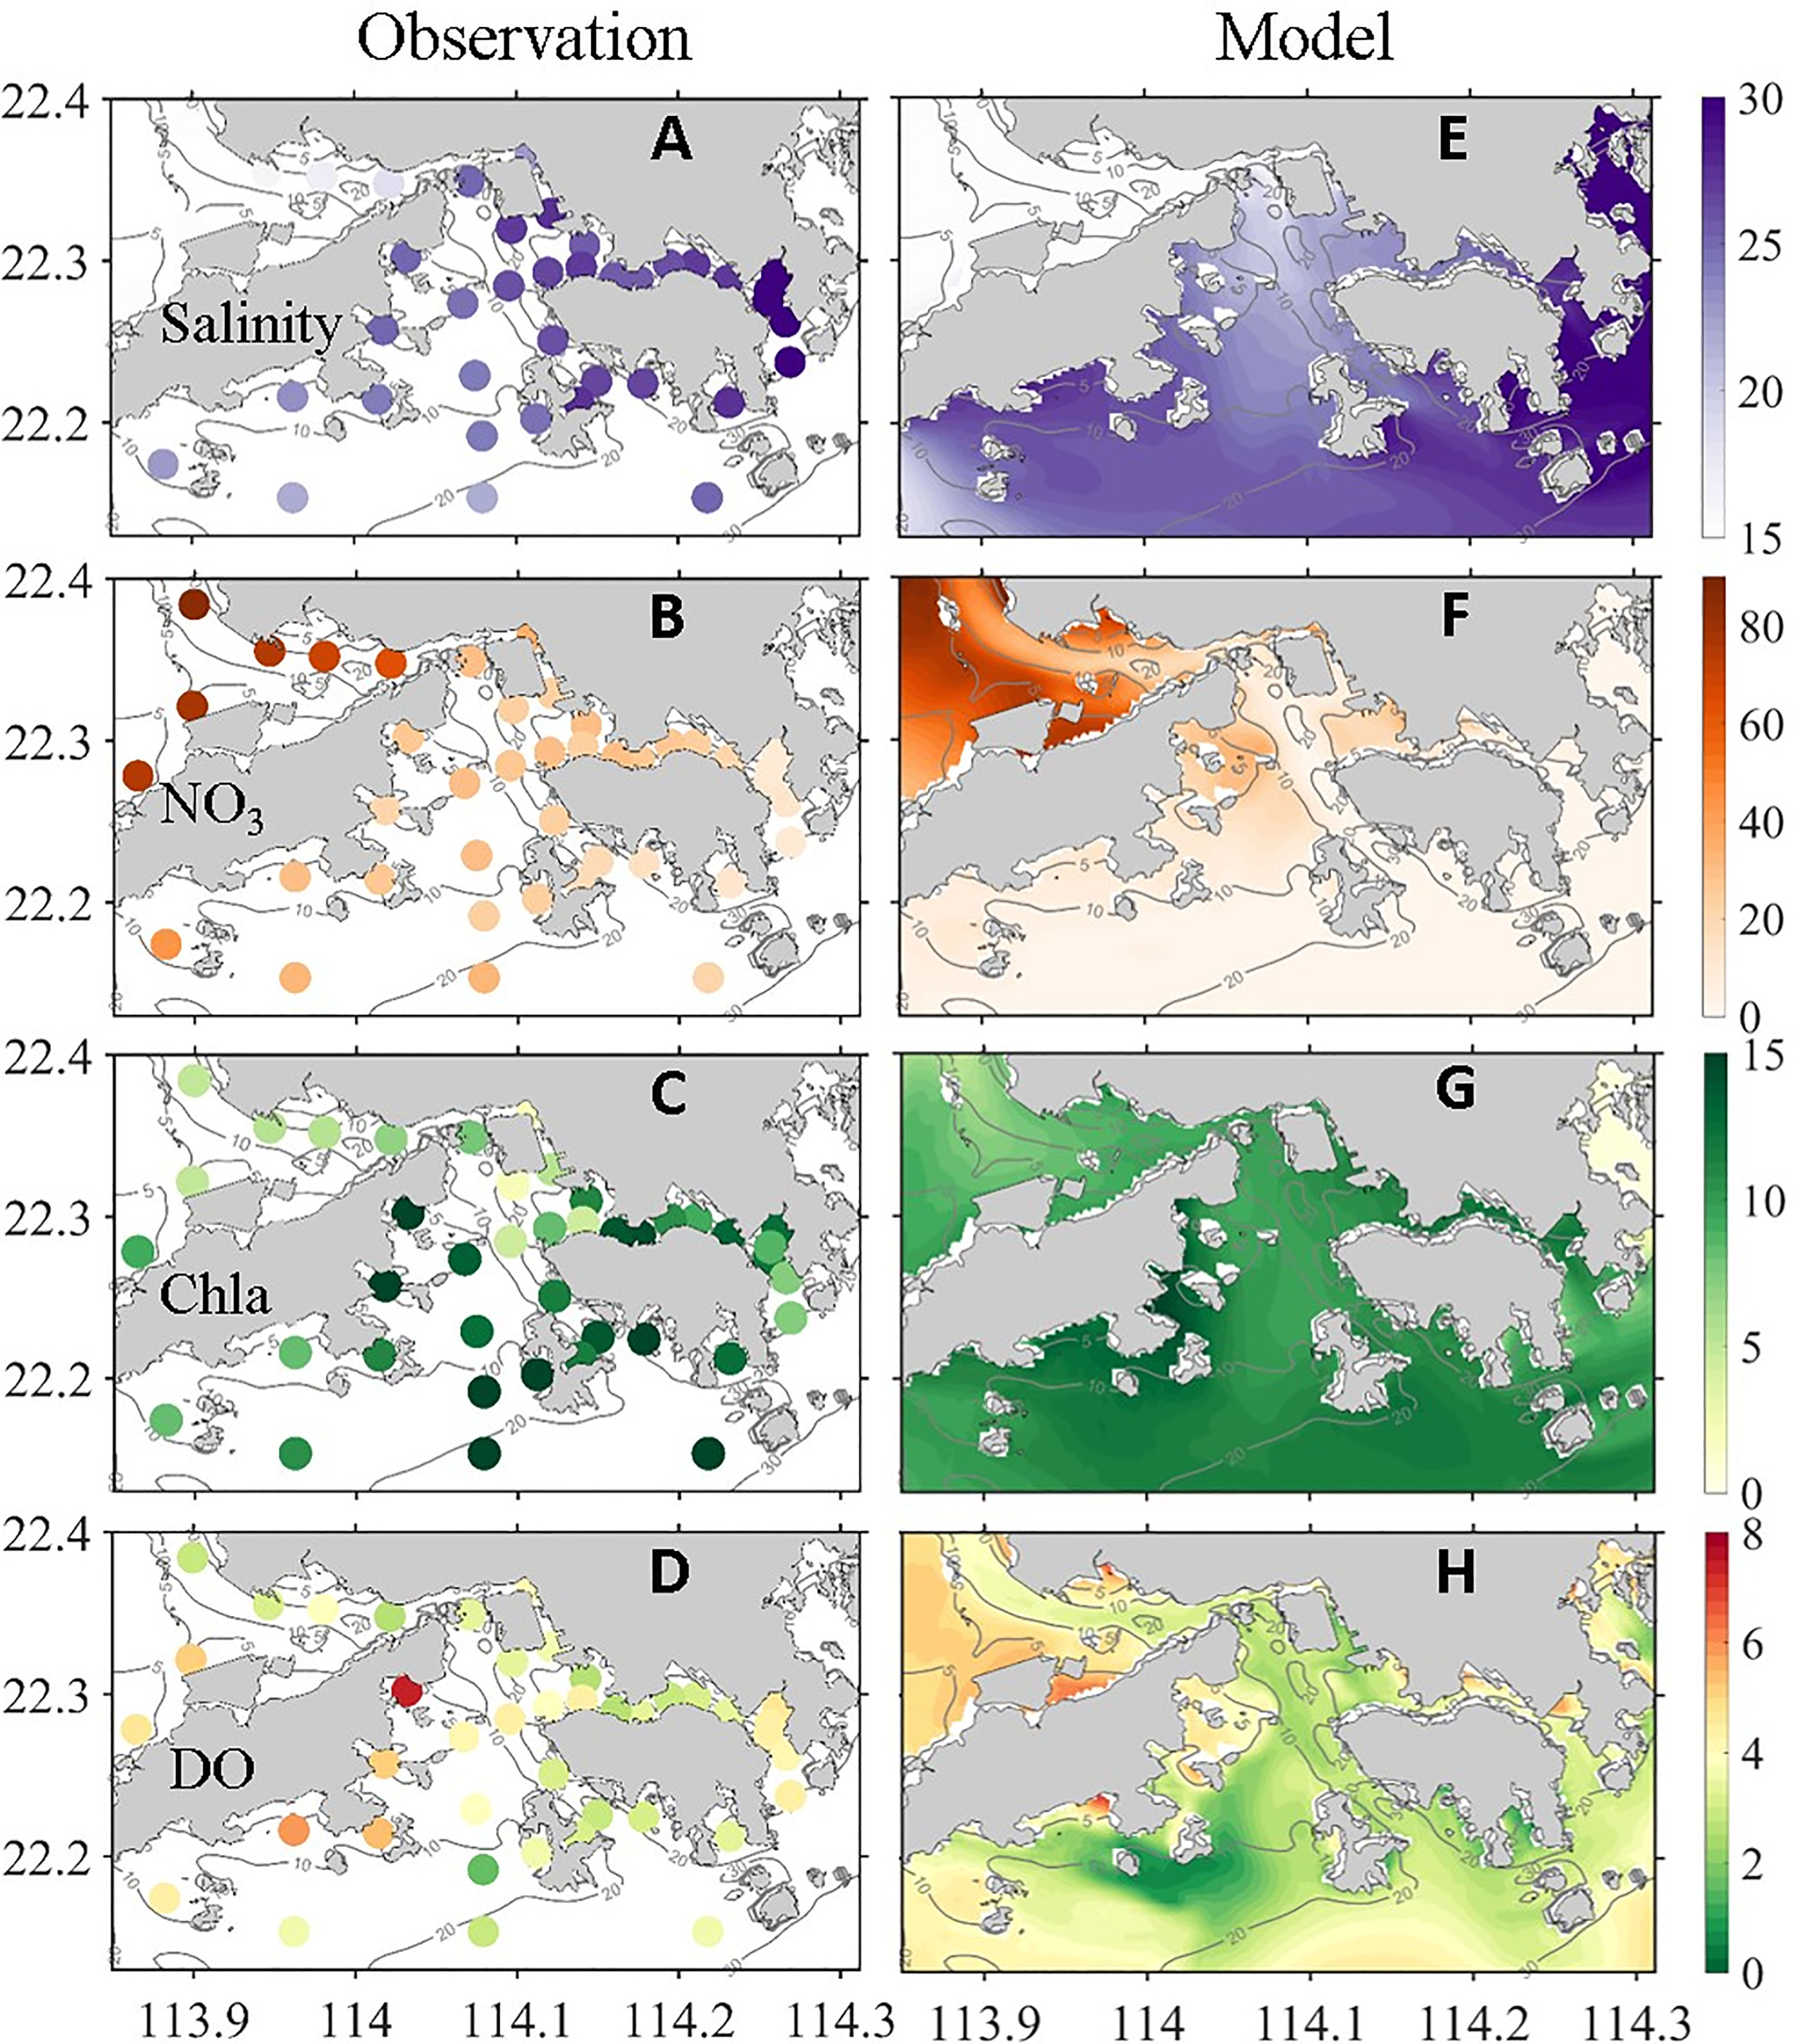
Figure 2 (left column) Observed and (right column) simulated (A, E) surface salinity (PSU), (B, F) surface NO3 (μM L−1), (C, G) surface chlorophyll (μg L−1), and (D, H) bottom DO (mg L−1).
Hypoxia can develop when plankton-derived OM in the upper water sinks to the bottom water or settle in sediments, hydrological conditions are suitable, and oxygen consumption exceeds replenishment (Rabouille et al., 2008). As shown in Figures 1B, and 2D, H, hypoxia was observed and simulated in the bottom water in most of the VH. The lowest DO was observed in the south of the VH because of strong convergence (Li et al., 2020).
In general, the model captured the key features of the observed distributions of different physical and biogeochemical parameters (such as salinity, NO3, Cha, DO) in surface and bottom waters. Some discrepancies between the model results and observations were found. The simulated hypoxia center was located northwest of the observed hypoxia center and had a large spatial extent (Figures 2D, H). Such model–data discrepancy may be partially attributed to the limited sampling coverage and resolution of the observations, and to the steady wind forcing, river discharge, and river nutrient concentration adopted in this process-oriented investigation. Nevertheless, the qualitative similarity between the observations and model results provided a sufficient confidence level for the conduct of a process-oriented investigation on oxygen dynamics and hypoxia in the VH and identification of internal and external physical and biogeochemical forcings.
4 Analysis and Discussion
4.1 Characteristic Distribution of Hypoxia and External and Internal Drivers
Controlled by river plume and summer monsoon, ocean circulation in HK waters and adjacent shelf is characterized by the interaction between wind-driven upwelling circulation and plume dynamics (Gan et al., 2009). The northwest part of the VH is adjacent to the lower PRE, where water flows mainly from north to south in the surface layer are driven by huge volumes of river discharge. When freshwater leaves the mouth of the PRE, the plume flows to the southeast under the influence of the southwesterly wind (Figure 3A; here the tidal signals were eliminated after the model results from day 38 to day 45 were averaged). In the bottom layer, the strong onshore intrusion of deep shelf water predominated the entire area (Figure 3B) because of the persistent upwelling-favorable wind (Liu et al., 2020). Owing to the variable topography, circulation in the VH is more complicated than that in the outer shelf. The most prominent feature was the through-flow along the three channels (C1, C2, and C3) that ran through the entire VH. These channels served as major transportation routes for buoyance, nutrients, and OM, which can indirectly affect the DO level in the VH. Meanwhile, the channels transported low-DO water from the deep shelf outside the VH. This shelf directly modulated the DO distribution inside the VH. Temporal and spatial changes in the velocity fields and biophysical variables in these channels are essential to the understanding of the evolution of hypoxia in the region.
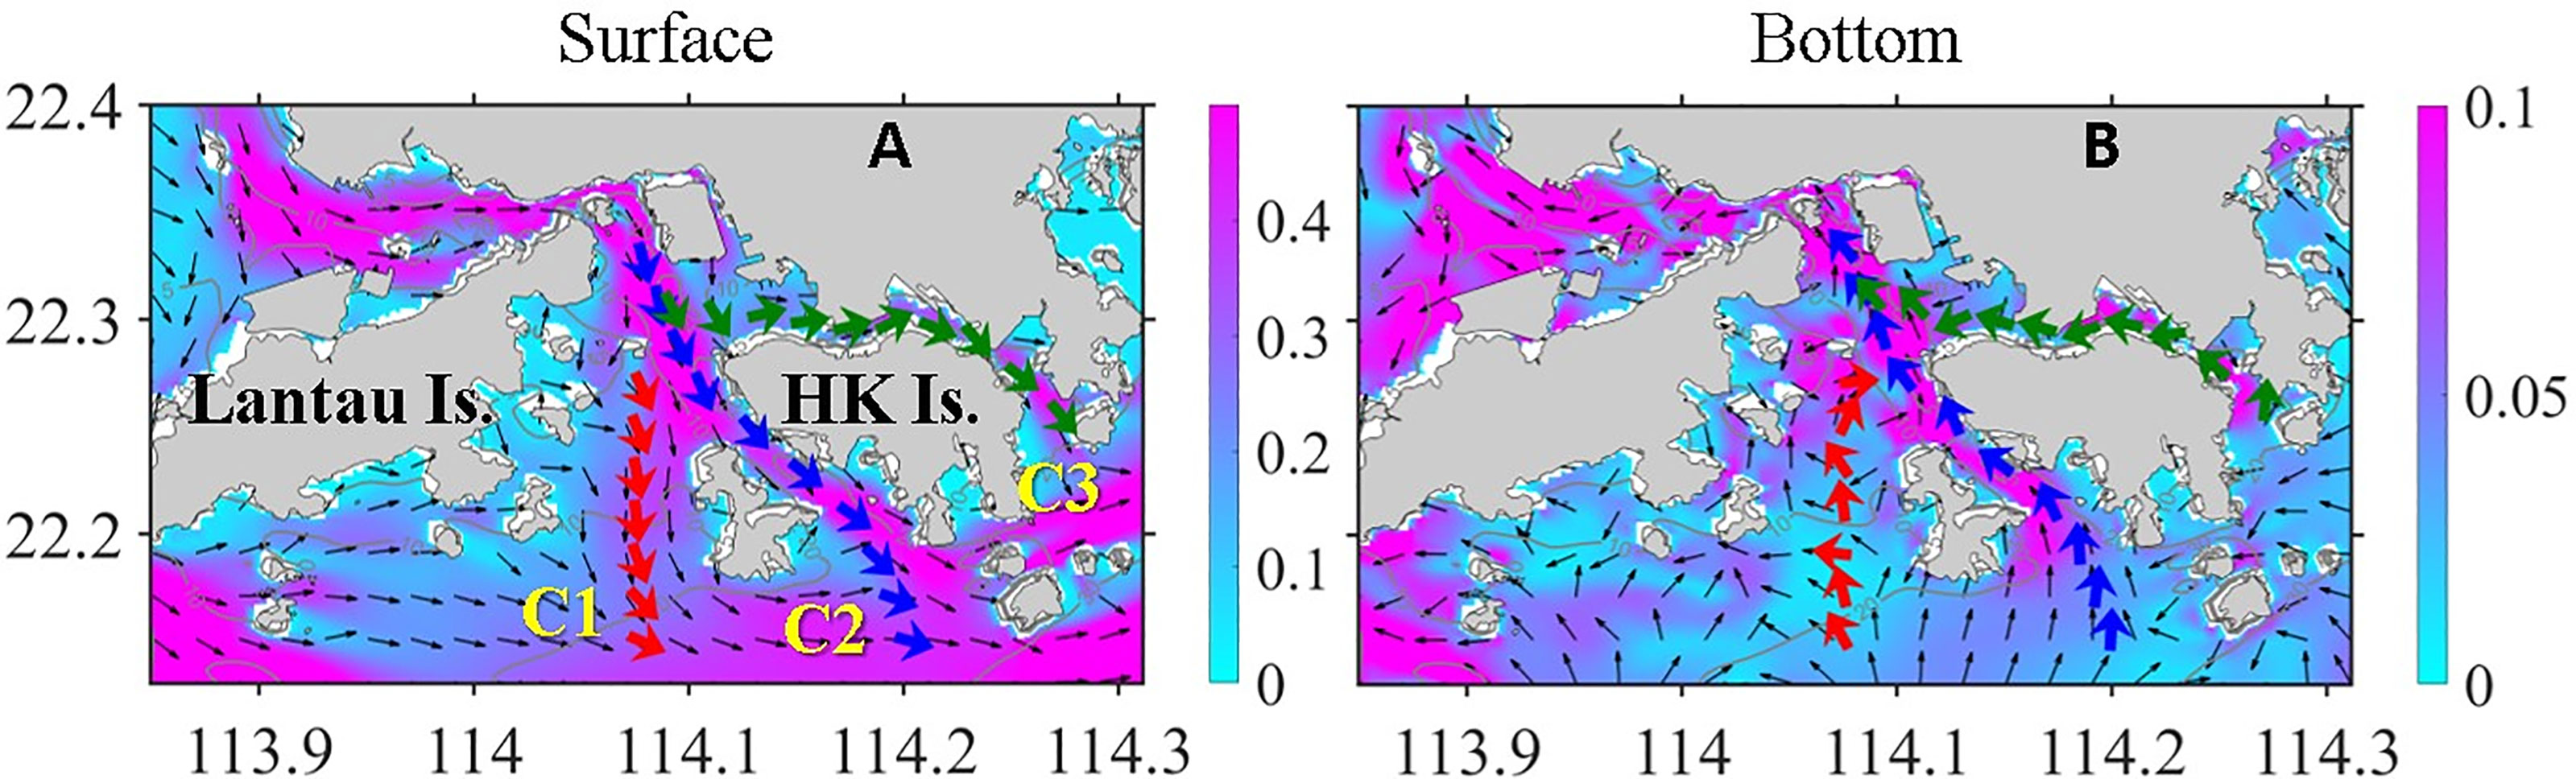
Figure 3 Simulated velocity (m s−1) field at (A) surface and (B) bottom layer averaged from day 38 to day 45. The color contours indicate the magnitude of velocity, and thin black arrows show the direction of velocity. The thick red, blue, and green arrows represent the horizontal integrated velocity in channels C1–3, respectively.
4.1.1 Effect of Externally Intruded Low-DO Water Intrusion Through Channels
Figures 4A–F show the simulated temperature, salinity and along-channel velocity of each channel. The values were averaged on day 40. As indicated by the surface distribution of salinity (Figures 2A, E), the entire VH area was affected by river plumes to varying degrees. River water and the riverine terrestrial substances were imported to the VH mostly through section 1 (S1, Figure 1A), whereas some substances from the south flowed through sections S2 and S3 along C1 and C2, respectively, and reached the VH. Meanwhile, oceanic water entered the VH from the east through C3. All three channels exhibited relatively strong velocity at the surface layer, resulting in a high flushing rate and short residence time, which hindered the accumulation of plankton biomass and prevented phytoplankton bloom (Xu et al., 2010; Lu and Gan, 2015). This result partially explained why the maximum phytoplankton concentration did not appear in the VH during observation and model simulation (Figures 2C, G) despite that the nutrient concentration in this area was higher than that in the downstream river plume (Figures 2B, F).
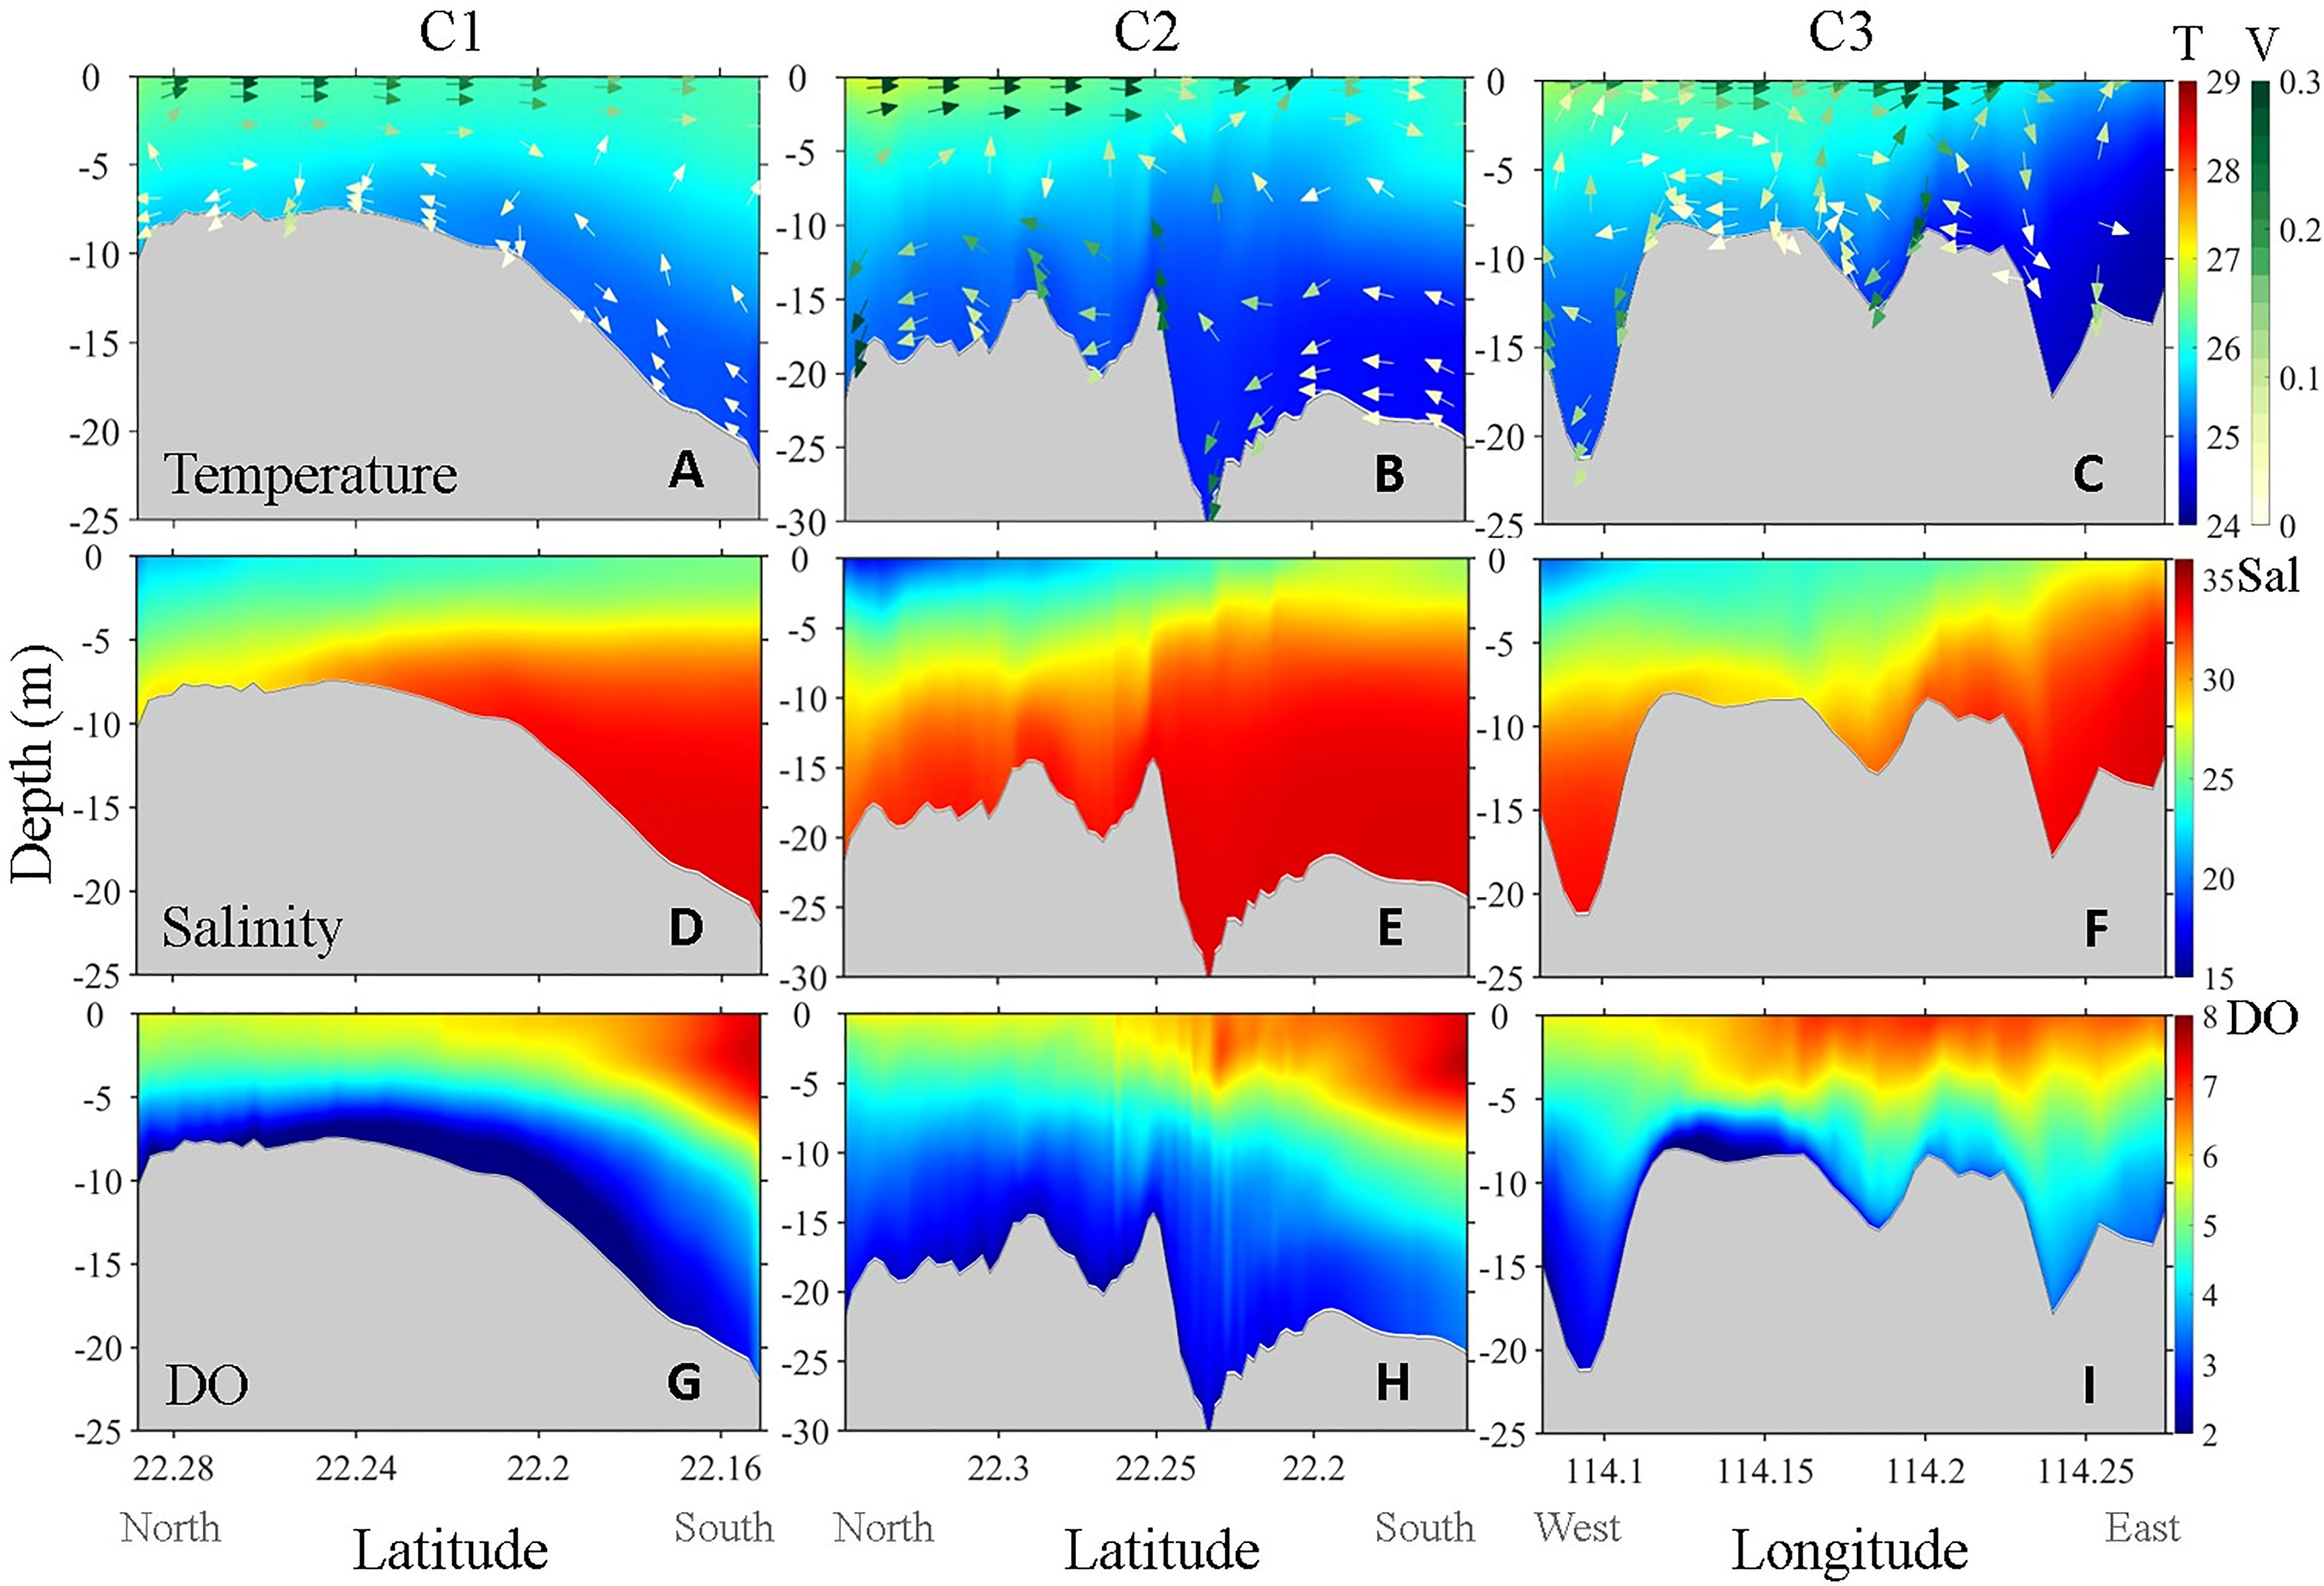
Figure 4 Simulated vertical distribution of (A–C) temperature (°C, upper row), (D–F) salinity (PSU, mid row) and (G–I) DO (mg L−1 , lower row) along Channel C1 (left column), C2 (mid column), and C3 (right column) on day 40. The colored arrows superimposed on the color contour are the along-channel velocity field (m s−1 ). The color bar located at the inner right side denotes temperature (upper row), salinity (mid row) and DO (lower row), and the color bar located at the outer right side denotes the current velocity.
Compared with surface circulation, bottom circulation and vertical circulations were more complicated as they are strongly influenced by variable topography. C1 was the widest and shallowest channel and thus had a relatively weak bottom velocity and strong vertical stratification (Figure 4A). C2 was the deepest channel and was generally narrow except in its southeast end. Thus, C2 had the strongest bottom current and showed a strong vertical velocity shear leading to an apparent vertical mixing along the variable terrain (Figure 4B). C3 ran through the entire CVH from west to east. In contrast to the other two channels that generally connect deep to shallow terrains, C3 was deep at both ends but relatively shallow in the middle. The intensity of the along-channel bottom velocity in C3 was between those of C1 and C2, but the vertical mixing in the entire channel of C3 was extremely strong (Figure 4C) and likely associated with strong anticyclonic circulation in Mirs Bay (Liu et al., 2018).
The vertical distributions of temperature and salinity along the channels clearly showed the large gradient between VH embayment and the outer shelf. Transported by the onshore cross-isobaths upwelling current, the cold deep water intruded the VH from the shelf (Liu et al., 2020), as shown by the vertical distribution of temperature and salinity in C1 and C2 (Figures 4A, B, D, E). Owing to the weakest along-channel up-slope bottom current, the cold water intrusion in C1 was much slower than that in C2. In C3, the direction of the bottom current was from east to west, but the horizontal transport capacity was limited because of the strong vertical mixing (Figures 4C, F).
The intrusion of low-DO deep water through the channels was the major external source that directly contributed to hypoxia inside the VH. Similar to temperature, the vertical distributions of DO in the channels were regulated by transport and mixing and further modulated by biogeochemical processes (Figures 4G-I). Along C1, the relatively weak bottom velocity and well-stratified water column enhanced hypoxia in the southern half of the channel (latitude around 22.2, Figures 2D, H). The low-DO center in C1 was observed further north of the low-temperature high-salinity center (Figures 4A, D, G), indicating that the hypoxia in the VH was affected not only by the external low-DO input but also by local biogeochemical processes. DO along C2 was relatively high because of the strong vertical velocity shear induced by the strongest bottom current, and thus no obvious low-DO center was observed in this channel. The low-DO water at the east end of C3 hardly migrated beyond the middle bulge of the channel. The lowest DO concentration was observed in the western part of C3 and spread further westward following the bottom current (Figure 4I).
Through observation and by using a calibrated 3D hydrodynamic model, Lee and Qu (2004) found that red tide initiated in Mirs Bay, far from the VH, can be transported to southern HK waters. Their findings were in line with ours, demonstrating that the biophysical condition in the VH is greatly affected by the external flows and biogeochemical substances of surrounding estuary, bays, and shelves. Circulation in the three channels and their connections with the outer shelf highlight the importance of external forcing to the development and distribution of hypoxia in the VH.
4.1.2 Role of Local Physical–Biogeochemical Processes
The spatial distribution of hypoxia in the VH is spatially heterogeneous (Figures 2D, H) and is controlled by the direct low-DO water influx and the spatial distribution of oxygen-consuming OM within the VH. OM that enters the VH-crossing sections in different channels is remineralized during its migration and deposition. The spatial and temporal distributions of OM settling and DO (and hypoxia) are largely determined by OM distribution.
Figure 5 shows the vertical distribution of DO and the major types of OM in the VH. Notably, the vertical distributions shown in Figure 5 were created by ordering all model grid cells (vertical water columns) in the VH from shallow to deep bathymetry instead of along a real section. Compared with other types of OM, phytoplankton has high concentrations mostly in waters shallower than 5 m and in the upper parts of water columns (Figure 5A). Such distribution pattern is the combined result of nutrient supply, vertical penetration of photosynthetic active radiation, water column stability, and residence time (Lu and Gan, 2015; Li et al., 2020). Unlike the phytoplankton, the large detritus (i.e., large organic particles from the aggregation of phytoplankton with small detritus) spread over the bottom in the entire region with high concentration. This region was located in the bottom layer at a water depth between 5 and 8 m (Figure 5B). By contrast, the concentration of river-delivered particulate OM (RPOM) rapidly declined from the entrance of the estuary seaward along the path of the plume (Yu et al., 2020) and was also primarily concentrated only in the bottom layer at a water depth between 5 and 8 m (Figure 5C). The resultant distribution of DO reflected the distribution pattern of total OM, which was superimposed on the direct low-DO deep water input (as shown in next section, Figure 7). Subsequently, a hypoxia center developed at a water depth between 5 and 8 m, and widespread low-DO zones appeared in waters with bathymetry greater than 10 m (Figure 5D).
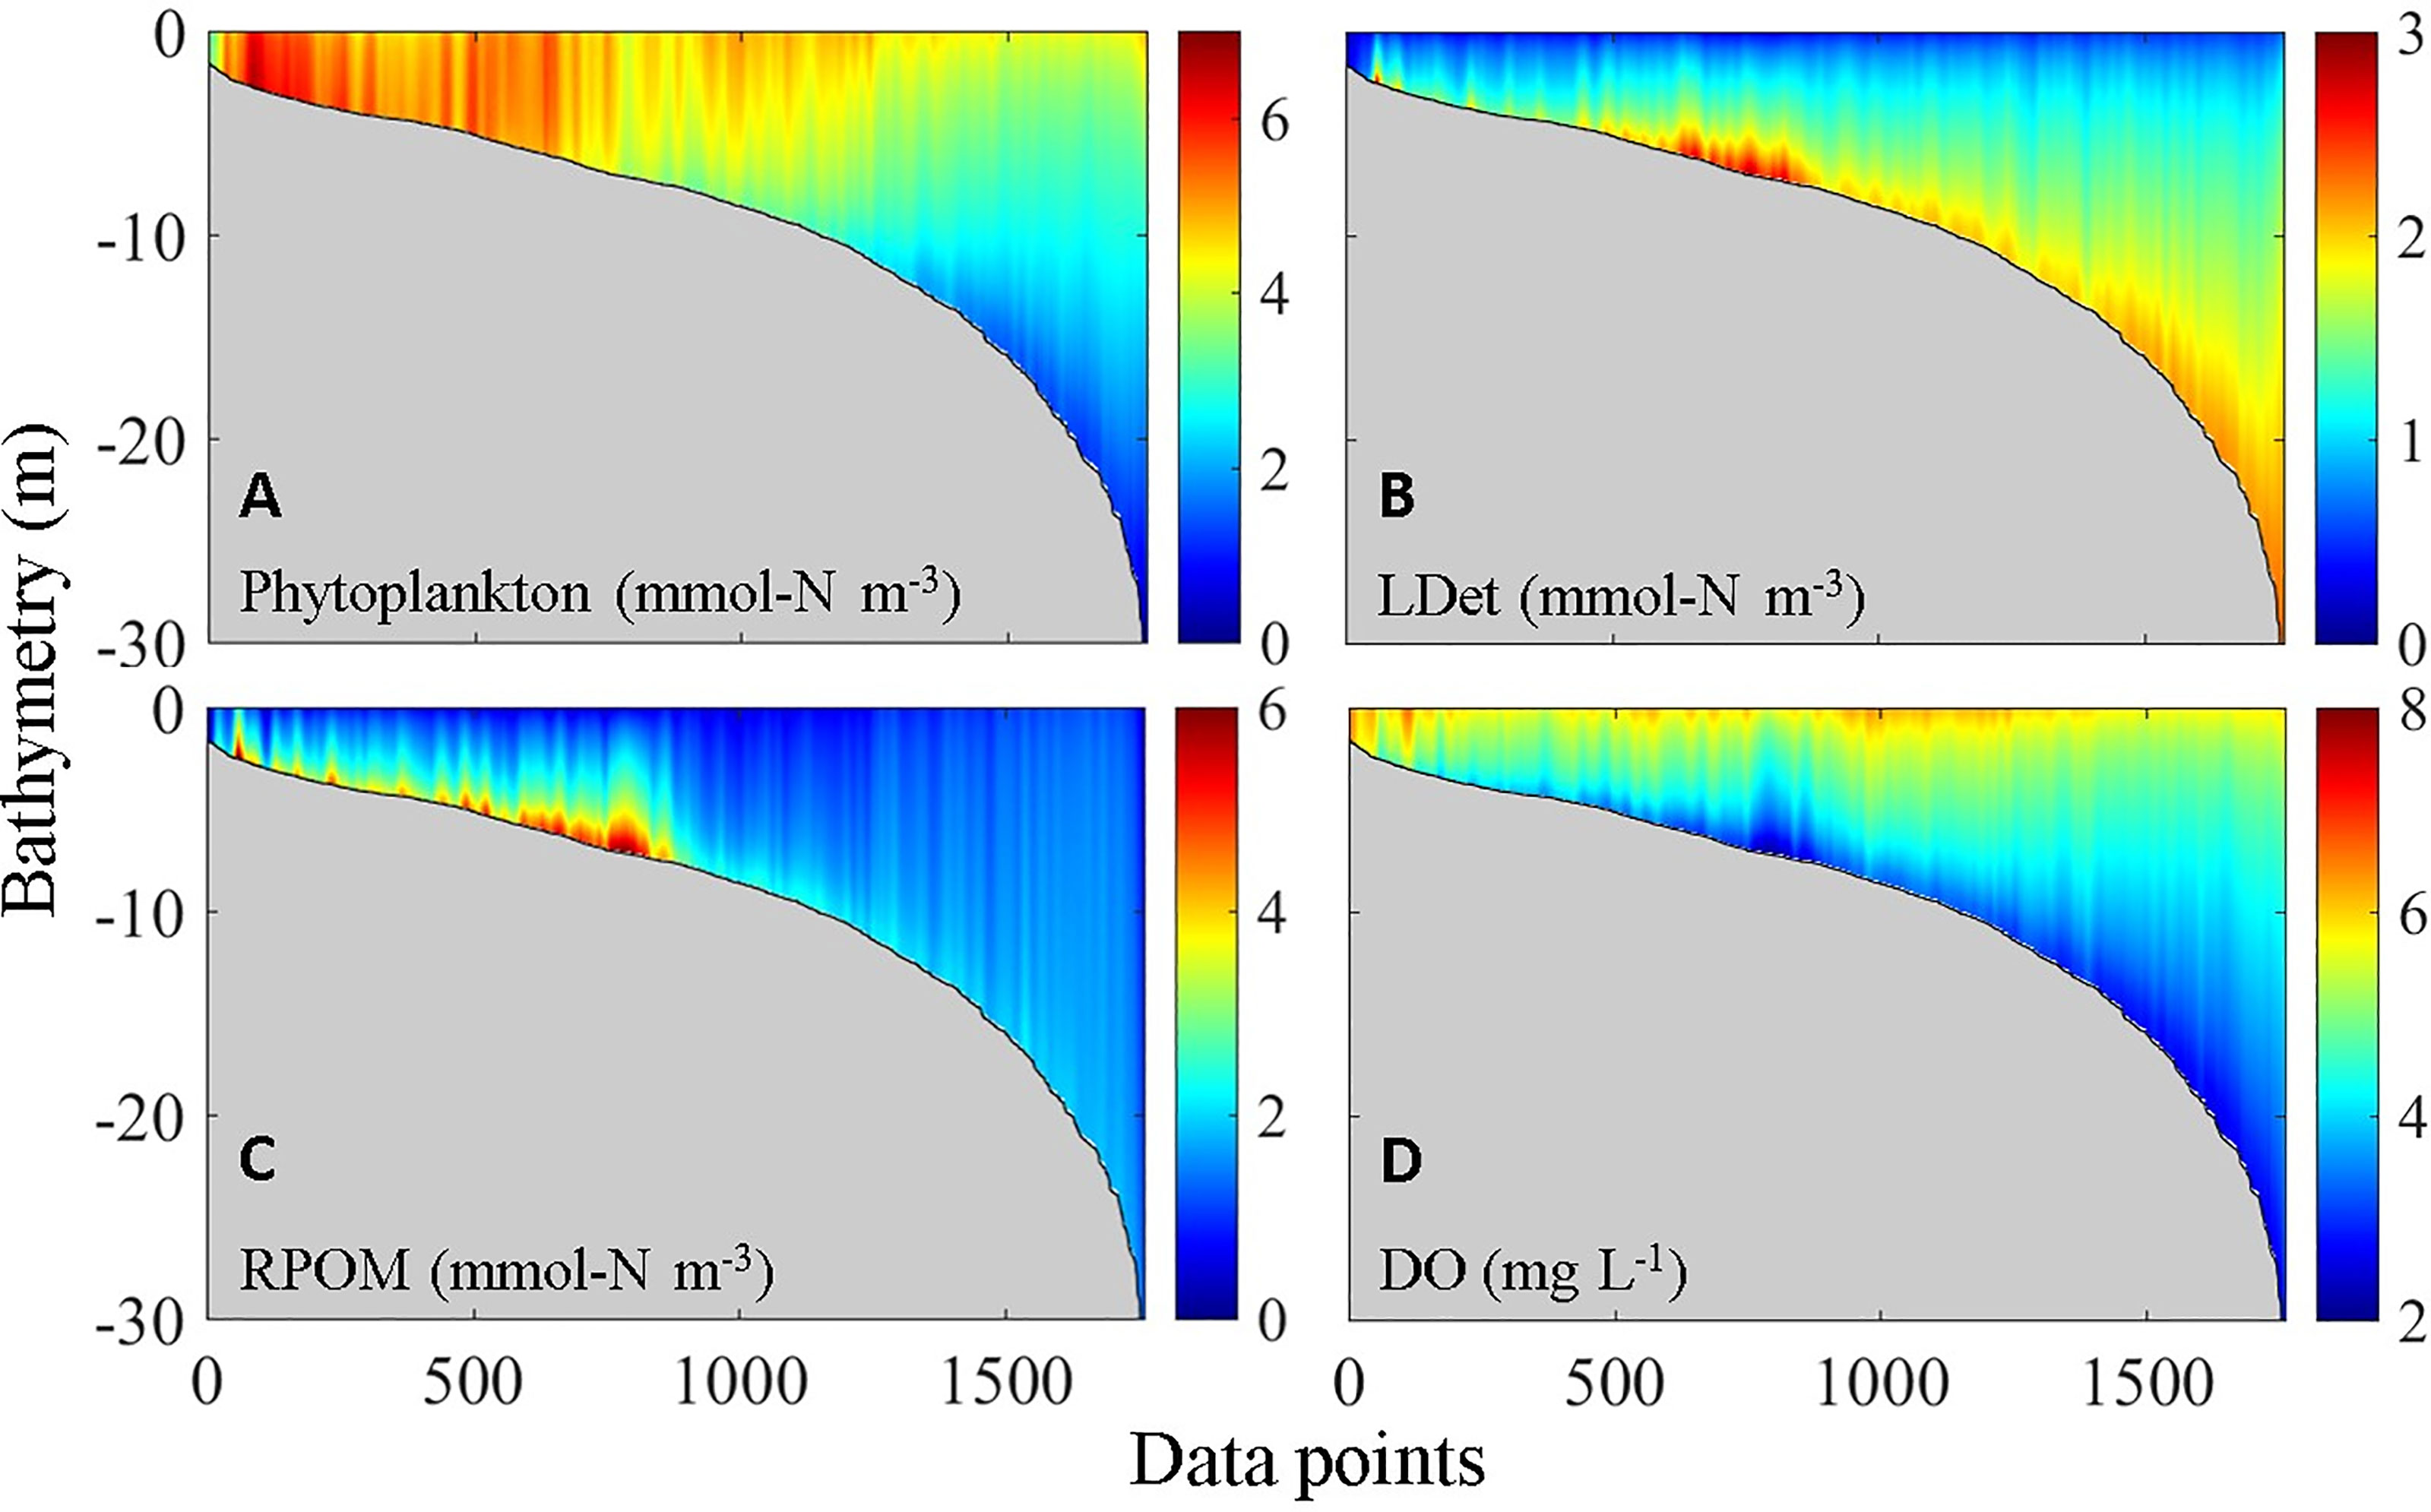
Figure 5 Vertical distribution of (A) phytoplankton, (B) LDet, (C) RPOM, and (D) DO.
By combining observations and numerical results of a physical-biogeochemical model, Yu et al. (2020) found that autochthonous OM (i.e., phytoplankton and detritus) is the main consumer of oxygen in the CTZ, especially in the eastern part of the CTZ that links with the VH. On the basis of the relationship between salinity and contribution of allochthonous OM (mainly RPOM) to oxygen consumption (Yu et al., 2020), we found that the RPOM only accounted for ~5% of the total oxygen consumption by OM in the bottom layer of the VH largely because terrestrially derived RPOM is more recalcitrant than the marine-derived large detritus (LDet) despite that they have comparable concentrations.
To quantify the relative contributions of the OM to hypoxia formation, we calculated the sediment oxygen demand (SOD) of different types of OM (Equation 1, where SODPhyt, SODSDet, SODLDet, and SODRPOM represent SOD contributed by phytoplankton, small detritus, large detritus, and river-delivered particulate OM, respectively) in the bottom layer of the VH and arranged them in the order of bathymetry (Figure 6A).

Figure 6 (A) Bathymetry-dependent distribution of terms (equation 1) contributing to SOD and AOU (shaded values) in the bottom layer over the VH. Horizontal distributions of (B) SOD and (C) AOU in the bottom layer (averaged over 1 m above the bottom) over the VH where water depth is shallower than 10 m. (D) The depth-dependent distribution of DO change rate in the bottom layer of Zone 1 and Zone 2 showing in (B). The larger negative value indicates stronger oxygen consumption rate.
We found that the remineralization of LDet in the sediments dominated the SOD in most VH waters. The relative contribution of LDet remineralization to SOD increased with bathymetry because the contributions from other types of OM decreased rapidly with increasing bathymetry. To relate the impacts of OM to DO status, we calculated apparent oxygen utilization (AOU) using the formula AOU = [O2]eq – [O2], where [O2]eq is the saturated DO concentration at in situ salinity and temperature and [O2] is the in situ DO concentration (Zhai et al., 2005). As shown in Figure 6A, the bathymetry-varied distribution of AOU primarily mirrored the distribution of SOD because SOD dominated the oxygen consumption at the bottom layer. However, the peak value of AOU was ~1–2 m deeper than the peak value of SOD. This result was inconsistent to our result showing that the oxygen consumption of the bottom layer was dominated by SOD in the VH. We then compared the horizontal distribution of SOD and the bottom layer AOU (Figures 6B, C). The maximum SOD was found in Zone 1 adjacent to Lantou Island (Figure 6B), whereas the maximum AOU was found in Zone 2, which was more offshore (Figure 6C). Thus, a spatial mismatch between the peaks of SOD and AOU were observed.
In addition to biological consumption, physical processes play an important role in the regulation of DO distribution. Figure 6D indicates that the net oxygen consumption rate in the bottom layer of Zone 1 was much lower than that in Zone 2 despite that the SOD was higher in Zone 1. By breaking down each physical and biogeochemical term contributing to oxygen variation rate, we found that the vertical diffusion and horizontal advection of oxygen in Zone 1 were much higher than those in Zone 2 and offset the relatively high SOD in Zone 1. Consequently, Zone 2 had a larger net oxygen consumption and hence formed stronger hypoxia.
4.2 Quantify Direct and Indirect Contributions to Hypoxia
4.2.1 Direct Contribution
To evaluate the direct effects of the external fluxes through the sections connecting VH and the ambient waters, we calculated the fluxes of water and hypoxic water volumes through the four sections (sections 1–4, Figure 1A) around the VH and the three sections (sections 4–6) around the CVH, respectively (Figure 7). Water flowed into the VH through S1 and S3 and flowed out mainly from S2, suggesting that the volume fluxes across S1 and S2 were dominated by upper layer flow, whereas the volume flux across S3 was dominated by bottom layer flow (refer to the surface and bottom velocity field in Figures 3A, B). Compared with the other sections, S4 had a small volume flux (Figure 7A). Fluctuations in fluxes over time reflected the spring–neap tidal cycle. The volume fluxes through the sections around the CVH were considerably smaller than those of the VH, and water mainly flowed in through S5 and out through S4 and S6 (Figure 7C). Surface layer flow was dominant.
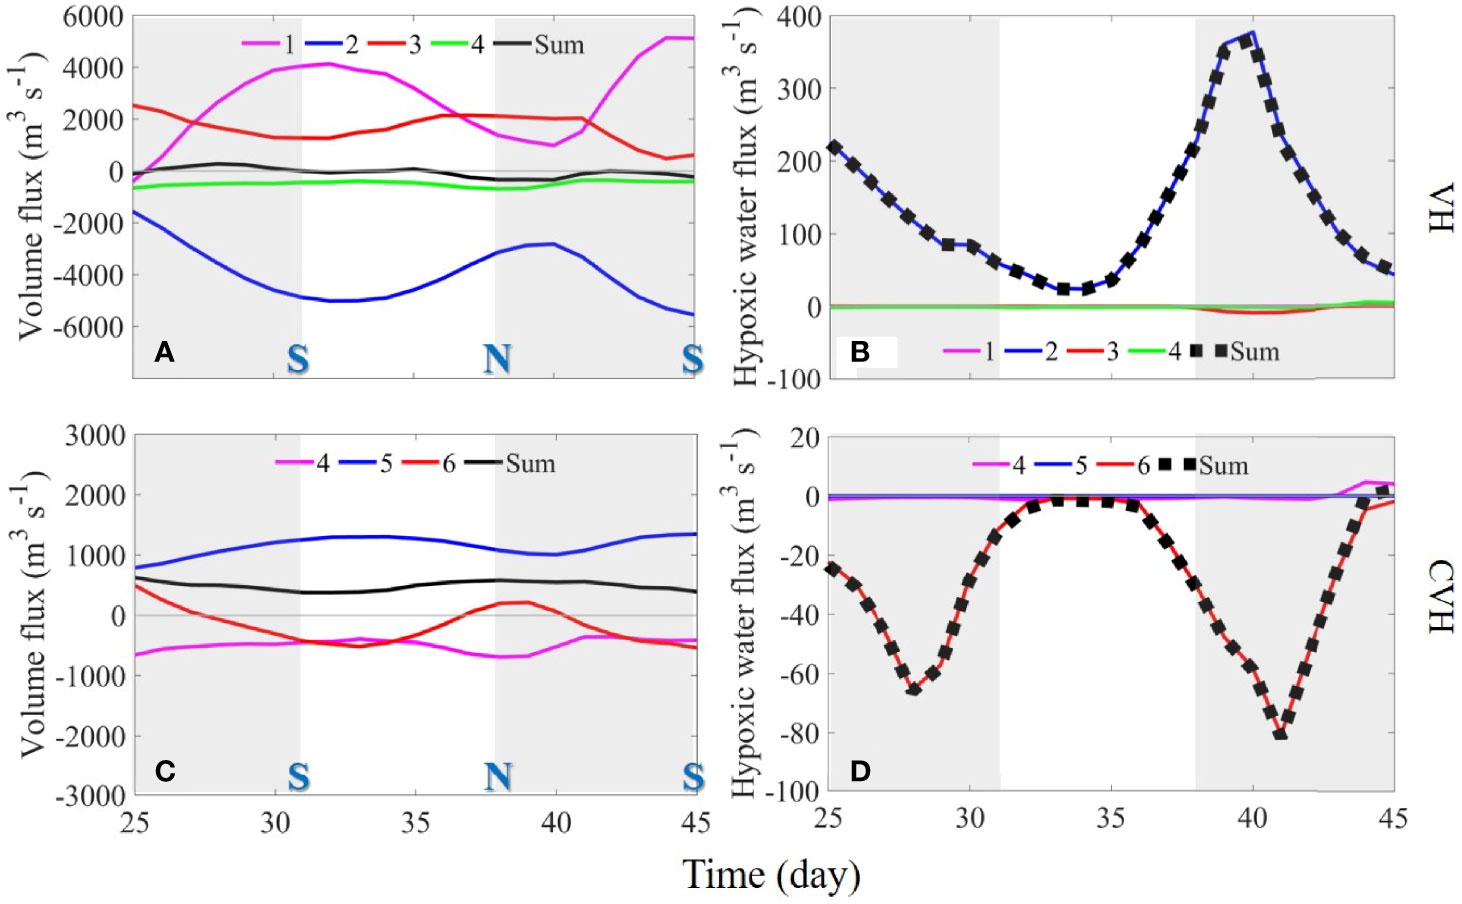
Figure 7 Time-series of (A, C) volume and (B, D) hypoxic water fluxes through sections 1–4 (VH; upper panel) and sections 4–6 (CVH; lower panel). Positive and negative values represent volume or DO fluxes into and out of the VH. “S” and “N” refer to the spring and neap tides, respectively. Note that the scales used for the CVH are smaller in the figure.
In contrast to the relatively strong volume flux in the upper layer, the flux of hypoxic water volume primarily occurred in the bottom layer where DO concentration was low (Figure 3). When strong hypoxia occurred in Hong Kong waters in the southern part of C1 (Figures 2D, H), influx through S2 was the major external source of hypoxic water (Figure 7B). The fluxes of hypoxic water through other sections were negligible despite their relatively strong bottom velocities. Nevertheless, the influx of low-DO yet not hypoxic water from other sections still contributed to hypoxia in the VH to a certain extent. Such contribution is difficult to quantify by the volume flux but can be derived through terms balance analysis, as demonstrated in Section 4.3.
Owing to the weak volume flux (Figure 7C), the total flux of hypoxic water through the sections of the CVH was small (Figure 7D). The bottom DO level around the CVH was higher than that in the southern Hong Kong waters and led to a net out flux of hypoxic water in the CVH. Almost the entire out flux went through S6, reflecting the westward spreading of low-DO bottom water in C3 (Figure 4I)
4.2.2 Indirect Contribution
We quantitatively assessed factors indirectly contributing to hypoxia in the VH and CVH. Figure 8 shows the time-series flux of the three major oxygen-consuming OM, namely LDet, river-origin dissolved OM (RDOM), and RPOM, through the sections of the VH and CVH. The fluxes of phytoplankton, zooplankton, and small detritus were relatively low and were thus not presented for simple analysis.
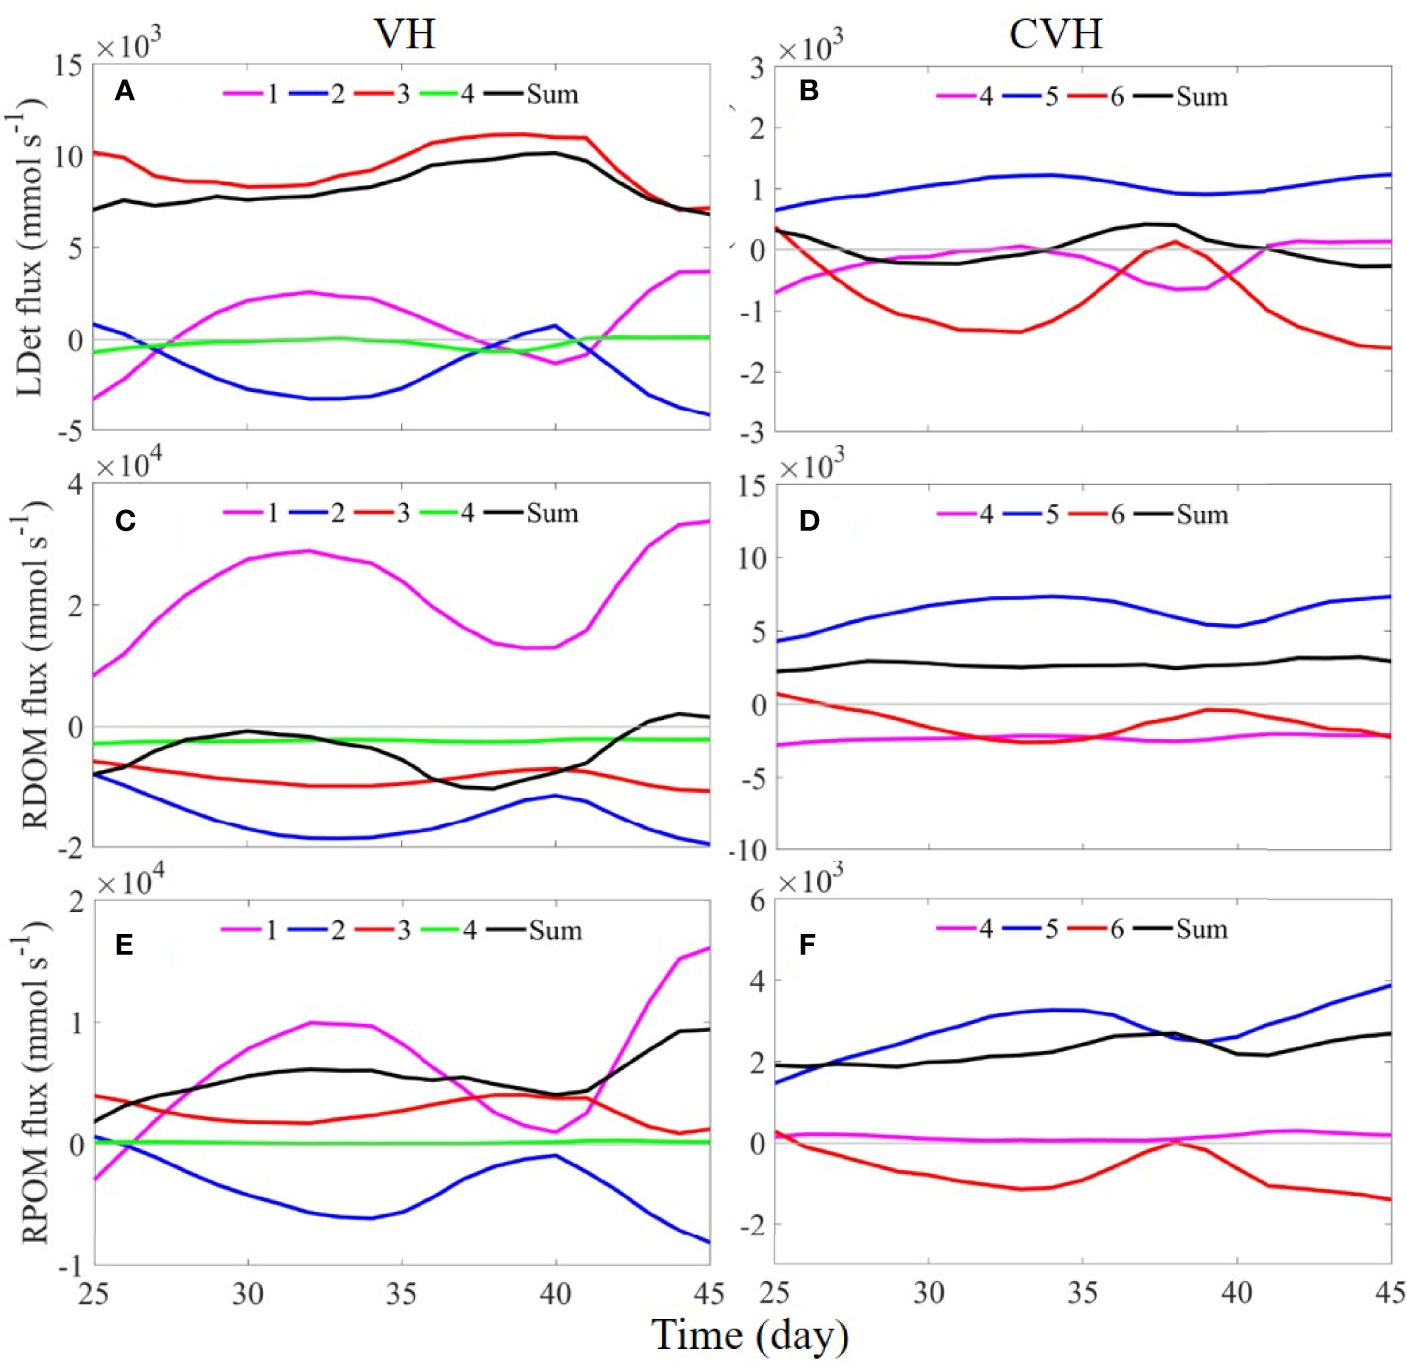
Figure 8 Time-series of (A, B) LDet, (C, D) RDOM, and (E, F) RPOM fluxes through sections 1–4 of the VH (left column) and through sections 4–6 of the CVH (right column). Positive and negative values represent flux into and out of the VH/CVH. Note that the scales used from CVH are smaller in the figure.
When the plankton-derived OM (mainly LDet) produced outside the VH settled in water below the pycnocline, they advected into the VH by the strong onshore up-slope current mainly through S3 where the bottom velocity is the strongest among all sections (Figure 8A). In addition, the RDOM mainly existed in the upper water because its only source was buoyant river freshwater and the RDOM does not sink. As a result, the flux of RDOM followed the same pattern as surface velocity (Figure 3A), which flowed into the VH through S1 and flowed out of the VH through other sections (Figure 8C). The RPOM was from river input, but it had a relatively fast settling rate (5 m d−1). Therefore, a large amount of RPOM was transported into the VH through S3 from the bottom layer, contributing to a positive flux of RPOM through S3 (flux into the VH; Figure 8E).
Oxygen consumption in water columns mainly occurs in the process of OM degradation and nitrification. Equations (2), (3) and (4) represent transformations of OM, ammonia, nitrite and nitrate, respectively.
The C106H263O110N16P in Equation (1) represents the averaged composition of OM (Paulmier et al., 2009).
When the entire imported OM was assumed degraded through aerobic remineralization (Equation 2) and subsequent nitrification (Equations 3 and 4) within the VH and the different degradation potentials of different types of OM (Yu et al., 2020) were considered, the time-averaged (days 38–45, same for CVH below) oxygen consumption rate was 0.8 × 10¹⁰ mmol d−1. Notably, the contribution from external LDet supply might have been underestimated in the above estimation because of the presence of outflow of the locally produced LDet in the upper layer. The fluxes of RDOM and RPOM through the sections around the CVH had patterns there were similar to the pattern of the VH under the same mechanism, and the influence of LDet on the CVH was not as strong as that on the VH and exhibited large fluctuations (Figures 8B, D, F). These results indicated that the contribution of terrestrial OM on the CVH was greater than that in the VH. Oxygen in the CVH was consumed at an average rate of 1.4 × 10⁹ mmol d−1.
4.3 Oxygen Dynamics in the VH
In this section, we assessed oxygen dynamics in the bottom layer of the VH. To reflect the influence of the highly diverse and spatially heterogeneous coastal system and investigate nonlinear local responses to external inputs, we analyzed the term balances in the oxygen governing equation (Equation 5) in the VH and CVH. The assessment was aimed at identifying the primary factors and processes regulating oxygen dynamics and quantifying their relative contributions.
In Equation 5, the right side terms Hadv, Vadv, Hdiff, Vdiff, Phot, Nitri, Remin, Metab, Rea, and SOD represent horizontal advection, vertical advection, horizontal diffusion, vertical diffusion, photosynthesis, nitrification, OM remineralization, zooplankton metabolism, air–sea re-aeration, and sediment oxygen demand, respectively (Li et al., 2020).
4.3.1 Oxygen Budget in VH
Figures 9A–C show the depth-integrated oxygen terms of the bottom layer within the VH. The terms were averaged from model day 38 to model day 45. SOD dominated the DO sink (93.7%) because the time for the remineralization of OM in the water column was insufficient when the sedimentation rate of particulate OM (such as LDet and RPOM) was relatively high and the water depth of the study region was shallow. As a result, water column oxygen consumption was low (6.3%). Vertical diffusion served as the largest source (57.0%) of DO in the bottom water because the huge vertical gradient of DO concentration promoted the rapid diffusion of DO from high-DO water in the upper layer to the low-DO water below. Vertical motion ranked the second largest source of DO to bottom water (24.3%) mainly because of strong water column mixing (e.g., in C3). Photosynthesis was one of the major sources of DO in the bottom layer primarily because the study region shallow (with a median water depth of ~7.9 m). Light was able to penetrate to the bottom layer and supported phytoplankton growth. Although the analysis in Section 4.2 showed net influx of hypoxic water from the south (S2), the net effect of horizontal advection still served as a net source of DO in the bottom layer in the VH. The reasons were that biogeochemical processes inside the VH further reduced the DO concentration and DO concentration in the water flowing out of the VH from the bottom layer was lower than that in the influx.
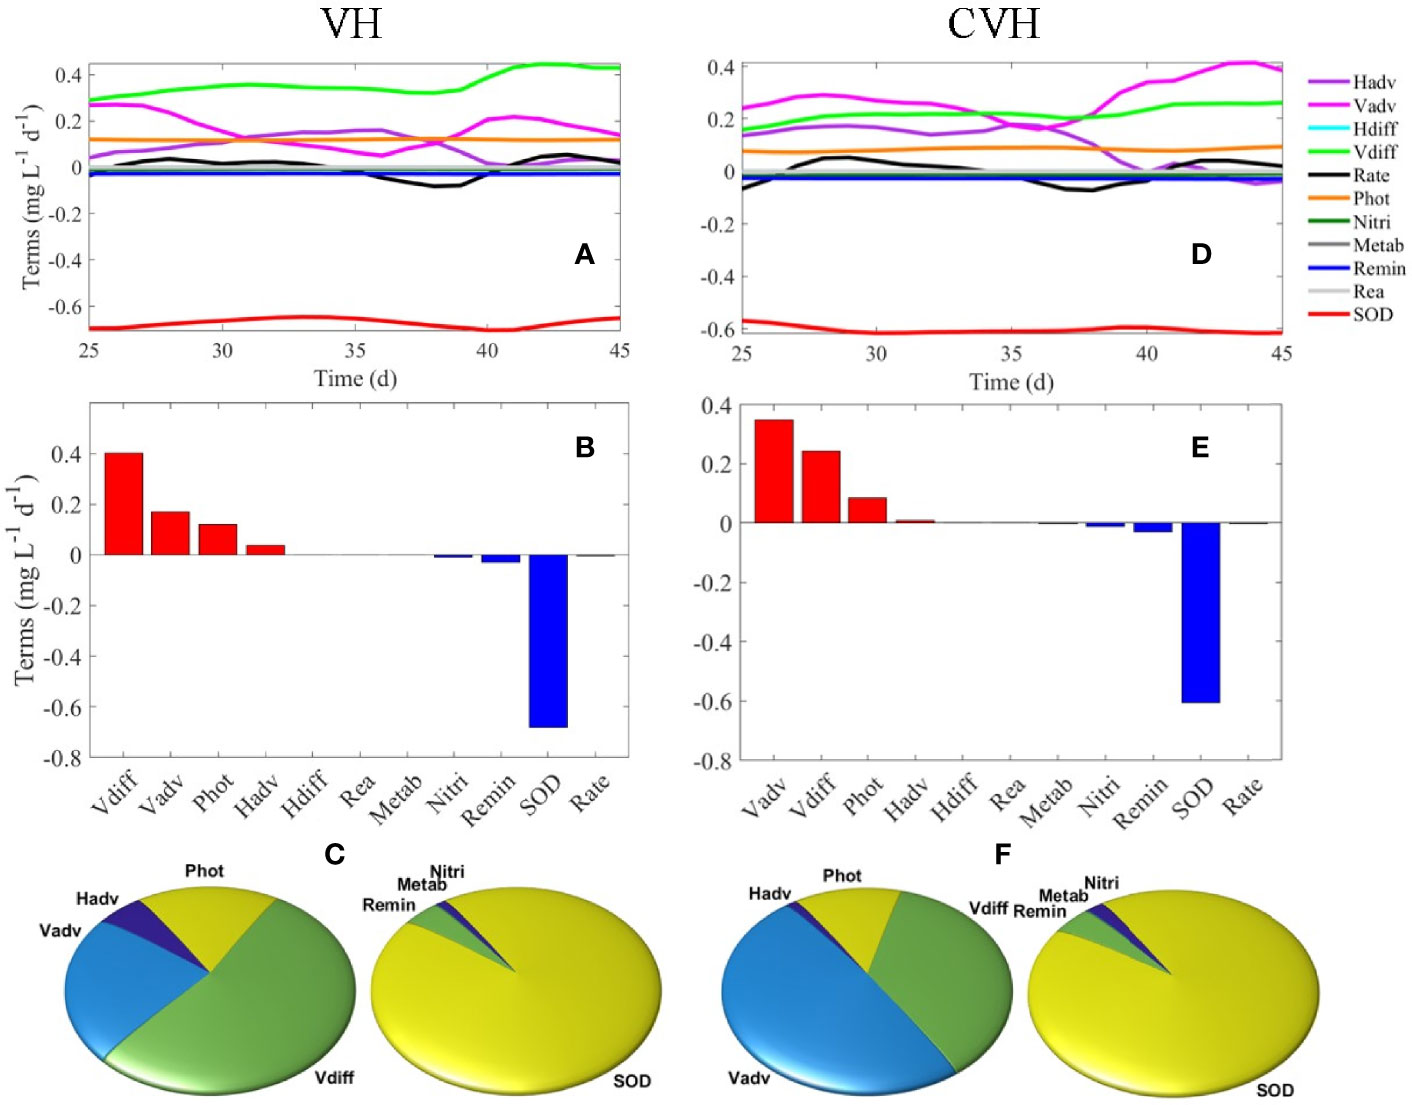
Figure 9 (A) Time-series of DO terms in the bottom layer of VH, (B) average DO terms from day 38–45 of VH in bottom layer, (C) percentage for DO source (left) and sink (right) terms of the VH in the bottom layer. (D–F) are the same as (A–C) but for the CVH.
4.3.2 Oxygen Budget in CVH
SOD was also the dominant DO sink in the CVH (92.8%), and remineralization and nitrification contributed to 4.5% and 2.5% of the bottom DO sink, respectively (Figures 9D–F). The magnitude of vertical motion exceeded that of the vertical diffusion and became the largest source of DO in the bottom layer of CVH in contrast to that in the VH. Such difference was due to the strong vertical motion related to the hydrodynamic conditions of the spatially constrained CVH and relatively weak vertical DO gradient and weak diffusion in the CVH.
5 Summary
Similar to many coastal waters around the world, the VH, a coastal embayment around a megacity linked to large discharge of terrestrial pollutants from the Pearl River, is threatened by the worsening eutrophication and hypoxia. The DO dynamics and hypoxia in the VH is jointly regulated by external exchange of water and biogeochemical substances with adjacent coastal waters and by local physical and biogeochemical processes occurring internally. Conveyed by the channels linking the embayment to the adjacent shelf, the onshore cross-isobath circulation under upwelling circulation transports low-DO deep water to the VH and thereby directly contributes to hypoxia in the VH. The external influx of anthropogenic nutrients and OM, mainly through channel C1 and C2, enhances the bottom water hypoxia in the VH by stimulating phytoplankton bloom and microbial consumption of oxygen in water columns and sediments. On the top of the external forcing, local hydrodynamics and biogeochemical processes further co-regulate hypoxia formation inside the VH. The strongest hypoxia developed in the southern half of C1 because of the low bottom velocity and stratified water column. The horizontal transport in C3 was limited by strong vertical mixing. The bottom DO in the CVH was lower than the surrounding waters, thus leading to a weak net outflux of hypoxic water in the CVH.
In the VH, oxygen consumption is mainly contributed by autochthonous OM, and remineralization of LDet in sediments dominates the SOD. The bathymetry-dependent distribution of AOU largely mirrored the distribution of SOD, but the dislocation between the bottom AOU and SOD due to the offsetting effects of physical processes drove the AOU peak to be ~1–2 m deeper than the SOD peak. The DO flux through the different sections of the VH generally followed the volume flux, but the relative contribution through S3 was much smaller than the volume flux. The low DO water entered the VH mainly through S2, which affected the DO distribution in the VH directly. The overall pattern of DO flux through the sections of the CVH was similar to the that of the volume flux, but the influx and outflux roughly cancelled each other. The flux of RPOM through S3 was positive (flux into the VH) because a large amount of RPOM was transported to the VH through S3 from the bottom layer. The flux of phytoplankton, RDOM, and RPOM through the sections around the CVH had patterns similar to those of the VH under same mechanism, but the influence of LDet was not as strong as that found in the VH and exhibited large fluctuations. The external impact of CVH was contributed mainly by terrestrial OM input, and the marine OM had less impact.
By performing a first-order assessment of oxygen dynamics in the water column, we analyzed the oxygen term balances to quantify the relative importance of different processes in the regulation of oxygen dynamics. In the bottom layer of the VH, SOD dominated the DO sink, and water column oxygen consumption was relatively small primarily because of the relatively high sedimentation rate of particulate OM and shallow water depth. Vertical diffusion and vertical motion were the two largest DO sources to the bottom water because of the strong vertical DO gradient and strong water column mixing, respectively. Photosynthesis is another important DO source in bottom water because light can penetrate the bottom water and support phytoplankton growth. In the CVH, SOD was the dominant DO sink in the bottom layer, but the magnitude of vertical motion exceeded that of vertical diffusion to become the largest source of DO in the bottom layer of the CVH because of strong vertical mixing.
By combining observations and a process-oriented model simulation, we studied the temporal and spatial distributions of hypoxia in the VH and the synergistic effects of local and remote forcing controlling hypoxia. Our work linked the state of hypoxia in the VH to surrounding complex estuarine and coastal environment and quantified the relative contributions of different sources to hypoxia formation in the VH for the first time. The results highlight the internal and external controls on hypoxia in a coastal embayment under the complex interactions of the hydrodynamics and biogeochemical processes and anthropogenic inputs of pollutants.
Data Availability Statement
The raw data supporting the conclusions of this article will be made available by the authors, without undue reservation.
Author Contributions
ZL analyzes the observational and model data, LY runs the model, and JG provides overall guidance. All authors contributed to the article and approved the submitted version.
Conflict of Interest
The authors declare that the research was conducted in the absence of any commercial or financial relationships that could be construed as a potential conflict of interest.
Publisher’s Note
All claims expressed in this article are solely those of the authors and do not necessarily represent those of their affiliated organizations, or those of the publisher, the editors and the reviewers. Any product that may be evaluated in this article, or claim that may be made by its manufacturer, is not guaranteed or endorsed by the publisher.
Acknowledgments
This work was supported by Innovation Group Project of Southern Marine Science and Engineering Guangdong Laboratory (Zhuhai) (projects 311020003 and 311021004), the Theme-based Research Scheme (T21-602/16-R) of the Hong Kong Research Grants Council. We are also grateful for the support of The National Supercomputing Centers of Tianjin and Guangzhou. The data for this study are generated from the publicly distributed Regional Ocean Model System (ROMS, https://www.myroms.org/).
Supplementary Material
The Supplementary Material for this article can be found online at: https://www.frontiersin.org/articles/10.3389/fmars.2022.858715/full#supplementary-material
References
Breitburg D., Levin L. A., Oschlies A., Grégoire M., Chavez F. P., Conley D. J., et al. (2018). Declining Oxygen in the Global Ocean and Coastal Waters. Science 359 (6371), 1–11. doi: 10.1126/science.aam7240
Cai W. J., Hu X., Huang W. J., Murrell M. C., Lehrter J. C., Lohrenz S. E., et al. (2011). Acidification of Subsurface Coastal Waters Enhanced by Eutrophication. Nat. Geosci. 4 (11), 766–770. doi: 10.1038/ngeo1297
Callahan J., Dai M., Chen R. F., Li X., Lu Z., Huang W. (2004). Distribution of Dissolved Organic Matter in the Pearl River Estuary, China. Mar. Chem. 89 (1–4), 211–224. doi: 10.1016/j.marchem.2004.02.013
Dagg M., Ammerman J. W., Amon R. M. W., Gardner W. S., Green R., Lohrenz S. E. (2007). A Review of Water Column Processes Influencing Hypoxia in the Northern Gulf of Mexico. Estuaries. Coasts. 30 (5), 735–752. doi: 10.1007/BF02841331
Dai M., Gan J., Han A., Kung H. S., Yin Z. (2013). “Physical Dynamics and Biogeochemistry of the Pearl River Plume”, in Biogeochemical Dynamics at Major River-Coastal Interfaces. (Cambridge: Cambridge University Press). doi: 10.1017/cbo9781139136853.017
Diaz R. J., Rosenberg R. (2008). Spreading Dead Zones and Consequences for Marine Ecosystems. Science 321 (5891), 926–929. doi: 10.1126/science.1156401
Doney S. C. (2010). The Growing Human Footprint on Coastal and Open-Ocean Biogeochemistry. Science. 328 (5985), 1512–1516. doi: 10.1126/science.1185198
Fennel K., Wilkin J., Levin J., Moisan J., O’Reilly J., Haidvogel D. (2006). Nitrogen Cycling in the Middle Atlantic Bight: Results From a Three-Dimensional Model and Implications for the North Atlantic Nitrogen Budget. Global Biogeochem. Cycles. 20 (3), 1–14. doi: 10.1029/2005GB002456
Gan J., Li L., Wang D., Guo X. (2009). Interaction of a River Plume With Coastal Upwelling in the Northeastern South China Sea. Continent. Shelf. Res. 29 (4), 728–740. doi: 10.1016/j.csr.2008.12.002
Gan J., Lu Z., Cheung A., Dai M., Liang L., Harrison P. J., et al. (2014). Assessing Ecosystem Response to Phosphorus and Nitrogen Limitation in the Pearl River Plume Using the Regional Ocean Modeling System (ROMS). J. Geophys. Res. C: Oceans 119 (12), 8858–8877. doi: 10.1002/2014JC009951
Gan J., Lu Z., Dai M., Cheung A. Y. Y., Liu H., Harrison P. (2010). Biological Response to Intensified Upwelling and to a River Plume in the Northeastern South China Sea: A Modeling Study. J. Geophys. Res.: Oceans 115 (9), 1–19. doi: 10.1029/2009JC005569
Harrison P. J., Yin K., Lee J. H. W., Gan J., Liu H. (2008). Physical-Biological Coupling in the Pearl River Estuary. Continent. Shelf. Res. 28 (12), 1405–1415. doi: 10.1016/j.csr.2007.02.011
He B., Dai M., Zhai W., Guo X., Wang L. (2014). Hypoxia in the Upper Reaches of the Pearl River Estuary and its Maintenance Mechanisms: A Synthesis Based on Multiple Year Observations During 2000-2008. Mar. Chem. 167, 13–24. doi: 10.1016/j.marchem.2014.07.003
Helly J. J., Levin L. A. (2004). Global Distribution of Naturally Occurring Marine Hypoxia on Continental Margins. Deep-Sea. Res. Part I: Oceanograph. Res. Papers 51 (9), 1159–1168. doi: 10.1016/j.dsr.2004.03.009
Huang X. P., Huang L. M., Yue W. Z. (2003). The Characteristics of Nutrients and Eutrophication in the Pearl River Estuary, South China. Mar. Pol. Bull. 47 (1–6), 30–36. doi: 10.1016/S0025-326X(02)00474-5
Lee J. H. W., Qu B. (2004). Hydrodynamic Tracking of the Massive Spring 1998 Red Tide in Hong Kong. J. Environ. Eng. 130 (5), 535–550. doi: 10.1061/(asce)0733-9372(2004)130:5(535
Li D., Gan J., Hui R., Liu Z., Yu L., Lu Z., et al. (2020). Vortex and Biogeochemical Dynamics for the Hypoxia Formation Within the Coastal Transition Zone Off the Pearl River Estuary. J. Geophys. Res.: Oceans 125 (8), 1–16. doi: 10.1029/2020JC016178
Liu Z., Gan J. (2020). A Modeling Study of Estuarine–Shelf Circulation Using a Composite Tidal and Subtidal Open Boundary Condition. Ocean Model. 147, 101563. doi: 10.1016/j.ocemod.2019.101563
Liu Z., Gan J., Wu X. (2018). Coupled Summer Circulation and Dynamics Between a Bay and the Adjacent Shelf Around Hong Kong: Observational and Modeling Studies. J. Geophys. Res.: Oceans 123 (9), 6463–6480. doi: 10.1029/2018JC013830
Liu Z., Zu T., Gan J. (2020). Dynamics of Cross-Shelf Water Exchanges Off Pearl River Estuary in Summer. Prog. Oceanogr. 189, 102465. doi: 10.1016/j.pocean.2020.102465
Lu Z., Gan J. (2015). Controls of Seasonal Variability of Phytoplankton Blooms in the Pearl River Estuary. Deep-Sea. Res. Part II: Top. Stud. Oceanogr. 117, 86–96. doi: 10.1016/j.dsr2.2013.12.011
Lu Z., Gan J., Dai M., Liu H., Zhao X. (2018). Joint Effects of Extrinsic Biophysical Fluxes and Intrinsic Hydrodynamics on the Formation of Hypoxia West Off the Pearl River Estuary. J. Geophys. Res.: Oceans 123 (9), 6241–6259. doi: 10.1029/2018JC014199
Lui H. K., Chen C. T. A. (2011). Shifts in Limiting Nutrients in an Estuary Caused by Mixing and Biological Activity. Limnol. Oceanogr. 56 (3), 989–998. doi: 10.4319/lo.2011.56.3.0989
Mellor G. L., Yamada T. (1982). Development of a Turbulence Closure Model for Geophysical Fluid Problems. Rev. Geophys. 20 (4), 851–875. doi: 10.1029/RG020i004p00851
Paulmier A., Kriest I., Oschlies A. (2009). Stoichiometries of Remineralisation and Denitrification in Global Biogeochemical Ocean Models. Biogeosciences 6 (5), 923–935. doi: 10.5194/bg-6-923-2009
Qian W., Dai M., Xu M., Kao S., Du C., Liu J., et al. (2017). Non-Local Drivers of the Summer Hypoxia in the East China Sea Off the Changjiang Estuary. Estuarine. Coast. Shelf. Sci. 198, 393–399. doi: 10.1016/j.ecss.2016.08.032
Qian W., Gan J., Liu J., He B., Lu Z., Guo X., et al. (2018). Current Status of Emerging Hypoxia in a Eutrophic Estuary: The Lower Reach of the Pearl River Estuary, China. Estuarine. Coast. Shelf. Sci. 205, 58–67. doi: 10.1016/j.ecss.2018.03.004
Rabalais N. N., Cai W. J., Carstens J., Conley D. J., Fry B., Hu X., et al. (2014). Eutrophication-Driven Deoxygenation in the Coastal Ocean. Oceanography 27 (1), 172–183. doi: 10.5670/oceanog.2014.21
Rabalais N. N., Díaz R. J., Levin L. A., Turner R. E., Gilbert D., Zhang J. (2010). Dynamics and Distribution of Natural and Human-Caused Hypoxia. Biogeosciences 7 (2), 585–619. doi: 10.5194/bg-7-585-2010
Rabouille C., Conley D. J., Dai M. H., Cai W. J., Chen C. T. A., Lansard B., et al. (2008). Comparison of Hypoxia Among Four River-Dominated Ocean Margins: The Changjiang (Yangtze), Mississippi, Pearl, and Rhône Rivers. Continent. Shelf. Res. 28 (12), 1527–1537. doi: 10.1016/j.csr.2008.01.020
Shchepetkin A. F., McWilliams J. C. (2005). The Regional Oceanic Modeling System (ROMS): A Split-Explicit, Free-Surface, Topography-Following-Coordinate Oceanic Model. Ocean Model. 9 (4), 347–404. doi: 10.1016/j.ocemod.2004.08.002
Wang H., Dai M., Liu J., Kao S. J., Zhang C., Cai W. J., et al. (2016). Eutrophication-Driven Hypoxia in the East China Sea Off the Changjiang Estuary. Environ. Sci. Technol. 50 (5), 2255–2263. doi: 10.1021/acs.est.5b06211
Xu J., Ho A. Y. T., Yin K., Yuan X., Anderson D. M., Lee J. H. W., et al. (2008). Temporal and Spatial Variations in Nutrient Stoichiometry and Regulation of Phytoplankton Biomass in Hong Kong Waters: Influence of the Pearl River Outflow and Sewage Inputs. Mar. Pol. Bull. 57 (6–12), 335–348. doi: 10.1016/j.marpolbul.2008.01.020
Xu J., Yin K., Liu H., Lee J. H. W., Anderson D. M., Ho A. Y. T., et al. (2010). A Comparison of Eutrophication Impacts in Two Harbours in Hong Kong With Different Hydrodynamics. J. Mar. Syst. 83 (3–4), 276–286. doi: 10.1016/j.jmarsys.2010.04.002
Yin K., Harrison P. J. (2007). Influence of the Pearl River Estuary and Vertical Mixing in Victoria Harbor on Water Quality in Relation to Eutrophication Impacts in Hong Kong Waters. Mar. Pol. Bull. 54 (6), 646–656. doi: 10.1016/j.marpolbul.2007.03.001
Yu L., Gan J., Dai M., Hui C. R., Lu Z., Li D. (2020). Modeling the Role of Riverine Organic Matter in Hypoxia Formation Within the Coastal Transition Zone Off the Pearl River Estuary. Limnol. Oceanograph. 66 (2), 452–468. doi: 10.1002/lno.11616
Zhai W., Dai M., Cai W. J., Wang Y., Wang Z. (2005). High Partial Pressure of CO2 and its Maintaining Mechanism in a Subtropical Estuary: The Pearl River Estuary, China. Mar. Chem. 93 (1), 21–32. doi: 10.1016/j.marchem.2004.07.003
Keywords: hypoxia, embayment, coastal sea, eutrophication, numerical model
Citation: Lu Z, Yu L and Gan J (2022) External and Internal Forcings for Hypoxia Formation in an Urban Harbour in Hong Kong. Front. Mar. Sci. 9:858715. doi: 10.3389/fmars.2022.858715
Received: 20 January 2022; Accepted: 21 March 2022;
Published: 19 April 2022.
Edited by:
Pengfei Xue, Michigan Technological University, United StatesReviewed by:
Hui Wu, East China Normal University, ChinaHon-Kit Lui, National Sun Yat-sen University, Taiwan
Copyright © 2022 Lu, Yu and Gan. This is an open-access article distributed under the terms of the Creative Commons Attribution License (CC BY). The use, distribution or reproduction in other forums is permitted, provided the original author(s) and the copyright owner(s) are credited and that the original publication in this journal is cited, in accordance with accepted academic practice. No use, distribution or reproduction is permitted which does not comply with these terms.
*Correspondence: Jianping Gan, bWFnYW5AdXN0Lmhr