 Manuel Vargas-Yáñez1*
 Francina Moya1
 Rosa Balbín2
 Rocío Santiago2
 Enrique Ballesteros1
 Ricardo F. Sánchez-Leal3Patricia Romero1
 Ma Carmen García-Martínez1
- 1Instituto Español de Oceanografía (IEO-CSIC). Centro Oceanográfico de Málaga., Málaga, Spain
- 2Instituto Español de Oceanografía (IEO-CSIC), Centro Oceanográfico de Baleares., Palma, Spain
- 3Instituto Español de Oceanografía (IEO-CSIC), Centro Oceanográfico de Cádiz., Cádiz, Spain
The warming of the surface ocean is expected to increase the stratification of the upper water column. This would decrease the efficiency of the wind-induced mixing, reducing the nutrient supply to the euphotic layer and the productivity of the oceans. Climatic projections show that the Mediterranean Sea will experience a strong warming and salting along the twenty first century. Nevertheless, very few works have found and quantified changes in the water column stratification of the Western Mediterranean. In this work, we obtain time series of Mixed Layer Depth (MLD) along the Spanish Mediterranean waters and the Gulf of Cádiz, using periodic CTD profiles collected under the umbrella of the Ocean Observing system of the Instituto Español de Oceanografía (IEO-CSIC). The length of the time series analyzed is variable, depending on the geographical area, but in some cases these time series extend from the beginning of the 1990s decade. Our results show that at present, no statistically significant changes can be detected. These results are confirmed by the analysis of MLD time series obtained from Argo profilers. Some of the meteorological factors that could affect the water column stratification (wind intensity and precipitation rates) did not experience significant changes for the 1990-2021 period, neither were observed long-term changes in the chlorophyll concentration. The hypothesis proposed to explain this lack of trends, is that the salinity increase of the surface waters has compensated for the warming, and consequently, the density of the upper layer of the Western Mediterranean (WMED) has remained constant. As the wind intensity has not experienced significant trends, the stratification of the Spanish Mediterranean waters and those of the Gulf of Cádiz would have not been affected. Nevertheless, we do not discard that our results are a consequence of the short length of the available time series and the large variance of the variables analyzed, evidencing the importance of the maintenance of the ocean monitoring programs.
Introduction
The oceans play a key role in the present scenario of Climate Change. They have absorbed more than 90% of the energy stored in the Earth’s Climate System because of the emissions of greenhouse gasses since the end of the nineteenth century (Zanna et al., 2019). One of the possible consequences of the warming of the most superficial layers of the oceans on marine ecosystems could be the increase of the water column stratification. The enhancement of the stratification would affect to the development of the winter Mixed Layer, reducing the efficiency of the wind mixing and consequently decreasing the nutrient supply to the euphotic layer and the primary production (Bindoff et al., 2019). It would also have important effects on the light availability for phytoplanktonic cells which is linked to the intensity of turbulent mixing (Villamaña et al., 2019; Morison et al., 2020; Comesaña et al., 2021). Global coupled carbon cycle climate models predict that this trend will continue during the twenty first century on a global scale (Steinacher et al., 2010; Hammond et al., 2020), but with regional differences, with a decrease of the primary production in the mid and low latitudes, and an increase in the Southern Ocean.
At present, the estimation of primary production trends on a global scale is based on chlorophyll concentration measurements derived from satellite observations. These results coincide with model predictions, showing a decrease of chlorophyll concentration in the permanently stratified regions, such as the subtropical gyres (Polovina et al., 2008), and an increase in the Southern Ocean (Del Castillo et al., 2019; Pinkerton et al., 2021). Nevertheless, there are some discrepancies with field observations. Behrenfeld et al. (2006) pointed out that the observations did not show the increase in the primary production of the Southern Ocean predicted by the models. Boyce, D. G, and Worm, B., (2015) analyzed more than 115 chlorophyll concentration time series and found different results depending on the geographical area. These authors stressed that most of the available times series had a length shorter than 23 years and that the largest trends were associated to short time series, whereas the long-term variability was much reduced for long time series. Dutkiewicz et al. (2019) evidenced that the detection of trends in the chlorophyll concentration and primary production of the sea, required long time series, because of the large variance of these variables. These authors considered that the length of the series should be enough to accumulate an increment larger than twice the standard deviation associated to the natural variability of the variable analyzed. Hence, one of the main problems that arise when dealing with the detection of long-term changes in the productivity of the oceans is the scarcity of long time series (Boyce and Worm (2015); Del Castillo et al., 2019; Hammond et al., 2020).
The Mediterranean Sea has been considered a hotspot for Climate Change and other anthropic stressors (Cuttelod et al., 2008; Coll et al., 2011). Because of its reduced dimensions and semi-enclosed character, it could be more sensitive to Climate Change than other regions of the world oceans (Calvo et al., 2011). In the case of the Western Mediterranean, the temperature and salinity of surface waters have increased along the twentieth century and the beginning of the twenty first one (Vargas-Yáñez et al., 2021; 2017; 2010), and numerical models, based on different emission scenarios, predict that these trends will continue along the twenty first century (Adloff et al., 2015). All these changes are expected to impact the biogeochemistry of the Mediterranean Sea (Durrieu de Madron et al., 2011). One of the current hypotheses considers that the warming of the upper layer could reduce the deep convection, and weaken the thermohaline circulation of the Mediterranean Sea (Somot et al., 2006; Herrmann et al., 2008a). Macias et al. (2018) found an increase of the deep convection in the WMED until 2030, but these authors considered that the discrepancies with previous works were simply caused by the different temporal horizon of the simulations. These changes in the convection processes and the thermohaline circulation are likely to impact the nutrient supply to the euphotic layer (Pasqueron de Fommervault et al., 2015), and the ventilation of the intermediate and deep waters (Coppola et al., 2018; Ulses et al., 2020). Herrmann et al. (2014) used a coupled ocean circulation-biogeochemical model, and found that the nutrient concentrations of the upper layers would be reduced in the North Western Mediterranean along the twenty first century, but the chlorophyll concentration would increase because of the effect of the sea warming. Besides the expected changes, there are few works that have identified unambiguously current changes in the WMED marine ecosystems. Laboratory experiments (Pulina et al., 2016) have shown that the warming of the surface waters would induce an increment of the phytoplanktonic biomass, being this increment linked to small-size cells. Ribera D’alcalà et al. (2004) analyzed time series of phytoplankton in a coastal station in the Gulf of Naples from 1984 to 2000, and also found a decrease of the size of phytoplanktonic cells, but in this case the overall biomass also decreased. Mazzocchi et al. (2012) observed a negative trend for the chlorophyll concentration at the same location from 1984 to 2006. El Hourany et al. (2021) also found negative trends for the surface chlorophyll concentrations in the Mediterranean Sea, using satellite-derived time series over the period 2003-2020, but these trends were not statistically significant. Furthermore, the significance of the trends, and even their sign could strongly depend on the period of time considered. Goffart et al. (2002) found a decrease of the chlorophyll in the Villefranche B-station (Ligurian Sea) from 1979 to 1990, but this trend was not observed when the time series was extended to 2005 (Goffart et al., 2015).
The different works commented above, both for the global ocean, and for the WMED, show that the detection of changes in the productivity of the sea, requires long time series, which are scarce in the WMED. This is also true for the case for the Spanish Mediterranean waters, which cover a large area of the WMED, from the Strait of Gibraltar to the Catalan Sea, including the Balearic Islands. The oldest monitoring station in this region is the L’Estartit station, in the Catalan Sea, operating since the beginning of the 1970s decade (Salat et al., 2019), but these observations do not include biogeochemical variables. The Balearic Islands Coastal Observing System (SCIB, Tintoré et al., 2019) includes a three-monthly multidisciplinary sampling of the Balearic Channels since 2014, but to our knowledge, no results dealing with the evolution of the chlorophyll or nutrient concentrations have been published. Bahamon et al. (2020) have analyzed physical and biological time series collected under the umbrella of the Operational Observatory of the Catalan Sea (OOCS), in a station close to the head of the Blanes submarine Canyon (Catalan Sea). Contrary to the expectations, this work found that the MLD deepened, and the chlorophyll and nutrient concentrations showed no changes during the period 2010-2017. The Blanes Bay Microbiological Observatory (BBMO) maintains a multidisciplinary monitoring station close to the coast of Blanes. The seasonal cycle of the primary production has been analyzed at this site (Gasol et al., 2016) and time series of anaerobic anoxygenic photoheterotrophic bacteria have been studied in Auladell et al. (2019), but no results are available dealing with long-term changes of the stratification and productivity of the Catalan waters.
Taking into account the projections based on different emission scenarios for the twenty first century, and the uncertainty about the present changes observed in the WMED marine ecosystems, it is of paramount importance to determine whether or not the stratification of the WMED is increasing, and if its productivity is being reduced. This possible oligotrophication of the Mediterranean Sea (Agusti et al, 2017) could be especially important in a sea that is already oligotrophic or extremely oligotrophic (Goffart et al., 2002; Siokou-Frangou et al., 2010). The Instituto Español de Oceanografía (IEO-CSIC) has developed several multidisciplinary monitoring projects in the Spanish Mediterranean and the Gulf of Cádiz since the beginning of the 1990s decade. Although these monitoring projects had different initial dates and covered different geographical areas, they were unified under the umbrella of two monitoring programs: one devoted to the Spanish Mediterranean (RADMED), and another one to the Gulf of Cádiz (STOCA). This work aims to analyze and quantify the possible changes in the MLD, using the available CTD time series from these two projects together with a MLD climatology obtained from Argo profilers. In order to check the robustness of our results, several different criteria will be used for the estimation of the MLD. We will also address the study of those factors that affect the water column stratification and the possible impact on the chlorophyll concentration of the surface waters.
Data and Methods
The time series presented in this work could be classified into three categories: The first one would correspond to those data used to infer the stratification of the water column. This includes ship-borne CTD profiles from the IEO monitoring programs (red dots in Figure 1), and MLD values obtained from Argo profilers. The IEO monitoring of the Spanish Mediterranean and the Gulf of Cádiz started at different dates as separated projects for each geographical region (Gulf of Cádiz, Alborán Sea, Cape Palos, and Balearic Islands). All these projects were finally unified under the umbrella of two major projects contributing to the IEO-Observing System (IEOOS; Tel et al., 2016): STOCA (Time series of oceanographic data in the Gulf of Cádiz) and RADMED (Time series of oceanographic data in the Mediterranean Sea). These projects were initiated in 2009 and 2007 respectively. Nevertheless, previous monitoring programs supported by the IEO, started during the 1990s decade. Therefore, data from 1992 are available in the case of some stations (see Vargas-Yáñez et al., 2017). Three-monthly campaigns conducted in these projects include CTD profiles at all the oceanographic stations, (see Sánchez-Leal et al. (2020) and López-Jurado et al. (2015) for more details). However, it should be noted that these series present some gaps due to bad weather conditions or technical problems. In this work, temperature, salinity and density profiles were used to estimate MLD time series. We have also used a climatology of MLD values downloaded from mixedlayer.ucsd.edu (Holte et al., 2017). This climatology uses temperature and salinity profiles from the international Argo program (https://argo.ucsd.edu/). We obtained all the MLD values corresponding to the following five geographical areas: Gulf of Cádiz, Alborán Sea, Cape Palos region, Balearic Islands, and a large area including the Catalan Sea and waters to the south of the Gulf of Lions that will be named hereafter as Northern Sector (see red rectangles in Figure 1). These data are distributed irregularly in time and space and their initial date is variable, being 2003 for the case of the Northern Sector, and 2015 for the Gulf of Cádiz.
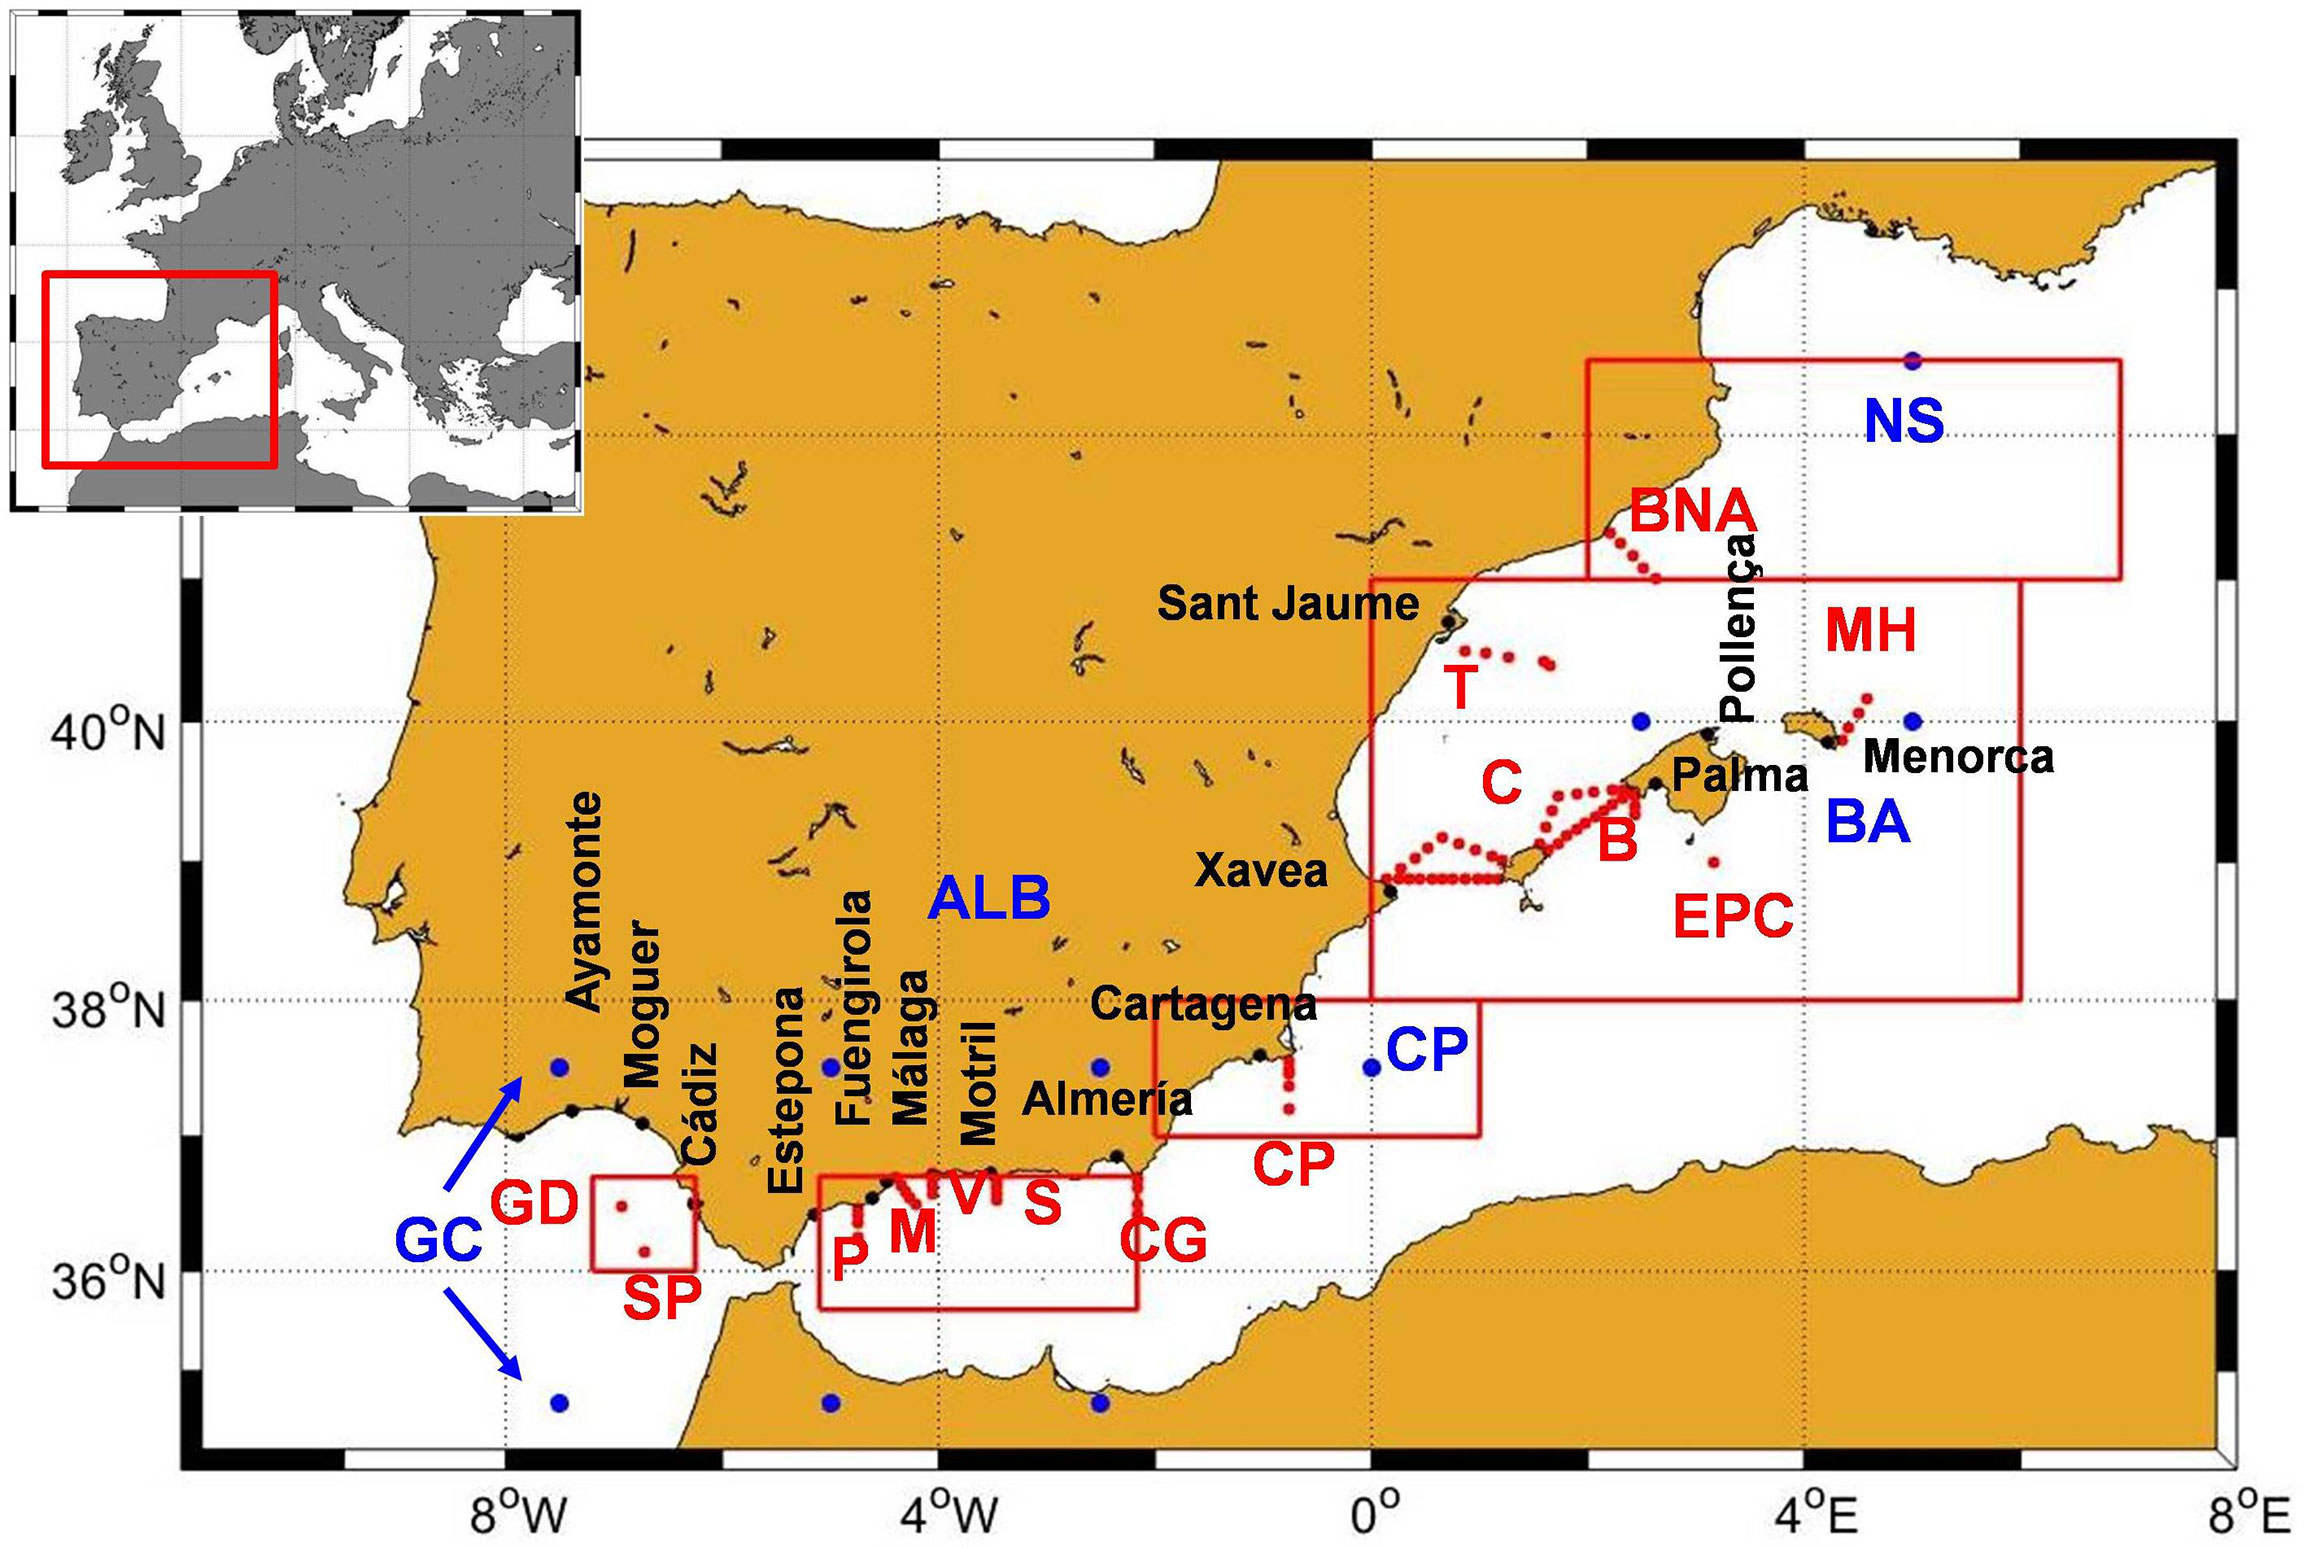
Figure 1 Map of the area of study. Red dots and labels show the position of the STOCA and RADMED oceanographic stations. Black dots and labels are the position of the coastal meteorological stations from the Spanish meteorological agency (AEMET). Red rectangles are the regions where Argo MLD, Chlorophyll concentration, and SST data were averaged for obtaining monthly time series. Blue dots are the NCEP/NCAR grid points where reanalysis data were collected and averaged for obtaining monthly time series over the same regions used for MLD, Chl and SST data.
The second category would include those variables that can have some influence on the mixing or stratification of the water column. These variables include wind intensity, air temperature, and precipitation rates, and were collected from two sources. The first one consists of several meteorological coastal stations from the Spanish meteorological service (Agencia Estatal de Meteorología, AEMET). The stations selected and their names correspond to black dots and labels in Figure 1. These data provide information about the meteorological conditions on a local scale. The AEMET time series are made of hourly or daily data. The wind time series extend from 1990 to 2021 in most cases, although some meteorological stations started operating more recently. Precipitation time series also extend from 1990 to 2021. In this case there are some longer time series, as Cádiz which starts in 1935, Málaga, in 1942, Menorca in 1965 and Palma, in 1978. The second data set has a broader spatial scale, and was obtained from the reanalysis of NCEP/NCAR at the NOAA (National Oceanographic and Atmospheric Agency) Physical Science Laboratory (https://psl.noaa.gov/data/gridded/index.html/, Kalnay et al., 1996). This data set consists of wind and precipitation monthly data with a 2.5° x 2.5° spatial resolution. Wind data start in 1948 and precipitation data in 1979. Blue dots and labels in Figure 1 show the selected grid points for each of the five studied regions.
Finally, the last category is selected to analyze the possible consequences of changes in the water column stratification on ocean productivity. Surface chlorophyll concentration can be considered as a proxy for primary production (Boyce and Boris Worm (2015); Lavigne et al., 2015). Hence, monthly time series of gridded sea surface chlorophyll concentration were downloaded from the Ocean Color NASA (National Aeronautics and Space Administration) web site (https://oceancolor.gsfc.nasa.gov). We used data from the MODIS and SeaWIFS missions with a spatial resolution of 0.0833° x 0.0833°. These time series extend from 1997 to 2021. In addition, Sea Surface Temperature (SST) data were obtained from the “NOAA high-resolution blended analysis of daily SST and ice” (https://psl.noaa.gov/data/gridded/data.noaa.oisst.v2.highres.html). These data have a spatial resolution of 0.25° x 0.25° and the time series extend from 1981 to 2021. Besides the different lengths of the time series presented above, since the earliest CTD profiles obtained in the frame of the IEO monitoring programs started in 1992, the central period analyzed in this work will be 1990-2021. This is also the period analyzed for other variables. In addition, and for having a broader perspective, longer time series were collected when available. In those cases two different time series were analyzed, one corresponding to the 1990-2021 period, and a second one corresponding to the longest available period. Once again, this second long period could be different depending on the variable and the data source.
Methods
Following Vargas-Yáñez et al. (2017) all the CTD profiles from RADMED and STOCA programs were grouped and averaged by season of the year. Average or climatological profiles were calculated for winter (January, February, March), spring (April, May, June), summer (July, August, September) and autumn (October, November, December). For each climatological density profile, the square of the Brünt-Väisälä frequency was calculated in order to get some information about the degree of stratification of the water column:
N2 has units of s-2, g is the acceleration of gravity (9.8 m s-2), ρ is density expressed in kg m-3, and z de vertical coordinate in meters.
For each individual CTD profile from RADMED and STOCA projects, the mixed layer depth was estimated using three different criteria. First, following de Boyer Motégut et al. (2004), we used a threshold method. In this work we have considered a temperature decrease of 0.3°C with respect to a reference value located at 10 m depth (t-threshold hereafter). This value was chosen after visual inspection of all the individual temperature profiles. A second criterion used a density threshold of 0.03 kg m-3 (de Boyer Motégut et al., 2004; d-threshold hereafter). Finally, the mixed layer depth was also estimated using the shallowest extreme curvature of the temperature (Lorbacher et al., 2006). In this latter case it was calculated using the matlab code provided in the supplementary information in Lorbacher et al. (2006). These time series extended from 1992 to 2021 for the case of the longest time series, and from 2009 to 2021 for the case of the shortest ones.
The MLD shows a very clear seasonal cycle worldwide (Kara et al., 2000; de Boyer Motégut et al., 2004; Lorbacher et al., 2006) and also in the case of the Western Mediterranean (Herrmann et al., 2008b; 2014; Somot et al., 2018; Testor et al., 2018; Bahamon et al., 2020). For this reason, the MLD values were grouped and averaged by season of the year. This seasonal cycle was subtracted to each individual value within the time series of MLD, and a series of anomalies or residuals was obtained. Linear trends were estimated by means of least square fits using the time series of residuals. Confidence intervals in the 95% confidence level were calculated taking into account the possible auto-correlation of the series.
According to mixedlayer.ucsd.edu/, MLD values were calculated using both temperature and density threshold methods and those values in de Boyer Motégut et al. (2004). In this case the temperature threshold is 0.2 °C whereas the density threshold is the same used for the CTD data (0.03 kg/m3). For each geographical area (red rectangles in Figure 1), and for each of the two methods used (temperature and density thresholds), the values corresponding to the same month and year were averaged for obtaining monthly time series for each region. Then, all the values corresponding to the same calendar month were grouped and averaged for obtaining a climatological seasonal cycle. This cycle was subtracted to the monthly time series to produce monthly time series of anomalies. These final times series were used for the estimation of linear trends.
Meteorological variables (zonal and meridional components of the wind, wind intensity, precipitation rates, and air temperature) from AEMET meteorological stations were also averaged to obtain monthly time series. Then, the same procedure used for MLD data was followed. An average seasonal cycle was calculated and then it was subtracted from the monthly time series for obtaining time series of residuals or anomalies. This latter time series were used for the estimation of linear trends.
In the case of NCEP/NCAR reanalysis, surface chlorophyll, and SST data sets, all the data from those grid points within each of the five geographical areas considered were averaged for obtaining monthly time series for each region. Then, average seasonal cycles and monthly time series of residuals were estimated.
Results
Seasonal Water Column Stratification
The stratification of the water column in the whole area of study is characterized by both a permanent and a seasonal picnocline (thermocline and halocline). Nevertheless, there are important differences between the Gulf of Cádiz and the WMED and also within the WMED. Average temperature, salinity, density, and N2 profiles were calculated for each oceanographic station (red dots in Figure 1). Figure 2 shows those profiles for some selected stations in the Gulf of Cádiz and the Alboran Sea (Figures 2A, D), for the Cape Palos region and the south of the Balearic Islands (Figures 2B, E), and for those stations to the north of the Balearic Islands (Figures 2C, F). These stations were selected in order to cover the southwest-northeast gradients from the Gulf of Cádiz to the northernmost stations located at the Catalan Sea. Profiles in Figure 2 correspond to winter, when the weakest vertical gradients are observed. Similar results are presented in Figure 3 for summer when the vertical stratification reaches its maximum value. The winter profiles show the permanent stratification. In the case of the Gulf of Cádiz, this is associated to the presence of the North Atlantic Central Water, which is characterized by a decrease of both temperature and salinity with depth. In the case of the Alboran Sea, the permanent stratification is caused by the two layer structure of the Mediterranean Sea, with the Atlantic Water laying above the Mediterranean Waters. In this case, temperature decreases with depth, while salinity increases. In the Gulf of Cádiz, only the temperature contributes to the permanent stratification, whereas in the case of the Mediterranean Sea, both temperature and salinity do. Therefore, the density difference between the sea surface and the 300 m level (the maximum one presented in Figures 2, 3) is much higher in the case of the Mediterranean Sea. In summer, the seasonal thermocline develops, being the main contributor to the vertical density gradient. As a result of this, N2 has a sharp maximum in all the geographical areas (Figures 3D–F) situated around 25 m depth and a much weaker secondary maximum close to 100 m, associated to the permanent picnocline. On the contrary, N2 values do not show a clear pattern during winter, with several local maxima distributed along the upper 100 m of the water column. The winter N2 maxima range between 0.001 s-2 and 0.004 s-2, whereas the summer maxima are an order of magnitude higher, with values around 0.03 s-2.
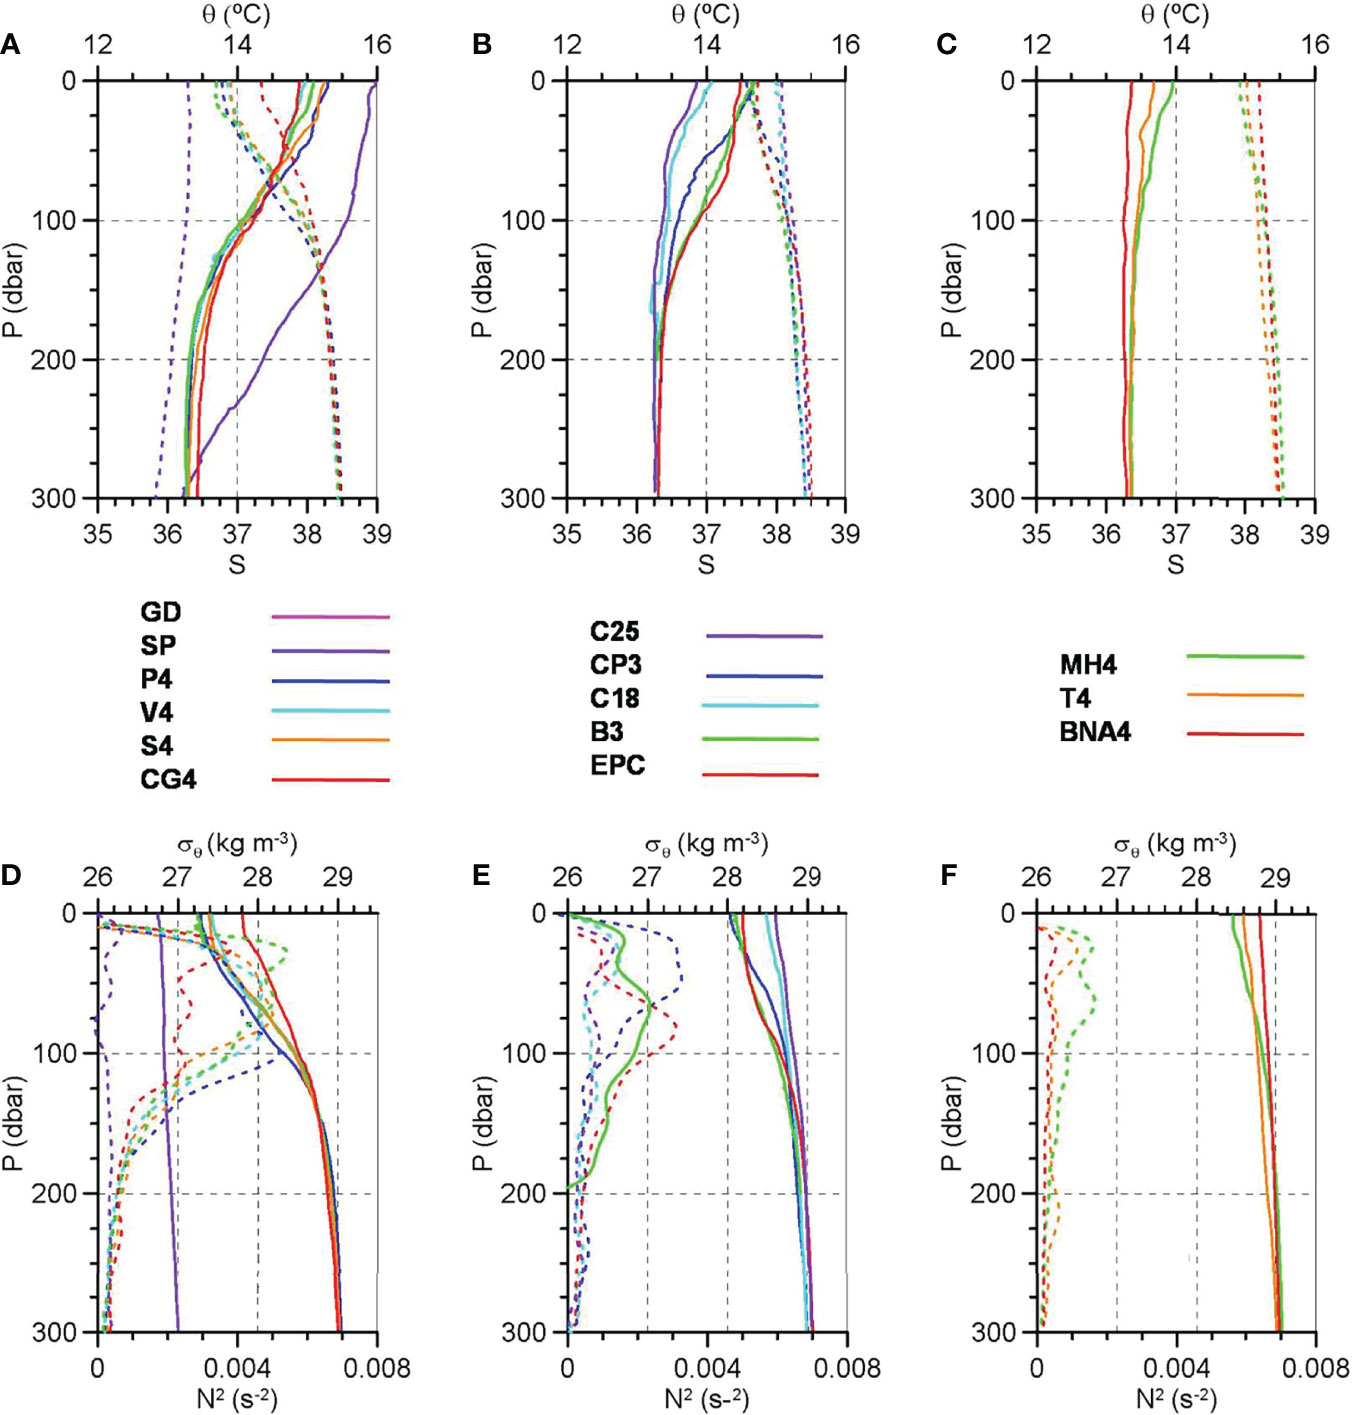
Figure 2 Winter climatology computed for temperature (top panels, continuous lines), salinity (top panels, dashed lines), density (bottom panels, continuous lines), and N2 (bottom panels, dashed lines) vertical profiles at the selected oceanographic stations of the Gulf of Cádiz and the Alborán Sea (A, D), Cape Palos and the south of the Balearic Islands (B, E) and those stations to the north of the Balearic Islands (C, F). See color legend for station identification.
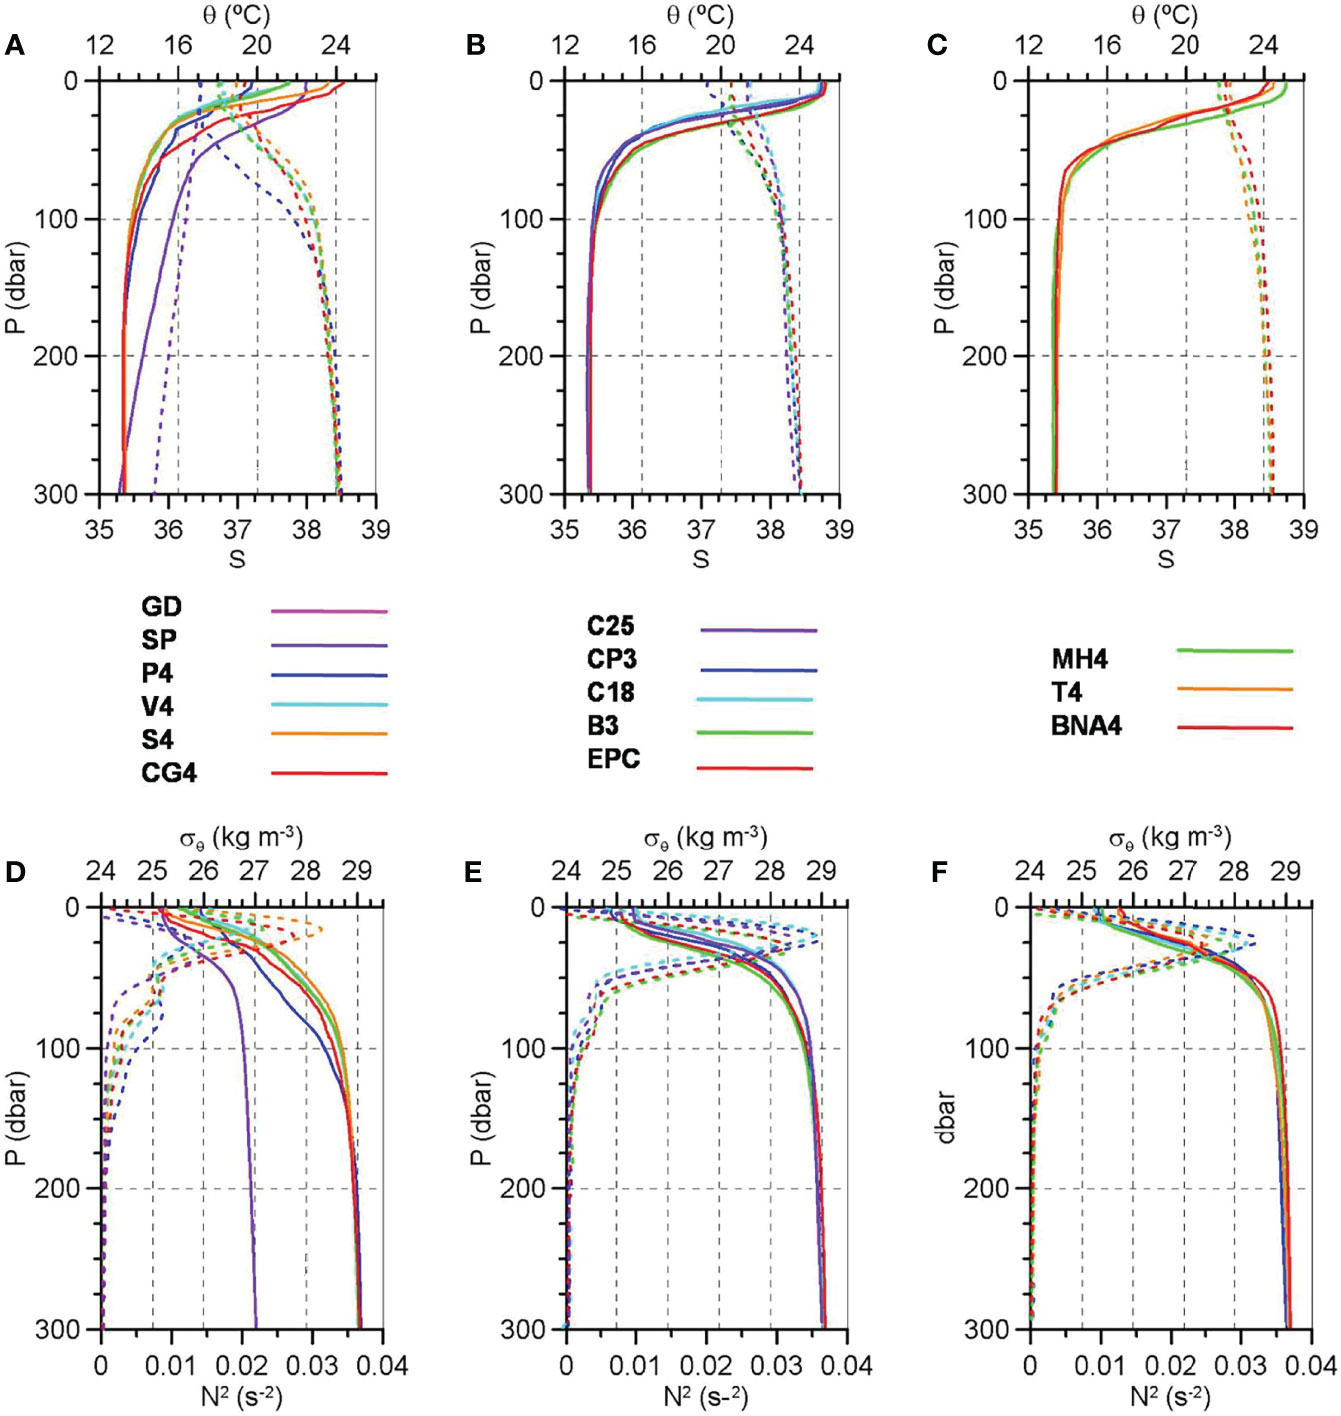
Figure 3 Summer climatology computed for temperature (top panels, continuous lines), salinity (top panels, dashed lines), density (bottom panels, continuous lines), and N2 (bottom panels, dashed lines) vertical profiles at the selected oceanographic stations of the Gulf of Cádiz and the Alborán Sea (A, D), Cape Palos and the south of the Balearic Islands (B, E) and those stations to the north of the Balearic Islands (C, F). See color legend for station identification.
There are also differences within the Mediterranean Sea, with a clear southwest-northeast gradient. Winter surface temperature (salinity) decreases (increases) first, as we move eastwards in the Alboran Sea, and then to the north along the eastern coast of the Spanish Mediterranean. This thermohaline gradient produces important differences in winter surface density which is around 27.75 kg m-3 in the Alboran Sea (Figure 2D), 28 kg m-3 around Cape Palos and to the south of the Balearic Islands (Figure 2E), and between 28.5 and 28.75 kg m-3 at the northernmost stations of the sampling area (Figure 2F). Consequently, there is a horizontal gradient in winter stratification, with N2 values decreasing from 0.004 s-2 in the Alboran Sea (Figure 2D), to 0.001 s-2 at BNA4 station, in the Catalan Sea (Figure 2F).
Seasonal Cycle of the MLD
Figures 4A–F show the average seasonal cycle for some selected stations in the Gulf of Cádiz and in the Alboran Sea. Continuous lines correspond to the four seasonal values obtained from the three-monthly sampling carried out in STOCA and RADMED projects. Blue lines show the results from the t-threshold method, red lines correspond to the d-threshold method (de Boyer Motégut et al., 2004) and black lines are for the temperature curvature method (Lorbacher et al., 2006). In addition, the average seasonal cycle of the MLD, obtained from Argo data (Holte et al., 2017) for the Gulf of Cádiz and for the Alboran Sea areas, are presented in Figures 4A, C as dashed lines, for comparison with the results obtained from ship-borne CTDs. Figures 5A–F show the MLD seasonal cycles for some stations in the Cape Palos area and to the south of the Balearic Islands. The Argo MLD seasonal cycle for the Cape Palos area is included in Figure 5A. Finally, Figures 6A–F show the MLD seasonal cycles for those stations situated to the north of the Balearic Islands and in the Catalan Sea. Argo MLD cycles for the Balearic Sea and for the Northern Sector are included in Figures 6F, D respectively.
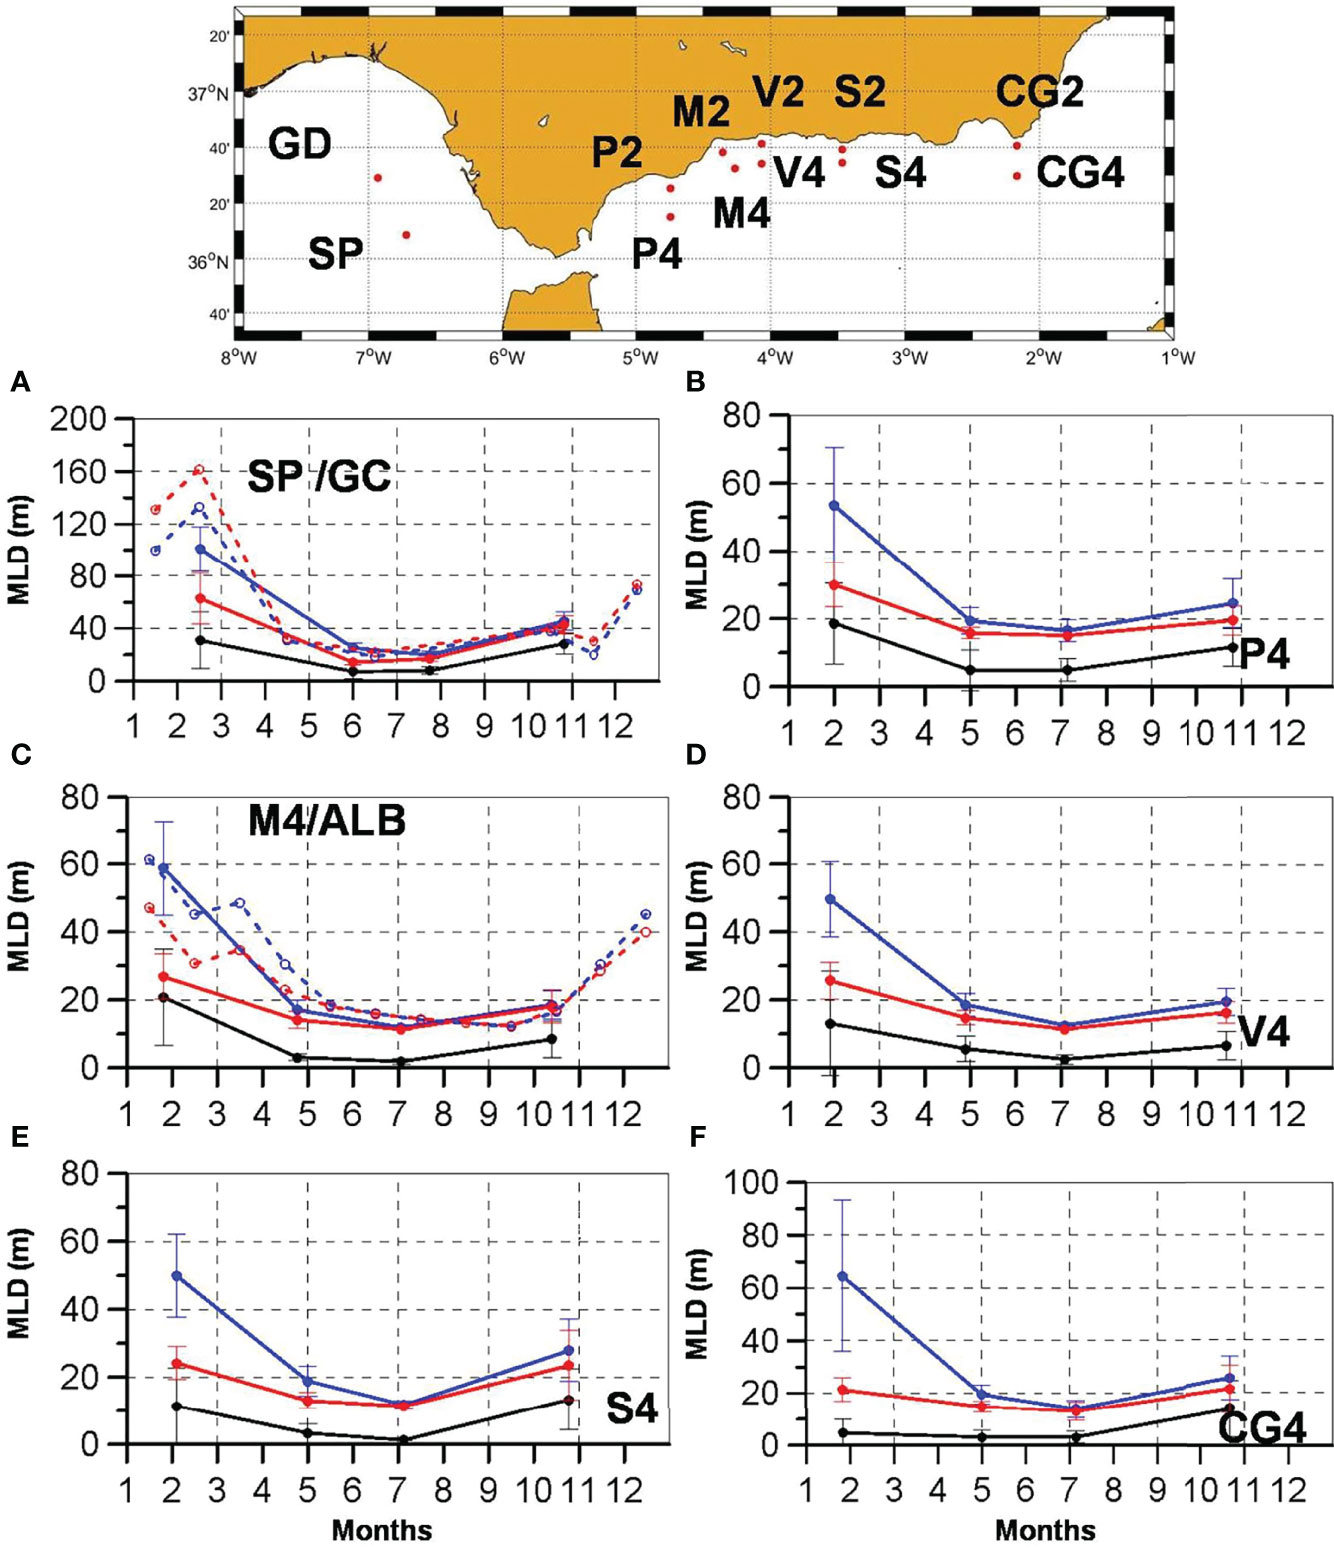
Figure 4 Seasonal cycles of the MLD estimated from the three-monthly sampling of STOCA and RADMED projects (continuous lines) at some selected oceanographic stations (see labels inserted in these figures and the map for the locations), and form the Argo MLD at the regions of the Gulf of Cádiz (A) and the Alborán Sea (C) (dashed lines). Blue lines correspond to the t-threshold method, red lines to the d-threshold method, and black lines to the temperature extreme curvature method. Please, note the different ranges of the y-axis between subplots.
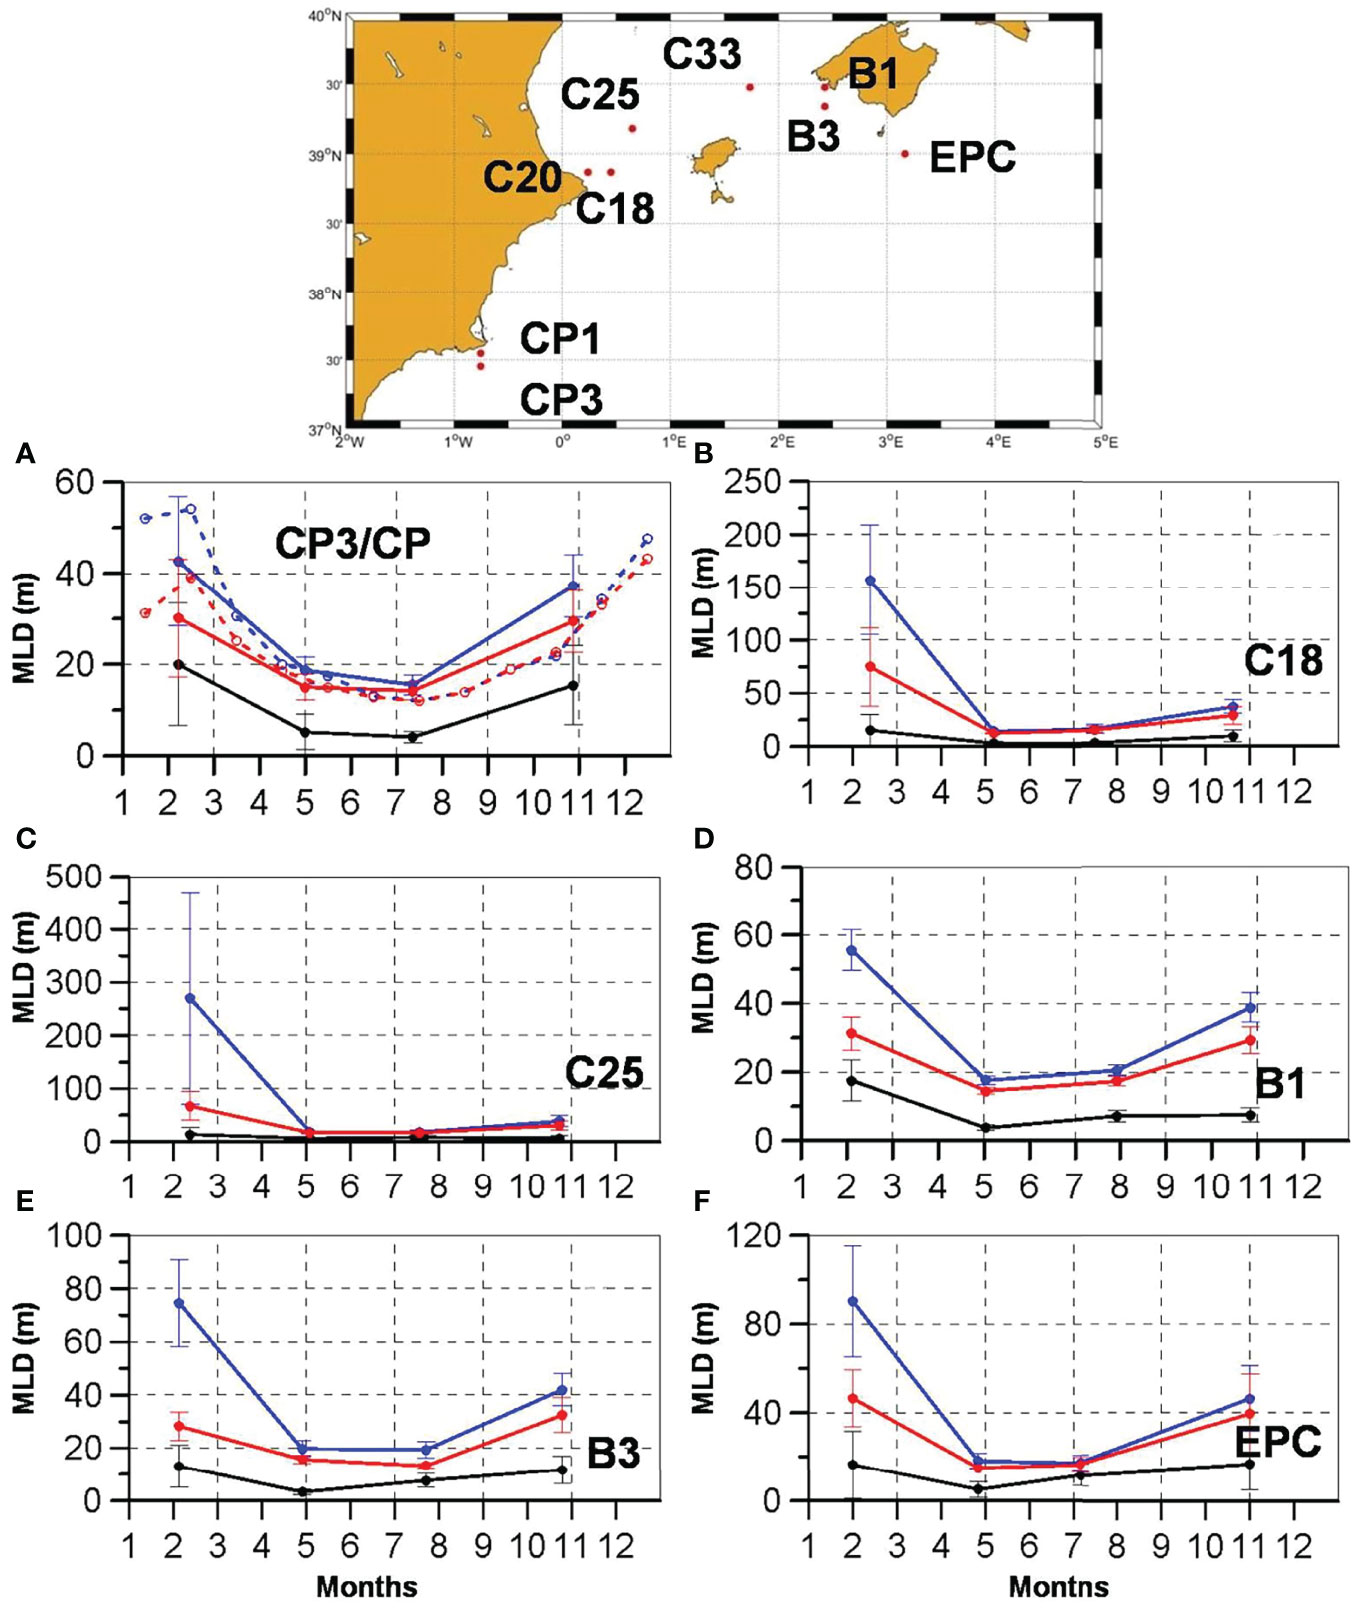
Figure 5 Seasonal cycles of the MLD estimated from the three-monthly sampling of RADMED projects (continuous lines) at some selected oceanographic stations (see labels inserted in these figures and the map for the locations), and form the Argo MLD at the region of Cape Palos (A) (dashed lines). Blue lines correspond to the t-threshold method, red lines to the d-threshold method, and black lines to the temperature extreme curvature method. Please, note the different ranges of the y-axis between subplots.
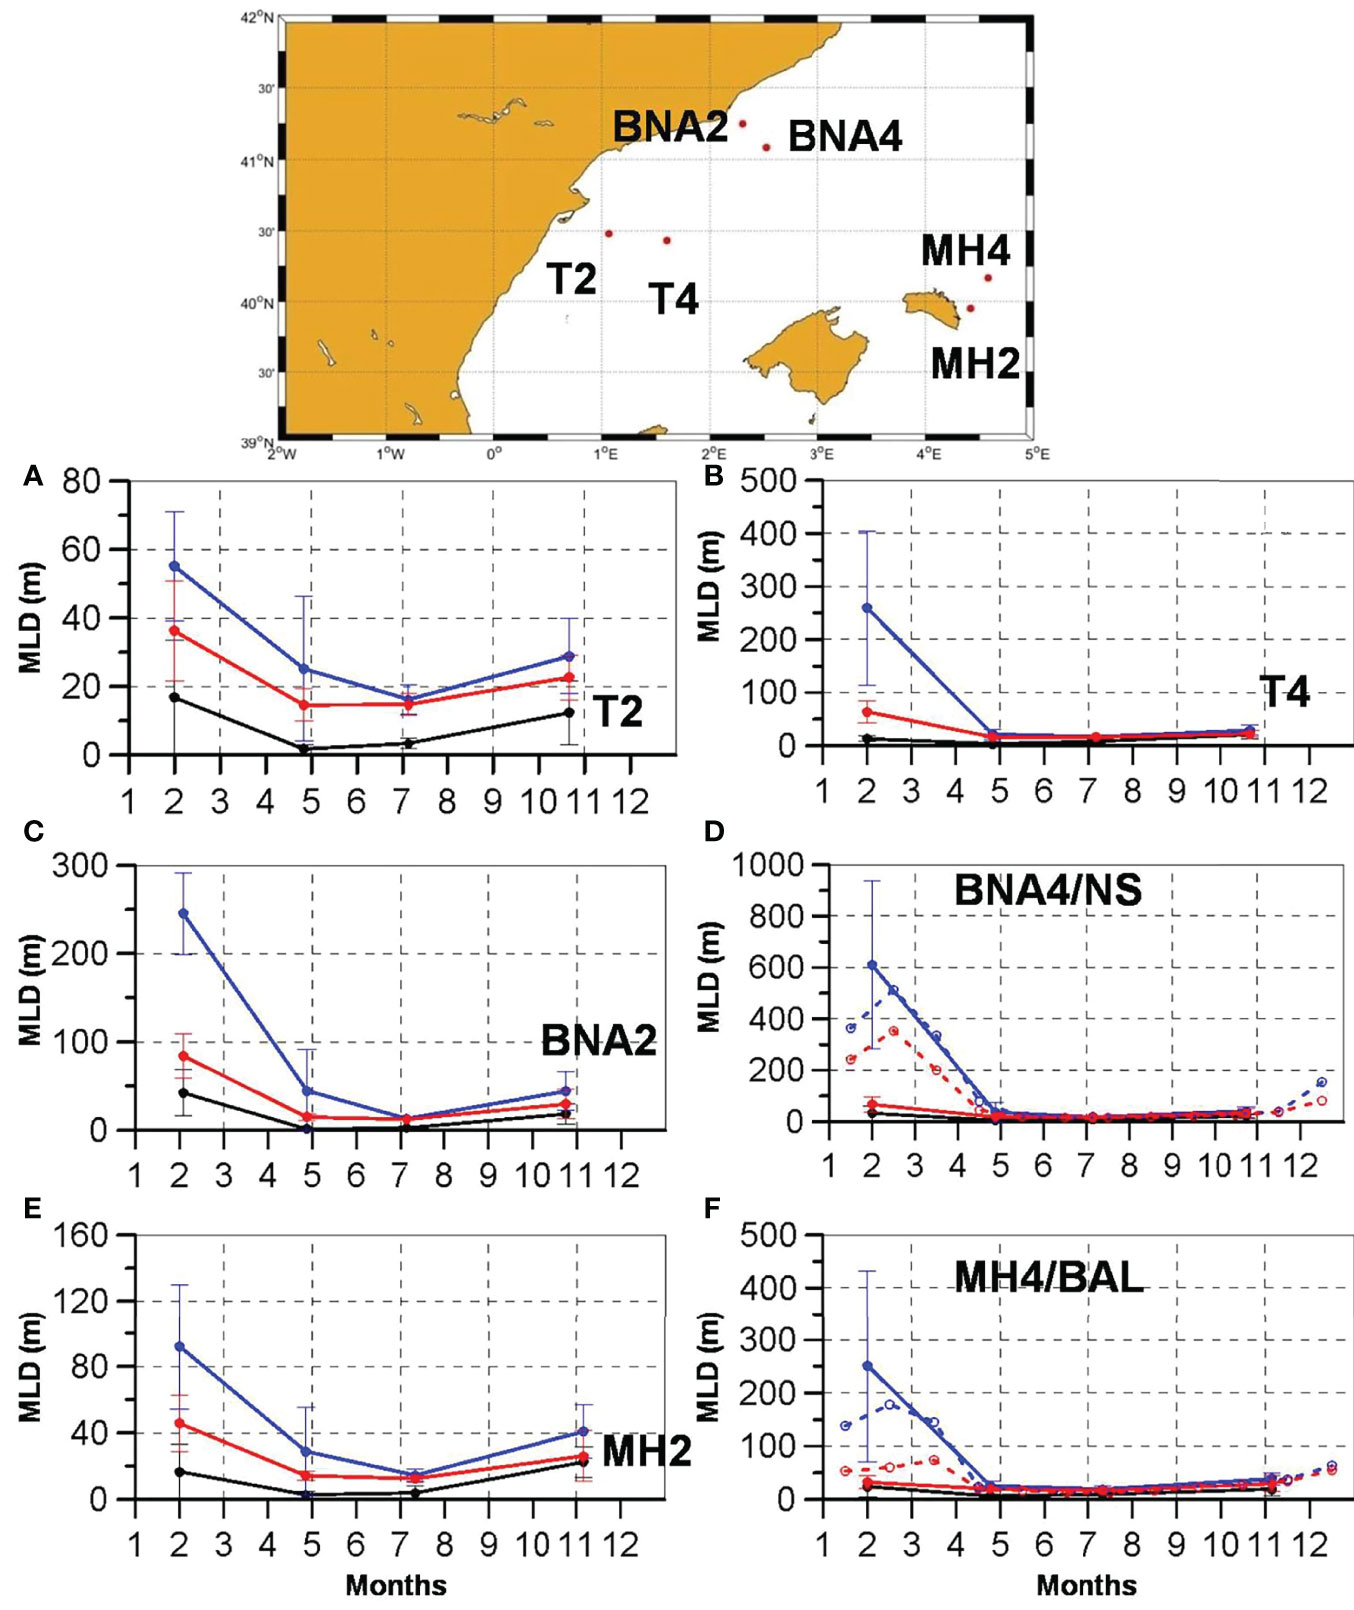
Figure 6 Seasonal cycles of the MLD estimated from the three-monthly sampling of RADMED projects (continuous lines) at some selected oceanographic stations (see labels inserted in these figures and the map for the locations), and form the Argo MLD at the regions of the Northern Sector (D) and the Balearic Islands (F) (dashed lines). Blue lines correspond to the t-threshold method, red lines to the d-threshold method, and black lines to the temperature extreme curvature method. Please, note the different ranges of the y-axis between subplots.
In all the cases analyzed, the seasonal cycle shows maximum values in winter. MLD decreases during spring and summer when the seasonal thermocline develops, reaching minimum values in summer. It starts to increase again during autumn. The use of monthly Argo MLD, shows that the maxima are observed in February, whereas the minima are distributed between July and September.
These results show the same southwest-northeast gradient evidenced in the vertical profiles of temperature, salinity, density, and N2 (Figures 2, 3). The winter MLD at the Alboran Sea and Cape Palos area ranges between 30 and 60 m, depending on the method used (Figure 4). These values increase to 75-150 m to the south of the Balearic Islands (Figure 5) and to 300 m in the Ibiza Channel. Finally, the deepest MLD is reached at BNA4, in the Catalan Sea (Figure 6D) where it ranges between 500 m and 600 m. The only exception to this spatial trend is observed in the Gulf of Cádiz, where winter MLD is deeper than in the Alboran Sea (Figure 4).
When using RADMED and STOCA CTD data, the MLD values calculated using the t-threshold method (blue lines in Figures 4–6) are always deeper than those obtained using a density criterion (red lines in Figures 4–6). This behavior is also observed for Argo MLD (with the only exception of the Gulf of Cádiz MLD). Nevertheless, despite the criterion and the data set used, the results are similar from a qualitative point of view. On the contrary, the extreme curvature method seems to sub-estimate the MLD in all of the cases.
MLD Linear Trends
Linear trends were estimated from the time series of anomalies of MLD for the 85 stations corresponding to STOCA and RADMED projects (red dots in Figure 1). For each station three different time series were available corresponding to the three methods used for determining the MLD: t-threshold, d-threshold, and extreme curvature (see methods section). In addition to this, the MLD obtained by means of the temperature and density threshold methods were applied to smoothed temperature and density profiles. Therefore, linear trends were estimated for a total of 85 x 5 = 425 time series. In most of the cases the resulting trends were not statistically significant at the 95% confidence level, alternating positive (deepening) and negative (shallowing) trends. Table S1 in supplementary information shows such trends for a subset of the 85 oceanographic stations based on the temperature and density thresholds. In summary, trends were significant only in 1.2% of the series analyzed using the extreme curvature method, in 3.5% of the series, using the t-threshold method, and in 2.4% of the cases, using the d-threshold method. When using smoothed time series the results were very similar with 4.7% and 2.4% of significant results.
Table 1 shows the linear trends obtained for the Argo MLD time series (see these time series in Figure S1 in Supplementary Material). In this case, only the results corresponding to the Balearic Sea were significant in the 95% confidence level. These trends were -4.5 ± 2.1 m yr-1 and -1.5 ± 1.1 m yr-1 for the t-threshold and d-threshold respectively.
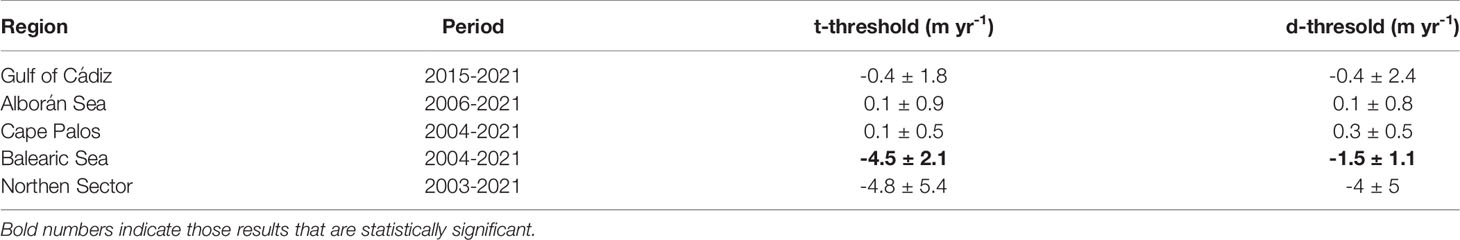
Table 1 Linear trends and confidence interval at the 95% level (b ± CI 95%) for the MLD estimated from the climatology obtained from Argo profilers (mixedlayer.ucsd.edu) at the five study regions, following the temperature (t-threshold, m yr-1) and density (d-threshold, m yr-1) criteria for the longest period available.
Seasonal Cycles and Linear Trends for Wind
Figure 7 shows the average seasonal cycle and the time series of anomalies for the wind intensity and the zonal and meridional components of the wind at those meteorological stations with the longest time series (Figures 7A–F). Such time series extend from 1990 to 2021. The west-east component of the wind is shown in blue (left axis, positive eastwards) and the south-north component in red (left axis, positive northwards). Black lines correspond to wind intensity (right axis). We also present the same results for the reanalysis time series corresponding to the geographical areas of the Gulf of Cádiz and the Alboran Sea (blue dots in Figure 1, red rectangles in Figures 7G–J).
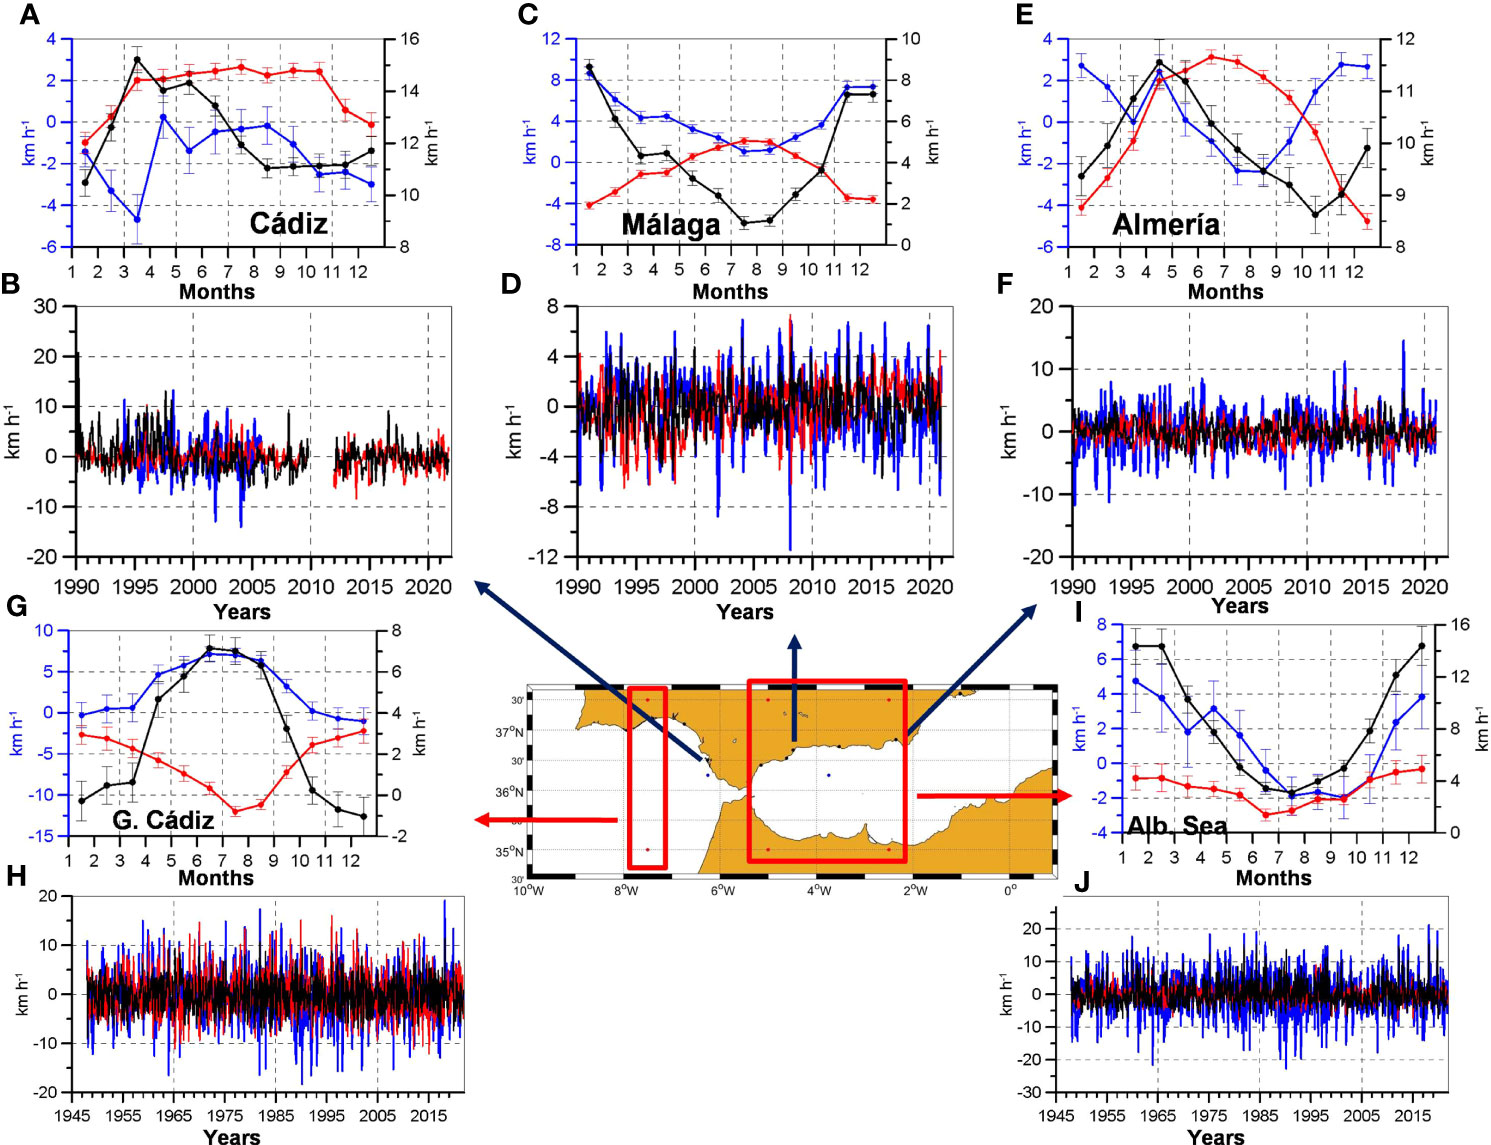
Figure 7 (A, C, E) are the seasonal cycles of west-east component of the wind (blue lines and left axis), south-north component (red lines and left axis) and the wind intensity (black lines and right axis) for the meteorological stations of Cádiz, Málaga, and Almería. (B, D, F) are the corresponding time series of anomalies. (G, I) are the wind seasonal cycles for the regions of Gulf of Cádiz and the Alborán Sea, using the reanalysis data. (H, J) are the corresponding time series of anomalies.
There are some differences between the Gulf of Cádiz and the Alborán Sea stations, and also between those results obtained from the local meteorological stations and those from the reanalysis data. These differences indicate the influence of local factors on the seasonal evolution of the winds. Considering the reanalysis results, the Gulf of Cádiz (Figure 7G) shows the prevalence of winds flowing eastwards (westerlies) and southwards (northerlies) during the whole year, with a maximum intensity during the summer months. In the Alborán Sea (Figure 7I), the wind blows from the north all the year round. The zonal component blows from the west during most of the year, with a shift to easterly winds during summer, when the wind intensity has a minimum value. Figure 8 shows similar results for those meteorological stations located on the eastern coast of the Spanish Mediterranean and on the Balearic Islands (Figures 8A–F). It also presents those results corresponding to the geographical areas named as Balearic Islands and Northern Sector (blue dots in Figure 1 and red rectangles in Figures 8G–J). Once again there are important differences between the results from local meteorological stations and those from the reanalysis data. Concerning these latter results, the wind in the Balearic Islands (Figure 8G) follows a pattern similar to that observed in the Alboran Sea. The meridional component of the wind is negative during the whole year (northerly winds). The zonal component is directed eastwards for most of the year, with the only exception of the summer months when the prevailing direction of the wind is westwards (easterlies). The intensity of the wind also has a clear seasonal cycle with minimum values occurring in summer. The wind seasonal cycles at the Northern Sector (Figure 8I) exhibit some differences. On the average, the wind flows eastwards (westerlies) and southwards (northerlies), with no sign change along the year for none of both components. The maximum intensity of the wind is observed in winter, with a secondary maximum in summer.
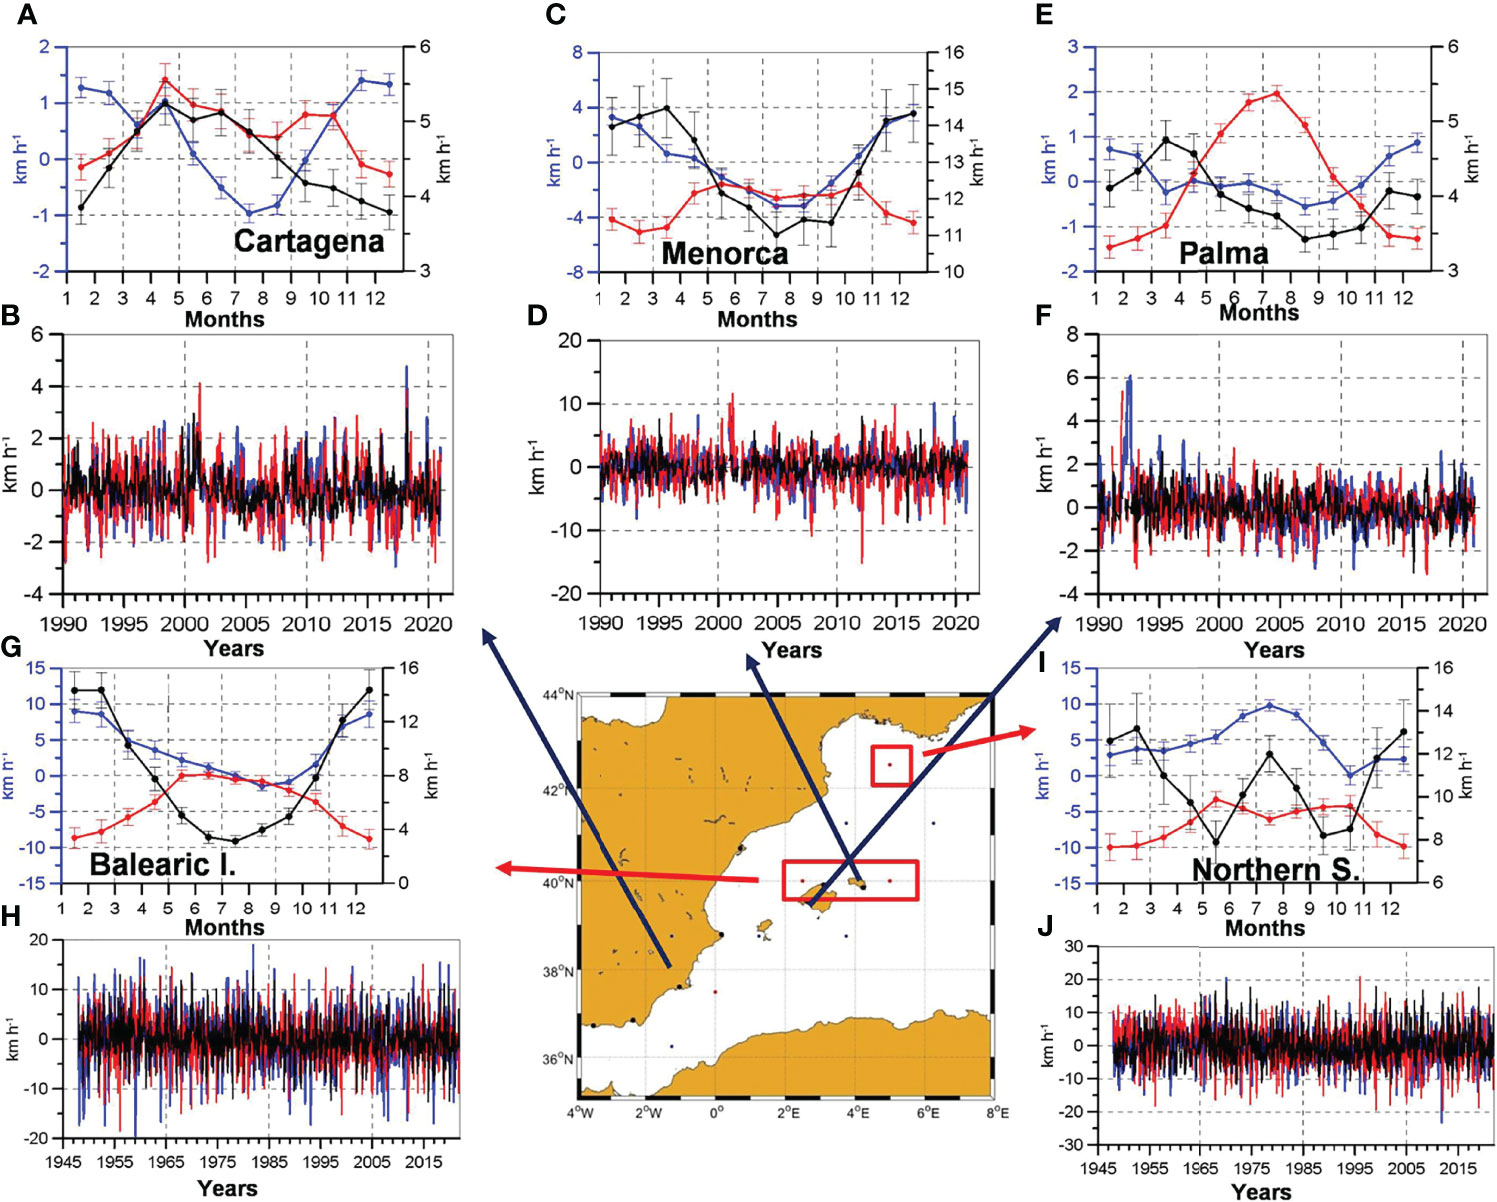
Figure 8 (A, C, E) are the seasonal cycles of west-east component of the wind (blue lines and left axis), south-north component (red lines and left axis) and the wind intensity (black lines and right axis) for the meteorological stations of Cartagena, Menorca, and Palma. (B, D, F) are the corresponding time series of anomalies. (G, I) are the wind seasonal cycles for the regions of Balearic Islands and the Northern Sector, using the reanalysis data. (H, J) are the corresponding time series of anomalies.
Table 2 shows the linear trends for time series of anomalies of the wind intensity at the different local meteorological stations, and Table 3 shows the linear trends for the wind intensity at the five regions where reanalysis data were obtained. Notice that in this latter case, data are available for a longer period of time. Therefore, trends were estimated for two different periods. First, from 1990 to 2021, for comparison with the local meteorological stations and with the MLD trends, and second, for the longest available period: 1948-2021. Trends estimated from the meteorological stations showed significant and non-significant trends (Table 2). Those significant trends were positive in some cases and negative in others without any clear spatial pattern. Nevertheless, many of the time series analyzed started after 1990 and had a short length. If we consider those series extending from 1990 to 2021 (Cádiz, Málaga, Almería, Cartagena and Palma, see Figure 1 for the locations), trends were significant in all the cases, being such trends negative in four cases and positive in one case. On the contrary, reanalysis time series showed no significant trends in most of the five regions considered (Table 3), nor for the period 1990-2021, neither for the extended one (1948-2021). The only exceptions corresponded to the Balearic Islands during the period 1948-2021, and to the Northern Sector from 1990 to 2021.
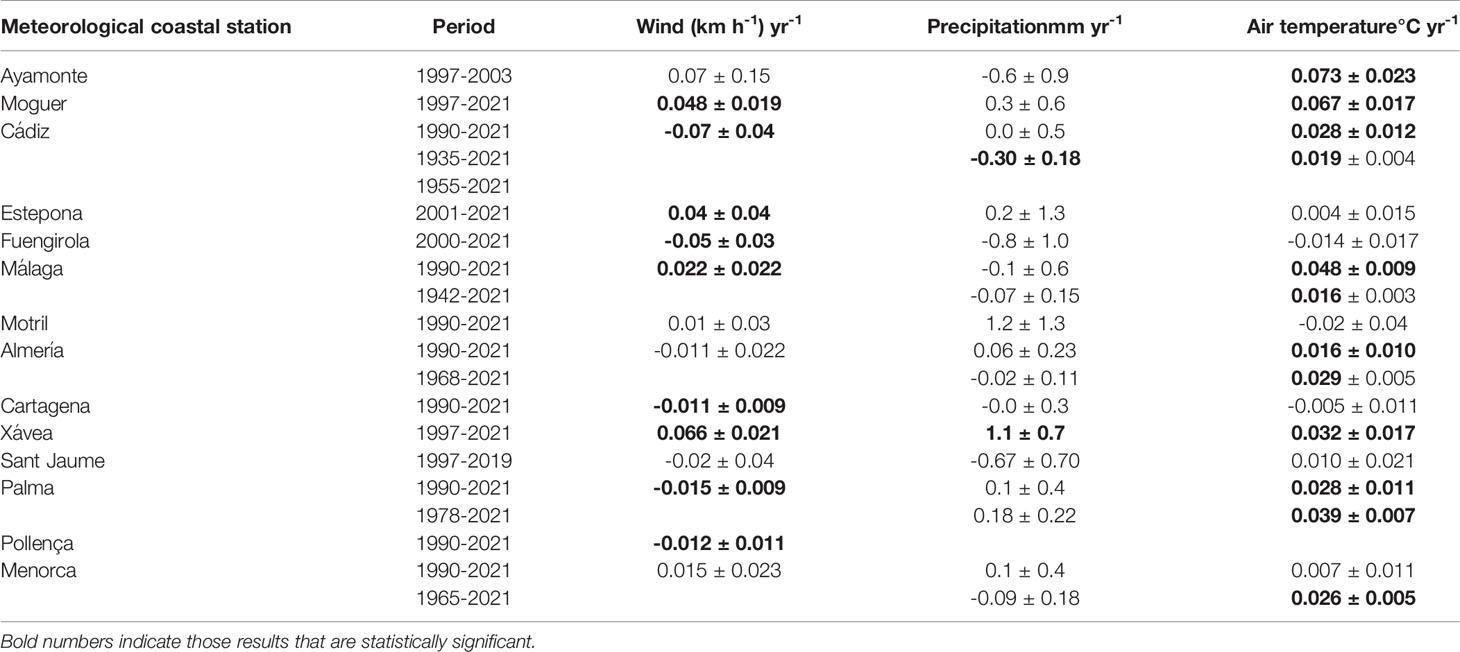
Table 2 Linear trends and confidence interval at the 95% level (b ± CI 95%) for the wind intensity ((km h-1) yr-1), precipitation rate (mm yr-1) and air temperature (°C yr-1) at the selected coastal meteorological stations (Spanish meteorological agency, AEMET) for the longest period available.
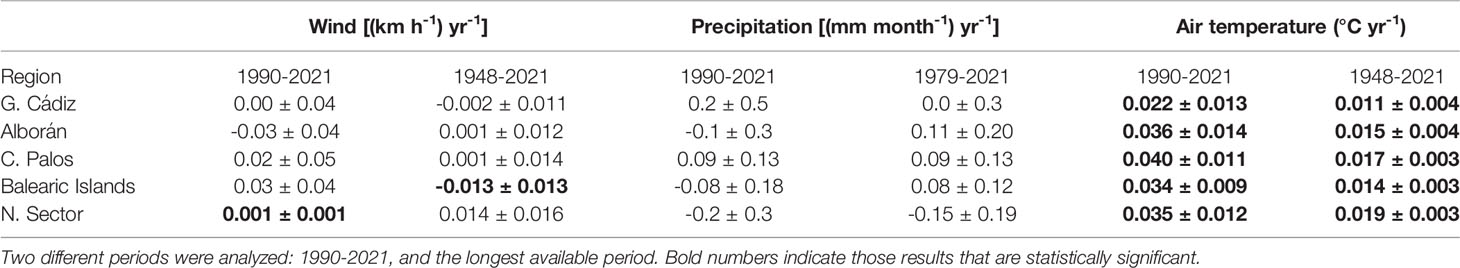
Table 3 Linear trends and confidence interval at the 95% level (b ± CI 95%) for the wind intensity ((km h-1) yr-1), precipitation rate (mm yr-1) and air temperature (°C yr-1) computed from NCEP/NCAR reanalysis data sets at the five study regions.
Seasonal Cycles and Linear Trends for Precipitation Rates and Air Temperature
The seasonal cycle of precipitation rates shows the well known characteristics of the Mediterranean region. Figure S2 in supplementary information shows these seasonal cycles and the time series of anomalies for the precipitation rates at those meteorological stations with the longest time series, and for the Gulf of Cádiz and the Alboran Sea regions (NCEP data). Figure S3 shows similar results for the Palma and Menorca meteorological stations, and the regions Cape Palos, Balearic Islands, and Northern Sector. The average seasonal cycles are similar in all the cases, with maximum precipitations in autumn and winter, and minimum ones in summer. The only difference is the presence of a secondary maximum in spring in some locations. This secondary maximum is more pronounced in the Balearic Sea and the Northern Sector.
Linear trends for the precipitation rates at the local meteorological stations are presented in Table 2. For some of these locations, data were available for a longer period of time. In those cases, the trends were calculated for the period 1990-2021, and for the longest period available. Once again, trends are not significant in most of the cases, with positive and negative values alternating. When considering the reanalysis time series of precipitation rates, none of the trends were significant (Table 3).
Figures S4, S5 in supplementary material show the seasonal cycles of air temperature and the time series of anomalies at the same meteorological stations and geographical areas considered in Figures S2, S3. In the case of the meteorological stations, we include monthly values of daily minimum, maximum and mean temperatures. Table 2, 3 show the linear trends for the air temperature for coastal meteorological stations and reanalysis data. These results show the well known increase of the air temperatures. It is important to notice that linear trends have very large values when short periods are considered (see for instance Moguer and Ayamonte trends in Table 2 for the period 1997-2021). The reanalysis data show lower trends, ranging between 0.01 and 0.02°C yr-1 for the period 1948-2021, with an intensification of these positive trends for the recent period 1990-2021.
Surface Chlorophyll Concentration and Sea Surface Temperature
Figure 9A presents the seasonal cycles of surface chlorophyll concentrations at the five geographical areas analyzed. Figures 9B–F are the time series of anomalies for the same regions. These figures clearly show the decrease of chlorophyll concentrations within the Mediterranean Sea. The highest chlorophyll concentrations are observed during winter in all the regions, with maximum values in March (Figure 9A). The only exception would be the Northern Sector where the maximum value is reached in April. These concentrations decrease from the Gulf of Cádiz to the Alboran Sea, and then along the eastern coast of the Spanish Mediterranean. The only exception corresponds to the early spring values in the Northern Sector. Notice that the variance of the time series of anomalies also decreases from the Gulf of Cádiz (Figure 9B) to the interior of the Mediterranean Sea (Figures 9C–F).
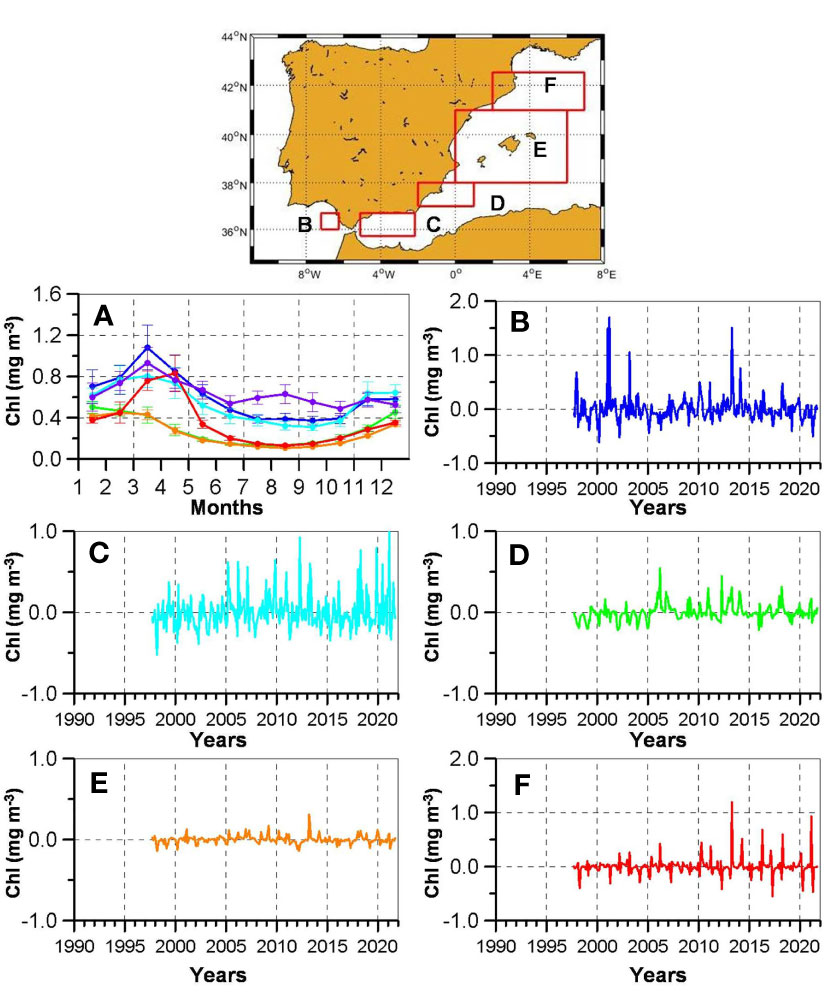
Figure 9 Seasonal chlorophyll concentration (A) and the corresponding time series of anomalies computed for the five study regions: Gulf of Cádiz (blue line, B), Alborán Sea (blue light line, C), Cape Palos (green line, D), Balearic Islands (orange line, E), and the Northern Sector (red line, F). Please, note the different ranges of the y-axis between subplots.
The chlorophyll concentrations did not experience any significant trend in most of the regions, with the only exception of the Cape Palos one, where it increased during the period 1997-2021 (Table 4).
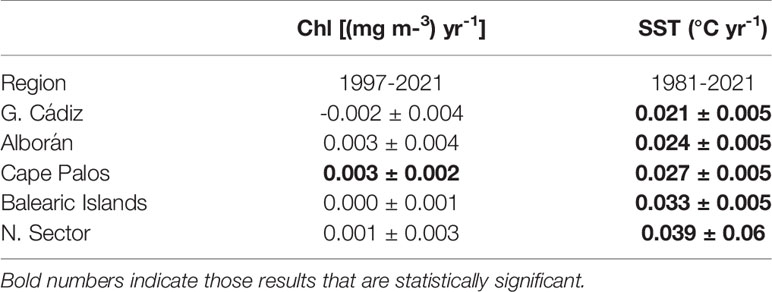
Table 4 Linear trends and confidence interval at the 95% level (b ± CI 95%) for the surface Chlorophyll concentration [(mg m-3) yr-1] and SST (°C yr-1) computed from (add data sets information) at the five study regions for the longest period available.
SST seasonal cycles and time series of anomalies are presented in Figure S6. In this case, the temperatures experienced significant and intense trends that ranged between 0.015°C yr-1 and 0.039°C yr-1 (Table 4).
Discussion and Conclusions
The main goal of the present work was to analyze the time evolution of the MLD along the south and east Spanish coast, from the Gulf of Cádiz to the Catalan Sea, including the de Balearic Islands. The possible existence of trends in this evolution could provide some indications about the increase of the stratification. The first step was to produce time series of MLD as long as possible for the different regions that make up our study area. There is not one single criterion to define the depth of the mixed layer (Kara et al., 2000; de Boyer Motégut et al., 2004; Lorbacher et al., 2006; Holte and Talley, 2009; Holte et al., 2017). We could not rule out a priori that the criterion used to define the MLD could have some impact on the trend estimation. Therefore, we followed the same approach used by Vargas-Yáñez et al. (2021; 2010; 2009) for the detection of long-term trends in the properties of the water masses in the WMED. That is, we repeated the calculations using different criteria, and then we checked if the results were sensitive to the methodology used. A similar issue could arise from the data set used. The longest available homogeneous data sets (periodic samples using the same methodology) are those from the RADMED and STOCA campaigns (three-monthly/CTD), and those temperature and salinity profiles obtained from the Argo profilers deployed within our area of interest.
Concerning the seasonal cycle of the MLD, the results obtained using the CTD time series and using both a t-threshold and a d-threshold criterion were qualitatively similar. These cycles show that the winter MLD increases from the Alboran Sea towards the Mediterranean Sea. The maximum values of MLD are observed at the northernmost stations. This southwest-northeast gradient has several causes. The Alboran Sea waters are strongly stratified because of the influence of fresher Atlantic Water flowing from the nearby Strait of Gibraltar. These waters are also warmer than the Mediterranean waters during winter. On the contrary, surface waters to the north of the Balearic Islands are highly modified after their circulation within the WMED. These geographical areas are also subject to a strong cooling during winter months that enhances the deepening of the mixed layer.
When considering the different criteria used to define the MLD, the main difference is that the t-threshold method always produced larger values than the d-threshold criterion, mainly in winter, when the MLD reaches its maximum value (see continuous blue and red lines in Figures 4–6). These results were also similar to those obtained using Argo data. Once again those estimations based on the temperature criterion were larger than those corresponding to the density criterion. However, in this case, one exception was observed in the winter MLD in the Gulf of Cádiz, where the MLD based on the density criterion was deeper than the one based on the temperature one (dashed lines in Figure 4A). This discrepancy could cast some doubts on the validity of our results. Nevertheless, they can be easily explained by the temperature and density thresholds used in each case.
Be , the vertical gradients of temperature and salinity in the near surface waters (below the reference depth of 10 m), and the stability ratio with α and β the thermal expansion and haline contraction coefficients. Then, if the threshold values used to determine the MLD are |ΔT| and Δρ, then the depth where these values are reached (MLD) can be approached by the expressions:
For CTD data, the 0.3 °C threshold was used. For the Argo data, it was used the same value found in de Boyer Motégut (2004) which is 0.2°C. In both cases the 0.03 kg m-3 value was used for the density threshold. If only the temperature effect on density was considered, the MLD based on density would always be lower than the one based on temperature, as the density change associated to 0.2°C and 0.3°C decrements are larger than 0.03 kg/m3. When the salinity effect is taken into account, this situation holds in the case of the Mediterranean Sea, as the stability ratio R is negative (see expression 2.2). On the contrary, R is positive in the Gulf of Cádiz, and the MLD for the d-threshold is lower for a ΔT=0.3°C (CTD data) and higher for the 0.2°C threshold used by de Boyer Motégut (2004) and Holte et al. (2017).
The extreme curvature method seems to underestimate the MLD seasonal cycle. Nevertheless, if any bias existed in the MLD calculation, it would affect to the complete time series and the estimation of linear trends would not be affected. These trends were not statistically significant in most of the cases, despite the method used for the calculation of the MLD or the data set analyzed (CTD or Argo). Hence we cannot accept the existence of an increase of the stratification in the Spanish Mediterranean waters and the Gulf of Cádiz. The factors that could contribute to the increase of the stratification are the warming of the surface layer, the decrease of salinity, and the decrease of the wind intensity. According to our results, it is clear that the SST has increased from 1981 as a consequence of global warming (Table 4). Such warming is also evidenced by the air temperature trends observed from 1948 in the case of the reanalysis data presented in this work, and from the 1990s decade (Tables 2, 3). Although we have not analyzed salinity data in this work, recent studies (Vargas-Yáñez et al., 2021; 2017) showed an increase of the surface salinity of the Mediterranean Sea as a consequence of an increase of the evaporation minus precipitation, the reduction of the rivers runoff (Skliris, 2014; Schroeder et al., 2017), or the inflow of saltier Atlantic Waters through the Strait of Gibraltar (Millot, 2007). Vargas-Yáñez et al. (2021; 2017) have shown that both temperature and salinity had increased in the different water masses of the WMED along the twentieth century and the beginning of the twenty first one, but those effects canceled each other and no significant trends were observed for the density. Other factors that could enhance the water column stratification would be the increase of precipitations and the decrease of the wind intensity. None of these variables showed significant trend (Tables 2, 3).
In the case of an increase of the stratification, it would be very likely that the sea productivity would decrease as a consequence of a lower supply of nutrients to the euphotic layer, unless an increase of the nutrient concentrations had compensated for the shallowing of the MLD. However, García-Martínez et al. (2019a) have shown that no changes in the nutrient concentrations have been observed since the beginning of the 1990s decade in the Spanish Mediterranean. The surface chlorophyll concentration did not experience significant changes in most of the geographical areas analyzed. This result supports the hypothesis that the MLD has not changed in the Spanish Mediterranean since 1990. However, these results should be taken cautiously as the length of the chlorophyll time series obtained from satellite could not have the length needed to discern between decadal variability and long-term changes (Dutkiewicz et al., 2019; Hammond et al., 2020). Some works have shown that the total phytoplanktonic biomass has not changed in the Mediterranean Sea since the end of the twentieth century, or even it had increased, but its composition could have changed with a substitution of large cells, such as diatoms, by small-size phytoplankton (Marty et al., 2002; El Hourany et al., 2021). The analysis of chlorophyll concentration time series does not allow us to discern this possibility. Anyway, according to the data presented in this work, if this shift in the composition of the Mediterranean planktonic community has occurred, it could not be attributed to an increase of the stratification of the water column.
Our results support the hypothesis that in the case of the WMED, the increase of salinity has compensated for the warming of the surface waters, preventing the increase of the stratification of the upper part of the water column. According to projections for the twenty first century, both warming and salting trends will continue in the Mediterranean Sea, making it difficult to predict the evolution of the vertical density gradients. Therefore, it is of paramount importance to determine whether or not these changes are occurring in the Mediterranean waters and if such potential changes have any impact on the productivity of the sea. We have not found significant changes in the time series of MLD, neither on those variables that can have some influence on it (meteorological variables) or that can be affected by it (chlorophyll concentration). However, these results should be taken with caution and two questions should be considered: First, they are related to the winter mixing that is observed along the continental shelf and slope of a large area within the WMED, but they cannot be extrapolated to the process of deep water formation that occurs in the waters close to the Gulf of Lions under more extreme conditions and involving more complicated process. Several works have shown that deep convection processes could weaken during the twenty first century (Somot et al., 2006; Adloff et al., 2015). Second, the longest time series analyzed in the present work extend from 1992 to 2021, and in many cases they were shorter. We cannot discard the possibility that the trends observed are simply the result of decadal variability and do not represent the real long-term behavior of MLD and chlorophyll concentration in this area of the WMED. This is especially true for the case of the Gulf of Cádiz, where MLD time series only extend from 2009 to 2021 in the case of STOCA project, and from 2015 to 2021 in the case of Argo MLD. On the other hand, the larger the variance of a variable, the longer the length of the time series required to detect any trend. Hence, it cannot be discarded the possibility that the detection of trends for variables such as MLD or chlorophyll concentration needs longer time series (Del Castillo et al., 2019; Pinkerton et al., 2021). This shortcoming is especially important when trying to detect possible changes in the specific composition of the phytoplanktonic community. Previous works analyzing RADMED time series from 1992 to 2015 did not show significant trends for the chlorophyll and nutrients concentrations along the continental shelf and slope of the Spanish Mediterranean, neither could be detected changes in the composition of the main phytoplaktonic groups (García-Martínez et al., 2019a; 2019b). These authors already pointed out that the variables analyzed had a large variance and that longer time series would be needed to detect long-term changes. To our knowledge, apart from the RADMED and STOCA projects, the only time series including phytoplanktonic sampling along the water column in the Gulf of Cádiz and the Spanish Mediterranean, are those of the Blanes Bay Microbial Observatory (BBMO, Gasol et al., 2016; Auladell et al., 2019), the Operational Observatory of the Catalan Sea (OOCS, Bahamon et al., 2020), and the Balearic Islands Coastal Observing System (SOCIB, Tintoré et al., 2019). Auladell et al. (2019) analyzed time series of anoxygenic photoheterotrophic bacteria in the BBMO, and no results are available for the phytoplankton sampling in the Balearic Channels carried out by SOCIB. Bahamon et al. (2020) found no changes in the chlorophyll and nutrient concentrations close to the Blanes Canyon (Catalan Sea), during the period 2010-2017. In summary, this work and those reviewed above, evidence the scarcity of long multidisciplinary time series, and the short length of the existent ones. Our results show that it cannot be considered that the MLD has become shallower in the Spanish Mediterranean and the Gulf of Cádiz as a result of the increase of the stratification, nor can be established a reduction in the productivity of the Mediterranean waters. Nevertheless, the length of the available time series does not allow us to discern whether this is the consequence of the compensating effects of warming and salting of the surface waters, or it is simply that the large variance of these variables requires longer time series to detect any change. In any case, these results stress the importance of completing and maintaining the existent observation systems of the Mediterranean Sea in order to answer this and other questions.
Data Availability Statement
The datasets presented in this study can be found in online repositories. The names of the repository/repositories and accession number(s) can be found below: http://www.ba.ieo.es/ibamar.
Author Contributions
MV-Y analyzed the time series and is responsible for the matlab codes for the analysis of time series. He also wrote the original manuscript. FM, EB and PR prepared the graphics, tables and participated in the review of the manuscript and redaction of the final version. They also were involved in the bibliographic review previous to the redaction of the work. RB, RS-L and RS maintained and updated the IBAMAR database and the STOCA time series, and are involved in the field works of the RADMED project. They also participated in the review and final version of the manuscript. MG-M is the responsible of the RADMED project. She took part in the redaction of the initial manuscript and its final review. All the authors took part in the discussion of the results. All authors contributed to the article and approved the submitted version.
Funding
This work has been carried out in the frame of the project RADMED (Series temporales de datos oceanográficos en el Mediterráneo) and STOCA (Series temporales de datos oceanográficos en el Golfo de Cádiz) founded by the Instituto Español de Oceanografía (IEO-CSIC).
Conflict of Interest
The authors declare that the research was conducted in the absence of any commercial or financial relationships that could be construed as a potential conflict of interest.
The handling editor JL declared a past co-authorship with the author RS-L.
Publisher’s Note
All claims expressed in this article are solely those of the authors and do not necessarily represent those of their affiliated organizations, or those of the publisher, the editors and the reviewers. Any product that may be evaluated in this article, or claim that may be made by its manufacturer, is not guaranteed or endorsed by the publisher.
Supplementary Material
The Supplementary Material for this article can be found online at: https://www.frontiersin.org/articles/10.3389/fmars.2022.901893/full#supplementary-material
References
Adloff F., Somot S., Sevault F., Jordà G., Aznar R., Déqué M., et al. (2015). Mediterranean Sea Response to Climate Change in an Ensemble of Twenty First Century Scenarios. Climate Dynamics 45, 2775–2802. doi: 10.1007/s00382-015-2507-3
Agusti S., Martinez-Ayala J., Regaudie-de-Gioux A., Duarte C. M. (2017). Oligotrophication and Metabolic Slowing-Down of a NW Mediterranean Coastal Ecosystem. Front. Mar. Sci. 4. doi: 10.3389/fmars.2017.00432
Auladell A., Sánchez P., Sánchez O., Gasol J. M., Ferrera I. (2019). Long-Term Seasonal and Interannual Variability of Marine Aerobic Anoxygenic Photoheterotrophic Bacteria. ISME J. 13, 1975–1987. doi: 10.1038/s41396-019-0401-4
Bahamon N., Aguzzi J., Ahumada-Sempoal M. A., Bernardello R., Reuschel C., Company J. B., et al. (2020). Stepped Coastal Water Warming Revealed by Multiparametric Monitoring at NW Mediterranean Fixed Stations. Sensor 20, 2658. doi: 10.3390/s20092658
Behrenfeld M. J., O’Malley R. T., Siegel D. A., McClain C. R., Sarmiento J. L., Feldman G. C., et al. (2006). Climate-Driven Trends in Contemporary Ocean Productivity. Nature 444, 7. doi: 10.1038/nature05317
Bindoff N. L., Cheung W. W. L., Kairo J. G., Arístegui J., Guinder V. A., Hallberg R., et al. (2019). “Changing Ocean, Marine Ecosystems, and Dependent Communities,” in IPCC Special Report on the Ocean and Cryosphere in a Changing Climate. Eds. Pörtner H.-O., Roberts D. C., Masson-Delmotte V., Zhai P., Tignor M., Poloczanska E., Mintenbeck K., Alegría A., Nicolai M., Okem A., Petzold J., Rama B., Weyer N. M. (Cambridge University Press, Cambridge, UK and New York, NY, USA).
Boyce D. G., Worm B. (2015). Patterns and Ecological Implications of Historical Marine Phytoplankton Change. Mar. Ecol. Prog. Ser. 534, 251–272. doi: 10.3354/meps11411
Calvo E., Simó R., Coma R., Ribes M., Pascual J., Sabatés A., et al. (2011). Effects of Climate Change on Mediterranean Marine Ecosystems: The Case of the Catalan Sea. Climate Res. 502011, 1–29. doi: 10.3354/cr01040
Coll M., Piroddi C., Albouy C., Ben Rais Lasram F., Cheung W. W. L., Christensen V., et al. (2011). The Mediterranean Sea Under Siege:Spatial Overlap Between Marine Biodiversity, Cumulative Threats and Marine Reserves. Global Ecol. Biogeogr. 21, 465–480. doi: 10.1111/j.1466-8238.2011.00697.x
Comesaña A., Fernández-Castro B., Chouciño P., Fernández E., Fuentes-Lema A., Gilcoto M., et al. (2021). Mixing and Phytoplankton Growth in an Upwelling System. Front. Mar. Sci. 8. doi: 10.3389/fmars.2021.712342
Coppola L., Legendre L., Lefevre D., Prieura L., Taillandiera V., Riquiera E. D. (2018). Seasonal and Inter-Annual Variations of Dissolved Oxygen in the Northwestern Mediterranean Sea (DYFAMED Site). Prog. Ocean. 162, 187–201. doi: 10.1016/j.pocean.2018.03.001
Cuttelod A., García N., Abdul Malak D., Temple H., Katariya V. (2008). “The Mediterranean: A Biodiversity Hotspot Under Threat,” in The 2008 Review of The IUCN Red List of Threatened Species. Eds. Vié J.-C., Hilton-Taylor C., Stuart S. N. (Switzerland: IUCN Gland).
de Boyer Motégut C., Madec G., Fisher A. S., Lazar A., Iudicone D. (2004). Mixed Layer Depth Over the Global Ocean: An Examination of Profile Data and a Profile-Based Climatology. J. Geophys. Res. 109, C12003. doi: 10.1029/2004JC002378
Del Castillo C. E., Signorini S. R., Karaköylü E. M., Rivero-Calle S. (2019). Is the Southern Ocean Getting Greener? Geophys. Res. Lett. 46, 6034–6040. doi: 10.1029/2019GL083163
Durrieu deMadron X, Guieu C., Sempéré R., Conan P., Cossa D., D’Ortenzio F., et al. (2011). Marine Ecosystems’ Responses to Climatic and Anthropogenic Forcings in the Mediterranean. Prog. Ocean. 91, 97–166. doi: 10.1016/j.pocean.2011.02.003
Dutkiewicz S., Hickman A. E., Jahn O., Henson S., Beaulieu C., Monier E. (2019). Ocean Color Signature of Climate Change. Nature Communications 10, 578. doi: 10.1038/s41467-019-08457-x
El Hourany R., Mejia C., Faour G., Crépon M., Thiria S. (2021). Evidencing the Impact of Climate Change on the Phytoplankton Community of the Mediterranean Sea Through a Bioregionalization Approach. J. Geophys. Research: Ocean. 126, e2020JC016808. doi: 10.1029/2020JC016808
García-Martínez M. C., Vargas-Yáñez M., Moya F., Santiago R., Muñoz M., Reul A., et al. (2019a). Average Nutrient and Chlorophyll Distributions in the Western Mediterranean: RADMED Project. Oceanologia 61, 143—169. doi: 10.1016/j.oceano.2018.08.003
García-Martínez M. C., Vargas-Yáñez M., Moya F., Santiago R., Reul A., Muñoz M., et al. (2019b). Spatial and Temporal Long-Term Patterns of Phyto and Zooplankton in the W-Mediterranean: RADMED Project. Water 11, 534. doi: 10.3390/w11030534
Gasol J. M., Cardelús C., Morán A. X. G., Balagué V., Forn I., Marrasé C., et al. (2016). Seasonal Patterns in Phytoplankton Photosynthetic Parameters and Primary Production at a Coastal NW Mediterranean Site. Sci. Mar. 80, 63–77. doi: 10.3989/scimar.04480.06E
Goffart A., Hecq J.-H., Legendre L. (2002). Changes in the Development of the Winter-Spring Phytoplankton Bloom in the Bay of Calvi (NW Mediterranean) Over the Last Two Decades: A Response to Changing Climate? Mar. Ecol. Prog. Ser. 236, 45–60. doi: 10.3354/meps236045
Goffart A., Hecq J.-H., Legendre L. (2015). Drivers of the Winter-Spring Phytoplankton Bloom in a Pristine NW Mediterranean Site, the Bay of Calvi (Corsica): A Long-Term Study, (1979–2011). Prog. Oceanogr. 137, 121–139. doi: 10.1016/j.pocean.2015.05.027
Hammond M. L., Beaulieu C., Henson S. A., Sahu S. K. (2020). Regional Surface Chlorophyll Trends and Uncertainties in the Global Ocean. Sci. Rep 10, 15273. doi: 10.1038/s41598-020-72073-9
Herrmann M., Estournel C., Adloff F., Diaz F. (2014). Impact of Climate Change on the Northwestern Mediterranean Sea Pelagic Planktonic Ecosystem and Associated Carbon Cycle. J. Geophys. Research Ocean. 119, 5815–5836. doi: 10.1002/2014JC010016
Herrmann M., Estournel C., Déqué M., Marsaleix P., Sevault F., Somot S. (2008a). Dense Water Formation in the Gulf of Lions Shelf: Impact of Atmospheric Interannual Variability and Climate Change. Continent. Shelf Res. 28, 2092–2112. doi: 10.1016/j.csr.2008.03.002
Herrmann M., Somot S., Sevault F., Estournel C., Dé qué M. (2008b). Modeling the Deep Convection in the Northwestern Mediterranean Sea Using an Eddy-Permitting and an Eddy-Resolving Model: Case Study of Winter 1986–1987. J. Geophys. 113, C04011. doi: 10.1029/2006JC003991
Holte J., Talley L. D. (2009). A New Algorithm for Finding Mixed Layer Depths With Applications to Argo Data and Subantarctic Mode Water Formation. J. Atmospher Ocean. Technol. 26, 1920–1939. doi: 10.1175/2009JTECHO543.1
Holte J., Talley L. D., Gilson J., Roemmich D. (2017). An Argo Mixed Layer Climatology and Database. Geophys. Res. Lett. 44, 5618–5626. doi: 10.1002/2017GL073426
Kalnay E., Kanamitsu M., Kistler R., Collins W., Deaven D., Gandin L., et al. (1996). The NCEP/NCAR 40-Year Reanalysis Project. Bull. Am. Meteorol. Soc 77, 437–471. doi: 10.1175/1520-04771996077<0437:TNYRP<2.0.CO;2
Kara A. B., Rochford P. A., Hulburt H. E. (2000). An Optimal Definition for Ocean Mixed Layer Depth. J. Geophys. Res. 105 (C7), 16803–16821. doi: 10.1029/2000JC900072
Lavigne H., D’Ortenzio F., D’Alcalá M. R., Claustre H., Sauzède R., Gacic M. (2015). On the Vertical Distribution of the Chlorophyll-a Concentration in the Mediterranean Sea: A Basin-Scale and Seasonal Approach. Biogeosciences 12, 5021–5039. doi: 10.5194/bg-12-5021-2015
López-Jurado J. L., Balbín R., Alemany F., Amengual B., Aparicio-González A., Fernández de Puelles M. L., et al. (2015). The RADMED Monitoring Programme as a Tool for MSFD Implementation: Towards an Ecosystem-Based Approach. Ocean. Sci. 11, 897–908. doi: 10.5194/os-11-897-2015
Lorbacher K., Demmenget D., Niiler P. P., Köhl A. (2006). Ocean Mixed Layer: A Subsurface Proxy for Ocean-Atmosphere Variability. J. Geophys. Res. Ocean. 111 (C7), C07010. doi: 10.1029/2003jc002157
Macias D., Garcia-Gorriz E., Stips A. (2018). Deep Winter Convection and Phytoplankton Dynamics in the NW Mediterranean Sea Under the Present Climate and Future (Horizon 2030) Scenarios. Sci. Rep. 8, 6626. doi: 10.1038/s41598-018-24965-0
Marty J.-C., Chiavérini J., Pizay M.-D., Avril B. (2002). Seasonal and Interannual Dynamics of Nutrients and Phytoplankton Pigments in the Western Mediterranean Sea at the DYFAMED Time-Series Station, (1991–1999). Deep-Sea Res. II 49, 1965–1985. doi: 10.1016/s0967-0645(02)00022-x
Mazzocchi M., Dubroca L., García-Comas C., Di Capua I., Ribera d’Alcalà M. (2012). Stability and Resilience in Coastal Copepod Assemblages: The Case of the Mediterranean Long-Term Ecological Research at Station MC (LTER-Mc). Prog. Ocean. 97-100, 135–151. doi: 10-1016/j.pocean.2011.11.003 doi: 10.1016/j.pocean.2011.11.003
Millot C. (2007). Interannual Salinification of the Mediterranean Inflow. Geophys. Res. Lett. 34, L21609. doi: 10.1029/2007GL031179
Morison F., Franzè G., Harvey E., Menden-Deuer S. (2020). Light Fluctuations are Key in Modulating Plankton Trophic Dynamics and Their Impact on Primary Production. Limnol. Ocean. Lett. 5, 346–353. doi: 10.1002/lol2.10156
Pasqueron de Fommervault O., Migon C., D'Ortenzio F., Ribera d'Alcalà M., Coppola L. (2015). Temporal Variability of Nutrient Concentrations in the Northwestern Mediterranean Sea (DYFAMED Time-Series Station). Deep-Sea Res. I 100, 1–12. doi: 10.1016/j.dsr.2015.02.006
Pinkerton M. H., Boyd P. W., Deppeler S., Hayward A., Höfer J., Moreau S. (2021). Evidence for the Impact of Climate Change on Primary Producers in the Southern Ocean. Front. Ecol. Evol. 9. doi: 10.3389/fevo.2021.592027
Polovina J. J., Howell E. A., Abecassis M. (2008). Ocean’s Least Productive Waters are Expanding. Geophys. Res. Lett. 35, L03618. doi: 10.1029/2007GL031745
Pulina P., Brutemark A., Suikkanen S., Padedda B. M., Grubisic L. M., Satta C. T., et al. (2016). Effects of Warming on a Mediterranean Phytoplankton Community. Web Ecol. 16, 89–92. doi: 10.5194/we-16-89-2016
Ribera D’alcalà M., Conversano F., Corato F., Licandro P., Mangoni O., Marino D., et al. (2004). Seasonal Patterns in Plankton Communities in a Plurianual Time Series at a Coastal Mediterranean Site (Gulf of Naples): An Attempt to Discern Recurrences and Trends. Sci. Mar. 68 (Suppl. 1), 65–83. doi: 10.3989/scimar.2004.68s165
Salat J., Pascual J., Flexas M., Chin T. M., Vazquez-Cuervo J. (2019). Fortyfive Years of Oceanographic and Meteorological Observations at a Coastal Station in Thenwmediterranean: A Ground Truth for Satellite Observations. Ocean. Dyn. 69, 1067–1084. doi: 10.1007/s10236-019-01285-z
Sánchez-Leal R. F., Bellanco M. J., Naranjo C., García-Lafuente J., González-Pola C. (2020). On the Seasonality of Waters Below the Seasonal Thermocline in the Gulf of Cádiz. Continent. Shelf Res. 204, 104190. doi: 10.1016/j.csr.2020.104190
Schroeder K., Chiggiato J., Josey S. A., Borghini M., Aracri S., Sparnocchia S. (2017). Rapid Response to Climate Change in a Marginal Sea. Sci. Rep. 7, 4065. doi: 10.1038/s41598-017-04455-5
Siokou-Frangou I., Christaki U., Mazzocchi M. G., Montresor M., Ribera d'Alcalá M., Vaqué D., et al. (2010). Plankton in the Open Mediterranean Sea: A Review. Biogeosciences 7, 1543–1586. doi: 10.5194/bg-7-1543-2010
Skliris N. (2014). “Past, Present and Future Patternsof the Thermohaline Circulation and Characteristic Water Masses of the Mediterranean Sea,” in The Mediterranean Sea: Its History and Present Challenges. Eds. Goffredo S., Dubinsky Z. (Springer, Dordrecht). doi: 10.1007/978-94-007-6704-1_3
Somot S., Houpert L., Sevault L., Testor P., Bosse A., Taupier−Letage I., et al. (2018). Characterizing, Modelling and Understanding the Climate Variability of the Deep Water Formation in the North−Western Mediterranean Sea. Climate Dynamics 51, 1179–1210. doi: 10.1007/s00382-016-3295-0
Somot S., Sevault F., Déqué M. (2006). Transient Climate Change Scenario Simulation of the Mediterranean Sea for the Twenty-First Century Using a High-Resolution Ocean Circulation Model. Cliamte Dynamics 27, 851–879. doi: 10.1007/s00382-006-0167-z
Steinacher M., Joos F., Fr¨olicher T. L., Bopp L., Cadule P., Cocco V., et al. (2010). Projected 21st Century Decrease in Marine Productivity: A Multi-Model Analysis. Biogeosciences 7, 979–1005. doi: 10.5194/bg-7-979-2010
Tel E., Balbín R., Cabanas J. M., García M. J., García-Martínez M. C., González-Pola C., et al. (2016). IEOOS: The Spanish Institute of Oceanography Observing System. Ocean. Sci. Discuss. 12, 345–353. doi: 10.5194/os-12-345-2016
Testor P., Testor P., Bosse A., Houpert L., Margirier F., Mortier L., Legoff H., et al. (2018). Multiscale Observations of Deep Convection in the Northwestern Mediterranean Sea During Winter 2012–2013 Using Multiple Platforms. J. Geophys. Research: Ocean. 123, 1745–1776. doi: 10.1002/2016JC012671
Tintoré J., Pinardi N., Álvarez-Fanjul E., Aguiar E., Álvarez-Berastegui D., Bajo M., et al. (2019). Challenges for Sustained Observing and Forecasting Systems in the Mediterranean Sea. Front. Mar. Sci. 6. doi: 10.3389/fmars.2019.00568
Ulses C., Estournel C., Fourrier M., Coppola L., Kessouri F., Lefèvre D., et al. (2020). Oxygen Budget for the North-Western Mediterranean Deep Convection Región. Biogeosciences 18, 937–960. doi: 10.5194/bg-18-937-2021
Vargas-Yáñez M., García-Martíneza M. C., Moya F., Balbín R., López-Jurado J. L., Serra M., et al. (2017). Updating Temperature and Salinity Mean Values and Trends in the Western Mediterranean: The RADMED Project. Prog. Ocean. 157, 27–46. doi: 10.1016/j.pocean.2017.09.004
Vargas-Yáñez M., Juza M., García-Martínez M. C., Moya F., Balbín R., Ballesteros E., et al. (2021). Long-Term Changes in the Water Mass Properties in the Balearic Channels Over the Period 1996–2019. Front. Mar. Sci. 8. doi: 10.3389/fmars.2021.640535
Vargas-Yáñez M., Moya F., Tel E., García-Martínez M. C., Guerber E., Bourgeon M. (2009). Warming and Salting of the Western Mediterranean During the Second Half of the XX Century: Inconsistencies, Unknowns and the Effect of Data Processing. Sci. Mar. 73 (1), 7–28. doi: 10.3989/scimar.2009.73n1007
Vargas-Yáñez M., Zunino P., Benali A., Delpy M., Pastre F., Moya F., et al. (2010). How Much Is the Western Mediterranean Really Warming and Salting? J. Geophys. Res. 115, C04001. doi: 10.1029/2009JC005816
Villamaña M., Marañón E., Cermeño P., Estrada M., Fernández-Castro B., Figueiras F. G., et al. (2019). The Role of Mixing in Controlling Resource Availability and Phytoplankton Community Composition. Prog. Ocean. 178, 102181. doi: 10.1016/j.pocean.2019.102181
Keywords: mixed layer depth, Western Mediterranean, climate change, ocean productivity, ocean observing system
Citation: Vargas-Yáñez M, Moya F, Balbín R, Santiago R, Ballesteros E, Sánchez-Leal RF, Romero P and García-Martínez MC (2022) Seasonal and Long-Term Variability of the Mixed Layer Depth and its Influence on Ocean Productivity in the Spanish Gulf of Cádiz and Mediterranean Sea. Front. Mar. Sci. 9:901893. doi: 10.3389/fmars.2022.901893
Received: 22 March 2022; Accepted: 10 May 2022;
Published: 10 June 2022.
Edited by:
Jesus Garcia Lafuente, University of Malaga, SpainReviewed by:
Maurizio Ribera D’Alcala’, Stazione Zoologica Anton Dohrn Napoli, ItalyIria Sala, University of Strathclyde, United Kingdom
Copyright © 2022 Vargas-Yáñez, Moya, Balbín, Santiago, Ballesteros, Sánchez-Leal, Romero and García-Martínez. This is an open-access article distributed under the terms of the Creative Commons Attribution License (CC BY). The use, distribution or reproduction in other forums is permitted, provided the original author(s) and the copyright owner(s) are credited and that the original publication in this journal is cited, in accordance with accepted academic practice. No use, distribution or reproduction is permitted which does not comply with these terms.
*Correspondence: Manuel Vargas-Yáñez, bWFub2xvLnZhcmdhc0BpZW8uY3NpYy5lcw==