 Zhaoguo Wang1†
 Jie Feng2†Hector M. Lozano-Montes3
 Neil R. Loneragan3Xiumei Zhang4
 Tao Tian1,5*
 Zhongxin Wu1,5*
- 1Center for Marine Ranching Engineering Science Research of Liaoning, Dalian Ocean University, Dalian, China
- 2Key Laboratory of Marine Ecology and Environmental Sciences, Institute of Oceanology, Chinese Academy of Sciences, Qingdao, China
- 3Environmental and Conservation Sciences and Harry Butler Institute, Murdoch University, Perth, Australia
- 4College of Fisheries, Zhejiang Ocean University, Zhoushan, China
- 5Key Laboratory of Environment Controlled Aquaculture, Ministry of Education, Dalian Ocean University, Dalian, China
Marine ranching has been proposed as a promising solution to manage the depleted coastal fishery ecosystem in recent decades across China. Marine ranching integrates the practices of artificial habitat-based with aquaculture-based enhancement. Assessing the ecological carrying capacity of target species for enhancement is a precondition for determining the optimal numbers for release, particularly for those species whose habitat restrictions have been eliminated through the construction of artificial habitats in the marine ranch. A responsible approach to stock enhancement aims not only to increase total yield and stock abundance but also to consider any potential effects on ecosystem structure and function. A time-dynamic, ecosystem model was constructed using Ecopath with Ecosim for the Laizhou Bay (Bohai Sea) marine ranching ecosystem in the nearshore waters of northern China. Two sedentary target species with potential for stock enhancement, i.e., the carnivorous red snail Rapana venosa and the detritivorous sea cucumber Apostichopus japonicus, were selected to simulate and estimate their ecological carrying capacities and project their overall effects on the ecosystem. Ecological carrying capacity was defined as the maximum standing stocks of the target species that would not cause “unacceptable” impacts on the ecosystem function and resilience, i.e., not cause any other group’s biomass to fall below 10% of its original biomass. The ecological carrying capacities estimated for R. venosa and A. japonicus were 623.46 and 200.57 t·km−2, respectively, corresponding to 7.8 and 5.0 times higher than their current standing stocks. Simulations of R. venosa enhancement showed distinct effects of increased target species abundance on other functional groups and ecosystem properties. An increase in red snail biomass caused negative impacts on the biomass of most other functional groups and ecosystem indicators, such as Finn’s cycling index, transfer efficiency, and Kempton’s Q index. In contrast, the simulated A. japonicus enhancement had relatively few impacts, and the biomasses of most other functional groups and ecosystem indicators did not change or changed very slightly (<5%). The current model framework provides a means of estimating the ecological carrying capacity in commercial-scale stock enhancement practices and avoiding potential ecological risks for marine ranching in northern China.
Introduction
The accelerating species extinction and the loss of biodiversity in the global marine environment have severely diminished the function of marine ecosystem services (Solan et al., 2004; Worm et al., 2006). The conservation and restoration of marine living resources are becoming increasingly important for maintaining marine systems (Worm et al., 2009; Stier et al., 2016). Marine stock enhancement, as a set of management approaches involving the release of cultured organisms to enhance or restore fisheries, has been practiced to implement marine biological resource conservation. Furthermore, it plays an increasingly important role in food security and developing and enhancing recreational fisheries (Lorenzen et al., 2010; Kitada, 2020; Lorenzen et al., 2021).
The implementation of stock enhancement programs in open waters nowadays still often lacks the necessary scientific evidence to be carried out effectively due to a lack of knowledge of the environment, target species, and release locations. This makes it difficult to identify any potential negative ecological impacts of stocking such as a reduction in genetic diversity, negative effects on wild stock growth and survival, and impacts on ecosystem functioning (Cudmore-Vokey and Crossman, 2000; Taylor et al., 2005; Townsend, 2010; Taylor et al., 2017; Lorenzen et al., 2021). For example, the introduction of salmon into Lake Michigan resulted in significant changes in the food web structure, causing the planktivorous fish ratio to fall from 8:1 in the 1930s to 1.3:1 at the end of the 20th century (Cudmore-Vokey and Crossman, 2000). In addition, the release of Brown Trout Salmo trutta into rivers in New Zealand drove the Whitebait Galaxias spp., which had the same niche as brown trout, to the brink of extinction (Townsend, 2010). In contrast, Khan et al. (2015) compared changes in the food web pre- and post-stocking of the carps, Catla catla (Hamilton), Labeo rohita (Hamilton), and Cirrhinus mrigala (Hamilton), in a tropical reservoir ecosystem in India, and showed that after stock enhancement, the reservoir ecosystem was more resilient and healthier based on ecological network indicators’ analyses. Therefore, evaluating the potential effects of stocking strategies on other fish species and aquatic communities before stocking is important for informing the stakeholders and fisheries managers and for avoiding any unanticipated consequences of stocking.
A responsible approach to stock enhancement has been advocated internationally since the concept was first developed in 1995 and then later revised in 2010 (Blankenship and Leber, 1995; Lorenzen et al., 2010). This approach recommends considering the effects of stock enhancement on the structure and function of the target aquatic ecosystem such as biodiversity and ecosystem properties (Blankenship and Leber, 1995; FAO, 2005; Zhang et al., 2009; Lorenzen et al., 2010; Jiang et al., 2014; Taylor et al., 2017).
Assessing the ecological carrying capacity of target species is a precondition to determining the optimal number of individuals for stocking. In order to make effective use of juveniles reared or collected for stock enhancement, an understanding of the carrying capacity of the habitat is needed. Overstocking will have detrimental effects on wild populations of the species and the released individuals in terms of growth and survival, and understocking will not maximize the returns from stocking (Munro and Bell, 1997). The risk of overstocking remains a concern, particularly because of adverse ecological consequences, including the displacement of wild populations and other competitors (Taylor et al., 2013).
Carrying capacity is defined as the limiting biomass of a specific population that the ecosystem can support under specific environmental conditions, such as food and habitat (Cooney and Brodeur, 1998; Taylor et al., 2005; Filgueira et al., 2021). According to the relationship between population size and the availability of resources, carrying capacity can be classified into four broad categories: physical, production, ecological, and social carrying capacities (Inglis et al., 2000; McKindsey et al., 2006). The ecological carrying capacity describes the maximum standing stock of target species that does not cause “unacceptable” impacts on the species or the ecosystem (Inglis et al., 2000; Kluger et al., 2016). Recent advances in ecosystem modeling provide the means to estimate ecological carrying capacity, given sufficient data on biological processes (Byron et al., 2011; Kluger et al., 2016). Kluger et al. (2016) introduced the definition of stock collapse (after Worm et al., 2009), i.e., any group biomass that falls below 10% of its original biomass, as an approach to define “unacceptable” impact thresholds and further to estimate the ecological carrying capacity for the target stocking species.
Laizhou Bay (LZB) in the Bohai Sea of north China is an important spawning and feeding ground and nursery area for many economically important fish and shrimp, such as the Chinese shrimp Fenneropenaeus chinensis and small yellow croaker Larimichthys polyactis (Jin and Deng, 2000; Jin et al., 2013). The LZB ecosystem has deteriorated severely in recent years as a result of overfishing and environmental pollution (Jin et al., 2013; Wei et al., 2022). Moreover, the fisheries resources and ecosystem structure of the LZB have changed dramatically (Jin and Deng, 2000; Jin et al., 2013). Since the 1990s, a series of fishery resource management approaches have been widely adopted in LZB to restore the productivity of the ecosystem (Shen and Heino, 2014). One of these initiatives has been the construction of marine ranches by deploying artificial reefs and releasing target species such as Japanese Flounder, Paralichthys olivaceus, and Chinese shrimp (Zhang et al., 2009). By the end of 2021, three national marine ranching demonstration zones had been built in LZB (Ministry of Agriculture and Rural Affairs of the People’s Republic of China, 2022). Following the deployment of the artificial reefs, the reef surfaces were colonized by a large number of Pacific oysters Crassostrea gigas, forming oyster reefs and even oyster mountains (Xu et al., 2019). These provide important food and habitat foundation for enhancing reef-associated species such as the red snail Rapana venosa and sea cucumber Apostichopus japonicus, which are commercially important, local species for stock enhancement. The landings of R. venosa and A. japonicus in 2020 were 4.2 and 1.65 t·km−2·year−1, respectively, according to the statistics from the Blue Ocean Company.
In this study, we first build an Ecopath model (https://ecopath.org/) to represent the current trophic flows of the LZB marine ranching system. The base model for the system was set as 2020–2021, following an annual survey of the biological resources in the region. We then further developed the model with Ecosim (Christensen and Walters, 2004) to simulate the biomass increases of two resident target species, R. venosa and A. japonicus, following stock enhancement. The simulated increases in biomass following different levels of enhancement were used to estimate the ecological carrying capacity for each species (Kluger et al., 2016) and then to determine the indicators of ecosystem properties from the models. These ecosystem properties were compared for the different levels of enhancement with the pre-enhancement state to determine the potential impacts of different stocking levels. The results for estimating ecological carrying capacity from the dynamic ecosystem model (EwE) were compared with those from a static Ecopath model (Byron et al., 2011).
Materials and methods
Study area
Laizhou Bay, located in the southern region of the Bohai Sea, is the largest bay in Shandong Peninsula (Figure 1). It stretches from the northern corner of Qimu Cape in the east, to the estuary of the Yellow River in the west, with a natural coastline of 319 km. Its total area is 6,966 km2, accounting for approximately 10% of the Bohai Sea, with a mean depth of 8 m and a maximum depth of ~15 m at the eastern mouth of the bay. The first marine ranch in LZB (37°15′–37°22′N, 119°38′–119°46′E) was built in 2010 by Shandong Blue Ocean Technology Co., Ltd. This marine ranch occupies a total area of 107.95 km2 with an artificial reef area of 33.3 km2 in the core area (Figure 1). The types of artificial reefs deployed in this marine ranch include stone reefs, derelict vessels, and artificial shell reefs. The core area of the ranch is used primarily for the stock enhancement of benthic, reef-associated species including R. venosa and A. japonicus (Xu et al., 2019), and the remaining zone of 74.6 km2 is the zone of marine ranching outside the area for stock enhancement (Figure 1). No artificial reefs are deployed in this latter area.
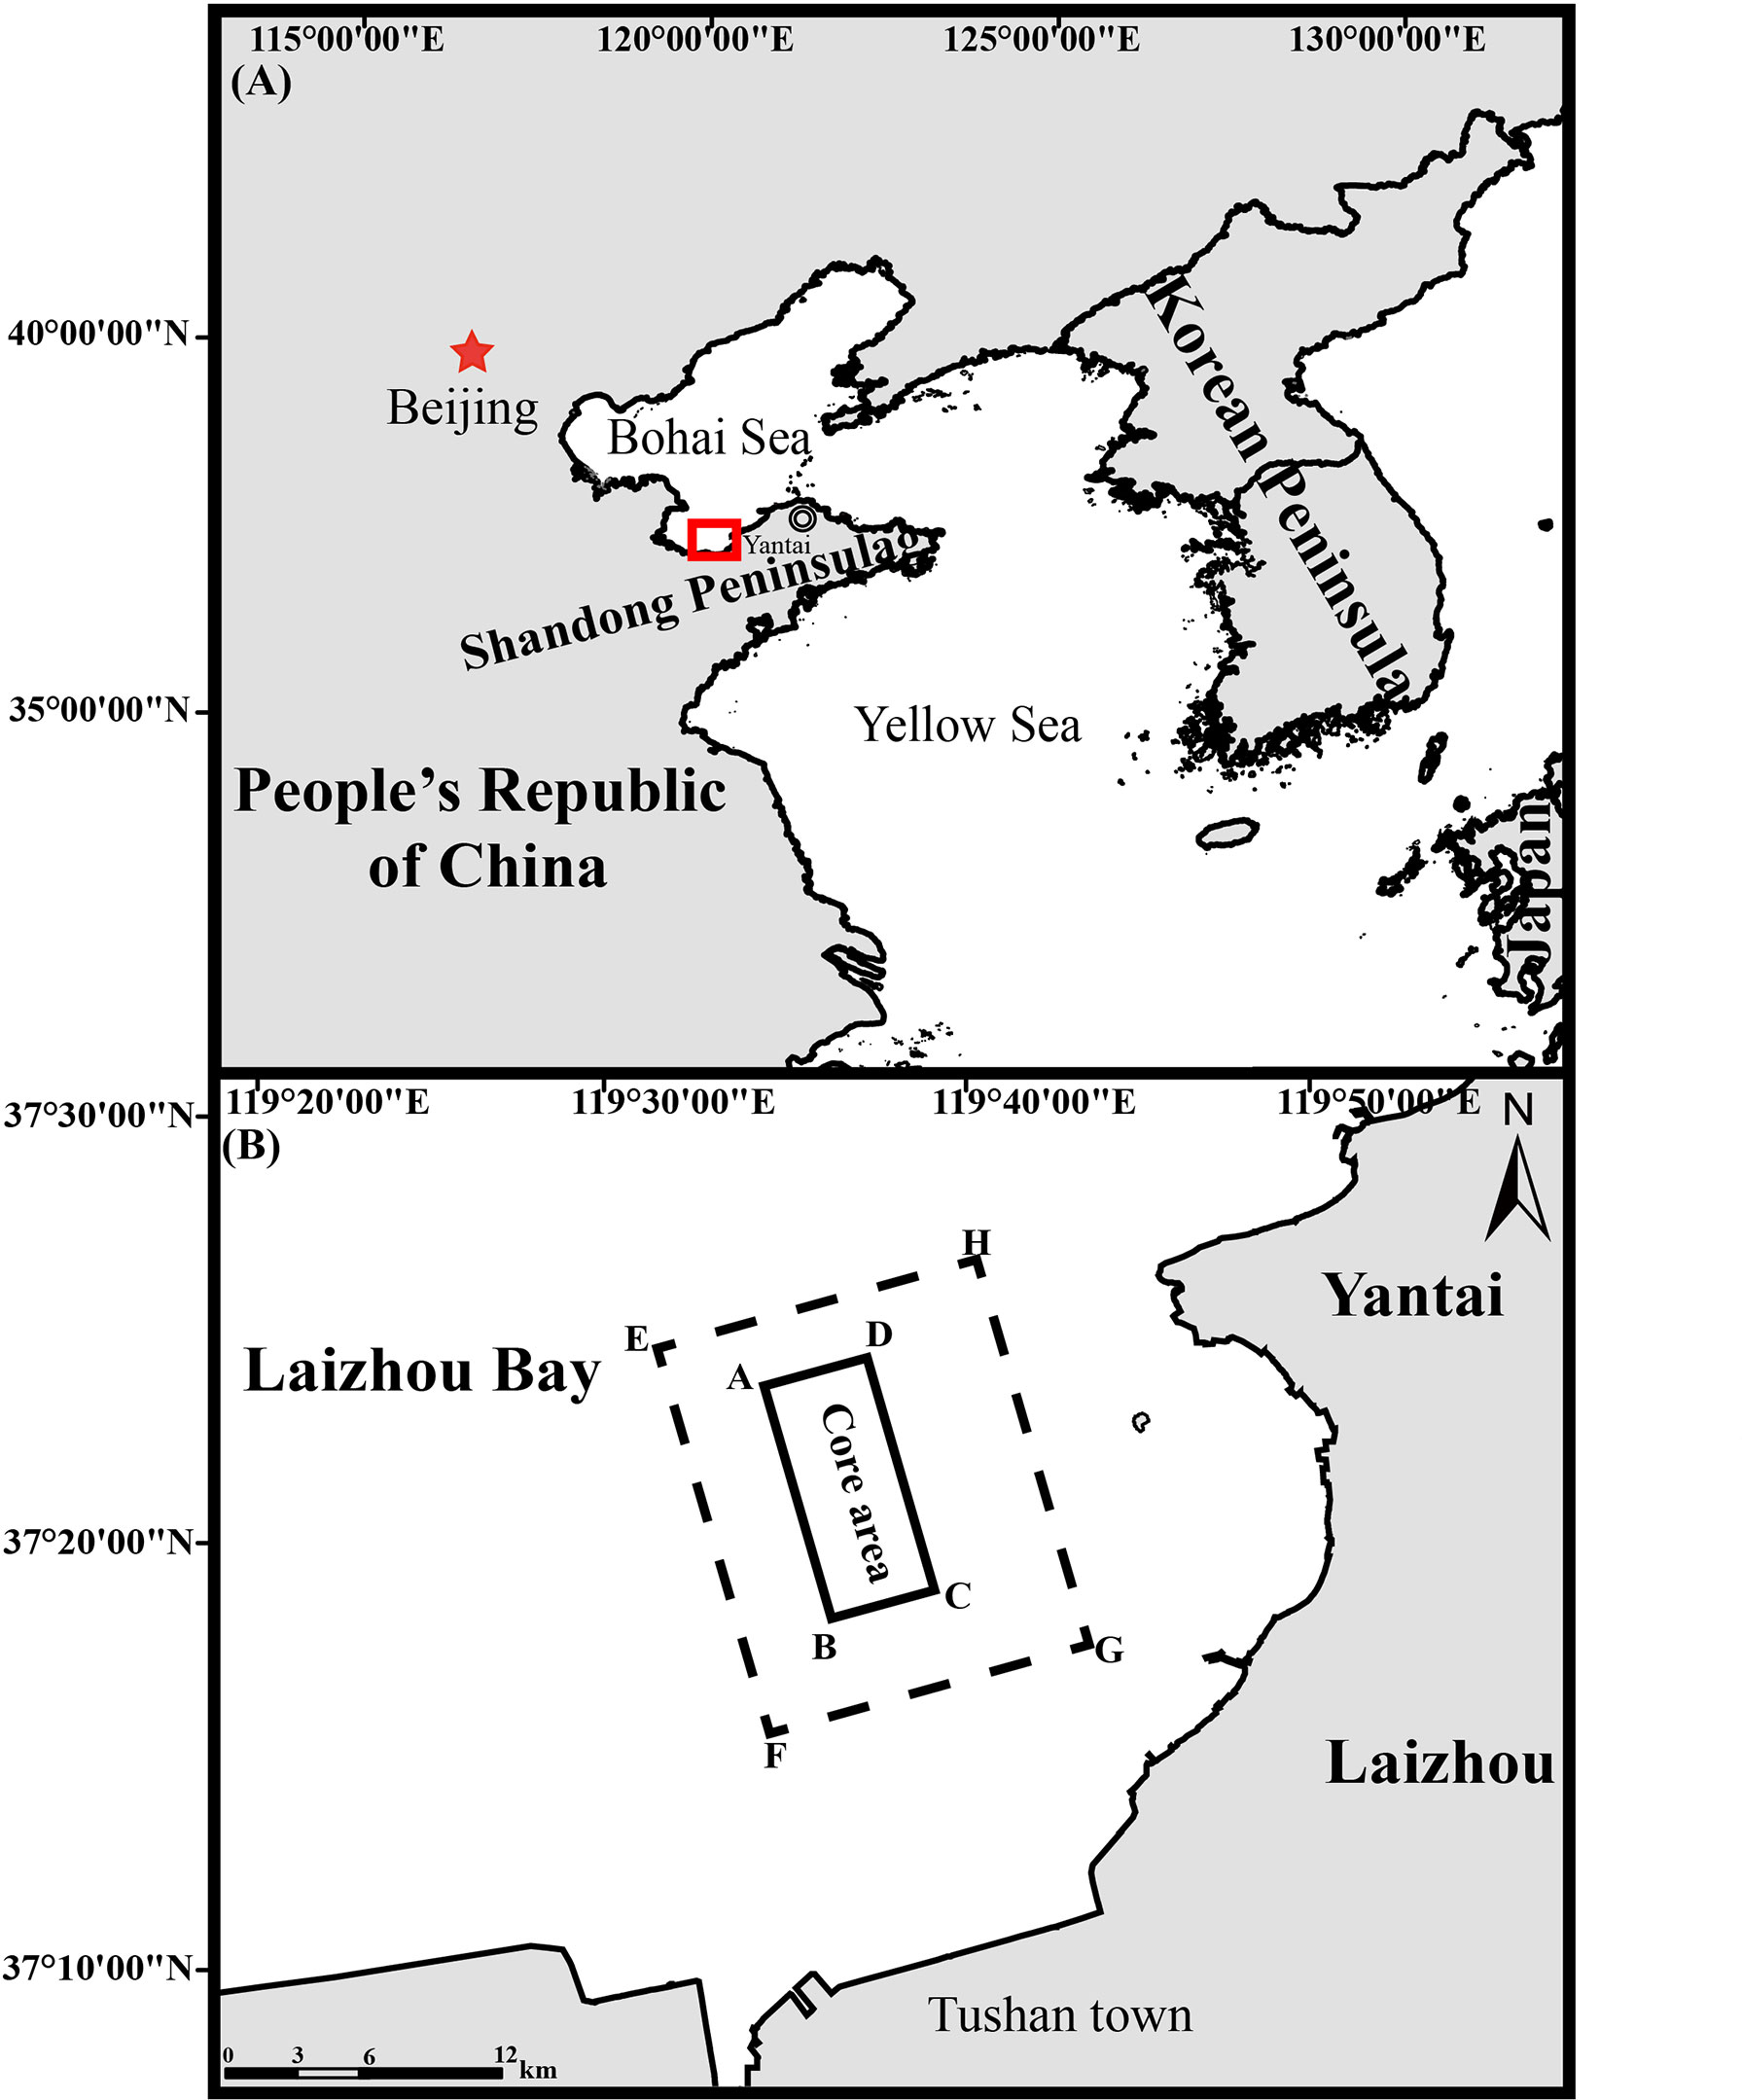
Figure 1 Map showing the location of (A) Laizhou Bay (dashed square) in the People’s Republic of China and (B) the model domain of Laizhou Bay marine ranching area (EFGH—dashed rectangle) and the core area for implementing stock enhancement (ABCD—solid rectangle).
The Ecopath model—functional groups and data sources
Ecopath with Ecosim (EwE version 6.6) was used to first construct the Ecopath model of LZB marine ranching. Based on the ecological habits, economic values, and ecological roles of the species in the area, we defined 27 functional groups in the model (Table 1), which covered the main trophic flows in LZB marine ranching ecosystem. Considering their important roles played in supporting fishery catch and ecosystem function, 10 single-species functional groups were established: four teleost groups (Sebastes schlegelii, Hexagrammos otakii, Lateolabrax japonicus, and Sparus macrocephalus); and six macroinvertebrate groups (A. japonicus (Sea Cucumber), R. venosa (Rea Snail), Charybdis japonica (Asian Paddle Crab), Oratosquilla oratoria (Japanese Mantis Shrimp), C. gigas (Pacific Oyster), and Aurelia aurita (Moon Jellyfish) (Table 1).
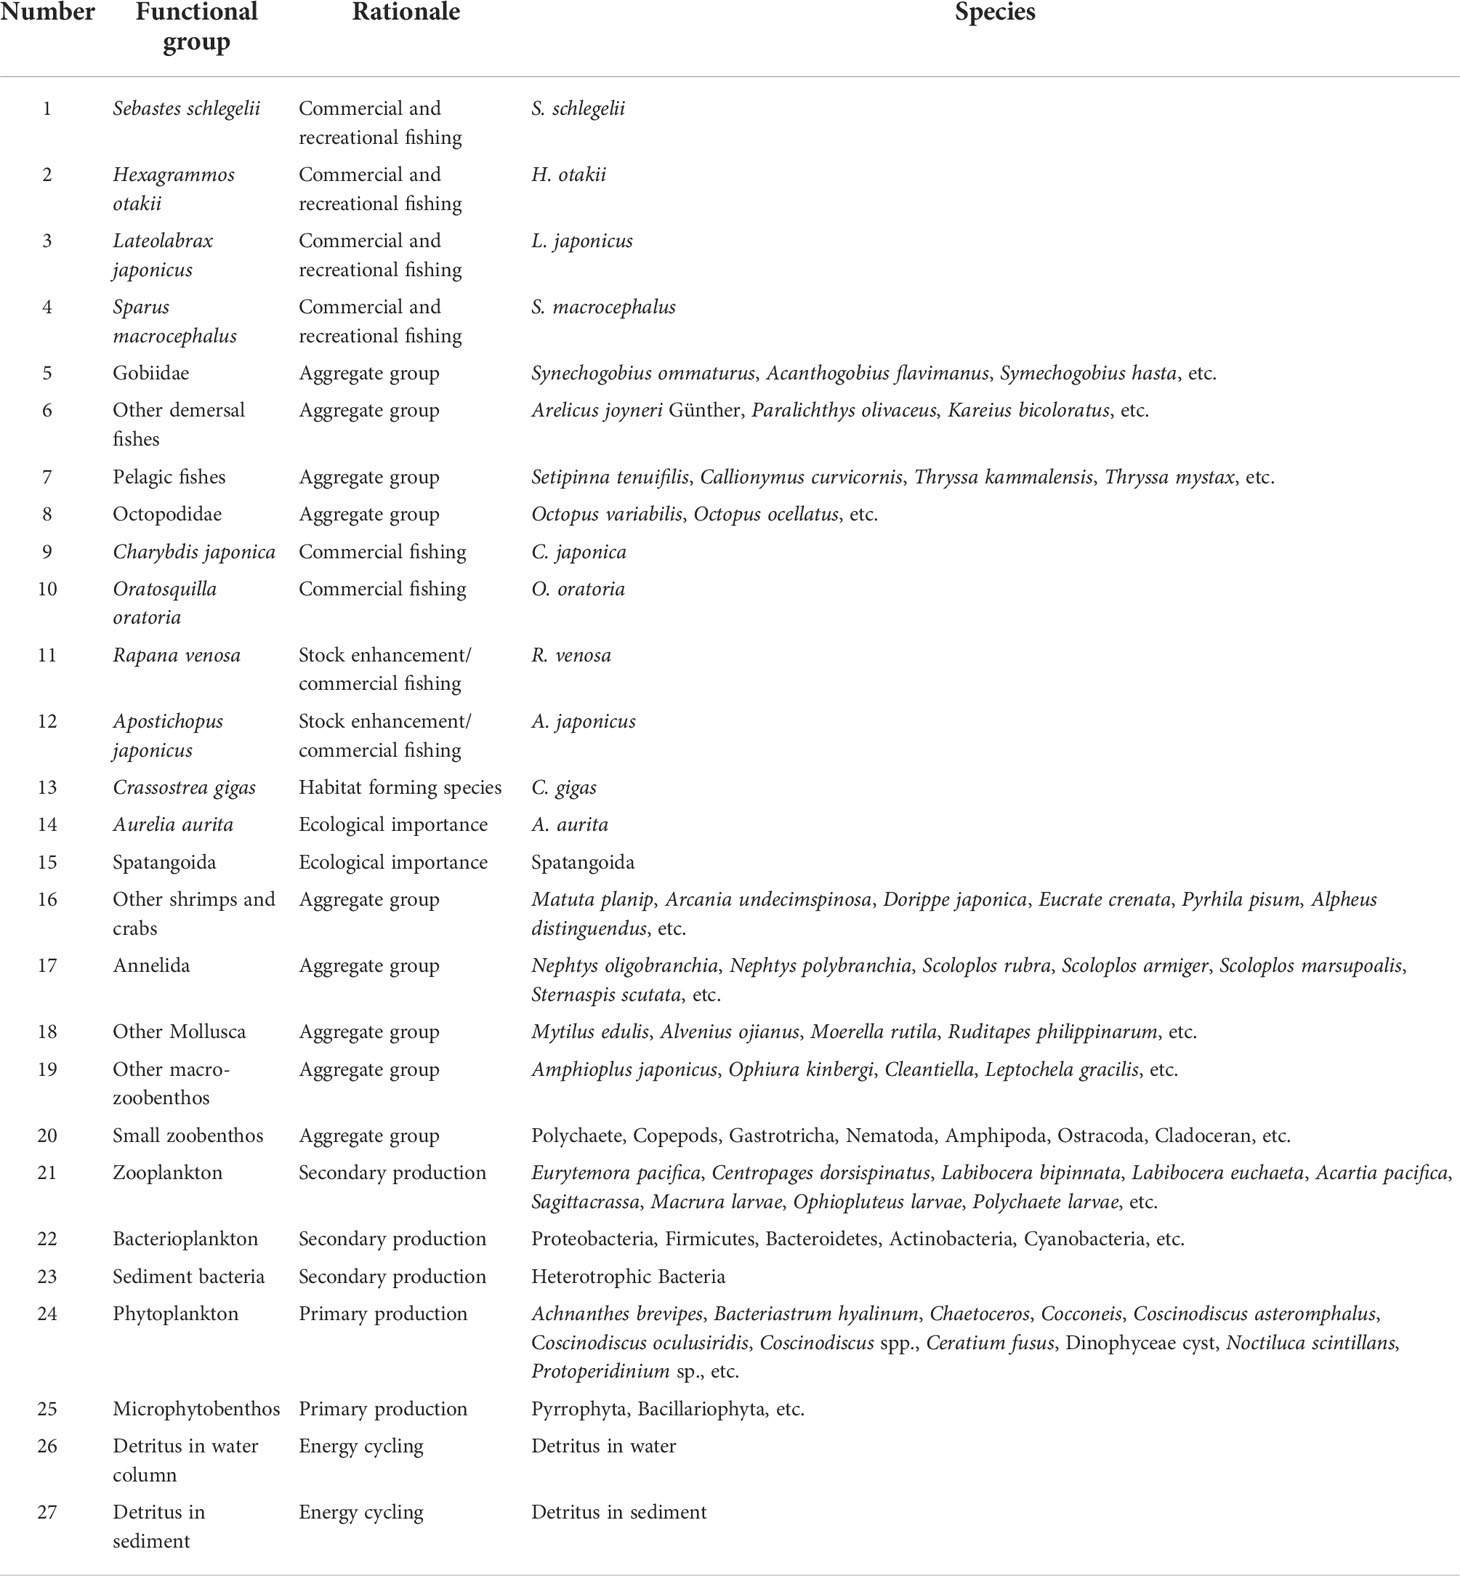
Table 1 Functional groups and main species comprising the different model compartments for the steady-state model of the Laizhou Bay marine ranching ecosystem.
The biomass inputs for macroinvertebrates and fish in the Ecopath model were primarily based on the resource survey data. The biomasses of fish and macroinvertebrates in the modeled area were estimated by sampling using trawls, gillnets, long fishing traps, and SCUBA quadrats during 2020–2021. Phytoplankton biomass in terms of chlorophyll-a was first measured using a Turner fluorometer according to standard procedure (Parsons et al., 1984), and biomass was estimated by transforming the chlorophyll-a concentration (mg/m3) using the following relationships: the ratio of organic carbon:chlorophyll-a = 43:1 (Wang et al., 1998), the organic carbon:dry weight ratio = 35:100 (Ning et al., 1995), and the dry weight:wet weight ratio = 1:2.86 (Su and Tang, 2002). The biomass of the macrobenthos and small zoobenthos were sampled in situ using grab samplers. The biomasses of water column bacteria and benthic bacteria were obtained from field experimental measurements, and the biomass of detritus (in water and sediment) was calculated with reference to the linear model proposed by Pauly and Bartz (1993), as follows:
where D [g(C)/m2] is detritus biomass, PP [g(C)/(m2·a)] is the primary production, and E (m) is the euphotic depth.
In the Ecopath model, the fish Production : Biomass ratio (P/B) and Consumption to Biomass ratio (Q/B) values were calculated by empirical formula or using reported values of similar ecological characteristics (Palomares and Pauly, 1989; Pauly and Bartz, 1993; Wu et al., 2013). The P/B, Q/B, and additional unknown parameters of other functional groups are mainly based on the reported data in the Ecopath model in LZB (Lin et al., 2009; Lin et al., 2013; Yang et al., 2016). The diet composition was based mainly on the gut content analyses for S. schlegelii, H. otakii, and C. japonica, as well as the literature for other species (see Supplementary Material Table S1). However, for the A. aurita and Spatangoida functional groups, the two abundant taxa in this area, few or even no predators were observed or reported. Thus, they were not in the diet composition of any functional group. Data on landings of fished species (S. schlegelii, L. japonicus, S. macrocephalus, C. japonica, O. oratoria, R. venosa, and A. japonicus) were obtained from Shandong Blue Ocean Technology Co., Ltd (see Supplementary Material Table S2). No commercial landings on H. otakii were available, but it is a commercial interest species.
Ecopath model tuning and quality analysis
Prior to balancing the model, a pre-balanced diagnostic (PREBAL) analysis was performed to evaluate the validity of the input parameters. The PREBAL diagnostics offered a series of tuning techniques to analyze the slope of the relationships for biological ratio, vital ratio, and production ratio, relative to the trophic level for each functional group (Link, 2010). According to the PREBAL criteria, as well as “rules of thumb”, the biomass estimated by the model should span 5–7 orders of magnitude, where >7 indicates that there are too many taxonomic or age-structured taxa in the model, and <5 indicates that the model might be focused on specific trophic levels and not representative of the broader food web (Link, 2010; Heymans et al., 2016). In addition, the biomass (on a logarithmic scale) should decrease by 5%–10% with increasing trophic levels across all functional groups, based on PREBAL diagnostics. Likewise, P/Q and Q/B were subjected to the same biomass PREBAL criteria (Link, 2010; Heymans et al., 2016).
After completion of the PREBAL diagnostics, a preliminary Ecopath model that met the ecological and fishing principles was developed. The Ecopath model was balanced, and the model quality was evaluated using the second law of thermodynamics to check that it was maintained (Link, 2010). The indicators included are the respiration and assimilation ratio (R/A ratio) and the gross efficiency (GE) of each functional group. The dimensionless R/A ratio cannot exceed 1, because respiration cannot exceed assimilation. The GE indicates the value for the P/Q ratio should be between 0.1 and 0.3 (Darwall et al., 2010).
The pedigree index (referred to as the P index) was used to analyze the uncertainty of the Ecopath model input parameters. The P index quantifies the overall quality of the data and model (Christensen and Walters, 2004). The quality of the input data source was ranked in the following order: direct measurement, empirical relationship, other models, and other references. The confidence intervals of the input parameters (B, P/B, Q/B, Landing, and diet composition) were between 0 and 1. The P index of each functional group was used to evaluate the overall quality indicator of the model. A higher value of the pedigree index indicates a higher credibility of the model. The P index was calculated using the following formula:
where Iij represents the pedigree index value for functional group i, n represents the total number of functional groups in the ecosystem, and j represents B, P/B, Q/B, Landing, and diet composition.
The Ecopath with Ecosim model (Ecosim model)
The Ecosim model is a time scale-based dynamic model based on the Ecopath model (Walters et al., 1997; Christensen and Walters, 2004). It drives the time-dynamic model by changing the initial food web model (Ecopath) over time steps and can simulate changes in the response of the system in a time series. The Ecosim model is used to simulate management behavior or environmental change to “experiment” with ecosystems and subsequently analyze how the ecosystem responds to changes, based on the different scenarios simulated.
The core equations of the Ecosim model are based on a series of differential equations, as follows:
where the subscripts are as mentioned for equation (2), dBi/dt is the rate of change in biomass, gi is the net growth efficiency, Qji is the consumption of function group i by functional group j, Moi is the non-predation natural mortality rate, Fi is the fishing mortality rate, ei is emigration rate, Ii is the immigration rate, and Bi is the biomass of group i (Christensen and Walters, 2004). The flow of biomass between functional groups in the Ecosim model is based on the “foraging arena” concept (Walters et al., 1997). The biomass of each function group was divided into two parts: vulnerable and invulnerable to predation. The vulnerability index is the transfer rate (vij) between the two states, and Qji is based on the following:
Where aij is the effective search efficiency of predator j for prey organism i, Bi is the biomass of prey organism i, Bj is the biomass of predator organism j, vij is the transfer rate between “vulnerable” and “invulnerable” components, and conversely (v′ij), with the assumption vij=v′ij (Christensen et al., 2005).
The value of the vulnerability index in Ecosim determines whether the trophic control between predator and prey is a top-down, bottom-up, or intermediate effect. An empirical formula was applied to calculate the vulnerability index for each functional group in the present study following Cheung et al. (2002):
where TLi is the trophic level corresponding to functional group i. Vulnerability settings ranging from 0 to 1, with 0.0–0.3 representing a bottom-up control, 0.3 representing the mixed control, and 0.3–1.0 describing a top-down impact (Christensen and Walters, 2004). The vi was then transformed to derive vnew for Ecosim input, which ranged from 1 to ∞:
Enhancement simulations and estimations of ecological carrying capacity
Different levels of stock enhancement were modeled by gradually increasing the individual density (e.g., 2, 3, and 4 inds·m−2) in the core area to represent the actual biomass of an increase in each target species, R. venosa and A. japonicus, because of stock enhancement. During this process, we referred to the reported largest biomasses for R. venosa and A. japonicus in natural waters as the possible upper limit reference for biomasses of target species in the simulation (Xu et al., 2016; Shalovenkov, 2017) (Table 2). As the Ecosim simulation needs the biomass of target species as input data, the individual density was first multiplied by the mean individual weight (measured in situ during the resource surveys) to obtain the biomass of target species in the zone of stock enhancement, and the final biomass (Bfinal) (t/km2) for the entire simulation area under different stock scenarios was calculated as follows:
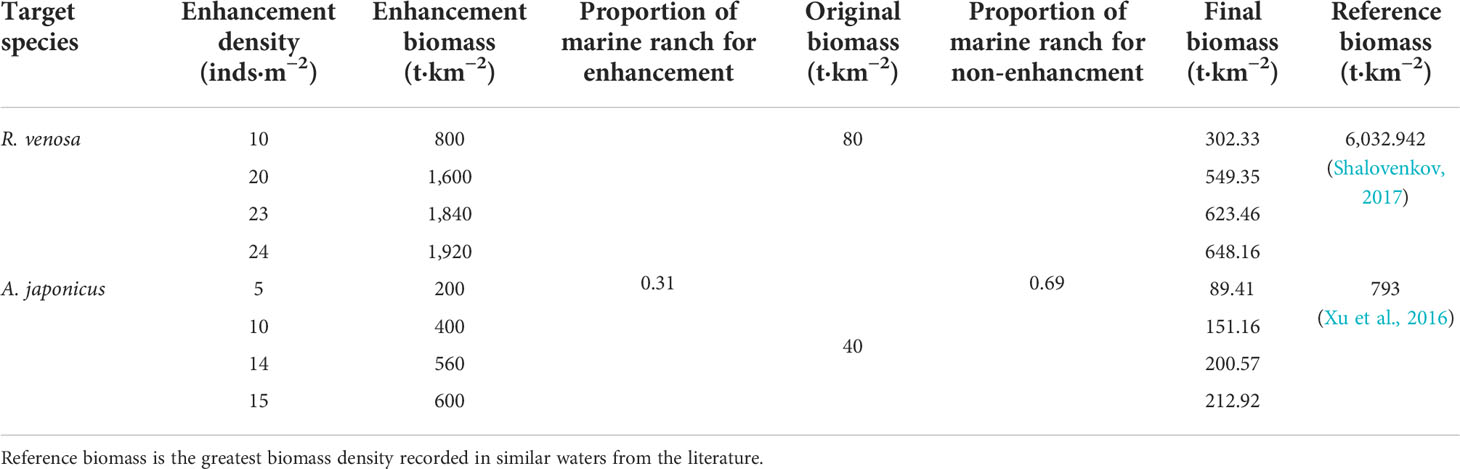
Table 2 Simulation scenarios for different enhancement densities of the target species, red snail Rapana venosa and sea cucumber Apostichopus japonicus, in Laizhou Bay marine ranching using the Ecopath with Ecosim model.
where Benhancement is the biomass of the target species in the enhancement simulation, Bnon-enhancement is the original biomass from the Ecopath model, and Aenhancement and Anon-enhancement represent the proportion areas for stock enhancement and non-enhancement, respectively. Stock enhancement was implemented only in the core area (33.3 km2), while the biomass in the non-enhancement area (74.6 km2) during the simulation maintained the original biomass (Table 2).
We applied the criteria of stock collapse to estimate the ecological carrying capacity for two target species; i.e., when the relative biomass of any other functional groups fell below 10% of their original biomasses during the simulation of stepwise-increasing biomass of target species, the resulting biomass at the breakthrough points was identified as the ecological carrying capacity of target species (Kluger et al., 2016). Lastly, we selected four representative enhancement densities as the modeled scenarios of ecological carrying capacity, i.e., slightly increasing, intermediate increasing, approaching ecological carrying capacity, and exceeding ecological carrying capacity (Table 2).
Target species stocking expansion was simulated for a period of 30 years under scenarios of differing final enhancement biomass, which was implemented through a linear increase in stock from 2 to 6 years and then held constant for the remaining 24 years. The time series of changes in relative biomass of a single simulation scenario were extracted when all simulations finished.
Ecological network analysis indicators
To explore the ecosystem effects under different stocking scenarios for the target species, ecological network analysis indicators were extracted and analyzed through the Ecopath and Ecosim output (network analysis). These indicators were divided into four categories in terms of Ecosystem Size—Total system throughput (TST), Total system biomass (B), Primary production (PP), Total system respiration (R), and Total production (P); Ecosystem Stability and Maturity—Entropy (H), Average mutual information (AMI), Ascendancy (A), Capacity (C), and Finn’s cycling index (FCI); Ecosystem Efficiency—Trophic transfer efficiency (TE); and Ecosystem Biodiversity—Kempton’s Q (Q) (Table 3). The changes in ecological network indicators across the stocking levels were compared with their initial values using radar plots.
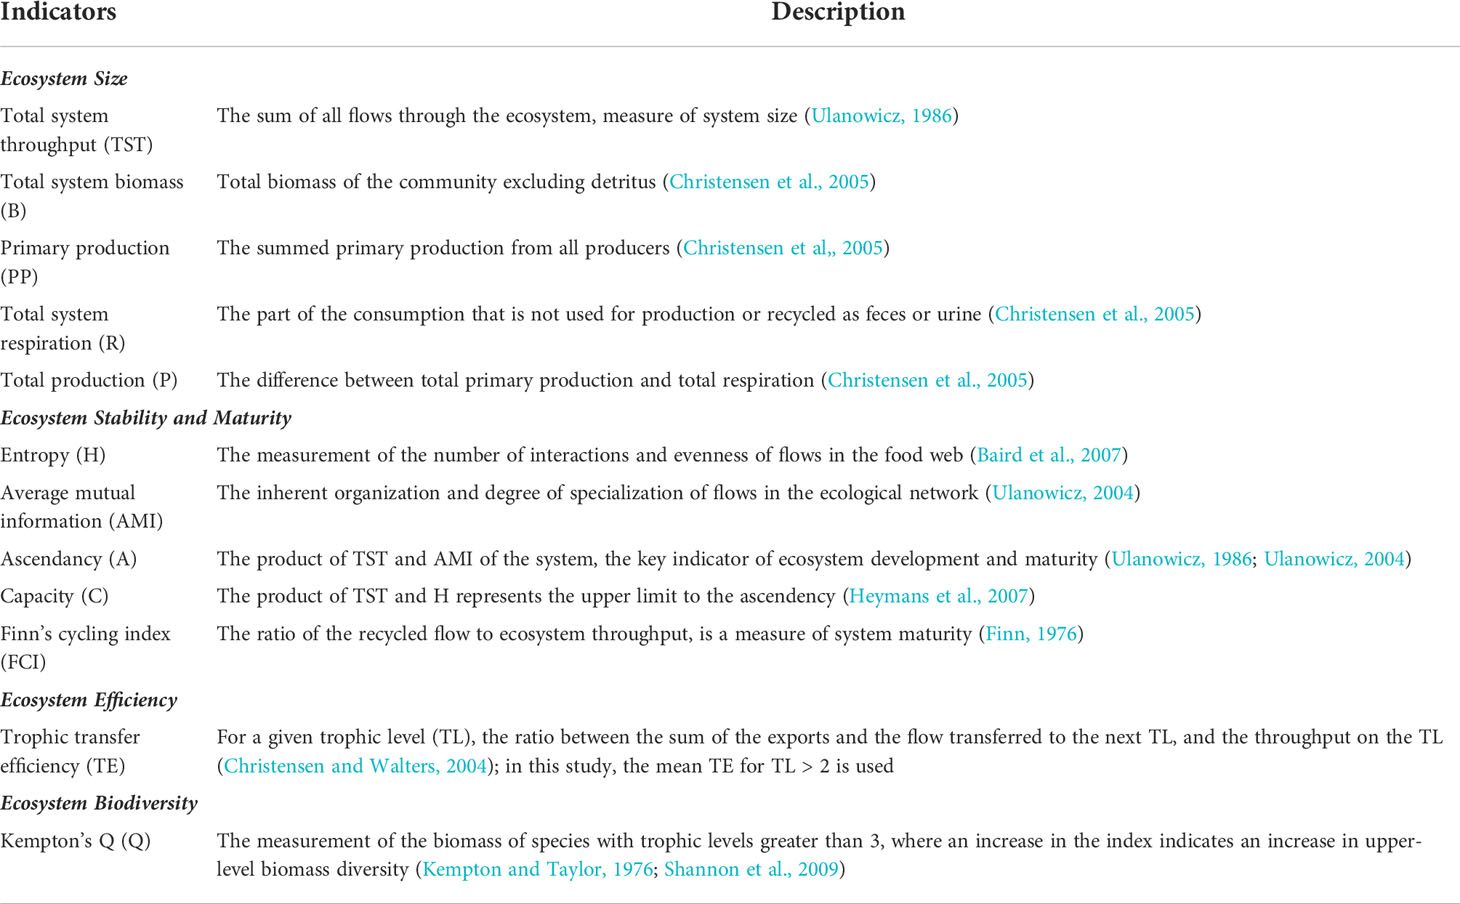
Table 3 Description of ecological network analysis indicators used in Laizhou Bay marine ranching ecosystem model.
Results
Evaluating Ecopath model quality
The biomass magnitude span of the taxa in the Ecopath model estimated by the PREBAL diagnostics was 6, and the slope of the biomass (on a logarithmic scale) from the highest to the lowest TL declined by 8.5%, which indicates that the model is providing a realistic representation of the system (Link, 2010; Heymans et al., 2016). Moreover, the P/B and the Q/B magnitude span was in the order of 6 and 4, and the P/B and Q/B ratios showed an increasing trend from high to low trophic levels, indicating that these vital ratios of prey species were generally higher than those of predators (see Supplementary Material Figure S1). The thermodynamic consistency law test revealed that the distribution of R/A among trophic levels exhibited a positive slope (a = 0.074) (see Supplementary Material Figure S2). The gross efficiency test revealed that the model generally conformed to thermodynamic constraints, with the exception of the O. oratoria functional group (0.329) and other shrimp and crabs (0.321) with high GE (see Supplementary Material Figure S3). Subsequent to calibrating the Ecopath model, we obtained an ecologically significant mass-balanced model. The Ecopath model Pedigree (P index) was 0.602, indicating that a reasonable amount of the input data were from the local area and have relatively good reliability and credibility. The trophic levels of the functional groups in LZB ranged from 1 to 4.183 (Table 4 and Figure 2). The trophic levels of the target species for enhancement, R. venosa, and A. japonicus, were 2.62 and 2.27, respectively.
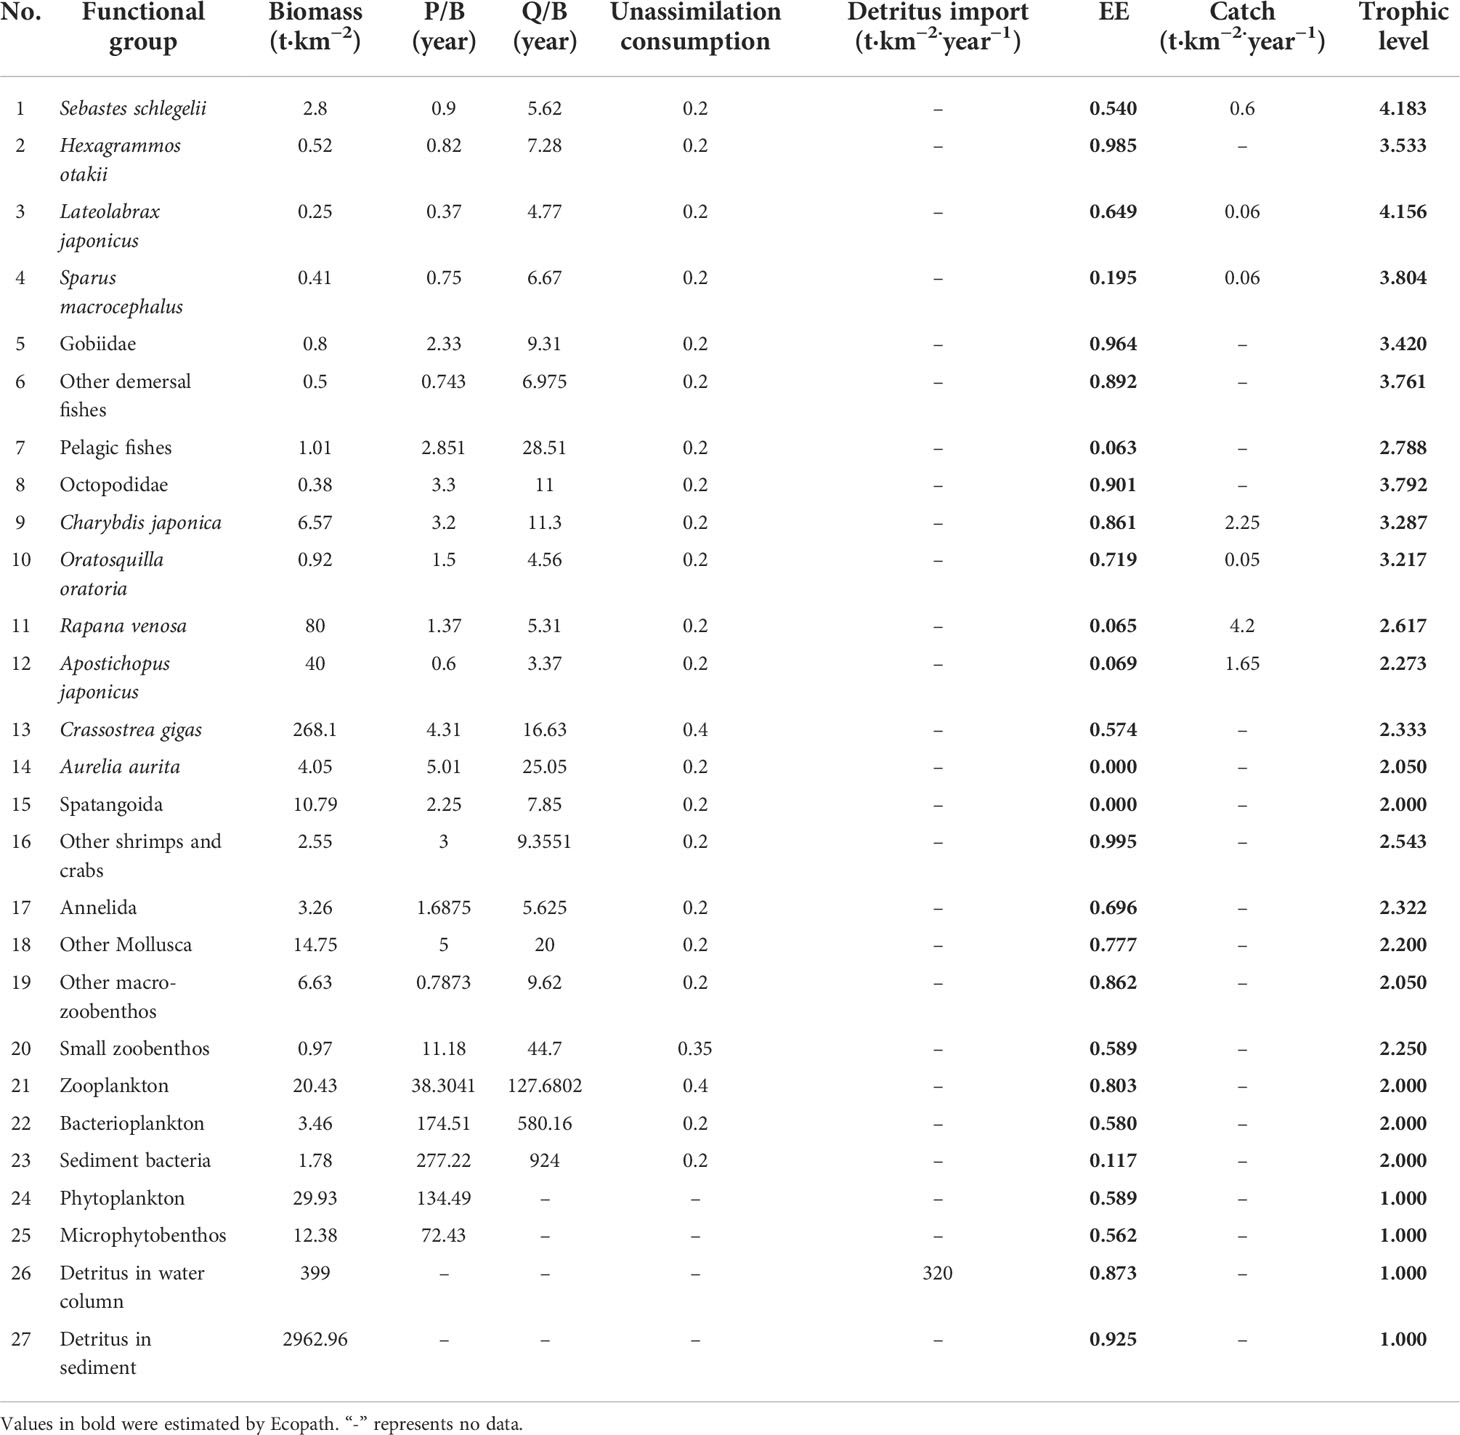
Table 4 Summary of the input and output parameters for functional groups as estimated by the EwE model of Laizhou Bay stocking marine ranching ecosystem.
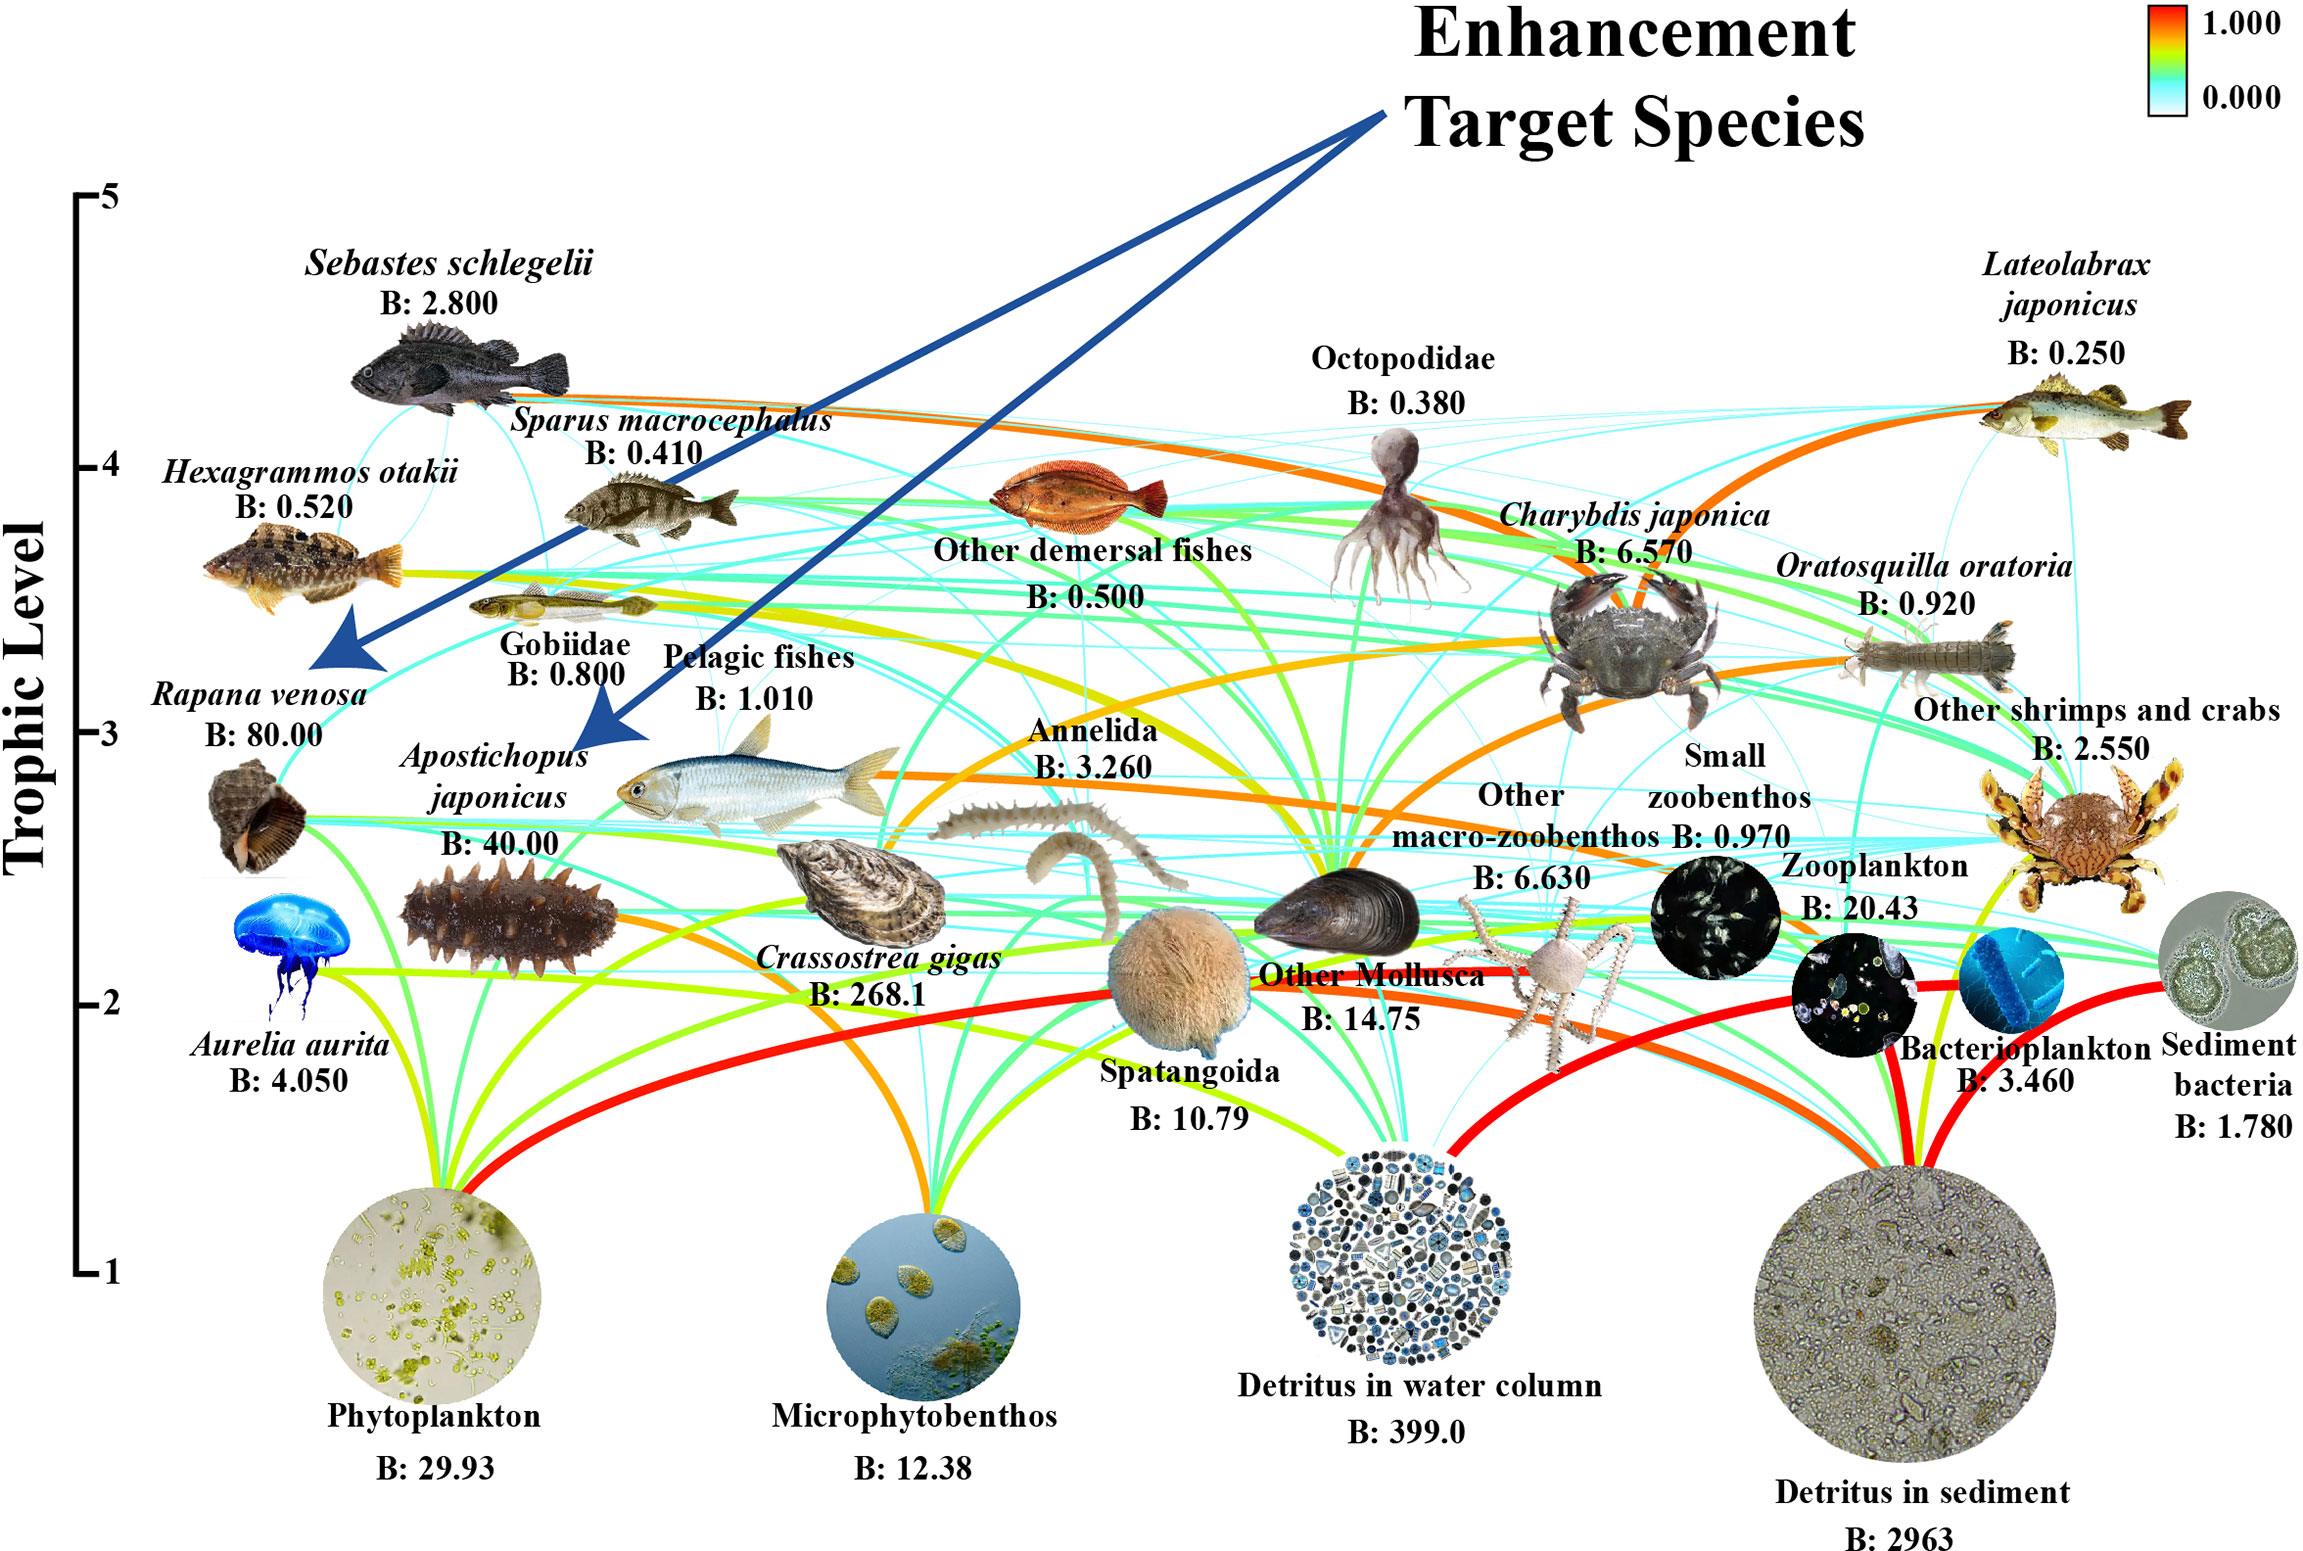
Figure 2 Functional groups and their biomass (B) in the food web of the Laizhou Bay stocking marine ranching ecosystem. Curved line shows prey–predator relationships. Blue arrows show target species for stock enhancement.
Ecological carrying capacity estimation
When the simulated stocking density of the red snail R. venosa was maintained at 10, 20, and 23 inds·m−2, the relative biomass of some functional groups (such as S. schlegelii, L. japonicus, S. macrocephalus, Gobiidae, C. japonica, O. oratoria, A. japonicus, C. gigas, other Mollusca, and small zoobenthos) declined by different proportions ranging from 10% for other Mollusca to ~75% for A. japonicus for different levels of stocking (Figure 3). The biomasses of some functional groups were predicted to increase greatly by up to three times, e.g., H. otakii and Octopodidae (Figure 3). However, no functional group fell below 10% of the original biomass, indicating that level of enhancement scales did not exceed the ecological carrying capacity of R. venosa. When the enhancement density was set at the greatest density of 24 R. venosa·m−2, the relative change in the biomass of other Mollusca functional groups decreased by 93% in the 17th year of the simulation. This was lower than the assessment threshold of the ecological carrying capacity (Figure 3); thus, the estimated ecological carrying capacity of R. venosa was 623.46 t·km−2, equivalent to a density of 23 inds·m−2.
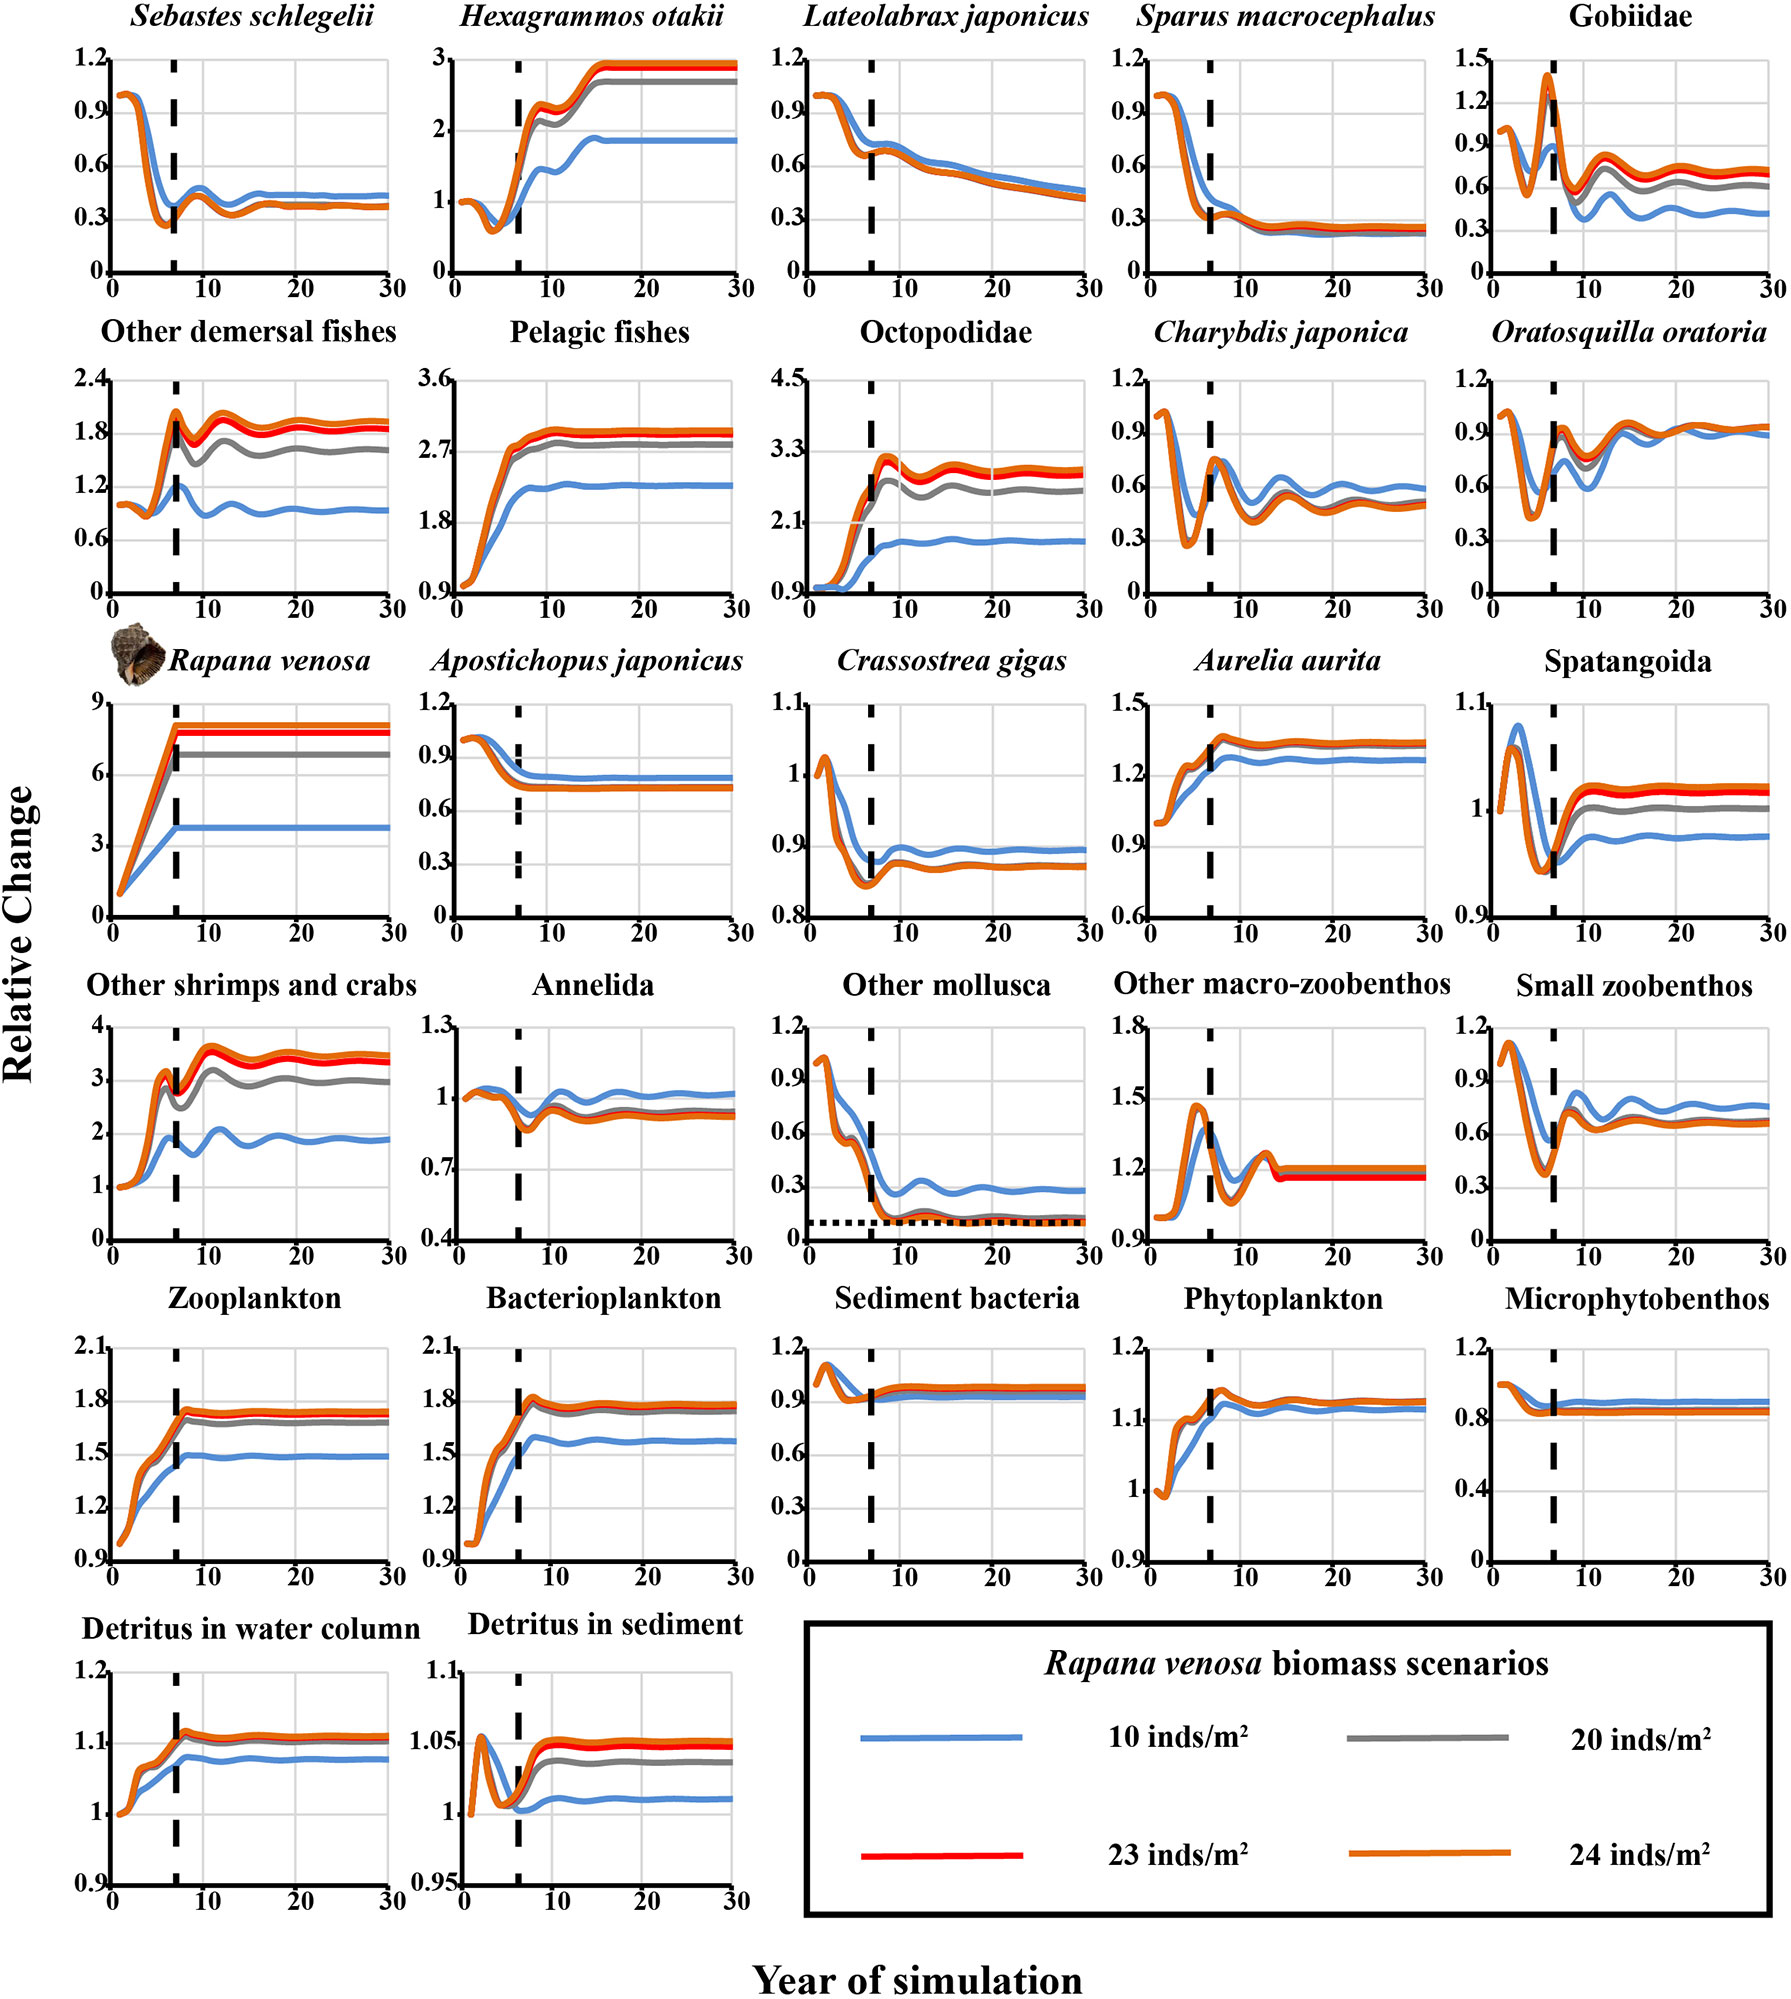
Figure 3 Predicted relative changes in biomass of each functional group in the Ecopath Model of Laizhou Bay marine ranching area for the selected four representative scenarios of the red snail Rapana venosa stock enhancement. Vertical dashed line, time after which the biomass level of R. venosa remained constant; horizontal dashed line, 10% threshold of initial biomass.
For the stocking scenarios of the sea cucumber A. japonicus, when the simulated individual densities were enhanced to 5, 10, and 14 inds·m−2, respectively, the biomass of H. otakii, Gobiidae, and R. venosa declined by only ~10%, while small zoobenthos declined to as low as ~10% to 35% of the original biomass, depending on the enhancement scenario (Figure 4). When the enhancement density increased to 15 A. japonicus·m−2, the relative change in the biomass of small zoobenthos functional groups decreased by 90.3% in the 12th year of the simulation, slightly lower than the evaluation threshold of the ecological carrying capacity (Figure 4). Thus, the estimated ecological carrying capacity of A. japonicus was 200.57 t·km−2, equivalent to an individual density of 14 inds·m−2.
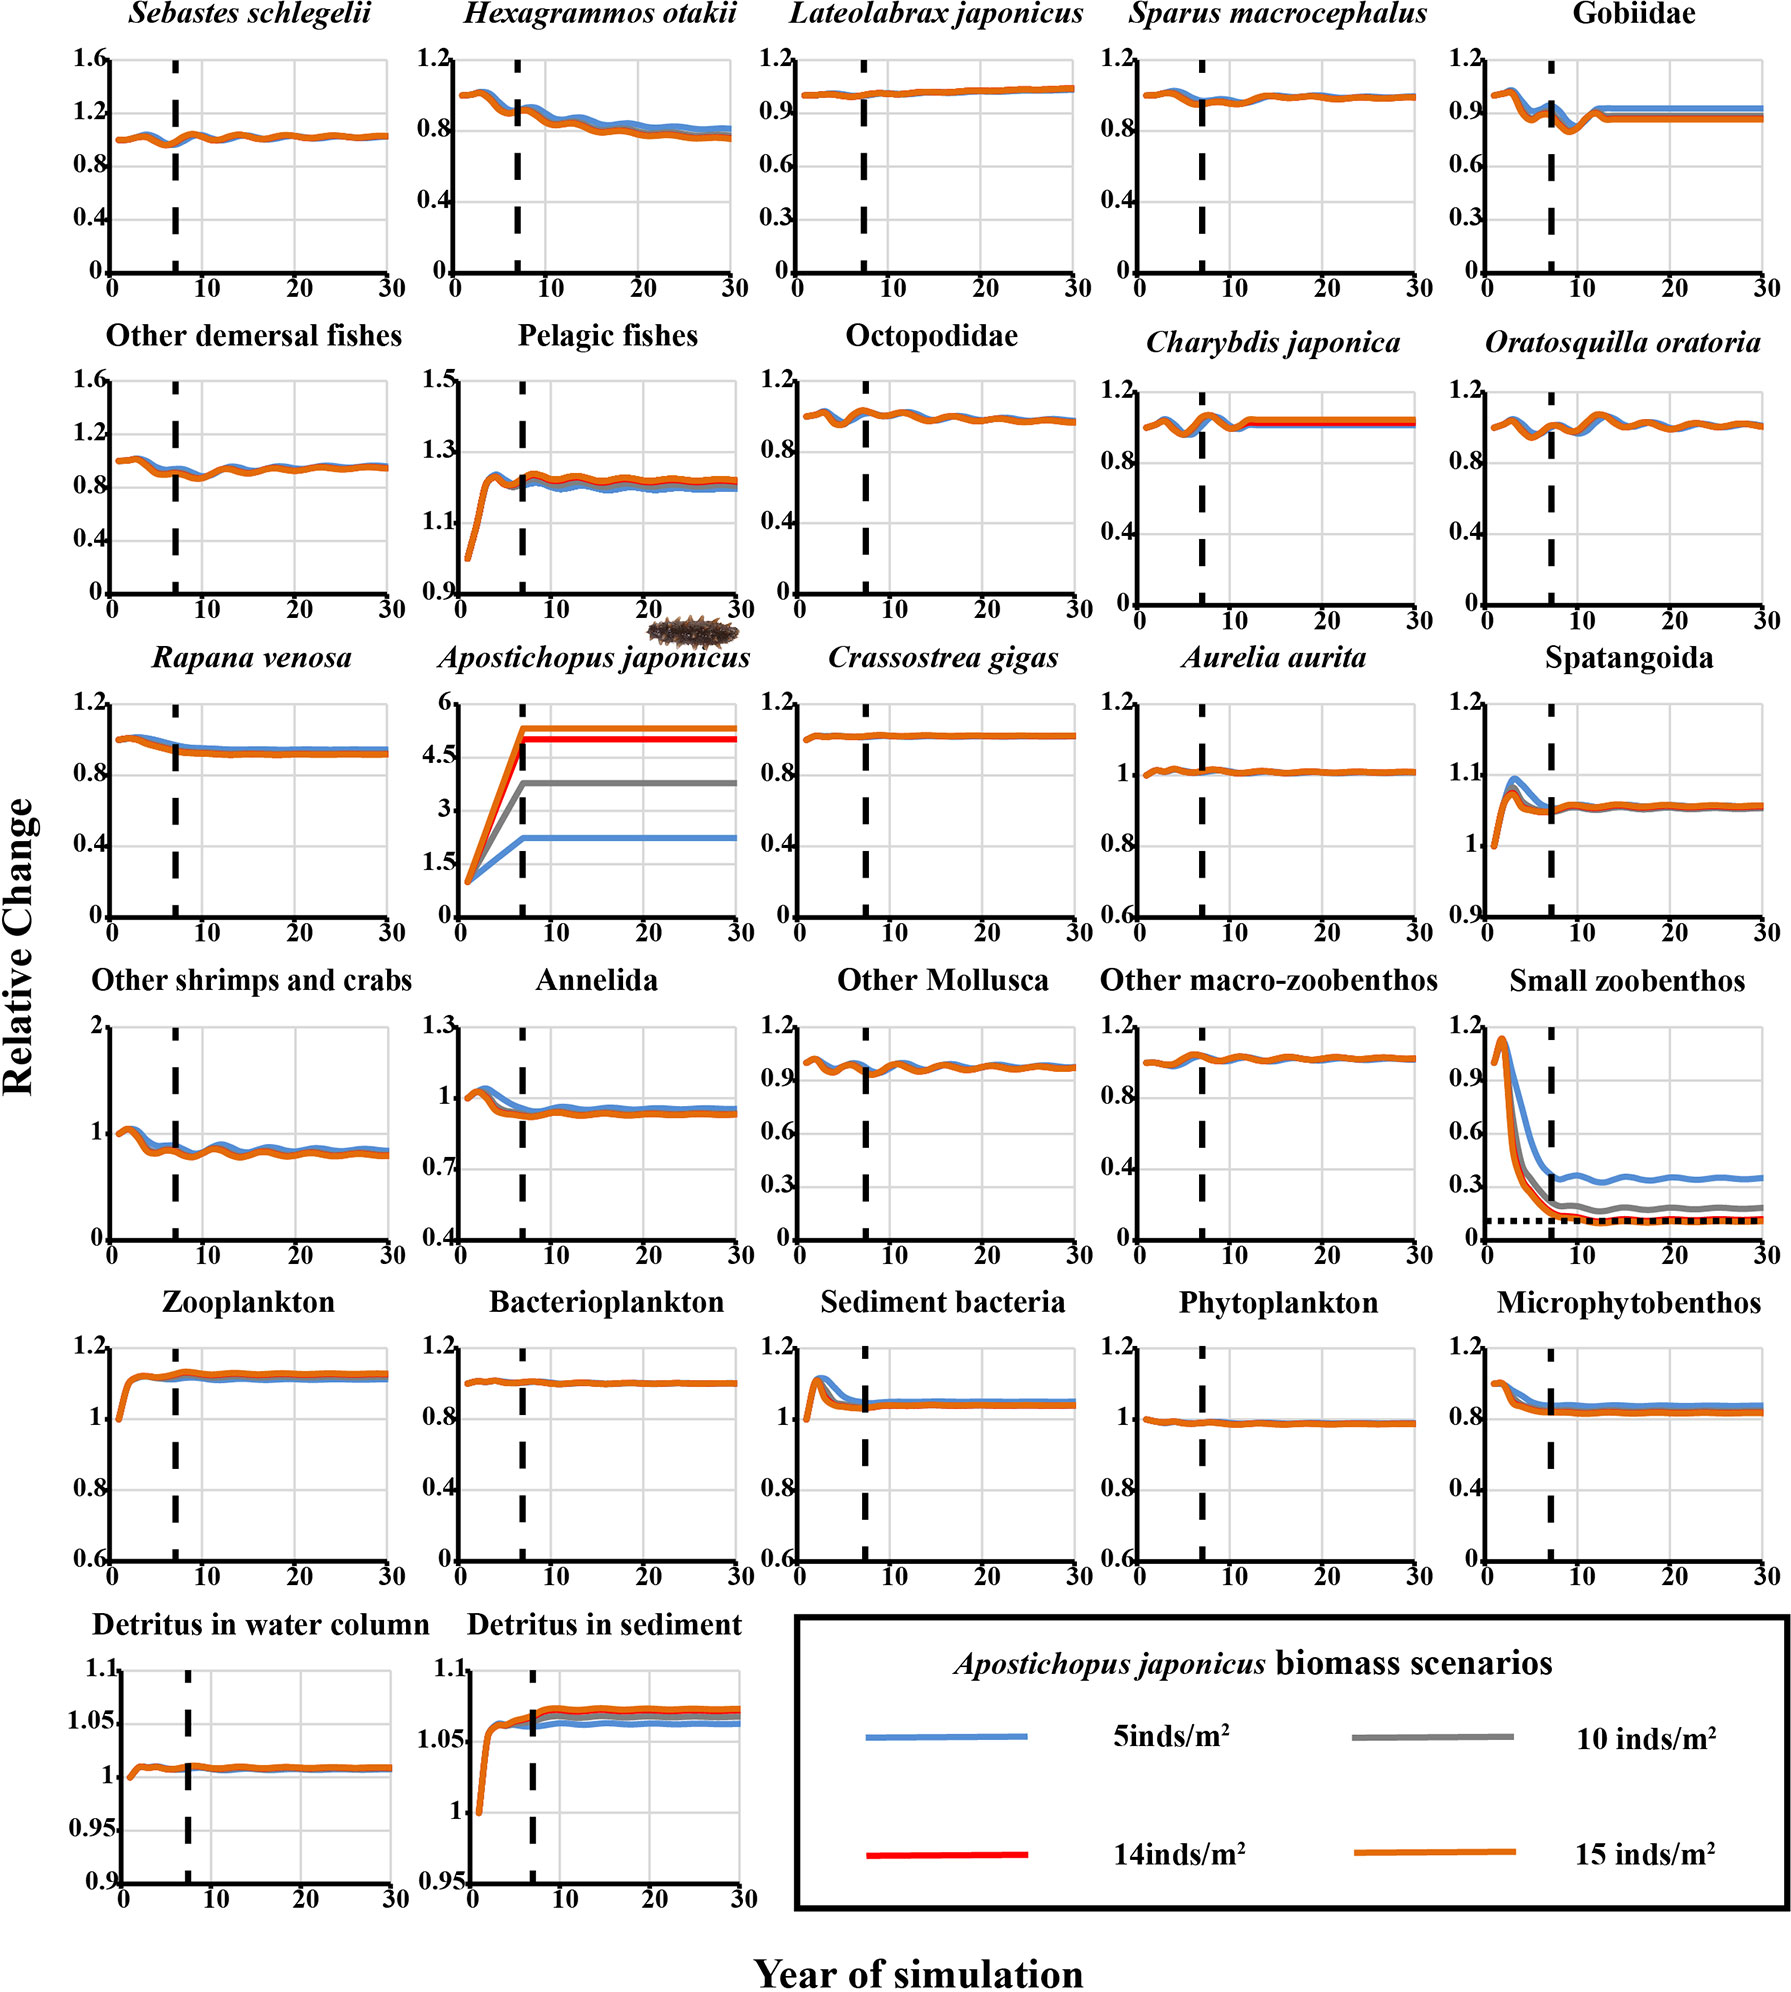
Figure 4 Predicted relative changes in biomass of each functional group for the selected four representative scenarios of the sea cucumber Apostichopus japonicus stock enhancement in the Ecopath Model of Laizhou Bay marine ranching area. Dashed black line, time after which the biomass level of A. japonicus remained constant; horizontal black dotted line, 10% threshold of initial biomass.
Overall ecosystem effects of enhancement
The ecological network analyses showed that the stock enhancement of two target species under four simulation scenarios caused different responses in the ecosystem size (TST, B, PP, R, and P), ecosystem stability, and maturity (H, AMI, C, A, and FCI), ecosystem efficiency (TE), and ecosystem biodiversity (Q). The maximum positive response was that the total system biomass increased by 102% after the stock enhancement of R. venosa, while the maximum negative effect was a 35% reduction in FCI for R. venosa enhancement (Figure 5). The variability of ecosystem property indicators to the R. venosa enhancement scenarios was more obvious than that for A. japonicus enhancement (Figure 5). For example, Kempton’s Q, a measure of ecosystem biodiversity, was approximately 30% lower for R. venosa stocking than that for A. japonicus (Figure 5).
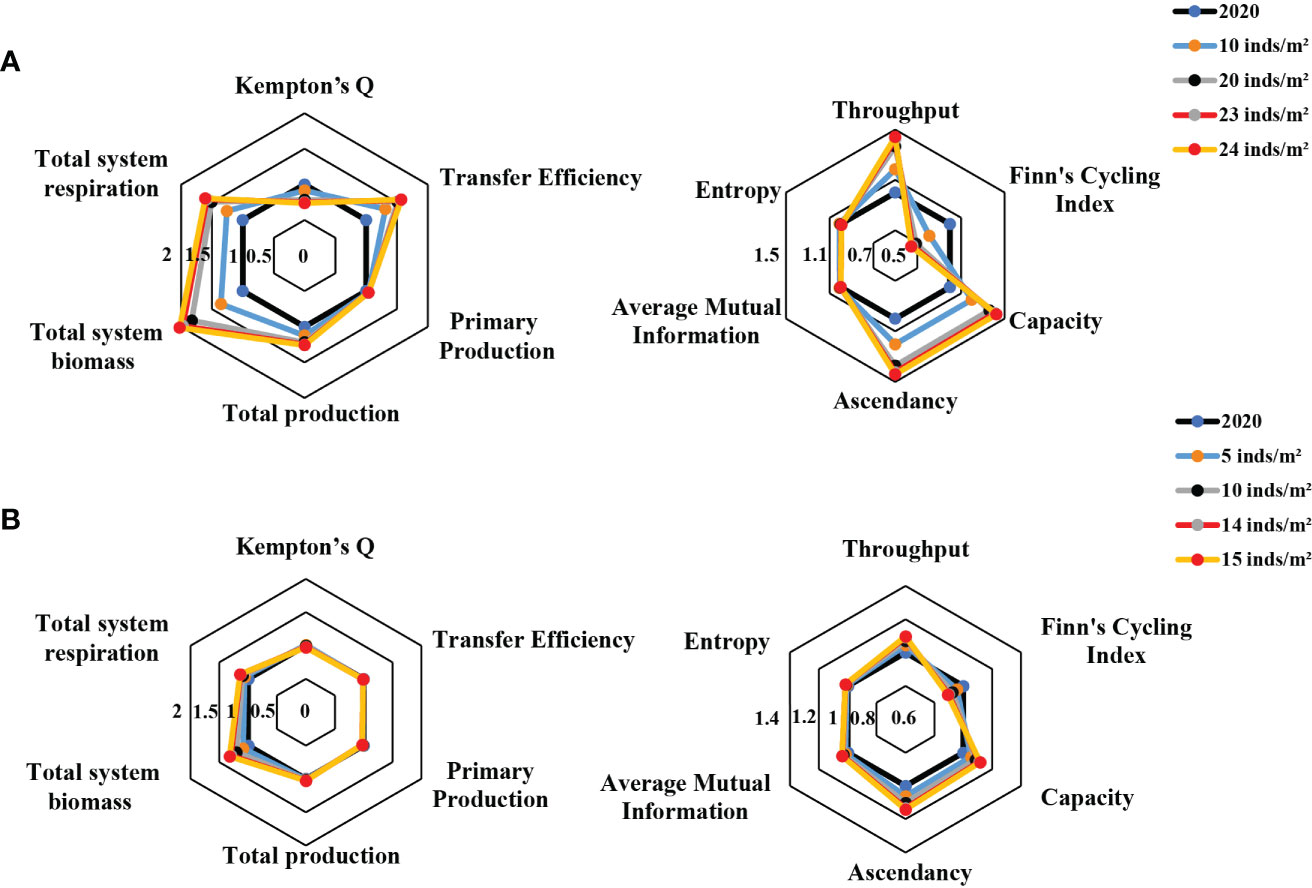
Figure 5 Radar plots showing the relative changes in ecological network analysis indicators predicted from the Ecopath model for the Laizhou Bay marine ranching areas under four stock enhancement scenarios for (A) the red snail Rapana venosa and (B) and the sea cucumber Apostichopus japonicus. 2020 = pre-enhancement values.
Discussion
Effects of simulated stock enhancement on other functional groups
Stocking target species may affect the structure and functioning of the ecosystem through direct and indirect trophic interactions in the food web (Pauly et al., 2000; Eby et al., 2006). Two sedentary benthic species, the red snail R. venosa and the sea cucumber A. japonicus, from different trophic levels were selected as the target species for stock enhancement in the LZB marine ranching ecosystem. We assessed the ecosystem effects of their stocking by evaluating different stocking densities in Ecopath with Ecosim. The simulations from these models showed that the effects of stocking were greater when releasing the benthic carnivorous R. venosa than for the benthic detritivore A. japonicus. When the stocking density for R. venosa reached 24 inds·m−2, other Mollusca functional groups fell below the collapse threshold of 10% of their initial biomass, resulting from the direct feeding of R. venosa on bivalves.
The enhancement scenario for A. japonicus indicated that the biomass of the small zoobenthic functional group fell just below the threshold for collapse when the A. japonicus enhancement density reached 15 inds·m−2. The detritivorous A. japonicus mainly preyed on microphytobenthos, detritus, and bacteria in the sediment (Mao et al., 2009; Wang et al., 2019), competing for food sources with the small zoobenthos functional group, which had a similar diet. The increasing biomass of A. japonicus following enhancement resulted in a reduction in their food resources and indirect competition with the small zoobenthos group, leading to a simulated decline in the biomass of small zoobenthos below the threshold.
R. venosa and A. japonicus are the typical reef-associated commercially important species on the northern coast of China, and the deployment of artificial reefs throughout the region provides an increase in settlement habitat for oysters and mussels (Xu et al., 2019; Xu et al., 2021). These species efficiently filter suspended particulate organic matter (POM) in the water column and provide food for higher trophic levels. Additionally, the feces and pseudo-feces excreted by filter-feeding oysters and mussels are removed by the detritivorous A. japonicus, which improves the utilization rate of organic detritus in the ecosystem and increases the energy recycling efficiency in the system (Molly et al., 1998; Kang et al., 2003; Zhou et al., 2006).
Overall ecosystem-level effects
The ecological network analyses showed the ecosystem size increased proportionally in response to increased levels of stocking of the target species. However, the rate of increase was greater for the R. venosa scenarios than A. japonicus. This is possibly related to the higher biomass of the carnivorous R. venosa, more diverse diet, and more complex trophic connections than those for the detritivorous A. japonicus.
The values of total system biomass (B) and total system respiration (R) also increased as the level of stock enhancement increased. In fact, given the microbial cycling mechanisms, the actual oxygen consumption of the community may be much higher than the model estimates (Nizzoli et al., 2005). The total system respiration can also be considered as a limiting indicator through long-term monitoring of oxygen concentration in the future. The estimation of ecological carrying capacity presented in this study focused on the trophic interactions; however, other biotic and abiotic limiting factors (e.g., space, disease) for a population to grow might result in a change in the carrying capacity of the system. The TST, representing the sum of all flows through the ecosystem, under the stocking scenarios of R. venosa and A. japonicus (41,699 and 31,711 t·km−2·year−1, respectively), were far higher than the base value (25,110 t·km−2·year−1).
A distinct difference in ecosystem development and maturity indicators between the two target species’ stocking was also detected. Expanding the enhancement scale of R. venosa facilitated the ecosystem capacity (C) and ascendancy (A), while ecosystem entropy (H) and average mutual information (AMI) gradually decreased. In contrast to R. venosa, enhancing A. japonicus to different levels resulted in an increase in all ecosystem development and maturity indicators i.e., C, A, H, and AMI, suggesting an increase in the trophic flow interactions among functional groups and a relative mature ecosystem, and a lower degree of unevenness and variability in the flow structure (Odum, 1969; Baird et al., 2007). Ulanowicz et al. (2004) proposed that AMI is more indicative of the developmental status of an ecosystem than H. With the biomass of A. japonicus growing through enhancement, the diversity of flows increased in the system. Furthermore, the increased AMI signifies that the system is channeling flows along more specific pathways. As a consequence, using the practices of appropriate stocking numbers, A. japonicus enhancement facilitates the maturity, stability, and resilience of LZB marine ranching.
Finn’s cycling index (FCI), which describes the ratio of the recycled throughput to the total throughput, declined by different degrees as the scale of stocking increased but responded differently for R. venosa compared with A. japonicus. The FCI of R. venosa decreased by 35.1%, whereas it decreased by only 10.7% for A. japonicus, suggesting that the effects of the enhancement on ecosystems varied between these two species and that stocking R. venosa would impair the ecosystem maturity more than stocking A. japonicus. The stocked R. venosa increased the consumption of oysters and other filter-feeding bivalves greatly, which reduced the energy flow of the ecosystem and limited the production of some potential food sources like feces and pseudo-feces for detritivores such as A. japonicus and likely also greatly decreased the system cycling efficiency.
Kempton’s Q index(Q), which measures the biomass diversity of species with trophic levels greater than 3 (Kempton and Taylor, 1976; Shannon et al., 2009), decreased significantly as the enhancement density of R. venosa increased. This indicates that the introduction of a large numbers of R. venosa through stocking reduced the biomass diversity of upper trophic levels in the Laizhou Bay marine ranching area. Kluger et al. (2016) and Gao et al. (2020) reported a similar trend in Q with the increasing culture biomass of the Peruvian bay scallop (Argopecten purpuratus) in Sechura Bay, Peru, and the Oyster (C. gigas) in Sanggou Bay, China, respectively. Conversely, Q changed by only −2.7% in the A. japonicus enhancement scenarios. The increase in single target species is likely to exert increased predation pressure on prey and even lead to the collapse of the prey functional group, decreasing biodiversity and disrupting the ecosystem balance (Beck et al., 2011; Camp et al., 2013). Empirical observations of the red snail have shown that when a large number of R. venosa invaded the Black Sea, significant changes in the benthic community were recorded, including a decline in biodiversity in the northern part of the continental shelf of the Black Sea (Janssen et al., 2014; Shalovenkov, 2017; Kasapoglu, 2021).
Ecological carrying capacity
In the present study, the Ecopath-based method was also employed to estimate the ecological carrying capacity for the same target species (Byron et al., 2011). The resulting estimates for A. japonicus and R. venosa (148.9 and 90.89 t·km−2, respectively) were only 45.3% and 23.9% of the prior Ecosim-based estimates, respectively. The discrepancies in estimates of carrying capacity are attributed to the different approaches in the estimations. The Ecopath method is based on a steady-state model that describes the constant energy flow between functional groups and assumes that the biomass of other functional groups remains unchanged when simulating the biomass increase of the target species (Jiang and Gibbs, 2005; Srithong et al., 2021). In comparison, in the dynamic Ecosim models, the biomasses of all functional groups vary over time, and thus, this approach provides a more realistic representation of the ecosystem changes. It shows the potential impact of increasing levels of stocking on a time scale and describes the responses of biomass and ecological network indicators over time (Kluger et al., 2016; Gao et al., 2020).
Most prior studies have focused on the ecological carrying capacity estimates of suspended particulate-feeding bivalves (Kluger et al., 2016; Gao et al., 2020), and we know of no other studies using Ecopath with Ecosim for evaluating the effects of enhancing target species in a marine ranching ecosystem. The current model framework provides an approach for estimating the ecological carrying capacity of marine ranching ecosystems along the coast of China, where the combination of habitat-based enhancement using artificial reefs, and releasing target species, is practiced on a very large scale. For example, in 2015, 190 marine ranches had been built in China, and an estimated 619.8 km2 of coastal waters was covered with artificial reefs with a volume of 60.94 million m3 along the coast of China (Chen, 2020). Meanwhile, 167 billion cultured juveniles (e.g., sea cucumber A. japonicus and abalone Haliotis discus hannai) were released by the government and private industry along the Chinese coast over the last two decades (Liu et al., 2022). The results of our study highlight the different ecosystem consequences of stocking two different species at different densities and the importance to managers of taking this information into account when designing their enhancement practices. This knowledge will help determine the optimal target species for enhancement and the densities for enhancement and reduce the possible ecological risks of enhancements. Our findings show that A. japonicus is an ideal potential target species for stocking because the simulated ecosystem responses in the Laizhou Bay marine ranching area after stocking were relatively small. When considering the implementation of stocking for commercially important carnivorous species, it is essential to strengthen the evaluation and monitoring of target species and their prey in the stock enhancement. Furthermore, a more realistic estimation of ecological carrying capacity in marine ranching is likely to be obtained if spatial processes are taken into account. This can be done by collecting information on different habitats and the distribution of species within the ranch and developing an Ecospace model to evaluate the ecological carrying capacity. This approach recognizes the spatial heterogeneity within the sea ranching ecosystem in estimating its potential ecological carrying capacity.
Conclusion
The ecological carrying capacities of red snail R. venosa and sea cucumber A. japonicus, two sedentary and reef-associated target species with potential for stock enhancement in the marine ranching waters of northern China, were estimated to be 623.46 and 200.57 t·km−2, respectively. These estimated carrying capacities are 7.8 and 5.0 times higher than the current standing stocks of R. venosa and A. japonicus. The ecosystem consequences of stocking different species are species-specific and relevant to their trophic position in the food web and differ between the carnivorous gastropod R. venosa and the detritivorous A. japonicus. The simulated enhancement for R. venosa showed a stronger negative impact on most other functional groups and ecosystem properties of marine ranching, such as system maturity and stability and biodiversity, than that for A. japonicus, which had relatively benign impacts. The current dynamic model framework provides an alternative means of estimating the ecological carrying capacity for stock enhancement practices in the development of marine ranching in northern China.
Data availability statement
The original contributions presented in the study are included in the article/Supplementary Material. Further inquiries can be directed to the corresponding authors.
Author contributions
ZWu and ZWa conceptualized this paper. JF, ZWa, and ZWu organized the database and constructed the model. ZWa and ZWu wrote the first draft of the manuscript. All authors contributed to the manuscript revision and approved the submitted version. ZWa and JF share the first authorship of this manuscript
Funding
This work was funded by the National Key Research and Development Program of China (Grant Number: 2019YFD0901304), the National Natural Science Foundation of China (Grant Number: 41906125), Dalian innovation and entrepreneurship project for high-level talents (Grant Number: 2020RQ112), and Dalian Science and Technology Innovation Fund (Grant Number: 2021JJ11CG001).
Conflict of interest
The authors declare that the research was conducted in the absence of any commercial or financial relationships that could be construed as a potential conflict of interest.
The reviewer TW declared a shared affiliation with the author ZX to the handling editor at the time of review.
Publisher’s note
All claims expressed in this article are solely those of the authors and do not necessarily represent those of their affiliated organizations, or those of the publisher, the editors and the reviewers. Any product that may be evaluated in this article, or claim that may be made by its manufacturer, is not guaranteed or endorsed by the publisher.
Supplementary material
The Supplementary Material for this article can be found online at: https://www.frontiersin.org/articles/10.3389/fmars.2022.936028/full#supplementary-material
References
Baird D., Asmus H., Asmus R. (2007). Trophic dynamics of eight intertidal communities of the sylt-rømø bight ecosystem, northern wadden Sea. Mar. Ecol.: Prog. Ser. 351, 25–41. doi: 10.3354/meps07137
Beck M. W., Brumbaugh R. D., Airoldi L., Carranza A., Coen L. D., Crawford C., et al. (2011). Oyster reefs at risk and recommendations for conservation, restoration, and management. BioScience 61, 107–116. doi: 10.1525/bio.2011.61.2.5
Blankenship H. L., Leber K. M. (1995). A responsible approach to marine stock enhancement. Am. Fish. Soc Symp. 15, 67–175.
Byron C., Link J., Costa-Pierce B., Bengtson D. (2011). Calculating ecological carrying capacity of shellfish aquaculture using mass-balance modeling: Narragansett bay, Rhode island. Ecol. Modell. 222, 1743–1755. doi: 10.1016/j.ecolmodel.2011.03.010
Camp E. V., Lorenzen K., Ahrens R. N. M., Barbieri L., Leber K. M. (2013). Potentials and limitations of stock enhancement in marine recreational fisheries systems: An integrative review of florida's red drum enhancement. Rev. Fish. Sci. 21, 388–402. doi: 10.1080/10641262.2013.83807
Chen Y. (2020). Research and construction of modern marine ranching in China: A review. J. Dalian Ocean Univ. 35, 147–154. doi: 10.16535/j.cnki.dlhyxb.2019−260
Cheung W. L., Watson R., Pitcher T. J. (2002). Policy simulation of fisheries in the Hong Kong marine ecosystem. N. Z. J. Mar. Freshw. Res. 10, 46–54. doi: 10.1080/00288330.2014.901232
Christensen V., Walters C. J. (2004). Ecopath with ecosim: Methods, capabilities and limitations. Ecol. Modell. 172, 109–139. doi: 10.1016/j.ecolmodel.2003.09.003
Christensen V., Walters C. J., Pauly D. (2005). Ecopath with ecosim: a user's guide Vol. 154 (Vancouver, British Columbia: University of British Columbia, Fisheries Centre, Canada and ICLARM, Penang, Malaysia), 31.
Cooney R. T., Brodeur R. D. (1998). Carrying capacity and north pacific salmon production: Stock-enhancement implications. Bull. Mar. Sci. 62, 443–464. doi: 10.1029/98JC00121
Cudmore-Vokey B., Crossman E. J. (2000). Checklists of the fish fauna of the laurentian great lakes and their connecting channels. Victoria: MS. Rpt. Fish. Aquat. Sci 2250:v+39p.
Darwall W., Allison E. H., Turner G. F., Irvine K. (2010). Lake of flies, or lake of fish? A trophic model of lake Malawi. Ecol. Model. 221, 713–727. doi: 10.1016/j.ecolmodel.2009.11.001
Eby L. A., Roach W. J., Crowder L. B., Stanford J. A. (2006). Effects of stocking-up freshwater food webs. Trends Ecol. Evol. 21, 576–584. doi: 10.1016/j.tree.2006.06.016
FAO (2005). A review of stock enhancement practices in the inland water fisheries of Asia (Bangkok: Asia Pacific Fishery Commission), 93.
Filgueira R., Guyondet T., Thupaki P., Sakamaki T., Grant J. (2021). The effect of embayment complexity on ecological carrying capacity estimations in bivalve aquaculture sites. J. Cleaner Prod. 288, 125739. doi: 10.1016/j.jclepro.2020.125739
Finn J. T. (1976). Measures of ecosystem structure and function derived from analysis of flows. J. Theor. Biol. 56, 363–380. doi: 10.1016/S0022-5193(76)80080-X
Gao Y. P., Fang J. G., Lin F., Li F. X., Li W. H., Wang X. Q. (2020). Simulation of oyster ecological carrying capacity in sanggou bay in the ecosystem context. Aquacult. Int. 28, 2059–2079. doi: 10.1007/s10499-020-00576-3
Heymans J. J., Coll M., Link J. S., Link J. S., Mackinson S., Steenbeek J., et al. (2016). Best practice in ecopath with ecosim food-web models for ecosystem-based management. Ecol. Modell. 331, 173–184. doi: 10.1016/j.ecolmodel.2015.12.007
Heymans J. J., Guenette S., Christensen V. (2007). Evaluating network analysis indicators of ecosystem status in the gulf of Alaska. Ecosystems 10, 488–502. doi: 10.1007/s10021-007-9034-y
Inglis G. J., Hayden B. J., Ross A. H. (2000). An overview of factors affecting the carrying capacity of coastal embayments for mussel culture Vol. 69 (Christchurch: National Institute of Water & Atmospheric Research), vi + 31p.
Janssen R., Knudsen S., Todorova V., Hosgor A. G. (2014). Managing Rapana in the black Sea: Stakeholder workshops on both sides. Ocean Coast. Manage. 87, 75–87. doi: 10.1016/j.ocecoaman.2013.10.015
Jiang W., Gibbs M. T. (2005). Predicting the carrying capacity of bivalve shellfish culture using a steady, linear food web model. Aquaculture 244, 171–185. doi: 10.1016/j.aquaculture.2004.11.050
Jiang Y. Z., Lin N., Yang L. L., Cheng J. Y. (2014). The ecological risk of stock enhancement and the measures for prevention and control. J. Fish. Sci. China 21, 413–422. doi: 10.3724/SP.J.1118.2014.00413
Jin X. S., Deng J. Y. (2000). Variations in community structure of fishery resources and biodiversity in the laizhou bay, Shandong. Chin. Biodiversity 8, 65–72. doi: 10.17520/biods.2000009
Jin X. S., Shan X. J., Xiansen L. I., Wang J., Cui Y., Zuo T. (2013). Long-term changes in the fishery ecosystem structure of laizhou bay, China. Sci. China: Earth Sci. 56, 366–374. doi: 10.1007/s11430-012-4528-7
Kang K. H., Kwon J. Y., Kim Y. M. (2003). A beneficial coculture: Charm abalone Haliotis discus hannai and sea cucumber. Stichopus japonicus. Aquaculture 216, 87–93. doi: 10.1016/S0044-8486(02)00203-X
Kasapoglu N. (2021). Population structure and shell dimension of the invasive veined whelk (Rapana venosa). J. Fish. 9, 91205–91205. doi: 10.17017/j.fish.256
Kempton R. A., Taylor L. R. (1976). Models and statistics for species diversity. Nature 262, 818–820. doi: 10.1038/262818a0
Khan M. F., Preetha P., Sharma A. P. (2015). Modelling the food web for assessment of the impact of stock supplementation in a reservoir ecosystem in India. Fish. Manage. Ecol. 22, 359–370. doi: 10.1111/fme.12134
Kitada S. (2020). Lessons from Japan marine stock enhancement and sea ranching programmes over 100 years. Rev. Aquacul. 12, 1944–1969. doi: 10.1111/raq.12418
Kluger L. C., Taylor M. H., Mendo J., Tam J., Wolff M. (2016). Carrying capacity simulations as a tool for ecosystem-based management of a scallop aquaculture system. Ecol. Modell. 331, 44–55. doi: 10.1016/j.ecolmodel.2015.09.002
Lin Q., Jin X. S., Zhang B., Gu X. W. (2009). Comparative study on the changes of the bohai Sea ecosystem structure based on ecopath model between ten years. Acta Ecol. Sin. 29, 3613–3620. doi: 10.3321/j.issn:1000-0933.2009.07.020
Link J. S. (2010). Adding rigor to ecological network models by evaluating a set of pre-balance diagnostics: A plea for PREBAL. Ecol. Modell. 221, 1580–1591. doi: 10.1016/j.ecolmodel.2010.03.012
Lin Q., Li X. S., Li Z. Y., Jin X. S. (2013). Ecological carrying capacity of Chinese shrimp stock enhancement in laizhou bay of East China based on ecopath model. Chin. J. Appl. Ecol. 24, 1131–1140. doi: 10.13287/j.1001-9332.2013.0269
Liu S. R., Zhou X. J., Zeng C., Frankstone T., Cao L. (2022). Characterizing the development of Sea ranching in China. Rev. Fish. Biol. Fisheries. 32, 1–21. doi: 10.1007/s11160-022-09709-8
Lorenzen K., Leber K. M., Blankenship H. L. (2010). Responsible approach to marine stock enhancement: an update. Rev. Fish. Sci. 18, 189–210. doi: 10.1080/10641262.2010.491564
Lorenzen K., Leber K. M., Loneragan N. R., Schloesser R. W., Taylor M. D. (2021). Developing and integrating enhancement strategies to improve and restore fisheries. Bull. Mar. Sci. 97, 475–487. doi: 10.5343/bms.2021.0036
Mao Y., Yang H., Zhou Y., Ye N., Fang J. (2009). Potential of the seaweed Gracilaria lemaneiformis for integrated multi-trophic aquaculture with scallop Chlamys farreri in north China. J. Appl. Phycol. 21, 649–656. doi: 10.1007/s10811-008-9398-1
McKindsey C. W., Thetmeyer H., Landry T., Silvert W. (2006). Review of recent carrying capacity models for bivalve culture and recommendations for research and management. Aquaculture 261, 451–462. doi: 10.1016/j.aquaculture.2006.06.044
Ministry of Agriculture and Rural Affairs of the People’s Republic of China (2022). Notice of ministry of agriculture and rural affairs of the people’s republic of China, (No. 115, 2321, 2476). http://www.moa.gov.cn/gk/tzgg_1/gg/ (Accessed by Apr 20, 2022)
Molly O. A. (1998). Consumption and assimilation of salmon net pen fouling debris by the red Sea cucumber Parastichopus californicus: Implications for polyculture. J. World Aquacult. Soc 29, 133–139. doi: 10.1111/j.1749-7345.1998.tb00972.x
Munro J. L., Bell J. D. (1997). Enhancement of marine fisheries resources. Rev. Fish. Sci. 5, 185–222. doi: 10.1080/10641269709388597
Ning X. R., Liu Z. L., Shi J. X. (1995). Assessment of potential fishery production and primary productivity in pohai, huanghai and dongha. Acta Oceanol. Sin. 17, 72–84. doi: 10.1088/0256-307X/12/7/010
Nizzoli D., Welsh D. T., Bartoli M., Viaroli P. (2005). Impacts of mussel (Mytilus galloprovincialis) farming on oxygen consumption and nutrient recycling in a eutrophic coastal lagoon. Hydrobiologia 550, 183–198. doi: 10.1007/s10750-005-4378-9
Odum E. P. (1969). The strategy of ecosystem development. Science 164, 262–270. doi: 10.5822/978-1-61091-491-8-20
Palomares M. L., Pauly D. (1989). A multiple regression model for prediction the food consumption of marine fish populations. Mar. Freshw. Res. 40, 259–273. doi: 10.1071/MF9890259
Parsons T. R., Maita Y., Lalli C. M. (1984). A manual of chemical and biological methods for seawater analysis (Oxford: Pergamon Press).
Pauly D., Bartz M. L. S. (1993). “Improved construction, parametrization and interpretation of steady-state ecosystem models,” in Trophic models of aquatic ecosystems. Eds. Christensen V., Pauly D. (Manila: ICLARM Conference Proceedings), 1–13.
Pauly D., Christensen V., Walters C. J. (2000). Ecopath, ecosim, and ecospace as tools for evaluating ecosystem impact of fisheries. ICES J. Mar. 57, 697–706. doi: 10.1006/jmsc.2000.0726
Shalovenkov N. N. (2017). Non-native zoobenthic species at the Crimean black Sea coast. Med. Mar. Sci. 18, 260–270. doi: 10.12681/mms.1925
Shannon L. J., Coll M., Neira S. (2009). Exploring the dynamics of ecological indicators using food web models fitted to time series of abundance and catch data. Ecol. Indic. 9, 1078–1095. doi: 10.1016/j.ecolind.2008.12.007
Shen G. M., Heino M. (2014). An overview of marine fisheries management in China. Mar. Policy. 44, 265–272. doi: 10.1016/j.marpol.2013.09.012
Solan M., Cardinale B. J., Downing A. L., Engelhardt K. A. M., Ruesink J. L., Srivastava D. S. (2004). Extinction and ecosystem function in the marine benthos. Science 306, 1177–1180. doi: 10.1126/science.1103960
Srithong N., Jensen K. R., Jarernpornnipat A. (2021). Application of the ecopath model for evaluation of ecological structure and function for fisheries management: A case study from fisheries in coastal Andaman Sea, Thailand. Reg. Stud. Mar. Sci. 47, 101972. doi: 10.1016/j.rsma.2021.101972
Stier A. C., Samhouri J. F., Novak M., Marshall K. N., Ward E. J., Holt R. D., et al. (2016). Ecosystem context and historical contingency in apex predator recoveries. Sci. Adv. 2, e1501769. doi: 10.1126/sciadv.1501769
Su J. L., Tang Q. S. (2002). Study on ecosystem dynamics in costal ocean II processes of the bohai Sea ecosystem dynamics (Beijing: Science Press).
Taylor M. D., Brennan N. P., Lorenzen K., Leber K. M. (2013). Generalized predatory impact model: A numerical approach for assessing trophic limits to hatchery releases and controlling related ecological risks. Rev. Fish. Sci. 21, 341–353. doi: 10.1080/10641262.2013.796815
Taylor M. D., Chick R. C., Lorenzen K., Agnalt A. L., Leber K. M., Blankenship H. L., et al. (2017). Fisheries enhancement and restoration in a changing world. Fish. Res. 186, 407–412. doi: 10.1016/j.fishres.2016.10.004
Taylor M. D., Palmer P. J., Fielder D. S., Suthers I. M. (2005). Responsible estuarine finfish stock enhancement: an Australian perspective. J. Fish. Biol. 67, 299–331. doi: 10.1111/j.0022-1112.2005.00809.x
Townsend C. R. (2010). Individual, population, community, and ecosystem consequences of a fish invader in new Zealand streams. Conserv. Biol. 17, 38–47. doi: 10.1046/j.1523-1739.2003.02017.x
Ulanowicz R. E. (1986). Growth and development: Ecosystems phenomenology. Estuaries 11, 73–74. doi: 10.2307/1351721
Ulanowicz R. E. (2004). Quantitative methods for ecological network analysis. Comput. Biol. Chem. 28, 321–339. doi: 10.1016/j.compbiolchem.2004.09.001
Walters C., Christensen V., Pauly D. (1997). Structuring dynamic models of exploited ecosystems from trophic mass-balance assessments. Rev. Fish. Biol. Fish. 7, 139–172. doi: 10.1023/A:1018479526149
Wang R., Chaolun L. I., Wang K. E., Zhang W. (1998). Feeding activities of zooplankton in the bohai Sea. Fish. Ocean. 7, 265–271. doi: 10.1046/j.1365-2419.1998.00067.x
Wang B., Tian J. S., Dong Y., Chen Z., Zhou Z. C., Song G., et al. (2019). Using carbon and nitrogen stable isotopes to evaluate feeding habits of Sea cucumber Apostichopus japonicus in aquaculture ponds in liaodong bay. Fish. Sci. 38, 236–240. doi: 10.16378/j.cnki.1003-1111.2019.02.014
Wei Y. Q., Cui H. W., Hu Q. J., Bai Y., Qu K. M., Sun J., et al. (2022). Eutrophication status assessment in the laizhou bay, bohai Sea: Further evidence for the ecosystem degradation. Mar. pollut. Bull. 181, 113867. doi: 10.1016/j.marpolbul.2022.113867
Worm B., Barbier E. B., Beaumont N., Duffy E., Folke C., Halpern B. S., et al. (2006). Impacts of biodiversity loss on ocean ecosystem services. Science 314, 787–790. doi: 10.1126/science.1132294
Worm B., Hilborn R., Baum J. K., Branch T. A., Collie J. S., Costello C., et al. (2009). Rebuilding global fisheries. Science 325, 578–585. doi: 10.1126/science.1173146
Wu Z. X., Zhang X. M., Zhang L., Tong F., Liu H. J. (2013). Predicting the ecological carrying capacity of lidao artificial reef zone of Shandong province for the sea cucumber, Apostichopus japonicus, (Selenck) and the abalone, Haliotis discus hannai, using a linear food web model. J. Fish. Sci. China 20, 327–337. doi: 10.3724/SP.J.1118.2013.00327
Xu M., Qi L., Zhang L. B., Zhang T., Yang H. S., Zhang Y. L. (2019). Ecosystem attributes of trophic models before and after construction of artificial oyster reefs using ecopath. Aquacult. Env. Interac. 11, 111–127. doi: 10.3354/aei00284
Xu M., Yang X. Y., Song X. J., Xu K. D., Yang L. L. (2021). Seasonal analysis of artificial oyster reef ecosystems: implications for sustainable fisheries management. Aquacult. Int. 29, 167–192. doi: 10.1007/s10499-020-00617-x
Yang C. J., Wu Z. X., Liu H. Y., Zhang P. D., Li W. T., Zeng X. Q., et al. (2016). The fishing strategy of charybdis japonica and Rapana venosa and the carrying capacity of Apostichopus japonucus in zhuwang, laizhou artificial reef ecosystem based on ecopath model. Period. Ocean Univ. China 46, 168–177. doi: 10.16441/j.cnki.hdxb.20160112
Zhang X. M., Wang X. J., Tu Z., Zhang P. D., Wang Y. Z., Gao T. X., et al. (2009). Current status and prospect of fisheries resource enhancement in Shandong province. Chin. Fish. Eco. 27, 51–58. doi: 10.3969/j.issn.1009-590X.2009.02.008
Keywords: Rapana venosa, Apostichopus japonicus, Laizhou Bay, artificial habitats, aquaculture-based enhancement, ecosystem effects, ecological risk
Citation: Wang Z, Feng J, Lozano-Montes HM, Loneragan NR, Zhang X, Tian T and Wu Z (2022) Estimating ecological carrying capacity for stock enhancement in marine ranching ecosystems of Northern China. Front. Mar. Sci. 9:936028. doi: 10.3389/fmars.2022.936028
Received: 04 May 2022; Accepted: 16 August 2022;
Published: 12 September 2022.
Edited by:
Binhe Gu, University of Florida, United StatesReviewed by:
Tianming Wang, Zhejiang Ocean University, ChinaQiang Xu, Hainan University, China
Yuan-Wei Du, Ocean University of China, China
Copyright © 2022 Wang, Feng, Lozano-Montes, Loneragan, Zhang, Tian and Wu. This is an open-access article distributed under the terms of the Creative Commons Attribution License (CC BY). The use, distribution or reproduction in other forums is permitted, provided the original author(s) and the copyright owner(s) are credited and that the original publication in this journal is cited, in accordance with accepted academic practice. No use, distribution or reproduction is permitted which does not comply with these terms.
*Correspondence: Zhongxin Wu, d3V6aG9uZ3hpbkBkbG91LmVkdS5jbg==; Tao Tian, dGlhbjIwMDdAZGxvdS5lZHUuY24=
†These authors have contributed equally to this work and share first authorship