 Libin Dai
 Cameron T. Hodgdon
 Luoliang Xu3
 Siquan Tian
- 1College of Marine Sciences, Shanghai Ocean University, Shanghai, China
- 2School of Marine Sciences, University of Maine, Orono, ME, United States
- 3Center for Limnology, University of Wisconsin-Madison, Madison, WI, United States
- 4National Engineering Research Center for Oceanic Fisheries, Shanghai Ocean University, Shanghai, China
- 5Key Laboratory of Sustainable Exploitation of Oceanic Fisheries Resources, Ministry of Education, Shanghai, China
- 6School of Marine and Atmospheric Sciences, Stony Brook University, Stony Brook, NY, United States
China contributes the largest catches to global marine wild-capture fisheries. The majority of them are harvested from China Seas which are highly productive, but are facing heavy fisheries exploitation. The status of exploited fisheries stocks in China Seas have remained largely unknown due to severe data-limited conditions, which hindered their sustainable use and effective management. Although the off-the-shelf use of catch-only methods (COMs) has been cautioned because of their poor estimation performance, such methods have been increasingly applied to infer the status of exploited stocks in China Seas without performance evaluation. In this study, we established an empirical approach to evaluate the performance of a suite of COMs in predicting stock biomass status for the data-limited fisheries in the East China Sea (ECS) from data-rich stocks with similar characteristics in the RAM Legacy Stock Assessment Database (RLSADB). The results confirmed that ensemble approaches performed better than the individual COMs in estimating the mean of stock biomass status for data-rich stocks selected from RLSADB. By contrast, mechanistic COMs demonstrated more accurate estimates when predicting the trend of stock biomass status. The stock status of commercial fisheries in ECS estimated by three mechanistic COMs (Catch-MSY, CMSY, and OCOM) was likely too optimistic for most species. We suggest that China establish its national database and develop and implement regular monitoring programs to satisfy formal statistical stock assessment for its coastal fisheries.
Introduction
The United Nations Sustainable Development Goal 14 (SDG 14), titling “Life below water”, calls for the global community to “Conserve and sustainably use the oceans, seas, and marine resources for sustainable development.” Marine fisheries are particularly important to food security, employment, cultural identity, and ecosystem services around the world (Ovando et al., 2021a). Achieving the SDG 14 targets partially relies on the ability to effectively determine the status of global marine fish populations and fisheries. However, the majority of the world’s fish populations, constituting roughly 50% of marine landings, lack formal stock assessment to evaluate their stock size relative to reference points (FAO, 2020; Hilborn et al., 2020). This includes nearly all marine wild-capture fisheries in China Seas, which are characterized by the world’s largest catches, highest fishing efforts, and the most fishing fleets (Zhang et al., 2022).
China produces 15% of global marine wild-capture catch (FAO, 2020), and its coastal fisheries in China Seas (i.e., the Bohai Sea, the Yellow Sea, the East China Sea, the South China Sea) are highly productive, producing ~80% of that total (MOA, 1986-2021). Unfortunately, the status of exploited fisheries in China Seas have remained largely unknown, which are mainly caused by lack of sufficient data and expertise to support formal stock assessment. Some previous studies revealed fish stock status in China Seas through graphical catch-only approaches (i.e., stock status plots) which assign status based on the ratio of current catch to the maximum catch with various fisheries phases (Cao et al., 2017; Lam and Pauly, 2019; Teh et al., 2020), even though such methods have been widely criticized for being negatively biased and providing overly pessimistic conclusions regarding stock status (Branch et al., 2011; Carruthers et al., 2012). Furthermore, mechanistic catch-only methods (COMs), such as CMSY (Froese et al., 2017) have been increasingly applied to infer the status of exploited stocks in China Seas (Zhang et al., 2018; Liao et al., 2021; Pauly et al., 2021). However, the performance of application of COMs in China Seas has yet to be evaluated.
The consensus of numerous evaluations is that COMs provide imprecise and biased estimates of stock status when applied to new fisheries (Free et al., 2020; Ovando et al., 2021b). Free et al. (2020) advocated for testing the performance of COMs through both simulation testing and empirical validation. Simulation testing has been advised to evaluate the ability of assessment models to accurately and precisely estimate stock conditions and could be conducted for a range of specific stocks covering a range of life history, data availability, recruitment variability, depletion level, fishery type, and others (Deroba et al., 2015). However, the characteristics of fisheries in China Seas are quite complex due to multiple aspects such as nonselective fishing (Cao et al., 2017), trophic cascades (Szuwalski et al., 2017), non-stationary population processes (Lee et al., 2020), uniform management policies (Su et al., 2020), pulse fishing (Xing et al., 2020), highly aggregated fishing efforts across limited time and space (Zhang et al., 2022), and a long coastal line with distinct types of ecosystems and habitats (Liu, 2013), making simulation exercises hard to realistically capture the true dynamics of localized systems. By contrast, empirical validation was implemented through testing on assessed fisheries with data-rich estimates of stock status, but have the shortcoming of comparison against model estimates, not true known values (Ovando et al., 2021b). Moreover, the lack of formally assessed fisheries or stocks in China Seas prevents analysts from providing data-rich estimates to support empirical validation.
The RAM Legacy Stock Assessment Database (RLSADB) has collected detailed assessment data from over 1400 individual marine fish and invertebrate stocks (Ricard et al., 2012), representing the best estimates of the state of data-rich assessed fish populations in the world (Hilborn et al., 2020). Numerous internal and external evaluations conducted empirical validation for COMs through assessed data-rich stocks in RLSADB (Martell and Froese, 2013; Anderson et al., 2017; Free et al., 2017; Zhou et al., 2017; Free et al., 2020; Ovando et al., 2021a; Ovando et al., 2021b);. Based on these efforts, it was recommended that testing COMs on data-rich fisheries with characteristics similar to data-limited fisheries is necessary. However, few studies seek to explore and test the potential of COMs’ application in data-limited fisheries in the China Seas from data-rich stocks in RLSADB.
Herein, we established an empirical approach to assess a suite of COMs on data-rich stocks in RLSADB with similar characteristics to data-limited fisheries from the East China Sea (ECS). Using the data-limited fisheries in ECS as an example, this study aimed to demonstrate how COMs can be applied and assessed using experience learned from data-rich stocks with characteristics similar to data-limited fisheries. This empirical approach could be extended to other data-limited regions where catch data are the main information source available.
Materials and Methods
The detailed procedures of our empirical approach were shown in Figure 1. Firstly, we chose typical commercial fisheries in the ECS as cases and summarized the pattern of their catch trends and depletion levels. Next, we selected RLSADB stocks which have similar catch trends and depletion levels as the ECS’s stocks and applied multiple COMs to these data-rich stocks. After that, we validated the performance of applied COMs on estimating stock biomass status by comparing with known estimates from likelihood-based assessments in RLSABD. Finally, we assessed the stock status of the main commercial fisheries of ECS as a case application.
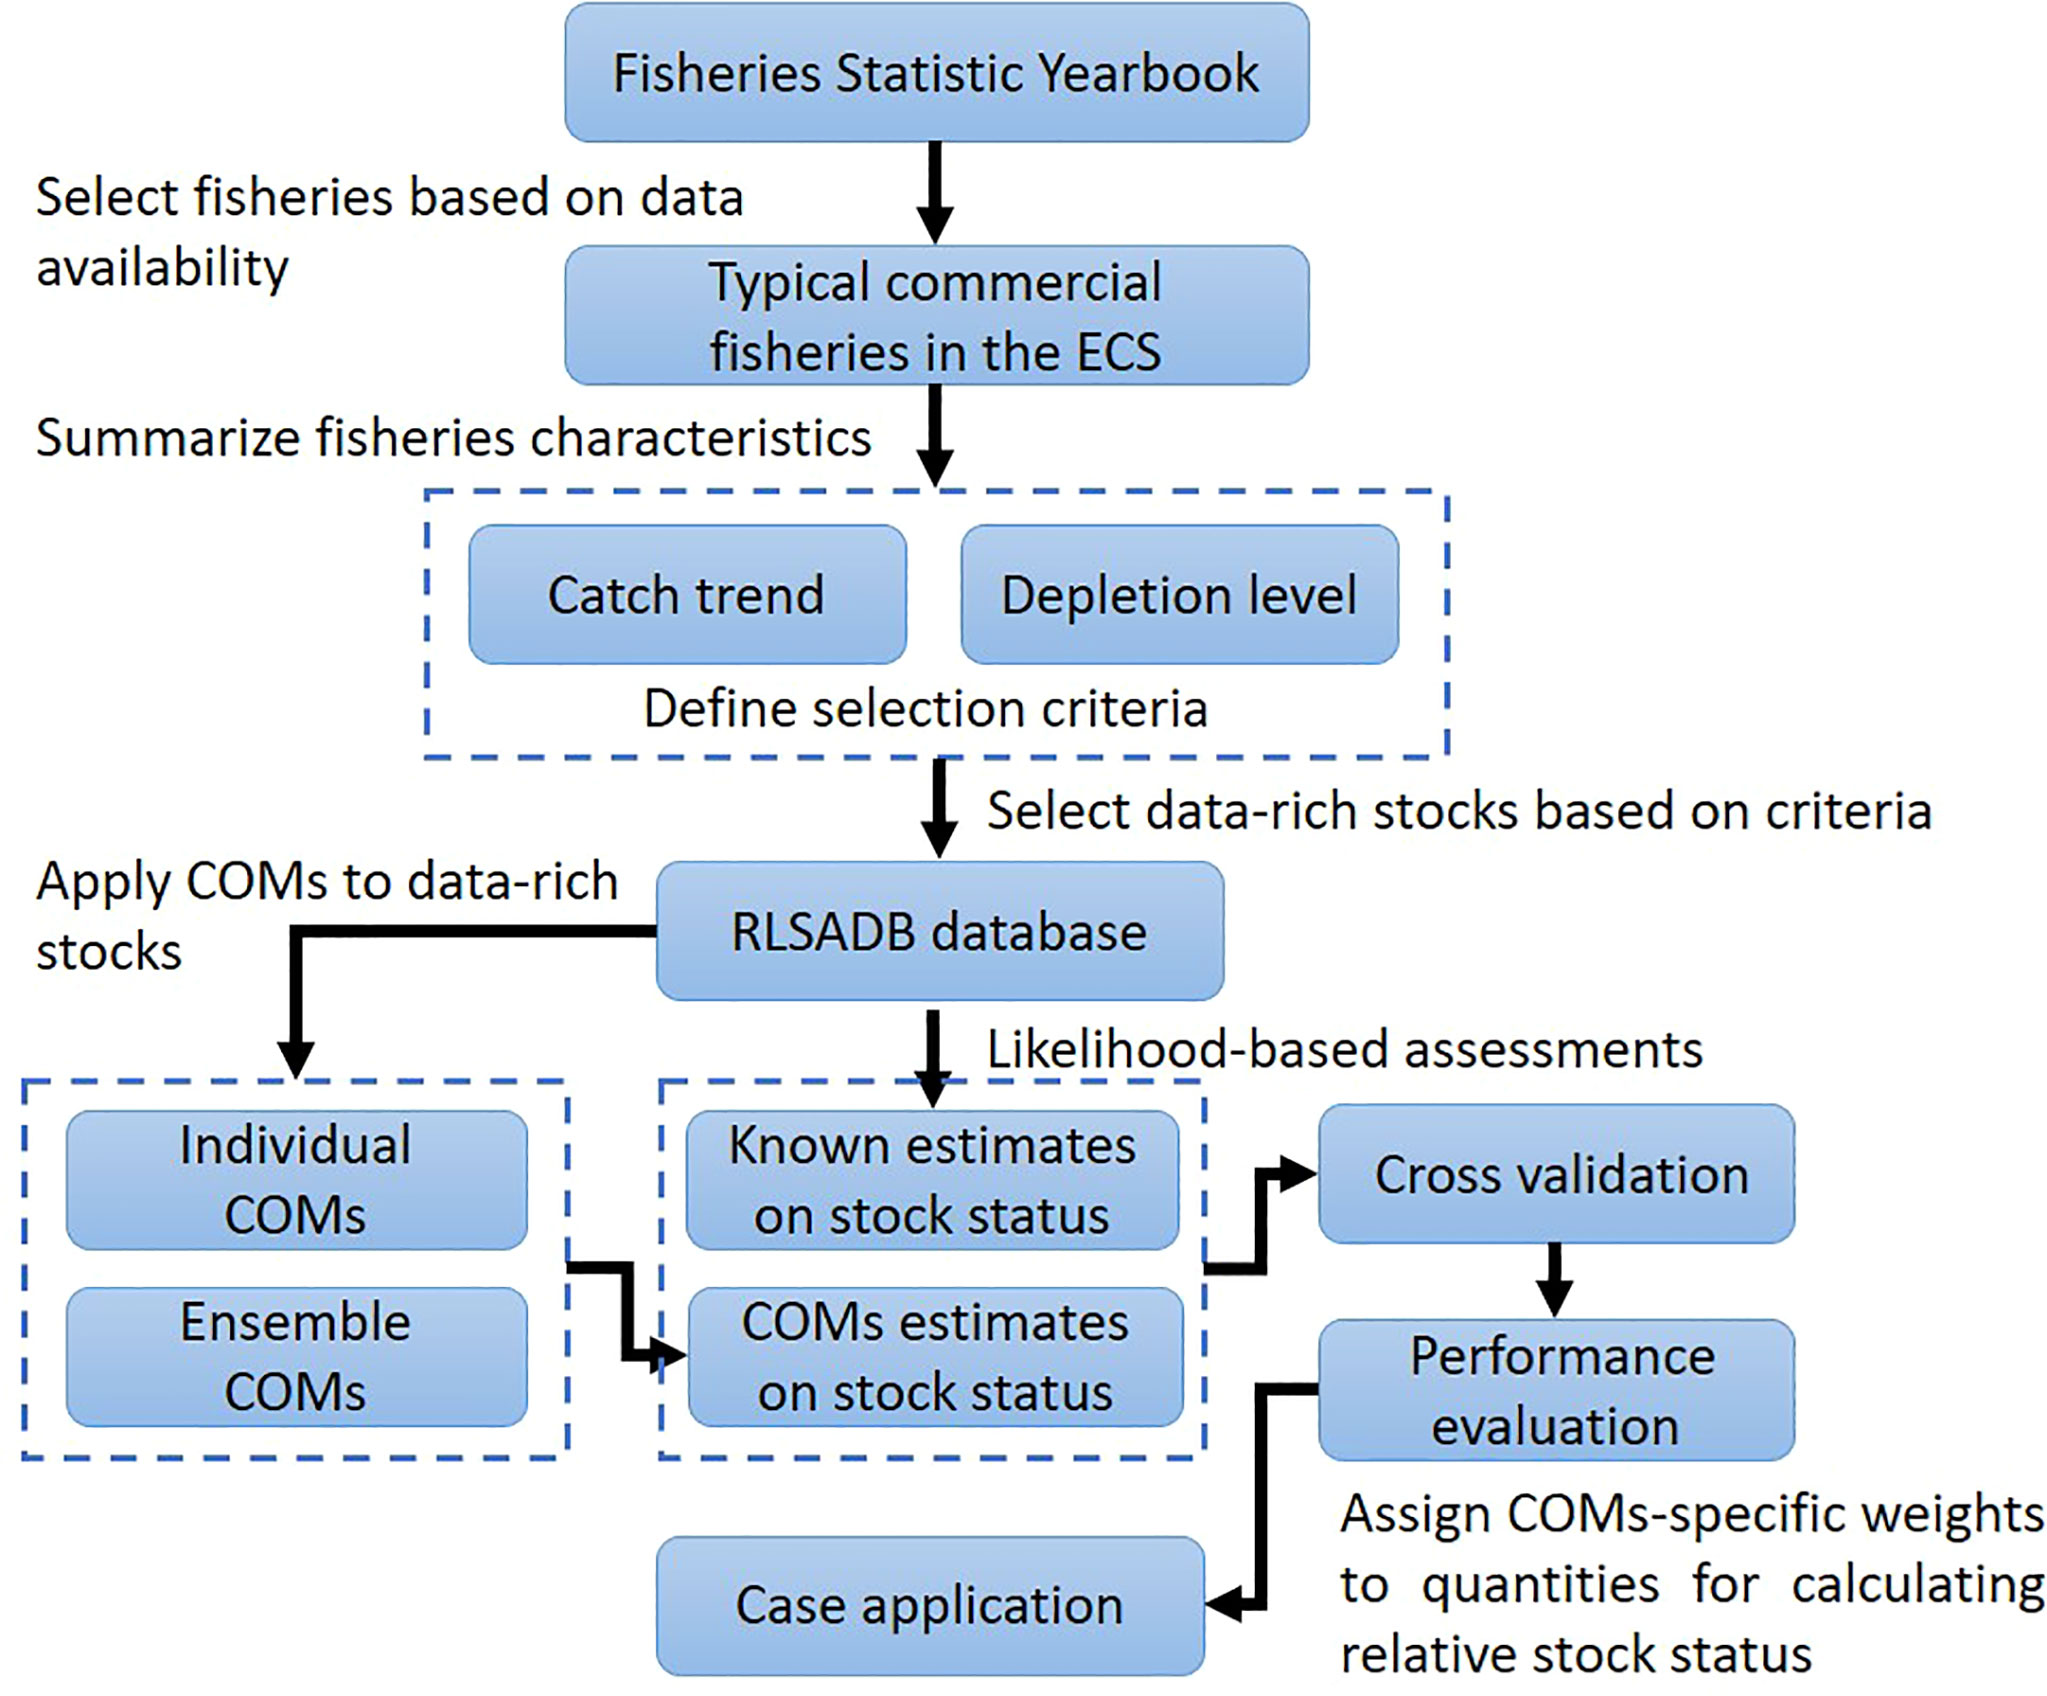
Figure 1 Flowchart for evaluating the performance of COMs based on an empirical approach.
Fisheries in the ECS
We compiled government statistics of catch data in the ECS from Fisheries Statistic Yearbook during the period 1985 to 2020 (MOA, 1986-2021). The ECS is the most productive of China’s waters, producing ~40% of total catch in 2020. The fisheries management in the ECS consists of input controls, such as gear restrictions as well as seasonal and spatial closures (Cao et al., 2017; Szuwalski et al., 2017; Su et al., 2019). During the past few decades, despite managed by relatively simple rules, the catch of many commercial fisheries in the ECS showed a general increasing trend and have been maintained at high catch levels for a long period, with a slightly decreasing trend in more recent years (Figure 2; See also, Figure 1 in Szuwalski et al., 2017).
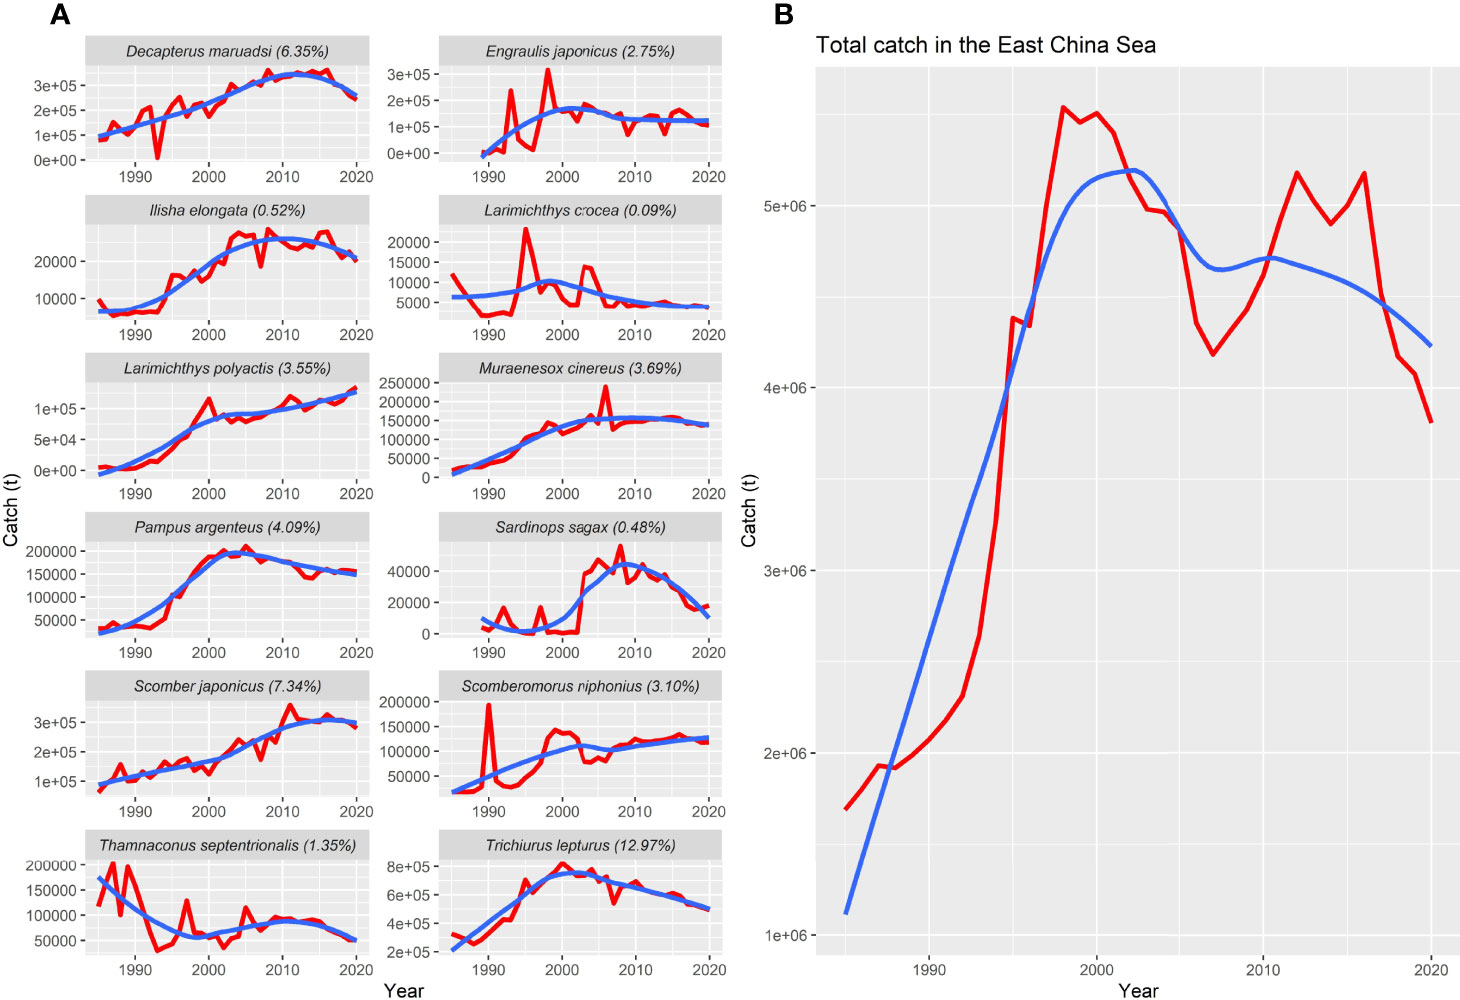
Figure 2 Catch trends of main commercial species (A) and the total catch (B) in the ECS during 1985-2020. The starting years of catch time series differ due to data availability of species. The value in percentage in brackets denotes catch proportion of total. The red and blue lines are reported catch and loess smoothing curves, respectively.
The catch trend and depletion level are crucial factors characterizing the stock condition (Zhou et al., 2017; Zhou et al., 2018). We selected 21 typical commercially important species in the ECS (Supplementary Table 1) and used catch-only boosted regression trees (Zhou et al., 2017; See Supplementary Material for model introduction) to calculate their current depletion level (defined as the ratio of the biomass in the terminal year to carrying capacity: B/K). Based on observations of catch trends and depletion levels for these data-limited fisheries in the ECS, data-rich stocks with similar characteristics in RLSADB were chosen.
Selection of Data-Rich Stocks in RLSADB
According to catch trend and depletion level of fisheries in the ECS, we defined the following criteria to select data-rich stocks from RLSADB: (i) the historical catch generally increased over time, and the average catch of 10 years after the historical maximum catch year is greater than 70% of that highest catch, and (ii) the current depletion level (defined as the ratio of biomass in the terminal year to virgin biomass, B/B0 or SSB/SSB0) of stocks had similar level as fisheries in the ECS, which would not greater than 0.8.
After careful evaluation, 23 fish stocks in RLSADB were selected based on our pre-defined criteria (Table 1; Figure 3). We defined the stocks which have sufficient data to support likelihood-based stock assessment models as being “data-rich”, including those have a time series of total catch and at least one time series of biomass index. The stock status of selected stocks was assessed with six frequently-used and likelihood-based stock assessment models. The comparison of frequency distribution of current depletion between stocks from ESC and RLSADB was shown in Figure 4. The mean value for both depletion distributions was around 0.4 with the mode in ESC being above its mean, whereas for the RLSADB the model was lower than the mean. Despite the dissimilarity of frequency distribution of current depletions between two data sets, we believed this would not affect study results.
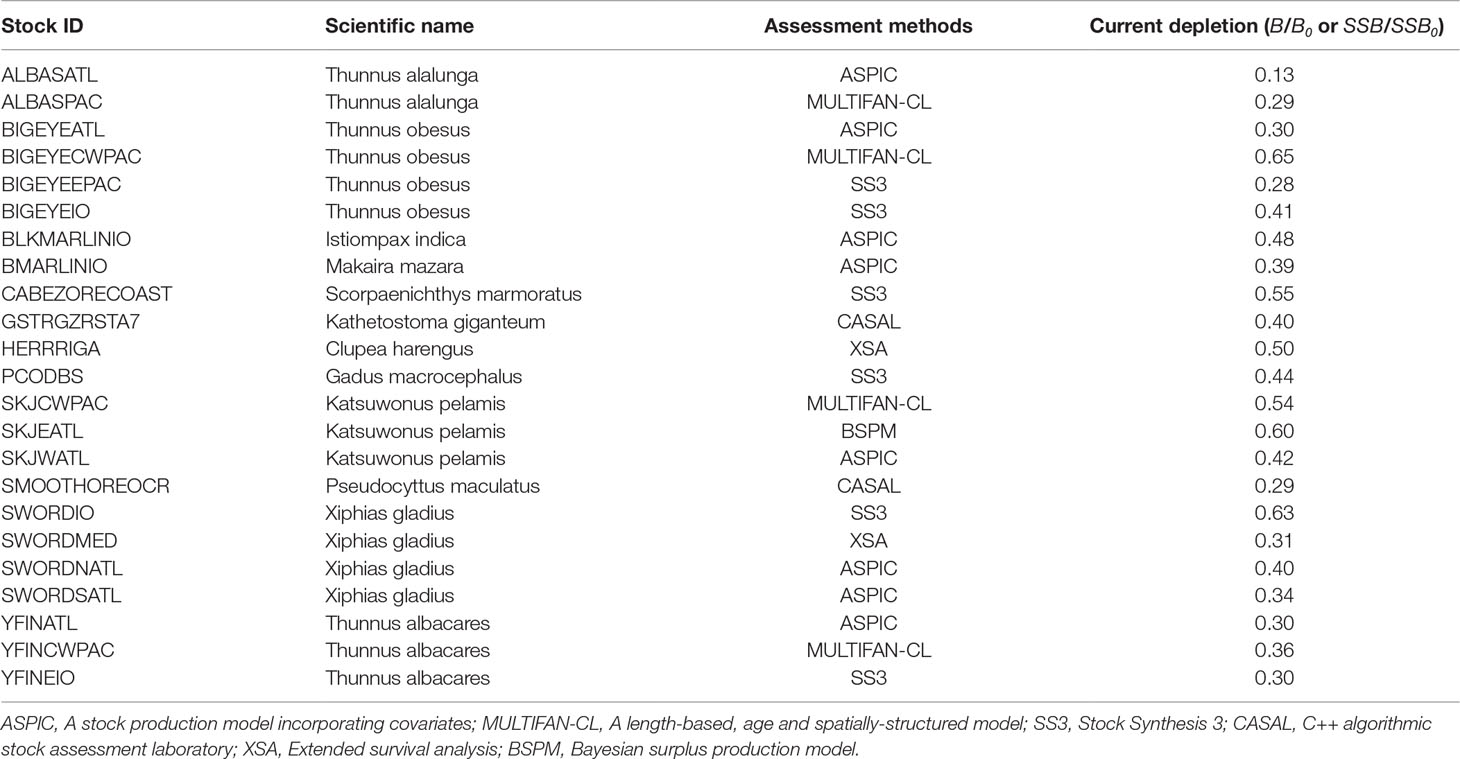
Table 1 The selected 23 fish stocks assessed by formal fisheries stock assessment methodologies from RLSADB v4.495.
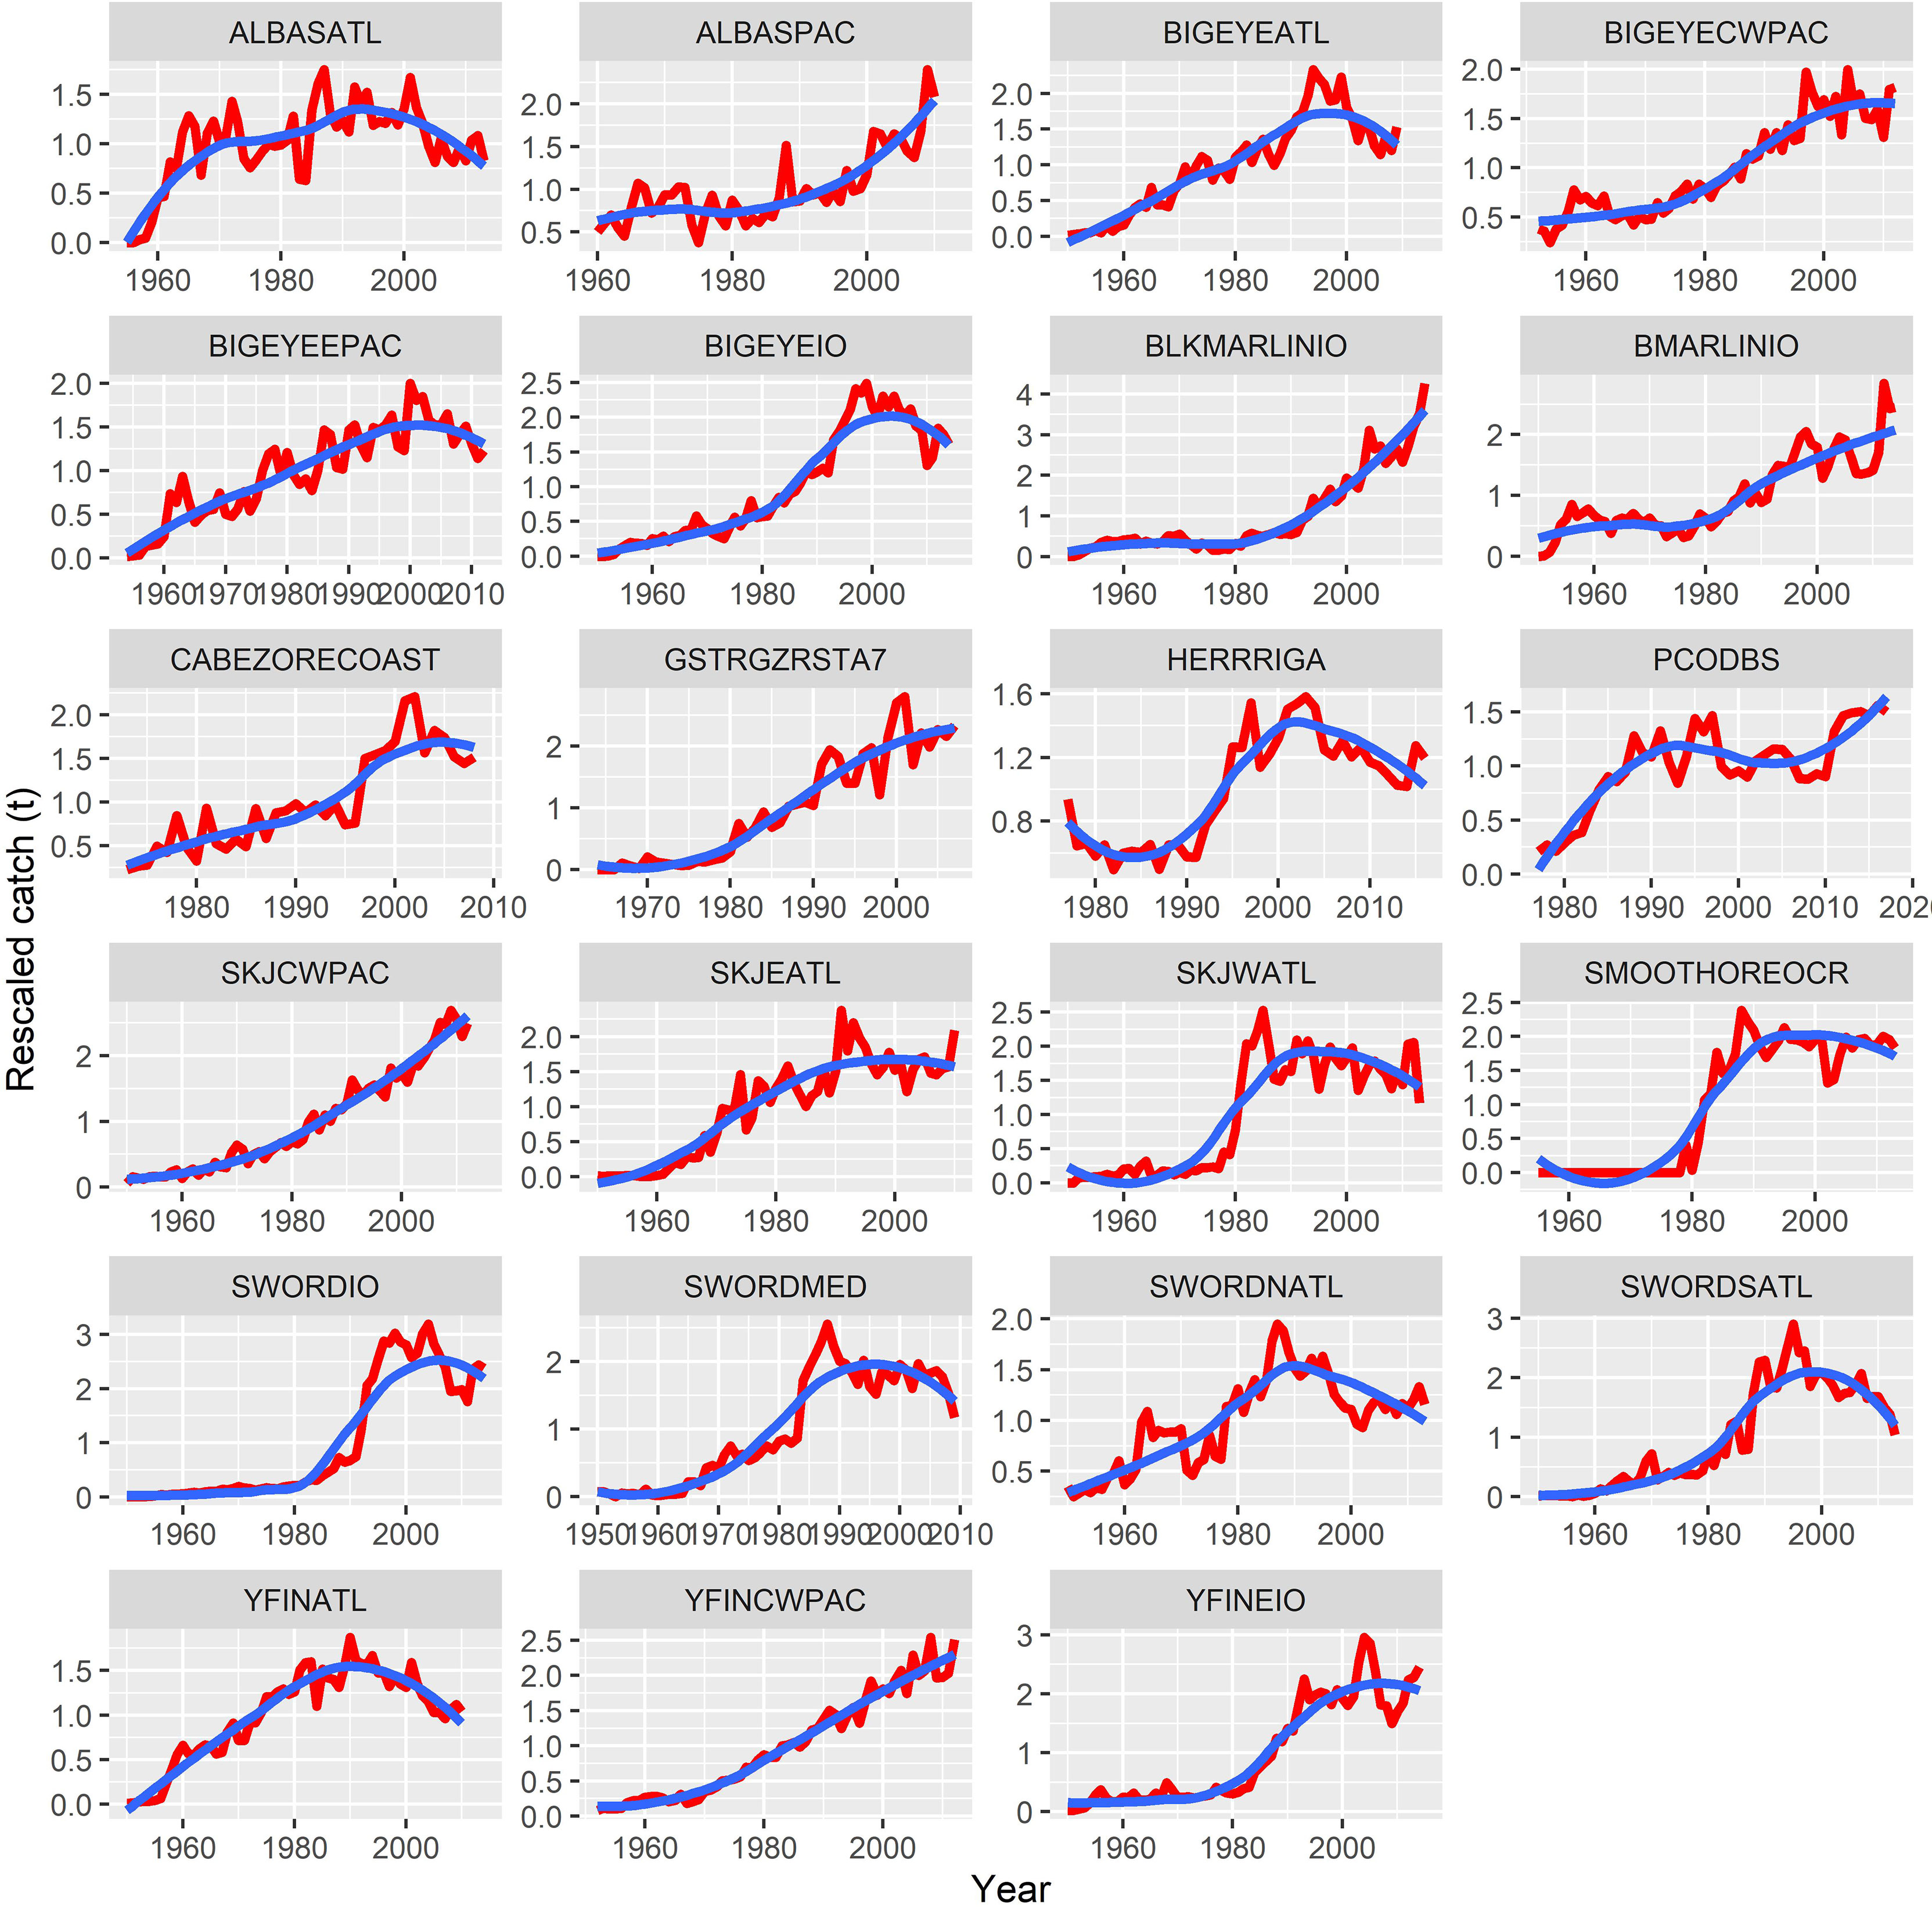
Figure 3 Catch trends of selected stocks in RLSADB. The header of each panel is the stock ID in RLSADB, see Table 1 for detailed stock information. The red and blue lines are rescaled catch and loess smoothing curves, respectively.
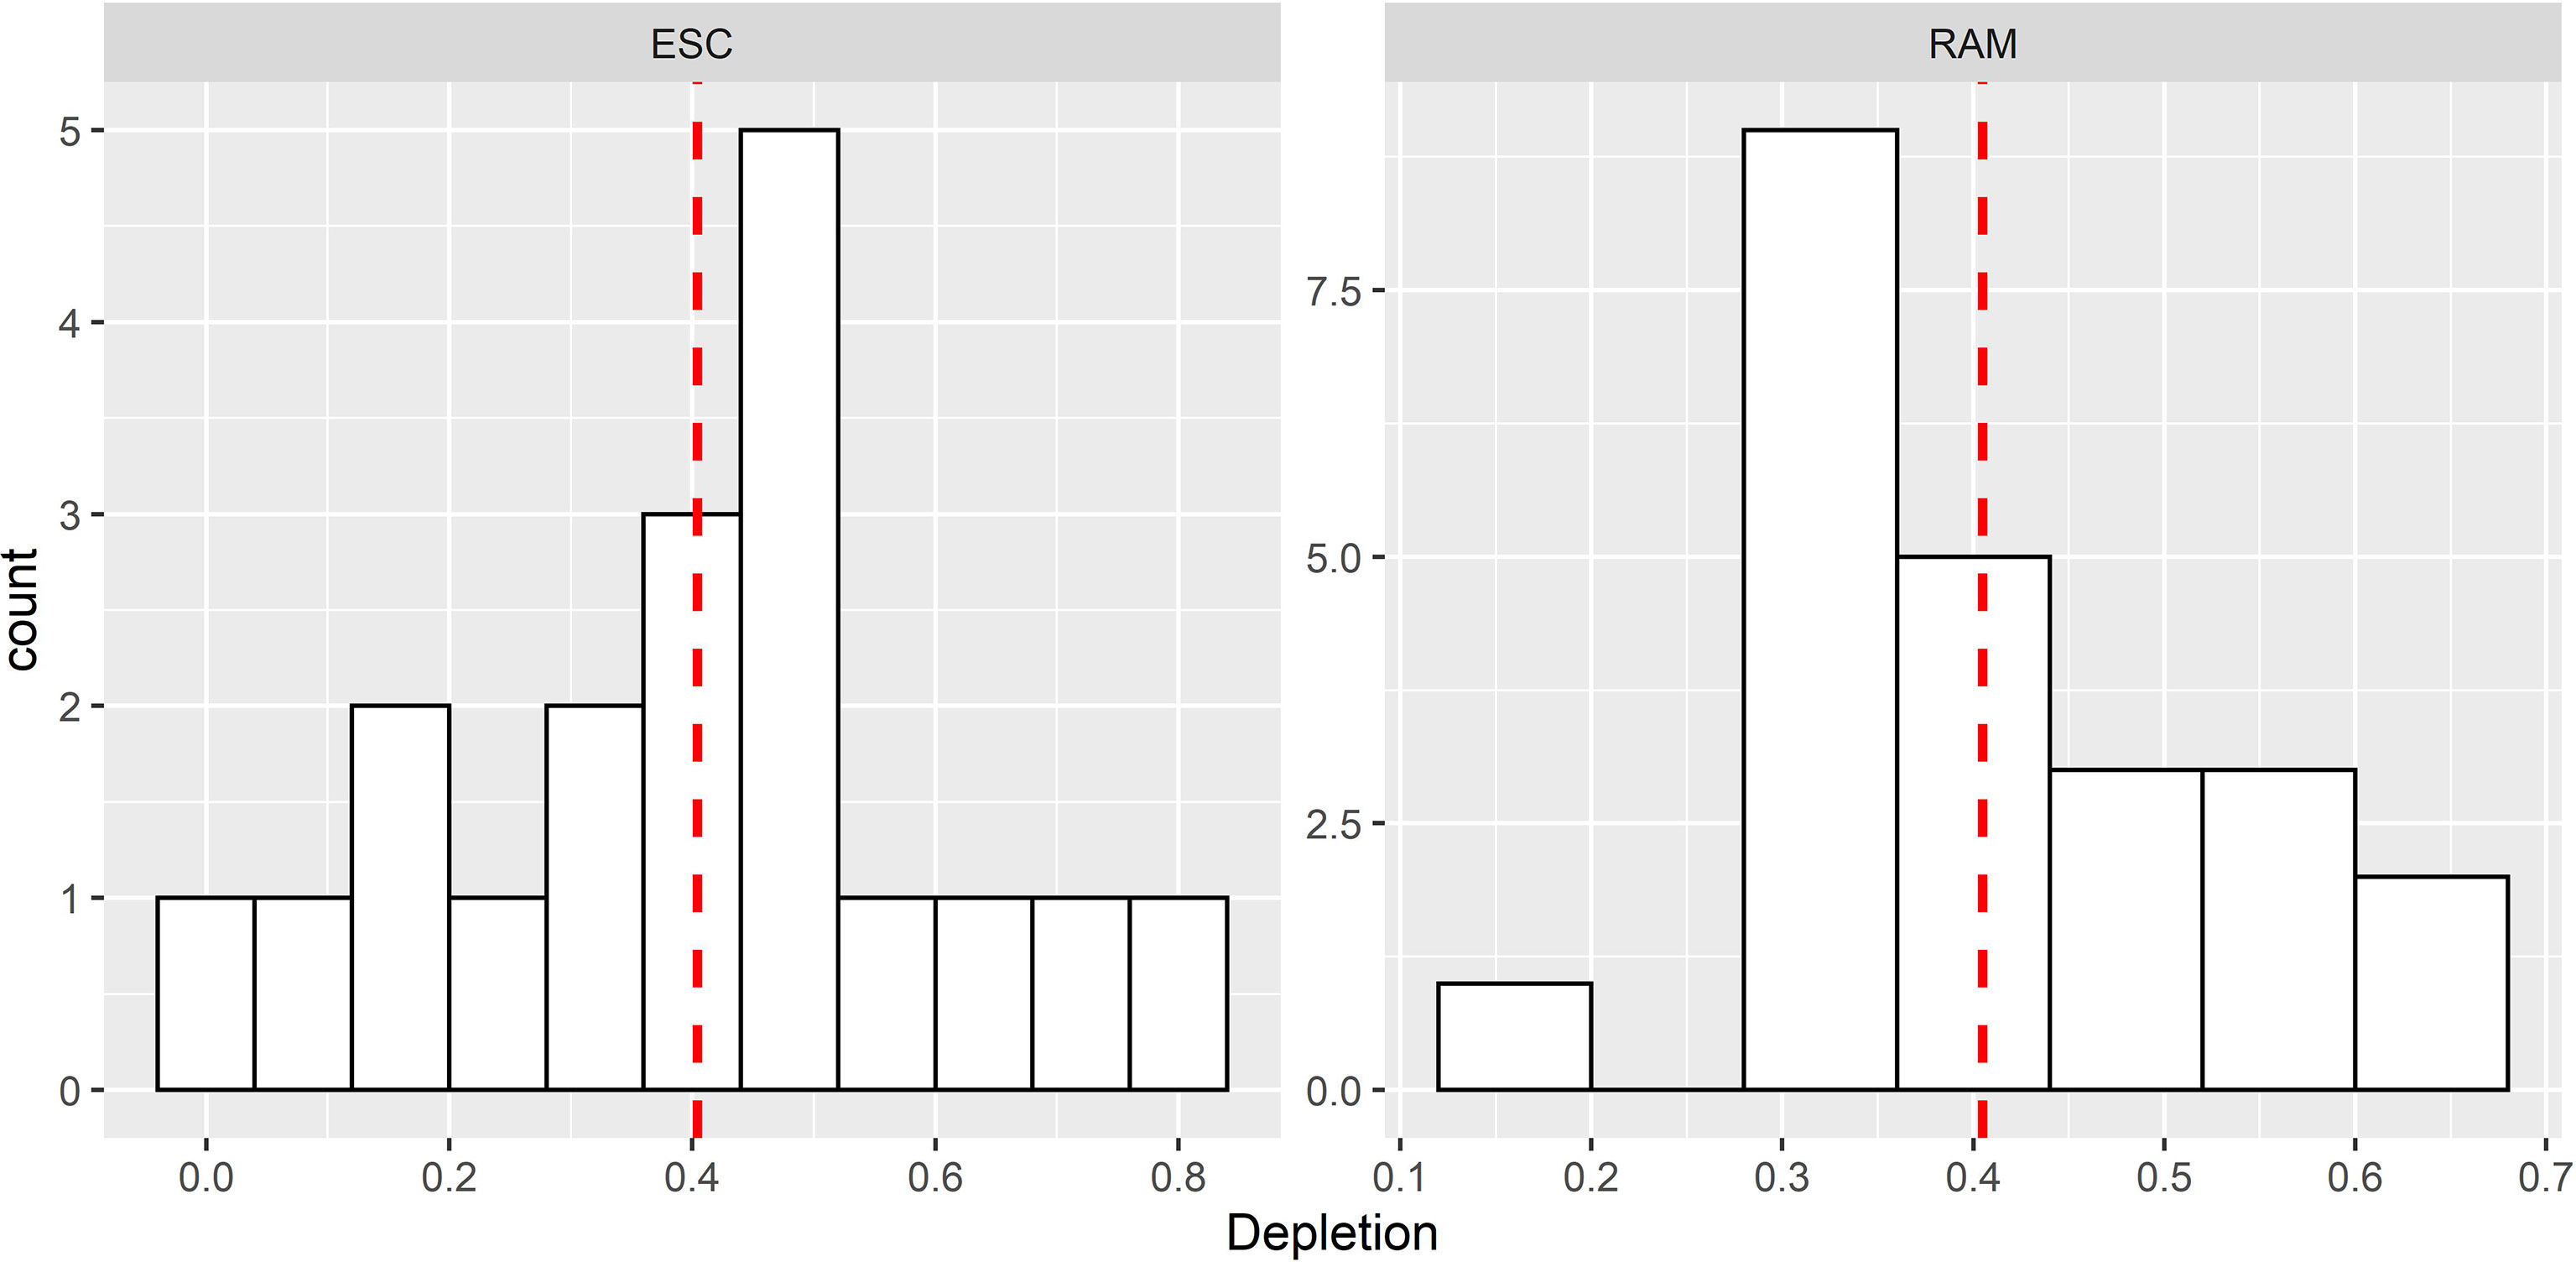
Figure 4 Histograms of current depletion for 19 typical commercial fisheries in the ECS (left) and 23 selected data-rich stocks in RLSADB (right). The dashed line denotes the mean value.
Assessment Models
Modern COMs consist of mechanistic approaches, empirical approaches, and ensemble approaches (Free et al., 2020). Of them, mechanistic COMs fit population (and effort) dynamics models to the catch data and make prior assumptions regarding parameters such as depletion to make up for the lack of other data. Empirical approaches use information from assessed data-rich stocks to establish relationships between stock statuses and catch data, and predict stock status for unassessed data-limited fisheries based on those relationships. Ensemble approaches, which take the average or weighted average of multiple individual methods, usually provide more accurate and less biased estimates by combining the strengths of individual methods through calibration via a statistical model such as a linear model or machine learning methods (Anderson et al., 2017; Free et al., 2020).
In this study, we considered a suite of commonly used and tested COMs including four mechanistic approaches, two empirical approaches and two ensemble approaches to comprehensively evaluate the performance of diverse COMs in estimating stock status for the data-rich stocks selected from RLSADB. The two empirical COMs that were used included modified panel regression model (mPRM; Costello et al., 2012) and catch-only boosted regression trees (zBRT; Zhou et al., 2017). The four mechanistic approaches were Catch-MSY (Martell and Froese, 2013), CMSY (Froese et al., 2017), state-space catch-only model (SSCOM; Thorson et al., 2013) and optimized catch-only model (OCOM; Zhou et al., 2018). The two ensemble approaches were linear model (LM) and random forest (RF), representing different levels of model complexity. A brief introduction of each individual COMs was provided in Supplementary Material. All individual COMs were implemented by using the “datalimited” (Anderson et al., 2016) and “datalimited2” (Free, 2018) packages, and RF was built by using the “randomForest” package (Liaw and Wiener, 2002) with the default argument values in the base R environment (R Core Team, 2020).
Each of the individual COMs returned a time series of stock biomass status (B/BMSY, stock biomass relative to stock biomass that produces maximum sustainable yield). We focused on two quantities: the mean and slope of B/BMSY in the last 5 years, indicating the recent state and trend of stock status (Anderson et al., 2017). The mean or slope of B/BMSY were used as response variables and the predictions from the individual COMs as predictor variables in ensemble approaches. Due to very limited sample sizes, interaction of predictors would not be considered in our analysis. A stepwise procedure was employed to generate the best fitting LM by minimizing the Akaike’s Information Criterion (AIC; Akaike, 1998).
Model Validation
Cross-validation was employed to estimate the model performance of COMs by comparing their estimates with known values from formal stock assessments in RLSADB. In each replicate of cross-validation, the entire data set was randomly split into three folds. Ensemble approaches were built on two-thirds of the data (training data set) and assessed predictive performance on the remaining third (testing data set). For comparison purpose, individual COMs were also applied to testing dataset. The known stock biomass status of selected RLSADB stocks estimated by formal stock assessments were deemed as “true” values and were compared with estimates of COMs. The detailed procedure of one replicate was shown in Supplementary Material. This procedure was repeated 50 times to account for bias that may result from any replicate, and the evaluation was averaged over all runs. Median relative error (MRE) and median absolute relative error (MARE) were selected as performance metrics to measure the bias and precision of COMs in predicting mean and slope of B/BMSY. MRE was defined as:
and MARE was calculated as:
where is the estimated B/BMSY from ensemble COMs built on training data set and estimated B/BMSYfrom individual COMs applied to testing data set, and θ is the known B/BMSY of the testing data from RLSADB.
Case Application
We applied all COMs to 12 commercially important species in the ECS (Figure 2A) as an illustration to show trajectories of stock status from diverse approaches. The other 9 species were not considered here due to their short catch time series and catch statistic issues (See Supplementary Table 1 for detail information). The prior range of key parameters such as stock depletion was generated by the default rule of each method. The input resilience r and natural mortality M were obtained from FishBase (Froese and Pauly, 2022) and “FishLife” package in R (Thorson et al., 2017), respectively.
Apart from B/BMSY, three mechanistic COMs (Catch-MSY, CMSY, and OCOM) also returned a times series of F/FMSY. In order to demonstrate the time trajectory of stock status relative to BMSY and FMSY, Kobe plots were constructed by using weighted means of B, BMSY, F, and FMSY. We used the approach by van Gemert et al. (2022) to assign COM-specific weights for these quantities. Firstly, the relative error of each method’s estimate of mean B/BMSY over the last 5 years was calculated by comparing with the mean of the ensemble estimates. The relative error, RE, of the ith COM was calculated as:
where Si is the estimate of mean B/BMSY over the last 5 years from the ith COM, Sμ is the estimate of mean B/BMSY over the last 5 years from the mean of the ensemble estimates. Next, the weight w of the ith COM was calculated as:
Thus, a larger estimation error from a COM would lead to a small weight. Subsequently, weights were scaled to make the sum of weights from all COMs equal to 1:
The scaled weight was then used to calculated weighted means of B, BMSY, F and FMSY for each of the COMs that estimated these quantities.
Results
The cross-validation results showed that the ensemble approaches outperformed the individual COMs, giving a more accurate and unbiased estimate of mean B/BMSY over the last 5 years (Figure 5). Mechanistic COMs (SSCOM, CMSY and Catch-MSY) produced the most biased and imprecise estimates of mean B/BMSY compared with other methods. However, mechanistic COMs (OCOM, CMSY and Catch-MSY) performed better than ensemble approaches and empirical COMs in predicting the recent trend of stock status. In addition, all model estimates on the slope of B/BMSY were negatively biased, and the magnitude of inaccuracy and bias of prediction on the slope was greater than the prediction on the mean.
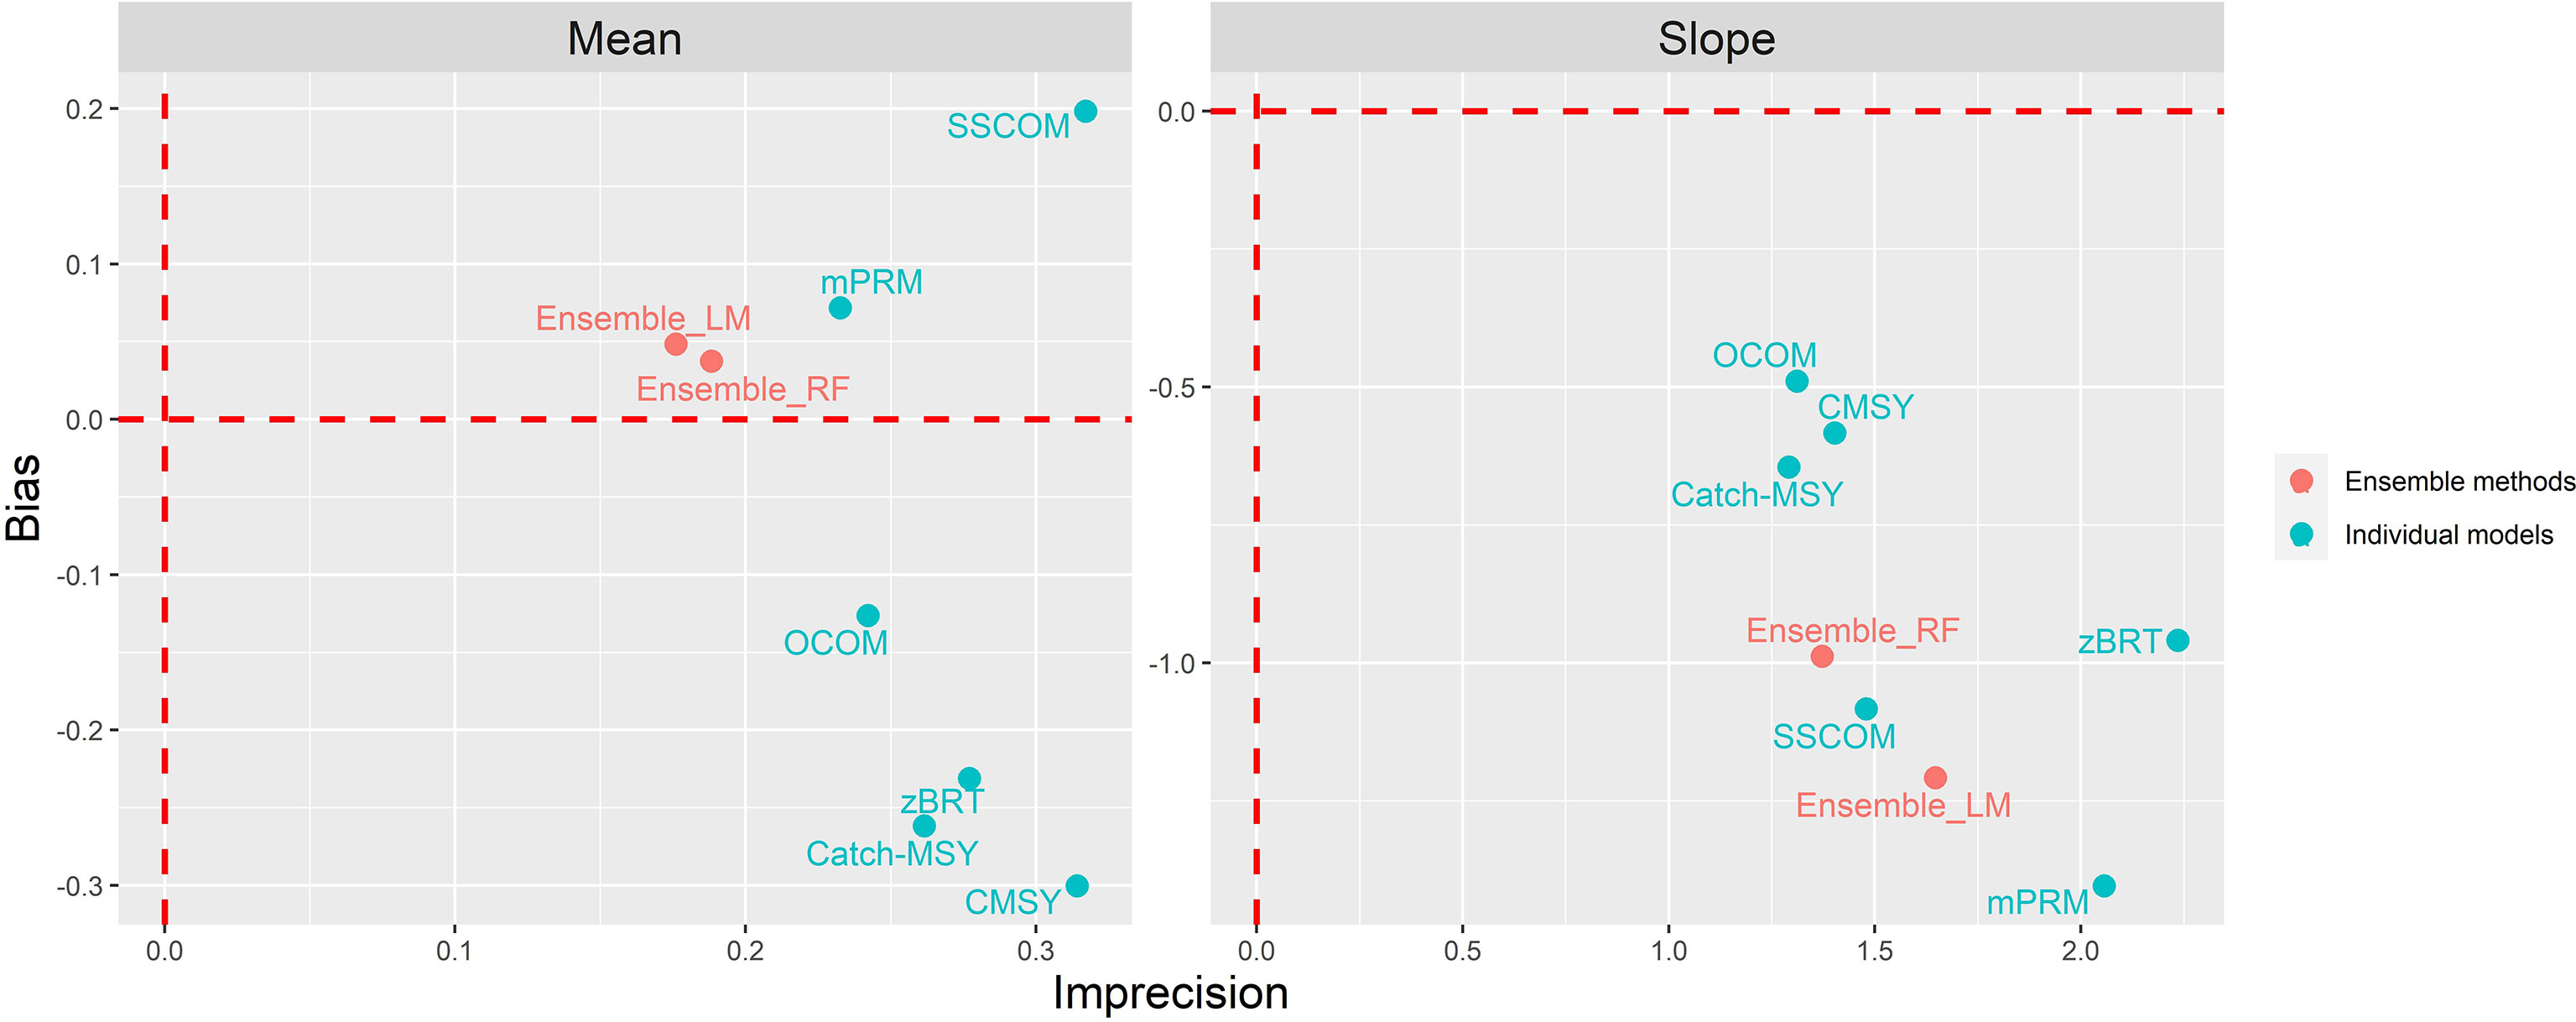
Figure 5 Bias and precision of COMs’ predictions from cross-validation. The cross of dashed red lines indicates the perfect performance (unbiased and precise) in predicting mean or slope of B/BMSY over the last 5 years.
The six individual COMs predicated diverse historical patterns in the B/BMSY trend of the commercial species in the ECS (Figure 6). Specifically, OCOM, CMSY and Catch-MSY showed similar estimation trends and revealed a smooth trajectory of B/BMSY. By contrast, mPRM, zBRT and SSCOM estimated a variable trajectory of B/BMSY among the most species. The estimation of B/BMSY time series from various individual COMs were highly contrasting for some species. For example, all methods demonstrated a declining trend of B/BMSY estimates before the middle of 1990s for T. septentrionalis, but they derived inconsistent estimations during the remaining period: OCOM, mPRM, CMSY and Catch-MSY predicted that B was consistently less than BMSY while prediction of B/BMSY from SSCOM and zBRT were more variable and greater than 1 in most years. For most species, the two ensemble approaches, LM and RF, estimated similar values for mean B/BMSY in the last 5 years and predicated negative slopes of recent B/BMSY (Figure 6; Table 2). However, they would also produce inverse estimations in terms of the trend of status (e.g., T. leptutus). The mean values of B/BMSY over the last 5 years estimated from ensemble approaches indicated that most commercial species in the ECS had not been overfished.
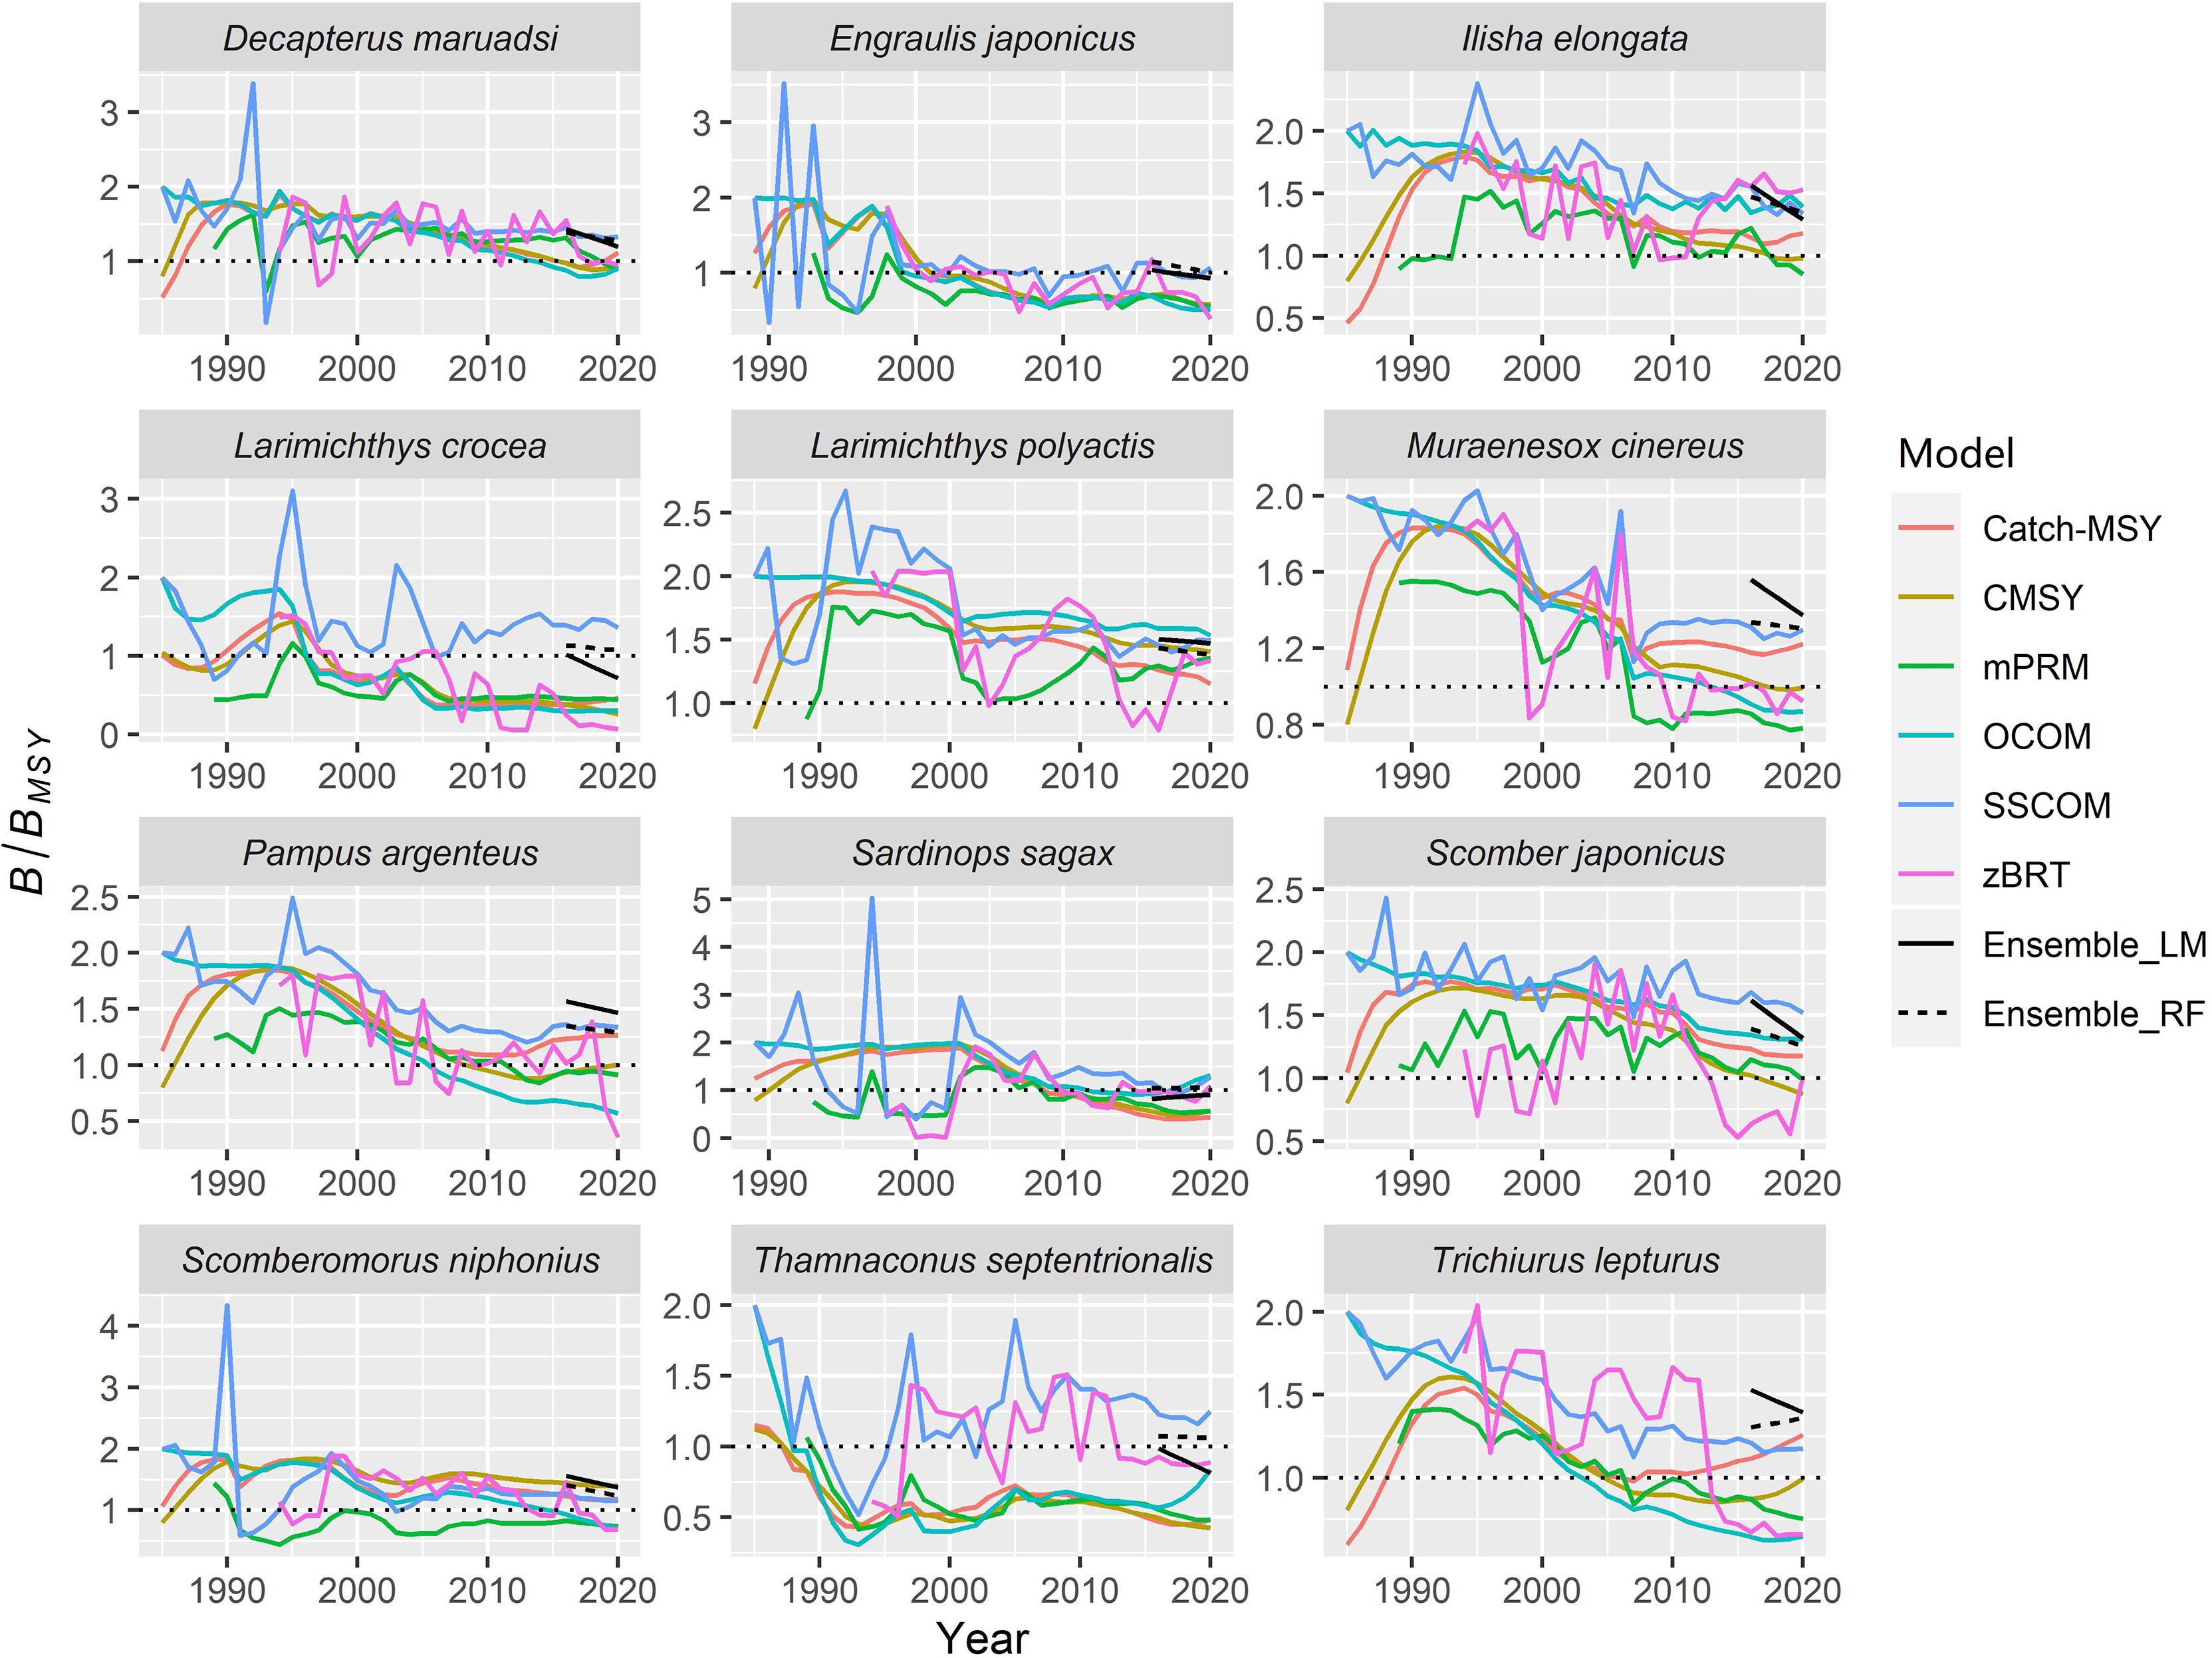
Figure 6 Time trajectories of B/BMSY estimates of individual and ensemble COMs for the stocks of ECS. The horizontal dotted line indicates B equals to BMSY.
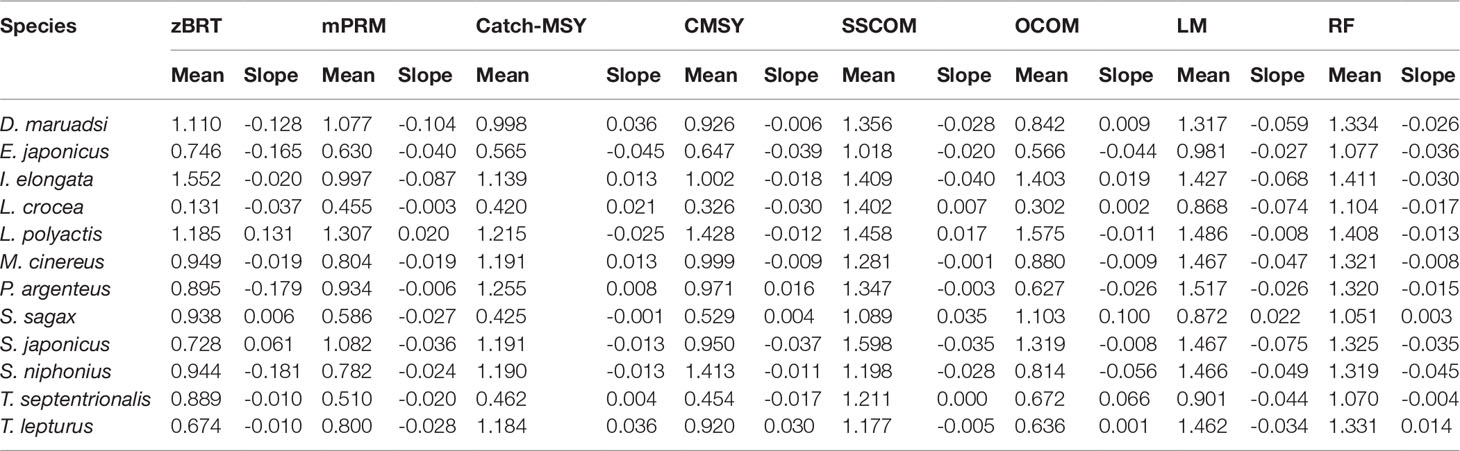
Table 2 Individual COMs and ensemble model estimates of the mean and slope of B/BMSY over the last 5 years of time series.
The highest weights in calculating time series of B and F as well as BMSY and FMSY among species were assigned by various methods (Table 3). For cases of I. elongata, L. polyactis and S. niphonius, individual model can account for over 80% weights of total in calculating weighted means of quantities. The three COMs assigned relatively even weights in calculating quantities for E. japonicus and L. crocea. The resulting weighted means of quantities were visualized as a Kobe plot to indicate the time trajectory of stock status for commercial species in the ECS (Figure 7).
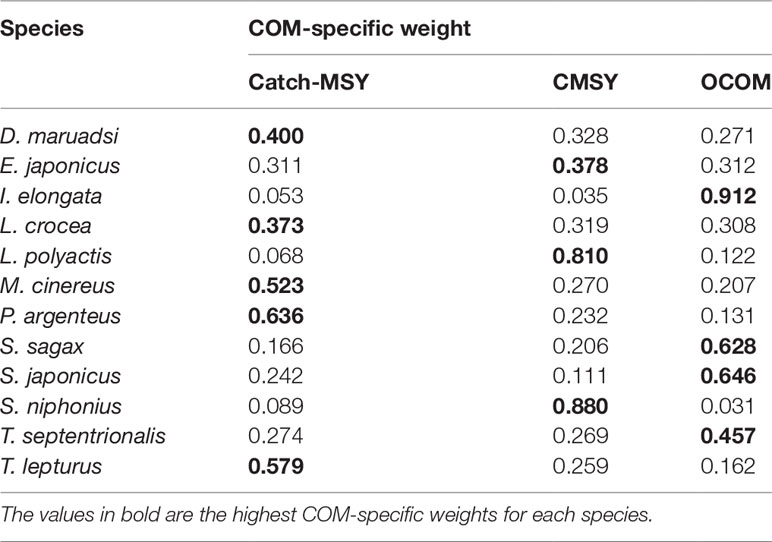
Table 3 Catch-only methods and their weight in calculating weighted means of B and F time series, as well as reference points BMSY and FMSY, for the fisheries in the ECS.
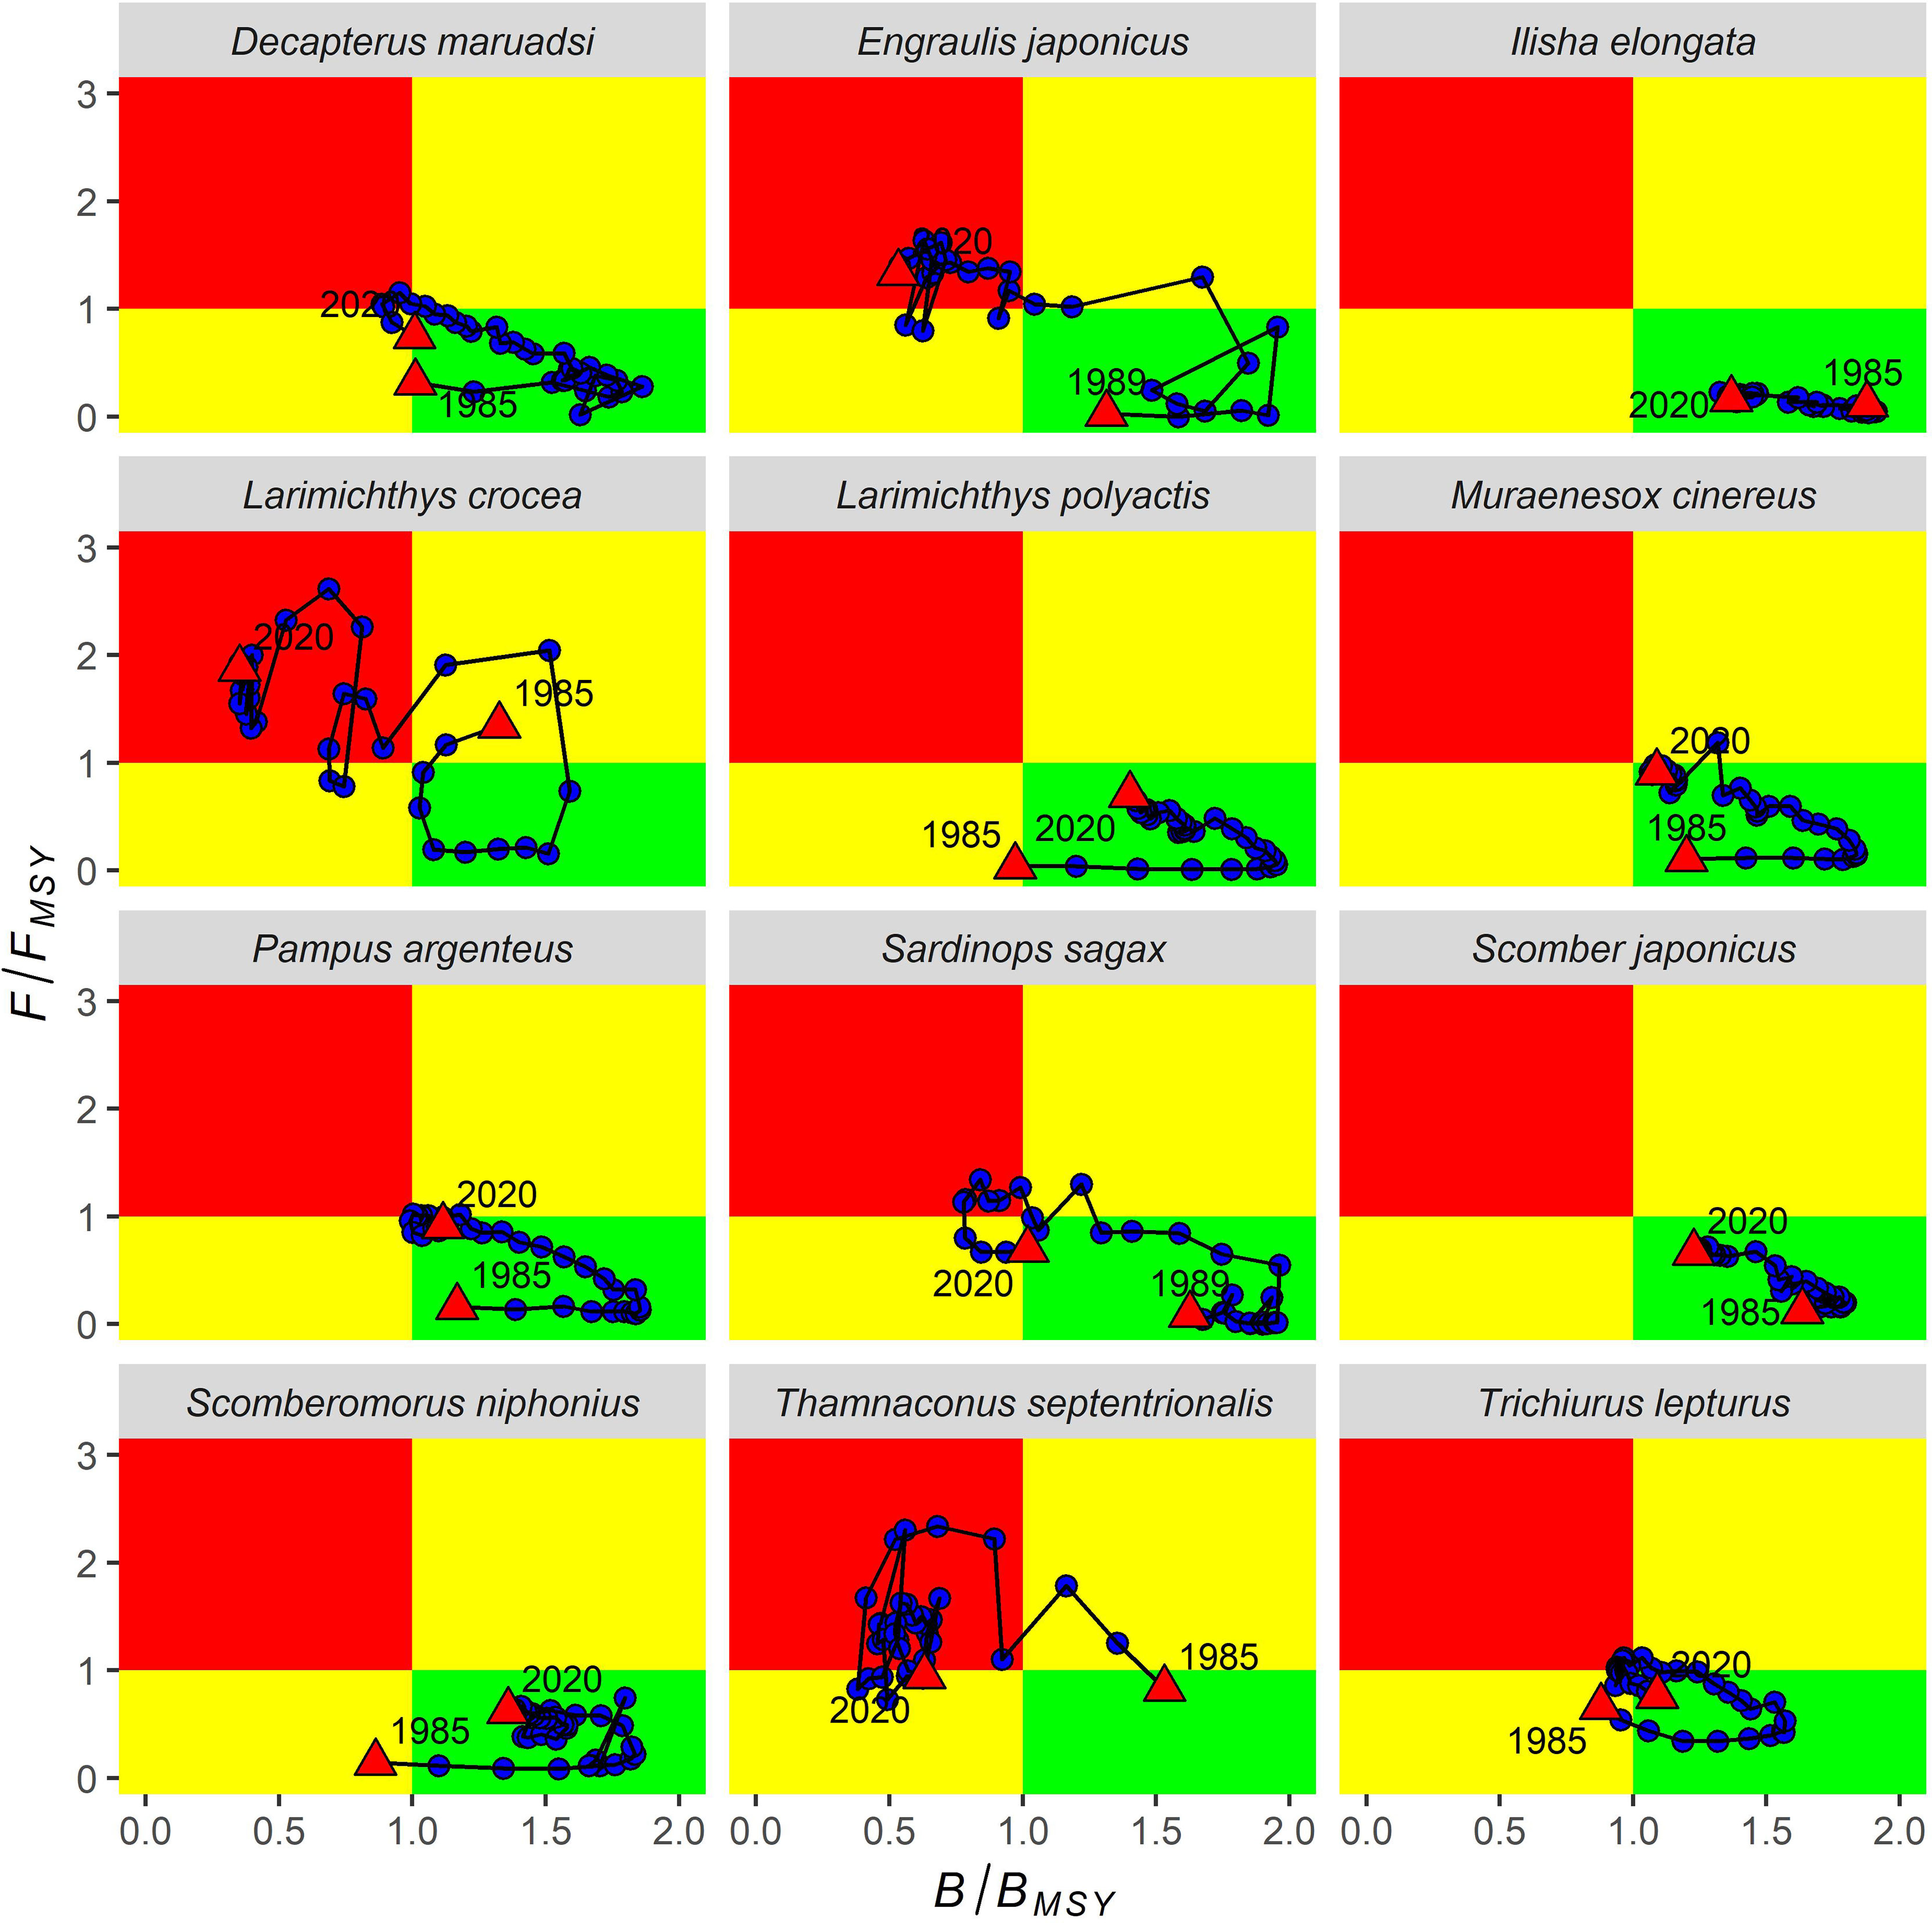
Figure 7 Kobe plot showing the stock status of the stocks of ECS from 1985 to 2020, calculating by the weighted quantities (B, BMSY, F, and FMSY). The green quadrant indicates healthy stock status, the yellow quadrants indicate the stock is either overfished (B/BMSY<1) or subject to overfishing (F/FMSY>1). The red quadrant indicates the stock is both overfished and subject to overfishing.
The Kobe plots indicated that, compared to the status in initial years, the current status of all species was subject to either lower relative biomass, higher relative fishing mortality, or both. For most species, the stock status was consistently located in green quadrants during most years, but time trajectories showed that the status of stocks tended to move to yellow or red quadrants. The current status of stocks, including E. japonicus, L. crocea, T. septentrionalis, was subject overfishing, was overfished, or both. Species such as D. maruadsi, S. sagax, and T. lepturus once were overfished or had an overfishing state, but revealed recovery trends in the most recent years. The trends of stock status during recent years among species were similar to estimation from ensemble approaches (Figure 6).
Discussion
There is an increasing interest in assessing heavily exploited stocks and fisheries management reform in China Seas (Cao et al., 2017; Pauly et al., 2021). China launched its pilot projects of implementing output control systems to set catch limits for coastal fisheries in 2017 (Huang and He, 2019). Accordingly, data-limited methods have tremendous potential to be used in estimating fishery status and setting scientific catch limits, such as total allowable catch, for commercial fisheries in China Seas. For example, Guan et al. (2020) improved stock reduction analysis with sporadic stock index information which could be collected from historical and recent fishery-independent surveys in China. Our study provides another way to apply and validate COMs for data-limited fisheries in China Seas and stock reduction analysis such as Catch-MSY and CMSY could provide MSY-based reference points which could be used to inform fisheries management.
Most data-limited methods which were employed to infer the status of fish populations in China Seas are catch-based or length-based (e.g., Zhang et al., 2018; Zhai et al., 2020; Han et al., 2021; Liao et al., 2021; Pauly et al., 2021; Zhang et al., 2021). However, either catch-based or length-based methods often produce contrasting estimates of stock status when using different models (Anderson et al., 2017; Pons et al., 2020; van Gemert et al., 2022), which is hard to objectively inform fisheries management. Ensemble approaches are able to provide more accurate and unbiased estimates than individual models on population statuses and trends (Anderson et al., 2017; Free et al., 2020; Han et al., 2021), which can assist fisheries managers in reconciling conflicting estimates from diverse approaches. In this study, we established an empirical approach to validate the performance of a suite of COMs in predicting stock biomass status from RLSADB data-rich stocks with similar characteristics to data-limited fisheries in the ECS. The cross-validation results confirm that ensemble approaches performed better than the individual COMs of estimating the mean of B/BMSY (status) over the last 5 years, which supports our method to assign COM-specific weights by comparing with the mean estimates of ensemble approaches. However, the results were dissimilar when predicting the slope of B/BMSY (trend): compared with ensemble approaches, most mechanistic COMs showed less bias. This inconsistent performance is different from previous studies in which ensemble methods were consistently the best or among the best when predicting both status and trend (Anderson et al., 2017; van Gemert et al., 2022). It is also noted that there was greater inaccuracy of the models in estimating the slope compared to the mean of B/BMSY over the last 5 years in this and the study by van Gemert et al. (2022), while Anderson et al. (2017) showed opposing conclusions. Therefore, the COMs testing results may be different among fisheries. We illustrated that ensemble approaches could provide accurate and precise estimates on the recent status of selected fisheries from RLSADB which have similar catch trends and depletion levels to those in the ECS. But it should be recognized that we compared individual COMs with ensemble COMs by using slightly different measures in terms of definition due to “ensemble” nature of ensemble COMs in cross-validation process (see Supplementary Material for detail procedures of cross-validation). This may have some effects on the conclusions derived from Figure 5. Nevertheless, we believe such a validation approach is the best available option for comparison purposes and it has also been adopted by previous studies (e.g., Anderson et al., 2017; van Gemert et al., 2022).
Although only a few of fisheries in the ECS has been assessed by formal statistical stock assessments, most of them were believed to have been fully exploited or overexploited for a long period based on observed changes in key life history parameters such as reduced maximum sizes, increased growth rates, and earlier age at maturity, and evidences on fishing down the food web of ecosystems (Cao et al., 2017; Szuwalski et al., 2017; Lee et al., 2020). Our assessment results, however, gave more optimistic estimates of stock status for most commercial fisheries in the ECS. According to our assessment, a majority of species were in healthy states during most years according to their Kobe plots (Figure 7), which were not consistent with actual biological observations and conclusions from some other studies. For instance, the stock status of L. polyactis was estimated to be in the green quadrant of its Kobe plot (neither overfished nor overfishing occurred) across all years except for the initial year. Previous assessments using Bayesian state-space surplus production models indicated that L. polyactis was overfished and overfishing occurred since the 1980s (Ma et al., 2020), the conclusion of overfishing was also supported by recent per-recruit analysis (Zhu et al., 2021). Apart from L. polyactis, three other stocks (S. japonicus, S. niphonius, and T. lepturus) were also previously assessed by surplus production models (Li et al., 2010; Zhang and Chen, 2015; Sui et al., 2021). Li et al. (2010) estimated that the biomass of S. japonicus in 2006 (B2006) was 451 thousand tons which was less than BMSY (804 thousand tons), and fishing mortality in 2006, F2006 (0.54), was greater than FMSY (0.37). By comparison, our estimates on stock status of S. japonicus in 2006 is more optimistic, which showed B2006/BMSY=1.58 and F2006/FMSY=0.41. However, although the trajectories of stock status estimated from our study and previous assessments on S. niphonius and T. lepturus are quite similar, previous assessments are more optimistic than our study results in terms of stock status in final assessment years. Sui et al. (2021) estimated B2015/BMSY>1.5 and F2015/FMSY<0.5 for S. niphonius, while our estimates demonstrated that B2015/BMSY=1.43 and F2015/FMSY=0.62. Similarly, B2012/BMSY and F2012/FMSY was 0.94 and 1.01, respectively, based on our analysis, but assessment by Zhang and Chen (2015) derived that B2012/BMSY=1.22 and F2012/FMSY = 0.74 for T. lepturus. Therefore, although the stock status of fisheries in the ECS estimated from our study was optimistic for most species, some of them were found to be more conservative than previous assessments which were based on surplus production models. Additionally, it was noted that widespread concerns have been expressed about the reliability of stock status estimation based on COMs and actual poor status of stocks in areas such as Southeast Asia by local experts (Hilborn et al., 2020).
One possible explanation to our optimistic assessments for most ECS fisheries was the poor predictive ability of the three COMs (OCOM, Catch-MSY, and CMSY) used to quantify relative stock status, even though model-specific weights were assigned to them (Figure 5). Other potential causes included the difference of model structures and the usage of default priors generated by the COMs as well as catch overreporting issues in China’s official fisheries statistics. Previous studies verified that stock reduction analysis such as CMSY will show notable bias and sensitivity when run with the default priors generated by themselves (Free et al., 2020; Bouch et al., 2021; Ovando et al., 2021b; Sharma et al., 2021). As a promising way to make improvement on estimates of the state of fish populations, external information or local expertise was advocated to develop the biomass or fishing effort priors for COMs (Ovando et al., 2021a; Sharma et al., 2021). For example, the fishing fleet dynamics in China Seas were recently analyzed through information from Automatic Identification Systems (Zhang et al., 2022), which could be utilized to construct fishery-specific priors on fishing mortality rates for COMs with effort dynamics. Catch overreporting issues in China’s official fisheries statistics have been criticized and concerned in past two decades (e.g., Watson and Pauly, 2001; Pauly et al., 2014; Kang et al., 2018), which may also lead to our optimistic assessment results. One potential solution is to adjust misreported catch data and/or develop sensitivity analyses regarding possible ranges of actual catch based on best available information. For instance, FAO worked with China to revise downwards its fisheries capture statistics by about 10% for the period 1997-2005 (FAO, 2012).
RLSADB summarized hundreds of formal stock assessments around the world and have been widely used to conduct empirical validation for COMs (Anderson et al., 2017; Free et al., 2020; Guan et al., 2020; Ovando et al., 2021b). In this study, only 23 fish stocks from RLSADB were found to satisfy our pre-defined criteria regarding catch trends and depletion levels. Most of the selected data-rich stocks were pelagic tuna and tuna-like species, which did not cover a broad range of life histories (Table 1). However, life history characteristics or the choices of priors on it can affect the performance of COMs (Guan et al., 2020; Pons et al., 2020; Ovando et al., 2021b). In future analyses, hypothetical stocks or fisheries generated by large simulation experiments (e.g., Rosenberg et al., 2014) could be utilized for empirical validation for the COMs applied to the fisheries of ECS across various life histories, fishing regimes, depletion levels, and other factors. The operating models used to simulate such hypothetical stocks should be customized or tuned according to the characteristics of the local system. For instance, non-stationary life history processes of small yellow croaker (L. polyactis) were considered into a simulation framework to evaluate the performance of a production model in estimating quantities often used in management (Lee et al., 2020).
It is cautioned that off-the-shelf use of COMs can lead to biased and imprecise estimates of stock status (Ovando et al., 2021a). Thus, model validation is critical for COMs before they can be used to inform fisheries management. Our study established an empirical approach to assess and apply COMs in commercial fisheries in the ECS from data-rich assessments of RLSADB, which provided an alternative way to determine stock status with COMs and could be used to assess fish stocks in other data-limited ecosystems. Nevertheless, COMs were still recommended to be treated as a temporary stepping stone before more reliable methods can be applied (Free et al., 2020). The results of our study demonstrated that the historical stock status of most fisheries in the ECS were optimistically estimated compared to actual biological observations and previous assessments. We thus recommend, as the largest contributor to global wild capture fisheries, China should phase in establishing its national database through compiling historical fishery-dependent and fishery-independent data as well as developing and implementing regular monitoring programs to meet the needs for formal statistical stock assessment for its coastal fisheries in the future. One of the initial steps could involve attempts on applying data-moderate integrated models (e.g., Length-based integrated mixed effects method, Rudd and Thorson, 2017; Stock Synthesis with catch and length, Rudd et al., 2021) which can include all available information from historical surveys and can be updated based on more data collection over time. Before that, the use of data-limited methods which solely rely on catch or length composition data should be carefully evaluated before they can be used to determine stock status and inform fisheries management.
Data Availability Statement
The datasets of data-rich stocks in this study can be found on https://www.ramlegacy.org/. And the catch history of data-poor stocks in this study can be obtained from China Fishery Statistical Yearbook.
Author Contributions
LD, conceptualization, methodology, data analysis, and draft manuscript preparation. LD, CH, and LX, analysis and interpretation of results and editing and reviewing of the manuscript. CG, ST, and YC, editing, reviewing, and finalization. All authors contributed to the article and approved the submitted version.
Funding
This study was financially supported by the National Key R&D Programs of China (2019YFD0901404), the National Key R&D Programs of China (2019YFD0901401), the National Natural Science Foundation of China (31902372), and the China Scholarship Council (202008967001).
Conflict of Interest
The authors declare that the research was conducted in the absence of any commercial or financial relationships that could be construed as a potential conflict of interest.
Publisher’s Note
All claims expressed in this article are solely those of the authors and do not necessarily represent those of their affiliated organizations, or those of the publisher, the editors and the reviewers. Any product that may be evaluated in this article, or claim that may be made by its manufacturer, is not guaranteed or endorsed by the publisher.
Acknowledgments
We would like to thank the reviewers and the editor for their constructive comments.
Supplementary Material
The Supplementary Material for this article can be found online at: https://www.frontiersin.org/articles/10.3389/fmars.2022.939177/full#supplementary-material
References
Akaike H. (1998). “Information Theory and an Extension of the Maximum Likelihood Principle,” in Selected Papers of Hirotugu Akaike (New York: Springer), 199–213.
Anderson S. C., Afflerbach J., Cooper A. B., Dickey-Collas M., Jensen O. P., Kleisner K. M., et al. (2016) Datalimited: Stock Assessment Methods for Data-Limited Fisheries. R Package Version 0.1.0. Available at: https://github.com/datalimited/datalimited.
Anderson S. C., Cooper A. B., Jensen O. P., Minto C., Thorson J. T., Walsh J. C., et al. (2017). Improving Estimates of Population Status and Trend With Superensemble Models. Fish. Fish. 18, 732–741. doi: 10.1111/faf.12200
Bouch P., Minto C., Reid D. G. (2021). Comparative Performance of Data-Poor CMSY and Data-Moderate SPiCT Stock Assessment Methods When Applied to Data-Rich, Real-World Stocks. ICES J. Mar. Sci. 78, 264–276. doi: 10.1093/icesjms/fsaa220
Branch T. A., Jensen O. P., Ricard D., Ye Y., Hilborn R. (2011). Contrasting Global Trends in Marine Fishery Status Obtained From Catches and From Stock Assessments. Conserv. Biol. 25, 777–786. doi: 10.1111/j.1523-1739.2011.01687.x
Cao L., Chen Y., Dong S., Hanson A., Huang B., Leadbitter D., et al. (2017). Opportunity for Marine Fisheries Reform in China. Proc. Natl. Acad. Sci. 114, 435–442. doi: 10.1073/pnas.1616583114
Carruthers T. R., Walters C. J., McAllister M. K. (2012). Evaluating Methods That Classify Fisheries Stock Status Using Only Fisheries Catch Data. Fish. Res. 119-120, 66–79. doi: 10.1016/j.fishres.2011.12.011
Costello C., Ovando D., Hilborn R., Gaines S. D., Deschenes O., Lester S. E. (2012). Status and Solutions for the World’s Unassessed Fisheries. Science. 338, 517–520. doi: 10.1126/science.1223389
Deroba J. J., Butterworth D. S., Methot R. D. Jr., De Oliveira J. A. A., Fernandez C., Nielsen A., et al. (2015). Simulation Testing the Robustness of Stock Assessment Models to Error: Some Results From the ICES Strategic Initiative on Stock Assessment Methods. ICES J. Mar. Sci. 72, 19–30. doi: 10.1093/icesjms/fst237
FAO (2012). The State of World Fisheries and Aquaculture 2012 (SOFIA) Vol. p (, Rome: Food and Agriculture Organization), 209.
FAO (2020). The State of World Fisheries and Aquaculture 2020. Sustainability in Action (Rome: Food and Agriculture Organization of the United Nations (FAO)). doi: 10.4060/ca9229en
Free C. M. (2018) Datalimited2: More Stock Assessment Methods for Data-Limited Fisheries. R Package Version 0.1.0. Available at: https://github.com/cfree14/datalimited2.
Free C. M., Jensen O. P., Anderson S. C., Gutierrez N. L., Kleisner K. M., Longo C., et al. (2020). Blood From a Stone: Performance of Catch-Only Methods in Estimating Stock Biomass Status. Fish. Res. 223, 105452. doi: 10.1016/j.fishres.2019.105452
Free C. M., Jensen O. P., Wiedenmann J., Deroba J. J. (2017). The Refined ORCS Approach: A Catch-Based Method for Estimating Stock Status and Catch Limits for Data-Poor Fish Stocks. Fish. Res. 193, 60–70. doi: 10.1016/j.fishres.2017.03.017
Froese R., Demirel N., Coro G., Kleisner K. M., Winker H. (2017). Estimating Fisheries Reference Points From Catch and Resilience. Fish. Fish. 18, 506–526. doi: 10.1111/faf.12190
Froese R., Pauly D. (2022) FishBase. World Wide Web Electronic Publication. Available at: www.fishbase.org.version.
Guan L., Chen Y., Boenish R., Jin X., Shan X. (2020). Improving Data-Limited Stock Assessment With Sporadic Stock Index Information in Stock Reduction Analysis. Can. J. Fish. Aquat. Sci. 77, 857–868. doi: 10.1139/cjfas-2018-0500
Han Q., Shan X., Jin X., Gorfine H., Yang T., Su C. (2021). Data-Limited Stock Assessment for Fish Species Devoid of Catch Statistics: Case Studies for Pampus Argenteus and Setipinna Taty in the Bohai and Yellow Seas. Front. Mar. Sci. 8. doi: 10.3389/fmars.2021.766499
Hilborn R., Amoroso R. O., Anderson C. M., Baum J. K., Branch T. A., Costello C., et al. (2020). Effective Fisheries Management Instrumental in Improving Fish Stock Status. Proc. Natl. Acad. Sci. 117, 2218–2224. doi: 10.1073/pnas.1909726116
Huang S., He Y. (2019). Management of China’s Capture Fisheries: Review and Prospect. Aquac. Fish. 4, 173–182. doi: 10.1016/j.aaf.2019.05.004
Kang B., Liu M., Huang X., Li J., Yan Y., Han S., et al. (2018). Fisheries in Chinese Seas: What can We Learn From Controversial Official Fisheries Statistics? Rev. Fish. Biol. Fish. 28, 503–519. doi: 10.1007/s11160-018-9518-1
Lam V. W., Pauly D. (2019). Status of Fisheries in 13 Asian Large Marine Ecosystems. Deep Sea Res. Part II Top. Stud. Oceanogr. 163, 57–64. doi: 10.1016/j.dsr2.2018.09.002
Lee Q., Lee A., Liu Z., Szuwalski C. S. (2020). Life History Changes and Fisheries Assessment Performance: A Case Study for Small Yellow Croaker. ICES J. Mar. Sci. 77, 645–654. doi: 10.1093/icesjms/fsz232
Liao B., Karim E., Zhang K. (2021). Comparative Performance of Catch-Based and Surplus Production Models on Evaluating Largehead Hairtail (Trichiurus Lepturus) Fishery in the East China Sea. Reg. Stud. Mar. Sci. 48, 102026. doi: 10.1016/j.rsma.2021.102026
Li G., Chen X., Guan W. (2010). Stock Assessment and Risk Analysis of Management Strategies for Scomber Japonicus in the East China Sea and Yellow Sea Using a Bayesian Approach. J. Fish. China. 34, 740–750. doi: 10.3724/SP.J.1231.2010.05941
Liu J. Y. (2013). Status of Marine Biodiversity of the China Seas. PloS One 8, e50719. doi: 10.1371/journal.pone.0050719
Ma Q., Jiao Y., Ren Y., Xue Y. (2020). Population Dynamics Modelling With Spatial Heterogeneity for Yellow Croaker (Larimichthys Polyactis) Along the Coast of China. Acta Oceanol. Sin. 39, 107–119. doi: 10.1007/s13131-020-1602-4
Martell S., Froese R. (2013). A Simple Method for Estimating MSY From Catch and Resilience. Fish. Fish. 14, 504–514. doi: 10.1111/j.1467-2979.2012.00485.x
MOA (Ministry of Agriculture) (1986-2021). China Fishery Statistical Yearbook (Beijing, China (in Chinese: China Agriculture Press).
Ovando D., Free C. M., Jensen O. P., Hilborn R. (2021b). A History and Evaluation of Catch-Only Stock Assessment Models. Fish. Fish. 00, 1–15. doi: 10.1111/faf.12637
Ovando D., Hilborn R., Monnhan C., Rudd M., Sharma R., Thorson J. T., et al. (2021a). Improving Estimates of the State of Global Fisheries Depends on Better Data. Fish. Fish. 22, 1377–1391. doi: 10.1111/faf.12593
Pauly D., Belhabib D., Blomeyer R., Cheung W., Cisneros-Montemayor A., Copeland D., et al. (2014). China’s Distant-Water Fisheries in the 21st Century. Fish. Fish. 15, 474–488. doi: 10.1111/faf.12032
Pauly D., Liang C., Xian W. (2021). Editoral: The Status of Marine Fisheries in East Asia. Front. Mar. Sci. 8. doi: 10.3389/fmars.2021.787217
Pons M., Cope J. M., Kell L. T. (2020). Comparing Performance of Catch-Based and Length-Based Stock Assessment Methods in Data-Limited Fisheries. Can. J. Fish. Aquat. Sci. 77, 1026–1037. doi: 10.1139/cjfas-2019-0276
R Core Team (2020). R: A Language and Environment for Statistical Computing (, Vienna, Austria: R Foundation for Statistical Computing). Available at: https://www.R-project.org/.
Ricard D., Minto C., Jensen O. P., Baum J. K. (2012). Evaluating the Knowledge Base and Status of Commercially Exploited Marine Species With the RAM Legacy Stock Assessment Database. Fish. Fish. 13, 380–398. doi: 10.1111/j.1467-2979.2011.00435.x
Rosenberg A. A., Fogarty M. J., Cooper A. B., Dickey-Collas M., Fulton E. A., Gutiérrez N. L., et al. (2014). Developing New Approaches to Global Stock Status Assessment and Fishery Production Potential of the Seas (Rome, Italy: FAO Fisheries and Aquaculture Circular), 1086.
Rudd M. B., Cope J. M., Wetzel C. R., Hastie J. (2021). Catch and Length Models in the Stock Synthesis Framework: Expanded Application to Data-Moderate Stocks. Front. Mar. Sci. 8. doi: 10.3389/fmars.2021.663554
Rudd M. B., Thorson J. T. (2017). Accounting for Variable Recruitment and Fishing Mortality in Length-Based Stock Assessments for Data-Limited Fisheries. Can. J. Fish. Aquat. Sci. 75, 1019–1035. doi: 10.1139/cjfas-2017-0143
Sharma R., Winker H., Levontin P., Kell L., Ovando D., Palomares M. L. D., et al. (2021). Assessing the Potential of Catch-Only Models to Inform on the State of Global Fisheries and the UN’s SDGs. Sustainability.13, 6101. doi: 10.3390/su13116101
Su S., Tang Y., Chang B., Zhu W., Chen Y. (2020). Evolution of Marine Fisheries Management in China from 1949 to 2019: How did China get here and where does China go next? Fish. Fish. 21, 435−452. doi: 10.1111/faf.12439
Sui X., Wang J., Chen X. (2021). Resource Assessment of Scomberomorus Niphonius Dependent Environmental Factors in East China Sea. Mar. Sci. 45, 136–146. doi: 10.11759/hykx20200722003
Szuwalski C. S., Burgess M. G., Costello C., Gaines S. D. (2017). High Fishery Catches Through Trophic Cascades in China. Proc. Natl. Acad. Sci. 114, 717–721. doi: 10.1073/pnas.1612722114
Teh L. S., Cashion T., Cheung W. W., Sumaila U. R. (2020). Taking Stock: A Large Marine Ecosystem Perspective of Socio-Economic and Ecological Trends in East China Sea Fisheries. Rev. Fish. Biol. Fish. 30 (2), 269–292. doi: 10.1007/s11160-020-09599-8
Thorson J. T., Minto C., Minte-Vera C. V., Kleisner K. M., Longo C., and (2013). A New Role for Effort Dynamics in the Theory of Harvested Populations and Data-Poor Stock Assessment. Can. J. Fish. Aquat. Sci. 70, 1829−1844. doi: 10.1139/cjfas-2013-0280
Thorson J. T., Munch S. B., Cope J. M., Gao J. (2017). Predicting Life History Parameters for All Fishes Worldwide. Ecol. Appl. 27, 2262–2276. doi: 10.1002/eap.1606/full
van Gemert R., Koemle D., Winkler H., Arlinghaus R. (2022). Data-Poor Stock Assessment of Fish Stocks Co-Exploited by Commercial and Recreational Fisheries: Applications to Pike Esox Lucius in the Western Baltic Sea. Fish. Manage. Ecol. 29, 16–28. doi: 10.1111/fme.12514
Watson R., Pauly D. (2001). Systematic Distortions in World Fisheries Catch Trends. Nature. 414, 534–536. doi: 10.1038/35107050
Xing L., Chen Y., Zhang C., Li B., Shin Y. J., Ren Y. (2020). Evaluating Impacts of Pulse Fishing on the Effectiveness of Seasonal Closure. Acta Oceanol. Sin. 39, 89–99. doi: 10.1007/s13131-020-1536-x
Zhai L., Liang C., Pauly D. (2020). Assessments of 16 Exploited Fish Stocks in Chinese Waters Using the CMSY and BSM Methods. Front. Mar. Sci. 7. doi: 10.3389/fmars.2020.483993
Zhang C., Chen Y., Xu B., Xue Y., Ren Y. (2022). The Dynamics of the Fishing Fleet in China Seas: A Glimpse Through AIS Monitoring. Sci. Total Environ. 819, 153150. doi: 10.1016/j.scitotenv.2022.153150
Zhang K., Li J., Hou G., Huang Z., Shi D., Chen Z., et al. (2021). Length-Based Assessment of Fish Stocks in a Data-Poor, Jointly Exploited (China and Vietnam) Fishing Ground, Northern South China Sea. Front. Mar. Sci. 8. doi: 10.3389/fmars.2021.718052
Zhang K., Zhang J., Xu Y., Sun M., Chen Z., Yuan M. (2018). Application of a Catch-Based Method for Stock Assessment of Three Important Fisheries in the East China Sea. Acta Oceanolog. Sin. 37, 102–109. doi: 10.1007/s13131-018-1173-9
Zhang K., Chen Z. (2015). Using Bayesian State-Space Modelling to Assess Trichiurus Japonicus Stock in the East China Sea. J. Fish. Sci. China. 22, 1015−1026. doi: 10.3724/SP.J.1118.2015.14536
Zhou S., Punt A. E., Smith A. D., Ye Y., Haddon M., Dichmont C. M., et al. (2018). An Optimized Catch-Only Assessment Method for Data Poor Fisheries. ICES Mar. Sci. 75, 964–976. doi: 10.1093/icesjms/fsx226
Zhou S., Punt A. E., Ye Y., Ellis N., Dichmont C. M., Haddon M., et al. (2017). Estimating Stock Depletion Level From Patterns of Catch History. Fish. Fish. 18, 742–751. doi: 10.1111/faf.12201
Keywords: stock assessment, data-limited fisheries, catch-only methods, the East China Sea, stock status
Citation: Dai L, Hodgdon CT, Xu L, Gao C, Tian S and Chen Y (2022) Evaluating Catch-Only Methods to Inform Fisheries Management in the East China Sea. Front. Mar. Sci. 9:939177. doi: 10.3389/fmars.2022.939177
Received: 08 May 2022; Accepted: 14 June 2022;
Published: 15 July 2022.
Edited by:
Maria Grazia Pennino, Spanish Institute of Oceanography (IEO), SpainReviewed by:
Kui Zhang, Chinese Academy of Fishery Sciences (CAFS), ChinaMarta Cousido-Rocha, Spanish Institute of Oceanography (IEO), Spain
Copyright © 2022 Dai, Hodgdon, Xu, Gao, Tian and Chen. This is an open-access article distributed under the terms of the Creative Commons Attribution License (CC BY). The use, distribution or reproduction in other forums is permitted, provided the original author(s) and the copyright owner(s) are credited and that the original publication in this journal is cited, in accordance with accepted academic practice. No use, distribution or reproduction is permitted which does not comply with these terms.
*Correspondence: Chunxia Gao, Y3hnYW9Ac2hvdS5lZHUuY24=; Siquan Tian, c3F0aWFuQHNob3UuZWR1LmNu