 Dong-Geon Lee
 Ji-Hoon Oh1
 Kyung Min Noh
 Eun Young Kwon
 Young Ho Kim
 Jong-Seong Kug
- 1Division of Environmental Science and Engineering, Pohang University of Science and Technology (POSTECH), Pohang, Republic of Korea
- 2IBS Center for Climate Physics, Pusan National University, Busan, Republic of Korea
- 3Department of Oceanography, Pukyoung National University, Busan, Republic of Korea
The Yellow and East China Seas (YECS) are productive continental shelves where essential nutrients for phytoplankton growth are mainly supplied by the intrusion of the Kuroshio Current, riverine inputs, and atmospheric deposition. Surface temperatures in YECS are increasing due to global warming, and are projected to increase further. In this study, future changes in YECS biogeochemical processes were evaluated using Coupled Model Intercomparison Project Phase 6 (CMIP6) Earth System Models. We found a great diversity in predictions of future changes in chlorophyll-a over the YECS region. This diversity was determined to be closely related to the extent of phosphorus (P) limitation for phytoplankton growth. Models simulating positive chlorophyll changes tend to simulate increased Dissolved Inorganic Phosphate (DIP) supplies under future global warming. Our study also demonstrated that the intrusion of the Kuroshio Current into the YECS plays a critical role in future changes in DIP and chlorophyll-a by transporting relatively DIP-rich subsurface water from the Kuroshio Current into the marginal sea.
1 Introduction
The Earth’s climate is warming due to the accumulation of greenhouse gases in the atmosphere. Uncertainty in the global carbon cycle related to biogeochemical feedbacks is one of the major challenges facing future climate projection (Friedlingstein, 2015). In particular, marine phytoplankton plays an important role in net primary production, both in the oceans and in estuarine–coastal ecosystems (Behrenfeld et al., 2006; Beardall et al., 2009; Cloern et al., 2014; Käse and Geuer, 2018). Consequently, identifying spatiotemporal variations in phytoplankton concentration and primary production in the oceans is important for understanding the carbon cycle and constraining ocean biogeochemical processes. In recent years, rapid increases in sea surface temperature (SST) have occurred due to industrialization and population growth around East Asian seas along the Kuroshio Current. The Yellow and East China Sea (YECS) face the most serious challenges and contribute significantly to aggravating global warming effects on a regional scale (Belkin, 2009; Yeh and Kim, 2010; Sasaki and Umeda, 2021).
The YECS region is bordered by China and the Korean Peninsula and is among the largest continental shelves (<100 m) in the Northwest Pacific Ocean (Ichikawa and Beardsley, 2002; Zhang et al., 2019; Shirota et al., 2021). The YECS region also has great economic importance as it is surrounded by population centers totaling hundreds of millions of people (Xie et al., 2002; Oh et al., 2005; Murray et al., 2014). The Kuroshio Current, which is the most representative western boundary current flow adjacent to the YECS region, plays a critical role in transporting heat and nutrients northward (Hsueh, 2000; Yuan et al., 2008; Chen et al., 2021). The YECS region is a highly productive sea into which several rivers flow, including the Yangtze (Chang-jiang river) and Huang He (Yellow river), two of the largest rivers in the world (Zhang, 1996; Liu et al., 2003; Zhao and Guo, 2011; Tong et al., 2015). In addition, the YECS region is one of the most turbid in the world due to the high level of sediment supply from rivers; the Yangtze river is responsible for more than 90% of the total river discharge and sediment to the YECS (Zhang et al., 2007; Shi and Wang, 2012; He et al., 2013). In general, primary production in the ocean is limited by nitrogen (N); however, the YECS region, featuring large amounts of riverine water input from the Yangtze river, has a strong phosphorus (P) limitation due to the excessive supply of N compared to P (Wang et al., 2003; Kim et al., 2011; Lee et al., 2017; Zhang et al., 2019; Moon et al., 2021). Therefore, changes in ocean surface P concentration can potentially modulate primary production in this region.
Chlorophyll-a is the most widely used and reliable proxy for estimating the primary production of the ocean arising from phytoplankton biomass because it is colored and common to all primary producers (Huot et al., 2007; McCluskey et al., 2022). Many previous studies of the YECS region have investigated its productivity using in situ (cruise) data for chlorophyll-a distribution and primary productivity (2006; Gong et al., 1996; Gong et al., 2003; Kim et al., 2009). Satellite ocean color data have also been widely used in the study of the spatiotemporal variability of chlorophyll-a (Kiyomoto et al., 2001; Yamaguchi et al., 2012; Zhang et al., 2018; Liu et al., 2019); however, although the role of the ocean in carbon cycle process is increasing due to global climate change, few studies have considered future changes in biogeochemical factors in the YECS region under global warming.
In this study, we explore future phytoplankton changes in the YECS region in response to 21st century global warming simulated by the Coupled Model Intercomparison Project Phase 6 (CMIP6) Earth System Models. In particular, we analyze the inter-model diversity of changes in chlorophyll-a across the YECS region using the CMIP6 models and evaluate which factors determine the observed diversity.
2 Materials and methods
To investigate future changes in phytoplankton concentrations across the YECS region under global warming, we used a total of 13 CMIP6 Earth System Models (ESMs) (Supplementary Table 1). However, since all the variables are not available in the 13 CMIP6 ESMs, all 13 models were used only for the chlorophyll-a data. In the case of DIP data, 12 models were used because the DIP data of the CanESM5 model is not available. For the calculation of PO4 transport, 11 models were used because the ocean current data are not available in the GFDL-ESM4 and CanESM5 (Supplementary Table 1). For historical changes, we analyzed the total historical period (1850–2014) (Eyring et al., 2016). We used a period of the last 30 years (2071–2100) for warm climate simulations using the SSP5-8.5 (Shared Socioeconomic Pathways 5–8.5) scenario in CMIP6 ESMs, which represents high emission scenarios to produce a radiative forcing of 8.5 Wm-2 in 2100 (O’Neill et al., 2016). Here, monthly mean data were used and future changes in variables were calculated according to the differences between the means of the historical period (1850–2014) and the future warm climate period (2071–2100). In addition, to investigate the Mixed Layer Depth (MLD) we used Simple Ocean Data Assimilation (SODA), version 3 (Carton et al., 2018), from 1980 to 2015.
All CMIP6 ESMs used in this study have different original resolutions; as such, all data were re-gridded into the same by 1 ×1 latitude/longitude grids. Only the vectors representing PO4 transport by the Kuroshio Current to the YECS region were re-gridded to a higher resolution of 0.5 × 0.5.
In order to evaluate the statistical significance of the results, the bootstrap non-parametric method was applied by random sampling 10000 times to replace as many as the number of the used CMIP6 ESMs. To evaluate the degree of factors affecting phytoplankton growth, multiple regression for SST, Shortwave radiation (SW), nutrient (PO4) was conducted based on annual mean data for the historical period (165 years). To compare relative importance, multiple regression is conducted after all variables were normalized by their standard deviations.
3 Results
To examine future changes in surface chlorophyll-a concentrations over the YECS region (34.5°N–40.5°N, 118°E–126°E; Red box region in Figure 1A), we analyzed differences in the average surface layer (upper 30 m depth mean) chlorophyll-a (SCHL) concentrations between historical climate period (1850–2014) and the future climate period (2071–2100) using 13 CMIP6 ESMs. Figure 1A shows the ensemble mean of the changes in SCHL concentrations of these models. The entire YECS domain excluding the YECS region shows significant decreasing trends. These changes can be explained by a reducing nutrient flux to the upper ocean as a result of an enhanced ocean stratification with the increased SST due to global warming (Behrenfeld et al., 2006; Doney, 2006; Lewandowska et al., 2014). Although SCHL changes over the YECS region indicate an increasing trend, these changes are not statistically significant, suggesting large model diversity. To evaluate this model diversity, changes in the SCHL of the YECS region were calculated using individual models (Figure 1B). Whereas the ensemble mean is positive, only three models simulate strong positive changes; the others simulate negative changes. The different signs of these responses clearly suggest large model diversity. To evaluate the factors determining this model diversity, we classified the models into two groups: a positive group (CESM2, CNRM-ESM2-1, and MIROC-ES2L) and a negative group (GFDL-ESM4, UKESM1-0-LL, CESM2-WACCM, and IPSL-CM6A-LR), characterized by strong positive and negative SCHL changes, respectively. In the case of three models classified as a positive group (CESM2, CNRM-ESM2-1, MIROC-ES2L), the concentration of SCHL increased by 110% (0.25mg/m3), 42% (0.42mg/m3), and 27% (0.14mg/m3) compared to the historical period and the SCHL concentration of the four negative models decreased by 27% (-0.06 mg/m3), 9% (-0.1mg/m3), 10% (-0.12mg/m3) and 20% (-0.08mg/m3) compared to historical period, respectively (Supplementary Figure 2). There is a considerable increasing (27% to 110%) and decreasing (-9% to -27%) trend compared to the historical period. As expected, the positive group shows strong positive changes in the YECS region, especially along the eastern coastal regions of China, the coastal regions of the Shandong peninsula, and in the Bohai Sea (Figure 1C). In the case of the negative group, overall negative changes are shown across the entire East Asian seas and negative SCHL responses are stronger in the eastern coastal regions of China at wider latitudes (25°N-40°N) (Figure 1D).
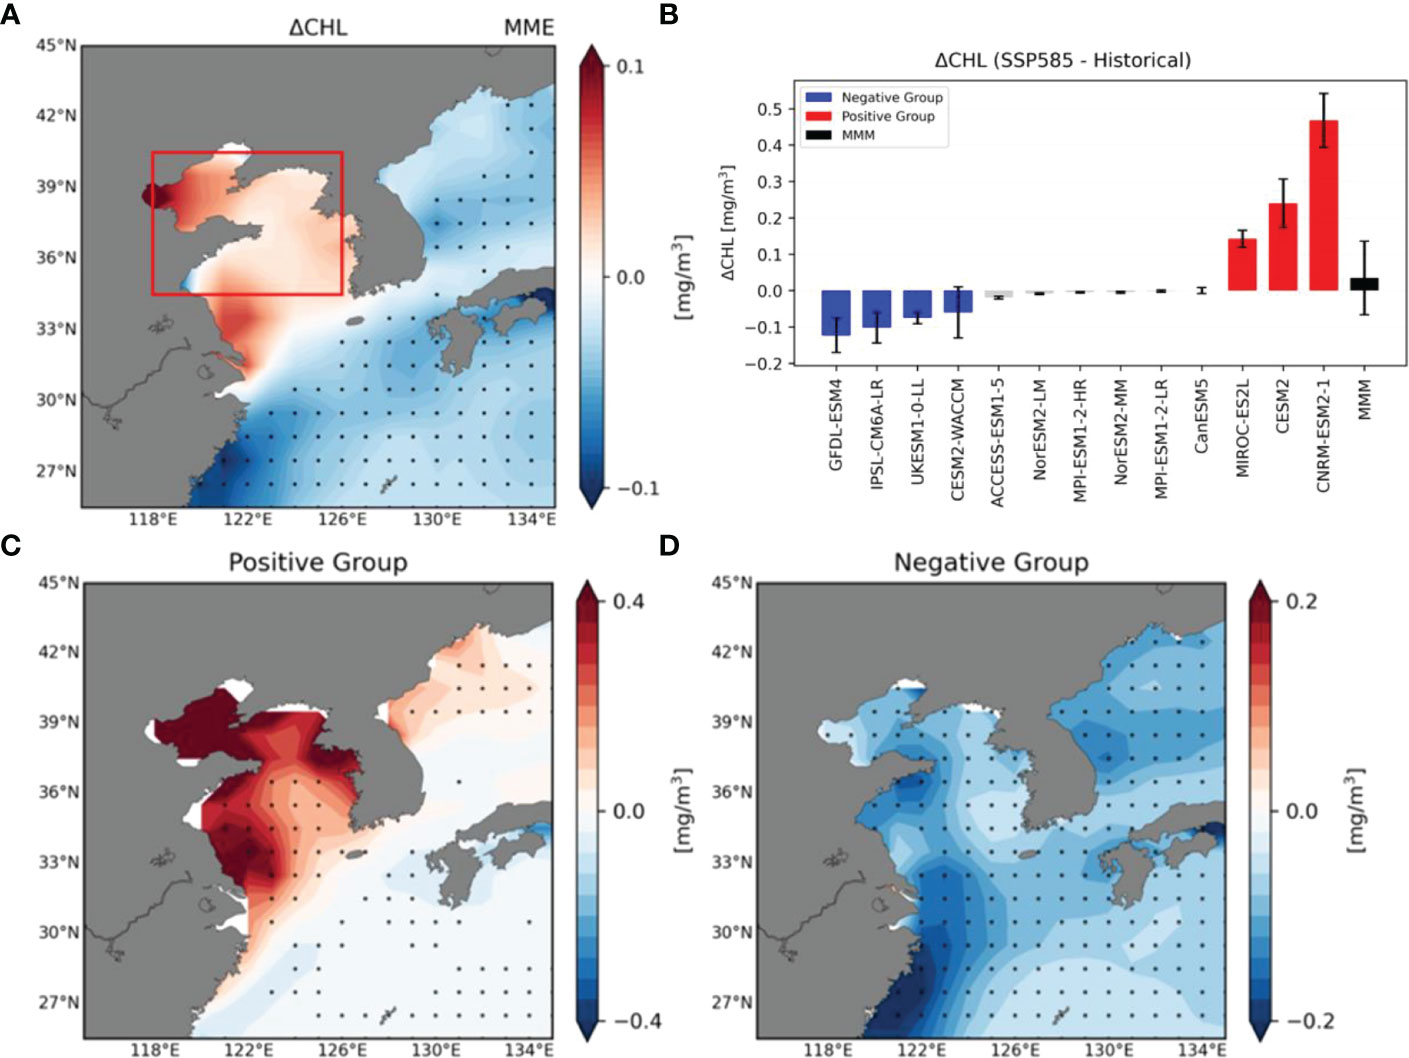
Figure 1 (A) Spatial distribution of Multi-Model Ensemble Mean difference in surface (upper 30 m depth mean) chlorophyll-a (SCHL) concentrations between historical climate period (1850–2014) and future climate period (2071–2100) using 13 CMIP6 models. (B) Area-averaged (Red box in Figure 1A) future changes of SCHL concentrations in the Yellow and East China Sea (YECS) region (34.5°N–40.5°N, 118°E–126°E) using 13 CMIP6 models. Red bars indicate models with an increase in SCHL concentrations in the future climate (positive group), and blue bars indicate models with decreasing SCHL concentrations (negative group). The black bar represents the Multi-Model Ensemble Mean (MMM) of 13 models of future change in the SCHL concentrations and crosses represent significance at the 95% confidence levels. (C, D) Spatial distribution of ensemble mean SCHL differences for historical and future climate periods for the positive group and negative group, respectively. Black dots indicate points at which these differences are significant at the 95% confidence level using the bootstrap method.
To further characterize model diversity, nutrient limitation was examined. It is well-known that phosphorus (P) concentrations are more important than nitrogen (N) concentrations for influencing primary productivity in the YECS region (Lee et al., 2017), since N supplies are relatively high owing to river discharge (Wang et al., 2003; Kim et al., 2011; Lee et al., 2017; Zhang et al., 2019; Moon et al., 2021). Therefore, changes in ocean primary productivity in the YECS region are closely related to changes in P concentration. To evaluate the relative contribution of limiting factors affecting surface chlorophyll-a, we conducted the multiple regression for the historical period for SST, SW, PO4 for 12 models as follows:
Table 1 shows the relative contribution of each limiting factor that affects the phytoplankton variability from the historical period simulation. Except for the ACCESS-ESM1-5 model, the relative contribution of SST is very low in all models. It is interesting that the models which were not classified into the positive or negative groups show weak sensitivity to the nutrient, except for the MPI-ESM1-2-LR. Their SCHL variabilities tend to be mainly contributed by the Shortwave radiation, so they can be not sensitive to the nutrient supplies under greenhouse warming. Among the four negative models, three models show the strongest sensitivity to the nutrient. In addition, all three positive models show strong sensitivity to the PO4 concentration, suggesting that nutrient is the main limiting factor to contribute to phytoplankton variability as consistent with the previous studies (Hecky and Kilham, 1988; Moore et al., 2013). Therefore, to understand the difference between the positive and negative groups, we conducted additional analyses focusing on PO4 concentration. Figure 2A shows future changes in DIP concentrations simulated by the individual models. It is evident that all models in the positive group simulate that increasing DIP concentrations in the future whereas all models in the negative group simulate negative DIP changes. The positive group shows significant strong DIP increases only in the Yellow Sea (YS) region, though there are significant decreases in other ocean areas (Figure 2B). The negative group simulates an overall negative DIP change in the YECS region, consistent with the SCHL changes (Figure 2C). Based on these results, the future change in SCHL concentrations seems to be largely related to changes in DIP concentrations in the YECS region. Whereas the DIP concentrations of the positive group (CESM2, CNRM-ESM2-1, MIROC-ES2L) increased by 38% (0.16mmol/m3), 225% (0.54mmol/m3), and 135% (1.23mmol/m3), respectively, the DIP concentrations of the negative group decreased by 50% (-0.22 mmol/m3), 20% (-0.01mmol/m3), 39% (-0.12mmol/m3) and 48% (-0.03mmol/m3) compared to the historical period, respectively (Supplementary Figure 2). External sources of nutrients in the YECS region include river discharge, mainly from the Yangtze river, atmospheric deposition, northward current from the Taiwan Strait, and the Kuroshio Current (Chung et al., 2001; Kim et al., 2011; Cloern et al., 2014; Zhang et al., 2019). We first evaluated riverine water inputs from the Chinese mainland, including the Yangtze river, and atmospheric deposition, but found no distinct differences between the positive and negative groups (Supplementary Figure 1).
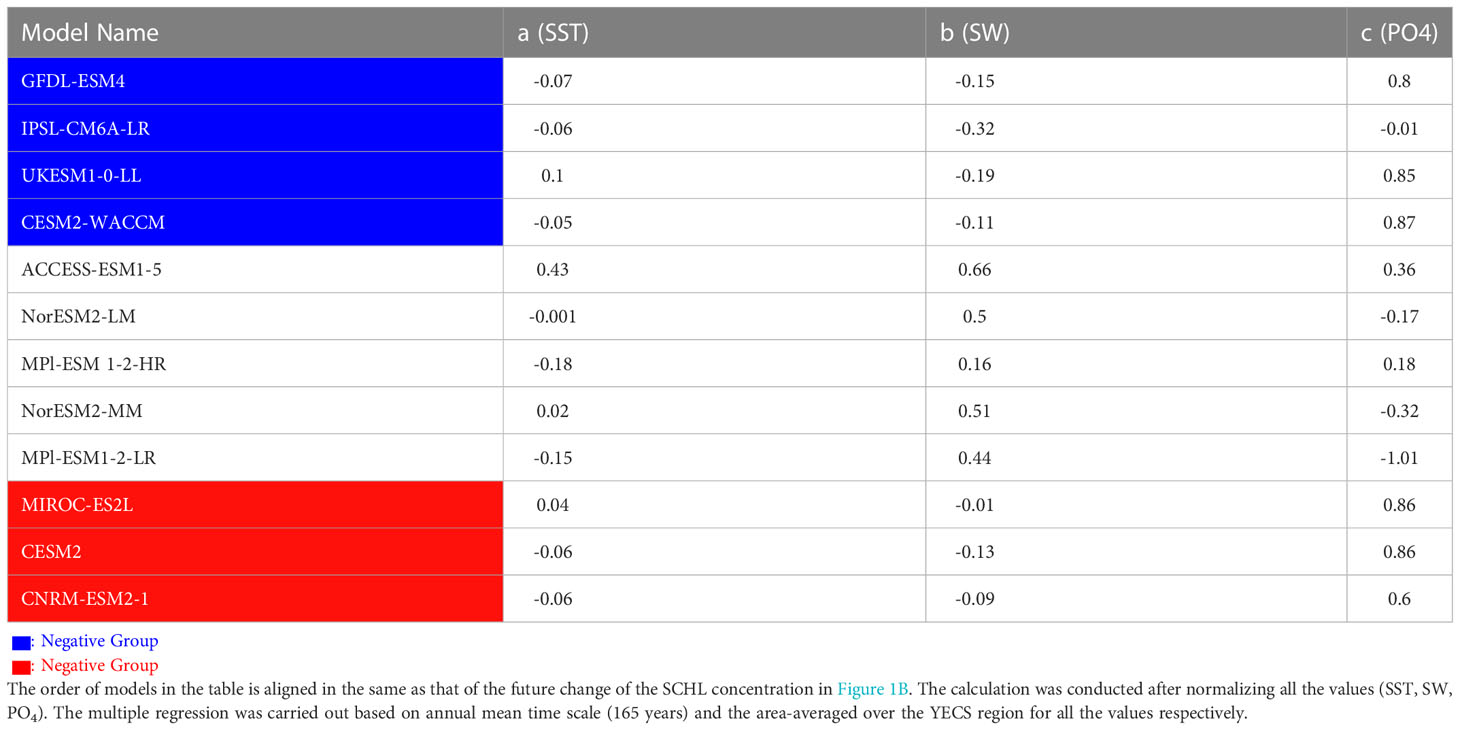
Table 1 Multiple Regression coefficients of Sea Surface Temperature (SST), Shortwave radiation (SW), and PO4 for 12 CMIP6 models of historical climate period (except for CanESM5 which DIP data are not available).
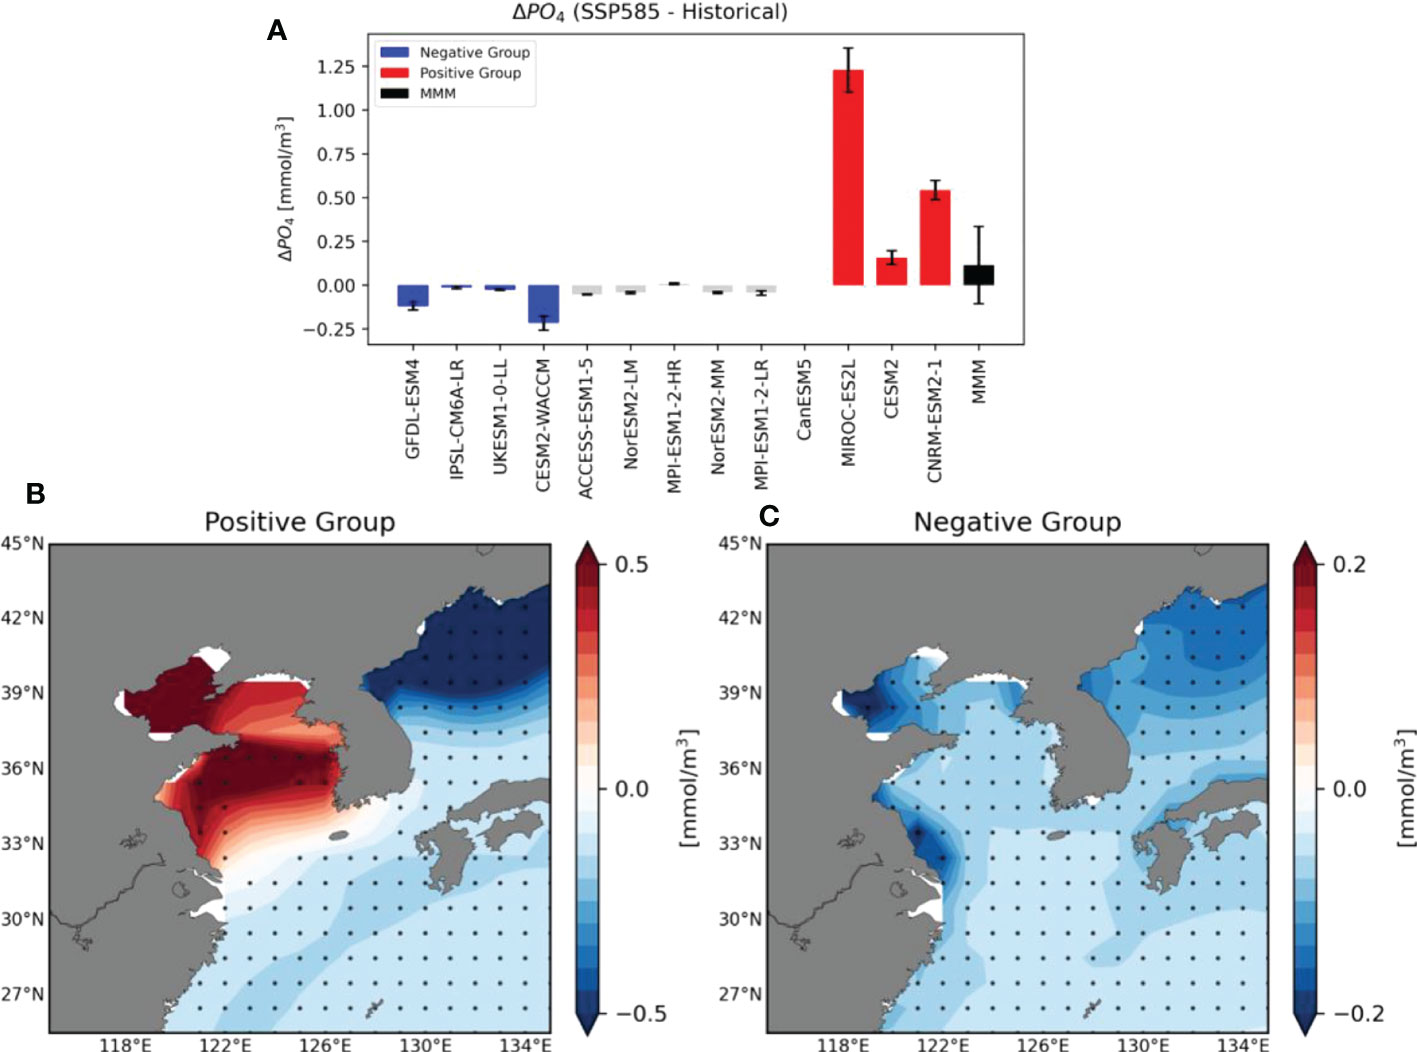
Figure 2 (A) Area-averaged future changes in surface (upper 30 m depth mean) Dissolved Inorganic Phosphorus (DIP) concentrations in the YECS region using 12 CMIP6 models (excluding the CanESM5 Model). The black bar represents MMM of 12 models of future change in the DIP concentrations and the crosses indicate significance at the 95% confidence level. The order of the graph is aligned the same as that of the future change of the SCHL concentration. (B, C) Spatial distribution of differences in the ensemble mean DIP concentrations of historical and future climate periods for the positive and negative Groups, respectively. Black dots indicate points at which the differences are significant at the 95% confidence level using the bootstrap method.
Chen and Wang (1999) and Zhang et al. (2007) suggested that the current from the Taiwan Strait has lower nutrient content than the Kuroshio Current. In particular, the Kuroshio subsurface waters are rich in DIP compared to the YECS shelf water and, thus, play an important role in supplying nutrients to the YECS (Chen, 1996; Zhang et al., 2019). Zhang et al. (2007) also showed that Kuroshio Current subsurface water is important for the supply of nutrients to the YECS region throughout both the summer and winter.
In general, the Yellow Sea Warm Current (YSWC) flows northward from the southwest of Jeju Island around the center of YS (122°E-125°E) to the northern part of the Yellow Sea and the Bohai Sea region. Chinese coastal current and West Korean coastal current flow southward on both sides (Ichikawa and Beardsley, 2002; Xu et al., 2009). The Kuroshio Current subsurface water intrudes into the YECS region as a pathway through the YSWC flows (Liu et al., 2021). In order to examine nutrient supply by oceanic currents, we calculated changes in vertically averaged (up to 100 m) ocean currents using 11 ESMs except for CanESM5 and GFDL-ESM4 which is not available for DIP data and ocean current data respectively. As shown by the ensemble mean of surface meridional ocean currents in Figure 3A, the positive group simulates strengthening the YSWC flowing northward [Left Panel]. In the case of the negative group, weakening ocean currents are simulated in the YECS region, and the Chinese coastal current and West Korean coastal current flowing southward in the surface layer is also weakened [Middle Panel]. These contrasting features result in clear differences between the two groups [Right Panel]. In other words, the positive group simulates stronger cyclonic circulation in the YECS region while the negative group simulates weaker circulation under warm climates. Furthermore, in order to identify the impact of Kuroshio Current subsurface water intrusion on the amount of P in the YECS region, we calculated PO4 transport and compared it between the two groups. The amount of PO4 transport was calculated by multiplying the DIP concentration and ocean current velocity, which was vertically integrated up to 100 m as follows:
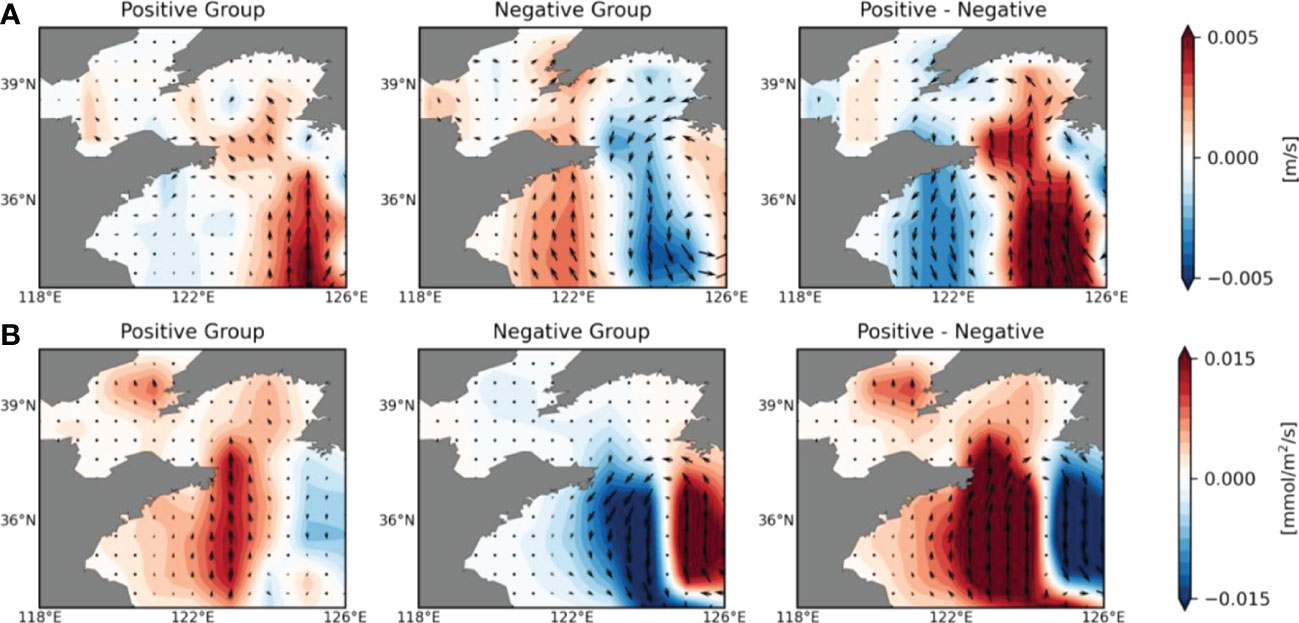
Figure 3 (A) Shading indicates the ensemble mean of the surface (upper 30 m depth mean) meridional ocean current velocity difference between historical and future climate periods for the positive group and negative group (excluding GFDL-ESM4) and the difference between the two groups. Vectors show future changes in surface zonal and meridional ocean current velocities in the YECS region. (B) Ensemble mean of differences in the vertically integrated (upper 100 m depth) meridional PO4 transport (shading) between historical and future climate periods for the positive group [Left Panel] and negative group [Middle Panel] (excluding GFDL-ESM4) and the difference between the two groups [Right Panel]. Vectors indicate vertically integrated zonal and meridional PO4 transport.
Figure 3B shows the ensemble mean of the vertically integrated meridional PO4 transport. In the case of the positive group, intensive northward transport occurs along the pathway of the intrusion of the Kuroshio subsurface waters occurs, and it reaches up to the Bohai Sea region. It seems that PO4 transported due to the intrusion of the Kuroshio subsurface water spreads to the mouth of the Yangtze River Estuary and the Bohai Sea due to strengthened cyclonic oceanic circulation in the YECS region. This positive PO4 transport may affect primary production in areas where SCHL changes positively [Left Panel]. In the case of the negative group, PO4 transport due to the intrusion of Kuroshio subsurface water decreases, resulting in a decrease in primary production throughout the YECS region [Middle Panel]. Differences between the positive and negative groups clearly show distinct PO4 transport pathways into the YECS region [Right Panel].
To further elucidate the impact of Kuroshio subsurface waters intrusions on SCHL concentrations in the YECS region, we evaluated the inter-model relationship between future changes in PO4 transport by the intrusion of Kuroshio subsurface water and surface layer DIP concentrations. We calculated the correlation coefficients, finding that PO4 transport is positively correlated with surface DIP concentration (r = 0.67); this relationship is significant at the 95% confidence level (Figure 4A). These results suggest that diversity in future changes of DIP concentration is significantly associated with PO4 transport through Kuroshio subsurface water.
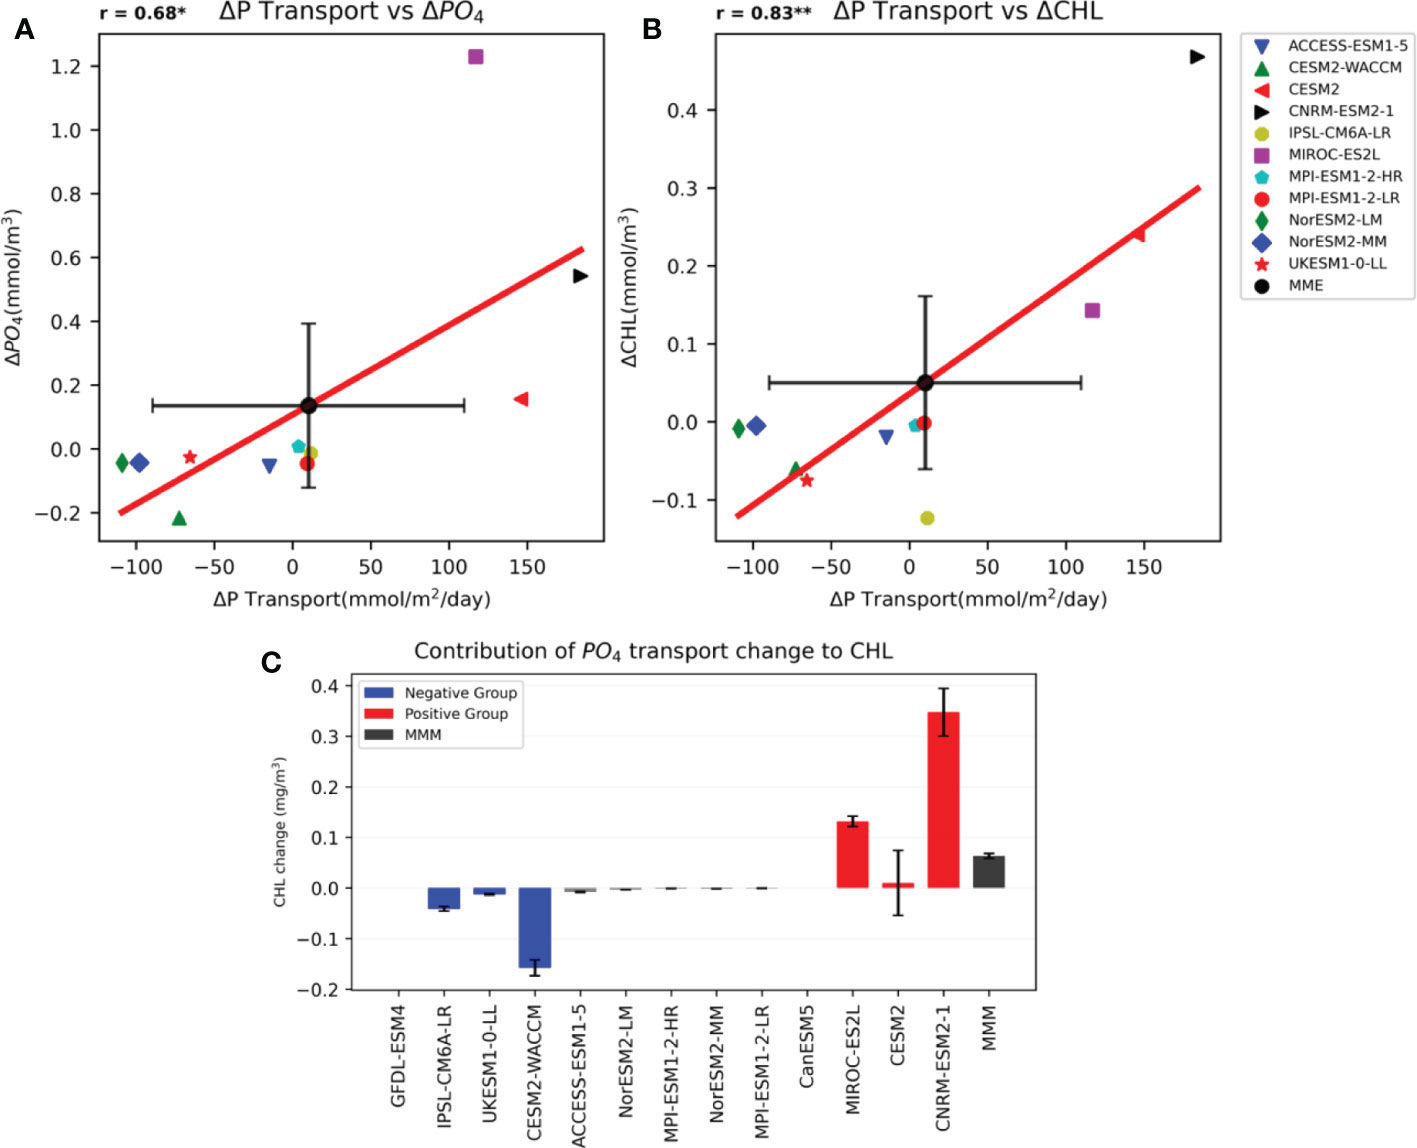
Figure 4 (A) Correlation coefficient of 11 CMIP6 models for the surface DIP concentration and meridional PO4 transport index of the YECS region. (B) Same as Figure 4A, showing the correlation between 11 CMIP6 models in terms of SCHL concentration and meridional PO4 transport index for the YECS region. Black dots and crosses represent the MMM of 11 models and spread (±1std). (C) Contribution of PO4 transport change to SCHL of 11 CMIP6 models. Black bar indicates the MMM of 11 models and crosses represent significance at the 95% confidence level. The order of the graph is aligned the same as that of the future change of the SCHL concentration. * mark indicates that the correlation coefficient is significant at the 95% confidence level. ** mark indicates that the correlation coefficient is significant at the 99% confidence level.
Furthermore, PO4 transport is shown to have a strong positive correlation with SCHL concentrations in the YECS region (r = 0.83); this relationship is significant at the 99% confidence level (Figure 4B). This strong positive correlation between PO4 transport and SCHL concentration in the YECS region indicates that a slight change in DIP concentration in the YECS region with strong P limitation can have a significant impact on primary productivity. This suggests that PO4 transported by the intrusion of the Kuroshio subsurface waters influences DIP concentrations in the YECS region and affects the corresponding SCHL concentrations.
To estimate quantitatively how much the PO4 transport changes contribute to the SCHL changes, we used a simple regression method. We calculated a linear regression coefficient of the SCHL with respect to the PO4 transport from the total period data (1850-2100), which represents the sensitivity of the SCHL to the PO4 transport. Using the regression coefficient, we can roughly estimate the contribution of the PO4 transport changes from each model as follows:
Figure 4C shows the contribution of future changes in PO4 transport to SCHL changes. Though the CESM2 model shows a larger error range, all models in the positive group show a positive contribution to the SCHL change, and all models in the negative group have a significant negative contribution of the PO4 transport change. It is also striking that the magnitude of the contribution of PO4 transport is comparable to that of the total SCHL changes shown in Figure 1B except for the CESM2 model. These results strongly support that the model diversity in the future phytoplankton changes over the YECS region is closely related to the diversity in the PO4 transport in the CMIP6 models.
4 Conclusion
In this study, we examined the impact of Kuroshio Current intrusions on future changes of phytoplankton in the YECS region under global warming. We identified future changes in SCHL in the YECS region using CMIP6 ESMs, which showed large inter-model diversity. In order to determine which factors induce inter-model diversity, we separated the models into positive and negative groups to simulate increasing and decreasing SCHL, respectively. In accordance with the environmental characteristics of the YECS region, in which strong P limitation has been identified, future changes in SCHL and DIP concentrations in the YECS region are found to be closely related.
In addition, for the positive group, cyclonic oceanic circulation in the YECS region was considered likely to strengthen in the future. Conversely, the negative group simulated a distinctive weakening of the cyclonic oceanic circulation. We showed that the PO4 transport differs significantly between these two groups. Therefore, enhanced PO4 transport leads to increased DIP concentrations in the YECS region, with significant inter-model correlation coefficients (r = 0.67, p< 0.05) between meridional PO4 transport and surface DIP concentrations. Moreover, the significant correlation coefficient (r = 0.83, p< 0.01) between meridional PO4 transport and SCHL strongly supports that increased P due to the intrusion of P-rich Kuroshio subsurface water into the YECS region induces an increase in SCHL concentrations.
In order to project future changes in biogeochemical processes over the YECS region, our study suggests that it is critical to understand how the Kuroshio Current intrusion will change under greenhouse warming and determine which factors control the Kuroshio Current. Despite many studies, the cause of the Kuroshio Current intrusion into the YECS region remains unclear (Yang et al., 2018; Yang et al., 2020). We found that the positive and negative groups defined herein show distinct changes in their pattern of wind stress curl over the East China Sea region (not shown), which may be important factors in the Kuroshio Current intrusion. This process should be investigated further.
Under global warming, ocean stratification has been enhanced and will continue over the global ocean (Li et al., 2020; Noh et al., 2022) due to the stronger surface warming. Several previous studies using ESMs such as CMIP5 and CMIP6 also pointed out that the enhanced stratification will decrease the nutrient supplies into the eutrophic layer from the deep ocean by suppressing vertical mixing, which may exacerbate surface nutrient limitation (Bopp et al., 2013; Fu et al., 2016; Kwiatkowski et al., 2020). Nevertheless, we showed that the phytoplankton blooming is highly controlled by horizontal nutrient transport. In particular, the positive group models of the present study show the increasing trend of the chlorophyll-a and nutrients over the YECS under the strong greenhouse forcing, while they also show a negative trend in the other East Asian Marginal Seas as shown in Figure 2. This unique feature is related to the topographical features of the YECS region. In the YECS region, the mean depth of the entire water column is quite shallow (<100m), and the climatological Mixed Layer Depth (MLD) is shallow compared to other oceans. Therefore, shoaling mixed layer is quite limited compared to the other ocean. Figure 5 shows future changes in the mixed layer and its changes. In the warm climate, the mixed layer over the global ocean becomes considerably shallower. In addition, the East Sea of the Korean Peninsula (35.5°N–44.5°N, 130°E–140°E) also shows consistently shallower mixed layer in the warm climate. Therefore, the future chlorophyll-a and nutrient changes in the YECS region can be more affected by other processes such as horizontal nutrient transport, rather than vertical stratification.
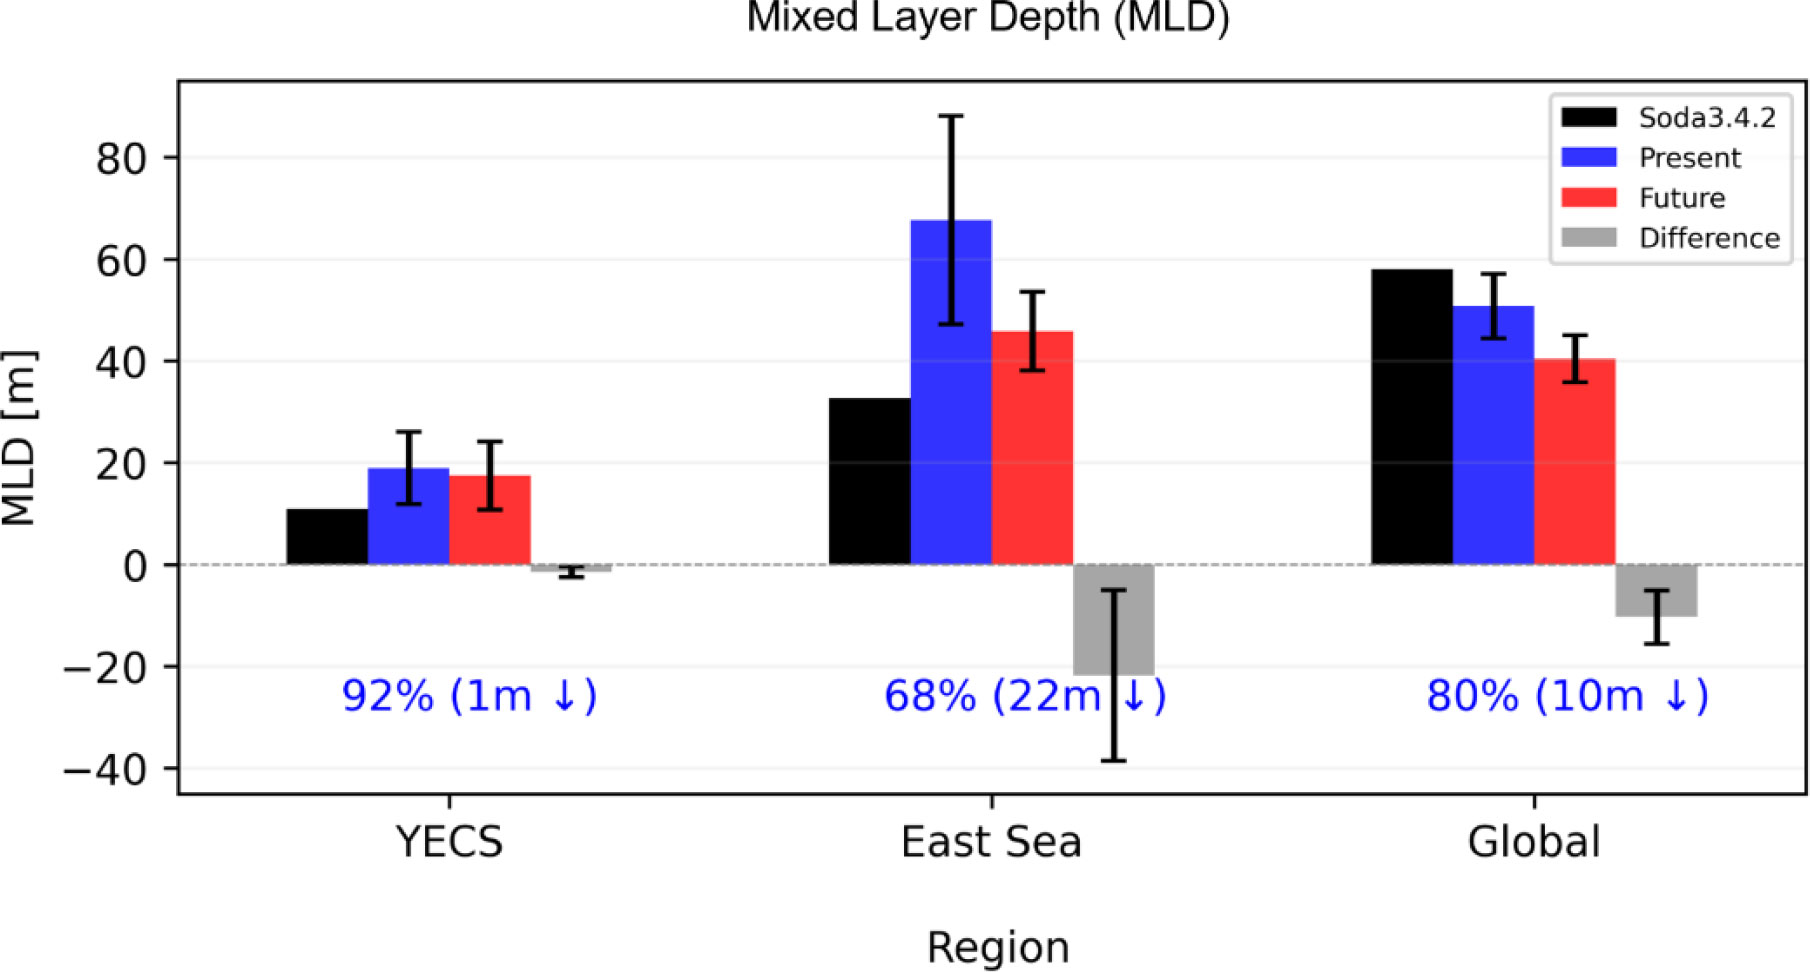
Figure 5 Future changes in Mixed Layer Depth (MLD) by regions (YECS, East Sea (35.5°N-44.5°N, 130°E-140°E), Global Ocean) of Multi-Model Ensemble Mean (MMM) of 13 CMIP6 models. Black bars represent the climatological MLD for 35 years from 1980 to 2015 using SODA 3.4.2 re-analysis data. Blue and red bars indicate MLD of the present and future period respectively. Gray bars represent the difference between the present and future periods. Crosses are spread over 13 models (±1std).
In addition, the present study has several limitations. First, the CMIP6 ESMs used in this study have low spatial resolution with coarse representations of continental shelves and slopes; therefore, local patterns, such as regional ocean currents, cannot be resolved accurately. Second, the CMIP6 ESMs do not simulate the riverine supply of nutrients prognostically, entailing a large uncertainty regarding future changes in riverine nutrient inputs. Third, the model representations of marine biogeochemical processes might be too simple to capture realistic nutrient cycles, surface production, and water column and benthic processes in continental shelf regions (Martiny et al., 2019). Fourth, we used only 13 ESMS to examine future changes and their diversity, such that each positive and negative group has three and four ESMs, respectively. This small sample may lead to model-dependent results, which prevent us from drawing unambiguous conclusions. These limitations should be considered when interpreting our results and further study is needed to improve these limitations.
Data availability statement
The original contributions presented in the study are included in the article/Supplementary Material. Further inquiries can be directed to the corresponding author.
Author contributions
D-GL compiled the data, conducted analyses, prepared the figures, and wrote the manuscript. J-SK designed the research and wrote the majority of the manuscript content. All authors contributed to the article and approved the submitted version.
Funding
This work was supported by research grants funded by the Korean Hydrographic and Oceanographic Agency (KHOA) and the National Research Foundation of Korea (NRF-2021M3I6A1086808 & NRF-2022R1A3B1077622).
Conflict of interest
The authors declare that the research was conducted in the absence of any commercial or financial relationships that could be construed as a potential conflict of interest.
Publisher’s note
All claims expressed in this article are solely those of the authors and do not necessarily represent those of their affiliated organizations, or those of the publisher, the editors and the reviewers. Any product that may be evaluated in this article, or claim that may be made by its manufacturer, is not guaranteed or endorsed by the publisher.
Supplementary material
The Supplementary Material for this article can be found online at: https://www.frontiersin.org/articles/10.3389/fmars.2023.1010341/full#supplementary-material
References
Beardall J., Stojkovic S., Larsen S. (2009). Living in a high CO 2 world: impacts of global climate change on marine phytoplankton. Plant Ecol. Divers. 2, 191–205. doi: 10.1080/17550870903271363
Behrenfeld M. J., O’Malley R. T., Siegel D. A., McClain C. R., Sarmiento J. L., Feldman G. C., et al. (2006). Climate-driven trends in contemporary ocean productivity. Nature 444, 752–755. doi: 10.1038/nature05317
Belkin I. M. (2009). Rapid warming of Large marine ecosystems. Prog. Oceanogr. 81, 207–213. doi: 10.1016/j.pocean.2009.04.011
Bopp L., Resplandy L., Orr J. C., Doney S. C., Dunne J. P., Gehlen M., et al. (2013). Multiple stressors of ocean ecosystems in the 21st century: projections with CMIP5 models. Biogeosciences 10, 6225–6245. doi: 10.5194/bg-10-6225-2013
Carton J. A., Chepurin G. A., Chen L. (2018). SODA3: A new ocean climate reanalysis. J. Clim. 31, 6967–6983. doi: 10.1175/jcli-d-18-0149.1
Chen C.-T. A. (1996). The kuroshio intermediate water is the major source of nutrients on the East China Sea continental shelf. Oceanol. Acta 19, 523–527. Available at: https://archimer.ifremer.fr/doc/00096/20722/.
Chen C. T. A., Huang T. H., Wu C. H., Yang H., Guo X. (2021). Variability of the nutrient stream near kuroshio’s origin. Sci. Rep. 11, 1–8. doi: 10.1038/s41598-021-84420-5
Chen C. T. A., Wang S. L. (1999). Carbon, alkalinity and nutrient budgets on the East China Sea continental shelf. J. Geophys. Res. Ocean. 104, 20,675-20,686. doi: 10.1029/1999JC900055
Chung S.-W., Jan S., Liu K.-K. (2001). 2000_Nutrient fluxex through the Taiwan strait in spring and summer 1999_Chung et al.pdf. J. Oceanogr. 57, 47–53. doi: 10.1023/A:1011122703552
Cloern J. E., Foster S. Q., Kleckner A. E. (2014). Phytoplankton primary production in the world’s estuarine-coastal ecosystems. Biogeosciences 11, 2477–2501. doi: 10.5194/bg-11-2477-2014
Eyring V., Bony S., Meehl G. A., Senior C. A., Stevens B., Stouffer R. J., et al. (2016). Overview of the coupled model intercomparison project phase 6 (CMIP6) experimental design and organization. Geosci. Model. Dev. 9, 1937–1958. doi: 10.5194/gmd-9-1937-2016
Friedlingstein P. (2015). Carbon cycle feedbacks and future climate change. Philos. Trans. R. Soc A Math. Phys. Eng. Sci. 373, 20140421. doi: 10.1098/rsta.2014.0421
Fu W., Randerson J. T., Keith Moore J. (2016). Climate change impacts on net primary production (NPP) and export production (EP) regulated by increasing stratification and phytoplankton community structure in the CMIP5 models. Biogeosciences 13, 5151–5170. doi: 10.5194/bg-13-5151-2016
Gong G. C., Chang J., Chiang K. P., Hsiung T. M., Hung C. C., Duan S. W., et al. (2006). Reduction of primary production and changing of nutrient ratio in the East China Sea: Effect of the three gorges dam? Geophys. Res. Lett. 33, 2–5. doi: 10.1029/2006GL025800
Gong G. C., Chen Y. L. L., Liu K. K. (1996). Chemical hydrography and chlorophyll a distribution in the East China Sea in summer: Implications in nutrient dynamics. Cont. Shelf Res. 16, 1561–1590. doi: 10.1016/0278-4343(96)00005-2
Gong G. C., Wen Y. H., Wang B. W., Liu G. J. (2003). Seasonal variation of chlorophyll a concentration, primary production and environmental conditions in the subtropical East China Sea. Deep. Res. Part II Top. Stud. Oceanogr. 50, 1219–1236. doi: 10.1016/S0967-0645(03)00019-5
He X., Bai Y., Pan D., Chen C. T. A., Cheng Q., Wang D., et al. (2013). Satellite views of the seasonal and interannual variability of phytoplankton blooms in the eastern China seas over the past 14 yr, (1998-2011). Biogeosciences 10, 4721–4739. doi: 10.5194/bg-10-4721-2013
Hecky R. E., Kilham P. (1988). Nutrient limitation of phytoplankton in freshwater and marine environments: A review of recent evidence on the effects of enrichment. Limnol. Oceanogr. 33, 796–822. doi: 10.4319/lo.1988.33.4part2.0796
Hsueh Y. (2000). The kuroshio in the East China Sea. J. Mar. Syst. 24, 131–139. doi: 10.1016/S0924-7963(99)00083-4
Huot Y., Babin M., Bruyant F., Grob C., Twardowski M. S., Claustre H. (2007). Does chlorophyll a provide the best index of phytoplankton biomass for primary productivity studies ? to cite this version : HAL Id : hal-00330232 does chlorophyll a provide the best index of phytoplankton biomass for primary productivity studies? Biogeosci. Discuss. 4, 707–745. doi: 10.5194/bgd-4-707-2007
Ichikawa H., Beardsley R. C. (2002). The current system in the yellow and East China seas. J. Oceanogr. 58, 77–92. doi: 10.1023/A:1015876701363
Käse L., Geuer J. K. (2018). Phytoplankton responses to marine climate change – an introduction. In Jungblut S., Liebich V., Bode M. eds. YOUMARES 8 – oceans across boundaries: learning from each other. (Cham, Switzerland: Springer). doi: 10.1007/978-3-319-93284-2
Kim D., Choi S. H., Kim K. H., Shim J. H., Yoo S., Kim C. H. (2009). Spatial and temporal variations in nutrient and chlorophyll-a concentrations in the northern East China Sea surrounding cheju island. Cont. Shelf Res. 29, 1426–1436. doi: 10.1016/j.csr.2009.03.012
Kim T.-W., Lee K., Najjar R. G., Jeong H.-D., Jeong H. J. (2011). Increasing n abundance in the northwestern pacific ocean due to atmospheric nitrogen deposition. Science 334, 505–509. doi: 10.1126/science.1206583
Kiyomoto Y., Iseki K., Okamura K. (2001). Ocean color satellite imagery and shipboard measurements of cholorophyll a and suspended particulate matter distributionin the East China Sea. J. Oceanogr. 57, 37–45. doi: 10.1023/A:1011170619482
Kwiatkowski L., Torres O., Bopp L., Aumont O., Chamberlain M., Christian J. R., et al. (2020). Twenty-first century ocean warming, acidification, deoxygenation, and upper-ocean nutrient and primary production decline from CMIP6 model projections. Biogeosciences 17, 3439–3470. doi: 10.5194/bg-17-3439-2020
Lee K., Matsuno T., Endoh T., Ishizaka J., Zhu Y., Takeda S., et al. (2017). A role of vertical mixing on nutrient supply into the subsurface chlorophyll maximum in the shelf region of the East China Sea. Cont. Shelf Res. 143, 139–150. doi: 10.1016/j.csr.2016.11.001
Lewandowska A. M., Boyce D. G., Hofmann M., Matthiessen B., Sommer U., Worm B. (2014). Effects of sea surface warming on marine plankton. Ecol. Lett. 17, 614–623. doi: 10.1111/ele.12265
Li G., Cheng L., Zhu J., Trenberth K. E., Mann M. E., Abraham J. P. (2020). Increasing ocean stratification over the past half-century. Nat. Clim. Change 10, 1116–1123. doi: 10.1038/s41558-020-00918-2
Liu Z., Gan J., Hu J., Wu H., Cai Z., Deng Y. (2021). Progress of studies on circulation dynamics in the East China Sea: The kuroshio exchanges with the shelf currents. Front. Mar. Sci. 8. doi: 10.3389/fmars.2021.620910
Liu X., Laws E. A., Xie Y., Wang L., Lin L., Huang B. (2019). Uncoupling of seasonal variations between phytoplankton chlorophyll a and production in the East China Sea. J Geophys Res.: Biogeosciences 124(7), 2400–2415. doi: 10.1029/2018JG004924
Liu S. M., Zhang J., Jiang W. S. (2003). Pore water nutrient regeneration in shallow coastal bohai Sea, China. J. Oceanogr. 59, 377–385. doi: 10.1023/A:1025576212927
Martiny A. C., Lomas M. W., Fu W., Boyd P. W., Chen Y., ling L., et al. (2019). Biogeochemical controls of surface ocean phosphate. Sci. Adv. 5, 1–10. doi: 10.1126/sciadv.aax0341
McCluskey E., Brewin R. J. W., Vanhellemont Q., Jones O., Cummings D., Tilstone G., et al. (2022). On the seasonal dynamics of phytoplankton chlorophyll-a concentration in nearshore and offshore waters of Plymouth, in the English channel: Enlisting the help of a surfer. Oceans 3, 125–146. doi: 10.3390/oceans3020011
Moon J. Y., Lee K., Lim W. A., Lee E., Dai M., Choi Y. H., et al. (2021). Anthropogenic nitrogen is changing the East China and yellow seas from being n deficient to being p deficient. Limnol. Oceanogr. 66, 914–924. doi: 10.1002/lno.11651
Moore C. M., Mills M. M., Arrigo K. R., Berman-Frank I., Bopp L., Boyd P. W., et al. (2013). Processes and patterns of oceanic nutrient limitation. Nat. Geosci. 6, 701–710. doi: 10.1038/ngeo1765
Murray N. J., Clemens R. S., Phinn S. R., Possingham H. P., Fuller R. A. (2014). Tracking the rapid loss of tidal wetlands in the yellow Sea. Front. Ecol. Environ. 12, 267–272. doi: 10.1890/130260
Noh K. M., Lim H. G., Kug J. S. (2022). Global chlorophyll responses to marine heatwaves in satellite ocean color. Environ. Res. Lett. 17(6), 064034. doi: 10.1088/1748-9326/ac70ec
Oh J. R., Choi H. K., Hong S. H., Yim U. H., Shim W. J., Kannan N. (2005). A preliminary report of persistent organochlorine pollutants in the yellow Sea. Mar. pollut. Bull. 50, 217–222. doi: 10.1016/j.marpolbul.2004.11.035
O’Neill B. C., Tebaldi C., van Vuuren D. P., Eyring V., Friedlingstein P., Hurtt G., et al. (2016). The scenario model intercomparison project (ScenarioMIP) for CMIP6. Geosci. Model. Dev. 9, 3461–3482. doi: 10.5194/gmd-9-3461-2016
Sasaki Y. N., Umeda C. (2021). Rapid warming of sea surface temperature along the kuroshio and the china coast in the East China sea during the twentieth century. J. Clim. 34, 4803–4815. doi: 10.1175/JCLI-D-20-0421.1
Shirota K., Okazaki Y., Konno S., Miyairi Y., Yokoyama Y., Kubota Y. (2021). Changes in surface water masses in the northern East China Sea since the last glacial maximum based on diatom assemblages. Prog. Earth Planet. Sci. 8, 1–17. doi: 10.1186/s40645-021-00456-1
Shi W., Wang M. (2012). Satellite views of the bohai Sea, yellow Sea, and East China Sea. Prog. Oceanogr. 104, 30–45. doi: 10.1016/j.pocean.2012.05.001
Tong Y., Zhao Y., Zhen G., Chi J., Liu X., Lu Y., et al. (2015). Nutrient loads flowing into coastal waters from the main rivers of China, (2006–2012). Sci. Rep. 5, 16678. doi: 10.1038/srep16678
Wang B., Wang X., Zhan R. (2003). Nutrient conditions in the yellow Sea and the East China Sea. Estuar. Coast. Shelf Sci. 58, 127–136. doi: 10.1016/S0272-7714(03)00067-2
Xie S.-P., Hafner J., Tanimoto Y., Liu W. T., Tokinaga H., Xu H. (2002). Bathymetric effect on the winter sea surface temperature and climate of the yellow and East China seas. Geophys. Res. Lett. 29, 81-1-81–4. doi: 10.1029/2002GL015884
Xu L., Wu D., Lin X., Ma C. (2009). The study of the yellow Sea warm current and its seasonal variability. J. Hydrodyn. 21, 159–165. doi: 10.1016/S1001-6058(08)60133-X
Yamaguchi H., Kim H. C., Son Y. B., Kim S. W., Okamura K., Kiyomoto Y., et al. (2012). Seasonal and summer interannual variations of SeaWiFS chlorophyll a in the yellow Sea and East China Sea. Prog. Oceanogr. 105, 22–29. doi: 10.1016/j.pocean.2012.04.004
Yang D., Huang R. X., Feng X., Qi J., Gao G., Yin B. (2020). Wind stress over the pacific ocean east of Japan drives the shelf circulation east of China. Cont. Shelf Res. 201, 104122. doi: 10.1016/j.csr.2020.104122
Yang D., Huang R. X., Yin B. S., Feng X. R., Chen H. Y., Qi J. F., et al. (2018). Topographic beta spiral and onshore intrusion of the kuroshio current. Geophys. Res. Lett. 45, 287–296. doi: 10.1002/2017GL076614
Yeh S. W., Kim C. H. (2010). Recent warming in the Yellow/East China Sea during winter and the associated atmospheric circulation. Cont. Shelf Res. 30, 1428–1434. doi: 10.1016/j.csr.2010.05.002
Yuan D., Zhu J., Li C., Hu D. (2008). Cross-shelf circulation in the yellow and East China seas indicated by MODIS satellite observations. J. Mar. Syst. 70, 134–149. doi: 10.1016/j.jmarsys.2007.04.002
Zhang J. (1996). Nutrient elements in large Chinese estuaries. Cont. Shelf Res. 16, 1023–1045. doi: 10.1016/0278-4343(95)00055-0
Zhang J., Guo X., Zhao L. (2019). Tracing external sources of nutrients in the East China Sea and evaluating their contributions to primary production. Prog. Oceanogr. 176, 102122. doi: 10.1016/j.pocean.2019.102122
Zhang Y., Huang Z., Fu D., Tsou J. Y., Jiang T., Liang X. S., et al. (2018). Monitoring of chlorophyll-a and sea surface silicate concentrations in the south part of cheju island in the East China sea using MODIS data. Int. J. Appl. Earth Obs. Geoinf. 67, 173–178. doi: 10.1016/j.jag.2018.01.017
Zhang J., Liu S. M., Ren J. L., Wu Y., Zhang G. L. (2007). Nutrient gradients from the eutrophic changjiang (Yangtze river) estuary to the oligotrophic kuroshio waters and re-evaluation of budgets for the East China Sea shelf. Prog. Oceanogr. 74, 449–478. doi: 10.1016/j.pocean.2007.04.019
Keywords: phytoplankton, chlorophyll, Yellow & East China Sea, Kuroshio Current (KC), global warming
Citation: Lee D-G, Oh J-H, Noh KM, Kwon EY, Kim YH and Kug J-S (2023) What controls the future phytoplankton change over the Yellow and East China Seas under global warming? Front. Mar. Sci. 10:1010341. doi: 10.3389/fmars.2023.1010341
Received: 03 August 2022; Accepted: 10 January 2023;
Published: 26 January 2023.
Edited by:
Alberto R. Piola, Naval Hydrography Service, ArgentinaReviewed by:
Yoshikazu Sasai, Japan Agency for Marine-Earth Science and Technology (JAMSTEC), JapanJun Sun, University of Geosciences Wuhan, China
Copyright © 2023 Lee, Oh, Noh, Kwon, Kim and Kug. This is an open-access article distributed under the terms of the Creative Commons Attribution License (CC BY). The use, distribution or reproduction in other forums is permitted, provided the original author(s) and the copyright owner(s) are credited and that the original publication in this journal is cited, in accordance with accepted academic practice. No use, distribution or reproduction is permitted which does not comply with these terms.
*Correspondence: Jong-Seong Kug, anNrdWdAcG9zdGVjaC5hYy5rcg==