 Natalia Petit-Marty
 Laura Casas
 Fran Saborido-Rey
- Department of Fisheries Ecology, Institute of Marine Research-Spanish National Research Council (IIM-CSIC), Vigo, Spain
An increasing number of studies using marine environmental DNA (eDNA) approaches are showing its potential application in marine fisheries management by helping and simplifying some of the labor-intensive traditional surveys required to assess exploited populations and ecosystem status. eDNA approaches (i.e. metabarcoding and targeted) can support to ecosystem-based fisheries management by providing information on species composition; surveillance of invasive, rare and/or endangered species; and providing estimates of species abundance. Due to these potential uses in fisheries and conservation sciences, the number of studies applying eDNA approaches in marine habitats has expanded in the very last few years. However, a lack of consistency across studies when applying pipelines for data analyses, makes results difficult to compare among them. Such lack of consistency is partially caused by poor knowledge in the management of raw sequences data, and analytical methods allowing comparative results. Hence, we review here the essential steps of eDNA data processing and analyses to get sound, reproducible, and comparable results, providing a set of bioinformatics tools useful for each step. Altogether this review presents the state of the art of eDNA data analyses towards a comprehensive application in fisheries management promoting sustainability.
1 Introduction
Management of marine fisheries requires a large amount of data collection. Such data include monitoring of fish stock abundance, biomass, and several life history parameters. Fisheries-independent research surveys based on capture or visual census of the fish species of interest provide a significant proportion of the data to assess commercial fish stocks. These surveys are complemented by studies determining maturity, fecundity, age and sex structure of the stocks. Moreover, fisheries-dependent data are also collected to monitor in situ fisheries accordingly to the authority’s regulation (Bradley et al., 2019; Urban et al., 2023). Altogether, these methods give essential information to assess the status of fisheries resources and to provide scientific advice on the best management strategies to achieve a sustainable exploitation.
At present, the effects of climate change (Pinsky et al., 2020) and the detected loss of marine biodiversity (Payne et al., 2016) impose new levels of complexities in the assessments of the sustainability of marine fisheries. Climate change is altering fish species distributions and likely accelerating adaptation events, potentially impacting species abundances and ecosystems structure (Perry et al., 2005; Gallego et al., 2020; Pinsky et al., 2020; Palacios-Abrantes et al., 2022). Moreover, the inception of ecosystem-based fisheries management (EBFM, (Pikitch et al., 2004)), highlights as crucial the evaluation of the effect of fishing operations on marine ecosystems. EBFM should ensure long-term productive, healthy, and resilient ecosystems. Thus, it is of maximum priority to characterize and monitor the ecosystem status at places where fishing operates, especially in ecosystems defined as vulnerable by FAO (2009). Hence, data collection to ensure sustainable management of fisheries is scaling up in complexity requiring specialized training and high budgets.
As fisheries science is urgently needing to collect an increasing amount of data to assess the long-term sustainability of fish resources, environmental DNA approaches (eDNA, Taberlet et al., 2012) have become a promising technology in simplifying survey tasks. Hence, studies using eDNA to investigate marine species richness, distribution, and abundance expanded in the very last years (reviewed Gilbey et al., 2021; Jo et al., 2022; Miya, 2022; Ramírez-Amaro et al., 2022; Rourke et al., 2022). eDNA refers to DNA that can be extracted from environmental samples (such as soil, water, or air), without first isolating any target organisms. It is characterized by a complex mixture of genomic DNA from many different organisms and by possible degradation (Taberlet et al., 2012). Environmental DNA can be classified into two types, organismal DNA, and extra-organismal DNA. The source of organismal DNA is from whole individuals most probably alive at the time of sampling, whereas extra-organismal DNA originates from a variety of sources such as part of tissue replacement, metabolic waste, gametes, etc. (Rodriguez-Ezpeleta et al., 2021). Thus, eDNA samples are composed of a complex mixture of both types of DNA (i.e., organismal and extra-organismal) from various sources and in varying proportions (Taberlet et al., 2012). This heterogeneity of eDNA samples provides for raw data to potentially answer wide-rank of scientific questions, though it also brings uncertainties at the time of interpreting and comparing results across studies.
Coupled with sequencing and laboratory technologies, the analysis of eDNA samples can be used to identify species and to characterize species communities associated with the environment from where the DNA was extracted. Basically, eDNA approaches are based on the extraction, amplification, and quantification of the DNA present in environmental samples. eDNA approaches can be divided into two main groups: (1) eDNA metabarcoding or community approach, and (2) species-specific or targeted approach (Seymour, 2019; Tsuji et al., 2019). Both strategies share the key characteristic of non-invasive indirect sampling but differ in their purpose, methodology, and interpretations. The current state of the art of sequencing and quantification technologies makes both eDNA approaches very powerful in helping sustainable marine fisheries surveys and monitoring (Gilbey et al., 2021; Ramírez-Amaro et al., 2022; Rourke et al., 2022). On the one hand, the metabarcoding or community eDNA approach is intended to characterize the species community living in a given environment (Alberdi et al., 2017). Therefore, it can greatly facilitate environmental monitoring surveys by providing data on species assemblages and changes in ecosystems where fishing operates. On the other hand, the targeted species-specific approach can inform on population dynamics such as geographical displacements and provide for quantitative estimates of abundance. In addition, intermediate approaches between targeted and metabarcoding eDNA approaches, are also being designed and implemented in aquatic ecosystems (e.g. Wilcox et al., 2020). Nevertheless, there are gaps in the knowledge of eDNA dynamics in the sea, which should be accounted for in a comprehensive implementation of eDNA approaches in fisheries data surveys.
Since the sea is a highly variable environment, and applications of eDNA cover a wide spectrum of scientific questions (Barnes & Turner, 2016), it is noted disparity among results of eDNA analyses. Such incongruencies have raised concerns on the potential applicability of eDNA surveys to help fisheries sustainable management (Hansen et al., 2018; Ramírez-Amaro et al., 2022). It has been highlighted that part of the disparate results found among studies could be explained by the heterogeneity across pipelines and bioinformatics tools used for data processing and analyses (Creedy et al., 2022). eDNA data analyses entail the knowledge of the analyzing algorithms and prior assumptions made by these. For example, the choice of the algorithm to classify taxonomically the composition of an environmental DNA sample, as well as the completeness of the reference database used for it, can have a significant impact on diversity estimates and should be made according to the goals of the study (Mathon et al., 2021, Liu and Zhang, 2021, Miya, 2022). Additionally, it is imperative to understand what are the limitations of each particular eDNA study with respect to the power of detection (Burian et al., 2021), especially when reporting the presence/absence or abundance of target species.
Several software, pipelines, and scripts exist to manage and analyze the thousands of millions of sequences obtained in a typical eDNA study. User-friendly bioinformatics tools for the analysis of eDNA allow for obtaining results without bioinformatics or computational knowledge. Nevertheless, understanding of every step of the analytical pipeline is relevant for the reliable and efficient application of eDNA approaches. When correctly applied, algorithms and models included within eDNA data analysis pipelines allow infer and, many times solve common errors related to eDNA approaches. Therefore, to know the state of the art of data analysis for eDNA approaches is of great importance before planning an eDNA study. Thus, the aim of this review is to present and explain the main analytical approaches used in eDNA studies towards to facilitate its application in helping fisheries’ sustainable management. This review expands and complements the review made by Ramírez-Amaro et al. (2022) included in this Research Topic Issue. Nevertheless, whereas Ramírez-Amaro et al. (2022) center on sampling and laboratory steps, here we focus on the next step: the analyses of the eDNA data.
2 eDNA Data analyses pipelines
Several tasks related to fisheries sustainable management can be supported by eDNA approaches: (1) Surveillance of rare (i.e. endangered) and invasive species, (2) Describing and monitoring Vulnerable Marine Ecosystems, (3) Monitoring fish assemblages, and (4) Quantifying biomass and/or abundance of target economically important species. Case-study examples of the applicability of both eDNA approaches to these four tasks are presented in BOX 1. eDNA metabarcoding can be used to describe species richness (e.g. in Leray and Knowlton, 2015; McClenaghan et al., 2020; Boulanger et al., 2021; Liu and Zhang, 2021; Sato et al., 2021; Yu et al., 2021; Fonseca et al., 2022; Good et al., 2022; Keck et al., 2022), surveillance of the presence/absence of target species such as invasive, or endangered (e.g. in Jerde et al., 2011; Boussarie et al., 2018; Holman et al., 2019; Bonfil et al., 2021; Manfrin et al., 2022), and monitor changes in species composition (e.g. in Stat et al., 2017; Jeunen et al., 2019; Gallego et al., 2020; Afzali et al., 2021; Gold et al., 2021; Russo et al., 2021; Stoeckle et al., 2021; Valdivia-Carrillo et al., 2021; West et al., 2021; Maiello et al., 2022). eDNA targeted approach is better suited for quantification of the abundance of target species (e.g. in Takahara et al., 2012; Lacoursière-Roussel et al., 2016; Yamamoto et al., 2016; Knudsen et al., 2019; Salter et al., 2019; Brys et al., 2021; Fukaya et al., 2021; Shelton et al., 2022; Urban et al., 2023), and therefore it could be applied in monitoring fish stocks and vulnerable species.
Data processing for eDNA metabarcoding requires several steps which include decision-making on the best algorithms to be used accordingly to the previous knowledge of the species community and the goal of the study, while for eDNA targeted approach it is simplified. Available, open-access bioinformatics tools with potential use for eDNA approaches in fisheries are listed in Supplementary Table 1.
Box 1. Case-study examples of four tasks required in sustainable management of marine fisheries
Task 1: Surveillance of rare species
Case-study: Environmental DNA illuminates the dark diversity of sharks.
Boussarie et al. (2018) used eDNA metabarcoding to detect shark species that are no longer detected by traditional surveys in habitats where they formerly occurred in New Caledonian. The authors performed eDNA sampling from a wide area encompassed by a gradient of human density. eDNA results were compared to visual censuses performed over more than 20 years, and data recorded by baited video over two years. An elasmobranch-specific COI primer set was used for the amplification of eDNA metabarcoding markers, and data analysis was performed with OBITools (Boyer et al., 2016), using a reference database with data retrieved from BOLD database (Hebert & Ratnasingham, 2007) for Elasmobranchii species. The reference database was enriched with homologous sequences from other non-elasmobranch taxa retrieved from the EMBL-EBI database by performing in silico PCR, to control for misidentification, given the short length of the amplified sequence (127bp). The Vegan R package (Dixon, 2003) was used for rarefaction analyses, followed by model fitting using the nls function in the stats package Models were fitted for the three methods independently (visual, video, and eDNA).
The results show that environmental DNA (eDNA) detected 44% more shark species than traditional underwater visual censuses and baited videos across the New Caledonian archipelago (south-western Pacific). eDNA analysis revealed the presence of previously unobserved shark species in human-impacted areas. The authors found that the main limitation of the method was the imperfect nature of currently available metabarcoding primers, which introduced a degree of uncertainty regarding the identification of certain species.
Task 2: Describing and monitoring Vulnerable Marine Ecosystems
Case-study: Detection of community-wide impacts of bottom trawl fishing on deep-sea assemblages using environmental DNA metabarcoding.
Good et al., 2022 assessed the impact of deep-sea trawling on open slope regions and marine canyons of the Mediterranean Sea for benthic meiofaunal species communities while assessing the power of eDNA metabarcoding in the detection of changes in species diversity richness and composition. The authors used different barcoding regions COI and 18S for targeting broad eukaryote diversity. eDNA samples from sediments were collected from five stations characterized by different levels of trawling impact, while meiofaunal samples were collected from two locations with different trawling activity. Data pre-processing and processing was performed using a combination of scripts and pipelines covering all standard steps. The taxonomic assignation of the Amplicon Sequence Variants (ASVs) was performed using the whole nucleotide database from NCBI, and the Vegan package (Dixon, 2003) was used to obtain rarefaction curves. Meiofaunal samples were classified by traditional methods.
The results indicated no effect of trawling on alpha diversity, but a significant effect on species composition by both methods (eDNA and meiofaunal surveys). Bryozoan taxa were only present at untrawled sites, suggesting this taxon could be used as trawling bioindicator. The main limitation of the study stems from a lack of reference databases. Therefore, the authors conclude that combining molecular and non-molecular methodologies remain the most holistic way to evaluate anthropogenic impacts, such as trawling, on benthic communities.
Task 3: Monitoring fish assemblages
Case-study: Trawl and eDNA assessment of marine fish diversity, seasonality, and relative abundance in coastal New Jersey, USA
Patterns of diversity, seasonality, and abundance of marine fish species were analyzed by Stoeckle & collaborators (2021) by concurrently performing trawl survey and eDNA sampling. The authors took advantage of a bottom trawl survey of marine fisheries and evaluated the performance of eDNA metabarcoding in the estimates of fish richness, composition, seasonality, and relative abundance. eDNA metabarcoding sequencing was performed using the mitochondrial 12S gene for a total of 136 samples replicated across seasons. Amplicon sequence variants (ASVs) were obtained using DADA2 (Callahan et al., 2016). Taxon assignments were based on 100% of sequence similarity to a 12S reference sequence of a regional fish database.
Results found: (i) Agreement in seasonal abundance for 70 percent of the fish species. Inconsistent detection was due to rare taxa detected by one or another survey in single eDNA samples or tows. (ii) increased sensitivity in species diversity index of seven orders of magnitude with respect to trawl survey. (iii) Concordance in species composition between the two survey methods was about 75%, and close to 100% for abundant species. (iv) eDNA species reads (log-scaled) significantly correlated (p<0.001) with species biomass, and more strongly with an allometric index calculated from biomass which depends on body size (R2 = 0.59, and 0.66, respectively). The authors conclude that eDNA approaches have potential to improve the management of fisheries and MPAs.
Task 4: Quantifying biomass and/or abundance of target economically important species
Case-study: Using eDNA to estimate biomass of bycatch in pelagic fisheries
Collecting fisheries-dependent bycatch data is particularly challenging in large industrial fisheries. Urban et al. (2023) used eDNA sampling and qPCR to determine the biomass of Atlantic mackerel (Scomber scombrus) bycatch in herring (Clupea harengus) catch. Recording catch composition is required twice by the fisheries authority; at first, onboard the ship and then after landing in the factory. The water of holdings tanks of fisheries vessels is unchanged from when the fishing operation ends until the catch is landed at a factory, providing an excellent source of eDNA from catch composition. Species-specific assays targeting both, herring and mackerel mitochondrial cytochrome b sequences were used for DNA quantification. eDNA-to-biomass models were established with experimental data (shedding and decay experiments) and then used to predict the biomass of mackerel in the catch.
The results indicated that fractions and/or weights of mackerel estimated with eDNA analyses were comparable to routinely used visual-based estimation metrics. The variation in biomass of bycatch mackerel estimated from eDNA samples was lower than that found among the two visual assessments (i.e. onboard the ship, and at the factory), and it is within the 10% variation allowed by regulatory authorities. The authors concluded that the eDNA-based approach is more precise and consistent in estimating catch fractions than the currently used methods.
3 eDNA metabarcoding
Metabarcoding refers to the amplification and sequencing of a DNA region, known as barcoding, simultaneously for a species community or taxonomic group. Most of the widely used barcoding regions belong to the mitochondrial genome. It is because mitochondria are present in multiple copies within cells and therefore are most likely to be amplified from environmental samples which contain low DNA content by species. PCR products are then sequenced by High Throughput Sequencing (HTS), commonly in Illumina platforms, and the obtained sequences are subsequently clustered by similarity, and then taxonomically classified.
The selection of the barcoding region to be obtained from an eDNA sample depends on the goal of the study as well as on the group of species intended to be surveyed. Universal primers for barcoding regions are designed to amplify taxonomically related species. The taxonomical assignment is performed by sequence identity searches against reference sequence databases. The quality of the results of the metabarcoding approach depends on the correct taxonomical assignments of the species present in an eDNA sample. Therefore, the correct selection of the barcoding region to be used and the completeness of the reference database are the keys, and also the main limitations of the metabarcoding approach (Miya, 2022).
Bioinformatics pipelines are the result of executing linked instructions to process a large amount of sequence data (often several hundred million reads) using scripts, software, and databases. Computational requirements for an eDNA metabarcoding data analysis will depend on the sampling magnitude, number of replicates, and goals of the study, though hundreds of gigabytes of data are expected from metabarcoding sequencing. Data analyses are mostly performed on Unix platforms, and in high-performance computing systems. However, pipelines such as PEMA (Zafeiropoulos et al., 2020) can be installed from regular computers to cloud or HPC environments. Processing times of different pipelines have been compared in Mathon et al., 2021. Requirements of any particular pipeline used in eDNA metabarcoding can be found in the source webpage listed in Supplementary Table 1.
Data analysis protocols should be adapted to the survey design and the ecological question under study (Alberdi et al., 2017; Zinger et al., 2019). However, independently of the particularities of each study, the metabarcoding data analyses pipeline has a number of common steps that are essential and summarized in Figure 1.
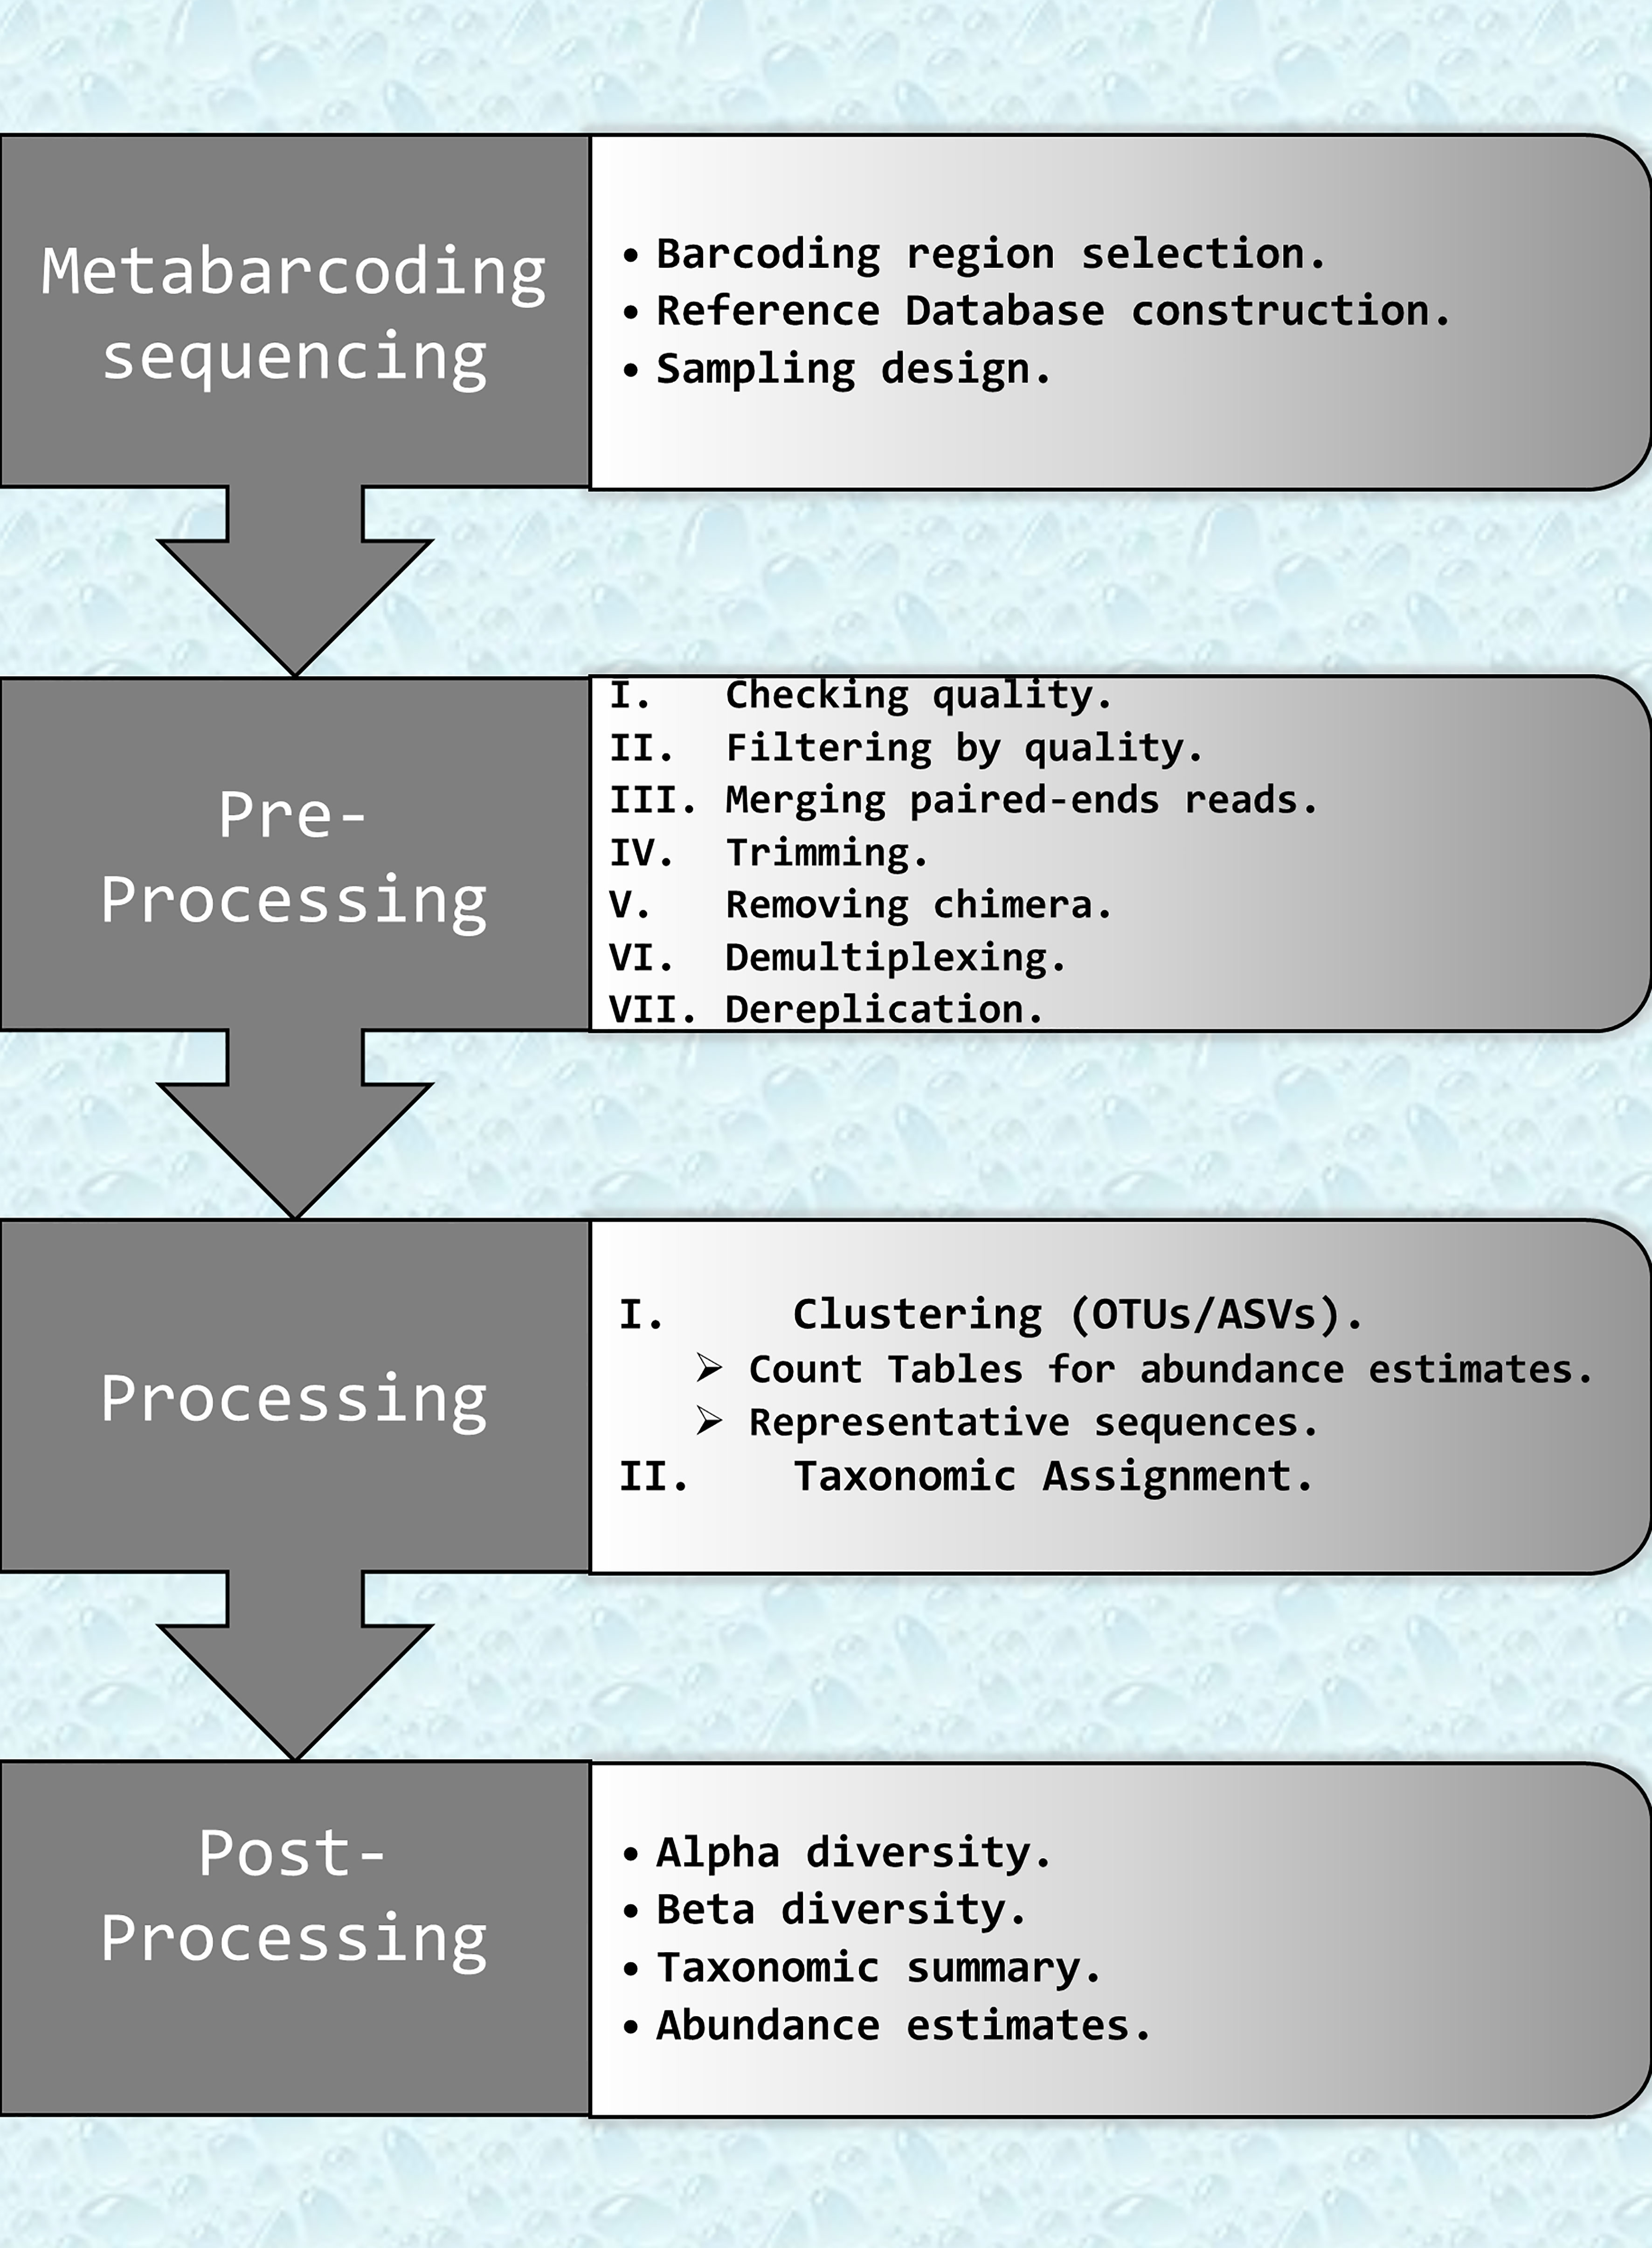
Figure 1 Flowchart describing the key bioinformatics steps required to analyze eDNA metabarcoding data. Steps are split in three parts: Pre-processing: filtering and correction raw data. Processing: clustering and taxonomic assignments; and Post-processing: statistical analysis and biodiversity index. OTUs, Organizational Taxonomic Units; ASVs, Amplicon Sequence Variants.
Because the first application of eDNA metabarcoding was for the study of microorganisms, there are very well-established packages for the study of microbial communities based on the 16S metabarcoding region, such as MOTHUR (Schloss et al., 2009), Qiime2 (Bolyen et al., 2019), USEARCH (Edgar, 2010), and RDP pipeline (Cole et al., 2014). However, the extended use of eDNA in conservation and marine sciences has produced an increasing number of additional bioinformatics tools as well as reference databases for the analysis of eukaryote taxonomic groups. Therefore, the list of tools provided in Supplementary Table 1 does not intend to conduct a systematic review of all existing metabarcoding pipelines. Instead, we focus on those that have been proven useful for the study of marine biodiversity and fish communities, are open access, and are well-documented.
To date, for the study of fish communities, MitoFish, MitoAnnotator, and MiFish pipelines constitute a key platform (Sato et al., 2018), OBITools (Boyer et al., 2016) and ANACAPA (Curd et al., 2019) pipelines have been tested offering reliable results for fish communities, while mBrave (Ratnasingham, 2019) linked to BOLD system platform (Ratnasingham and Hebert, 2007), and Meta-Fish-Lib (Collins et al., 2021) are powerful tools to increase the knowledge in fish biodiversity surveys. Most of the pipelines presented in Supplementary Table 1 do not perform all steps needed to perform a complete eDNA metabarcoding analysis. However, most of them are modular allowing users to run different modules separately and choose better options according to their case study. Independently of the analytical protocol, the steps described below are essential in any eDNA metabarcoding analyses.
3.1 Pre-processing: filtering raw data
The first steps of the bioinformatic pathway to analyze eDNA metabarcoding data are aimed to correct errors that can be introduced during DNA amplification and sequencing. The goal of pre-processing steps is to end up with a dataset composed of high-quality sequences that can be clustered and taxonomically assigned.
3.1.1 Checking the raw data quality profiles
HTS technologies produce massive amounts of data requiring multiple computationally intensive steps before performing an appropriate taxonomic assignment analysis. Commonly, raw files are generated in FASTQ format, a text file including the obtained DNA sequences (i.e. reads) and quality values encoded as ASCII characters associated with each base of the sequence. Commonly, reads are of 100-150 nucleotide length, and these can be single-end or paired-end depending on whether only one DNA strand or both are sequenced, respectively. For paired-end sequencing, two files per sample with the same number of reads are generated, corresponding to the forward (R1) and reverse (R2) reads.
The reads-associated quality values are produced using the light intensity signal of each base call during the sequencing process. These quality scores are then translated into a Phred score using a modified version of the Phred algorithm (Ewing et al., 1998). Phred scores, are defined as the probability of error when calling a nucleotide base (A, C, T, or G) during the sequencing process, and are used for the control of the quality of the eDNA sequences. The quality of the reads can be obtained by using freely available software packages, such as FASTQC (Andrews, 2014) or FASTP (Chen et al., 2018). Both tools perform a primary check of the quality of all raw reads in a dataset through evaluation of different parameters such as the number of sequences, sequence length, GC content, presence of adaptors, ambiguous bases, overrepresented k-mers, and duplicated reads content. Visualizing and checking the quality scores from raw data is essential to set appropriate cut-off levels during further pre-processing steps and is fundamental for optimal downstream analysis.
3.1.2 Filtering by sequence quality
Typically, an average quality score (Q) of a read below 20 is considered low, and these sequences should be eliminated from the analysis. Moreover, sequencing accuracy decays with the sequence length and, accordingly, the 3’ end of reads usually presents lower quality scores. Hence, it is recommended to trim the end of the forward and reverse reads based on their phred score to remove low-quality positions (typically Q20). This trimming can be performed by several programs, such as the trimmer tool of FASTQX-toolkit (https://hannonlab.cshl.edu/fastx_toolkit/), FastQC (Andrews, 2014), FastP (Chen et al., 2018), or Trimmomatic (Bolger et al., 2014).
3.1.3 Merging paired-end reads
This step should be performed if paired-end sequencing was obtained. Forward and reverse data files need to be combined into a single file to generate a complete amplicon sequence. Crucial parameters to perform merging of forward and reverse reads are the choice of the algorithm, the presence of gaps in the alignment, or the minimum overlapping length (Taberlet et al., 2018). Algorithms for merging paired-end reads are implemented in different software packages, such as PEAR (Zhang et al., 2014), PANDAseq (Masella et al., 2012), FLASH (Magoč & Salzberg, 2011), or the illuminapairedend algorithm in OBITools (Boyer et al., 2016).
3.1.4 Trimming PCR primers and filtering by length
It is mandatory to remove the primers used in the eDNA metabarcoding experiment from every read. Primer sequences are usually removed using two approaches: (i) by allowing zero or a small number of mismatches between the sequence of the primers and the raw reads, with software packages such as Cutadapt (Martin, 2011) or (ii) by trimming the length of forward and reverse primers from the 5’ -end and 3’ -end of the sequences, respectively, using Trimmomatic (Bolger et al., 2014). Moreover, in most eDNA metabarcoding studies, only sequences within the expected length range of the amplified genomic region used are kept to reduce error rates in the dataset (Deiner et al., 2017). This can be done by setting a minimum and/or maximum length command with Cutadapt (Martin, 2011).
3.1.5 Removing chimeric sequences
Chimeric sequences are PCR artifacts made up of two or more sequences that have been erroneously combined during the extension step of the PCR amplification. The removal of chimeras has been identified as an essential quality control step to increase the diversity estimation accuracy (Alberdi et al., 2017; Deiner et al., 2017). Strategies for chimera detection are based on the comparison of all the sequences present in the dataset between themselves, in order to detect if any of them is derived from the 5’ -end of one parent sequence and the 3’ -end of another. Detection and removal of chimeras are implemented in several pipelines such as DADA2 (Callahan et al., 2016) and VSEARCH (Rognes et al., 2016), MIFISH (Sato et al., 2018), and BARQUE (Mathon et al., 2021). However, parameters used in the removal of chimeras during the bioinformatic pipeline could sometimes eliminate species that are actually present in the sample, so it is advisable to compare the results obtained with and without chimera removal.
3.1.6 Demultiplexing
Before pooling together eDNA samples for sequencing, a unique sequence named barcode is ligated to the genetic material of each individual sample. Then, the barcode information is used to allocate the sequence to their corresponding sample in a process known as demultiplexing. Different tools have been developed to this end as SABRE (https://github.com/najoshi/sabre), or FLEXBAR (Dodt et al., 2012), and it is also implemented in OBITools (ngsfilter, Boyer et al., 2016), eDNAFlow (Mousavi-Derazmahalleh et al., 2021), and SLIM (Dufresne et al., 2019).
3.1.7 Dereplication
Given that sequences obtained from eDNA samples contain different representations of species and/or individuals within the same species, it is needed to collapse strictly identical sequencing reads into unique sequences. This process is known as dereplication. It can be carried out in OBITools (Boyer et al., 2016) using the obiuniq command, or in VSEARCH (Rognes et al., 2016) using the –derep_fulllength or –derep_prefix scripts, and also in DADA2 (Callahan et al., 2016) and SWARM (Mahé et al., 2015). The abundance of identical sequences in each sample is tracked in the output file, information that is subsequently used to generate a count table after the clustering analyses.
3.2 Processing data: taxonomic assignment
The taxonomic assignment is key in the eDNA metabarcoding approach, and it is split into two steps: clustering and searching taxonomic identity in the reference databases.
3.2.1 Clustering
Clustering of the sequences by similarity is performed in order to split intra- from inter-specific genetic variability (Alberdi et al., 2017). However, a lack of knowledge on the expected spectrum of DNA sequence variation among and within species makes the selection of the clustering algorithm a critical step to get confident results. Different algorithms to perform the clustering have been proposed and evaluated, and the selection should be based on the study goals and the existing knowledge of the environment being analyzed (Xiong and Zhan, 2018).
Sequence clustering can be reference-based or de novo. Reference-based clustering is straightforward always that the reference database is complete enough, and the barcoding sequence has enough power to differentiate species. Clustering de novo entails grouping all sequences among themselves into clusters and assigning taxonomically the representative sequences.
The clustering algorithms most frequently used are based on generating clusters of sequences, named molecular Operational Taxonomic Units (OTUs). OTUs group sequences differing by less than a previously defined threshold, commonly set among 3 to 5% of sequence variation. Nevertheless, the imposed threshold of sequence similarity used is frequently arbitrary if the variability in DNA sequences of the target species community is unknown. Thus, it could produce misidentification of species if the threshold is set high or a lack of detection if it is too low. Therefore, other clustering methods have been developed without the need for a threshold of sequence similarity such as the Bayesian clustering algorithm of CROP (Hao et al., 2011) or the iterative growth process used in SWARM (Mahé et al., 2015b). These alternatives to OTUs, use Amplicon Sequence Variants (ASVs, Eren et al., 2013), also known as Exact Sequence Variants (ESVs), or zero-radius OTUs (ZOTUs).
Different from OTUs, ASVs are constructed by a de novo process grouping the sequences contained in the dataset by minimizing the number of differing nucleotides, frequently to one single difference. Therefore, all biological variation is captured in ASVs and results can be compared between different studies. ASVs algorithms are implemented in several software and pipelines such as DADA2 (Callahan et al., 2016), SLIM (Dufresne et al., 2019), ANACAPA toolkit (Curd et al., 2019), eDNAFlow (Mousavi-Derazmahalleh et al., 2021), and PEMA (Zafeiropoulos et al., 2020).
An overview of the open-access bioinformatics tools implementing the four most common clustering algorithms: VSEARCH (Rognes et al., 2016), SWARM (Mahé et al., 2015), CROP (Hao et al., 2011) and DADA2 (Callahan et al., 2016) are presented in Table 1. Moreover, LULU (Frøslev et al., 2017), is an algorithm specially designed for removing erroneous OTUs improving the accuracy of species diversity statistics estimates based on similarity thresholds.
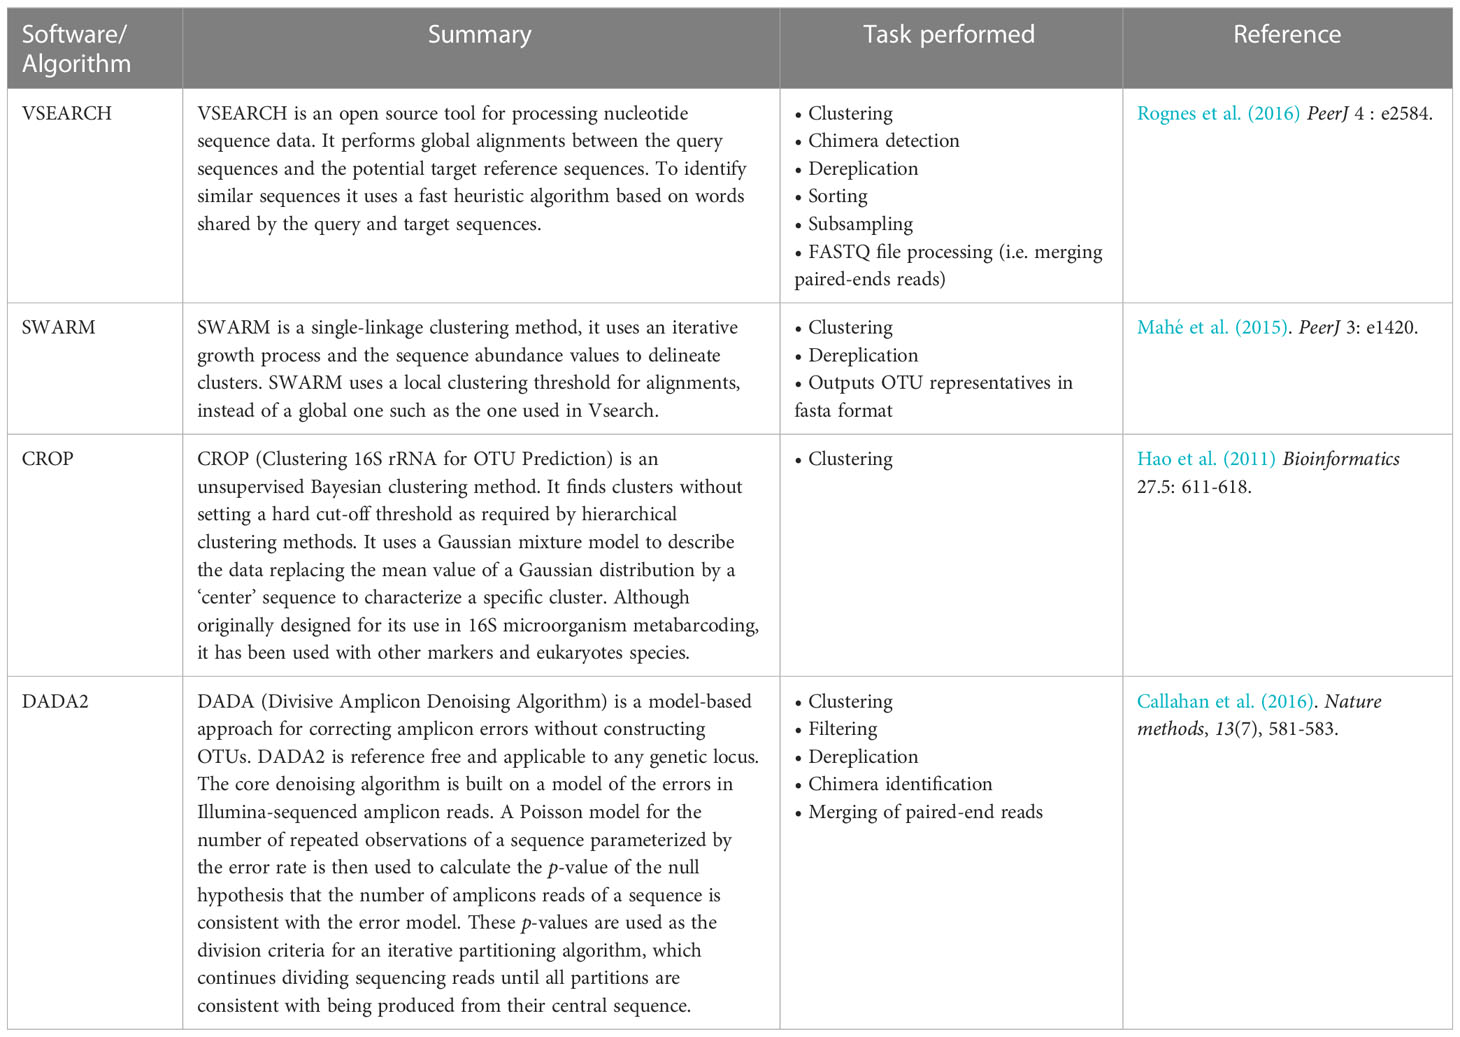
Table 1 Most common algorithms used for the clustering step in metabarcoding eDNA analyses.
3.2.2 Taxonomic assignment
Several DNA regions are used as targets for HTS taxonomic identification using the eDNA metabarcoding approach in eukaryotes. Among the most widely used DNA regions are the ribosomal RNA genes (rRNA 12S/18S/28S), the internal transcribed spacer (ITS), and the Cytochrome oxidase subunit I (COI) mitochondrial gene. However, the use of one or another depends on the species groups under study, and the power of each one should be assessed when planning the study. Different studies recommend the use of more than one DNA region to increase the power of species detection (Kumar et al., 2022).
The taxonomic identification of OTUs/ASVs is one of the crucial steps in the pipeline and can be accomplished using different approaches: (i) the similarity-based method performs an alignment against all sequences of the reference database to assign taxonomy to a query sequence, and it is performed by BLAST (Altschul et al., 1990) or BOLD (for COI sequences, (Ratnasingham & Hebert, 2007)) algorithms; (ii) the phylogeny-based approach, implemented in pipelines such as SAP (Munch et al., 2008), pplacer (Matsen et al., 2010), or EPA-ng (Barbera et al., 2019), estimates the similarity between the query sequence and the reference sequences by analyzing the position of the query sequence in the phylogenetic tree generated for the reference database; and (iii) the composition-based method scores query sequences against the reference database and assigns the taxonomy based on the pattern of scores obtained, and it is implemented by the script ecotag in OBITools (Boyer et al., 2016)
As the goal of eDNA metabarcoding studies is to characterize the community of species living in a given environment, the quality and completeness of the reference databases used for taxonomic assignment is one of the crucial points to avoid false negative results (Miya, 2022). The best option is to build an ad hoc database containing the sequences of species inhabiting the area under study (e.g. in Boulanger et al., 2021; Gold et al., 2021), which requires an extra survey effort in marine environments where species composition is not fully characterized, or unknown. It is the most important for the description and surveillance of Marine Vulnerable Ecosystems, including invertebrate species which are poorly characterized molecularly (Miya, 2022).
For eDNA metabarcoding of fish species assemblages, reference databases are mostly complete if not at species levels, at least in high taxonomic categories such as genera or family. Moreover, for commercially important fish species monitored in fisheries management programs, biological material to build up sequences databases is available from research surveys, port landings, and markets. Thus, for fish species valued in markets, reference databases’ incompleteness is not a limiting issue.
Universal primers for barcoding teleost fish are already available (Ivanova et al., 2007; Sato et al., 2018), as well as several databases specifically dedicated to teleosts, such as MitoFish (Sato et al., 2018) and Phylofish (Pasquier et al., 2016). To date, for fish species the two more frequently used barcoding regions are 12S and COI. Nowadays, it is possible to retrieve barcoding reference sequences of 25,924 fish species (i.e. 24,724 teleost and 1,200 Elasmobranchii) from BOLD systems (Ratnasingham and Hebert, 2007) and 8,523 from MIFISH database (Miya, 2022). Thus, using the COI mitochondrial gene potentially allows for the detection of approximately 70% out of the nearly 34,000 described fish species, though the length of the obtained COI sequences should be extended to avoid misidentifications (Collins et al., 2021). However, rRNA-related barcoding regions are preferred when different groups of species are intended to be surveyed from the eDNA sample (Miya, 2022), as these have the potential to differentiate wider taxonomic groups using the more common short reads metabarcoding sequencing. Additionally, bioinformatic tools for building up custom reference databases are available, allowing mining and retrieving barcoding sequences of species of interest from big sequences reference databases. The ANACAPA toolkit’s (Curd et al., 2019) first module, CRUX, construct custom reference databases for user-defined primers by querying public databases such as NCBI’s nucleotide database (Benson et al., 2013), and Meta-Fish-Lib (Collins et al., 2021) is a pipeline designed to retrieve mitochondrial DNA sequence data for a given list of fish species.
3.3 Post-processing and diversity statistics
Refining the distribution of sequences in the final count table is imperative to reduce the impact of false positives in further analyses. False positives are mainly due to external contamination, occurred in the laboratory, or internal contamination in the sequencing process (Taberlet et al., 2018).
External contaminations can be detected through the incorporation of controls during the processing of samples, such as negative DNA extractions (i.e. DNA extraction from storage/extraction buffers used in the field) or negative PCR controls. Internal contaminations are mainly due to the miss-assignment of indices during library preparation, sequencing, and/or demultiplexing steps, that causes the allocation of a low percentage of sequences of a sample to other samples. Additionally, due to miscalled bases during sequencing, OTUs/ASVs with a small number of sequences appear randomly spread through the count table. Therefore, error-correction in the count table (singletons and rare OTUs/ASVs) prior to starting biological interpretation is recommended in eDNA metabarcoding experiments. A summary of all potential source of errors in an eDNA processing workflow, as well as potential solutions to avoid these can be found in Zinger et al., 2019.
Different bioinformatics tools can also be used to minimize and correct false positive errors in eDNA metabarcoding analyses. DADA2 (Callahan et al., 2016) generates a parametric error model that is trained on each sequencing run and then applies that model to correct and collapse the sequence into ASVs. Deblur (Supplementary Table 1), computes error profiles to obtain putative error-free sequences from Illumina MiSeq and HiSeq. LULU (Frøslev et al, 2017) collapses erroneous OTUs/ASVs into their parents to remove them from the dataset. Finally, the R package microDecon (McKnight et al., 2019), uses the proportions of contaminant OTUs/ASVs in negative blank samples to identify and remove erroneous sequences from the eDNA metabarcoding datasets.
3.3.1 Alpha diversity patterns
Alpha-diversity analyses use the number of OTUs/ASVs sequences assigned to a taxonomic level at each sampling location. Different approaches are followed to accommodate differences in sampling effort and diversity coverages (McKnight et al., 2019). Rarefaction curves are used to check whether the sequencing depth obtained is sufficient to retrieve most of the species diversity present in the environmental samples. Rarefaction curves can be obtained by using the Vegan R package (Dixon, 2003). Alpha diversity indexes are frequently integrated within available eDNA metabarcoding pipelines (see Supplementary Table 1) or can be performed separately using TTT (Macher et al., 2021) or Vegan R package (Dixon, 2003).
3.3.2 Beta diversity patterns
Beta diversity can be defined as the variability in species composition among sampling units for a given area. Thus, it is different from alpha diversity as two groups can have identical species richness indexes, but different species compositions. Similar to alpha-diversity, beta-diversity analyses are frequently included in pipelines (See Supplementary Table 1) or can be obtained by using TTT (Macher et al., 2021) or Vegan R package (Dixon, 2003).
3.4 Quantitative monitoring of biodiversity
The quantification of the abundance of the detected species in an eDNA sample adds very valuable information to eDNA metabarcoding analyses. The quantitative relationship between species abundance and the amount of DNA present in the environment has been explored in seawater samples. It has been shown a significant positive correlation between trawl catches or visual census and estimated eDNA abundances (e.g. in Thomsen et al., 2016; Doi et al., 2017; Tillotson et al., 2018, Levi et al., 2019, Fukaya et al., 2021, Afzali et al., 2021; Russo et al., 2021; Sato et al., 2021; Stoeckle et al., 2021; Maiello et al., 2022). Nonetheless, many studies also report high uncertainty in these estimations, mainly due to the lack of knowledge on the dynamics of eDNA in marine environments (i.e. process-based models see point 3. e.g. Lacoursière-Roussel et al., 2016, Sepúlveda et al., 2021; Nakagawa et al., 2022), and the poor knowledge on the probability of detection in eDNA metabarcoding approaches (i.e. occupancy and process models, see point 3, e.g. Doi et al., 2019; Fukaya et al., 2021). A modelling framework for eDNA metabarcoding data, allowing for all key sources of variation, error and noise in the data-generating process, has been proposed by Diana et al. (2022). Inference is performed using MCMC and can be used to estimate within-species biomass changes across sites and to link those changes to environmental covariates, while accounting for between-species and between-sites correlation. The modelling framework is available across the eDNAPLUS R script (Supplementary Table 1). However, currently, there is a consensus indicating that quantitative measures of species abundance are better achieved by using the targeted eDNA approach.
4 Targeted eDNA
The second category of eDNA approaches involves species-specific techniques that use assays tailored to target DNA fragments of particular species in an environmental sample. When designed stringently and after thorough validation, these are highly reliable and often effectively linked to the biomass and abundance of the target organism (e.g. in Takahara et al., 2012; Doi et al., 2015; Lacoursière-Roussel et al., 2016; Yamamoto et al., 2016; Capo et al., 2019; Knudsen et al., 2019; Salter et al., 2019; LeBlanc et al., 2020; Brys et al., 2021; Fukaya et al., 2021; Shelton et al., 2022; Kasmi et al., 2023; Urban et al., 2023). Nowadays, the main technique used in species-specific detection of environmental samples is real-time quantitative PCR (qPCR). However, other PCR relate-techniques such as digital PCR can also be used. The workflow of data analyses for the targeted eDNA approach is presented in Figure 2.
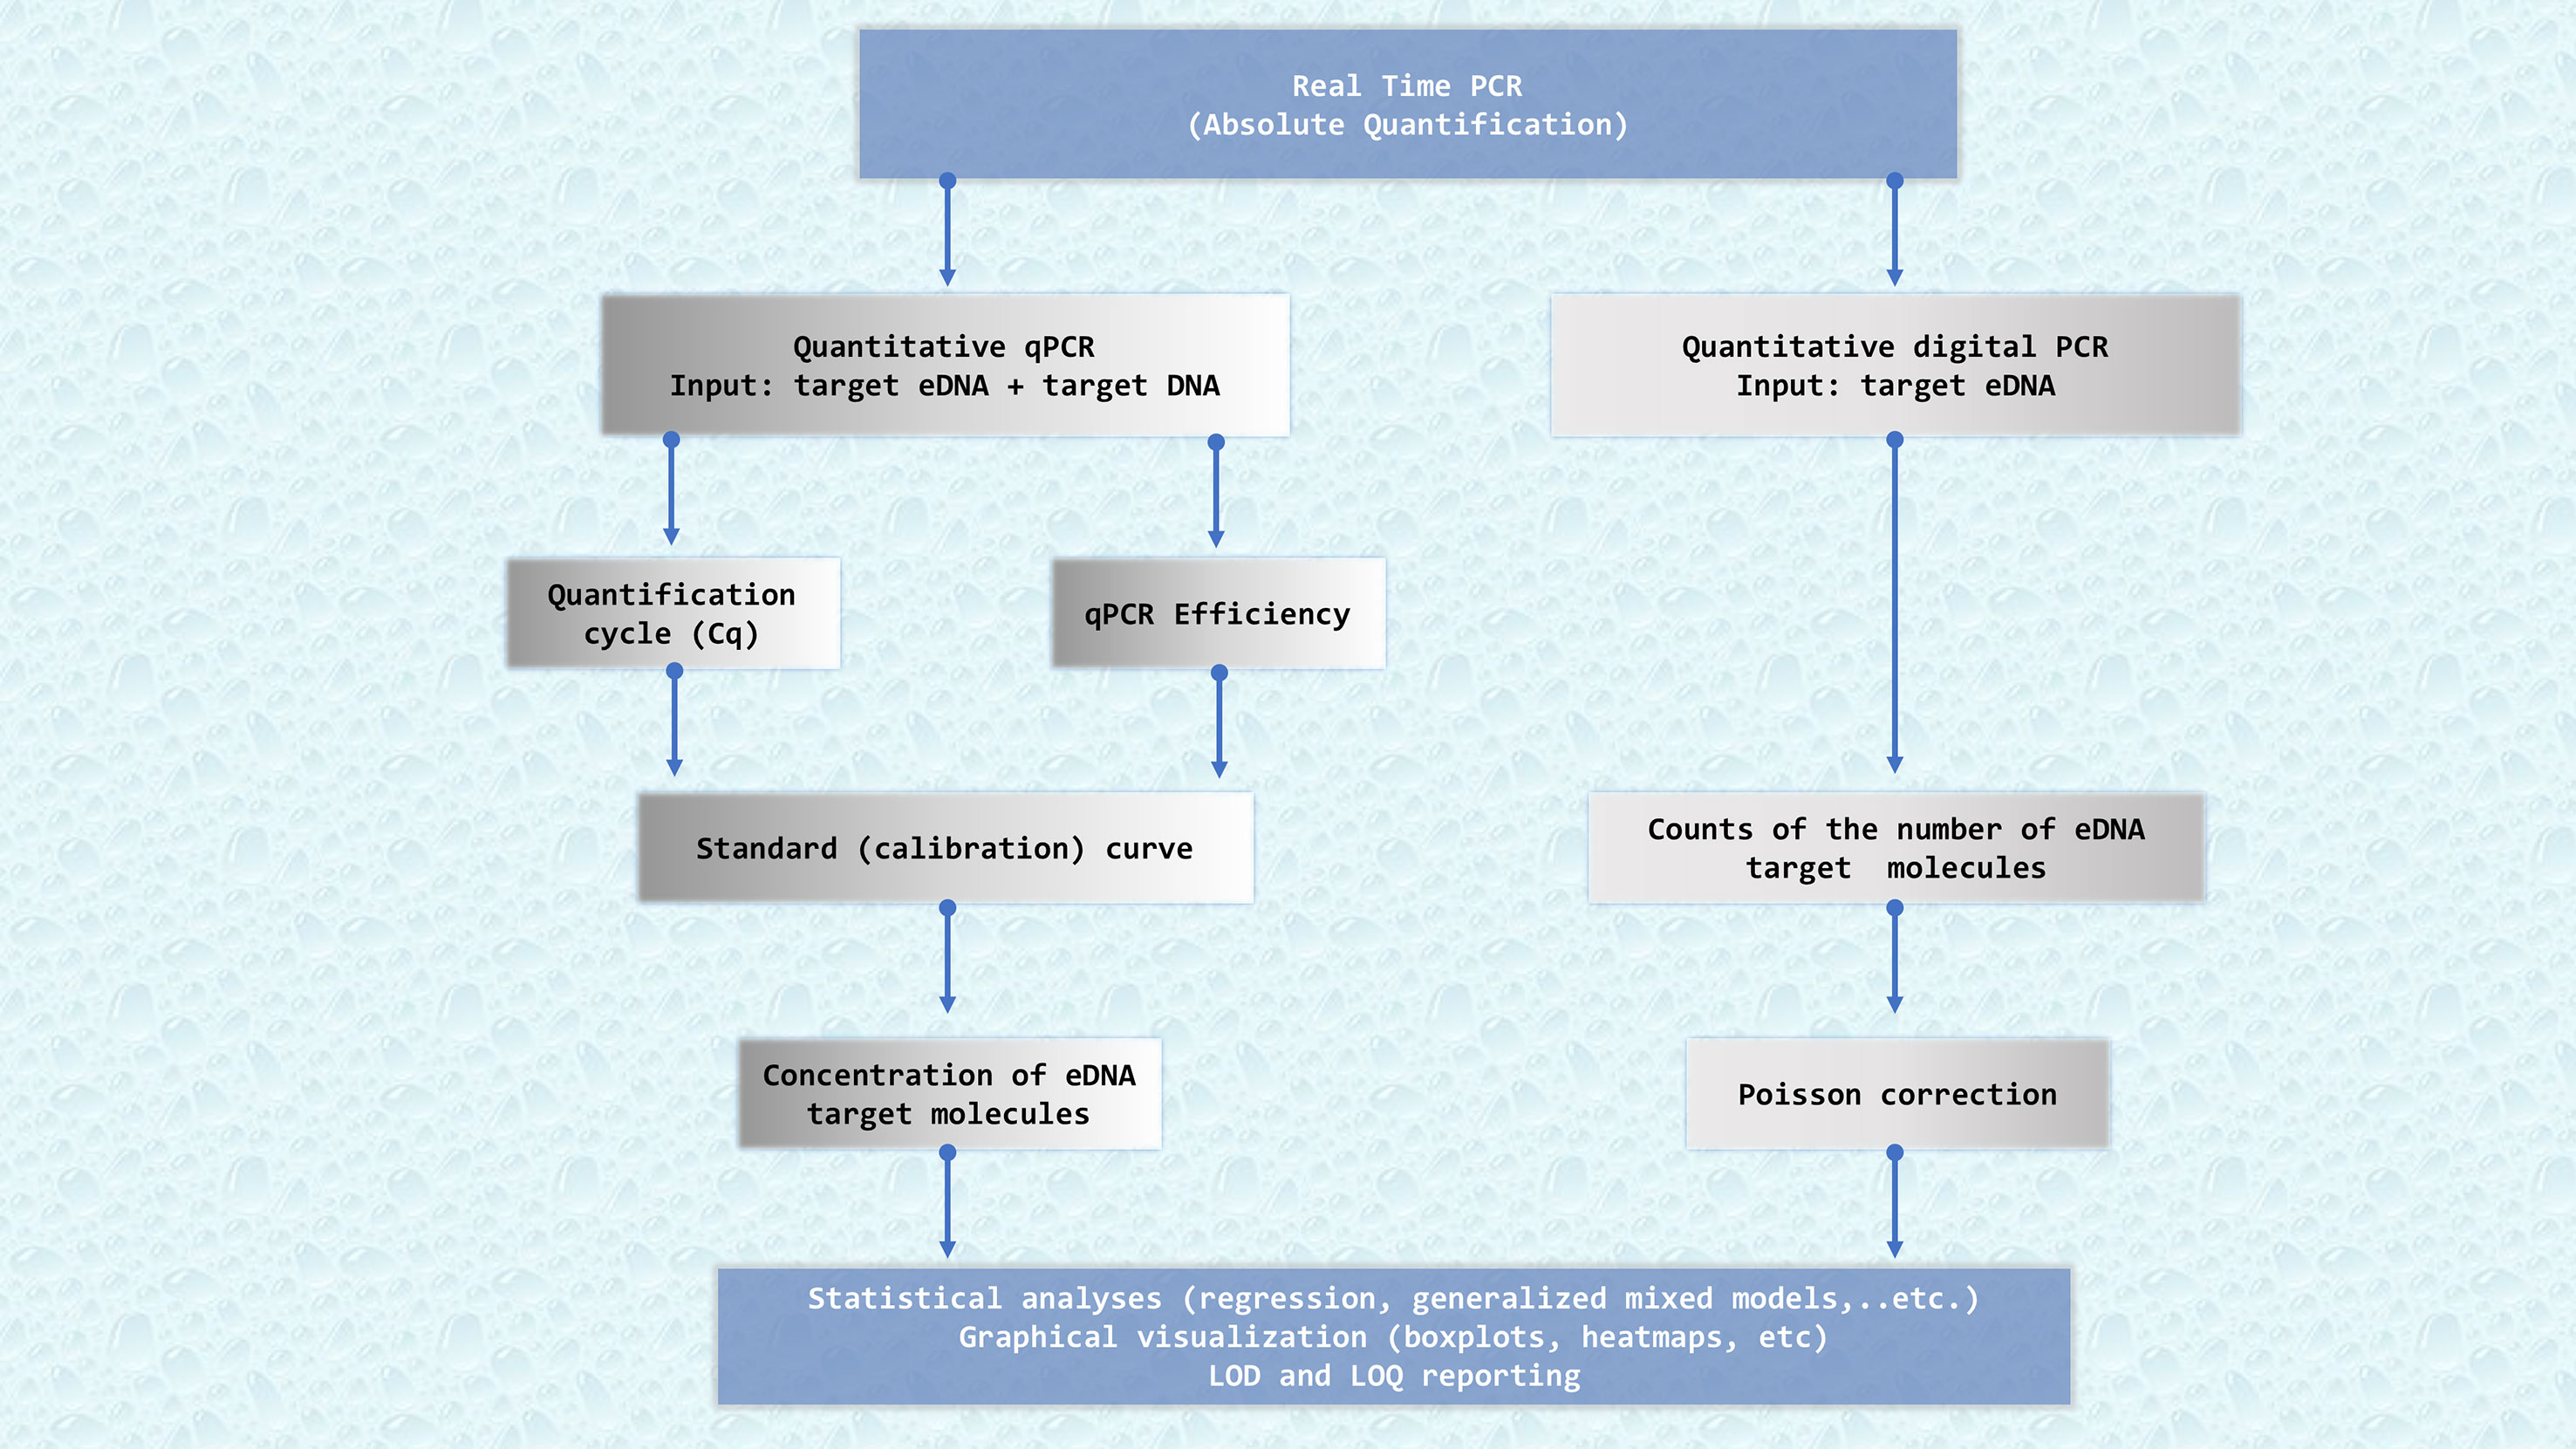
Figure 2 Flowchart describing the key bioinformatics steps required to get successful results quantifying eDNA from marine samples. qPCR: real-time quantitative PCR, dPCR: digital PCR. Quantification of eDNA samples by qPCR needs a standard calibration curve, whereas digital PCR directly counts eDNA target molecules splitting the PCR reaction in tiny volumes. Cq: quantification cycle, a PCR cycle at which the accumulating PCR products’ fluorescence reaches a pre-established threshold. Efficiency, which measures the overall performance of the qPCR. A standard curve is obtained by plotting Cq values versus DNA concentration for different dilutions of a target DNA sample of known concentration. LOD, Limit of Detection. LOQ, Limit of Quantification.
4.1 Real-time quantitative PCR
Real-time quantitative PCR or qPCR is a technique capable of detecting and quantifying tiny amounts of DNA present in a sample by contrasting the data obtained to a standard curve. Different from the original PCR method, qPCR measures DNA amplification by fluorescence signals as the reaction progresses in real-time. The quantification of the target DNA of a qPCR experiment is performed by measuring the emission of a fluorescent reporter dye that binds to the DNA in each amplification cycle. Thus, the initial amounts of DNA templates in a sample can be quantified by comparing the number of amplification cycles required to reach a particular threshold of fluorescence signal. Hence, the number of PCR cycles will be negatively related to the starting concentration of the target DNA (Kubista et al., 2006). Therefore, the most significant parameter derived from a qPCR experiment is the quantification cycle (Cq), which can be defined as a PCR cycle at which the accumulating PCR products’ fluorescence reaches a pre-established threshold.
A standard curve is obtained by plotting Cq values versus DNA concentration for different dilutions of a target DNA sample of known concentration. The standard curves are used to calibrate the qPCR and interpolate the data from the target samples with unknown concentrations collected in the environment.
The rate at which new amplicons are generated is the qPCR Efficiency, which measures the overall performance of the qPCR. An efficiency of 100% means that target DNA molecules double at each cycle. Typical efficiencies range from 90 to 110%. Efficiency values below or above the aforementioned range mean that the chosen qPCR conditions are not optimal (e.g. inefficient primer design, presence of PCR inhibitors, excessive amounts of starting DNA, or incorrect annealing temperature). Efficiency is calculated from the standard curve as E= 10-1/slope – 1.
In order to get comparative results among qPCR studies it is necessary to report the relevant experimental conditions. Bustin et al. (2009) provide guidelines for the Minimum Information for the publication of Quantitative Real-Time PCR experiments (MIQE). Moreover, for eDNA quantitative results it is advised to report the assay Limit of Detection (LOD) and the assay Limit of Quantification (LOQ). LOD and LOQ are defined as the lowest standard concentration of template DNA that produced at least 95% positive replicates, and the lowest standard concentration that could be quantified with a CV value below 35%; respectively (Klymus et al. (2020); see Section 4.4 for more details).
4.2 Absolute quantification of target eDNA
The first step to getting absolute quantification is the generation of a standard curve for each run of qPCR. The standard curve is obtained using a DNA sample with a known concentration from the target species to be analysed (e.g DNA extracted from a small piece of tissue). These standard DNA samples are serially diluted to generate a minimum of five samples with decreasing DNA concentrations, and then added in triplicate to the qPCR assay and amplified jointly with the eDNA samples of unknown concentration (Yamamoto et al., 2016; Itakura et al., 2019). Usually, thermal cyclers can hold a plate containing up to 96 samples in a single run. Therefore, if more plates are needed for a given study, a unique standard curve should be generated for each run and also for each target species. Once the Cq values for the standard curve are obtained, these are plotted against the logarithm of the starting concentrations, which produce a linear relationship with a negative slope. With this standard curve, Cq data for the unknown eDNA samples are interpolated to obtain eDNA concentration of the target species. Most real-time thermal cyclers include proprietary software that performs these types of analyses automatically. Additionally, there is a wide range of software for the different raw data analyses that have been exhaustively reviewed by Pabinger et al., 2014.
4.3 Digital PCR techniques
Similar to qPCR, digital PCR (dPCR) allows for the quantification of minimal amounts of DNA, but it does not require a standard curve for quantification. Thus, quantification is possible even when a standard sample is not available. Moreover, eliminating calibration curves also eliminates a potential source of errors.
In a dPCR, the reaction mixture is split into a large number of separate tiny volumes, such that there is one or no target molecule present in any individual reaction. Currently, available commercial systems can generate up to ten thousand (Bio-Rad, Life Technologies), nearly fifty thousand (Standard BioTools), and ten million (RainDance) partitions per experiment (Pabinger et al., 2014). Therefore, each reaction becomes binary (i.e. presence/absence) and these discrete signals are counted. Obtaining target eDNA concentration values from a dPCR experiment is made directly by the software implemented in the machine. The data that this system generates is gathered from a binary signal that, after applying a Poisson correction to consider partitions with more than one molecule, can be used to directly count the number of targets eDNA molecules in the original sample.
Comparisons between qPCR and dPCR methods has shown the later to be more tolerant to PCR inhibition. Therefore, the obtained concentration estimates are less biased and, consequently, the correlation between eDNA concentration versus abundance or biomass should be stronger. There are few studies relying exclusively on dPCR for the estimation of target species abundance or biomass, likely as the technology is still expensive for its wide use (e.g. in Marx, 2014; Doi et al., 2015; Capo et al., 2019; Brys et al., 2021; Manfrin et al., 2022).
4.4 Getting standard measures for comparative studies: LOD and LOQ
eDNA samples contain low concentrations of target DNA, thus, the ability of an assay to detect and quantify these low concentrations of DNAs is of the most importance. Klymus et al. (2020) presented a simple method based on discrete thresholds for determining the LOD and LOQ for an eDNA qPCR assay. LOD determines how many copies of target DNA can be detected with 95% of confidence in a qPCR reaction. Thus, LOD describes the ability of an assay to detect target DNA, which is key in monitoring rare species based on detection/nondetection. While LOQ determines which is the minimum number of target DNA copies quantifiable in a qPCR reaction with defined precision, which is of the maximum importance when the goal of a study is quantifying biomass or abundance. LOD and LOQ can also be obtained by a curve-fitting modelling method, which is recommended to avoid rigorous testing of a large number of different DNA concentrations. Multiple models can be evaluated to select the best for each assessed dataset. LOD and LOQ can be estimated using the R script qPCR LOD CALC (Merkes et al., 2019, Supplementary Table 1)
4.5 Correlating eDNA concentration with abundance or biomass
Different studies focused on correlating abundances or biomass with eDNA concentration use diverse statistical methods for their analysis. Most studies find that the residual errors do not follow a normal distribution and need, therefore, to be first log-transformed in order to improve the homogeneity of the variance (Thomsen et al., 2016; Knudsen et al., 2019; Murakami et al., 2019). The statistical model used greatly depends on the experimental design and the data obtained. For studies dealing with just two variables (abundance or biomass and eDNA concentration), the statistical method of choice is either type II linear regression (Takahara et al., 2012; Doi et al., 2015; Knudsen et al., 2019) or type I regression (Yamamoto et al., 2016). Studies also considering the different variables that may be having an influence on eDNA concentration (such as temperature or salinity) use linear mixed-effects models (Itakura et al., 2019) or generalized linear models (Thomsen et al., 2016; Tillotson et al., 2018; Knudsen et al., 2019). However, Kasmi et al. (2023) found differences in the relationship between eDNA copies and biomass depending on the statistical methods, getting better results when using Gaussian Process Regression (GPR), neural network and non-linear regression model, than with simple regression models.
High correspondence between abundance or biomass estimated from traditional and eDNA methods have been found (eg. Shelton et al., 2022; Kasmi et al., 2023; Urban et al., 2023). However, natural environmental conditions (e.g. Lacoursière-Roussel et al., 2016) and species-specific characteristics such as eDNA shed and decay (Urban et al., 2023), are source of uncertainty and need to be considered in results interpretation. Nevertheless, occupancy and process-based modelling can help to better interpret eDNA quantification results obtained from natural environments (See Section 5).
5 Results interpretation: occupancy and process-based models
When assessments of species distribution are carried out, it is imperative to understand what are the limitations of the survey methods used. Similarly to all survey methods, detection (or lack of detection) of species by eDNA sampling is not free of errors (see Burian et al., 2021 for a review of potential sources of error of eDNA-based methods). A particular species might not be detected even if it is present in the environment (i.e. false negative), or it can be erroneously detected even when absent (i.e. false positive). Therefore, it is most important to understand the level of error that the particular eDNA survey presents, to make sound and consistent interpretations.
As commented in section 3.3.3 several bioinformatics tools help to filter out false positive errors in eDNA metabarcoding studies. However, it is important to consider the rate of false negative results too, especially when the goal of the study is to monitor a group of target species (i.e. by metabarcoding) or single target species. False negative detection can be produced because enzymatic inhibition, or eDNA for a species was not collected within the sample, or it is in such a low concentration that became undetectable or because of the sensitivity of PCR (Ficetola et al., 2015). To avoid missing detection of taxa that are actually present (false negatives), multiple extractions and amplifications of the same samples are often performed (Ficetola et al., 2015; McClenaghan et al., 2020). Moreover, increasing sequencing depth can also improve the rates of detection (McClenaghan et al., 2020; Fukaya et al., 2021).
Currently, it is becoming common and advisable to interpret surveys based on eDNA within an occupancy modelling framework. Occupancy modelling allows estimating the probability of detection of a given species in a given environment (Griffin et al., 2020). Occupancy modelling can be applied to eDNA metabarcoding (i.e. Doi et al., 2019; McClenaghan et al., 2020, Valdivia-Carrillo et al., 2021), and in targeted eDNA approach (Dorazio and Erickson, 2018, Fukaya et al., 2021; Buxton et al., 2022). Appropriate data for fitting an Occupancy Site model consist of a series of samples obtained from S sampling sites, with K replicate samples obtained per site (Dorazio and Erickson, 2018). Models have been developed allowing for multiscale occupancy models to be applied accounting for both positive and negative errors at the field and laboratory stages (Griffin et al., 2020). Occupancy models successfully estimated true prevalence, detection probability, and false-positive rates, and their performance increased with the number of replicates (Ficetola et al., 2015). Thus, the occupancy modelling framework can be also applied to study the optimal conditions for sampling and laboratory stages (Doi et al., 2019). Modelling is frequently performed by Bayesian inference, and modeled parameters can include environmental and experimental covariates (Guillera-Arroita et al., 2017; McClenaghan et al., 2020; Burian et al., 2021; Buxton et al., 2022).
Other origins of uncertainty in the results of surveys of eDNA, especially for quantitative results, come from the dynamics of concentrations of eDNA at the sampling places (Burian et al., 2021). The amount of DNA shed into the environment by a particular species can be different from another, the biomass of an adult fish can be the same as hundred juvenile individuals of the same species; while environmental characteristics can make DNA rapidly degraded or transported by oceanic currents (Hansen et al., 2018). Process-based models are based on a mechanistic understanding of the dynamics of eDNA concentrations in the environment and can help in accounting for these sources of false positive and false negative results (Burian et al., 2021). eDNA studies have been favourably augmented in precision when accounting for eDNA transport shed and decay (e.g. Collins et al., 2021, Murakami et al., 2019; Kirtane et al., 2021; Urban et al., 2023). The experimental output, informs on the expected rates of detection or lack of it in the eDNA survey and can be integrated as prior information within the occupancy modelling framework.
Occupancy modelling can be performed using the eDNA SHINY APP (Diana et al., 2021), or the R script EDNAOCCUPANCY (Dorazio and Erickson, 2018).
6 Ten good practices in eDNA metabarcoding and targeted dPCR/qPCR data analyses
I. Make good planning of sampling (i.e. number of sites, replicates by sites, PCR replicates, amplicon sequencing depth), and use simulations to infer the probability of detection and number of replications.
II. Compile all the information available on the species or ecosystems to be surveyed, combining eDNA with traditional survey methodologies to get more confident results.
III. Follow strictly the pre-processing steps of eDNA metabarcoding data analyses pipelines.
IV. Assess the completeness of reference databases and choose the adequate clustering and taxonomic assignment algorithms accordingly to available data, and to the goal of the study.
V. Perform post-processing filtering of OTUS/ASVs to eliminate most of the possible sources of false positives produced in the laboratory.
VI. Estimate LOD and LOQ when performing qPCR assays, reporting these for comparative results among studies.
VII. Assess the probability of detection of the species of interest at both field and laboratory stages.
VIII. Research the eDNA dynamics (i.e. shed, decay, and transport) regarding your target species/ecosystem.
IX. Do not make conclusions about species absence without performing points V for the targeted eDNA approach, and VI and VII for both eDNA methods.
X. Conclusions on true species detection should be made only when using a robust protocol (e.g. including an appropriate number of positive replicates).
7 Final considerations
As sequencing and quantitative technologies grow, the applications of eDNA approaches also do. To date, automatic sequencing robots are already available to process eDNA in situ within aquatic environments (Sepulveda et al., 2020), and long-read sequencing of eDNA enhances taxonomic assignments opening also the possibility to estimate population genetics parameters at the same time (Sigsgaard et al., 2020; Tsuji et al., 2020). Bioinformatics tools to analyze the different data from eDNA sampling are growing along with the sequencing technologies, and are not a limiting issue in the application of eDNA approaches. The increasing number of eDNA studies published in the very last few years reflects both the simplicity of the method to potentially answer different scientific questions, and the need to simplify costly surveys traditionally used in ecological sciences. However, this diversity of studies with different analytical approaches makes it difficult to navigate the bibliography for a systematic implementation of eDNA approaches in the sustainable management of fisheries. Here, we show the state of the art of data analyses with the available bioinformatics tools proven to be useful for avoiding common mistakes in processing, analyzing, and interpreting results based on eDNA samples.
Across different studies referenced here, it seems clear that both eDNA approaches (metabarcoding and targeted) suffer uncertainty regarding detection probabilities. This uncertainty can be at least partially improved by: (i) designing eDNA sampling with enough numbers of sample replications, and sampling sites, and covering seasonal variance; (ii) getting PCR and amplicon sequencing replications, (iii) getting enough amplicon coverage, and (iv) by using occupancy and process-based modelling. This is particularly important in the application of eDNA approaches to surveillance of rare species (e.g. endangered), which are prone to suffer from uncertainties for the low probability of detection (Ficetola et al., 2015, but see Boussarie et al., 2018 in BOX 1-TASK 1). Major complexities are found in the application of eDNA approaches to surveillance of Marine Vulnerable Ecosystems, as many of them are poorly described, and therefore, reference databases are incomplete (e.g. Good et al., 2022, see BOX 1-TASK 2). In this regard, complementing and comparing eDNA sampling with traditional surveys such as visual census and video recording is necessary (e.g. Boussarie et al., 2018; Good et al., 2022). Nevertheless, the molecular characterization of the relevant invertebrate species of Vulnerable Ecosystems will be necessary for reference databases to be complete before monitoring can be systematically implemented. On this point, the use of different primer sets and different genomics regions gives more complete results (Good et al., 2022; Kumar et al., 2022). However, the use of eDNA approaches are giving promising results when monitoring Marine Protected Areas (MPA) (eg. Gold et al., 2021). Ecosystems within MPA are generally well described making the implementation of eDNA approaches augmented by prior knowledge. Similarly, barcoding regions have been obtained for thousands of fish species, and especially for economically important ones making that monitoring of fish communities does not present obvious methodological or analytical difficulties. Thus, the research on the limitations of the eDNA approaches for the study of target fish species (i.e. commercial) and fish communities are less challenging to be accomplished (Keck et al., 2022). Reference databases enriched with sequences of fish species locally known increase the likelihood of detection (e.g. Stoeckle et al., 2021, see BOX 1- TASK 3) and it is advisable when monitoring fish communities.Moreover, uncertainties about detection probabilities are decreased when DNA studies are performed in fisheries-related conditions (e.g. Russo et al., 2021; Stoeckle et al., 2021; Maiello et al., 2022; Kasmi et al., 2023, and Urban et al., 2023 presented in BOX 1- TASK 4).
In summary, eDNA approaches are showing realistic results for tasks related to fish abundance quantification and monitoring. Nonetheless, its use in ecosystem-based fisheries management could be delayed until reference databases of vulnerable marine ecosystems are completed. Several studies referenced here have demonstrated the feasibility of applying eDNA approaches to support tasks related to sustainable fisheries management. Given the urgent need of promoting sustainability in fisheries management, the extensive amount of data collection required for this, and the rapid scientific advances improving eDNA data analysis, it is likely that eDNA approaches can be incorporated within fisheries-related tasks in the nearby future.
Author’s note
The information and views set out in this publication are those of the authors and do not necessarily reflect the official opinion of CINEA or of the European Commission. Neither CINEA nor the European Commission can guarantee the accuracy of the scientific data/information collected under the above Specific Contract or the data/information included in this publication. Neither CINEA nor the European Commission or any person acting on their behalf may be held responsible for the use which may be made of the information contained therein.
Author contributions
NP-M, LC and FS-R wrote, edited and reviewed the manuscript. All authors approved the submitted version.
Funding
The information and views set out in this manuscript are based on scientific data and information collected under Service Contract “Improving cost-efficiency of fisheries research surveys and fish stocks assessments using next-generation genetic sequencing methods [EMFF/2018/015]” signed with the European Climate, Infrastructure and Environment Executive Agency (CINEA) and funded by the European Union. NP-M is supported by MSCA-PF FishAdapt 101066785.
Acknowledgments
The authors would like to express their gratitude to Gary Carvalho, Laszlo Orban and Allan Tucker for their advice and expert revision of the State-of-the-Art review in which this manuscript is based on. We also acknowledge the good suggestions of the reviewers on the first version of this manuscript, which improved it in both content and quality.
Conflict of interest
The authors declare that the research was conducted in the absence of any commercial or financial relationships that could be construed as a potential conflict of interest.
Publisher’s note
All claims expressed in this article are solely those of the authors and do not necessarily represent those of their affiliated organizations, or those of the publisher, the editors and the reviewers. Any product that may be evaluated in this article, or claim that may be made by its manufacturer, is not guaranteed or endorsed by the publisher.
Supplementary material
The Supplementary Material for this article can be found online at: https://www.frontiersin.org/articles/10.3389/fmars.2023.1061530/full#supplementary-material
References
Afzali S. F., Bourdages H., Laporte M., Mérot C., Normandeau E., Audet C., et al. (2021). Comparing environmental metabarcoding and trawling survey of demersal fish communities in the gulf of st. Lawrence, Canada. Environ. DNA 3 (1), 22–42. doi: 10.1002/edn3.111
Alberdi A., Aizpurua O., Gilbert M. T. P., Bohmann K. (2017). Scrutinizing key steps for reliable metabarcoding of environmental samples. Methods Ecol. Evol. 9, 134–147. doi: 10.1111/2041-210X.12849
Altschul S. F., Gish W., Miller W., Myers E. W., Lipman D. J. (1990). Basic local alignment search tool. J. Mol. Biol. 215, 403–410. doi: 10.1016/S0022-2836(05)80360-2
Andrews S. (2014) FastQC a quality-control tool for high-throughput sequence data. Available at: https://www.bioinformatics.babraham.ac.uk/projects/fastqc/.
Barbera P., Kozlov A. M., Czech L., Morel B., Darriba D., Flouri T., et al. (2019). EPA-Ng: massively parallel evolutionary placement of genetic sequences. Systematic Biol. 682), 365–369. doi: 10.1093/sysbio/syy054
Barnes M. A., Turner C. R. (2016). The ecology of environmental DNA and implications for conservation genetics. Conserv. Genet. 17 (1), 1–17. doi: 10.1007/s10592-015-0775-4
Benson D. A., Cavanaugh M., Clark K., Karsch-Mizrachi I., Lipman D. J., Ostell J., et al. (2013). GenBank. Nucleic Acids Res. 41, D36–D42. doi: 10.1093/nar/gks1195
Bolger A. M., Lohse M., Usadel B. (2014). Trimmomatic: A flexible trimmer for illumina sequence data. Bioinformatics 30, 2114–2120. doi: 10.1093/bioinformatics/btu170
Bolyen E., Rideout J. R., Dillon M. R., Bokulich N. A., Abnet C. C., Al-Ghalith G. A., et al. (2019). Reproducible, interactive, scalable and extensible microbiome data science using QIIME 2. Nat. Biotechnol. 37, 852–857. doi: 10.1038/s41587-019-0209-9
Bonfil R., Palacios-Barreto P., Vargas O. U. M., Ricaño-Soriano M., Díaz-Jaimes P. (2021). Detection of critically endangered marine species with dwindling populations in the wild using eDNA gives hope for sawfishes. Mar. Biol. 168 (5), 1–12. doi: 10.1007/s00227-021-03862-7
Boulanger E., Loiseau N., Valentini A., Arnal V., Boissery P., Dejean T., et al. (2021). Environmental DNA metabarcoding reveals and unpacks a biodiversity conservation paradox in Mediterranean marine reserves. Proc. R. Soc. B 288 (1949), 20210112. doi: 10.1098/rspb.2021.0112
Boussarie G., Bakker J., Wangensteen O. S., Mariani S., Bonnin L., Juhel J. B., et al. (2018). Environmental DNA illuminates the dark diversity of sharks. Sci. Adv. 4 (5), eaap9661. doi: 10.1126/sciadv.aap9661
Boyer F., Mercier C., Bonin A., Le Bras Y., Taberlet P., Coissac E. (2016). Obitools: A unix-inspired software package for DNA metabarcoding. Mol. Ecol. Resour. 161), 176–182. doi: 10.1111/1755-0998.12428
Bradley D., Merrifield M., Miller K. M., Lomonico S., Wilson J. R., Gleason M. G. (2019). Opportunities to improve fisheries management through innovative technology and advanced data systems. Fish Fisheries 20 (3), 564–583. doi: 10.1111/faf.12361
Brys R., Halfmaerten D., Neyrinck S., Mauvisseau Q., Auwerx J., Sweet M., et al. (2021). Reliable eDNA detection and quantification of the European weather loach (Misgurnus fossilis). J. Fish Biol. 98 (2), 399–414. doi: 10.1111/jfb.14315
Burian A., Mauvisseau Q., Bulling M., Domisch S., Qian S., Sweet M. (2021). Improving the reliability of eDNA data interpretation. Mol. Ecol. Resour. 21 (5), 1422–1433. doi: 10.1016/j.scitotenv.2020.144466
Bustin S. A., Benes V., Garson J. A., Hellemans J., Huggett J., Kubista M., et al. (2009). The MIQE guidelines: Minimum information for publication of quantitative real-time PCR experiments. Clin. Chem. 55, 611–622. doi: 10.1373/clinchem.2008.112797
Buxton A., Diana A., Matechou E., Griffin J., Griffiths R. A. (2022). Reliability of environmental DNA surveys to detect pond occupancy by newts at a national scale. Sci. Rep. 12 (1), 1295. doi: 10.1038/s41598-022-05442-1
Callahan B. J., McMurdie P. J., Rosen M. J., Han A. W., Johnson A. J. A., Holmes S. P. (2016). DADA2: high-resolution sample inference from illumina amplicon data. Nat. Methods 13, 581–583. doi: 10.1038/nmeth.3869
Capo E., Spong G., Norman S., Königsson H., Bartels P., Byström P. (2019). Droplet digital PCR assays for the quantification of brown trout (Salmo trutta) and Arctic char (Salvelinus alpinus) from environmental DNA collected in the water of mountain lakes. PloS One 14 (12), e0226638. doi: 10.1371/journal.pone.0226638
Chen S., Zhou Y., Chen Y., Gu J. (2018). Fastp: an ultra-fast all-in-one FASTQ preprocessor. Bioinformatics 34, i884–i890. doi: 10.1093/bioinformatics/bty560
Cole J. R., Wang Q., Fish J. A., Chai B., McGarrell D. M., Sun Y., et al. (2014). Ribosomal database project: data and tools for high throughput rRNA analysis. Nucleic Acids Res. 42, D633–D642. doi: 10.1093/nar/gkt1244
Collins R. A., Trauzzi G., Maltby K. M., Gibson T. I., Ratcliffe F. C., Hallam J., et al. (2021). Meta-Fish-Lib: A generalised, dynamic DNA reference library pipeline for metabarcoding of fishes. J. Fish Biol. 99 (4), 1446–1454. doi: 10.1111/jfb.14852
Creedy T. J., Andujar C., Meramveliotakis E., Noguerales V., Overcast I., Papadopoulou A., et al. (2022). Coming of age for COI metabarcoding of whole organism community DNA: towards bioinformatic harmonisation. Mol. Ecol. Resour. 22 (3), 847–861. doi: 10.1111/1755-0998.13502
Curd E. E., Gold Z., Kandlikar G. S., Gomer J., Ogden M., O'Connell T., et al. (2019). Anacapa toolkit: An environmental DNA toolkit for processing multilocus metabarcode datasets. Methods Ecol. Evol. 109), 1469–1475. doi: 10.1111/2041-210X.13214
Deiner K., Renshaw M. A., Li Y., Olds B. P., Lodge D. M., Pfrender M. E. (2017). Long-range PCR allows sequencing of mitochondrial genomes from environmental DNA. Methods Ecol. Evol. 8 (12), 1888–1898. doi: 10.1111/2041-210X.12836
Diana A., Matechou E., Griffin J. E., Buxton A. S., Griffiths R. A. (2021). An RShiny app for modelling environmental DNA data: accounting for false positive and false negative observation error. Ecography 44 (12), 1838–1844. doi: 10.1111/ecog.05718
Diana A., Matechou E., Griffin J., Yu D., Luo M., Tosa M., et al. (2022). eDNAPlus: A unifying modelling framework for DNA-based biodiversity monitoring. arXiv preprint. doi: 10.48550/arXiv.2211.12213
Dixon P. (2003). VEGAN, a package of r functions for community ecology. J. Vegetation Sci. 146, 927–930. doi: 10.1111/j.1654-1103.2003.tb02228.x
Dodt M., Roehr J. T., Ahmed R., Dieterich C. (2012). FLEXBAR–flexible barcode and adapter processing for next-generation sequencing platforms. Biology 13), 895–905. doi: 10.3390/biology1030895
Doi H., Akamatsu Y., Watanabe Y., Goto M., Inui R., Katano I., et al. (2017). Water sampling for environmental DNA surveys by using an unmanned aerial vehicle. Limnology Oceanogr: Methods 15 (11), 939–944. doi: 10.1002/lom3.10214
Doi H., Fukaya K., Oka S. I., Sato K., Kondoh M., Miya M. (2019). Evaluation of detection probabilities at the water-filtering and initial PCR steps in environmental DNA metabarcoding using a multispecies site occupancy model. Sci. Rep. 9 (1), 3581. doi: 10.1038/s41598-019-40233-1
Doi H., Uchii K., Takahara T., Matsuhashi S., Yamanaka H., Minamoto T. (2015). Use of droplet digital PCR for estimation of fish abundance and biomass in environmental DNA surveys. PloS One 10, e0122763. doi: 10.1371/journal.pone.0122763
Dorazio R. M., Erickson R. A. (2018). Ednaoccupancy: An r package for multiscale occupancy modelling of environmental DNA data. Mol. Ecol. Resour. 18 (2), 368–380. doi: 10.1111/1755-0998.12735
Dufresne Y., Lejzerowicz F., Apotheloz Perret-Gentil L., Pawlowski J., Cordier T. (2019). SLIM : a flexible web application for the reproducible processing of environmental DNA metabarcoding data. BMC Bioinf. 201, 88. doi: 10.1186/s12859-019-2663-2
Edgar R. C. (2010). Search and clustering orders of magnitude faster than BLAST. Bioinformatics 26 (19), 2460–2461. doi: 10.1093/bioinformatics/btq461
Eren A. M., Maignien L., Sul W. J., Murphy L. G., Grim S. L., Morrison H. G., et al. (2013). Oligotyping: differentiating between closely related microbial taxa using 16S rRNA gene data. Methods Ecol. Evol. 4 (12), 1111–1119. doi: 10.1111/2041-210X.12114
Ewing B., Hillier L., Wendl M. C., Green P. (1998). Base-calling of automated sequencer traces usingPhred. i. accuracy assessment. Genome Res. 8 (3), 175–185. doi: 10.1101/gr.8.3.175
FAO (2009). International guidelines for the management of deep-sea fisheries in the high seas (Rome: Food And Agriculture Organization Of The United Nations), 73. Available at: https://www.fao.org/3/i0816t/i0816t00.htm.
Ficetola G. F., Pansu J., Bonin A., Coissac E., Giguet-Covex C., De Barba M., et al. (2015). Replication levels, false presences and the estimation of the presence/absence from eDNA metabarcoding data. Mol. Ecol. Resour. 15 (3), 543–556. doi: 10.1111/1755-0998.12338
Fonseca V. G., Kirse A., Giebner H., Vause B. J., Drago T., Power D. M., et al. (2022). Metabarcoding the Antarctic peninsula biodiversity using a multi-gene approach. ISME Commun. 2 (1), 1–11. doi: 10.1038/s43705-022-00118-3
Frøslev T. G., Kjøller R., Bruun H. H., Ejrnæs R., Brunbjerg A. K., Pietroni C., et al. (2017). Algorithm for post-clustering curation of DNA amplicon data yields reliable biodiversity estimates. Nat. Commun. 8, 1188. doi: 10.1038/s41467-017-01312-x
Fukaya K., Murakami H., Yoon S., Minami K., Osada Y., Yamamoto S., et al. (2021). Estimating fish population abundance by integrating quantitative data on environmental DNA and hydrodynamic modelling. Mol. Ecol. 30 (13), 3057–3067. doi: 10.1111/mec.15530
Gallego R., Jacobs-Palmer E., Cribari K., Kelly R. P. (2020). Environmental DNA metabarcoding reveals winners and losers of global change in coastal waters. Proc. R. Soc. B 287 (1940), 20202424. doi: 10.1098/rspb.2020.2424
Gilbey J., Carvalho G., Castilho R., Coscia I., Coulson M. W., Dahle G., et al. (2021). Life in a drop: Sampling environmental DNA for marine fishery management and ecosystem monitoring. Mar. Policy 124, 104331. doi: 10.1016/j.marpol.2020.104331
Gold Z., Sprague J., Kushner D. J., Zerecero Marin E., Barber P. H. (2021). eDNA metabarcoding as a biomonitoring tool for marine protected areas. PloS One 16 (2), e0238557. doi: 10.1371/journal.pone.0238557
Good E., Holman L. E., Pusceddu A., Russo T., Rius M., Iacono C. L. (2022). Detection of community-wide impacts of bottom trawl fishing on deep-sea assemblages using environmental DNA metabarcoding. Mar. pollut. Bull. 183, 114062. doi: 10.1016/j.marpolbul.2022.114062
Griffin J. E., Matechou E., Buxton A. S., Bormpoudakis D., Griffiths R. A. (2020). Modelling environmental DNA data; Bayesian variable selection accounting for false positive and false negative errors. J. R. Stat. Soc. 69 (2), 377–392. doi: 10.1111/rssc.12390
Guillera-Arroita G., Lahoz-Monfort J. J., van Rooyen A. R., Weeks A. R., Tingley R. (2017). Dealing with false-positive and false-negative errors about species occurrence at multiple levels. Methods Ecol. Evol. 8 (9), 1081–1091. doi: 10.1111/2041-210X.12743
Hansen B. K., Bekkevold D., Clausen L. W., Nielsen E. E. (2018). The sceptical optimist: challenges and perspectives for the application of environmental DNA in marine fisheries. Fish Fisheries 19 (5), 751–768. doi: 10.1111/faf.12286
Hao X., Jiang R., Chen T. (2011). Clustering 16S rRNA for OTU prediction: a method of unsupervised Bayesian clustering. Bioinformatics 27 (5), 611–618. doi: 10.1093/bioinformatics/btq725
Holman L. E., de Bruyn M., Creer S., Carvalho G., Robidart J., Rius M. (2019). Detection of introduced and resident marine species using environmental DNA metabarcoding of sediment and water. Sci. Rep. 9 (1), 1–10. doi: 10.1038/s41598-019-47899-7
Itakura H., Wakiya R., Yamamoto S., Kaifu K., Sato T., Minamoto T. (2019). Environmental DNA analysis reveals the spatial distribution, abundance and biomass of Japanese eels at the river basin scale. Aquat. Conservation: Mar. Freshw. Ecosyst. 29, 361–363. doi: 10.1002/aqc.3058
Ivanova N. V., Zemlak T. S., Hanner R. H., Hebert P. D. (2007). Universal primer cocktails for fish DNA barcoding. Mol. Ecol. Notes 7 (4), 544–548. doi: 10.1111/j.1471-8286.2007.01748.x
Jerde C. L., Mahon A. R., Chadderton W. L., Lodge D. M. (2011). Sight-unseen detection of rare aquatic species using environmental DNA. Conserv. Lett. 4, 150–157. doi: 10.1111/j.1755-263X.2010.00158.x
Jeunen G. J., Knapp M., Spencer H. G., Lamare M. D., Taylor H. R., Stat M., et al. (2019). Environmental DNA (eDNA) metabarcoding reveals strong discrimination among diverse marine habitats connected by water movement. Mol. Ecol. Resour. 19 (2), 426–438. doi: 10.1111/1755-0998.12982
Jo T., Takao K., Minamoto T. (2022). Linking the state of environmental DNA to its application for biomonitoring and stock assessment: Targeting mitochondrial/nuclear genes, and different DNA fragment lengths and particle sizes. Environ. DNA 4 (2), 271–283. doi: 10.1002/edn3.253
Kasmi Y., Blanke T., Eschbach E., Möckel B., Casas L., MatthiasBernreuther M., et al. (2023). Atlantic Cod (Gadus morhua) assessment approaches in the north and Baltic Sea: a comparison of environmental DNA analysis versus bottom trawl sampling. Front. Mar. Sci. 10, 1058354. doi: 10.3389/fmars.2023.1058354
Keck F., Blackman R. C., Bossart R., Brantschen J., Couton M., Hürlemann S., et al. (2022). Meta-analysis shows both congruence and complementarity of DNA and eDNA metabarcoding to traditional methods for biological community assessment. Mol. Ecol. 31 (6), 1820–1835. doi: 10.1111/mec.16364
Kirtane A., Wieczorek D., Noji T., Baskin L., Ober C., Plosica R., et al. (2021). Quantification of environmental DNA (eDNA) shedding and decay rates for three commercially harvested fish species and comparison between eDNA detection and trawl catches. Environ. DNA 3 (6), 1142–1155. doi: 10.1002/edn3.236
Klymus K. E., Merkes C. M., Allison M. J., Goldberg C. S., Helbing C. C., Hunter M. E., et al. (2020). Reporting the limits of detection and quantification for environmental DNA assays. Environ. DNA 2 (3), 271–282. doi: 10.1002/edn3.29
Knudsen S. W., Ebert R. B., Hesselsøe M., Kuntke F., Hassingboe J., Mortensen P. B., et al. (2019). Species-specific detection and quantification of environmental DNA from marine fishes in the Baltic Sea. J. Exp. Mar. Biol. Ecol. 510, 31–45. doi: 10.1016/j.jembe.2018.09.004
Kubista M., Andrade J. M., Bengtsson M., Forootan A., Jonák J., Lind K., et al. (2006). The real-time polymerase chain reaction. Mol. aspects Med. 27 (2-3), 95–125. doi: 10.1016/j.mam.2005.12.007
Kumar G., Reaume A. M., Farrell E., Gaither M. R. (2022). Comparing eDNA metabarcoding primers for assessing fish communities in a biodiverse estuary. PloS One 17 (6), e0266720. doi: 10.1371/journal.pone.0266720
Lacoursière-Roussel A., Rosabal M., Bernatchez L. (2016). Estimating fish abundance and biomass from eDNA concentrations: variability among capture methods and environmental conditions. Mol. Ecol. Resour. 16 (6), 1401–1414. doi: 10.1111/1755-0998.12522
LeBlanc F., Belliveau V., Watson E., Coomber C., Simard N., DiBacco C., et al. (2020). Environmental DNA (eDNA) detection of marine aquatic invasive species (AIS) in Eastern Canada using a targeted species-specific qPCR approach. Manage. Biol. Invasions 11 (2), 201. doi: 10.3391/mbi.2020.11.2.03
Leray M., Knowlton N. (2015). DNA Barcoding and metabarcoding of standardized samples reveal patterns of marine benthic diversity. Proc. Natl. Acad. Sci. 112 (7), 2076–2081. doi: 10.1073/pnas.1424997112
Levi T., Allen J. M., Bell D., Joyce J., Russell J. R., Tallmon D. A., et al. (2019). Environmental DNA for the enumeration and management of pacific salmon. Mol. Ecol. Resour. 19 (3), 597–608. doi: 10.1111/1755-0998.12987
Liu J., Zhang H. (2021). Combining multiple markers in environmental DNA metabarcoding to assess deep-sea benthic biodiversity. Front. Mar. Sci. 8. doi: 10.3389/fmars.2021.684955
Macher T. H., Beermann A. J., Leese F. (2021). TaxonTableTools: A comprehensive, platform-independent graphical user interface software to explore and visualise DNA metabarcoding data. Mol. Ecol. Resour. 21 (5), 1705–1714. doi: 10.1111/1755-0998.13358
Magoč T., Salzberg S. L. (2011). FLASH: fast length adjustment of short reads to improve genome assemblies. Bioinformatics 27, 2957–2963. doi: 10.1093/bioinformatics/btr507
Mahé F., Rognes T., Quince C., De Vargas C., Dunthorn M. (2015). Swarm v2: highly-scalable and high-resolution amplicon clustering. PeerJ 3, e1420. doi: 10.7717/peerj.1420
Maiello G., Talarico L., Carpentieri P., De Angelis F., Franceschini S., Harper L. R., et al. (2022). Little samplers, big fleet: eDNA metabarcoding from commercial trawlers enhances ocean monitoring. Fisheries Res. 249, 106259. doi: 10.1016/j.fishres.2022.106259
Manfrin C., Zanetti M., Stanković D., Fattori U., Bertucci-Maresca V., Giulianini P. G., et al. (2022). Detection of the endangered stone crayfish austropotamobius torrentium (Schrank 1803) and its congeneric a. pallipes in its last Italian biotope by eDNA analysis. Diversity 14 (3), 205. doi: 10.1007/s10530-022-02761-2
Martin M. (2011). Cutadapt removes adapter sequences from high-throughput sequencing reads. EMBnet. J. 171), 10–12. doi: 10.14806/ej.17.1.200
Masella A. P., Bartram A. K., Truszkowski J. M., Brown D. G., Neufeld J. D. (2012). PANDAseq: paired-end assembler for illumina sequences. BMC Bioinf. 13 (1), 1–7. doi: 10.1186/1471-2105-13-31
Mathon L., Valentini A., Guérin P. E., Normandeau E., Noel C., Lionnet C., et al. (2021). Benchmarking bioinformatic tools for fast and accurate eDNA metabarcoding species identification. Mol. Ecol. Resour. 21 (7), 2565–2579. doi: 10.1111/1755-0998.13430
Matsen F. A., Kodner R. B., Armbrust E. V. (2010). Pplacer: linear time maximum-likelihood and Bayesian phylogenetic placement of sequences onto a fixed reference tree. BMC Bioinf. 11, 538. doi: 10.1186/1471-2105-11-538
McClenaghan B., Compson Z. G., Hajibabaei M. (2020). Validating metabarcoding-based biodiversity assessments with multi-species occupancy models: a case study using coastal marine eDNA. PloS One 15 (3), e0224119. doi: 10.1371/journal.pone.0224119
McKnight D. T., Huerlimann R., Bower D. S., Schwarzkopf L., Alford R. A., Zenger K. R. (2019). A highly accurate read-subtraction tool for the post-sequencing removal of contamination in metabarcoding studies. Environ. DNA 1, 14–25. doi: 10.1002/edn3.11
Merkes C., Klymus K., Allison M., Goldberg C., Helbin C., Hunter M., et al. (2019). Reporting the limits of detection (LOD) and quantification (LOQ) for environmental DNA assays. Data: U.S. Geological Survey Data release. doi: 10.5066/P9AKHU1R
Miya M. (2022). Environmental DNA metabarcoding: A novel method for biodiversity monitoring of marine fish communities. Annu. Rev. Mar. Sci. 14, 161–185. doi: 10.1146/annurev-marine-041421-082251
Mousavi-Derazmahalleh M., Stott A., Lines R., Peverley G., Nester G., Simpson T., et al. (2021). eDNAFlow, an automated, reproducible and scalable workflow for analysis of environmental DNA sequences exploiting nextflow and singularity. Mol. Ecol. Resour. 215), 1697–1704. doi: 10.1111/1755-0998.13356
Munch K., Boomsma W., Willerslev E., Nielsen R. (2008). Fast phylogenetic DNA barcoding. Philos. Translation R. Soc. B 363, 3997–4002. doi: 10.1098/rstb.2008.0169
Murakami H., Yoon S., Kasai A., Minamoto T., Yamamoto S., Sakata M. K., et al. (2019). Dispersion and degradation of environmental DNA from caged fish in a marine environment. Fisheries Sci. 85, 327–337. doi: 10.1007/s12562-018-1282-6
Nakagawa H., Fukushima K., Sakai M., Wu L., Minamoto T. (2022). Relationships between the eDNA concentration obtained from metabarcoding and stream fish abundance estimated by the removal method under field conditions. Environ. DNA 4, 1369–1380. doi: 10.1002/edn3.346
Pabinger S., Rödiger S., Kriegner A., Vierlinger K., Weinhäusel A. (2014). A survey of tools for the analysis of quantitative PCR (qPCR) data. Biomol Detect Quantif 1 (1), 23–33. doi: 10.1016/j.bdq.2014.08.002
Palacios-Abrantes J., Frölicher T. L., Reygondeau G., Sumaila U. R., Tagliabue A., Wabnitz C. C., et al. (2022). Timing and magnitude of climate-driven range shifts in transboundary fish stocks challenge their management. Global Change Biol. 28 (7), 2312–2326. doi: 10.1111/gcb.16058
Pasquier J., Cabau C., Nguyen T., Jouanno E., Severac D., Braasch I., et al. (2016). Gene evolution and gene expression after whole genome duplication in fish: the PhyloFish database. BMC Genomics 17 (1), 1–10. doi: 10.1186/s12864-016-2709-z
Payne J. L., Bush A. M., Heim N. A., Knope M. L., McCauley D. J. (2016). Ecological selectivity of the emerging mass extinction in the oceans. Science 353 (6305), 1284–1286. doi: 10.1126/science.aaf2416
Perry A. L., Low P. J., Ellis J. R., Reynolds J. D. (2005). Climate change and distribution shifts in marine fishes. science 308 (5730), 1912–1915. doi: 10.1126/science.1111322
Pikitch E. K., Santora C., Babcock E. A., Bakun A., Bonfil R., Conover D. O., et al. (2004). Ecosystem-based fishery management. Science 305 (5682), 346–347. doi: 10.1126/science.1098222
Pinsky M. L., Selden R. L., Kitchel Z. J. (2020). Climate-driven shifts in marine species ranges: Scaling from organisms to communities. Annu. Rev. Mar. Sci. 12, 153–179. doi: 10.1146/annurev-marine-010419-010916
Ramírez-Amaro S., Bassitta M., Picornell A., Ramon C., Terrasa B. (2022). Environmental DNA: State-of-the-art of its application for fisheries assessment in marine environments. Front. Mar. Sci. 9, 1004674. doi: 10.3389/fmars.2022.1004674
Ratnasingham S. (2019). mBRAVE: The multiplex barcode research and visualization environment. Biodivers Inf Sci Stand. 3, e37986. doi: 10.3897/biss.3.37986
Ratnasingham S., Hebert P. D. N. (2007). BOLD: the barcode of life data system (www.barcodinglife.org). Mol. Ecol. Notes 7 (3), 355–364. doi: 10.1111/j.1471-8286.2007.01678.x
Rodriguez-Ezpeleta N., Morissette O., Bean C. W., Manu S., Banerjee P., Lacoursière-Roussel A., et al. (2021). Trade-offs between reducing complex terminology and producing accurate interpretations from environmental DNA: Comment on “Environmental DNA: What's behind the term?” by pawlowski et al.,(2020). Mol. Ecol. 30 (19), 4601–4605. doi: 10.1111/mec.15942
Rognes T., Flouri T., Nichols B., Quince C., Mahé F. (2016). VSEARCH: a versatile open source tool for metagenomics. PeerJ 4, e2584. doi: 10.7717/peerj.2584
Rourke M. L., Fowler A. M., Hughes J. M., Broadhurst M. K., DiBattista J. D., Fielder S., et al. (2022). Environmental DNA (eDNA) as a tool for assessing fish biomass: A review of approaches and future considerations for resource surveys. Environ. DNA 4 (1), 9–33. doi: 10.1002/edn3.185
Russo T., Maiello G., Talarico L., Baillie C., Colosimo G., D'Andrea L., et al. (2021). All is fish that comes to the net: metabarcoding for rapid fisheries catch assessment. Ecol. Appl. 31 (2), e02273. doi: 10.1002/eap.2273
Salter I., Joensen M., Kristiansen R., Steingrund P., Vestergaard P. (2019). Environmental DNA concentrations are correlated with regional biomass of Atlantic cod in oceanic waters. Commun. Biol. 2, 461. doi: 10.1038/s42003-019-0696-8
Sato M., Inoue N., Nambu R., Furuichi N., Imaizumi T., Ushio M. (2021). Quantitative assessment of multiple fish species around artificial reefs combining environmental DNA metabarcoding and acoustic survey. Sci. Rep. 11, 19477. doi: 10.1038/s41598-021-98926-5
Sato Y., Miya M., Fukunaga T., Sado T., Iwasaki W. (2018). MitoFish and MiFish pipeline: a mitochondrial genome database of fish with an analysis pipeline for environmental DNA metabarcoding. Mol. Biol. Evol. 35, 1553–1555. doi: 10.1093/molbev/msy074
Schloss P. D., Westcott S. L., Ryabin T., Hall J. R., Hartmann M., Hollister E. B., et al. (2009). Introducing MOTHUR: open-source, platform-independent, community-supported software for describing and comparing microbial communities. Appl. Environmental. Microbiol. 75, 7537–7541. doi: 10.1128/AEM.01541-09
Sepúlveda A. J., Al-Chokhachy R., Laramie M. B., Crapster K., Knotek L., Miller B., et al. (2021). It’s complicated … environmental DNA as a predictor of trout and char abundance in streams. Can. J. Fisheries Aquat. Sci. 78, 422–432. doi: 10.1139/cjfas-2020-0182
Sepulveda A. J., Birch J. M., Barnhart E. P., Merkes C. M., Yamahara K. M., Marin R., et al. (2020). Robotic environmental DNA bio-surveillance of freshwater health. Sci. Rep. 10 (1), 1–8. doi: 10.1038/s41598-020-71304-3
Seymour M. (2019). Rapid progression and future of environmental DNA research. Commun. Biol. 2, 80. doi: 10.1038/s42003-019-0330-9
Shelton A. O., Ramón-Laca A., Wells A., Clemons J., Chu D., Feist B. E., et al. (2022). Environmental DNA provides quantitative estimates of pacific hake abundance and distribution in the open ocean. Proc. R. Soc B. 289 (1971), 20212613. doi: 10.1098/rspb.2021.2613
Sigsgaard E. E., Jensen M. R., Winkelmann I. E., Møller P. R., Hansen M. M., Thomsen P. F. (2020). Population-level inferences from environmental DNA–current status and future perspectives. Evolutionary Appl. 13 (2), 245–262. doi: 10.1111/eva.12882
Stat M., Huggett M. J., Bernasconi R., DiBattista J. D., Berry T. E., Newman S. J., et al. (2017). Ecosystem biomonitoring with eDNA: metabarcoding across the tree of life in a tropical marine environment. Sci. Rep. 7 (1), 1–11. doi: 10.1038/s41598-017-12501-5
Stoeckle M. Y., Adolf J., Charlop-Powers Z., Dunton K. J., Hinks G., VanMorter S. M. (2021). Trawl and eDNA assessment of marine fish diversity, seasonality, and relative abundance in coastal new Jersey, USA. ICES J. Mar. Sci. 78 (1), 293–304. doi: 10.1093/icesjms/fsaa225
Taberlet P., Bonin A., Zinger L., Coissac E. (2018). Environmental DNA. for biodiversity research and monitoring (UK: Oxford University Press). doi: 10.1093/050/9780198767220.001.0001
Taberlet P., Coissac E., Pompanon F., Brochmann C., Willerslev E. (2012). Towards next-generation biodiversity assessment using DNA metabarcoding. Mol. Ecol. 21, 2045–2050. doi: 10.1111/j.1365-294X.2012.05470.x
Takahara T., Minamoto T., Yamanaka H., Doi H., Kawabata Z. (2012). Estimation of fish biomass using environmental DNA. PloS One 7, e35868. doi: 10.1371/journal.pone.0035868
Thomsen P. F., Møller P. R., Sigsgaard E. E., Knudsen S. W., Jørgensen O. A., Willerslev E. (2016). Environmental DNA from seawater samples correlate with trawl catches of subarctic, deepwater fishes. PloS One 11 (11), e0165252. doi: 10.1371/journal.pone.0165252
Tillotson M. D., Kelly R. P., Duda J. J., Hoy M., Kralj J., Quinn T. P. (2018). Concentrations of environmental DNA (eDNA) reflect spawning salmon abundance at fine spatial and temporal scales. Biol. Conserv. 220, 1–11. doi: 10.1016/j.biocon.2018.01.030
Tsuji S., Miya M., Ushio M., Sato H., Minamoto T., Yamanaka H. (2020). Evaluating intraspecific genetic diversity using environmental DNA and denoising approach: A case study using tank water. Environ. DNA 2 (1), 42–52. doi: 10.1002/edn3.44
Tsuji S., Takahara T., Doi H., Shibata N., Yamanaka H. (2019). The detection of aquatic macroorganisms using environmental DNA analysis–a review of methods for collection, extraction, and detection. Environ. DNA 1 (2), 99–108. doi: 10.1002/edn3.21
Urban P., Bekkevold D., Hansen B. K., Jacobsen M. W., Nielsen A., Nielsen E. E. (2023). Using eDNA to estimate biomass of bycatch in pelagic fisheries. Environ. DNA 00, 1–16. doi: 10.1002/edn3.377
Valdivia-Carrillo T., Rocha-Olivares A., Reyes-Bonilla H., Domínguez-Contreras J. F., Munguia-Vega A. (2021). Integrating eDNA metabarcoding and simultaneous underwater visual surveys to describe complex fish communities in a marine biodiversity hotspot. Mol. Ecol. Resour. 21 (5), 1558–1574. doi: 10.1111/1755-0998.13375
West K., Travers M. J., Stat M., Harvey E. S., Richards Z. T., DiBattista J. D., et al. (2021). Large-Scale eDNA metabarcoding survey reveals marine biogeographic break and transitions over tropical north-western Australia. Diversity Distributions 27 (10), 1942–1957. doi: 10.1111/ddi.13228
Wilcox T. M., McKelvey K. S., Young M. K., Engkjer C., Lance R. F., Lahr A., et al. (2020). Parallel, targeted analysis of environmental samples via high-throughput quantitative PCR. Environ. DNA 2 (4), 544–553. doi: 10.1002/edn3.80
Xiong W., Zhan A. (2018). Testing clustering strategies for metabarcoding-based investigation of community–environment interactions. Mol. Ecol. Resour. 18 (6), 1326–1338. doi: 10.1111/1755-0998.12922
Yamamoto S., Minami K., Fukaya K., Takahashi K., Sawada H., Murakami H., et al. (2016). Environmental DNA as a “snapshot” of fish distribution: a case study of Japanese jack mackerel in maizuru bay, Sea of Japan. PloS One 11, e0149786. doi: 10.1371/journal.pone.0149786
Yu D., Shen Z., Chang T., Li S., Liu H. (2021). Using environmental DNA methods to improve detectability in an endangered sturgeon (Acipenser sinensis) monitoring program. BMC Ecol. Evol. 21 (1), 216. doi: 10.1186/s12862-021-01948-w
Zafeiropoulos H., Viet H. Q., Vasileiadou K., Potirakis A., Arvanitidis C., Topalis P., et al. (2020). PEMA: a flexible pipeline for environmental DNA metabarcoding analysis of the 16S/18S ribosomal RNA, ITS, and COI marker genes. GigaScience 9 (3), giaa022. doi: 10.1093/gigascience/giaa150
Zhang J., Kobert K., Flouri T., Stamatakis A. (2014). PEAR: a fast and accurate illumina paired-end read merger. Bioinformatics 30, 614–620. doi: 10.1093/bioinformatics/btt593
Keywords: eDNA, bioinformatic pipeline, qPCR, dPCR, marine ecosystems, metabarcoding, vulnerable marine ecosystems
Citation: Petit-Marty N, Casas L and Saborido-Rey F (2023) State-of-the-art of data analyses in environmental DNA approaches towards its applicability to sustainable fisheries management. Front. Mar. Sci. 10:1061530. doi: 10.3389/fmars.2023.1061530
Received: 04 October 2022; Accepted: 29 March 2023;
Published: 18 April 2023.
Edited by:
Ana Rotter, National Institute of Biology (NIB), SloveniaReviewed by:
Luca Mirimin, Galway-Mayo Institute of Technology, IrelandSimon Goodman, University of Leeds, United Kingdom
Copyright © 2023 Petit-Marty, Casas and Saborido-Rey. This is an open-access article distributed under the terms of the Creative Commons Attribution License (CC BY). The use, distribution or reproduction in other forums is permitted, provided the original author(s) and the copyright owner(s) are credited and that the original publication in this journal is cited, in accordance with accepted academic practice. No use, distribution or reproduction is permitted which does not comply with these terms.
*Correspondence: Natalia Petit-Marty, bnBldGl0QGlpbS5jc2ljLmVz; Laura Casas, bGF1cmFjYXNhc0BpaW0uY3NpYy5lcw==; Fran Saborido-Rey, ZnJhbkBpaW0uY3NpYy5lcw==