 Haining Wang
 Xiaocheng Wang
 Lei Cao3
 Zhaoshan Zhong
 Chaolun Li
- 1Key Laboratory of Marine Ecology and Environmental Sciences, Institute of Oceanology, Chinese, Academy of Sciences, Qingdao, China
- 2National Marine Environmental Monitoring Center, Dalian, China
- 3Deep Sea Research Center, Institute of Oceanology, Chinese Academy of Sciences, Qingdao, China
- 4Center for Ocean Mega-Science, Chinese Academy of Sciences, Qingdao, China
- 5Key Laboratory of Marine Geology and Environment, Institute of Oceanology, Chinese Academy of Sciences, Qingdao, China
A cold seep is one of the typical deep-sea chemical energy ecosystems and a hotspot for studying unique life processes and biogeochemical cycles in the deep sea. Macrofauna, which is one of the most important components of the cold seep ecosystem, has not been thoroughly studied. We examined the macrofauna community at Site F using images collected in 2016 by an imaging and laser profiling system and biological samples collected in 2020 and 2021 by TV grab and a remotely operated vehicle. In total, 41 species were found. The overall number of macrofauna identified at Site F (20,000 m2) reached 252,943 individuals, and the biomass reached 726.15 kg by dry weight. As the dominant species, Gigantidas platifrons and Shinkaia crosnieri reached their highest densities of 629 and 396 individuals/m2, respectively. The comparisons between different stations revealed that the diversity and density, even the biomass of dominant species, were much higher in the south than in the north at Site F in 2020. Correlation analysis showed that methane had a positive effect on macrofauna density. Compared with S. crosnieri, G. platifrons seems to be more adapted to the harsh cold seep environment. Methane consumption rates of the dominant species show that macrofauna are important in influencing seafloor methane fluxes. Our findings provide valuable insights into the ecology, community structure, and biota-environment interaction in the cold seep at Site F.
1. Introduction
Cold seeps are environments where emissions of methane, sulfide, or other reduced chemicals occur from the seafloor at near-ambient temperatures (Vanreusel et al., 2009; Levin et al., 2016). They are commonly called “oases” because they contain a large number of symbiont-bearing invertebrates (Laubier, 1993; Carney, 1994). These invertebrate communities are found at seeps on active and passive continental margins throughout the world’s oceans (Sibuet and Olu, 1998; Cordes et al., 2009). In general, seeps that support many chemosynthetic organisms (Levin, 2005; Cordes et al., 2010), such as symbiont-containing bathymodiolin mussels or vestimentiferan tubeworms, often host communities with high abundances and biomass but low diversity compared to surrounding non-seep habitats (Menot et al., 2010). Meanwhile, some non-symbiotic macrobenthos and vagrants are also attracted by the cold seeps because of their high food availability and habitat heterogeneity (Levin et al., 2016; Zhao et al., 2020). The macrofauna inhabiting cold seeps are distinct from those in other areas of the deep sea, and so they should be recognized as a distinct component of biodiversity and protected (Levin et al., 2016; Amon et al., 2017). As one of the most investigated components of the cold seep ecosystem, macrofauna have great ecological importance and obvious significance. Some of them are considered ecosystem engineers because they influence the sediment environment by providing physical structure and modulating geochemistry through oxygenation (pumping) and ion uptake activities (Levin, 2005). However, these macrofauna have not been thoroughly studied, and little is known about their numbers, habitats, and relationships with surrounding environments. As a critical tool for promoting sustainable management of marine resources, habitat mapping of these macrofauna at seeps plays an important role (Cochrane and Lafferty, 2002; Degraer et al., 2008). Therefore, it is essential to comprehensively describe the species, density, biomass, and so on of macrofauna at cold seeps. However, because of the high heterogeneity of cold seeps, it is difficult to obtain complete information in a traditional way (Levin et al., 2000; Wang et al., 2021). With the development of camera and video technologies, imaging technologies have become the obvious method to characterize these communities and have proven helpful in dense habitats (Sen et al., 2016).
The Formosa Ridge is located on the northern continental margin of the South China Sea, offshore of southwestern Taiwan (Figure 1). Exposed gas hydrates on the seafloor were found in this area (Zhang et al., 2017). Site F, located on the Formosa Ridge, was first recognized as an active cold seep in 2007 (Lin et al., 2007). Previous studies have focused on geological and biogeochemical backgrounds (Feng et al., 2015; Zhang et al., 2017; Wang et al., 2018; Cao et al., 2021), where epifauna were collected and identified (Li, 2015; Li, 2017; Zhao et al., 2020). For example, Cao et al. (2021) identified the chemical gradients (mainly methane and oxygen) from the flourishing center to the periphery of Site F. However, there have been fewer studies on spatial distribution and density until a transect survey was conducted by a remotely operated vehicle (ROV) in 2018 (Zhao et al., 2020). This study showed the highest densities of dominant species such as G. platifrons and S. crosnieri could reach 273 and 300 individuals/m2, respectively. The similarity between the macrobenthos in the South China Sea cold seeps and the Okinawa Trough hydrothermal vents indicated a high degree of connectivity. Despite this, the total quantity, biomass, and distribution of macrofauna, in addition to the interaction between the environment and biota at the entire Site F are not well documented. Otherwise, few studies have systematically and exhaustively examined the macrofauna community at cold seeps. For example, quantitative mosaics and videos collected by laser line-scan, multibeam backscatter, and bathymetry, together with video records and other methods, were used to map the habitats and species distributions of cold seeps because of the high habitat heterogeneity (MacDonald et al., 2003; Sen et al., 2016). Astrom et al. (2018) used photographs to examine the diversity, abundance, and biomass of infaunal communities at high-Arctic cold seeps. Alternatively, seafloor images were also used by Sen et al. (2019) to compare the megafauna community between seep and non-seep background sites at the Svanefjell seep. However, it is still a challenge to completely describe the biodiversity, spatial distribution, and interannual variation of cold seep macrofauna communities.
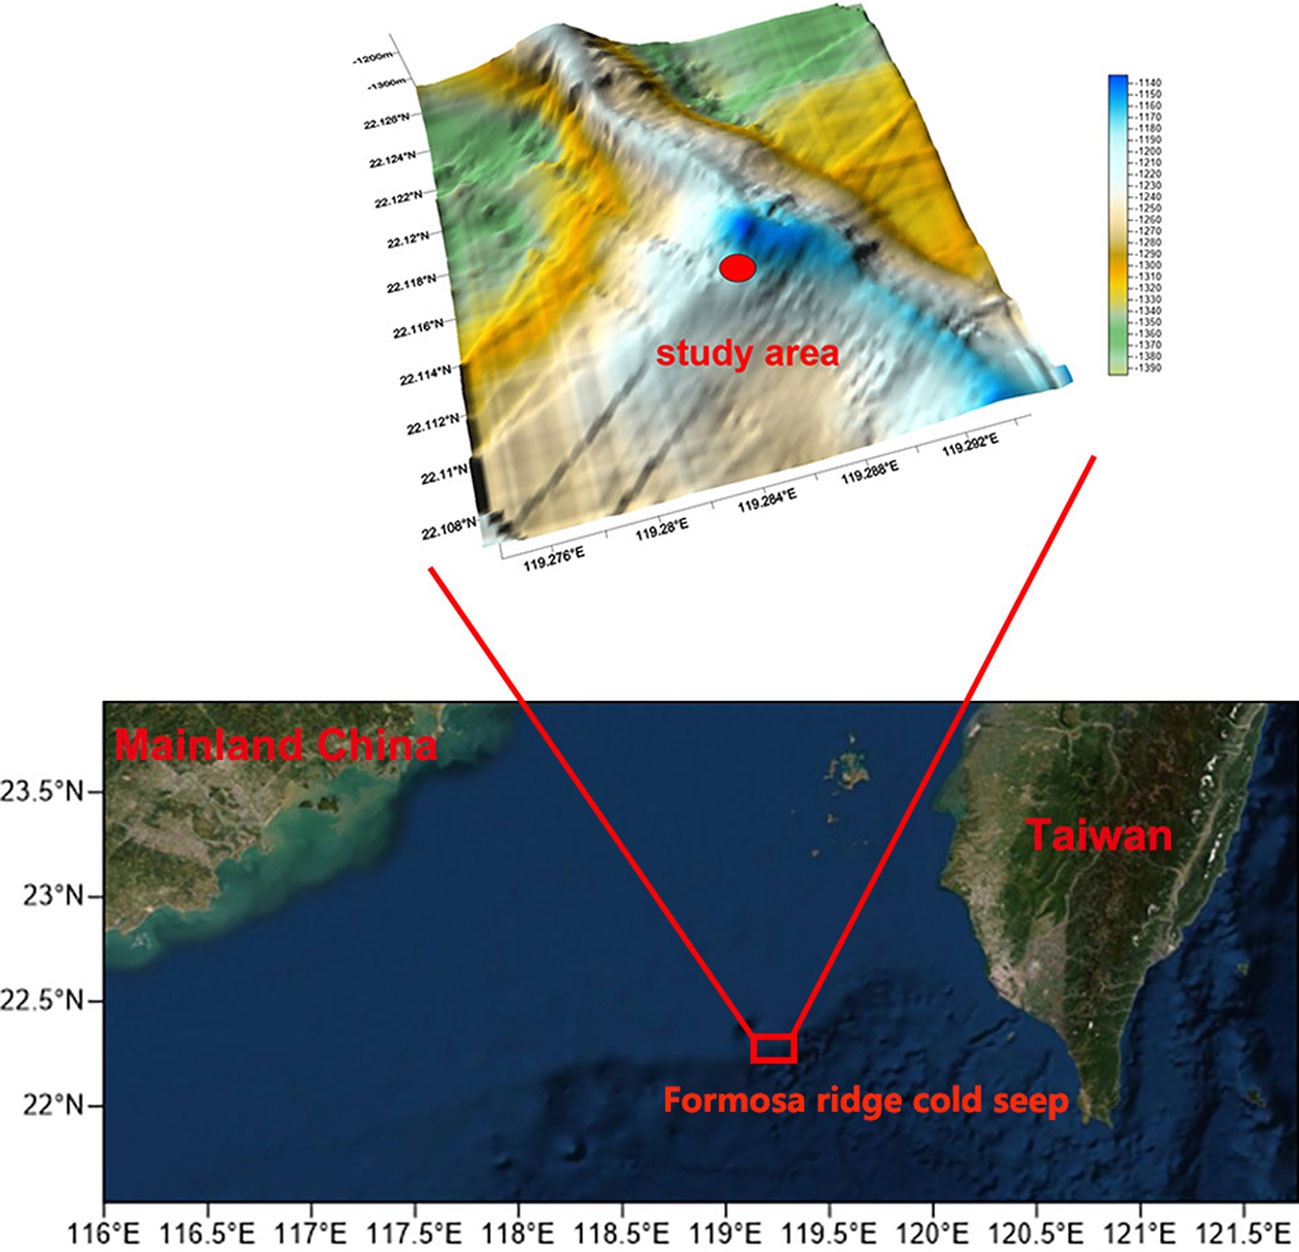
Figure 1 Location of the cold seep sites surveyed at Formosa ridge. Topographic map shows the tectonic features. The study area is delimited by the red dot.
Because the understanding of biomass, spatial distribution, and the controlled factors of macrofauna is the basis for further understanding the cold seep ecosystem, we examined macrofauna communities at Site F through analyses of images and biological samples in 2016, 2020, and 2021. An imaging and laser profiling system was used to collect images, and a TV grab and an ROV were used to collect biological samples . Our goal was to show the density, biomass, and distribution of macrofauna throughout the site to the greatest degree possible. This will be truly helpful for understanding the community structure of Site F. The length-weight relationships and distribution of body length for the dominant species G. platifrons and S. crosnieri are useful in comparing the growth of these two species in different areas and at different times. Geochemical measurements were used to gain an understanding of how abiotic features relate to the macrofauna communities.
2. Materials and methods
2.1. Image collection and analysis
The R.V. Kexue conducted a photographic survey of the Formosa Ridge during a research cruise in 2016 . Faxian, an ROV equipped with an L1000 imaging and laser profiling system which was designed and supplied by Cathx Ocean Ltd., was used to obtain all images. This system was equipped with a still camera, two LED lights with outputs of 7,000 and 28,000 lumens, and two green line lasers. All original images associated with geographic coordinates were captured at a rate of nine frames per second. The mosaic was pieced together using these coordinates and the same object identifier in adjacent images (Figure 2) (Wang et al., 2019). PTGui software was used for the initial splice, and Adobe Photoshop was used for the subsequent image optimization. Then, for statistical convenience, the mosaic was divided uniformly by 200 x 200 tiles (19,516 small pictures with an area of about 1 m2, except the blank). All visible macrofauna in the mosaic were counted and identified to the lowest taxonomic level possible. To compare the spatial distribution and density of macrofauna, the whole cold seep area was divided into a 10 m by 10 m grid. Geographic information and the density of macrofauna in each grid were used to perform cluster analysis to verify the similar occurrence of macrofauna. Meanwhile, a non-metric multidimensional scaling (NMDS) approach was used to compare the similarity between different groups. All these analyses were performed using Primer v.6. To calculate the mean body length in each grid, 20 to 50 individuals of the dominant species (G. platifrons and S. crosnieri) were chosen at random.

Figure 2 Mosaic (20,000 m2) of the seep community at Site F cold seep in 2016; two high-resolution images used to identify macrofauna are shown in the inset. The outline represents the area where images were obtained.
2.2. Sample collection and environmental detections
To compare the spatial difference and interannual variation of macrofauna (compared to the 2016 data, mainly from the south and north of Site F), TV grab operations (including GA, GB, and GC monitored twice at each station) were taken by the R.V. Kexue at Site F in 2020. All macrofauna collected by TV grab were counted. The Shannon–Weiner index was calculated to compare the species diversity at different stations. Meanwhile, environmental factors at each station were also identified. Benthic environmental variables (methane and dissolved oxygen) were measured by the Seabird SBE 43 dissolved oxygen sensor (DO) (Sea-Bird Electronics, Inc., Washington, USA) and the CONTROS HydroC® CH4 sensor (Kongsberg Gruppen, Norway) installed in the ROV tool sled (Cao et al., 2021). The manipulator arm performed every in situ detection as it approached the target sites. Pearson correlation analysis was used to identify correlations between environmental factors (methane and DO) and the dominant species.
2.3. Biomass measurement
The body length and weight (wet and dry) of G. platifrons and S. crosnieri were measured in 50 specimens, respectively, to model the relationship between length and weight. Dry weights were measured after at least 48 hours in a freeze dryer. For G. platifrons, the dry weight was calculated only after the shell was removed. For S. crosnieri, the shell length of the head and the whole-body length were all recorded. Because of the inconvenient measurement, the whole-body length appears worse in modeling. So, the shell lengths of the head were used as the body length of S. crosnieri. These data were used to model the following standard equation:
where W is the weight (g) and L is the body length (or the shell, for G. platifrons), measured with a vernier caliper, in mm.
2.4. The methane consumption of the dominant species
To assess the metabolism in the G. flatirons community, the relationship between oxygen consumption and body weight of mytilids was determined according to this equation (Khripounoff et al., 2017):
where R is the oxygen consumption, and W is the dry body weight of G. platifrons. W is calculated by the equation given in Section 2.3. L is the mean body length of G. platifrons measured from the mosaic. The methane consumption of G. platifrons was calculated by the relationship in metabolic gas flux (per mol CH4 consumed, the G. platifrons consumed ~1.2 mol O2) (Kochevar et al., 1992). Meanwhile, the mean methane consumption rate (1.98 μmol/h) of S. crosnieri as estimated by Watsuji et al. (2014) at 12.0 MPa was used.
3. Results
3.1. Background environments
Methane concentrations at Site F varied quickly and were unstable, ranging from 237.25 ppm to 15,000 ppm with a mean of 4120.88 ppm (Supplementary Table 1). The variation in concentration of dissolved oxygen was relatively smaller, ranging from 2.89 mg/L to 3.16 mg/L with a mean of 3.07 mg/L. The substrates at Site F contained hard (central authigenic carbonates) and soft (peripheral muddy) sea bottoms. Large mussel beds, lobster clusters, and shell debris were found on hard substrates formed by authigenic carbonates (Figure 2). In addition to authigenic carbonates, there was a large, soft argillaceous environment, including reduced sediments and muddy sea bottoms.
3.2. Species composition and density
In this survey, 41 species or categories, including Mollusca (12), Porifera (3), Annelida (9), Echinodermata (4), Arthropoda (9), Cnidaria (3), and Vertebrata (1) were found in the mosaic and TV grabs. There were 34 taxa identified as species or genera, and others were the higher taxa (Supplementary Table 2). There were 17 categories collected or identified through this method, including Cnidaria (Anthomastus sp., Caryophyllia sp., and Alvinactis sp.), Mollusca (Conchocele bisecta, Solemya sp., Enigmaticolus inflatus sp. nov., cf. Abyssochrysos sp., and Chaetoderma sp.), Arthropoda (Lysianassoidea sp., and Pleurocryptella fimbriata), Annelida (Lepidonotopodium sp., Branchinotogluma sp., Lamellibrachia sp., Glycera sp., Nereis sp., and Capitellidae sp.), and Enteropneusta (cf. Balanoglossus) . Among them, there were 10 newly recorded species.
The quantity of macrofauna in the whole mosaic (20,000 m2) reached as high as 252,943 individuals. G. platifrons and S. crosnieri were the dominant species at Site F, with 215,339 and 37,422 individuals, respectively. Clustering analysis revealed a 77.5% similarity between the four groups (r = 0.995, P < 0.01) and was used to verify the similarity of macrofauna occurrence in each grid (Figure 3A, B). The densities (individuals/100 m2) of Groups 1 through 4 were as follows: Group 1, 3,584–17,806; Group 2, 1,075–3,108; Group 3, 106–815; and Group 4, 0–133. According to the spatial distribution of each grid at the cold seep in Site F, we discovered a pattern of patchy distribution of macrofauna in which the most abundant areas (Group 1) were concentrated in the center of the entire site , followed by Groups 2, 3, and 4 (Figure 3C).
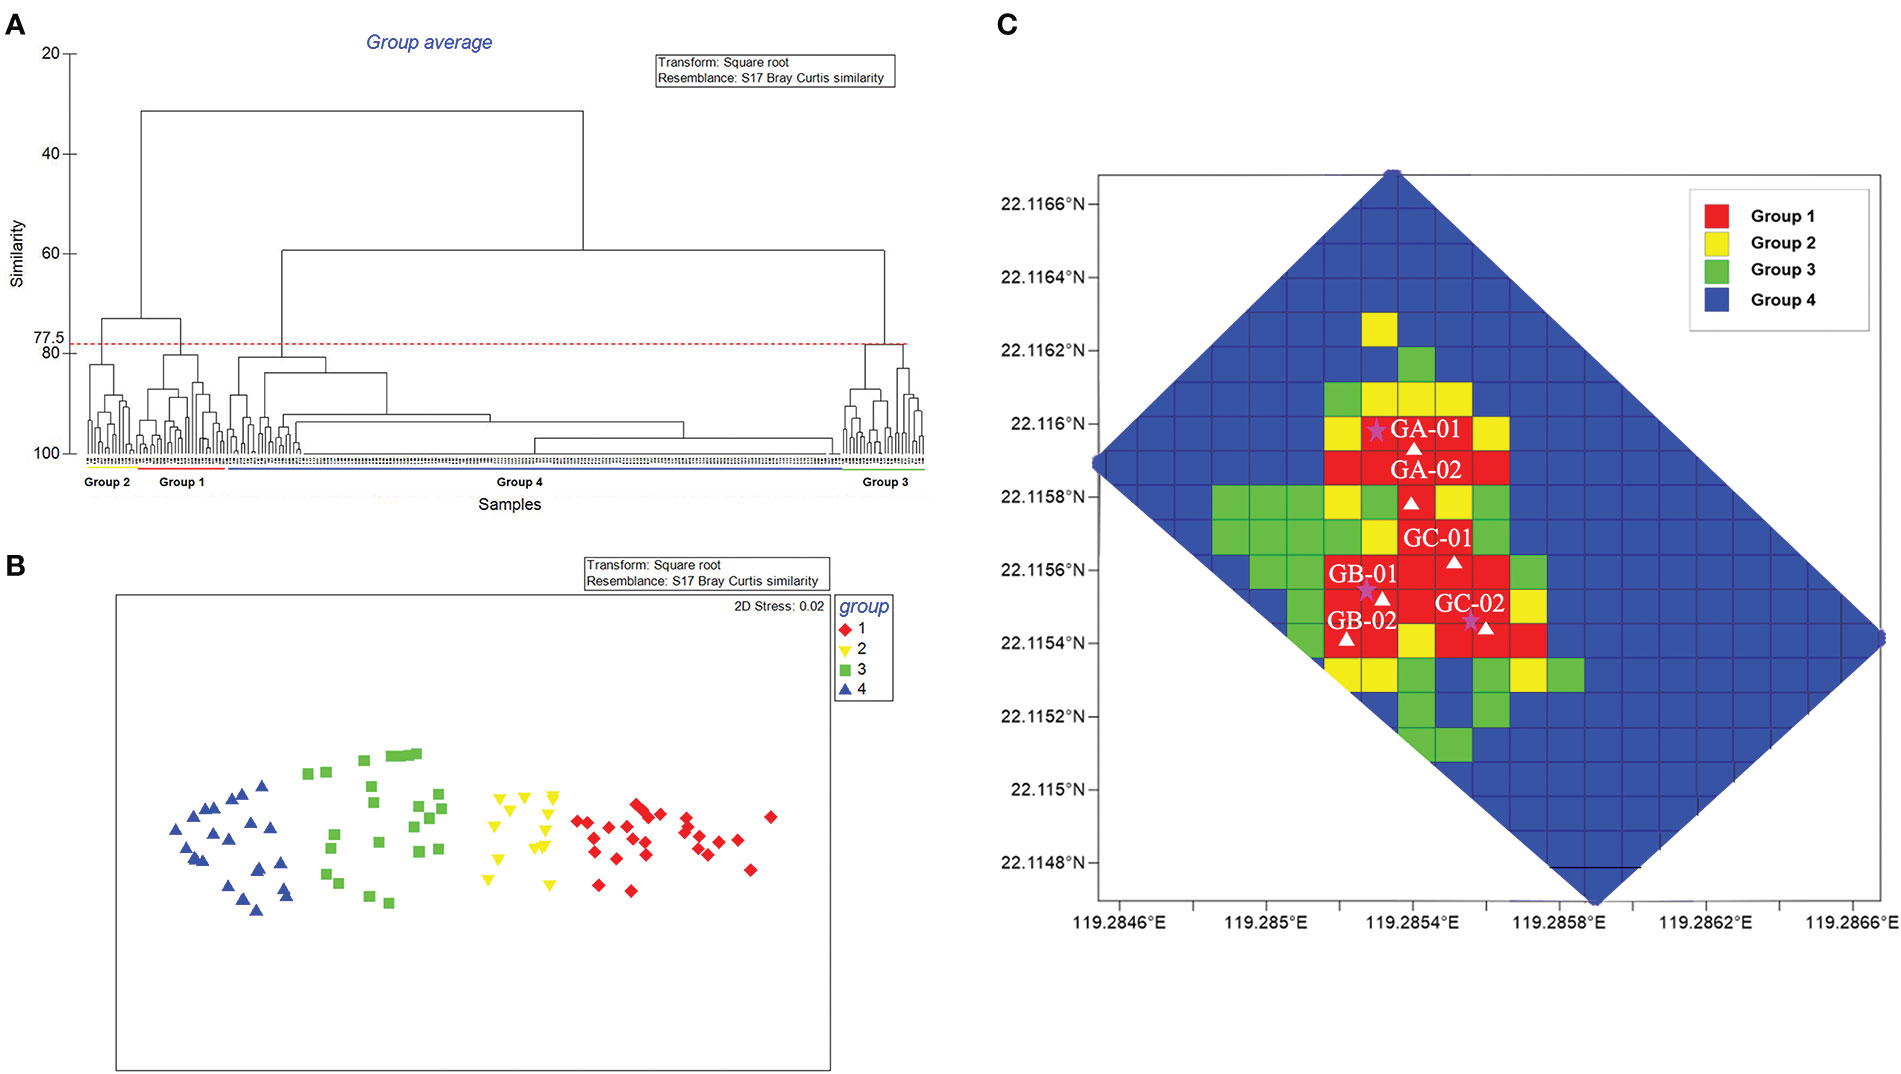
Figure 3 Cluster analysis of different grids from the mosaic. (A) Four groups (Groups 1 to 4) had a similarity of 77.5%. (B) Multidimensional scaling plots of different groups. (C) Spatial distribution of each grid at Site F. The ranges of density (individuals/100 m2) of each group are as follows: Group 1, 3584–17806; Group 2, 1075–3108; Group 3, 106–815; and Group 4, 0–133.The white triangles represent the TV grab and environmental detection stations. The vent sites are indicated by pentagrams.
The density of macrofauna at Site F was greater than that of the surrounding seabed, especially for dominant species. G. platifrons and S. crosnieri reached their highest densities of 560 and 396 individuals/m2, respectively. Their density distributions in every grid are shown in Figure 4. G. platifrons mostly covered a large area and had the highest population density in the north, while S. crosnieri was not widely distributed and had the highest population density in the south (Figure 4). These locations, which had a dense population of the dominant species, possessed visibly active seepages (such as the release of strings of bubbles from the seabed). In contrast, areas without any sign of seepage, such as shell debris and exposed carbonate rocks, had a relatively lower density of the dominant species. In comparison with G. platifrons and S. crosnieri, the abundance of Munidopsis sp. at these locations was not high, with 861 individuals and a maximum density of 45 individuals/m2. Other macrofauna densities in the mosaic were considerably lower than those of G. platifrons and S. crosnieri. Lithodes longispina, Ophidiidae sp., Benthesicymus sp., and Henricia sp. Populations reached 103, 55, 23, and 19 individuals/m2, respectively. In the meantime, the dominant species collected by TV grab in 2020 were counted to calculate the species density (Supplementary Table 1). TV grab collections showed that the highest densities of G. platifrons, Histampica sp., Bathyacmaea lactea, Phymorhynchus buccinoides, and Provanna glabra reached 629, 28, 56, 17, and 78 individuals/m2, respectively. The grabs in three stations showed that G. platifrons in GA (356 individuals/m2) and GB (336 and 330 individuals/m2) were similar in density, while S. crosnieri in GB (29 and 129 individuals/m2) was higher than GA (25 individuals/m2). Compared with GA and GB, the densities of G. platifrons (289 and 629 individuals/m2) and S. crosnieri (225 and 271 individuals/m2) in GC were relatively high. The Shannon–Weiner index of GC (1.15) was the highest, followed by GB (0.66) and GA (0.49).
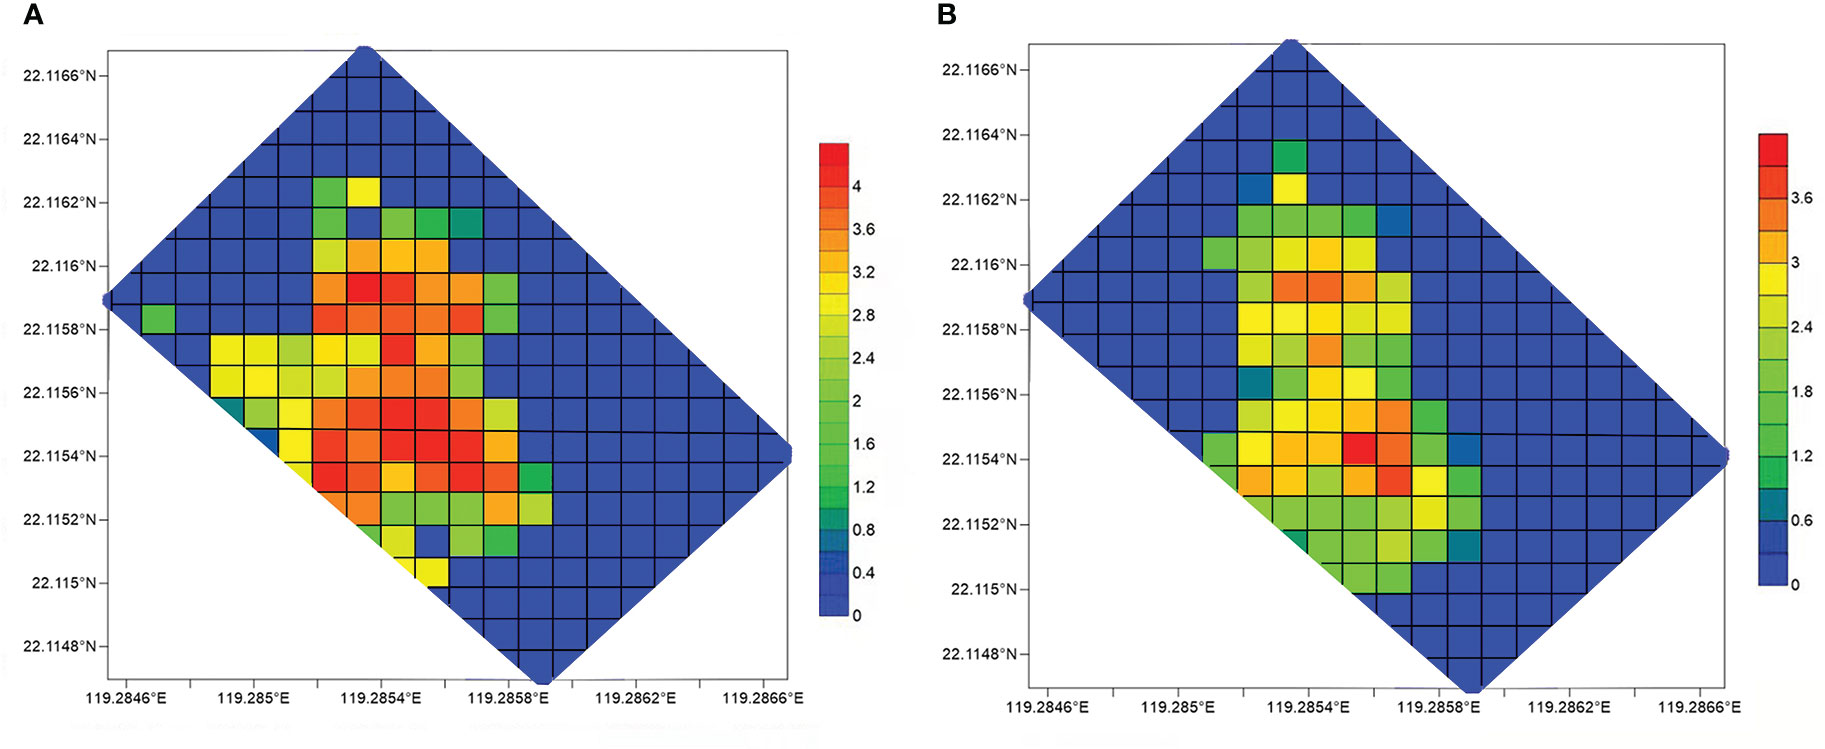
Figure 4 Density (log base 10) distribution of (A) G. platifrons and (B) S. crosnieri in every grid. The highest density of these two species reached 15,452 and 6,868 individuals/100 m2, respectively.
To assess the biomass of the dominant species, we calculated its wet and dry weight. For G. platifrons, flesh wet weight accounted for 20.78 ± 30.37% of total weight. Flesh dry weight accounted for 3.98 ± 5.08% of total weight and 19.07 ± 11.46% of flesh wet weight. Dry weight accounted for 32.82 ± 13.80% of wet weight in S. crosnieri. None of the data shows an obvious trend of change with the variation in body length. Meanwhile, the length-to- weight ratios of G. platifrons and S. crosnieri fit well (Table 1). The mean body lengths of these two species calculated from the mosaic were 74.44 mm and 39.08 mm, respectively. Therefore, their respective mean dry weights in the mosaic were 2.71 g and 3.81 g. Based on the total number of the two species, the dry biomass of Site F reached 726.15 kg. Otherwise, the ratio of dry weight to wet weight was used to calculate the biomass (dry weight) of the three stations in 2020. The highest and lowest total mean biomass per station were 1.62 kg dry weight/m2 (dw/m2) and 16.42 kg wet weight/m2 (ww/m2) at GC and 0.43 kg dw/m2 and 6.83 kg ww/m2at GB.
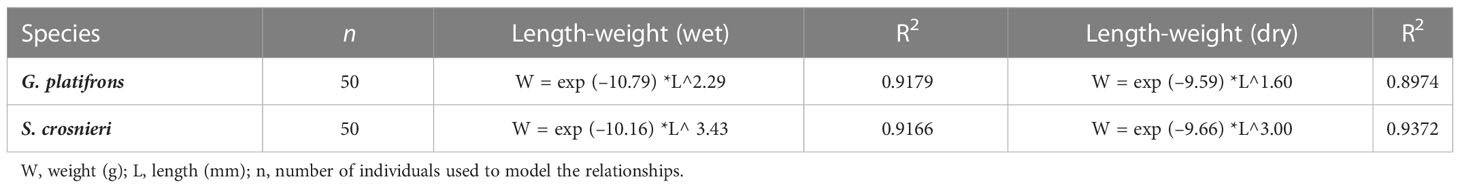
Table 1 The relationships between length and weight of G. platifrons and S. crosnieri. .
A patch distribution pattern of macrofauna was found at the Site F cold seep (Figures 4 and 5). Almost all macrofauna, such as G. platifrons, S. crosnieri, Lithodes longispina, and most of the Ophidiidae sp., were found living on or around the hard substrates. Meanwhile, some common species (B. lactea, P. buccinoides, Alvinocaris longirostris, and several species of Polynodiae) at Site F were also found on hard substrates through the TV grab and the ROV camera. According to grab operations in different substrates, the macrofauna in soft substrates, even in reduced sediments (only four types of macrofauna were found), had relatively low diversity and density when compared to hard substrates. Munidopsis sp. was found on carbonate rocks and the exterior (mainly a mix of mussels and shells) of the G. platifrons –S. crosnieri community. A phenomenon we observed was that Munidopsis sp. and S. crosnieri did not exist in large numbers (>30 individuals/m2) at the same location. An abundance of S. crosnieri was found at Site F, but no significant numbers of Munidopsis sp. In addition, two species of sponges, Esperiopsis sp. and Stlocordyla sp., were abundant (the highest density reached 578 individuals/m2) and widely distributed in carbonate rocks.

Figure 5 Spatial distribution of other macrofauna in the mosaic, including Lithodes Longispina (green), Benthesicymus sp. (red), Ophidiidae sp. (orange), cf. Semperella jiaolongae (yellow), cf. Bathypolypus (blue), cf. Bathyteuthoida (purple), Asteroidea (brown), Histampica sp. (pink), and cf. Cidaridae (white). The outline represents the area where images were obtained. Large patches of black and gray represent hard and soft bottoms, respectively.
3.3. Interannual variation in body length of the dominant species in different areas
The body length of the dominant species was measured to compare the age composition in different areas. The mean body lengths of G. platifrons and S. crosnieri we found in the mosaic in 2016 reached 35.89 to 94.15 mm and 24.26 to 55.35 mm, respectively. The central area was almost covered by the larger G. platifrons, while the larger S. crosnieri were abundant only in the southeast (Figure 6). Obvious signs of seepage were found in these two locations. To compare the interannual variation in body length, samples were taken from three stations (Supplementary Table 1). The average body length and weight in GA were higher as compared to those in the other locations. Individuals with a smaller body length (< 20 mm) and no signs of seepage were absent. Using the normal distribution of body length in 2016 and 2020, we analyzed the body length at these three stations (Figure 7). The average body length of G. platifrons and S. crosnieri in GA was significantly increased. Their length ranges were noticeably narrower. In contrast, the mean body length of G. platifrons in GB and GC decreased dramatically, with the former dropping from 70–80 mm to 30–40 mm and the latter dropping from 80–90 mm to 30–40 mm. The proportion of medium and small body lengths in both areas increased significantly.
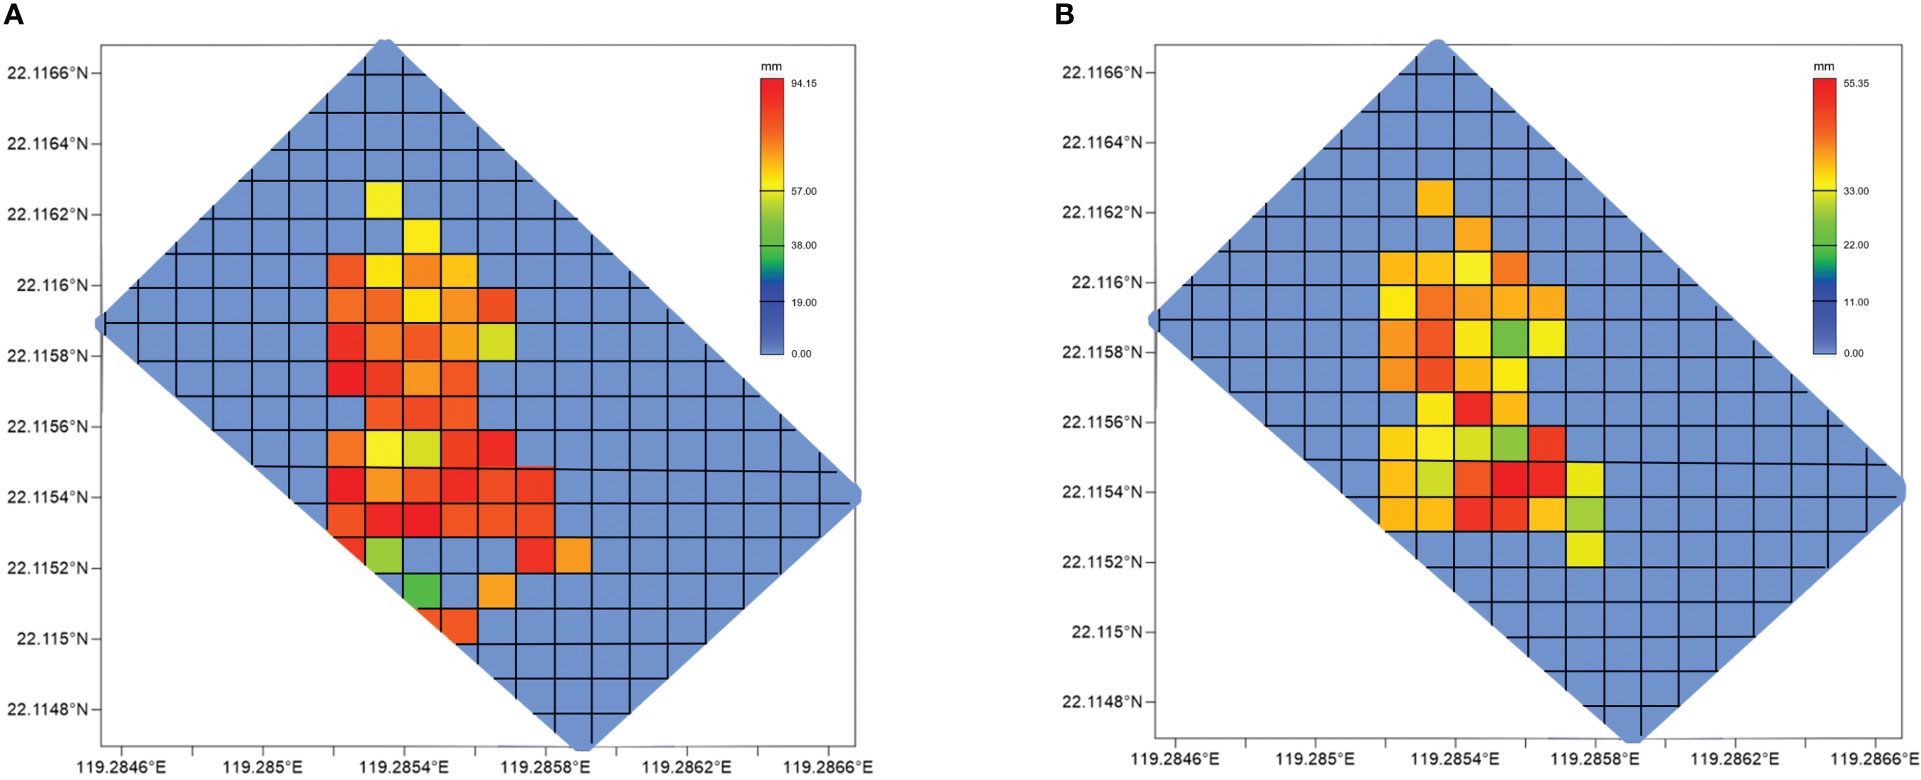
Figure 6 Body length distribution of (A) G. platifrons and (B) S. crosnieri in every grid. The maximum body length of these two species reached 94.15 and 55.35 mm, respectively.
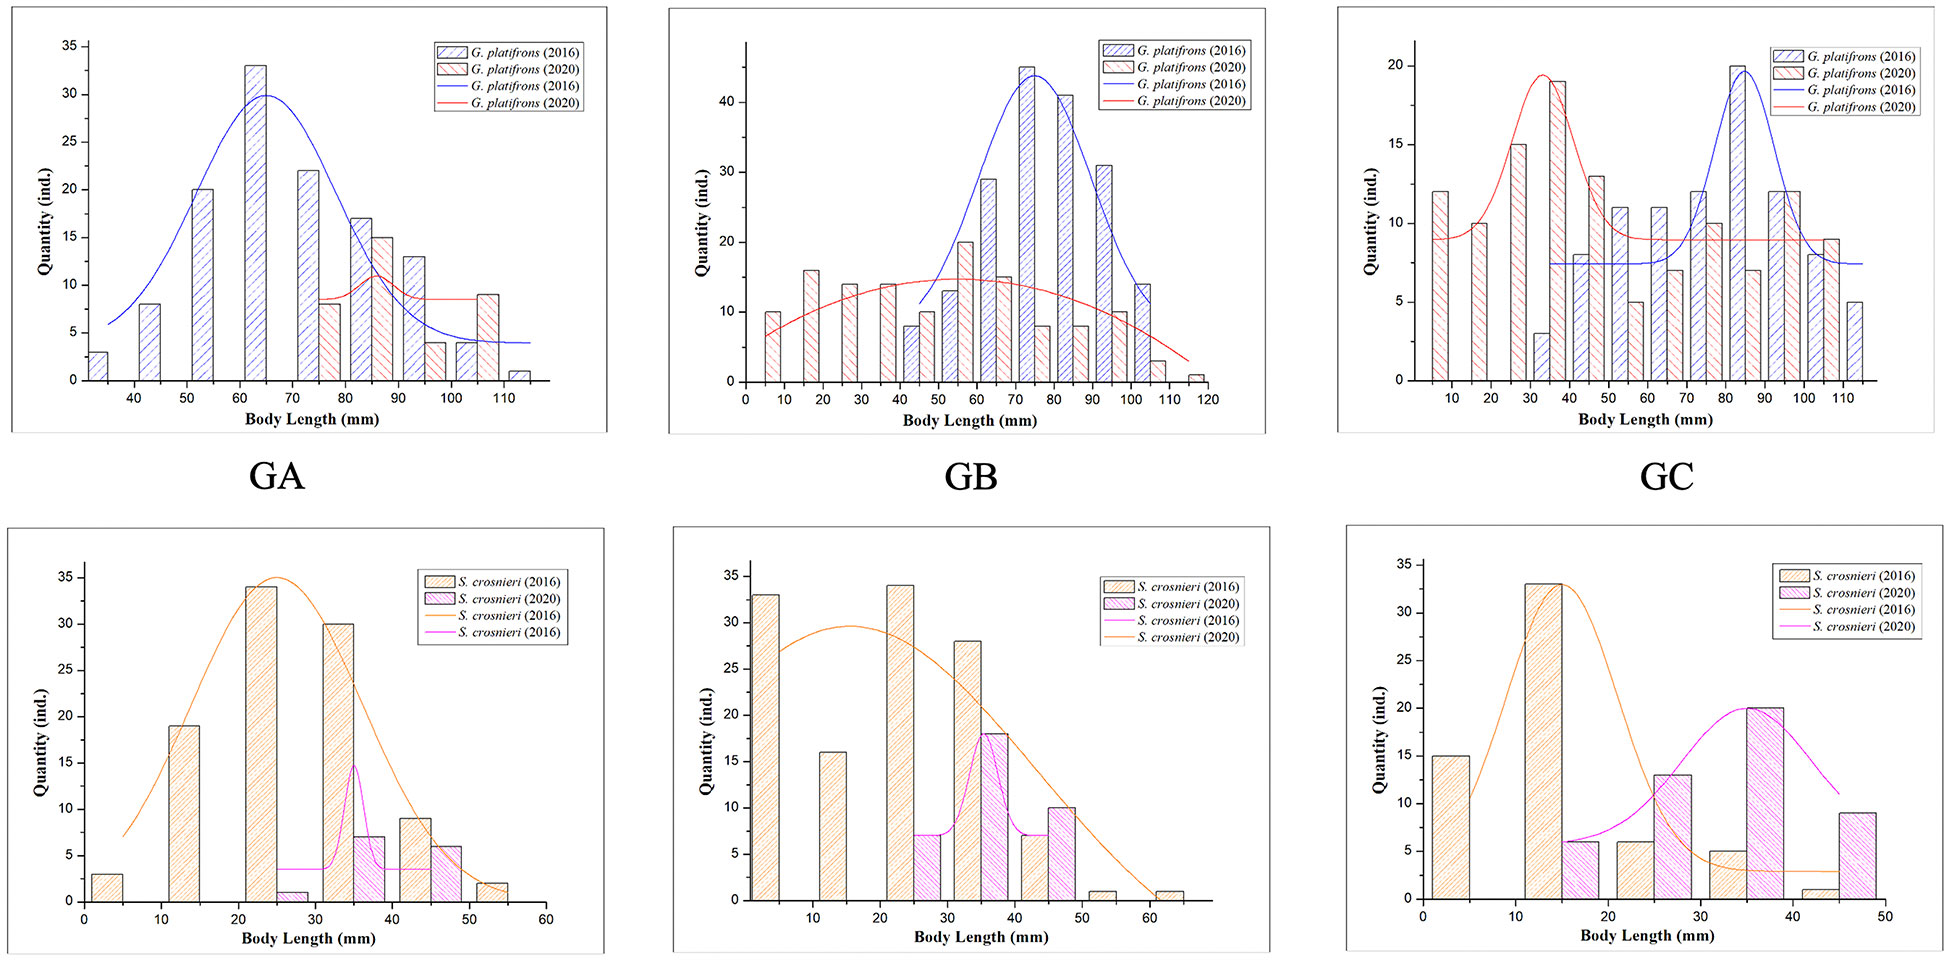
Figure 7 Interannual variation of organism length in three areas (GA, GB, and GC). The bar charts and curves are the actual quantity of different body length ranges and normally fitted curves, respectively.
3.4. The correlation between methane, oxygen, and dominant species
The concentration of methane showed a strong positive correlation with the density of G. platifrons (r = 0.895, P < 0.05) and S. crosnieri (r = 0.833, P = 0.08), while DO showed a strong negative correlation with G. platifrons (r = –0.908, P < 0.05) and S. crosnieri (r = –0.823, P = 0.08).
The oxygen consumption calculated from the 2.71 g dry weight of G. platifrons was 17.54 μmol/(g dry weight by h). G. platifrons consumed 14.62 μmol/(g dry weight by h) of CH4. Therefore, with a dry weight of 2.71 g and a quantity of 215,339 individuals, the G. platifrons in the whole of Site F (2,000 m2) consumed 204.74 mol of methane per day. Methane consumption of S. crosnieri at the entire Site F was 1.78 mol/d by 37,422 individuals.
4. Discussion
4.1. Seep community compositions in Site F
For the Site F cold seep, 41 species of macrofauna were found in our study. Compared with 42 chemosynthesis-based ecosystems in the northwest Pacific (range 2–38), including cold seeps in Sagami Bay, Nankai Trough, and so on, the species richness of Site F was high (Nakajima et al., 2014; Zhao et al., 2020). A previous study proved the strong influences among seepage activity and density, species evenness, and taxonomic composition of macrofauna (Levin et al., 2017). The relatively young carbonate rocks at Site F (Feng et al., 2018) suggested that past seep activity may have contributed to the relatively high species diversity. In addition to the previously reported macrofauna from the Formosa cold seep (Dong and Li, 2015; Li, 2017; Zhang et al., 2020; Zhao et al., 2020), we also found some new or newly recorded species. This indicates that species richness in this area remains under-sampled. It is worth noting that almost half of the species were found through TV grabs. Most of these were new or newly recorded species. Thus, further research on traditional physical collection could help in the discovery of possible new species.
Density-wise, Bivalvia, mainly G. platifrons, and Crustacea, particularly S. crosnieri, dominated community composition at Site F. The highest densities of these two species in the mosaic reached 560 and 396 individuals/m2, respectively. Our research found a higher density of G. platifrons (629 individuals/m2) with our TV grab in 2020. This was more than double what Zhao et al. (2020) had previously reported. However, there were still a substantial number of individuals that had not been collected. Therefore, the density of G. platifrons and S. crosnieri at Site F has been greatly underestimated. The total mean biomass at Site F was low when compared with other cold seeps, including the Monterey Bay (0.7–2.05 kg ash-free dry mass/m2), the Gulf of Mexico (0.47–3.13 kg ash- free dry mass/m2), and the Peru Trench (30 kg ww/m2) (Olu et al., 1996; Bergquist et al., 2003; Barry et al., 2007). One cold seep dominated by vesicomyid at the Regab pockmark (0.77–2.03 kg dw/m2) (Decker et al., 2012) had the closest amount of biomass. However, because of the undersampling of the dominant species, the biomass at Site F was underestimated.
4.2. Distribution pattern of macrofauna and environment at Site F
Site F had both hard (central authigenic carbonates) and soft (peripheral muddy) substrates. This pattern may be a result of the succession of cold seeps. When seepage begins in an area, microbial mats form and methanogenesis occurs, creating carbonates (Levin, 2005). Then, the fauna began to gather. As time goes on, the outermost mussel beds decompose into shell debris.
Almost all the macrofauna were found on or around the hard substrates (mainly the authigenic carbonates), and their relatively high density was always found at the locations where there were obvious signs of seepage. Authigenic carbonates appeared to be a major factor contributing to the higher macrofaunal diversity and abundance (Sen et al., 2019). This is mainly because these structures (e.g., cracks, outcrops) formed by authigenic carbonates can enhance habitat heterogeneity and might be used as the migration pathway for seepage. For example, small clusters of S. crosnieri can be found living in the cracks formed by authigenic carbonates. These cracks might be used as the dominant migration pathway for cold seep fluid transportation and provide sufficient energy and shelter for the overlying fauna. Some macrofauna, such as some top predators (L. longispina, Ophidiidae sp., Henricia sp.) and some small species (like Histampica sp. and some Gastropoda) were also observed in the vicinity of carbonates (Figure 5) because the high biomass communities formed by G. platifrons and S. crosnieri could provide more food sources. Some studies also found that the prevalence of provannid snails, pyropeltid limpets, and polynoid polychaetes occurred on carbonates in common with another hard substrate vent, seep, and whale fall communities in the Pacific (Bergquist et al., 2007; Levin and Le Bris, 2015). L. longispina has been observed feeding on G. platifrons and possibly S. crosnieri (Li, 2017). Bathyacmaea lactea, a type of limpet, may consume biofilm on mussel shells (Chen et al., 2019). As for soft substrates, even in the reduced sediments, there was a lack of macrofauna. Only three species (Solemya sp., Glycera sp., and Chaetoderma sp.) were discovered in locations where oxidizing and reducing sediments were mixed. Sulfide in reduced sediments, a vital energy source, is important for the regulation of sulfide-dependent symbiont-bearing species (Cao et al., 2021). Despite the fact that it has been proven that animals can adapt to the toxic sulfide (Grieshaber and Volkel, 1998), relatively high concentrations may prevent biological adaptations. Otherwise, habitat suitability, geochemical differences, fluid flow, and seepage rates also had an effect on species distribution (Roy et al., 2007; Rybakova et al., 2013; Sen et al., 2018).
Overall, a distinct patchy distribution pattern of macrofauna was found in the mosaic, where the most abundant areas were clustered in the center of the entire cold seep area. Strong spatial differences in faunal composition and large aggregations characterized the megafauna pattern at the seep site (Astrom et al., 2018). Other cold seep ecosystems with patchy faunal distributions include the pockmark Regab, a cold seep near Baltimore Canyon, the northern Peruvian margin, and so on (Olu et al., 1996; Menot et al., 2010; Bourque et al., 2017). To clarify the spatial differences at Site F, we analyzed the macrofauna composition by comparing five stations in the south and north. Predictable successional processes were occurring within the G. platifrons –S. crosnieri communities. The density, biomass, and diversity of the associated macrofauna all decreased in the north. Narrowed body length ranges, a lack of juveniles (Figure 7), and the disappearance of the cold seep vent may indicate that the northern region was in the final stages of the cold seep eruption and on the way to extinction. In the south, however, high densities and biomass of macrofauna were discovered. An obvious cold seep vent was found in this area in 2020, which may have contributed to a rise in local primary productivity. Some local macrofauna, such as B. lactea, P. glabra, and Histampica sp., were abundant in the south, especially in the southeast. Therefore, in 2020, the macrofauna in the north at Site F was declining, whereas the southern macrofauna was thriving .
4.3. The interaction between environmental factors and dominant species
The dominant species in the cold seep area had strong connections with methane and DO concentrations. In in situ environment detection and macrofauna collection were critical for better understanding these connections. However, the variation in these environmental factors, especially methane, was relatively different in the cold seep area (Cao et al., 2021). Indeed, a number of studies have shown that the concentration of methane can vary greatly in a short period of time, even by an order of magnitude (Davide et al., 2013; Bayrakci et al., 2014). This undoubtedly increased the difficulty of detection. Data from several stations were used to understand the interaction between environmental factors and dominant species. G. platifrons and S. crosnieri in central areas that had relatively high concentrations of methane were found to have comparatively higher densities (Supplementary Table 1). G. platifrons and S. crosnieri obtained energy through symbiosis with methane-oxidizing bacteria and were limited to areas where chemical flux was sufficient for endosymbiont nutrition (Sibuet and Olu, 1998). This may also suggest that high methane concentrations have some positive effects on these two species. As for DO, we attributed the negative correlation to oxygen consumption by life processes. Other environmental factors, including temperature, pH, salinity, and depth, were also applied in correlation analysis and showed insignificant correlations. In addition, to better understand the biological-environmental relationships, more sampling sites and environmental factors (such as fluid flow, seepage rate, and so on) needed to be included in future investigations.
The consumption of methane (204.74 and 1.78 mol/d) at the entire Site F by the dominant species G. platifrons and S. crosnieri was estimated. The equation between oxygen consumption and body weight of mytilids was used to calculate the oxygen consumption of G. platifrons. The conditions for this equation were that the dry weight of bivalves should be 0.03- 4 g (Khripounoff et al., 2017). The dry weight of G. platifrons at Site F was predominantly in the range of 0.03–2.36 g. Meanwhile, the similar temperature of the habitat could also reduce the estimation error because temperature is the most important factor affecting oxygen consumption. Since it was assumed that mytilids were solely responsible for oxygen consumption , the oxygen consumption of G. platifrons may be overestimated. As for the relationship between methane and oxygen, the presence of related species (Gigantidas sp.) at Site F and the Gulf of Mexico added credibility to the estimation of methane consumption. For assessing the influence of dominant species on methane flux, the methane flux (60-1,598 mol/d) at the whole of Site F (20,000 m2) was estimated according to Mau et al. (2020). Methane consumption by the dominant species accounted for 12.93% of the maximum methane flux at Site F. Although the methane flux was underestimated (ignoring any methane that remained in bubbles), the consumption of methane by macrofauna on the seafloor cannot be ignored.
5. Conclusions
The combination of habitat mapping and physical collection is an important method for characterizing seafloor ecosystems. Imagery provided an opportunity to identify the structure, composition, and temporal change of macrofauna communities on a larger scale. Our quantitative evidence of images and TV grab data revealed the number, body length, biomass, and distribution of the dominant species living in the cold seep area at Site F. Combined with porewater geochemistry (e.g., dissolved oxygen and methane concentrations), a high-resolution map of macrofauna could be used to estimate population dynamics. Methane consumption by macrofauna indicates that they play an important role in affecting methane fluxes. Seepage and authigenic carbonate exerted strong control over the diversity, taxonomic composition, and density of macrofauna at Site F. However, habitat suitability, geochemical differences, fluid flow, and seepage rate probably also played other roles in enhancing the richness and density of macrofauna, although this could not be specifically explained in our study. Therefore, more sampling is needed for further research. An enhanced understanding of methane flux and associated sediment geochemistry, coupled with the composition of the macrofauna community, could benefit the ecosystem modelling relating to the macrofauna structure and function of cold seeps. All of our data contributed to ecosystem modeling, which is key to promoting sustainable management of the deep seas.
Data availability statement
The raw data supporting the conclusions of this article will be made available by the authors, without undue reservation.
Author contributions
Conceptualization, HW and CL; data curation, HW, and ZL; formal analysis, HW; funding acquisition, CL; investigation, HW, LC, and ZZ; methodology, HW and CL; validation, HW; writing—original draft, HW; writing—review and editing, CL and XW. All authors contributed to the article and approved the submitted version.
Funding
This work was supported by the National Natural Science Foundation of China (42030407 and 42076091).
Acknowledgments
The samples and data were collected by R.V. Kexue. We thank Lei Cao and Chao Lian for their help in environmental data collection. We appreciate the help of Minxiao Wang, Xin Zhang, and Zhendong Luan in data analysis.
Conflict of interest
The authors declare that the research was conducted in the absence of any commercial or financial relationships that could be construed as a potential conflict of interest.
Publisher’s note
All claims expressed in this article are solely those of the authors and do not necessarily represent those of their affiliated organizations, or those of the publisher, the editors and the reviewers. Any product that may be evaluated in this article, or claim that may be made by its manufacturer, is not guaranteed or endorsed by the publisher.
Supplementary material
The Supplementary Material for this article can be found online at: https://www.frontiersin.org/articles/10.3389/fmars.2023.1068916/full#supplementary-material
References
Amon D. J., Gobin J., Van Dover C. L., Levin L. A., Marsh L., Raineault N. A. (2017). Characterization of methane-seep communities in a deep-Sea area designated for oil and natural gas exploitation off Trinidad and Tobago. Front. Mar. Sci. 4. doi: 10.3389/fmars.2017.00342
Astrom E. K. L., Carroll M. L., Ambrose W. G. Jr., Sen A., Silyakova A., Carroll J. (2018). Methane cold seeps as biological oases in the high-Arctic deep sea. Limnol. Oceanogr. 63, S209–S231. doi: 10.1002/lno.10732
Barry J. P., Whaling P. J., Kochevar R. K. (2007). Growth, production, and mortality of the chemosynthetic vesicomyid bivalve, calyptogena kilmeri from cold seeps off central California. Mar. Ecol. an Evol. Perspect. 28 (1), 169–182. doi: 10.1111/j.1439-0485.2007.00119.x
Bayrakci G., Scalabrin C., Dupré S., Leblond I., Tary J.-B., Lanteri N., et al. (2014). Acoustic monitoring of gas emissions from the seafloor. part II: a case study from the Sea of marmara. Mar. Geophys. Res. 35 (3), 211–229. doi: 10.1007/s11001-014-9227-7
Bergquist D. C., Eckner J. T., Urcuyo I. A., Cordes E. E., Hourdez S., Macko S. A., et al. (2007). Using stable isotopes and quantitative community characteristics to determine a local hydrothermal vent food web. Mar. Ecol. Prog. Ser. 330, 49–65. doi: 10.3354/meps330049
Bergquist D. C., Ward T., Cordes E. E., McNelis T., Howlett S., Kosoff R., et al. (2003). Community structure of vestimentiferan-generated habitat islands from gulf of Mexico cold seeps. J. Exp. Mar. Biol. Ecol. 289 (2), 197–222. doi: 10.1016/s0022-0981(03)00046-7
Bourque J. R., Robertson C. M., Brooke S., Demopoulos A. W. J. (2017). Macrofaunal communities associated with chemosynthetic habitats from the U.S. Atlantic margin: A comparison among depth and habitat types. Deep Sea Res. Part II: Topical Stud. Oceanogr. 137, 42–55. doi: 10.1016/j.dsr2.2016.04.012
Cao L., Lian C., Zhang X., Zhang H., Wang H., Zhou L., et al. (2021). In situ detection of the fine scale heterogeneity of active cold seep environment of the Formosa ridge, the south China Sea. J. Mar. Syst. 218, 103530. doi: 10.1016/j.jmarsys.2021.103530
Carney R. S. (1994). Consideration of the oasis analogy for chemosynthetic communities at gulf of Mexico hydrocarbon vents. Geo Marine Lett. 14 (2-3), 149–159. doi: 10.1007/BF01203726
Chen C., Watanabe H. K., Nagai Y., Toyofuku T., Xu T., Sun J., et al. (2019). Complex factors shape phenotypic variation in deep-sea limpets. Biol. Lett. 15 (10), 20190504. doi: 10.1098/rsbl.2019.0504
Cochrane G. R., Lafferty K. D. (2002). Use of acoustic classification of sidescan sonar data for mapping benthic habitat in the northern channel islands, California. Continental Shelf Res. 22 (5), 683–690. doi: 10.1016/S0278-4343(01)00089-9
Cordes E. E., Bergquist D. C., Fisher C. R. (2009). Macro-ecology of gulf of Mexico cold seeps. Ann. Rev. Mar. Sci. 1, 143–168. doi: 10.1146/annurev.marine.010908.163912
Cordes E. E., Cunha M. R., Galeron J., Mora C., Olu-Le Roy K., Sibuet M., et al. (2010). The influence of geological, geochemical, and biogenic habitat heterogeneity on seep biodiversity. Mar. Ecol. an Evol. Perspect. 31 (1), 51–65. doi: 10.1111/j.1439-0485.2009.00334.x
Davide E., Giuditta M., Francesco F., Stephen M., Giuseppe E., Luca G., et al. (2013). Monitoring of gas and seismic energy release by multiparametric benthic observatory along the north Anatolian fault in the Sea of marmara (NW Turkey). Geophys. J. Int. 196 (2), 850–866. doi: 10.1093/gji/ggt436
Decker C., Caprais J.-C., Khripounoff A., Olu K. (2012). First respiration estimates of cold seep vesicomyid bivalves from in situ total oxygen uptake measurements. Comptes Rendus Biologies 335 (4), 261–270. doi: 10.1016/j.crvi.2012.03.002
Degraer S., Verfaillie E., Willems W., Adriaens E., Vincx M., Lancker V. V. (2008). Habitat suitability modelling as a mapping tool for macrobenthic communities: An example from the Belgian part of the north Sea. Continental Shelf Res. 28 (3), 0–379. doi: 10.1016/j.csr.2007.09.001
Dong D., Li X. (2015). Galatheid and chirostylid crustaceans (Decapoda: Anomura) from a cold seep environment in the northeastern south China Sea. Zootaxa 4057 (1), 91–105. doi: 10.11646/zootaxa.4057.1.5
Feng D., Cheng M., Kiel S., Qiu J.-W., Yang Q., Zhou H., et al. (2015). Using bathymodiolus tissue stable carbon, nitrogen and sulfur isotopes to infer biogeochemical process at a cold seep in the south China Sea. Deep Sea Res. Part I Oceanogr. Res. Papers 104, 52–59. doi: 10.1016/j.dsr.2015.06.011
Feng D., Qiu J.-W., Hu Y., Peckmann J., Guan H., Tong H., et al. (2018). Cold seep systems in the south China Sea: An overview. J. Asian Earth Sci. 168, 3–16. doi: 10.1016/j.jseaes.2018.09.021
Grieshaber M. K., Volkel S. (1998). Animal adaptations for tolerance and exploitation of poisonous sulfide. Annu. Rev. Physiol. 60, 33–53. doi: 10.1146/annurev.physiol.60.1.33
Khripounoff A., Caprais J. C., Decker C., Le Bruchec J., Noel P., Husson B. (2017). Respiration of bivalves from three different deep-sea areas: Cold seeps, hydrothermal vents and organic carbon-rich sediments. Deep Sea Res. Part II: Topical Stud. Oceanogr. 142, 233–243. doi: 10.1016/j.dsr2.2016.05.023
Kochevar R. E., Childress J. J., Fisher C. R., Minnich E. (1992). The methane mussel: roles of symbiont and host in the metabolic utilization of methane. Mar. Biol. 112, 389–401. doi: 10.1007/978-94-024-0884-3_3
Laubier L. (1993). La vie aux frontières du possible: Les oasis animales des grandes profondeurs marines. Sciences (1969) 93(2-3): 99–115.
Levin L. A. (2005). “Ecology of cold seep sediments: Interactions of fauna with flow, chemistry and microbes,” in Oceanography and Marine Biology - An Annual Review, Vol. 43 . Eds. Gibson R. N., Atkinson R. J. A., Gordon J. D. M.(Boca Raton, FL: CRC Press), 1–46. doi: 10.1201/9781420037449.ch1
Levin L. A., Baco A. R., Bowden D. A., Colaco A., Cordes E. E., Cunha M. R., et al. (2016). Hydrothermal vents and methane seeps: Rethinking the sphere of influence. Front. Mar. Sci. 3. doi: 10.3389/fmars.2016.00072
Levin L. A., James D. W., Martin C. M., Rathburn A. E., Harris L. H., Michener R. H. (2000). Do methane seeps support distinct epifaunal assemblages? observations on community structure and nutrition from the northern California slope and shelf. Mar. Ecol. Prog. Ser. 208, 21–39. doi: 10.3354/meps208021
Levin L. A., Le Bris N. (2015). The deep ocean under climate change. Science 350 (6262), 766–768. doi: 10.1126/science.aad0126
Levin L. A., Mendoza G. F., Grupe B. M. (2017). Methane seepage effects on biodiversity and biological traits of macrofauna inhabiting authigenic carbonates. Deep Sea Res. Part II: Topical Stud. Oceanogr. 137, 26–41. doi: 10.1016/j.dsr2.2016.05.021
Li X. (2015). Report on two deep-water caridean shrimp species (Crustacea: Decapoda: Caridea: Alvinocarididae, acanthephyridae) from the northeastern south China Sea. Zootaxa 3911 (1), 130–138. doi: 10.11646/zootaxa.3911.1.8
Li X. (2017). Taxonomic research on deep-sea macrofauna in the south China Sea using the Chinese deep-sea submersible Jiaolong. Integr. Zool. 12 (4), 270–282. doi: 10.1111/1749-4877.12254
Lin S., Lim Y., Liu C. S., Yang T. F., Chen Y. G., Machiyama H., et al. (2007). Formosa Ridge, a cold seep with densely populated chemosynthetic community in the passive margin, southwest of Taiwan. Geochimica Et Cosmochimica Acta 71 (15), A582. doi: 10.1007/s11001-017-9339-y
MacDonald I. R., Sager W. W., Peccini M. B. (2003). Gas hydrate and chemosynthetic biota in mounded bathymetry at mid-slope hydrocarbon seeps: Northern Gulf of Mexico. Marine Geology 198(1-2), 133–158. doi: 10.1016/s0025-3227(03)00098-7.
Mau S., Tu T. H., Becker M., Ferreira C., Chen C. N., Lin L. H., et al. (2020). Methane seeps and independent methane plumes in the south China Sea offshore Taiwan. Front. Mar. Sci. 7. doi: 10.3389/fmars.2020.00543
Menot L., Galeron J., Olu K., Caprais J.-C., Crassous P., Khripounoff A., et al. (2010). Spatial heterogeneity of macrofaunal communities in and near a giant pockmark area in the deep gulf of Guinea. Mar. Ecol. an Evol. Perspect. 31 (1), 78–93. doi: 10.1111/j.1439-0485.2009.00340.x
Nakajima R., Yamakita T., Watanabe H., Fujikura K., Tanaka K., Yamamoto H., et al. (2014). Species richness and community structure of benthic macrofauna and megafauna in the deep-sea chemosynthetic ecosystems around the Japanese archipelago: An attempt to identify priority areas for conservation. Divers. Distrib. 20, 1160–1172. doi: 10.1111/ddi.12204
Olu K., Duperret A., Sibuet M., Foucher J. P., FialaMedioni A. (1996). Structure and distribution of cold seep communities along the Peruvian active margin: Relationship to geological and fluid patterns. Mar. Ecol. Prog. Ser. 132 (1-3), 109–125. doi: 10.3354/meps132109
Roy K. O.-L., Caprais J. C., Fifis A., Fabri M. C., Galeron J., Budzinsky H., et al. (2007). Cold-seep assemblages on a giant pockmark off West Africa: Spatial patterns and environmental control. Mar. Ecol. an Evol. Perspect. 28 (1), 115–130. doi: 10.1111/j.1439-0485.2006.00145.x
Rybakova E., Galkin S., Bergmann M., Soltwedel T., Gebruk A. (2013). Density and distribution of megafauna at the håkon mosby mud volcano (the barents Sea) based on image analysis. Biogeosciences 10 (5), 3359–3374. doi: 10.5194/bg-10-3359-2013
Sen A., Ondréas H., Gaillot A., Marcon Y., Augustin J.-M., Olu K. (2016). The use of multibeam backscatter and bathymetry as a means of identifying faunal assemblages in a deep-sea cold seep. Deep Sea Research Part I: Oceanographic Research Papers 110, 33–49. doi: 10.1016/j.dsr.2016.01.005.
Sen A., Astrom E. K. L., Hong W.-L., Portnov A., Waage M., Serov P., et al. (2018). Geophysical and geochemical controls on the megafaunal community of a high Arctic cold seep. Biogeosciences 15 (14), 4533–4559. doi: 10.5194/bg-15-4533-2018
Sen A., Chitkara C., Hong W. L., Lepland A., Cochrane S., di Primio R., et al. (2019). Image based quantitative comparisons indicate heightened megabenthos diversity and abundance at a site of weak hydrocarbon seepage in the southwestern barents Sea. PeerJ 7, e7398. doi: 10.7717/peerj.7398
Sibuet M., Olu K. (1998). Biogeography, biodiversity and fluid dependence of deep-sea cold-seep communities at active and passive margins. Deep Sea Res. Part Ii Topical Stud. Oceanogr. 45 (1-3), 517–567. doi: 10.1016/s0967-0645(97)00074-x
Vanreusel A., Andersen A. C., Boetius A., Connelly D., Cunha M. R., Decker C., et al. (2009). Biodiversity of cold seep ecosystems along the European margins. Oceanography 22 (1), 110–127. doi: 10.5670/oceanog.2009.12
Wang H., Fu X., Zhao C., Luan Z., Li C. (2021). A deep learning model to recognize and quantitatively analyze cold seep substrates and the dominant associated species. Front. Mar. Sci. 8. doi: 10.3389/fmars.2021.775433
Wang X., Liu B., Qian J., Zhang X., Guo Y., Su P., et al. (2018). Geophysical evidence for gas hydrate accumulation related to methane seepage in the taixinan basin, south China Sea. J. Asian Earth Sci. 168, 27–37. doi: 10.1016/j.jseaes.2017.11.011
Wang B., Song Y., Du Z. (2019). A submarine imaging and laser profiling system and its application to cold seep site investigation off southwestern Taiwan. Mar. Geol. Lett. 35 (11), 60–65. doi: 10.16028/j.1009-2722.2019.11009
Watsuji T.-o., Yamamoto A., Takaki Y., Ueda K., Kawagucci S., Takai K. (2014). Diversity and methane oxidation of active epibiotic methanotrophs on live Shinkaia crosnieri. Isme J. 8 (5), 1020–1031. doi: 10.1038/ismej.2013.226
Zhang X., Du Z., Luan Z., Wang X., Xi S., Wang B., et al. (2017). In situ raman detection of gas hydrates exposed on the seafloor of the south China Sea. Geochem. Geophys. Geosystems 18 (10), 3700–3713. doi: 10.1002/2017gc006987
Zhang S., Zhang S., Chen H. (2020). Enigmaticolus inflatus sp. nov., a new buccinid species from a methane seep area in the south China Sea (Gastropoda: Neogastropoda). Zootaxa 4728 (3), 385–389. doi: 10.11646/zootaxa.4728.3.8
Keywords: macrofauna, cold seep, density, body length, distribution, methane consumption
Citation: Wang H, Wang X, Cao L, Zhong Z, Luan Z and Li C (2023) Macrofauna community of the cold seep area at Site F, South China Sea. Front. Mar. Sci. 10:1068916. doi: 10.3389/fmars.2023.1068916
Received: 13 October 2022; Accepted: 09 January 2023;
Published: 23 January 2023.
Edited by:
Elva G. Escobar-Briones, National Autonomous University of Mexico, MexicoReviewed by:
Zhilei Sun, Qingdao Institute of Marine Geology (QIMG), ChinaXiaoshou Liu, Ocean University of China, China
Copyright © 2023 Wang, Wang, Cao, Zhong, Luan and Li. This is an open-access article distributed under the terms of the Creative Commons Attribution License (CC BY). The use, distribution or reproduction in other forums is permitted, provided the original author(s) and the copyright owner(s) are credited and that the original publication in this journal is cited, in accordance with accepted academic practice. No use, distribution or reproduction is permitted which does not comply with these terms.
*Correspondence: Chaolun Li, bGNsQHFkaW8uYWMuY24=