 Joo-Eun Yoon
 David King2
 Jack Longman
 Shane J. Cronin
- 1Centre for Climate Repair at Cambridge, Department of Applied Mathematics and Theoretical Physics, University of Cambridge, Cambridge, United Kingdom
- 2Downing College, University of Cambridge, Cambridge, United Kingdom
- 3Marine Isotope Geochemistry, Institute for Chemistry and Biology of the Marine Environment (ICBM), University of Oldenburg, Oldenburg, Germany
- 4Department of Geography and Environmental Sciences, Northumbria University, Newcastle upon Tyne, United Kingdom
- 5School of Environment, The University of Auckland, Auckland, New Zealand
When it is deposited in the ocean, volcanic ash has the potential to release iron and other nutrients into surface water to stimulate ocean productivity. In the western South Pacific Ocean (SPO), one of the most important volcanic ash deposition regions, occasional widespread transport of volcanic ash may supply the nutrients not only locally around source islands but also within the wider the western SPO, accompanied by phytoplankton response. Through a comparative analysis of satellite and reanalysis data for the past 19 years (2004–2022), this study reveals that four explosive volcanic eruptions, Rabaul volcano, Papua New Guinea (October, 2006), Ambae volcano, Vanuatu (July, 2018), Ulawun volcano, Papua New Guinea (June, 2019), and Hunga volcano, Tonga (January, 2022), had the most strong stratospheric injection (>15 km) and mass loading of volcanic materials over the wider the western SPO (covering an area of >765,000 km2). The transport of 2006, 2018, 2019 volcanic emissions, was not likely associated with significant ash deposition over the western SPO. However, the Hunga eruption led to the deposition of ash-laden volcanic plumes over a wide area (~2,000 km from source), and was followed by the increase in chlorophyll-a concentrations (Chl-a) in the region (~70% increase). Minor changes related to other nutrient sources (e.g., hydrothermal input) suggest a link between the increase in Chl-a and 2022 Hunga ash falls over the western SPO. Our results indicate that volcanic ash deposition has implications for phytoplankton productivity in the western SPO, and highlights the need for further research into understanding how nutrient supply alleviated limitations of phytoplankton at the community level.
1 Introduction
Anthropogenic greenhouse gas release to the atmosphere since the beginning of the industrial era has caused climate change and global warming, with the oceans taking up more than 90% of the excess heat trapped in the earth system (Cooley et al., 2022). This increased ocean temperature has resulted in greater water-column stability and stronger ocean stratification, contributing to a decrease in phytoplankton biomass, due to a decrease in upward nutrient flux to the euphotic zone (Behrenfeld et al., 2006; Boyce et al., 2010; Bindoff et al., 2019; Li et al., 2020b). The external supply of nutrients to the marine environments (e.g., atmospheric deposition and riverine input) therefore is recognized to play an increasingly important role in marine biogeochemical cycles and marine ecosystems, helping to offset reduced nutrient supply via upwelling (Duce et al., 2008; Wang et al., 2015; Yoon et al., 2022).
Atmospheric deposition episodically transports macro- and micronutrients (N, P, Si, Fe, and other metals) from natural (e.g., desert dust, volcanic ash, and forest fires) and anthropogenic sources (e.g., fossil fuel combustion and biomass burning) to the surface ocean throughout the globe (Guieu et al., 2014; Kim et al., 2014; Jickells and Moore, 2015; Ventura et al., 2021; Longman et al., 2022). In particular, volcanic ash, which is formed during explosive volcanic eruptions, is highly reactive and can rapidly release iron and other nutrients (Si, N, Mn) into the surface water to stimulate ocean productivity (Frogner et al., 2001; Duggen et al., 2007; Jones and Gislason, 2008; Longman et al., 2022). This can occur on local to regional scales, with wide ranges in the nutrient supply, dependant on ash-loading, ash particle size, chemical composition, and surface salt coatings (Duggen et al., 2007; Hamilton et al., 2022). Several studies have shown that elevated fluxes of metals and nutrients following the deposition of volcanic ash stimulated primary productivity (PP) not only in high-nitrate low-chlorophyll (HNLC) regions but also in low-nitrate low-chlorophyll (LNLC) regions (Hamme et al., 2010; Langmann et al., 2010; Lin et al., 2011; Achterberg et al., 2013; Olgun et al., 2013b). Accordingly, volcanic ash has been suggested as a fertilizer material to promote ocean productivity (Duggen et al., 2010; Hamme et al., 2010; Olgun et al., 2013b; Longman et al., 2019; Longman et al., 2020).
The western South Pacific Ocean (SPO), a highly stratified oligotrophic system (the low-nutrient situation; Bock et al., 2018), has been recently described as a hot spot of dinitrogen (N2) fixing organisms, which contribute to the high levels of PP (Bonnet et al., 2017; Caffin et al., 2018). In this region, the west–east gradient of N2 fixation, with higher values in the western parts, has been attributed to the alleviation of iron limitation by hydrothermal submarine iron inputs, island sediment, and land runoff in the west of the Tonga arc (Shiozaki et al., 2014; Bonnet et al., 2018; Guieu et al., 2018; Moutin et al., 2018; Tilliette et al., 2022). However, the western SPO, as one of most important volcanic ash deposition regions, has the potential to be fertilized by the transport of volcanic ash from the explosive eruptions, such as the volcano from Tonga, Vanuatu, and Papua New Guinea (Figure S1A) (Kloss et al., 2020; McKee et al., 2021; Filho et al., 2022; Hamilton et al., 2022; Mishra et al., 2022). As the work of Barone et al. (2022) first detailed, the eruption of Hunga volcano on 15 January 2022, the most explosive of the 21st century, led to a massive chlorophyll-a (Chl-a) increase around Tonga island, stimulated by nutrients supplied through ash deposition. However, several studies have observed the presence of discolored water plumes at the surface around Tonga island following Hunga eruptions (2009, 2019, and 2022), and so the link between ash and Chl-a is not certain (Shi and Wang, 2011; Whiteside et al., 2021; Whiteside et al., 2023). Unusually sporadic and widespread transport of ash from these explosive volcanic events may supply the nutrients over the wider western SPO beyond the source region (Kloss et al., 2020; McKee et al., 2021; Mishra et al., 2022). However, little work has been dedicated to the response of phytoplankton associated with the long-distance transport of explosive ash plumes within the wider the western SPO.
In this study, through a comparative analysis of satellite and reanalysis data for the past 19 years (2004–2022), we present the temporal and spatial characteristics of transport pathways of airborne volcanic ash over the western SPO during the period. We investigate changes in satellite-derived Chl-a concentrations to compare the phytoplankton responses to deposition of distally transported ash plumes.
2 Methods & materials
2.1 Satellite data
Satellite observations of SO2 have previously been used as a proxy for volcanic eruptions and volcanic ash transport (Thomas and Prata, 2011; Sears et al., 2013). The temporal variability of volcanic plumes produced over the western SPO (10°N–35°S, 125°E–150°W) during the study period of October 2004 to February 2022 was examined using daily level-3 best pixel SO2 total column products with a 0.25° regular grid, obtained from NASA’s Aura satellite Ozone Monitoring Instrument (OMI), which is available since October 2004 (https://disc.gsfc.nasa.gov/datasets/OMSO2e_003/summary; Li et al., 2017; Li et al., 2020a). The background SO2 loads (<0.1 Dobson Units (DU); 1 DU = 2.69 × 10¹⁶ molecules cm−2) were removed (Li et al., 2020a). To characterize the spatial distribution of volcanic plumes, we also used the level-2 PCA SO2 total column products (NMSO2-PCA-L2) with a spatial resolution of 50 km, taken from Ozone Mapping and Profiler Suite (OMPS) onboard NASA/NOAA Suomi National Polar-orbiting Partnership (SNPP) satellite, which is available since 2012 (https://disc.gsfc.nasa.gov/datasets/OMPS_NPP_NMSO2_PCA_L2_2/summary). To ensure data quality and maintain pixel numbers, we accepted OMPS SO2 values with a solar zenith angle less than 75°, cloud cover less than 80%, and SO2 values higher than 0.1 DU (Yang et al., 2013; Li et al., 2020a). We analyzed the spatial distribution of OMI level 2-PCA SO2 total column products with a spatial resolution of 13 × 24 km2 for the pre-OMPS period (i.e., prior to 2012). These data were re-sampled to 0.25° by 0.25° using MATLAB cubic interpolation methods. The vertical and horizontal transport of ash plumes was detected using level-2 aerosol subtypes data (version 4.x) and level-1 532 nm total attenuated backscatter coefficient measurements (version 4.x) by the Cloud-Aerosol Lidar with Orthogonal Polarization (CALIOP) onboard the Cloud-Aerosol Lidar and Infrared Pathfinder Satellite Observations (CALIPSO) satellite (https://www-calipso.larc.nasa.gov; Winker et al., 2009; Vernier et al., 2016; Kim et al., 2018). To track the vertical profile of ash particles from volcanic eruption, we further used daily level-2 aerosol extinction coefficient at 675 nm (version 2) measured by OMPS Limb Profiler sensor on the Suomi-NPP satellite (https://disc.gsfc.nasa.gov/datasets/OMPS_NPP_LP_L2_AER_DAILY_2/summary; Kramarova et al., 2018; Loughman et al., 2018). The aerosol extinction coefficient data have a vertical resolution of approximately 1.8 km. To monitor atmospheric features on volcanic eruptions, the NASA WorldView images of true color corrected reflectance, derived from both SNPP-Visible Infrared Imaging Radiometer Suite (VIIRS) and Aqua-Moderate Resolution Imaging Spectroradiometer (MODIS) were also used (https://worldview.earthdata.nasa.gov/).
The change in phytoplankton biomass over the western SPO was evaluated using Chl-a products, derived using the OC4 blue-green band ratio algorithm, which is applicable for Case 1 waters (i.e., typically oligotrophic and open oceans) (O'Reilly et al., 2000). The Chl-a estimates are 0.25° gridded daily merged products generated by the weighted average method from the GlobColour dataset (https://hermes.acri.fr). To exclude the local impact, we removed the Chl-a values over shallow waters (bathymetry <200 m; Figure S1A). Furthermore, we estimated ocean PP, using the vertically generalized production model (VGPM) developed by Behrenfeld and Falkowski (1997). The input data required for the PP estimation were obtained from GlobColour datasets for the Chl-a, photosynthetic available radiation, and euphotic depth, and the operational sea surface temperature and sea ice analysis (OSTIA) system dataset for sea surface temperature (SST) (https://marine.copernicus.eu; Good et al., 2020), respectively. The SST data with the spatial resolution of 0.05° were re-sampled to 0.25° by 0.25° grid using MATLAB cubic interpolation methods.
2.2 Reanalysis and simulated data
Emitted volcanic ashes are dispersed in the atmosphere and transported by wind to the distance of ten to thousands of kilometers away from their source. The NOAA’s hybrid single-particle Lagrangian integrated trajectory (HYSPLIT) model was applied to identify the atmospheric transport and dispersion of volcanic ash (http://www.ready.noaa.gov) (Stein et al., 2015; Rolph et al., 2017). Global data assimilation system (GDAS) metrological data with a horizontal resolution of 1° were used as model input to calculate the 96-hrs forward trajectories for heights in the surface layer (0.8 km) and stratospheric layer (15 and 21 km) from Ulawun volcano, Papua New Guinea on 7 October, 2006 (4.27°S, 152.20°E), Ambae volcano, Vanuatu on 27 July, 2018 (15.40°S, 167.84°E), Ulawun volcano, Papua New Guinea on 26 June, 2019 (5.05°S, 151.33°E) and Hunga volcano, Tonga on 15 January, 2022 (20.54°S, 175.38°W), respectively. The volcanic ash transport was also examined by using the daily zonal wind (u) and meridional wind (v) at 925 hPa from the National Centers for Environmental Prediction (NCEP)-National Center for Atmospheric Research (NCAR) Reanalysis 1 (https://psl.noaa.gov/data/gridded/data.ncep.reanalysis.pressure.html).
To confirm the influence of the vertical mixing of the water column over the western SPO, we analyzed the weekly estimates of mixed layer depth (MLD) with a 0.25° × 0.25° regular grid derived from the Multi Observation Global Ocean ARMOR3D L4 near real time weekly products and multi-year reprocessed products, for the period of 2020 to 2022 and 2004 to 2021, respectively, distributed by the Copernicus Marine Environment Monitoring Service (CMEMS) (https://resources.marine.copernicus.eu). MLD data were estimated as the minimum value of a density threshold equivalent to a 0.2°C variation of the temperature conditions from the temperature at 10 m depth and the MLD temperature criteria with 0.2°C threshold (de Boyer Montégut et al., 2004). The weekly MLD data were re-sampled to daily data using MATLAB resample function. We also used the daily surface precipitation rate dataset derived from NCEP-NCAR reanalysis 1 to understand the nutrient supply from river flux (Shiozaki et al., 2014). To investigate the nutrient flux from the sediment arounds the islands (Dutheil et al., 2018), we analyzed surface zonal current using Ocean Surface Current Analysis Real-time (OSCAR) dataset with a 1/3 degree grid with a 5 day resolution, which was calculated from satellite datasets using a simplified physical model of an upper ocean turbulent mixed layer (https://podaac.jpl.nasa.gov/dataset/OSCAR_L4_OC_third-deg_YEARLY).
2.3 Geochemical analysis of ash
To investigate the role that varying chemical compositions of ash may have had on phytoplankton response, the geochemical composition of volcanic ash from the studied volcanic eruptions was investigated. For the 2018 Ambae eruption, major and trace element geochemistry for the bulk ash and individual ash glasses was taken from Moussallam et al. (2019). Comparable data for the 2009 and 2014–2015 eruptions of Hunga were taken from Brenna et al. (2022), supplemented by analysis of 2022 products collected on land from Tongatapu, Tonga. These samples were collected in the aftermath of the eruption, roughly 75 km south of Hunga volcano. Bulk X-Ray Fluorescence (XRF) analysis of the whole ash sample from Nakualolofa, Tongatapu and XRF analysis of pumice separated from ash collected from Fu’amotu airport was completed by SpectraChem Analytical Ltd. Christchurch using Li-Borate beads for major elements and pressed-powder pellets for trace elements. Individual glass shards from 2022 material deposited on Tongatapu were analyzed using a JEOL Field Emission Electron Probe Microanalyser System 8530F (Hyperprobe) at the University of Auckland. A defocussed beam of 10–20 μm diameter was used with an accelerating voltage of 15 kV, with Na analyzed first and probe conditions monitored using secondary international glass standards.
3 Results and discussion
3.1 The occurrence of four extreme volcanisms in the western SPO
The spatial distribution of the combined climatology of the OMI-derived mean SO2 in the western SPO averaged over last 19 years (2004–2022) is shown in Figure S1B. Comparatively higher SO2 total column values (>0.4 DU) were found in and around the land than that over ocean. The highest values of SO2 are found in the regions near the volcanoes shown in Figure S1, indicating the SO2 variation for the study period in the western SPO is mainly related to the state of volcanic activity. One exception is in Southeast Australia where SO2 emissions are entirely anthropogenic from 19 coal-fired power stations operating in Australia (Hendryx et al., 2020).
To describe the explosive volcanisms that occurred in the western SPO over last 19 years, we first investigated the volcanic explosivity index (VEI; https://volcano.si.edu/), which distinguishes the volcanic eruptions in the range from 0 (non-explosive eruptions) to 8 (mega-colossal explosive eruptions) on the logarithm of 10, based on volume of magma erupted during an eruption and plume height (Newhall and Self, 1982). During this period, twelve explosive eruptions of VEI 3 or greater have been observed (Table S1). The Hunga eruption from an andesitic submarine caldera, on 15 of January 2022, a Paroxysmal eruption, was the biggest explosion of the 21st century from with a VEI estimated at 5, which is greater by two orders of magnitude than any others in the dataset. However, there were four further events of VEI 4 from the volcanoes in Papua New Guinea, which are Ulawun, Manam, and Rabaul volcanoes. The Ambae event was the most energetic episode of a longer period of sub-Plinian/Plinian volcanism from a basaltic vent at ~1400 m elevation, with VEI of 3 (Moussallam et al., 2019).
Figure 1A shows the daily variations of OMI-derived SO2 total column during the study period of October 2004 to February 2022 averaged over the western SPO (10°N–35°S, 125°E–150°W). The daily mean SO2 total column averaged over the western SPO displays generally low values (0.23 ± 0.05 DU), but episodic SO2 peaks occurred for twelve explosive eruptions of VEI 3 or greater (>0.9 DU) (Figure 1A and Table S1). To identify which explosive eruptions delivered the emitted substances with high intensity over the broad area of the western SPO, we extracted extremely high values fall that above 99.9th percentile of daily mean SO2 total column (>0.931 DU), suggestive of high volcanic ash deposition to the western SPO. There were four distinct peaks in October 2006 (maximum value: 1.63 DU), July 2018 (maximum value: 1.56 DU), June 2019 (maximum value: 0.93 DU), and January 2022 (maximum value: 1.95 DU) (Figure 1B), corresponding with timing of volcanic eruptions in the Rabaul, Papua New Guinea (October 2006), Ambae, Vanuatu (July 2018), Ulawun, Papua New Guinea (June 2019), and Hunga, Tonga (January 2022). The number of pixels (0.25° grid) with SO2 values above 99.9th percentile (0.931 DU) over the western SPO area also showed the strong peaks (>1000 pixels) in the corresponding periods (Figure S2), i.e., covering an area of >765,000 km2. The true color images confirm the emissions of volcanic ash from Rabaul (7 October, 2006), Ambae (especially on 20 and 27 July, 2018), Ulawun (25 June, 2019), and Hunga eruptions (14 January, 2022) (Figure S3) (https://worldview.earthdata.nasa.gov). Combined, these data suggest the eruptions of Rabaul, Papua New Guinea (October 2006), Ambae, Vanuatu (July 2018), Ulawun, Papua New Guinea (June 2019), and Hunga, Tonga (January 2022) were the most extreme volcanic plumes produced in the western SPO over last 19 years (2004–2022).
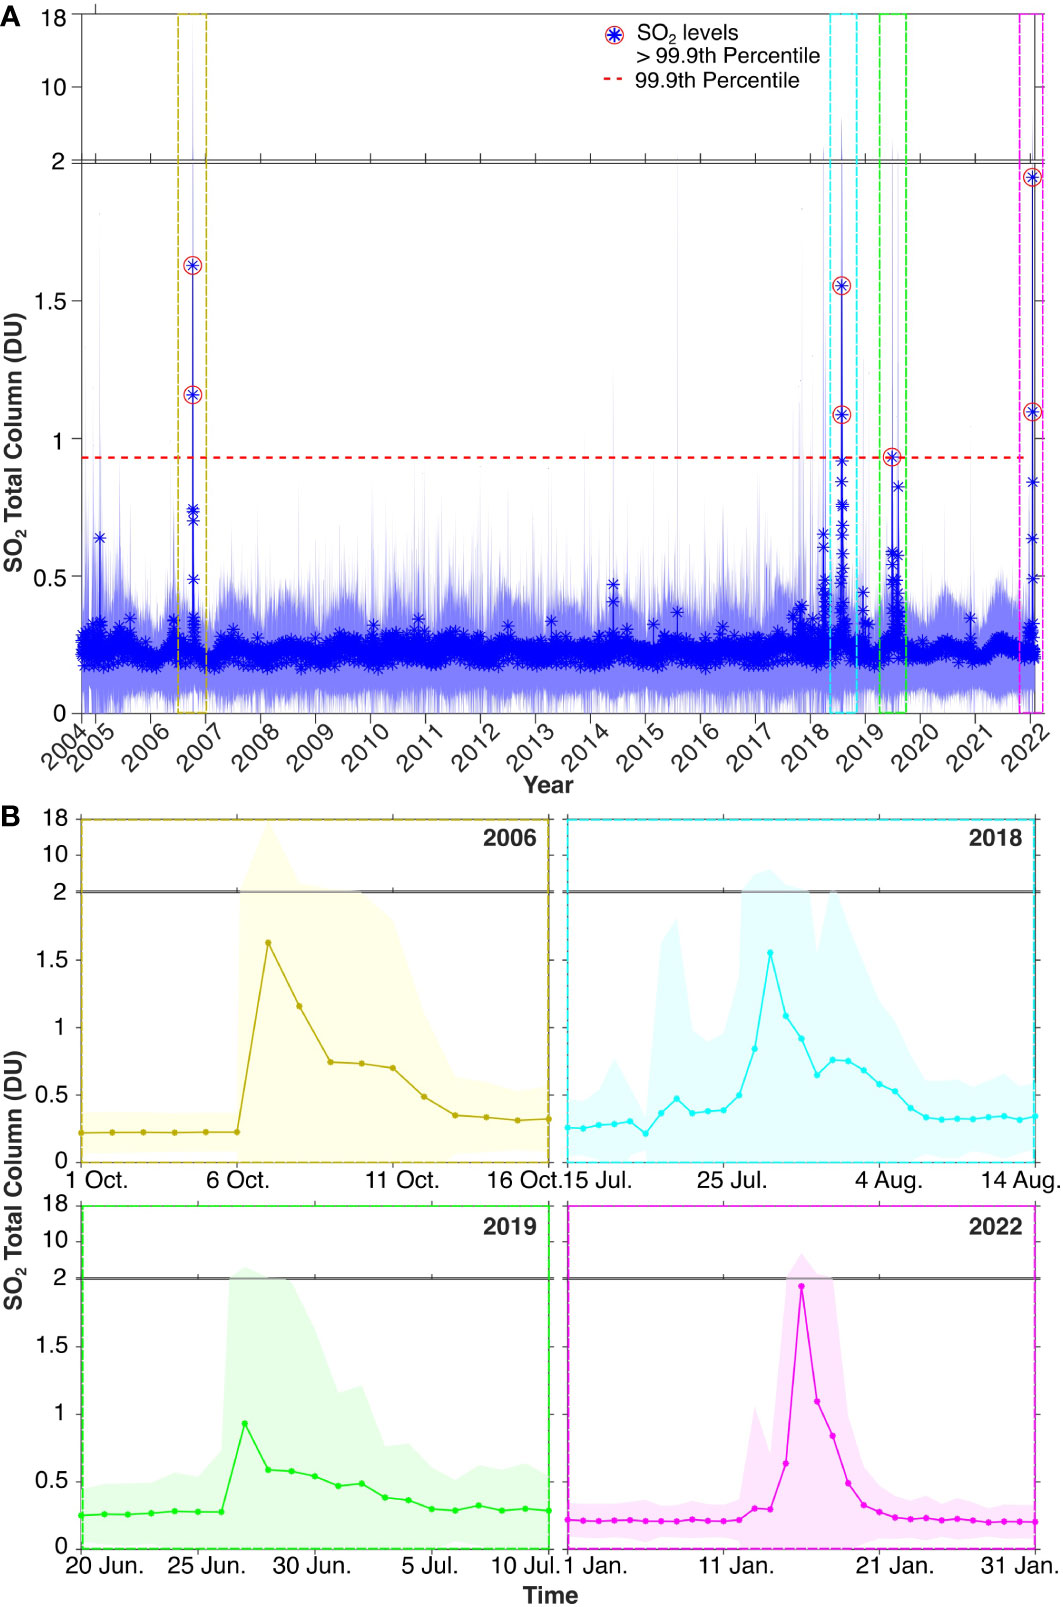
Figure 1 The temporal variation of OMI-derived mean SO2 total column averaged over the western SPO (10°N–35°S, 125°E–150°W) (A) for the study period of October 2004 to February 2022, enlarged figures (B) for October, 2006, July to August, 2018, June to July, 2019 and for January, 2022. The asterisk markers and blue lines in (A) (circle markers and shading in Figure 1B) indicate the mean and one standard deviation of mean, respectively. Red dotted line indicates the threshold of SO2 value that correspond to 99.9th percentile. Red circles indicate the SO2 values that exceeded 99.9th percentile.
3.2 Horizontal and vertical transport of four extreme volcanic plumes
During a volcanic eruption, buoyant plumes of ash and gas are produced (fragmented volcanic glass and minerals, rich in macro- and micro-nutrients; Duggen et al., 2007; Longman et al., 2022). These are rapidly transported horizontally and vertically by the wind, until deposition. Ash deposition in the western SPO may supply limiting nutrients (particularly iron for N2 fixation; Bonnet et al., 2017) for phytoplankton growth (Heffter and Stunder, 1993; Langmann et al., 2010; Olgun et al., 2013a). To characterize the spatial pattern of the deposition of volcanic materials into the western SPO, in this section, we describe the horizontal and vertical transport and dispersion of ash plumes from Rabaul volcano in October 2006, Ambae volcano in July–August 2018, Ulawun volcano in June–July 2019, and Hunga volcano in January 2022.
Figure 2 shows the horizontal evolution of satellite-derived mean SO2 total column over the western SPO averaged for the periods of the four volcanic eruptions, 2006 Rabaul eruption (7–13 October), 2018 Ambae eruption (20–27 July and 28 July–4 August), 2019 Ulawun eruption (26 June–4 July), and 2022 Hunga eruption (15–20 January). On 7 October 2006, very high SO2 columns (>14 DU) were observed around Rabaul volcano (Figure S4A), and SO2 plumes from this source were horizontally distributed over the western SPO, showing two pathways of westward transport and southeastern transport, respectively (Figures 2A and S4A). Highest plumes were displayed over near coastal waters with a westward relatively short distance (~700 km) around the northeastern area of Papua New Guinea after leaving the source, during southeasterly surface wind conditions. Following the continuous SO2 emission from Ambae volcano (>14 DU) during the period of 20–27 July, 2018, with relatively high SO2 levels around source region (Ambae) (shown in inset in Figure 2B), the SO2 plumes averaged during the period of 28 July to 4 August 2018 showed eastward long-distance (>2000 km) transport, showing highest plumes around the northern part of Tongatapu island (29 July 2018), but the direction of surface winds in 2018 case showed different pathways of long-distance transport of SO2, suggesting that this transport was associated with air masses at the higher altitude (Figures 2B and S4B). During 2019 Ulawun eruption event, the SO2 plumes were relatively less dispersed over the western SPO, compared to those from other volcanoes studied here (Figures 2C and S4C). This event showed high plume concentrations only in the eastern area of Papua New Guinea, a short-distance (~500 km) southward from the source region as described in a recent study (McKee et al., 2021). Conversely, the SO2 distribution averaged during the period of 15–20 January illustrates that the SO2 emitted from the Hunga volcano travelled a long distance (>6000 km) westward, reaching the northern part of Australia, passing over the waters around Vanuatu and Fiji (Figures 2D and S4D). The highest SO2 values (>14 DU) appeared in around source region (Hunga) and the water surrounded by Vanuatu, New Caledonia, and Fiji (i.e., an area of ~8.2 × 10⁵ km2, ~2000 km from source; blue box in Figure 2D) on 16 January 2022. The transport of volcanic plumes in the 2022 case was consistent with the easterly wind direction at the near surface.
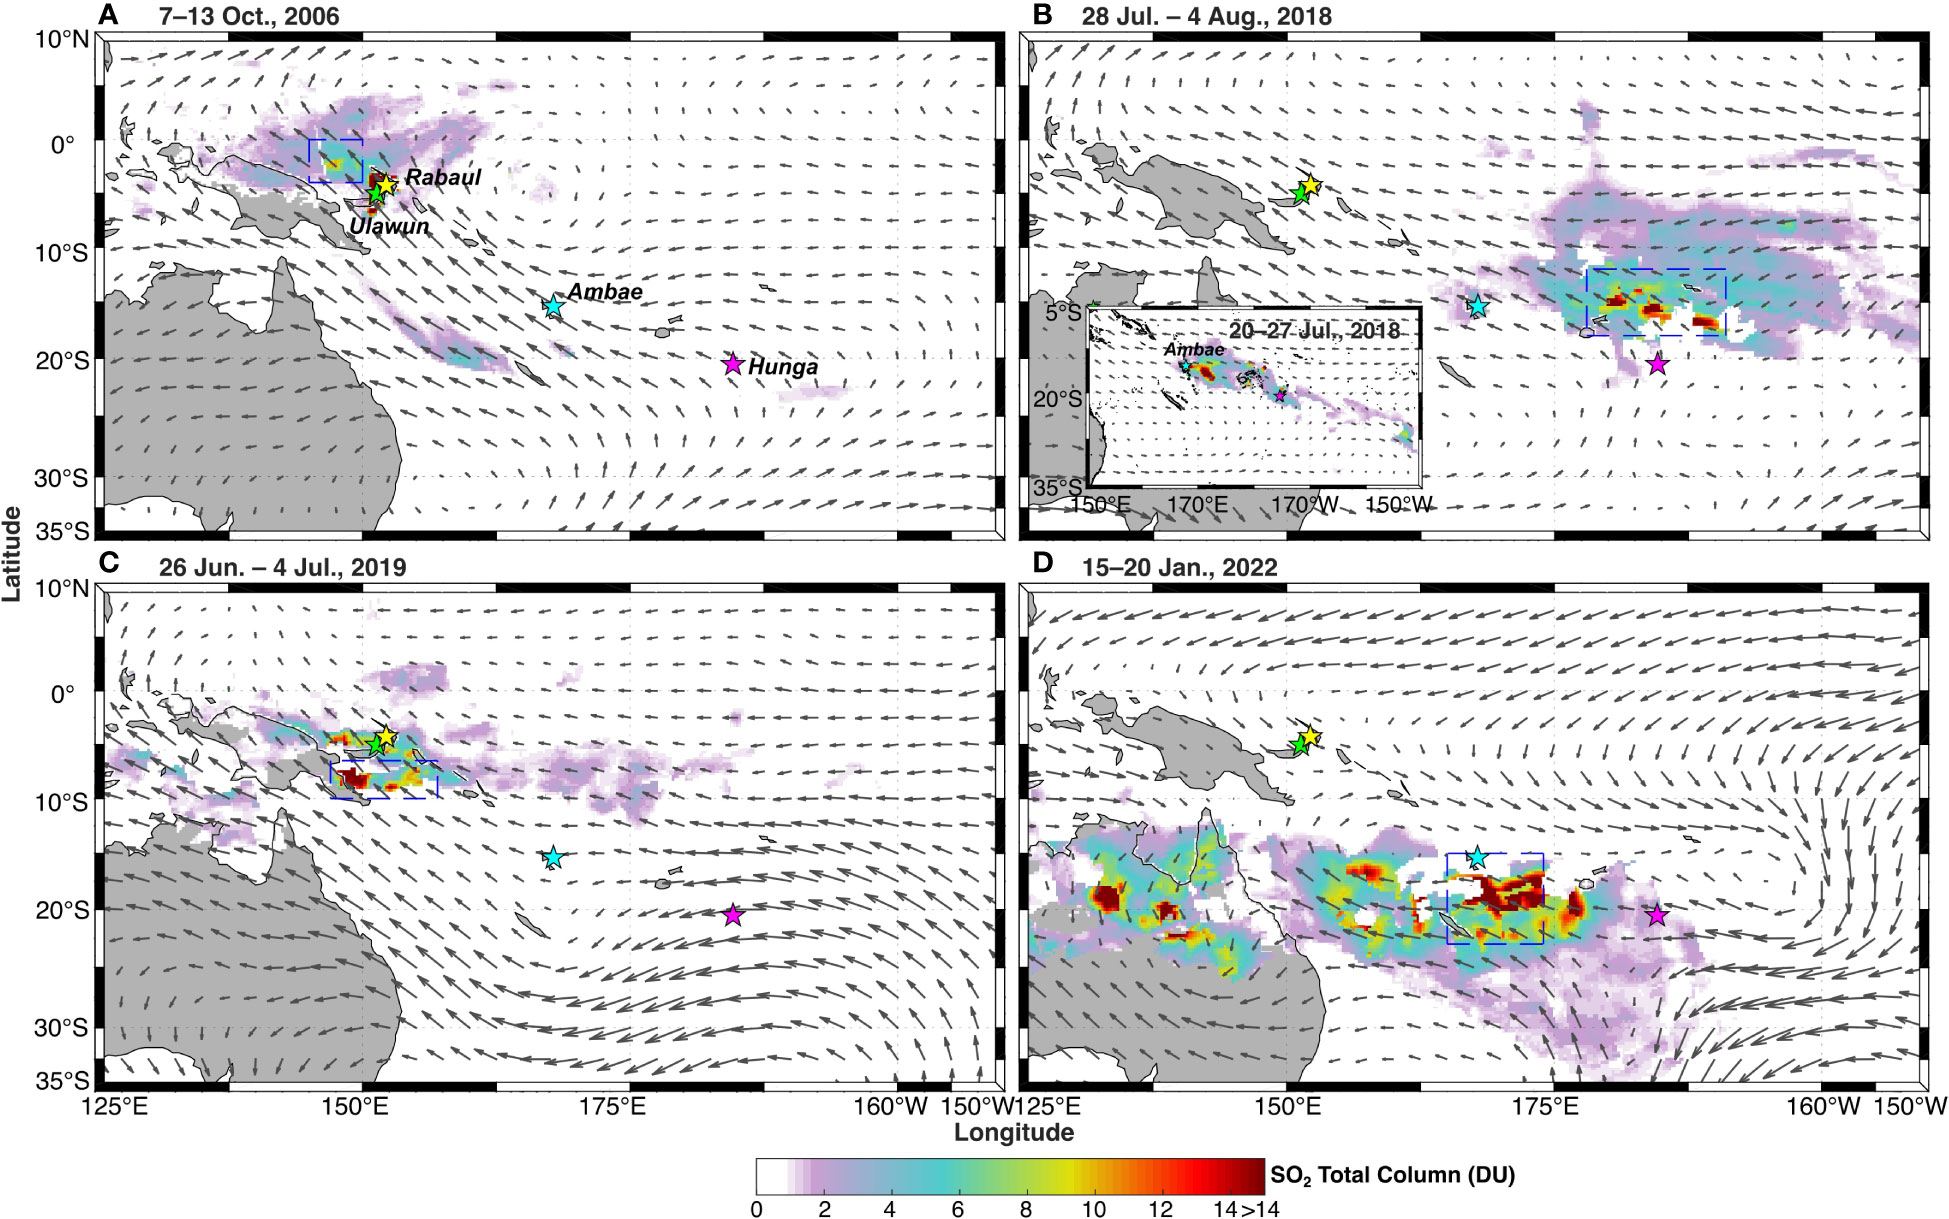
Figure 2 A spatial distribution of the SO2 total column averaged over the period of (A) 7-13 October, 2006, (B) 28 July - 4 August, 2018, (C) 26 June - 4 July, 2019, and (D) 15-20 January, 2022, with surface wind (at 925 hPa). Inserted figure in (B) is the spatial distribution of SO2 total column averaged over the period of 20-27 July, 2018.
Based on NOAA’ HYSPLIT 96-hrs forward trajectories model, we investigated the vertical transport pathways of tropospheric (0.8 km) and stratospheric air masses (15 and 21 km), originating from the Rabaul, Ambae, Ulawun, and Hunga volcanoes (Figure 3A). During the Rabaul volcano event (7 October, 2006), air mass trajectories simulated by HYSPLIT showed that the air mass movement at the altitude of 15 km captured the horizontal distribution of SO2 plumes, suggesting the stratospheric injection and mass loading of volcanic materials expelled from Rabaul volcano (Figures 2A, 3A). The movement of air masses at the altitudes of 0.8 and 21 km from Ambae volcano (27 July, 2018), was consistent with that of near surface wind (Figure 2B). Unlike the direction of other air masses, the air mass at an altitude of 15 km showed a pathway consistent with the spatial distribution of SO2 total column, supporting the suggestion that volcanic ash from the Ambae eruption in July 2018 was transported at an altitude of 15 km (i.e., stratosphere aerosol level). This result is also consistent with the vertical distribution of the Ambae volcanic plume observed with a core brightness temperature (Kloss et al., 2020). The airmass at the altitude of 21 km following the Ulawun eruption (26 June, 2019) showed a pathway eastward, which is consistent with the spatial distribution of SO2 with low levels (Figure 3A). On the other hand, airmass forward trajectory, starting from altitude of 15 km, depicted high SO2 plume distribution around the eastern area of Papua New Guinea (Figures 2C, 3A). The pathways of air masses at the altitudes of 0.8, 15, and 21 km, starting at the Hunga on 15 January 2022, appeared to be in the westward direction, showing consistent pathways to the region of Vanuatu, New Caledonia, and Fiji (Figures 2D, 3A). Dispersion of air mass at an altitude of 21 km was nearly the same as that of the SO2 distribution, indicating that volcanic ash is suspected to be more efficiently transported over a long distance to the northern part of Australia along an altitude of 21 km, higher than the Ambae volcano. Recent studies also showed that much of the plume reached an altitude higher than 30 km during the Hunga eruption, and it developed a massive umbrella region of ~400 km diameter (Carr et al., 2022; Smart, 2022), making it much more effective in dispersing ash over large areas.
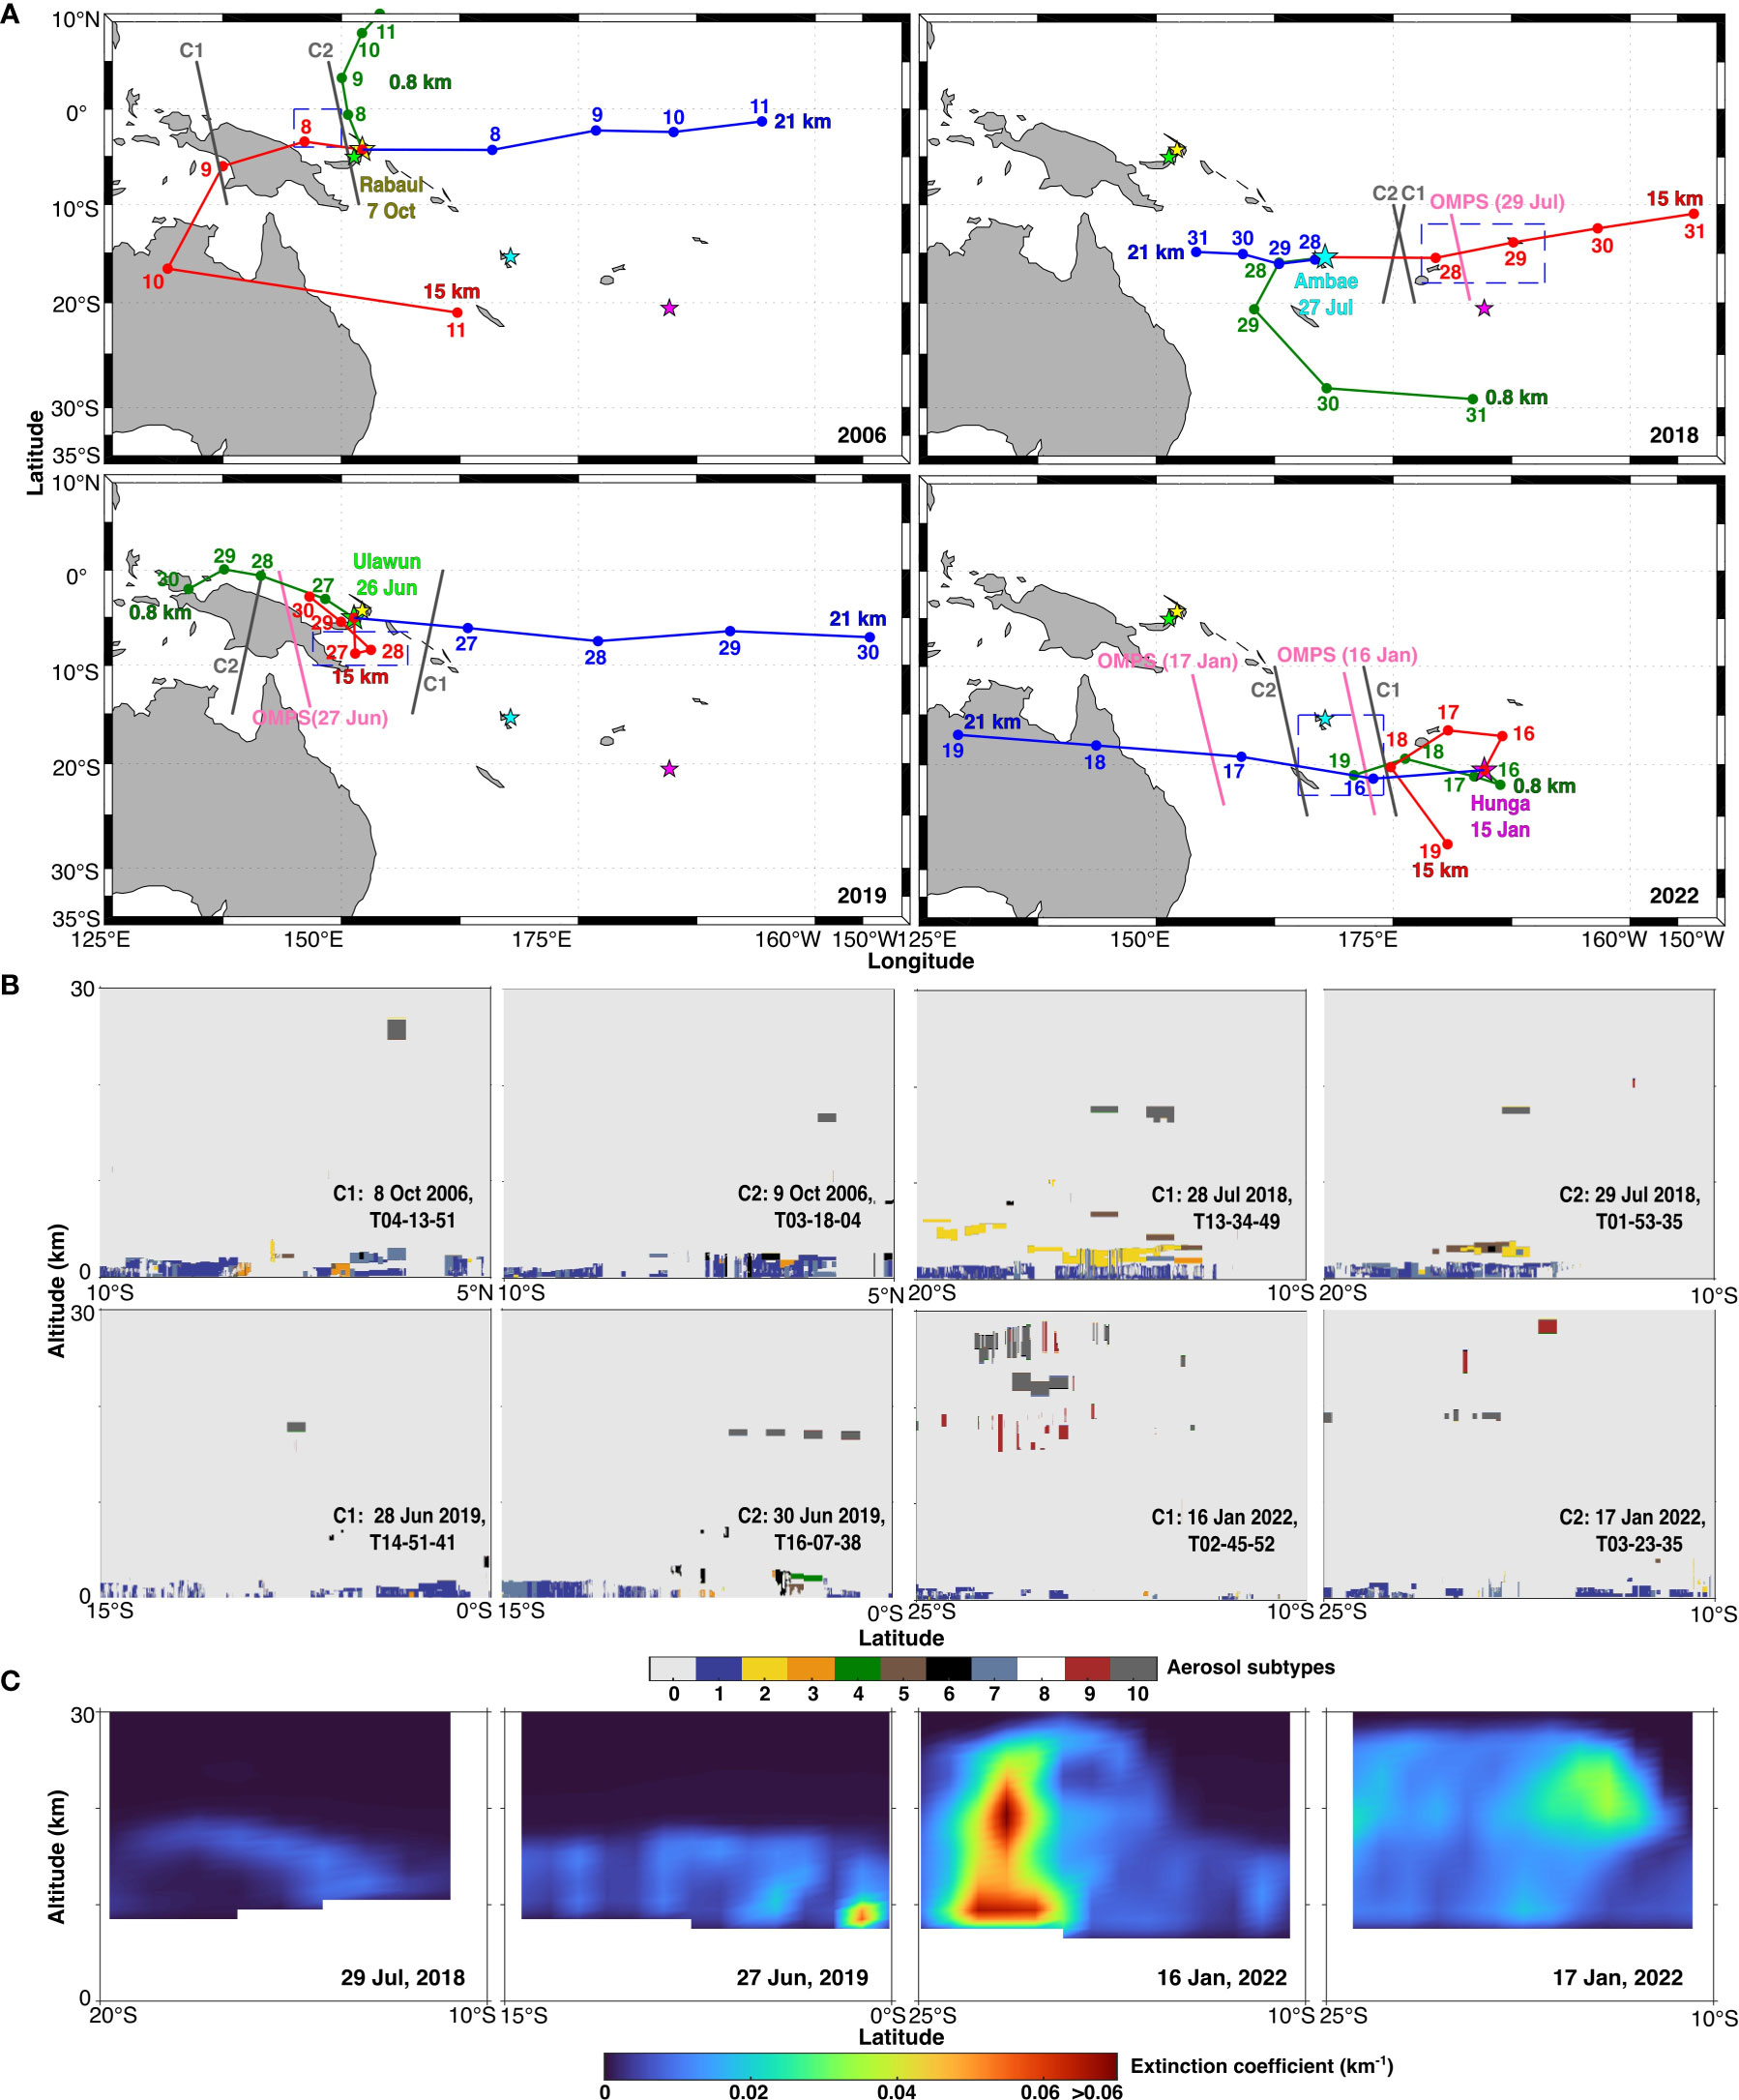
Figure 3 (A) The HYSPLIT forward trajectories (96-hrs) at altitudes of 0.8 km (green), 15 km (red), 21 km (blue) from Rabaul (7 October, 2018), Ambae (27 July, 2018), Ulawun (26 June, 2019), and Hunga (15 January, 2022). Grey lines indicate CALIPSO orbits. Pink lines indicate OMPS orbits. (B) The vertical distribution of CALIPSO-derived aerosol subtypes in 2006, 2018, 2019 and 2022 along the orbits shown in (A). Colorbar indicates stratospheric aerosol subtypes (0: not determined, 1: clean marine, 2: dust, 3: polluted continental/smoke, 4: clean continental, 5: polluted dust, 6: elevated smoke, 7: dusty marine, 8: polar stratospheric clouds aerosol, 9: volcanic ash, 10: sulphate/other). (C) The vertical distribution of OMPS-derived aerosol extinction coefficient on 29 July, 2018, 27 June, 2019, 16 and 17 January, 2022 along the orbits shown in Figure 3A.
To identify whether long-range transportation of air mass in the stratosphere (usually higher than approximately 12 km above the surface) is associated with the dispersion of volcanic aerosol plumes over the western SPO, we further analyzed the CALIPSO L2 aerosol products after the 2006, 2018, 2019 and 2022 eruptions, which classify aerosols into ten subtypes for the stratospheric layer; clean marine, dust, polluted continental/smoke, clean continental, polluted dust, elevated smoke, dusty marine, polar stratospheric clouds aerosol, volcanic ash, sulphate/other (Figure 3B) (Kim et al., 2018). The stratospheric aerosols were well spread at the altitudes of around ~15 to 25 km in 2006, 2018, and 2019 eruptions. For the 2022 eruption, relatively higher heights, at the altitudes of 18 to 30 km, respectively, along the CALIPSO measurement orbit tracks, as shown by the HYSPLIT atmospheric long-distance trajectories (15 km in 2006, 2018, and 2019 year and 21 km in 2022 year) and SO2 distribution (Figures 2, 3B). The presence of volcanic ash plumes was also characterized by CALIPSO L1B total attenuated backscattering coefficient at 532 nm (~0.002 km-1 sr-1; yellow in the figure) (Figure S5). Most importantly, the CALIPSO measurements show that the composition of the 2006, 2018, and 2019 plumes was primarily sulphate aerosols (grey in the figures), while the 2022 Hunga eruption was a mixture of volcanic ash and sulphate aerosols (red and grey in the figure), indicating the persistence of ash-laden plumes over the western SPO after the eruption (Figure 3B). Furthermore, we investigated the vertical distribution of OMPS L2 aerosol extinction to understand the quantitative retrievals of volcanic ash transported and deposited to the western SPO following 2018, 2019, and 2022 eruptions (Figure 3C). There was no available data in 2006. The vertical distribution of aerosol extinction along the OMPS orbit track on 29 July 2018, confirmed a slight increase (~0.02 km-1) at altitudes of ~15 to 20 km in the northern area of Tongatapu island where the highest levels in SO2 were shown, indicating relatively potential low deposition (Figures 2B, 3C). After the 2019 volcanic eruption, aerosol extinction coefficients on 27 June 2019 also showed a slight increase (>0.02 km-1) at altitudes of ~15 to 20 km around Papua New Guinea. However, unlike these events, the vertical distribution of aerosol extinction coefficients on 16 January 2022 showed relatively higher values with levels of >~0.05 km-1 at all observed altitudes (<30 km) in the water surrounded by Vanuatu, New Caledonia, and Fiji (Figure 3C), where ash-laden plumes and high levels in SO2 were mainly observed, but relatively low aerosol extinction coefficients in the western part of Vanuatu on 17 January 2022 (Figures 2D, 3A, C). Mishra et al. (2022) showed that on 16 January the maximum SO2 value in the region occurred when the spread speed of atmospheric westward plume was lowest as <1000 km day-1, but >2500 km day-1 after 17 January. Ash deposition maxima can result from the trapping of ash related to relatively low wind speed, as shown in a numerical modeling study (Poulidis et al., 2018). Therefore, these results suggest 2022 Hunga eruption was accompanied by high deposition of ash-rich aerosols over the water surrounded by Vanuatu, New Caledonia, and Fiji on 16 January 2022, probably by relatively weak winds.
3.3 The volcanic ash composition
The composition of the deposited volcanic ash has the potential to control the phytoplankton response, with differing levels of nutrient release from different ash compositions already noted (Jones and Gislason, 2008; Longman et al., 2022). Our ash classification showed that in October 2006, the large sub-Plinian eruption from Rabaul volcano, with a whole-rock composition of Trachydacite (Figure S6) (Bouvet de Maisonneuve et al., 2015; Bernard and Bouvet de Maisonneuve, 2020). The 2018 Amabe volcano, which is a basaltic shield volcano, produced basaltic andesite to trachy-basalt ash (Moussallam et al., 2019). The 2022 Hunga eruption produced andesitic to basaltic andesite ash, similar to earlier eruptions of this volcano (Brenna et al., 2022). Figure S7 shows that both Ambae and Vanuatu ash contain high iron contents in their total glass and bulk analyses (often >10 wt%), which is a common nutrient deficiency in the ocean, but Rabaul ash contains relatively low iron contents (<10 wt%) (Table S2 and S3) (Moore et al., 2013). This may explain the lack of phytoplankton response to Rabaul, but our data do not contain information on bioavailability of the Fe contained within the ash. As such, further research is necessary to confirm the hypothesis that changing ash composition leads to different phytoplankton response.
3.4 The response of chlorophyll-a concentrations to distal plumes transport
To understand the response of phytoplankton subsequent to distal ash transport from four extreme eruptions (2006 Rabaul, 2018 Ambae, 2019 Ulawun, and 2022 Hunga eruptions) in the western SPO, we carried out an inspection of area-averaged time series of GlobColour-merged Chl-a concentrations in the distal region (Figures 4A–D), i.e., regions having highest atmospheric SO2 loading (>14 DU) extending toward the western SPO (blue box; 2006: 0–4°S, 145–150°E, 2018: 12–18°S, 178°E–169°W; 2019: 6.5–10°S, 147–157°E; 2022: 15–23°S, 165–174°E) (Figure 2). A time series of Chl-a estimates in the distal region, which is affected regions by long-range transport of volcanic plumes (>500 km), showed profoundly different response to 2022 Hunga events when compared to all other volcanic events (2006, 2018, 2019 events; Figures 4A–D). Following long-range transport of the 2006, 2018, 2019 volcanic emissions (Figures 2A–C), Chl-a concentrations did not show any noticeable increases (Figures 4A–C), suggesting limited nutrient supply (particularly iron) probably due to low volumes of ash deposition. However, in regions affected by likely high deposition of long-distance transported Hunga ash on 16 January 2022 (Figures 2D, 3C), Chl-a estimates were two times higher than that of climatological mean and one standard deviation for approximately 10 days after a lag period of 6 days (Figure 4D). The difference between Chl-a values from the 2022 Hunga event with the climatological values were statistically significant (p <0.05; t-test analysis). The response of Chl-a values to 2022 Hunga eruptions (0.15 mg m-3) showed a 67% increase in average compared to climatological values (0.09 ± 0.03 mg m-3) (red shading in figure). Oceanic PP estimates subsequent to 2022 Hunga eruptions (383 mg C m-2 d-1) also showed a 43% increase compared to climatological value (268 ± 74 mg C m-2 d-1). This conclusion is echoed by the findings of a recent study, which showed increasing Chl-a in close proximity to Hunga volcano, but with a higher magnitude in Chl-a values (>10-fold than before eruption) immediately after the eruption (Barone et al., 2022). However, as the presence of ash particles can directly influence the satellite ocean color signatures, in turn biasing the appraised Chl-a estimates, monitoring of the phytoplankton response to the ash deposition using satellite-derived optical datasets should be interpreted with caution (Johnson et al., 2011; Browning et al., 2015). The ash particles have residence times of up to 2 days in the euphotic zone depending on the particle sizes (Duggen et al., 2007). Whiteside et al. (2023) revealed that there were extremely high amounts of suspended ash particles in the surface waters around the Hunga volcano 2 days after 2022 eruption, which probably led to ash-contaminated Chl-a estimates but 9 days after the eruption the ash-related values recovered to normal, suggesting the removal of ash signal in the surface with time. In addition, previous studies have shown that the phytoplankton began to respond five to six days after deposition of volcanic ash, as shown in mesoscale iron-fertilization experiments (Coale et al., 2004; Duggen et al., 2007; Langmann et al., 2010; Lin et al., 2011; Yoon et al., 2018). Therefore, in the context of this study, the increase in Chl-a at a time period ∼6 days after 2022 Hunga eruption, potentially after sinking of ash particles below surface waters, would exclude the misinterpretation of Chl-a estimates by ash particles itself in the surface water (Langmann et al., 2010).
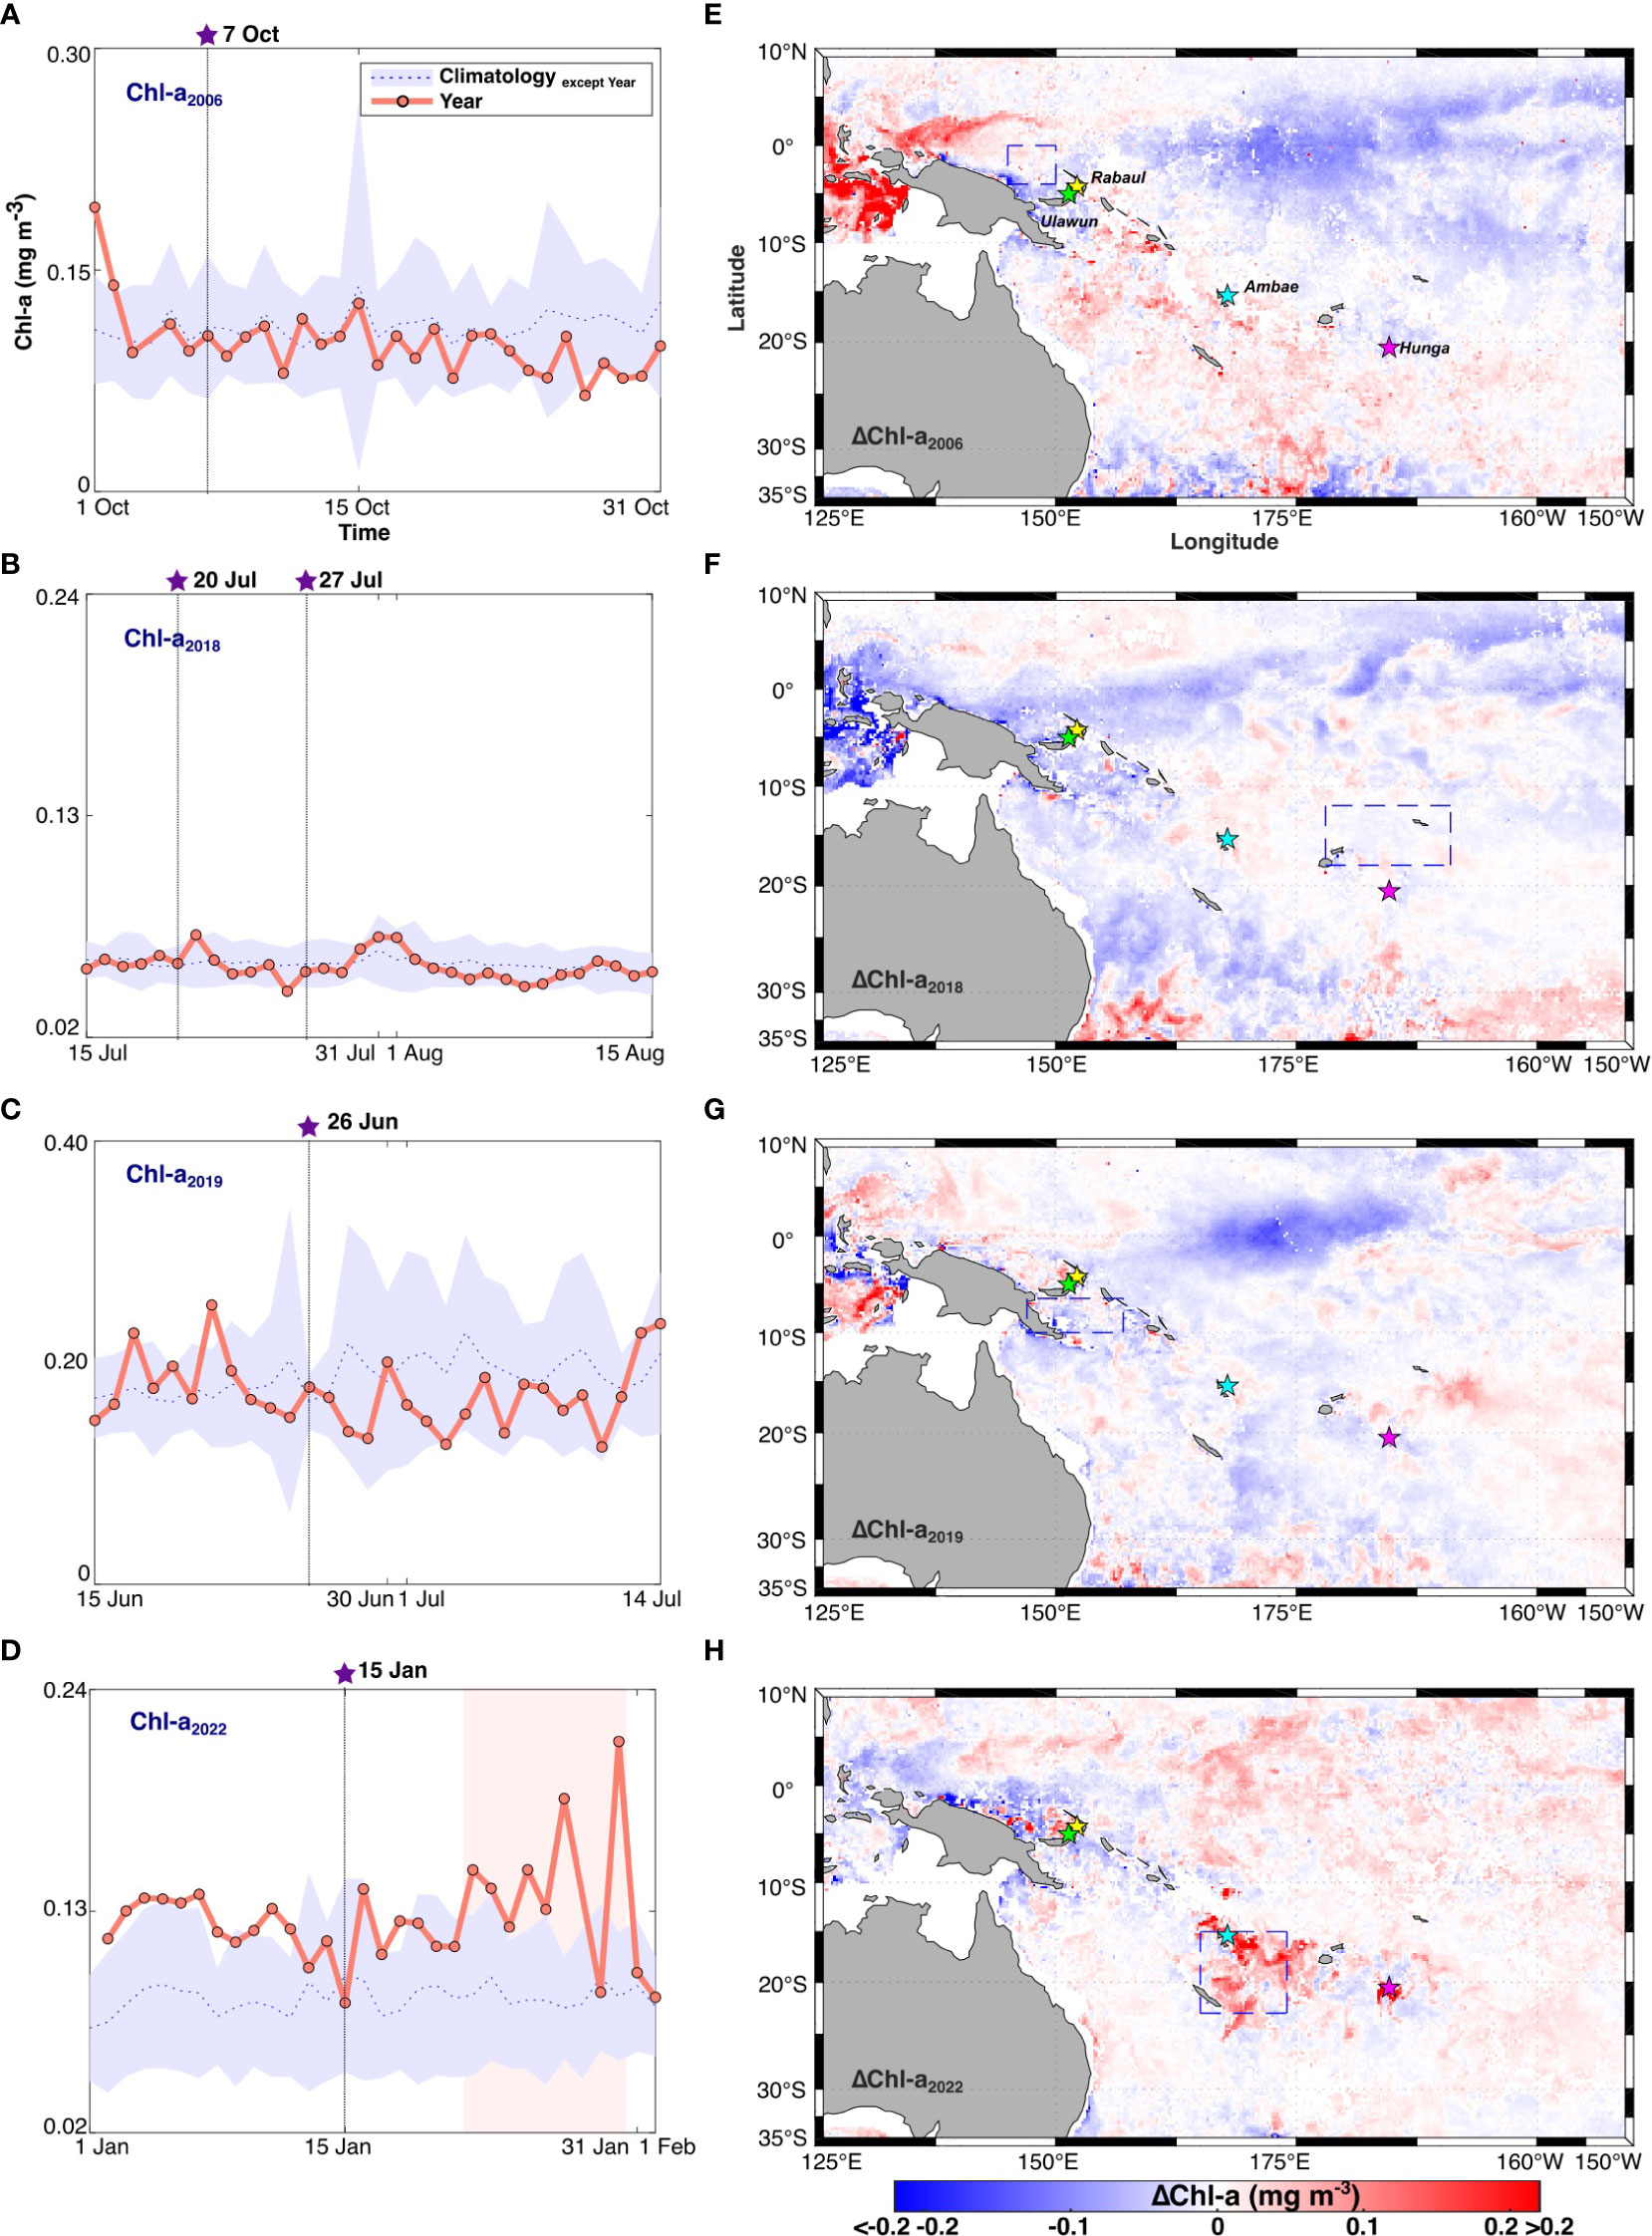
Figure 4 The area-averaged time series of Chl-a (red markers) over the distal region in (A) 2006 (0–4°S, 145–150°E), (B) 2018 (12–18°S, 178°E–169°W), (C) 2019 (6.5–10°S, 147–157°E), and (D) 2022 (15–23°S, 165–174°E). Each region is shown as blue box in Figure 2. The blue dotted line indicates the area-averaged climatological mean and blue shading indicates one standard deviation of climatological mean. Star markers indicate main volcanic eruptions. The red shading indicates a Chl-a response subsequent to 2022 Hunga event. The spatial distribution of ΔChl-a for the period of (E) 13-22 October, 2006, (F) 2-11 August, (G) 2-11 July, 2019 and (H) 21-30 January, 2022. ΔChl-a is difference of Chl-ayear and Chl-aclimatology except year for corresponding each period, respectively.
Furthermore, we analyzed the spatial distribution of the difference of 10-days mean Chl-a concentrations 6 days after volcanic eruption (2006: Chl-a2006 (13–22 October); 2018: Chl-a2018 (2-11 August); 2019: Chl-a2019 (2–11 July); 2022: Chl-a2022 (21–30 January)) and 10-days mean climatological Chl-a concentrations (2006: Chl-a2006clim (13–22 October); 2018: Chl-a2018clim (2-11 August); 2019: Chl-a2019clim (2–11 July); 2022: Chl-a2022clim (21–30 January)) averaged for corresponding periods for 19 years (2004–2022) except corresponding year, respectively (e.g., ΔChl-a 2006 (13–22 October) = Chl-a2006 (13–22 October) – Chl-aclim (13–22 October) except 2006) (Figures 4E–H). As shown in the temporal analysis, the long-distance transport of 2006, 2018, 2019 volcanic plumes over western SPO was not followed by any apparent response in Chl-a over regions that have high levels in SO2 (Figures 2A–C, 3C, 4E–G). However, in 2022, considerable positive anomalies of Chl-a values (Figure 4H) were also distinctively visible over the water surrounded by Vanuatu, New Caledonia, and Fiji which showed potential high deposition following the long-range transport of ash released from Hunga (Figures 2D, 3C). Furthermore, an anomalously high phytoplankton stock was detected in waters in close proximity to Hunga volcano at a time period 6 days after the 2022 eruption (Figure 4H), as shown in Barone et al. (2022), indicating a continued response in Chl-a even under a substantial sinking of ash particles (Duggen et al., 2007; Whiteside et al., 2023). These results suggest that volcanic ash deposition is considered the likely explanation for the enhancements in phytoplankton response in the western SPO.
3.5 Other possible drivers of 2022 chlorophyll-a response
In the western SPO, PP has been linked to the occurrence of N2 fixing organisms, and high N2 fixation rates have been recently assumed to be due to the alleviation of iron limitation, driven by multiple potential iron inputs, such as shallow hydrothermal plumes, island sediment, and river runoff (Shiozaki et al., 2014; Caffin et al., 2018; Dutheil et al., 2018; Guieu et al., 2018; Tilliette et al., 2022). Therefore, to investigate the hypothesis that significant ash deposition on the western SPO led to the Chl-a increase following the 2022 Hunga eruption, we investigated the possibility of Chl-a response to nutrient supply from other sources.
First, the shallow hydrothermal sources along Tonga-Kermadec arc have the potential to fertilise the western SPO with iron (Guieu et al., 2018; Tilliette et al., 2022). However, as Tilliette et al. (2022) say, shallow hydrothermal plumes release high levels of iron only around the shallow hydrothermal sources on the Tonga-Kermadec arc, and to lesser extent, into the water surrounded by Vanuatu, New Caledonia, and Fiji. This indicates the Chl-a increase following the 2022 Hunga eruption was not driven by a shallow hydrothermal source of iron.
Dutheil et al. (2018) showed that the spatial distribution of Chl-a estimates is tightly controlled by iron release from the sediment flux, which are related to the zonal (eastward) advection of iron downstream of the islands, a second potential iron source. Figure S8A shows the spatial distribution of the 5-day mean surface zonal current anomalies for January 2022 against 2004–2021 climatology. Positive (negative) values of surface zonal currents imply eastward (westward) anomalies. However, the surface zonal current dataset showed the insignificant changes in this region between pre- and post-eruption of Hung volcano in January 2022, when compared to other years.
Many islands could also deliver terrigenous nutrients through runoff to the western SPO. A large amount of runoff from land is expected to be triggered by high precipitation, which causes the water column stratification and land drainage required for N2 fixation (Shiozaki et al., 2014). Figure S8B shows the daily variation of precipitation rates averaged over the western SPO for 2022 vs. climatological mean with one standard deviation of the mean (2004 to 2021). However, there was no significant increase in precipitation over the waters of Vanuatu, New Caledonia, and Fiji during 2022 volcanic episodes compared to climatological values, indicating a likely minor impact of river runoff on nutrient supply.
A final alternative explanation for the changes in phytoplankton biomass in the western SPO may be the changes in MLD, related to the supply of nutrients from below the thermocline to the euphotic zone (Vaughan et al., 2007; Boyce et al., 2010; Mantas et al., 2011; Jutzeler et al., 2014; Jutzeler et al., 2020). Indeed, Terry et al. (2022) reported the tsunamis produced by the 2022 Hunga eruption, were up to 15 m on the islands near to the source volcano. However, there was no significant change in the area-averaged MLDs in 2022 year with time, relative to climatological area-averaged MLDs (Figure S8C). Therefore, in summary, the lack of alternative plausible hypotheses supports our conclusion that the increase in Chl-a is linked to the 2022 Hunga ash fall over the western SPO.
4 Summary and conclusion
Using multiple satellite and reanalysis data sets during the past 19 years (2004–2022), we analyzed the transport pathways of extreme explosive volcanic plumes and their impacts on phytoplankton biomass in the western SPO. Our study revealed that there were four extreme volcanic events, which have a VEI above 3 and exceeded 99.9th percentile of daily SO2 values averaged over the western SPO over last 19 years, from Rabaul volcano (October 2006), Ambae volcano (July 2018), Ulawun volcano (June 2019), and Hunga volcano (January 2022). Four extreme volcanic eruptions produced sporadic SO2 plumes which have the long-distance transport (covering an area of >765,000 km2) over the western SPO and injection into the stratosphere (>15 km). The 2006 Rabaul and 2019 Ulawun eruptions showed relatively high volcanic plumes over coastal waters around the source volcano. In July 2018, Ambae eruption showed eastward long-distance (>2000 km) transport, reaching the northern part of the Tongan archipelago. On the other hand, the SO2 emitted from the 2022 Hunga volcano travelled a long distance (>6000 km) westward, reaching the northern part of Australia, passing over Vanuatu and Fiji. In particular, there was likely high deposition of ash-laden plumes transported long-distance over the waters surrounded by Vanuatu, New Caledonia, and Fiji (~2000 km from source). In addition, this study showed that the high positive Chl-a anomaly to the 2022 Hunga volcanic eruption was spatially distributed in the water surrounded by Vanuatu, New Caledonia, and Fiji. The phytoplankton response to 2022 Hunga eruptions was associated with a ~70% increase in Chl-a (~40% increase in PP), compared to climatological changes. However, the other three events studied here (2006 Rabaul, 2018 Ambae, and 2019 Ulawun eruptions) were not associated with a Chl-a response over the regions with the high volcanic plumes, likely a result of low ash deposition. Minor changes in nutrient supply from other sources for 2022 vs. climatological means suggest a link between the increase in Chl-a and the 2022 Hunga ash fall. These results indicate that the phytoplankton response to the long-distance transport of the explosive volcanic plumes is not ubiquitous. Only volcanic events accompanied by high ash deposition strongly impact ocean productivity over the western SPO, supporting the hypothesis that volcanic ash fertilization has a potential to alleviate the limited nutrients of phytoplankton growth (particularly iron for N2 fixation) in the western SPO. Assuming that an increase of surface ocean iron concentrations by 2 nM (usually with surface condition of ~0.5 nM Fe in the waters around Vanuatu and Fiji; Tilliette et al., 2022) is needed to induce the optimal phytoplankton growth condition (Fitzwater et al., 1996), observed phytoplankton response for the distal ash deposits over the area of ~8.2 × 10⁵ km2 with MLD of ~20 m (Figures 2D, 4H, S8C) might be supported by the supply of a total amount of ~2.5 × 10¹⁶ nmol Fe following 2022 Hunga eruption. Our findings underline the importance of further studies based on geochemical experiments and shipboard bioassay experiments, to improve our understanding of which nutrients alleviate nutrient limitation of phytoplankton at community level following volcanic ash deposition in the western SPO (Duggen et al., 2007; Browning et al., 2014; Mélançon et al., 2014; Vergara-Jara et al., 2021).
Data availability statement
The original contributions presented in the study are included in the article/Supplementary Material. Further inquiries can be directed to the corresponding author.
Author contributions
J-EY and DK proposed the motivation of this work. J-EY designed the research. J-EY obtained, analyzed, and interpreted the satellite and reanalysis data. JL and SC provided, analyzed, and interpreted the geochemical data. J-EY wrote the manuscript with inputs from DK, JL, and SC. All authors contributed to the article and approved the submitted version.
Funding
SC was supported by the Ministry of Business, Innovation and Employment (MBIE) Endeavour Research Program (UOAX1913) and Ministry of Lands of the Kingdom of Tonga and the University of Auckland for support for the sampling and analysis of 2022 Hunga tephra.
Acknowledgments
This work was conducted as a part of the Marine Biomass Regeneration project in the Centre for Climate Repair at Cambridge. We thank the editor and four reviewers for helpful feedback. We acknowledge NASA for providing CALIPSO, OMI, and OMPS data, European Space Agency for providing GlobColour datasets, Copernicus for providing MLD and SST data, and NOAA for providing precipitation rate and wind datasets.
Conflict of interest
The authors declare that the research was conducted in the absence of any commercial or financial relationships that could be construed as a potential conflict of interest.
Publisher’s note
All claims expressed in this article are solely those of the authors and do not necessarily represent those of their affiliated organizations, or those of the publisher, the editors and the reviewers. Any product that may be evaluated in this article, or claim that may be made by its manufacturer, is not guaranteed or endorsed by the publisher.
Supplementary material
The Supplementary Material for this article can be found online at: https://www.frontiersin.org/articles/10.3389/fmars.2023.1072610/full#supplementary-material
References
Achterberg E. P., Moore C. M., Henson S. A., Steigenberger S., Stohl A., Eckhardt S., et al. (2013). Natural iron fertilization by the eyjafjallajökull volcanic eruption. Geophys. Res. Lett. 40 (5), 921–926. doi: 10.1002/grl.50221
Barone B., Letelier R. M., Rubin K. H., Karl D. M. (2022). Satellite detection of a massive phytoplankton bloom following the 2022 submarine eruption of the hunga Tonga-hunga ha‘apai volcano. Geophys. Res. Lett. 49 (17), e2022GL099293. doi: 10.1029/2022GL099293
Behrenfeld M. J., Falkowski P. G. (1997). Photosynthetic rates derived from satellite-based chlorophyll concentration. Limnol Oceanogr 42 (1), 1–20. doi: 10.4319/lo.1997.42.1.0001
Behrenfeld M. J., O’Malley R. T., Siegel D. A., McClain C. R., Sarmiento J. L., Feldman G. C., et al. (2006). Climate-driven trends in contemporary ocean productivity. Nature 444 (7120), 752–755. doi: 10.1038/nature05317
Bernard O., Bouvet de Maisonneuve C. (2020). Controls on eruption style at rabaul, Papua new Guinea – insights from microlites, porosity and permeability measurements. J. Volcanol Geotherm Res. 406, 107068. doi: 10.1016/j.jvolgeores.2020.107068
Bindoff N. L., Cheung W. W. L., Kairo J. G., Arístegui J., Guinder V. A., Hallberg R., et al. (2019). “Changing ocean, marine ecosystems, and dependent communities,” in IPCC special report on the ocean and cryosphere in a changing climate. Eds. H.-O. Pörtner D. C. R., Masson-Delmotte V., Zhai P., Tignor M., Poloczanska E., Mintenbeck K., Alegría A., Nicolai M., Okem A., Petzold J., Rama B., Weyer N. M. (Cambridge, UK and New York, NY, USA: Cambridge University Press), 447–587.
Bock N., Van Wambeke F., Dion M., Duhamel S. (2018). Microbial community structure in the western tropical south pacific. Biogeosciences 15 (12), 3909–3925. doi: 10.5194/bg-15-3909-2018
Bonnet S., Caffin M., Berthelot H., Grosso O., Benavides M., Helias-Nunige S., et al. (2018). In-depth characterization of diazotroph activity across the western tropical south pacific hotspot of N2 fixation (OUTPACE cruise). Biogeosciences 15 (13), 4215–4232. doi: 10.5194/bg-15-4215-2018
Bonnet S., Caffin M., Berthelot H., Moutin T. (2017). Hot spot of N2 fixation in the western tropical south pacific pleads for a spatial decoupling between N2 fixation and denitrification. Proc. Natl. Acad. Sci. 114 (14), E2800-E2801. doi: 10.1073/pnas.1619514114
Bouvet de Maisonneuve C., Costa F., Patia H., Huber C. (2015). Mafic magma replenishment, unrest and eruption in a caldera setting: insights from the 2006 eruption of rabaul (Papua new Guinea). Geological Society London Special Publications 422, 17–39. doi: 10.1144/SP422.2
Boyce D. G., Lewis M. R., Worm B. (2010). Global phytoplankton decline over the past century. Nature 466 (7306), 591–596. doi: 10.1038/nature09268
Brenna M., Cronin S., Smith I., Pontesilli A., Tost M., Barker S., et al. (2022). Post-caldera volcanism reveals shallow priming of an intra-ocean arc andesitic caldera: hunga volcano, Tonga, SW pacific. Lithos 412-413, 1–15. doi: 10.1016/j.lithos.2022.106614
Browning T. J., Bouman H. A., Henderson G. M., Mather T. A., Pyle D. M., Schlosser C., et al. (2014). Strong responses of southern ocean phytoplankton communities to volcanic ash. Geophys. Res. Lett. 41 (8), 2851–2857. doi: 10.1002/2014GL059364
Browning T. J., Stone K., Bouman H. A., Mather T. A., Pyle D. M., Moore C. M., et al. (2015). Volcanic ash supply to the surface ocean–remote sensing of biological responses and their wider biogeochemical significance. Front. Mar. Sci. 2. doi: 10.3389/fmars.2015.00014
Caffin M., Moutin T., Foster R. A., Bouruet-Aubertot P., Doglioli A. M., Berthelot H., et al. (2018). N2 fixation as a dominant new n source in the western tropical south pacific ocean (OUTPACE cruise). Biogeosciences 15 (8), 2565–2585. doi: 10.5194/bg-15-2565-2018
Carr J. L., Horváth Á., Wu D. L., Friberg M. D. (2022). Stereo plume height and motion retrievals for the record-setting hunga Tonga-hunga ha'apai eruption of 15 January 2022. Geophys. Res. Lett. 49 (9), e2022GL098131. doi: 10.1029/2022GL098131
Coale K., Johnson K., Chavez F., Buesseler K., Barber R., Brzezinski M., et al. (2004). Southern ocean iron enrichment experiment: carbon cycling in high- and low-Si waters. Sci. (New York N.Y.) 304, 408–414. doi: 10.1126/science.1089778
Cooley S., Schoeman D., Bopp L., Boyd P., Donner S., Ghebrehiwet D. Y., et al. (2022). “Ocean and coastal ecosystems and their services,” in Climate change 2022: impacts, adaptation, and vulnerability. contribution of working group II to the sixth assessment report of the intergovernmental panel on climate change. Eds. H.-O. Pörtner D. C. R., Tignor M., Poloczanska E. S., Mintenbeck K., Alegría A., Craig M., Langsdorf S., Löschke S., Möller V., Okem A., Rama B. (Cambridge University Press).
de Boyer Montégut C., Madec G., Fischer A. S., Lazar A., Iudicone D. (2004). Mixed layer depth over the global ocean: an examination of profile data and a profile-based climatology. J. Geophys. Res. Oceans 109, C12. doi: 10.1029/2004JC002378
Duce R. A., LaRoche J., Altieri K., Arrigo K. R., Baker A. R., Capone D. G., et al. (2008). Impacts of atmospheric anthropogenic nitrogen on the open ocean. Science 320 (5878), 893–897. doi: 10.1126/science.1150369
Duggen S., Croot P., Schacht U., Hoffmann L. (2007). Subduction zone volcanic ash can fertilize the surface ocean and stimulate phytoplankton growth: evidence from biogeochemical experiments and satellite data. Geophys. Res. Lett. 34, L01612. doi: 10.1029/2006GL027522
Duggen S., Olgun N., Croot P., Hoffmann L., Dietze H., Delmelle P., et al. (2010). The role of airborne volcanic ash for the surface ocean biogeochemical iron-cycle: a review. Biogeosciences 7 (3), 827–844. doi: 10.5194/bg-7-827-2010
Dutheil C., Aumont O., Gorguès T., Lorrain A., Bonnet S., Rodier M., et al. (2018). Modelling N2 fixation related to trichodesmium sp.: driving processes and impacts on primary production in the tropical pacific ocean. Biogeosciences 15 (14), 4333–4352. doi: 10.5194/bg-15-4333-2018
Filho W. L., Azul A. M., Brandli L., Salvia A. L., Wall T. (2022). Clean water and sanitation (Springer International Publishing).
Fitzwater S. E., Coale K. H., Gordon R. M., Johnson K. S., Ondrusek M. E. (1996). Iron deficiency and phytoplankton growth in the equatorial pacific. Deep Sea Res. Part II Top. Stud. Oceanogr 43 (4), 995–1015. doi: 10.1016/0967-0645(96)00033-1
Frogner P., Gíslason S. R., Óskarsson N. (2001). Fertilizing potential of volcanic ash in ocean surface water. Geology 29 (6), 487–490. doi: 10.1130/0091-7613(2001)029<0487:Fpovai>2.0.Co;2
Good S., Fiedler E., Mao C., Martin M. J., Maycock A., Reid R., et al. (2020). The current configuration of the OSTIA system for operational production of foundation Sea surface temperature and ice concentration analyses. Remote Sens. 12 (4), 720. doi: 10.3390/rs12040720
Guieu C., Aumont O., Bopp L., Law C. S., Mahowald N., Achterberg E., et al. (2014). The significance of the episodic nature of atmospheric deposition to low nutrient low chlorophyll regions. Global Biogeochem Cycles 422, 17–39. doi: 10.1002/2014GB004852
Guieu C., Bonnet S., Petrenko A., Menkes C., Chavagnac V., Desboeufs K., et al. (2018). Iron from a submarine source impacts the productive layer of the Western tropical south pacific (WTSP). Sci. Rep. 8 (1), 9075. doi: 10.1038/s41598-018-27407-z
Hamilton D. S., Perron M. M. G., Bond T. C., Bowie A. R., Buchholz R. R., Guieu C., et al. (2022). Earth, wind, fire, and pollution: aerosol nutrient sources and impacts on ocean biogeochemistry. Ann. Rev. Mar. Sci. 14 (1), 303–330. doi: 10.1146/annurev-marine-031921-013612
Hamme R., Webley P., Crawford W., Whitney F., DeGrandpre M., Emerson S., et al. (2010). Volcanic ash fuels anomalous plankton bloom in subarctic northeast pacific. Geophys. Res. Lett. 37, L19604. doi: 10.1029/2010GL044629
Heffter J. L., Stunder B. J. B. (1993). Volcanic ash forecast transport and dispersion (VAFTAD) model. Weather Forecas 8 (4), 533–541. doi: 10.1175/1520-0434(1993)008<0533:Vaftad>2.0.Co;2
Hendryx M., Islam M. S., Dong G.-H., Paul G. (2020). Air pollution emissions 2008-2018 from Australian coal mining: implications for public and occupational health. Int. J. Environ. Res. Public Health 17 (5), 1570. doi: 10.3390/ijerph17051570
Jickells T., Moore C. M. (2015). The importance of atmospheric deposition for ocean productivity. Annu. Rev. Ecol. Evol. Syst. 46 (1), 481–501. doi: 10.1146/annurev-ecolsys-112414-054118
Johnson M. S., Meskhidze N., Kiliyanpilakkil V. P., Gassó S. (2011). Understanding the transport of Patagonian dust and its influence on marine biological activity in the south Atlantic ocean. Atmospheric Chem. Phys. 11 (6), 2487–2502. doi: 10.5194/acp-11-2487-2011
Jones M., Gislason S. (2008). Rapid releases of metal salt and nutrient following the deposition of volcanic ash into aqueous environments. Geochim. Cosmochim. Acta 72, 3661–3680. doi: 10.1016/j.gca.2008.05.030
Jutzeler M., Marsh R., Carey R. J., White J. D. L., Talling P. J., Karlstrom L. (2014). On the fate of pumice rafts formed during the 2012 havre submarine eruption. Nat. Commun. 5 (1), 3660. doi: 10.1038/ncomms4660
Jutzeler M., Marsh R., van Sebille E., Mittal T., Carey R. J., Fauria K. E., et al. (2020). Ongoing dispersal of the 7 august 2019 pumice raft from the Tonga arc in the southwestern pacific ocean. Geophys. Res. Lett. 47 (5), e1701121. doi: 10.1029/2019GL086768
Kim I.-N., Lee K., Gruber N., Karl D. M., Bullister J. L., Yang S., et al. (2014). Increasing anthropogenic nitrogen in the north pacific ocean. Science 346 (6213), 1102–1106. doi: 10.1126/science.1258396
Kim M.-H., Omar A. H., Tackett J. L., Vaughan M. A., Winker D. M., Trepte C. R., et al. (2018). The CALIPSO version 4 automated aerosol classification and lidar ratio selection algorithm. Atmos Meas Tech 11 (11), 6107–6135. doi: 10.5194/amt-11-6107-2018
Kloss C., Sellitto P., Legras B., Vernier J.-P., Jegou F., Venkat ratnam M., et al. (2020). Impact of the 2018 ambae eruption on the global stratospheric aerosol layer and climate. J. Geophys. Res. Atmos 125 (14), e2020JD032410. doi: 10.1029/2020jd032410
Kramarova N. A., Bhartia P. K., Jaross G., Moy L., Xu P., Chen Z., et al. (2018). Validation of ozone profile retrievals derived from the OMPS LP version 2.5 algorithm against correlative satellite measurements. Atmos Meas Tech 11 (5), 2837–2861. doi: 10.5194/amt-11-2837-2018
Langmann B., Zakšek K., Hort M., Duggen S. (2010). Volcanic ash as fertiliser for the surface ocean. Atmospheric Chem. Phys. 10 (8), 3891–3899. doi: 10.5194/acp-10-3891-2010
Li G., Cheng L., Zhu J., Trenberth K. E., Mann M. E., Abraham J. P. (2020b). Increasing ocean stratification over the past half-century. Nat. Clim. Change 10 (12), 1116–1123. doi: 10.1038/s41558-020-00918-2
Li C., Krotkov N. A., Carn S., Zhang Y., Spurr R. J. D., Joiner J. (2017). New-generation NASA aura ozone monitoring instrument (OMI) volcanic SO2 dataset: algorithm description, initial results, and continuation with the suomi-NPP ozone mapping and profiler suite (OMPS). Atmos Meas Tech 10 (2), 445–458. doi: 10.5194/amt-10-445-2017
Li C., Krotkov N. A., Leonard P. J. T., Carn S., Joiner J., Spurr R. J. D., et al. (2020a). Version 2 ozone monitoring instrument SO2 product (OMSO2 V2): new anthropogenic SO2 vertical column density dataset. Atmos Meas Tech 13 (11), 6175–6191. doi: 10.5194/amt-13-6175-2020
Lin I.-I., Hu C., Li Y.-H., Ho T.-Y., Fischer T. P., Wong G. T. F., et al. (2011). Fertilization potential of volcanic dust in the low-nutrient low-chlorophyll western north pacific subtropical gyre: satellite evidence and laboratory study. Global Biogeochem Cycles 25, 1. doi: 10.1029/2009GB003758
Longman J., Palmer M. R., Gernon T. M. (2020). Viability of greenhouse gas removal via artificial addition of volcanic ash to the ocean. Anthropocene 32, 100264. doi: 10.1016/j.ancene.2020.100264
Longman J., Palmer M. R., Gernon T. M., Manners H. R. (2019). The role of tephra in enhancing organic carbon preservation in marine sediments. Earth-Sci Rev. 192, 480–490. doi: 10.1016/j.earscirev.2019.03.018
Longman J., Palmer M. R., Gernon T. M., Manners H. R., Jones M. T. (2022). Subaerial volcanism is a potentially major contributor to oceanic iron and manganese cycles. Commun. Earth Environ. 3 (1), 60. doi: 10.1038/s43247-022-00389-7
Loughman R., Bhartia P. K., Chen Z., Xu P., Nyaku E., Taha G. (2018). The ozone mapping and profiler suite (OMPS) limb profiler (LP) version 1 aerosol extinction retrieval algorithm: theoretical basis. Atmos Meas Tech 11 (5), 2633–2651. doi: 10.5194/amt-11-2633-2018
Mantas V. M., Pereira A. J. S. C., Morais P. V. (2011). Plumes of discolored water of volcanic origin and possible implications for algal communities. the case of the home reef eruption of 2006 (Tonga, southwest pacific ocean). Remote Sens Environ. 115 (6), 1341–1352. doi: 10.1016/j.rse.2011.01.014
McKee K., Smith C. M., Reath K., Snee E., Maher S., Matoza R. S., et al. (2021). Evaluating the state-of-the-art in remote volcanic eruption characterization part II: ulawun volcano, Papua new Guinea. J. Volcanol Geotherm Res. 420, 107381. doi: 10.1016/j.jvolgeores.2021.107381
Mélançon J., Levasseur M., Lizotte M., Delmelle P., Cullen J., Hamme R. C., et al. (2014). Early response of the northeast subarctic pacific plankton assemblage to volcanic ash fertilization. Limnol Oceanogr 59 (1), 55–67. doi: 10.4319/lo.2014.59.1.0055
Mishra M. K., Hoffmann L., Thapliyal P. K. (2022). Investigations on the global spread of the hunga Tonga-hunga ha’apai volcanic eruption using space-based observations and Lagrangian transport simulations. Atmosphere 13 (12), 2055. doi: 10.3390/atmos13122055
Moore C. M., Mills M. M., Arrigo K. R., Berman-Frank I., Bopp L., Boyd P. W., et al. (2013). Processes and patterns of oceanic nutrient limitation. Nat. Geosci. 6 (9), 701–710. doi: 10.1038/ngeo1765
Moussallam Y., Rose-Koga E. F., Koga K. T., Médard E., Bani P., Devidal J.-L., et al. (2019). Fast ascent rate during the 2017–2018 plinian eruption of ambae (Aoba) volcano: a petrological investigation. Contrib Mineral Petrol 174 (11), 90. doi: 10.1007/s00410-019-1625-z
Moutin T., Wagener T., Caffin M., Fumenia A., Gimenez A., Baklouti M., et al. (2018). Nutrient availability and the ultimate control of the biological carbon pump in the western tropical south pacific ocean. Biogeosciences 15 (9), 2961–2989. doi: 10.5194/bg-15-2961-2018
Newhall C., Self S. (1982). The volcanic explosivity index (VEI): an estimate of explosive magnitude for historical volcanism. J. Geophys. Res. 87, 1231–1238. doi: 10.1029/JC087iC02p01231
O'Reilly J. E. (2000). Ocean color chlorophyll a algorithms for SeaWiFS OC2 and OC4, version 4, in SeaWiFS Postlaunched Calibration and Validation Analyses, Part 3, edited by S. B. Hooker, and E. R. Firestone. NASA Tech. Memo. 2000-206892 11, 9–23, NASA.
Olgun N., Duggen S., Andronico D., Kutterolf S., Croot P. L., Giammanco S., et al. (2013a). Possible impacts of volcanic ash emissions of mount Etna on the primary productivity in the oligotrophic Mediterranean Sea: results from nutrient-release experiments in seawater. Mar. Chem. 152, 32–42. doi: 10.1016/j.marchem.2013.04.004
Olgun N., Duggen S., Langmann B., Hort M., Waythomas C., Hoffmann L., et al. (2013b). Geochemical evidence of oceanic iron fertilization by the kasatochi volcanic eruption in 2008 and the potential impacts on pacific sockeye salmon. Mar. Ecol. Prog. Ser. 488, 81–88. doi: 10.3354/meps10403
Poulidis A. P., Phillips J. C., Renfrew I. A., Barclay J., Hogg A., Jenkins S. F., et al. (2018). Meteorological controls on local and regional volcanic ash dispersal. Sci. Rep. 8 (1), 6873. doi: 10.1038/s41598-018-24651-1
Rolph G., Stein A., Stunder B. (2017). Real-time environmental applications and display sYstem: READY. Environ. Model. Software 95, 210–228. doi: 10.1016/j.envsoft.2017.06.025
Sears T., Thomas G., Carboni E., Smith A., Grainger R. (2013). SO2 as a possible proxy for volcanic ash in aviation hazard avoidance. J. Geophys. Res. Atmos 118, 5698–5709. doi: 10.1002/jgrd.50505
Shi W., Wang M. (2011). Satellite observations of environmental changes from the Tonga volcano eruption in the southern tropical pacific. Int. J. Remote Sens 32 (20), 5785–5796. doi: 10.1080/01431161.2010.507679
Shiozaki T., Kodama T., Furuya K. (2014). Large-Scale impact of the island mass effect through nitrogen fixation in the western south pacific ocean. Geophys. Res. Lett. 41, 2907–2913. doi: 10.1002/2014GL059835
Smart D. (2022). The first hour of the paroxysmal phase of the 2022 hunga Tonga–hunga ha'apai volcanic eruption as seen by a geostationary meteorological satellite. Weather 77 (3), 81–82. doi: 10.1002/wea.4173
Stein A. F., Draxler R. R., Rolph G. D., Stunder B. J. B., Cohen M. D., Ngan F. (2015). NOAA’s HYSPLIT atmospheric transport and dispersion modeling system. Bull. Am. Meteorol. 96 (12), 2059–2077. doi: 10.1175/bams-d-14-00110.1
Terry J. P., Goff J., Winspear N., Bongolan V. P., Fisher S. (2022). Tonga Volcanic eruption and tsunami, January 2022: globally the most significant opportunity to observe an explosive and tsunamigenic submarine eruption since AD 1883 krakatau. Geosci. Lett. 9 (1), 24. doi: 10.1186/s40562-022-00232-z
Thomas H. E., Prata A. J. (2011). Sulphur dioxide as a volcanic ash proxy during the April–may 2010 eruption of eyjafjallajökull volcano, Iceland. Atmospheric Chem. Phys. 11 (14), 6871–6880. doi: 10.5194/acp-11-6871-2011
Tilliette C., Taillandier V., Bouruet-Aubertot P., Grima N., Maes C., Montanes M., et al. (2022). Dissolved iron patterns impacted by shallow hydrothermal sources along a transect through the Tonga-kermadec arc. Global Biogeochem Cycles 36 (7), e2022GB007363. doi: 10.1029/2022GB007363
Vaughan R., Abrams M., Hook S., Pieri D. (2007). Satellite observations of new volcanic island in Tonga. Eos Trans. Am. Geophysical Union 88, 37–41. doi: 10.1029/2007EO040002
Ventura A., Simões E. F. C., Almeida A. S., Martins R., Duarte A. C., Loureiro S., et al. (2021). Deposition of aerosols onto upper ocean and their impacts on marine biota. Atmosphere 12 (6), 684. doi: 10.3390/atmos12060684
Vergara-Jara M. J., Hopwood M. J., Browning T. J., Rapp I., Torres R., Reid B., et al. (2021). A mosaic of phytoplankton responses across Patagonia, the southeast pacific and the southwest Atlantic to ash deposition and trace metal release from the calbuco volcanic eruption in 2015. Ocean Sci. 17 (2), 561–578. doi: 10.5194/os-17-561-2021
Vernier J., Fairlie T., Deshler T., Natarajan M., Knepp T., Foster K., et al. (2016). In situ and space-based observations of the kelud volcanic plume: the persistence of ash in the lower stratosphere: persistence of volcanic ash. J. Geophys. Res. Atmos 121, 11104–11118. doi: 10.1002/2016JD025344
Wang Y., Jiang H., Jin J., Zhang X., Lu X., Wang Y. (2015). Spatial-temporal variations of chlorophyll-a in the adjacent Sea area of the Yangtze river estuary influenced by Yangtze river discharge. Int. J. Environ. Res. Public Health 12 (5), 5420–5438. doi: 10.3390/ijerph120505420
Whiteside A., Dupouy C., Singh A., Bani P., Tan J., Frouin R. (2023). Impact of ashes from the 2022 Tonga volcanic eruption on satellite ocean color signatures. Front. Mar. Sci. 9. doi: 10.3389/fmars.2022.1028022
Whiteside A., Dupouy C., Singh A., Frouin R., Menkes C., Lefèvre J. (2021). Automatic detection of optical signatures within and around floating Tonga-Fiji pumice rafts using MODIS, VIIRS, and OLCI satellite sensors. Remote Sens. 13, 501. doi: 10.3390/rs13030501
Winker D. M., Vaughan M. A., Omar A., Hu Y., Powell K. A., Liu Z., et al. (2009). Overview of the CALIPSO mission and CALIOP data processing algorithms. J. Atmos Ocean Technol. 26 (11), 2310–2323. doi: 10.1175/2009jtecha1281.1
Yang K., Dickerson R., Carn S., Ge C., Wang J. (2013). First observations of SO2 from the satellite suomi NPP OMPS: widespread air pollution events over China. Geophys. Res. Lett. 40, 4957–4962. doi: 10.1002/grl.50952
Yoon J.-E., Son S., Kim I.-N. (2022). Capture of decline in spring phytoplankton biomass derived from COVID-19 lockdown effect in the yellow Sea offshore waters. Mar. pollut. Bull. 174, 113175. doi: 10.1016/j.marpolbul.2021.113175
Yoon J. E., Yoo K. C., Macdonald A. M., Yoon H. I., Park K. T., Yang E. J., et al. (2018). Reviews and syntheses: ocean iron fertilization experiments – past, present, and future looking to a future Korean iron fertilization experiment in the southern ocean (KIFES) project. Biogeosciences 15 (19), 5847–5889. doi: 10.5194/bg-15-5847-2018
Keywords: volcanic eruption, western South Pacific Ocean, satellite data, chlorophyll-a concentration, ash deposition
Citation: Yoon J-E, King D, Longman J and Cronin SJ (2023) Differential response of chlorophyll-a concentrations to explosive volcanism in the western South Pacific. Front. Mar. Sci. 10:1072610. doi: 10.3389/fmars.2023.1072610
Received: 17 October 2022; Accepted: 31 March 2023;
Published: 19 April 2023.
Edited by:
Ricardo Maria Letelier, Oregon State University, United StatesReviewed by:
Sudheer A. K., Physical Research Laboratory, IndiaJan-Lukas Menzel Barraqueta, European Ecological Consulting S.L., Spain
Copyright © 2023 Yoon, King, Longman and Cronin. This is an open-access article distributed under the terms of the Creative Commons Attribution License (CC BY). The use, distribution or reproduction in other forums is permitted, provided the original author(s) and the copyright owner(s) are credited and that the original publication in this journal is cited, in accordance with accepted academic practice. No use, distribution or reproduction is permitted which does not comply with these terms.
*Correspondence: Joo-Eun Yoon, amV5MjhAY2FtLmFjLnVr