 Lara Jacobi
 Dirk Nürnberg
 Weng-si Chao2
 Lester Lembke-Jene
 Ralf Tiedemann
- 1GEOMAR, Helmholtz Centre for Ocean Research Kiel, Kiel, Germany
- 2Alfred-Wegner-Institute - Helmholtz Centre for Polar and Marine Research, Bremerhaven, Germany
The subarctic front (SAF) in the pelagic North Pacific is the northernmost front of the Kuroshio-Oyashio transition zone separating the subpolar and subtropical gyres and is marked by a strong sea surface temperature gradient. A complex interplay of e.g. variations of currents, the wind system and other forcing mechanisms causes shifts of the SAF’s position on timescales from orbital to interannual. In this study, we present proxy data from the Emperor Seamount chain, which reveal a link between long-term ENSO (El Niño/Southern Oscillation) dynamics in the tropics and shifts of the SAF. Based on sediment core SO264-45-2 from Jimmu Seamount (46°33.792’N, 169°36.072’E) located close to the modern position of the SAF, we reconstruct changes in (sub)surface temperature ((sub)SSTMg/Ca) and δ18Osw-ivc (approximating salinities) via combined Mg/Ca and δ18O analyses of the shallow-dwelling foraminifera Globigerina bulloides and the near-thermocline-dwelling Neogloboquadrina pachyderma, biological productivity (XRF-based Ba/Ti ratios), and terrigenous input via dust (XRF-based Fe). From ~600 to ~280 ka BP we observe significantly higher SSTMg/Ca than after an abrupt change at 280 ka BP. We assume that during this time warmer water from the Kuroshio-Oyashio transition zone reached the core site, reflecting a shift of the SAF from a position at or even north of our study site prior to 280 ka BP to a position south of our study site after 280 ka BP. We propose that such a northward displacement of the SAF between 600-280 ka BP was induced by sustained La Niña-like conditions, which led to increased transport of tropical ocean heat into the Kuroshio-Oyashio transition zone via the Kuroshio Current. After ~280 ka BP, the change to more El Niño-like conditions led to less heat transfer via the Kuroshio Current with the SAF remaining south of the core location. In contrast, our productivity record shows a clear glacial-interglacial pattern that is common in the North Pacific. We assume that this pattern is connected to changes in nutrient supply or utilization, which are not primarily driven by changes of the Kuroshio and Oyashio Currents or the SAF.
1 Introduction
The Kuroshio Current, as the northern boundary of the subtropical gyre, and the Oyashio Current, as the southern boundary of the subpolar gyre, are of significant importance for the midlatitude pelagic North Pacific (Qiu, 2019). The area between the two Currents is named the Kuroshio-Oyashio transition zone and is marked by several fronts (Figure 1). For example, the subarctic front (SAF), located close to our study site, is the northernmost front in the Kuroshio-Oyashio transition zone. Shifts of the Kuroshio and Oyashio Currents and their mixing zones have significantly affected oceanographic conditions in the North Pacific on various time scales and influence the global climate as the Kuroshio-Oyashio transition zone acts as a sink for atmospheric CO2 (Thompson and Shackleton, 1980; Hovan et al., 1991; Kawahata et al., 2000; Yamane, 2003; Ogawa et al., 2006; Takahashi et al., 2009; Ayers and Lozier, 2012; Chiyonobu et al., 2012). Yet the timing and the causes of such shifts in the frontal system are still a matter of debate.
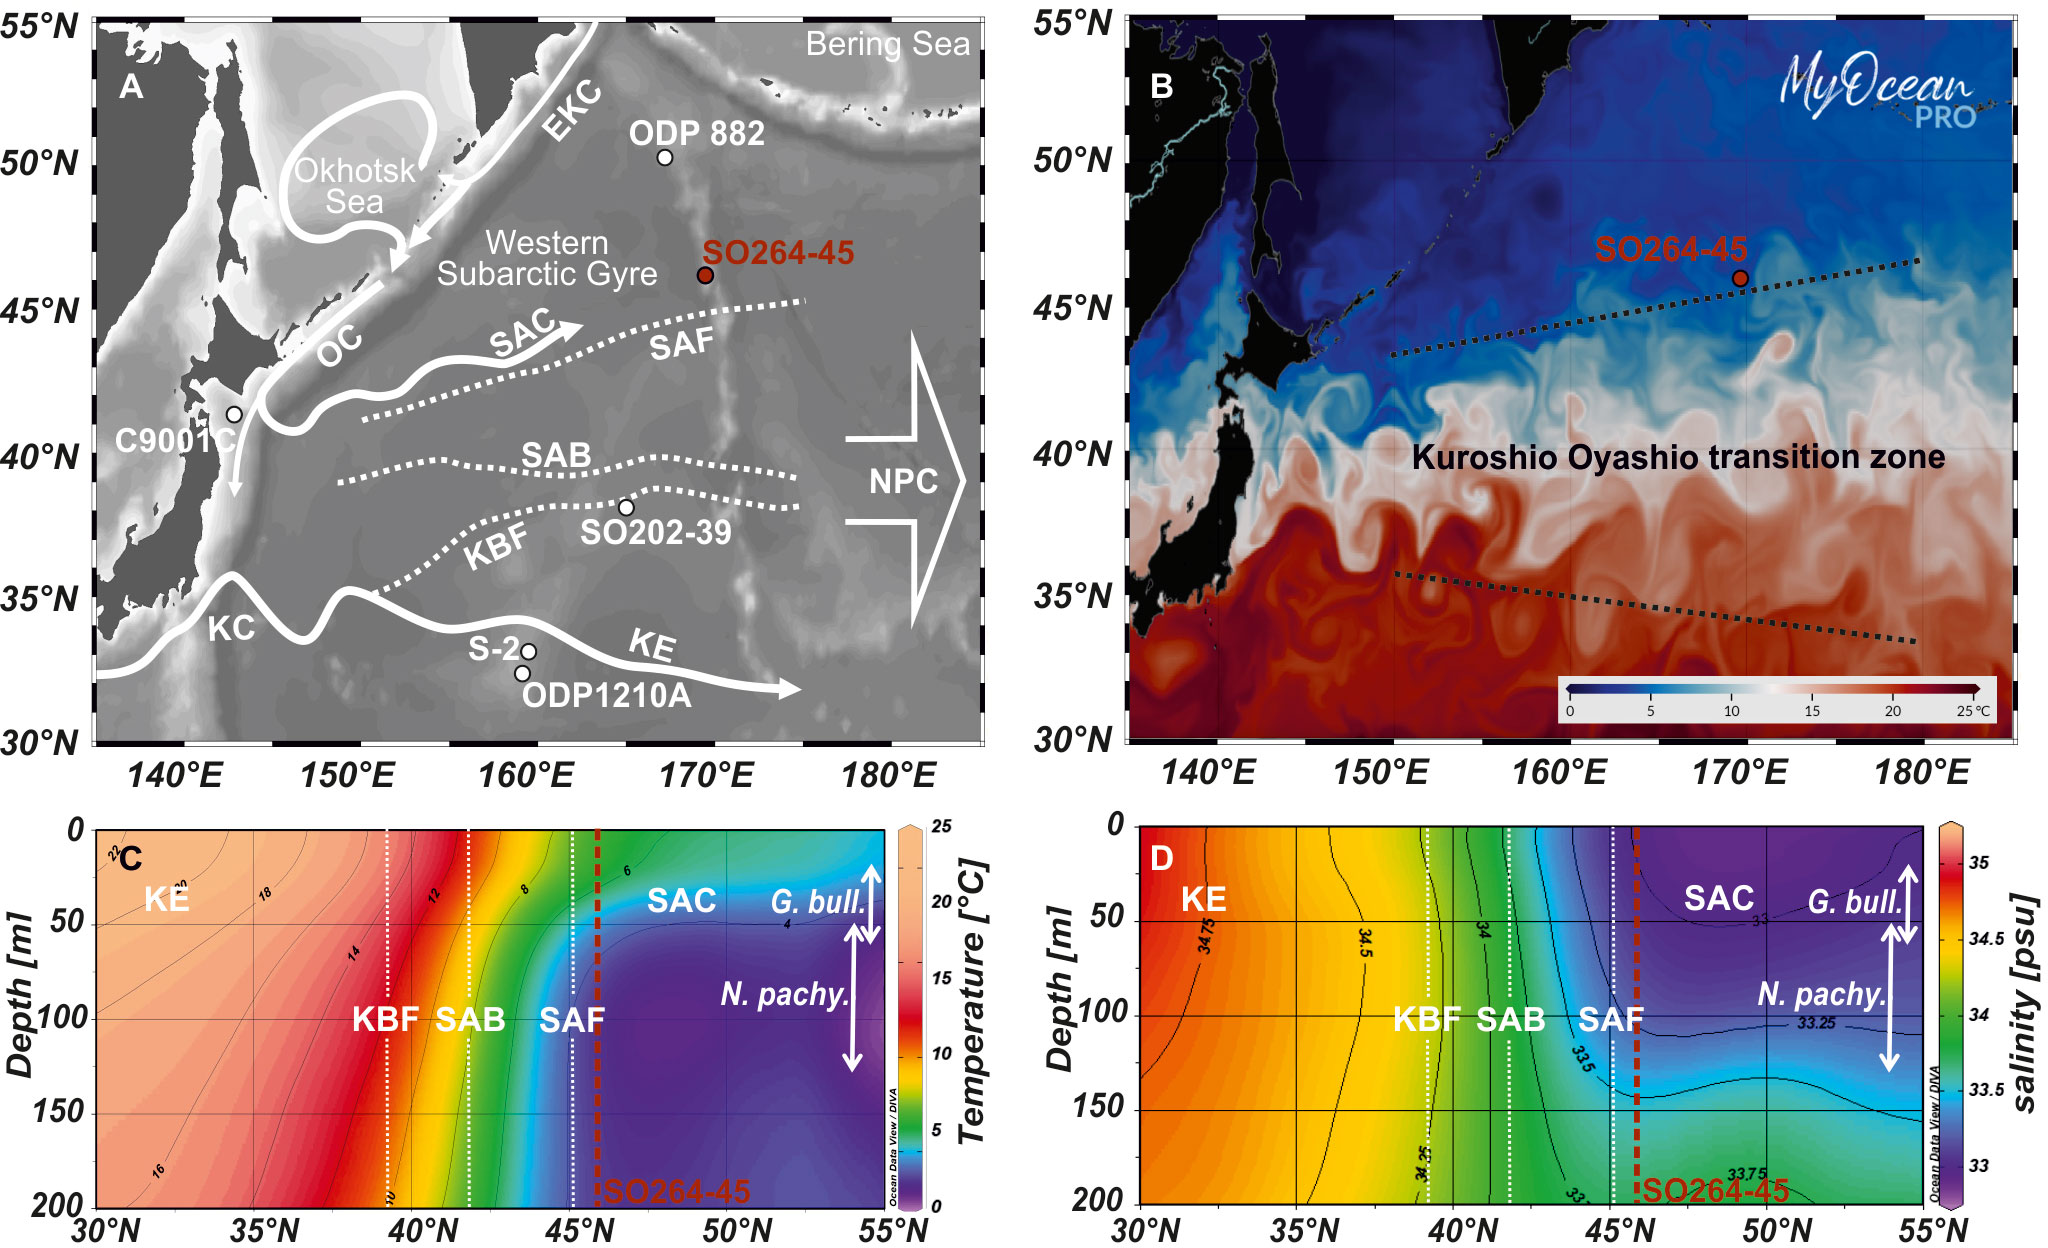
Figure 1 Sea surface and subsurface hydrology of the North West Pacific. (A) Bathymetric map indicating the locations of the study site SO264-45 and reference cores ODP Site 882 (Jaccard et al., 2010), SO202-39 (Korff et al., 2016), ODP Site 1210A (Chiyonobu et al., 2012), S-2 (Yamane, 2003), and C9001C (Matsuzaki et al., 2014). The surface current and water-mass structure in the Kuroshio-Oyashio transition area is schematically illustrated: EKC, East Kamchatka Current; KC, Kuroshio Current; KE, Kuroshio Extension; NPC, North Pacific Current; OC, Oyashio Current; SAC, Subarctic Current; KBF, Kuroshio Bifurcation Front; SAB, Subarctic Boundary; SAF, Subarctic Front. (B) Potential sea surface temperature of the North West Pacific from early summer 2021. The Oyashio-Kuroshio transition zone is characterized by large eddies. This figure was generated using EU Copernicus Marine Service Information with data from GLOBAL_ANALYSIS_FORECAST_PHY_001_024 (Zammit-Mangion and Wikle, 2020). (C, D) North-south-oriented annual temperature and salinity transects along 170°E illustrated with Ocean Data View (Schlitzer, 2019) based on data from the World Ocean Atlas 2018 (Locarnini et al., 2018; Zweng et al., 2019). The position of fronts are marked by white dotted lines; the core position by a red dotted line and depth habitats of G. bulloides and N. pachyderma by white arrows.
Some authors suggest a connection between shifts of the oceanic fronts in the North Pacific and climate changes related to glacial-interglacial cycles (Thompson and Shackleton, 1980; Kawahata and Ohshima, 2002; Harada et al., 2004; Yasudomi et al., 2014; Gallagher et al., 2015), others hypothesize a connection between El Niño-Southern Oscillation (ENSO), the Kuroshio strength and the positioning of the front system (Yamane, 2003; Chen et al., 2007). While ENSO is commonly known as the interannual oscillation between “El Niño” and “La Niña” phases, several authors suggest that there are also changes from more La Niña-like to more El Niño-like conditions on longer time scales (de Garidel-Thoron et al., 2005; Wara et al., 2005; Zheng et al., 2016; Jia et al., 2018). These authors use the paleotemperature gradient between the West Pacific Warm Pool (WPWP) and the Eastern Equatorial Pacific (EEP) (ΔTWPWP-EEP) as an indicator for ENSO on geological time scales. During more El Niño-like phases, there is a weak temperature gradient, whereas, during more La Niña-like phases, there is an amplified ΔTWPWP-EEP (de Garidel-Thoron et al., 2005; Wara et al., 2005; Zheng et al., 2016; Jia et al., 2018). Further, the path and strength of both the Kuroshio and Oyashio Currents are affected by changes in the wind system, e.g., the westerlies or the East Asian Monsoon (Yatsu et al., 2013).
The investigation of upper ocean hydrography, particularly sea surface temperature (SST), is promising for gaining further insights into shifts of the Kuroshio-Oyashio transition zone and its frontal systems. However, in the pelagic North Pacific, variations of SSTs have little been studied beyond the availability of observational data mainly because proxy records are sparse, especially over longer time scales, beyond the last glacial (Lohmann et al., 2019; Zhong et al., 2023). One of the main causes is the limited availability of carbonate-bearing sediment records. These are restricted to, e.g., seamount areas, where the water depth does not exceed the depth of the calcite compensation depth, which lies at about ~4000 m in the open North Pacific (Chen et al., 2021). This constrains the use of foraminiferal calcite as signal carrier for paleo proxies. Our study site, however, is located on Jimmu Seamount (water depth< 2500 m) right beneath the modern position of the SAF (Figure 1) and thus provides the rare opportunity to use foraminiferal calcite as a proxy for the reconstruction of changes in SST and δ18O of seawater.
The SST variability in the mid-latitude North Pacific is dominated by the Pacific Decadal Oscillation (PDO; Mantua et al., 1997). It describes the variability between periods of warm or cool surface waters and is a highly complex system combining various forcing factors. According to Newman et al. (2016), these include: (1) changes in ocean surface heat fluxes and Ekman (wind-driven) transport related to the Aleutian low due to both local, rapidly decorrelating, unpredictable weather noise and to remote forcing from interannual to decadal tropical variability (largely El Nino) via the “atmospheric bridge”; (2) ocean memory, or processes determining oceanic thermal inertia including “re-emergence” and oceanic Rossby waves, that act to integrate this forcing and thus generate added PDO variability on decadal time scales; and (3) decadal changes in the Kuroshio-Oyashio current system forced by the multi-year history of basin-wide Ekman pumping, manifested as SST anomalies along the subarctic front at about 40°N in the western Pacific ocean. The whole complexity of the PDO is not yet entirely understood. Thus, it is heavily discussed in ongoing research within the meteorological and climate dynamics communities, and attempts for paleo studies on the PDO reaching back further than 500 years are rare (e.g., MacDonald and Case, 2005; Yu et al., 2015; Johnson et al., 2020; Li et al., 2020; Choi and Son, 2022). Since much of the PDO represents the oceanic response to atmospheric forcing, it is difficult to consider the PDO as a forcing function itself (Newman et al., 2016).
To further identify the influence of shifts in the frontal system on primary productivity, we also consider representative XRF-based proxy data. In the North Pacific, primary productivity is mainly described to be linked to glacial-interglacial cycles, with higher productivity during interglacials and lower productivity during glacials (Narita et al., 2002; Gorbarenko et al., 2004; Kienast et al., 2004; Jaccard et al., 2005; Brunelle et al., 2007; Shigemitsu et al., 2007; Galbraith et al., 2008; Gebhardt et al., 2008; Jaccard et al., 2010; Riethdorf et al., 2013). However, the driving mechanisms for changes in productivity over longer time scales are not yet entirely understood. For example, to what extent the productivity was influenced by the complex interplay of atmosphere and ocean and their respective circulation patterns dependent on, e.g., sea ice formation, light limitation, wind strength, nutrient supply, and stratification (Haug and Sigman, 2009; Jaccard et al., 2010; Sigman et al., 2010; Sigman et al., 2021); Kawahata et al., 2000; Matsumoto et al., 2002; Brunelle et al., 2007; Shigemitsu et al., 2007; Jaccard et al., 2010; Nishioka et al., 2011; Costa et al., 2018; Sigman et al., 2021).
Thus, our new dataset on upper ocean temperatures (based on foraminiferal Mg/Ca), marine productivity (XRF-based Ba/Ti), and terrigenous input via wind (XRF-based Fe) from the pelagic North Pacific provide a unique opportunity to gain further insights into upper ocean dynamics, primarily spatial and temporal shifts of the Kuroshio-Oyashio frontal systems and a possible link to productivity over the past 650 ka.
1.1 Oceanographic setting
The North Pacific is characterized by two large-scale wind-driven gyre systems: the cyclonic Subarctic Gyre in the north and the anticyclonic Subtropical Gyre in the south (Huang, 2015). The Subarctic Gyre has a strong western boundary current. The Oyashio Current originates from the East Kamchatka Current and is further fed by cold, low saline nutrient-rich water from the Okhotsk Sea. Close to the coast of northern Japan the Oyashio Current has an annual mean temperature of ~5°C and a salinity of ~33 (Locarnini et al., 2018; Zweng et al., 2019). At ~42°N the Oyashio Current splits and one path continues as the northeastward flowing Subarctic Current (SAC) (Qiu, 2019). The western limb of the North Pacific Subtropical Gyre is also formed by a strong western boundary current. The Kuroshio Current originates from the warm, saline North Equatorial Current (NEC) and transports oceanic heat from the WPWP to the northern regions (Figure 1). The location where the North Equatorial Current (NEC) bifurcates into the Kuroshio Current and the Mindanao Current (Metzger and Hurlburt, 1996; Qiu and Lukas, 1996; Ujiié et al., 2003) is located at ~15.5°N for the annual average, but varies with time and depth. The meridional migration of the NEC bifurcation is strongly influenced by ENSO (Kim et al., 2004), which is the main driver of upper ocean circulation in the tropical Pacific, (Hu et al., 2015; Joh and Di Lorenzo, 2019). In El Niño years the NEC’s bifurcation point migrates to the north and the Kuroshio velocity and volume transport decrease. During La Niña years, in contrast, the NEC’s bifurcation migrates to the south and the Kuroshio velocity and volume transport increase (Qiu and Lukas, 1996; Yuan et al., 2001; Kim et al., 2004). Close to the coast of southern Japan, the Kuroshio Current has an annual mean temperature of ~19°C and a salinity of ~35 (Locarnini et al., 2018; Zweng et al., 2019). After separating from the Japanese coast at ~35°N, the Kuroshio Current enters the open basin of the North Pacific and continues as Kuroshio Extension (Qiu, 2002). At Shatsky Rise (~159°E), the Kuroshio Extension bifurcates, where the main body of the Kuroshio Extension continues eastward. A secondary branch, the Kuroshio Bifurcation Front (KBF), extends northwards (Qiu, 2002).
Along the northern boundary of the Kuroshio Extension/Kuroshio Bifurcation Front, numerous meanders and mesoscale eddies occur (Figure 1) due to the dia- and isopycnal mixing between Kuroshio and Oyashio water with vertically different temperature, salinity and velocity structures (Yasuda et al., 1996; Shimizu et al., 2001; Yasuda et al., 2002; Isoguchi et al., 2006; Mitnik et al., 2020). This mixing zone of water originating from the Kuroshio and Oyashio currents is termed the Kuroshio-Oyashio transition zone or mixed water region and is characterized by a pronounced latitudinal sea surface temperature, salinity, and nutrient gradient (Yasuda, 2003; Garcia et al., 2018; Locarnini et al., 2018; Zweng et al., 2019) (Figure 1). The northern end of the transitional zone is marked by the Subarctic Front (SAF) or Oyashio Front, which is defined as the 4°C isotherm at 100 m depth (Favorite, 1976). Subarctic surface water may drift southward across the SAF, and may cover the surface in the transition zone between the SAF and the Subarctic Boundary (SAB). The SAB is a near surface salinity front south of the SAF (Yasuda, 2003). East of 180°W/E the distinction between the Kuroshio Extension and the Subarctic Current is no longer clear and together they form the broad eastward-moving North Pacific Current (Qiu, 2019). It has been suggested, that there is a linkage between the latitudinal displacement of the Kuroshio-Oyashio transition zone and the climatic conditions of the tropical Pacific e.g. long term ENSO-like variability (Yamamoto et al., 2005).
Intermediate water masses (~400-900 m) are dominated by North Pacific Intermediate Water (NPIW) in the Subtropical Gyre and the mixed water region (Talley, 1993), and by Pacific Subpolar Intermediate Water (PSIW) in the subarctic Gyre (Emery, 2001; Fuhr et al., 2021).
2 Material and methods
The 8.35 m long gravity core SO264-45-2 was recovered from Jimmu Seamount at 46°33.792’N and 169°36.072’E from a water depth of 2425 m during R/V SONNE cruise SO264 (SONNE-EMPEROR) in August 2018 (Nürnberg, 2018). Additionally, the sediment surface was sampled with a Multi Corer (MUC: SO264-45-1, core length: 0.15 m; 46°33.795’N and 169°36.072’E). The core site selection was based on a systematic bathymetric survey, as well as sediment echosounder profiling. The upper 4.7 m of the core presented in this study consist of foraminifera-bearing sandy silt to foraminifera-bearing calcareous ooze, in some parts containing IRD (Nürnberg, 2018) and intercalated by five tephra layers of 2-6 cm width (Figure 2).
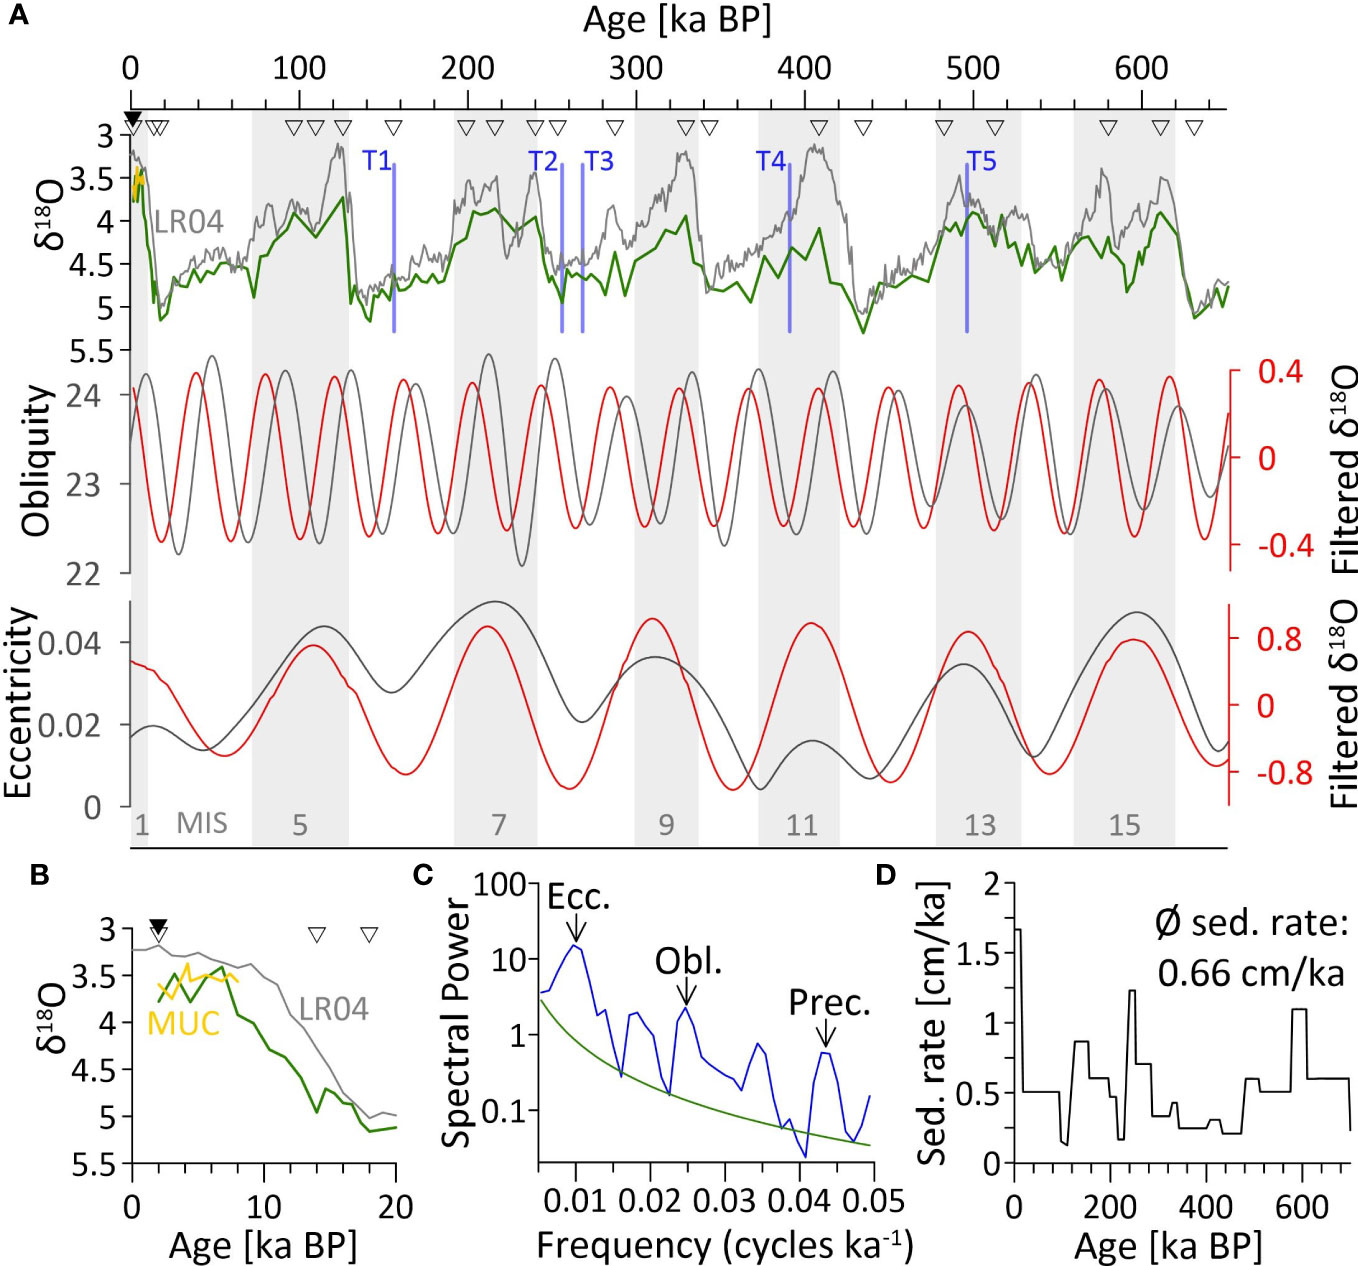
Figure 2 Chronostratigraphy of core SO264-45 from Jimmu Seamount (Emperor Seamount Chain). (A) Top: Benthic d18O stack of core SO264-45 (green line = gravity core; yellow line = multicorer) in comparison to the global benthic LR04 d18O reference stack from Lisiecki and Raymo (2005). White triangles = tie lines used for tuning the core SO264-45 d18O to LR04. Black triangle = AMS14C dating. Bottom: The filtered 41 kyr component of the benthic d18O stack of SO264-45 (red) in comparison to the orbital obliquity. Gray shadings and numbers mark Marine Isotope Stages (MIS 1-17). Tephra layers identified in core SO264-45 are indicated as blue vertical lines. (B) The first 20 ka of A as a close up to better indicate the MUCs d18O in correlation with the gravity core and LR04. (C) The frequency spectrum of the benthic d18O stack (green = 95% significance line) indicates dominant cyclicities of 100, 41 and 23 kyr as a response to cyclic fluctuations in the Earth’s orbital parameters eccentricity, obliquity and precession. (D) Age-depth diagram for core SO264-45; the sedimentation rate is given by the curve’s slope.
2.1 XRF scanning
To determine the sedimentary elemental composition, the archive half of each core segment was scanned using an Avaatech X-ray Fluorescence (XRF) core scanner at the Alfred‐Wegener‐Institute (AWI) Bremerhaven. For preparation, the uppermost sediment layer was removed to provide a fresh and undisturbed surface, which was then covered with SPEXCerti Prep Ultralene foil. Each core segment was triple scanned at a one-centimeter resolution with a current of 0.15, 0.175 and 1 mA, tube voltages of 10, 30, and 50 kV, and acquisition times of 10, 15, and 20 sec, respectively. Element intensities were determined with the proprietory Aavatech WinAxil (Batch) software covering elements from aluminum to barium and are reported as counts per second (cps). As proxy for changes in paleoproductivity we use the barium/titanium ratio (Ba/Ti) (biogenic barium reflecting diatom productivity; e.g. Nürnberg et al., 1997). Based on the assumption that the covariance between aluminum (Al) and Ti content of terrigenous material remained constant in space and time (Galbraith et al., 2007), the XRF-derived barium counts normalized against terrigenous background elements like Al or Ti are well-established paleoproductivity proxies in the North Pacific area (Nürnberg et al., 2004; Jaccard et al., 2010; Korff et al., 2016). Al and Ti are both exclusively of detrital origin and correlate well at our study site (Supplementary Figure 6). Yet the detection of light elements like Al during XRF scanning shows a higher risk to be influenced by water trapped between the sediment and the scanning foil than heavier elements (Tjallingii et al., 2007). Thus, we use Ti for normalizing our Ba record.
Fe has been widely used to document variations in terrigenous sediment delivery and often relates to aeolian dust flux and thus wind strength (Jahn et al., 2003; Nürnberg et al., 2004; Jahn et al., 2005; Mohtadi et al., 2007; Helmke et al., 2008; Kaiser et al., 2008; Lamy et al., 2014; Abell et al., 2021). Therefore, we use the iron (Fe) record derived via XRF scanning as proxy for relative changes in terrigenous Fe input. Because the use of raw intensities or peak integrals of single element counts cannot be interpreted in terms of sediment composition we report our Fe-record as log-values (Weltje et al., 2008). The very good correlation of our Ti and Fe records (R²=0.98) (Supplementary Figure 6) implies that a potential diagenetic imprint on Fe is negligible (Croudace and Rothwell, 2015).
2.2 Foraminiferal geochemistry
For geochemical studies, we use the most abundant planktic foraminiferal species foraminifera Globigerina bulloides (G. bulloides) and Neogloboquadrina pachyderma (N. pachyderma) (sinistral-coiling, Darling et al., 2006). In the Northwest Pacific, G. bulloides is a near-surface dweller and mainly found above the thermocline (Iwasaki et al., 2017; Schiebel et al., 2017; Taylor et al., 2018), which occurs at ~40-50 m at the study site (Locarnini et al., 2018) (Figure 1 and Supplementary Figure 1). In the study region, G. bulloides calcifies throughout the year (Kuroyanagi et al., 2008; Sagawa et al., 2013; Taylor et al., 2018). In the North Pacific, N. pachyderma is mainly found at thermocline depth (Sarnthein et al., 2004; Riethdorf, 2013; Taylor et al., 2018), thus, we assume a depth habitat of 50-130 m for our study site (Locarnini et al., 2018). N. pachyderma is a subpolar species and prefers water temperatures below 7°C (Reynolds and Thunell, 1986), thus in modern settings it mainly occurs from autumn to spring at our study site, which is shown by sediment trap studies from the North Pacific (Kuroyanagi et al., 2008; Sagawa et al., 2013; Taylor et al., 2018). For a detailed discussion about seasonality and habitat depth, see Supplement 1.
2.2.1 Magnesium and calcium element ratios
Mostly, ~50 visually well-preserved specimens of G. bulloides and ~120 of N. pachyderma were selected from core SO264-45-2 at 2 cm sample spacing. Due to insufficient sample material in most of the samples, specimens were selected from a rather wide size range (G. bulloides: 250 – 400 µm; N. pachyderma: 125-315 µm; potential side effects on Mg/Ca ratios are discussed in the Supplement 1). Tests were gently crushed between cleaned glass plates to open the test chambers for efficient cleaning. Chamber fillings e.g. sediment or pyrite particles were removed. The fragmented and homogenized samples were divided into one-third for stable isotope analyses and two-thirds for trace element measurements.
Cleaning of foraminiferal fragments prior to trace element analyses followed the procedures of Boyle and Keigwin (1985) and Boyle and Rosenthal (1996). These include oxidative and reductive (with hydrazine) cleaning steps to e.g. remove oxide-rich coatings which may influence the Mg/Ca values (see Supplement 3). Samples were measured at GEOMAR - Helmholtz Centre for Ocean Research, on a VARIAN 720 ES axial ICP-OES coupled with a VARIAN SPS3 sample preparation system. The measurement strategy included regular analyses of standards and blanks to ensure analytical quality control. The data was drift-corrected and standardized to the internal consistency standard BCS-DRM 393 (ECRM 752-1) with an Mg/Ca reference value of 3.761 mmol/mol (Greaves et al., 2008). The long-term external reproducibility for the ECRM standard for Mg/Ca is ± 0.1 mmol/mol (2σ).
To monitor contamination and insufficient removal of siliciclastic material during the cleaning procedure, Al/Ca, Mn/Ca and Fe/Ca ratios were measured alongside the Mg/Ca. By assessing this data, we could not find any evidence of an influence of contamination on our Mg/Ca ratios. A detailed discussion can be found in the supporting information (Supplement 3). In addition, statistical Mg/Ca outliers were identified by applying the 1.5 interquartile method after Tukey (1977) (Supplement 3) and the two identified samples were remeasured.
2.2.2 Stable oxygen isotopes
In addition to the planktic foraminiferal species (G. bulloides: 250 – 400 µm; N. pachyderma: 125-315 µm), 3-5 tests of the benthic foraminiferal species Uvigerina spp. and Cibicidoides wuellerstorfi were selected from the size fraction 315-400 µm for oxygen isotope measurements. Planktic and benthic specimen were measured on a Thermo Fischer Scientific MAT 253 mass spectrometer equipped with an automated Kiel IV carbonate preparation device. Isotope values were calibrated to NBS‐19 (National Bureau of Standards) and reported relative to the Vienna Pee Dee Belemnite (VPDB) standard. The long‐term external reproducibility (n =<3,000) was monitored by the in-house Bremen standard (Solnhofen Limestone) with an analytic precision of 0.06 ‰ for δ18O. Applying the 1.5 interquartile method after Tukey (1977) the δ18O records of both the planktic and benthic foraminifera were checked for outliers (Supplement 3).
In order to combine the δ18O-values of both benthic species, we follow the conventional assumption that Uvigerina spp. calcifies in equilibrium with surrounding seawater δ18O (Shackleton, 1974; Shackleton and Hall, 1984; Labeyrie et al., 1999; Fontanier et al., 2006) and that C. wuellerstorfi deviates by ~0.64 ‰ from Uvigerina values (Shackleton and Opdyke, 1973; Labeyrie et al., 1999; Waddell et al., 2009). We hence corrected δ18OC. wuellerstorfi by adding 0.64 ‰.
2.3 Upper ocean temperature and ice volume corrected δ18O seawater assessment based on foraminiferal Mg/Ca and δ18O
For converting Mg/Ca of foraminiferal calcite into water temperature we used well-established species-specific equations from Elderfield and Ganssen (2000) for G. bulloides (Mg/Ca=0.56e(0.10*T)) and from Kozdon et al. (2009) for N. pachyderma (Mg/Ca=0.13*T+0.35) (Supplement 2). The temperature derived from G. bulloides is referred to as annual sea surface temperature (SSTMg/Ca: ~20-60 m) and the temperature from N. pachyderma as subsurface temperature (subSSTMg/Ca: ~50-130 m). Late Holocene temperatures of both species match the modern annual mean temperatures in the defined depth habitats (Locarnini et al., 2018; Supplementary Figure 1). For our interpretations, we assume that the foraminiferal species did not significantly change their habitat depth over time.
We are aware that changes in pH and salinity of the surrounding seawater, calcite dissolution and diagenetic effects can influence foraminiferal Mg/Ca, and hence the reconstructed absolute temperature values. Yet, we assume that these effects are either neglectable for our interpretation or lie within the assigned error range. A detailed discussion can be found in the Supplement 2–4.
Via the combined δ18O and Mg/Ca measurement of the foraminiferal calcite, we calculate the δ18O of seawater (δ18Osw) by removing the temperature effect from the initial foraminiferal δ18O signal. For G. bulloides we use the equation from Shackleton (1974) (T=16.9-4.38*(δ18Ocalcite-δ18Osw)+0.1*(δ18Ocalcite-δ18Osw)²) and for N. pachyderma the species-specific equation from Mulitza et al. (2003) (T=3.55*(δ18Ocalcite-δ18Osw)+12.69). The δ18Osw data is further corrected for changes in global ice volume (δ18Osw-ivc reported in ‰ versus SMOW; ivc = ice-volume corrected) by using a data set from De Boer et al. (2014). This was calculated based on the global LR04 stack (Lisiecki and Raymo, 2005) and simulations of continental ice sheets (De Boer et al., 2014). Modern δ18Osw is positively correlated to salinity (e.g. δ18Osw = 0.44*S-15.13; LeGrande and Schmidt, 2006), yet previous studies have shown that this relationship can vary over time e.g. through changes in regional freshwater budgets, ocean circulation, and sea ice regimes (Caley and Roche, 2015; Holloway et al., 2016). Therefore, we refrain from converting the calculated δ18Osw-ivc into absolute salinity units. However, we interpret high values in terms of relative high saline conditions and low values in terms of relative freshening. We present δ18Osw-ivc as relative changes deviating from the calculated modern value.
2.4 Chronostratigraphy
Accelerated mass spectrometer radiocarbon (AMS14C) dating provides an age estimation for the sediment surface (0–1 cm) from station SO264-45-1 (MUC). We chose the undisturbed surface sample of the MUC for this measurement, because the surface of gravity cores is often disturbed during core recovery. Approximately 90 µg C of the planktic species G. bulloides and the benthic species Uvigerina peregrina were measured at the MICADAS (Mini Carbon Dating System) facility at the AWI in Bremerhaven, Germany (AWI sample nr. 3976.1.1 and 3976.2.1). The raw 14C age was converted into calendar age, using the Calib8.20 software (Stuiver et al., 2020) along with the marine calibration dataset MARINE20 (Heaton et al., 2020) and a regional reservoir age correction of ΔR = 273 +- 70 years. In this case, ΔR is the mean reservoir age of six sites from the North Pacific published by Kuzmin et al. (2001; 2007) and Yoneda et al. (2007). The generated AMS14C age range (2 sigma) for U. peregrina is 263-745 years BP and 1871-1301 years BP for G. bulloides. This age difference lies within the age range for one sample (~1500 years/sample) as discussed below.
As benthic foraminiferal δ18O values from the MUC SO264-45-1 fit rather well to those of the uppermost centimeters of the gravity core SO264-45-2 (Figure 2), it is likely that both have similar surface ages. Thus, based on the 14C ages from the MUC’s surface we assume that the gravity core top sediments are of late Holocene age.
The stacked benthic δ18O isotope record of SO264-45-2 was visually correlated to the global benthic isotope stack LR04 (Lisiecki and Raymo, 2005) by using QAnalySeries v1.5.0 (Kotov et al., 2018). Our benthic record shows smaller amplitudes than LR04, which is most likely caused by low sedimentation rates, which mute extreme values. By applying 21 tie lines and linear interpolation between the tie lines, a correlation coefficient of r = 0.82 was achieved. Further support for the age model is provided by the spectral analysis of the benthic δ18O stack that reveals dominant cyclicities with a frequency of 0.01 and 0.025 as a response to the cyclic fluctuations in the Earth’s orbital parameters eccentricity and obliquity (Figure 2). The spectral analysis reveals that all obliquity cycles of the past 650 ka are reflected in our benthic δ18O stack. The calculated sedimentation rates are rather low with an average of 0.66 cm/ka for the discussed interval, thus one sample of 1 cm width reflects on average ~1500 years. Yet due to the observed bioturbation of the sediment (Nürnberg, 2018), the absolute age range of foraminifera in one sample might even be higher.
The ages of five tephra layers mentioned in the core description (Nürnberg, 2018) are shown in Figure 2. We assume that T4 might be the prominent Pauzhetka ash found in several records from the Northwest Pacific and Okhotsk Sea and dated to 421.2 ± 6.6 ka BP (Ponomareva et al., 2018). Yet according to our age model, the depth of T4 refers to an age of ~390 ka BP, which is likely within the range of dating uncertainty.
3 Results
3.1 Reconstruction (sub)SSTMg/Ca and δ18Osw-ivc
Over the last ~650 ka BP, δ18O values of G. bulloides fluctuate between 1.5 and 4 ‰, and those of N. pachyderma between 2.4 and 3.8 ‰ (Figure 3). With only few exceptions in MIS 6-8 the δ18O of N. pachyderma are consistently heavier than those of G. bulloides. The δ18O fluctuations of both species follow the glacial-interglacial pattern of the LR04 reference record (Lisiecki and Raymo, 2005) with heavy δ18O values during glacials and light δ18O values during interglacials (Figure 3). In MIS 11, however, G. bulloides shows lighter δ18O values than in the adjacent interglacials. In MIS 7, the δ18O are not light throughout the entire interglacial, yet decrease steadily. δ18O of G. bulloides is lightest in MIS 15 and 13 compared to the other interglacials in our record, while the δ18O of LR04 is heavier in MIS 15 and 13 compared to the other interglacials.
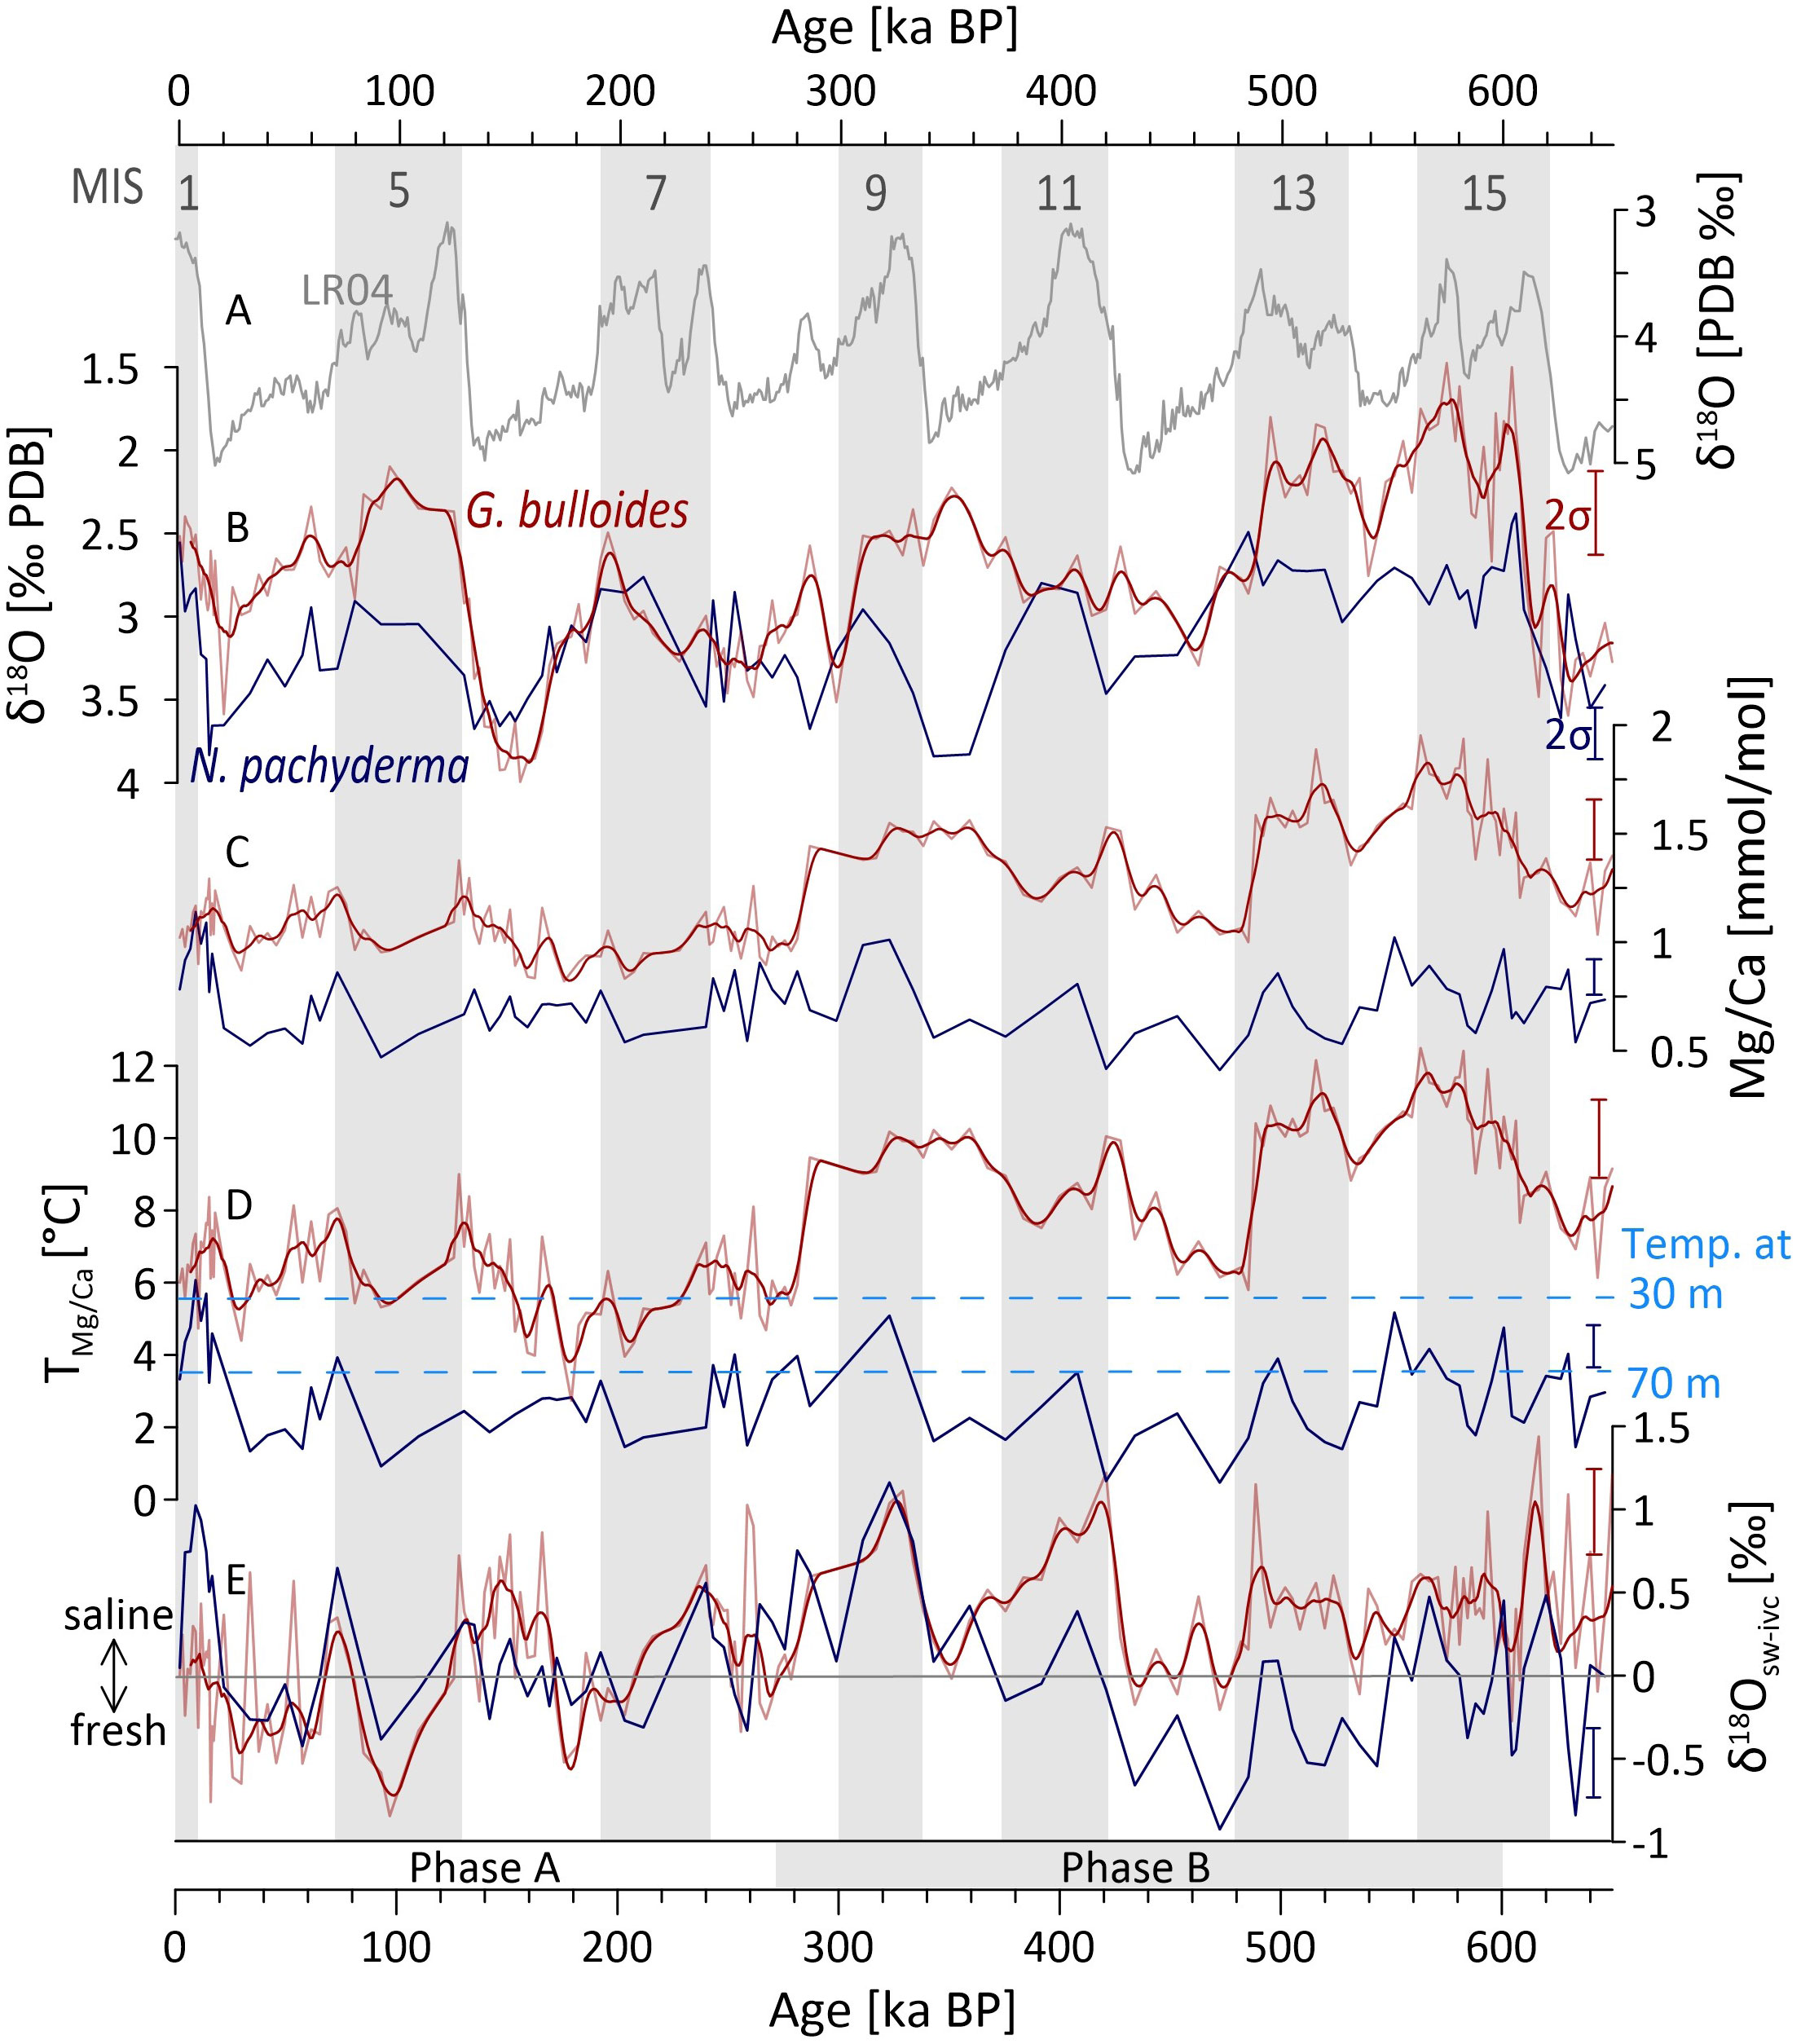
Figure 3 Foraminiferal sea surface (red = G. bulloides, all data (thin line) overlain by a 10 ka unweighted smooth (thick line)) and sub sea surface (dark blue = N. pachyderma) proxy data of core SO264-45 versus age. (A) global benthic LR04 d18O climate record (Lisiecki and Raymo, 2005) for reference. (B) foraminiferal d18O; (C) foraminiferal Mg/Ca; (D) reconstructed sea surface (SSTMg/Ca) and subsurface (subSSTMg/Ca) temperatures; dashed blue lines = modern annual mean water temperatures at the defined living depths of G. bulloides (~30 m) and N. pachyderma (~70 m) (Locarnini et al., 2018). (E) Relative changes in Ice-volume corrected d18Osw deviating from the calculated modern value (gray line). Gray shadings and numbers mark Marine Isotope Stages (MIS 1-17). Error bars mark the 95% standard deviation (2s). Phase A (0-270 ka) and B (270-600 ka) are indicated by gray boxes.
Mg/Ca ratios from G. bulloides vary between 0.82 and 2 mmol/mol, which leads to SSTMg/Ca estimates between 3.8 and 12.7°C. The SSTMg/Ca development of G. bulloides can be divided into two phases (Figures 3, 4). Between ~600 and 280 ka BP (phase B), the surface ocean temporally reached SSTMg/Ca of up to ~12°C (with a mean of 8.7°C), thereby being up to ~6.5°C warmer than modern annual mean SST at 30 m (Figure 3). Within this time interval, the SSTMg/Ca broadly follow glacial-interglacial cycles except for MIS 10, during which the SSTMg/Ca is high (~10°C) throughout the glacial and MIS 11, where temperatures are ~2°C lower than in the adjacent glacials. In contrast to the cold MIS 16 (min ~ 7°C), MIS 14 remains rather warm with minimum temperatures of ~9.5°C. At 480 ka BP, the SSTMg/Ca abruptly decreases by ~4°C (calculated as the temperature difference between three data points prior and after the decrease; the decrease itself occurs between two data points) coming close to the modern-day SST value (Figure 3). This decrease is followed by an overall increasing SSTMg/Ca trend for the next 200 kyrs. Phase B ends at ~ 280 ka BP after a second abrupt SSTMg/Ca decrease of ~3.5°C (calculated as the temperature difference between three data points prior and after the decrease; the decrease itself occurs between two data points). From here on (phase A) the SSTMg/Ca remain rather low with an average of ~ 6.1°C and show only minor variations (max ±2°C) around the modern annual mean temperature at 30 m of ~5.5°C (Locarnini et al., 2018). The warmest SSTMg/Ca occur at the beginning and end of MIS 5 and in MIS 2, while in the middle of MIS 7 and 6 the SSTMg/Ca are coldest.
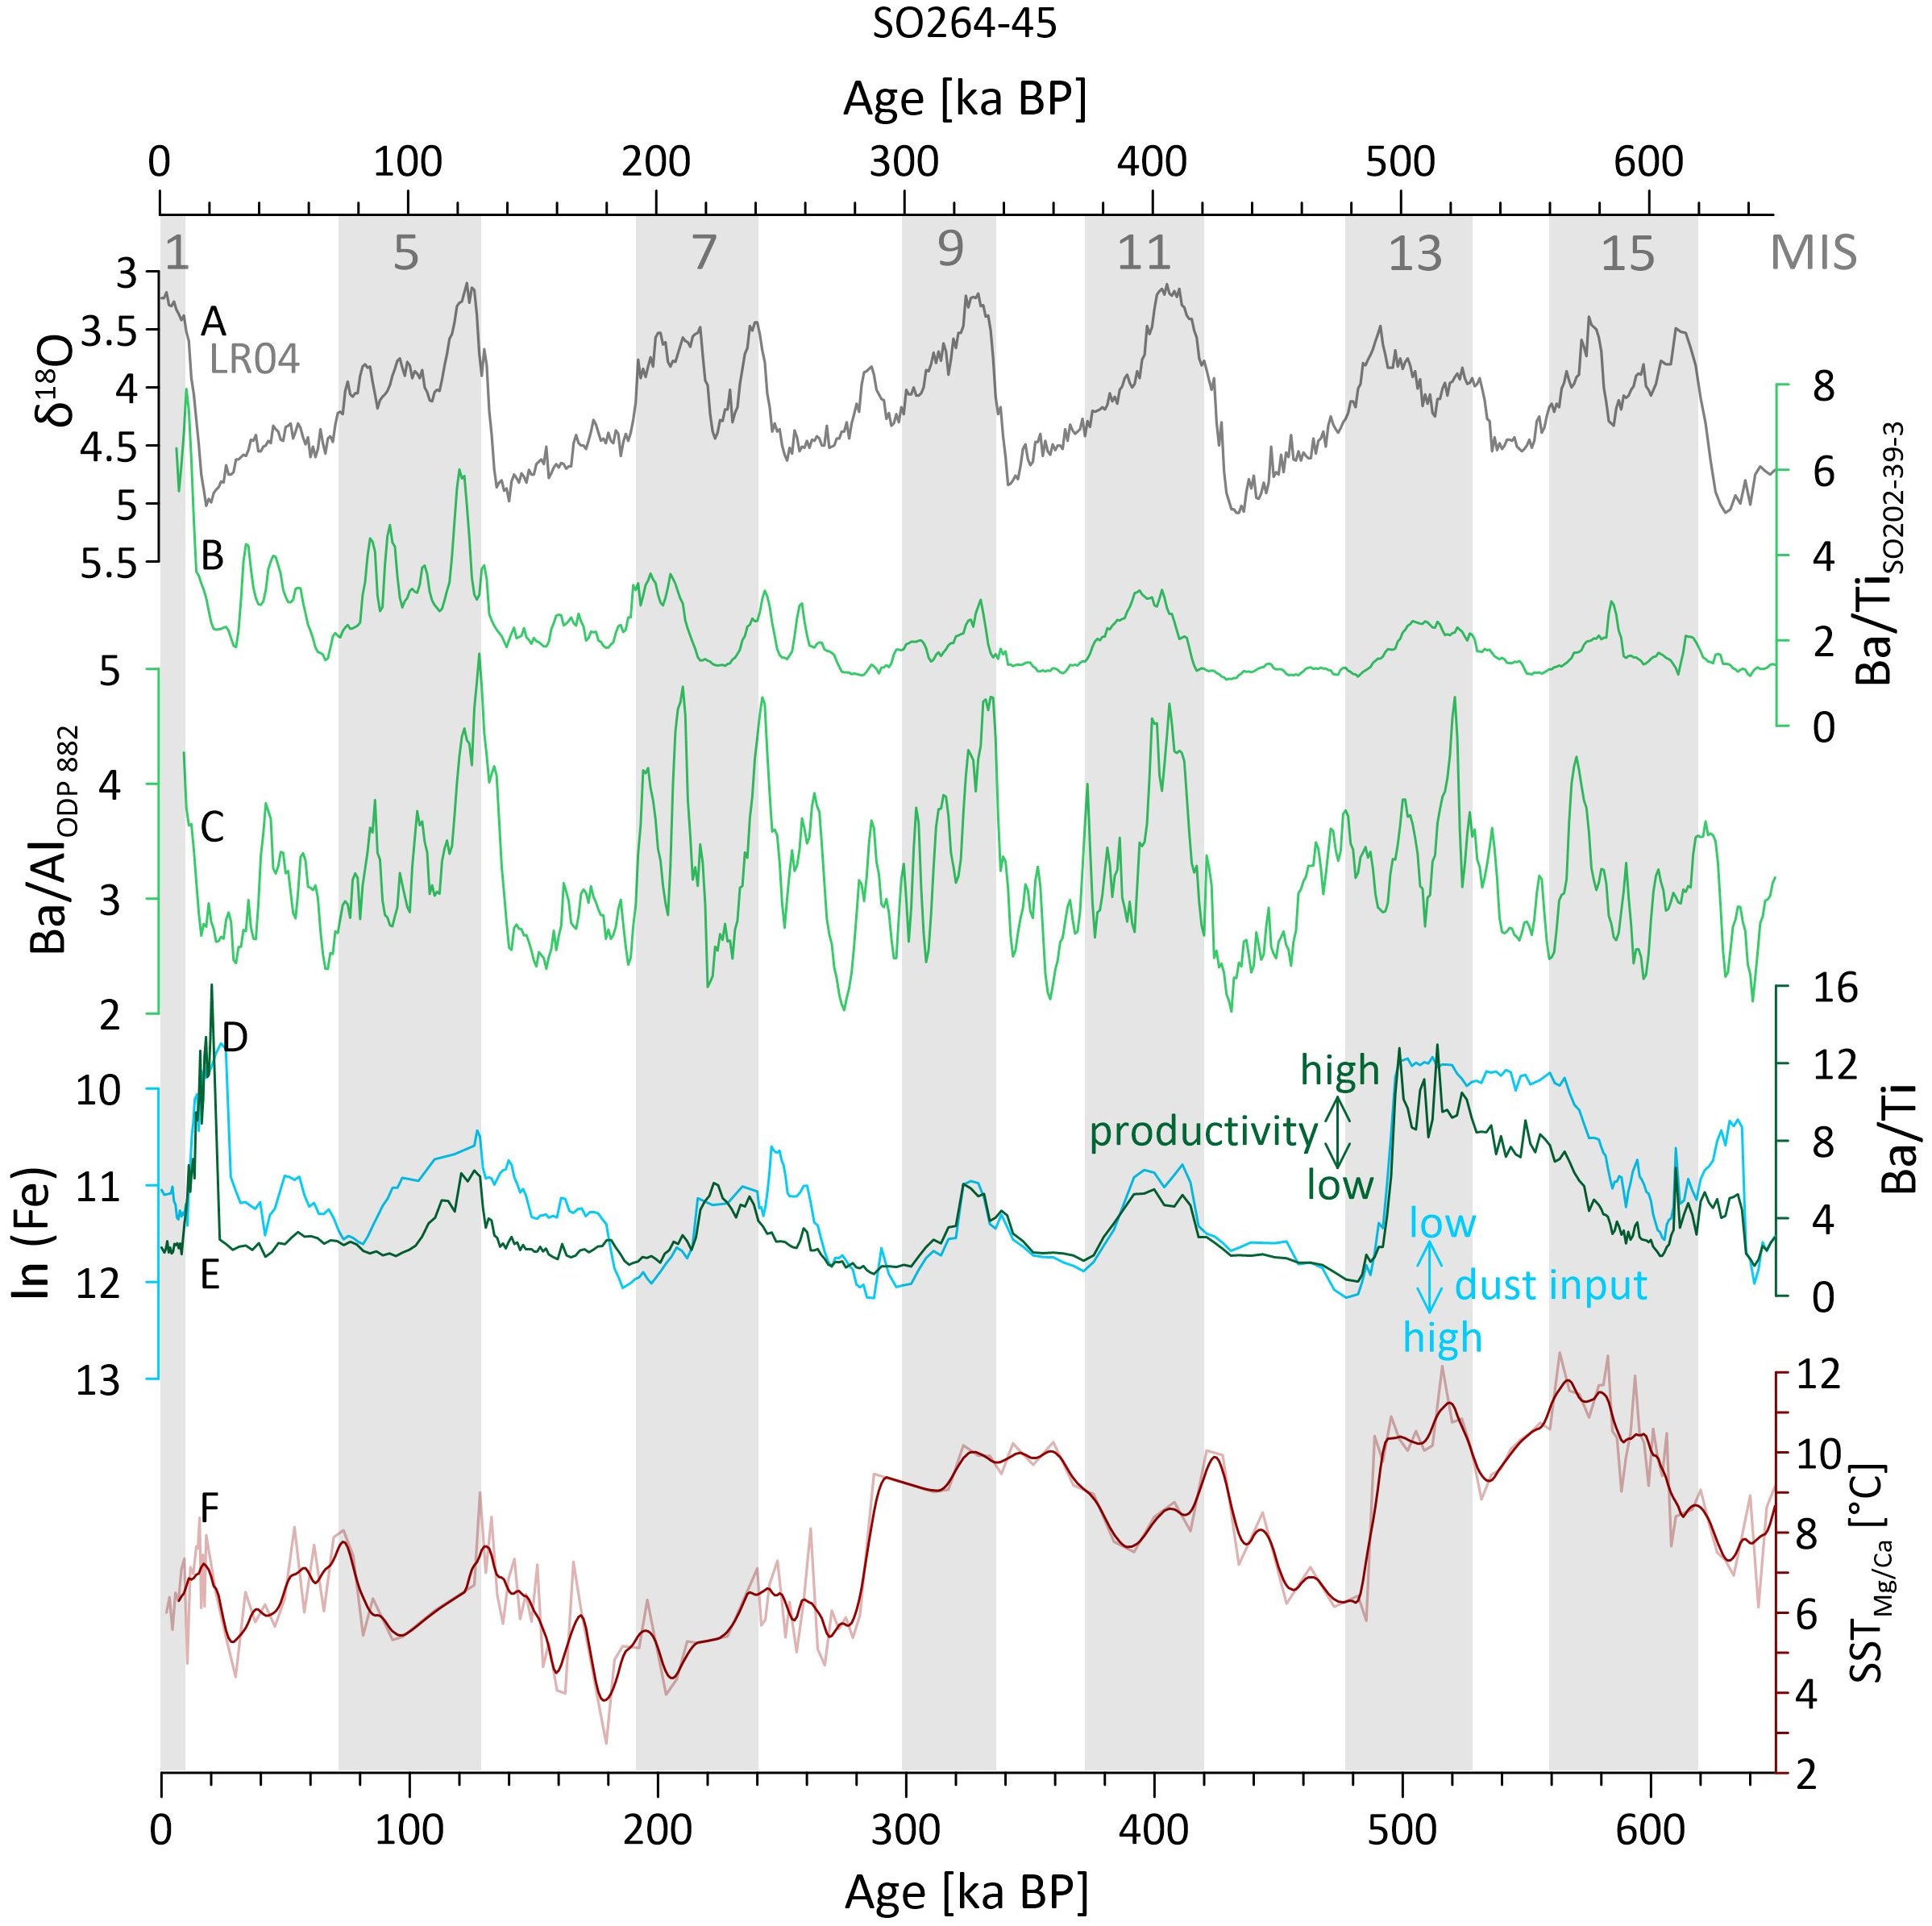
Figure 4 Marine productivity and eolian flux in comparison to the SSTMg/Ca development: (A) LR04 d18O benthic isotope stack from Lisiecki and Raymo (2005). (B–D) XRF-based productivity records from the North Pacific; high Ba/Al and Ba/Ti values point to a high marine productivity. (B) Ba/Ti record of SO202-39-3 (Korff et al., 2016). (C) Ba/Al record of ODP 882 (Jaccard et al., 2010). (D) Ba/Ti record SO264-45 (this study). (E) XRF-based normalized Fe record as indicator for eolian dust supply to core SO264-45 (this study); note the descending y-axis. (F) SSTMg/Ca record SO264-45 (thin line = raw data; thick line = 10 ka unweighted smooth). Gray shadings and numbers mark Marine Isotope Stages (MIS1-17).
N. pachyderma shows consistently lower Mg/Ca ratios than G. bulloides, which vary between 0.41 and 1.14 mmol/mol with subSSTMg/Ca estimates between 0.5 and 6.1°C (Figure 3). Throughout the entire record, the subSSTMg/Ca show amplitude variations of ±3°C around an average of ~2.9°C. This average matches the modern annual temperature at thermocline depth of ~3°C (Locarnini et al., 2018). The highest subSSTMg/Ca of up to ~6°C is reached at the transition to the Holocene and the lowest with ~0.5°C during MIS 12. In contrast to the SSTMg/Ca the subSSTMg/Ca do not show a shift towards warmer temperatures prior to 280 ka BP, yet rather cold subsurface conditions between MIS 13 and MIS 10. From MIS 5 to MIS 1 subSSTMg/Ca and SSTMg/Ca follow a similar low-amplitude pattern.
The δ18Osw-ivc records reveal a different pattern than the SSTMg/Ca and subSSTMg/Ca records (Figure 3). Both, the seasurface and subsurface δ18Osw-ivc records have rather similar amplitudes and fluctuations. Between ~650 and 350 ka BP G. bulloides shows constantly higher δ18Osw-ivc values than N. pachyderma. Between 0 and ~350 ka BP, however, both records lie within error range of each other and alternately show higher values. Prior to 280 ka BP the δ18Osw-ivc records of both species tend to be higher in interglacials and lower in glacials.
3.2 Productivity and terrigenous input
The XRF-based Ba/Ti record and thus the reflection of marine productivity shows a clear glacial-interglacial cyclicity. Ba/Ti values start to increase during the deglaciations and reach their maxima during the early interglacials (Figure 4). During the late interglacials and the subsequent early glacials low Ba/Ti values predominate. This pattern even holds for the period MIS 15-14, although the Ba/Ti ratios remain on an exceptionally high level during glacial MIS 14, which even exceeds typical deglacial to early interglacial values. The deglaciation towards MIS 13 is again characterized by a continuous increase in Ba/Ti. In the late interglacial MIS 13 (~500-480 ka BP), we observe a rapid and significant decrease in Ba/Ti to typical glacial values, synchronous to significant changes in Fe and SSTMg/Ca (Figure 4).
The XRF-based normalized log Fe record, which is used as a proxy for terrigenous input commonly increases at the transitions from late interglacials to early glacials and decreases during the glacials. Prior to MIS 12, no distinct glacial-interglacial pattern is recognizable. Between ~560 and ~500 ka BP, Fe values are exceptionally low, which is followed by a sudden increase from ~500-480 ka BP (Figure 4). Ba/Ti and Fe appear to be anticorrelated with low Fe values in times of high Ba/Ti and vice versa. Thus, between MIS 13 and 5 Ba/Ti maxima occur on average ~30 ka earlier than Fe maxima.
4 Discussion
4.1 Influence of changes in the Kuroshio/Oyashio current system on upper ocean temperatures at Jimmu Seamount
At the study site, glacial-interglacial changes are well documented in the benthic and planktic δ18O records of all species with high δ18O values during glacials and low δ18O values during interglacials. This indicates that climate variations did have an effect on both the upper and deep ocean. Yet in our SSTMg/Ca and subSSTMg/Ca records changes between glacial and interglacial periods are neither particularly dominant nor continuously reflected. Thus, the observed temperature variations and especially the mode shift between phases A and B, recorded in the SSTMg/Ca record must have been caused by different forcing mechanisms. A shift from higher SSTMg/Ca prior to 280 ka BP to colder SSTMg/Ca in more recent times, as reflected in our proxy data, does occur in few records from certain areas in the North Pacific (cf. 4.1.1) but it is neither a global phenomenon nor significant in the entire Pacific region (Morley and Heusser, 1997; Herbert et al., 2001; Lang and Wolff, 2011; Bordiga et al., 2013). Thus, our observed SSTMg/Ca shift cannot be explained by a general cooling of the (North) Pacific climate after 280 ka BP yet must be linked to changes in local hydrography, most likely the complex interplay of the Kuroshio and Oyashio Current.
4.1.1 Influences of changes in the tropical Pacific on the study region
Today the volume transport of the Kuroshio Current is linked to ENSO and the induced changes of the location of the NEC’s bifurcation point (cf. 1.1). This way the Kuroshio velocity and volume transport is increased during La Niña years and reduced during El Niño years (Qiu and Lukas, 1996; Yuan et al., 2001; Kim et al., 2004). It is likely that such changes do not only appear on decadal timescales, but also over longer time periods. This is indicated by a study from the Ryukyu Arc region (north of the NECs bifurcation point) based on planktic foraminiferal assemblages. It shows that during the last 21 ka BP lower rates of surface transport in the Kuroshio Current occurred when more El Niño-like conditions prevailed in the Equatorial Pacific (Ujiié et al., 2003). Assuming that these mechanisms did not significantly change over the past 650 ka BP, they would also have affected the upper ocean dynamic at our study site.
To test this hypothesis, we compare our SSTMg/Ca record to proxy records from de Garidel-Thoron et al. (2005) and Jia et al. (2018) (Figure 5). Both studies reconstructed mean states of more La Niña-like and more El Niño-like conditions in the WPWP on millennial timescales. de Garidel-Thoron et al. (2005) used records from the WPWP (MD97-2140: SSTs generated via Mg/Ca from planktic foraminifera) and the EEP (ODP846: SSTs generated from alkenones) to calculate the temperature difference between the WPWP and the EEP (ΔTWPWP-EEP). Jia et al. (2018) calculated the ΔTWPWP-EEP by using four Mg/Ca-based SST records from the WPWP as well as three SST records from the EEP generated from Mg/Ca and . The records from Jia et al. (2018) and de Garidel-Thoron et al. (2005) are not entirely concordant (Figure 5). This is likely a result of different seasonality of the proxies, regional differences, local influences on the temperature development besides ENSO, which reflects the highly dynamic development of the WPWP and EEP, and uncertainties in age models. Yet, the general trends of both records are rather similar and thus, reliably reflect major changes of ENSO dynamics on long time scales. By comparing our SSTMg/Ca record to these paleo-ENSO records, we focus on the long-term development and identify threshold-like events.
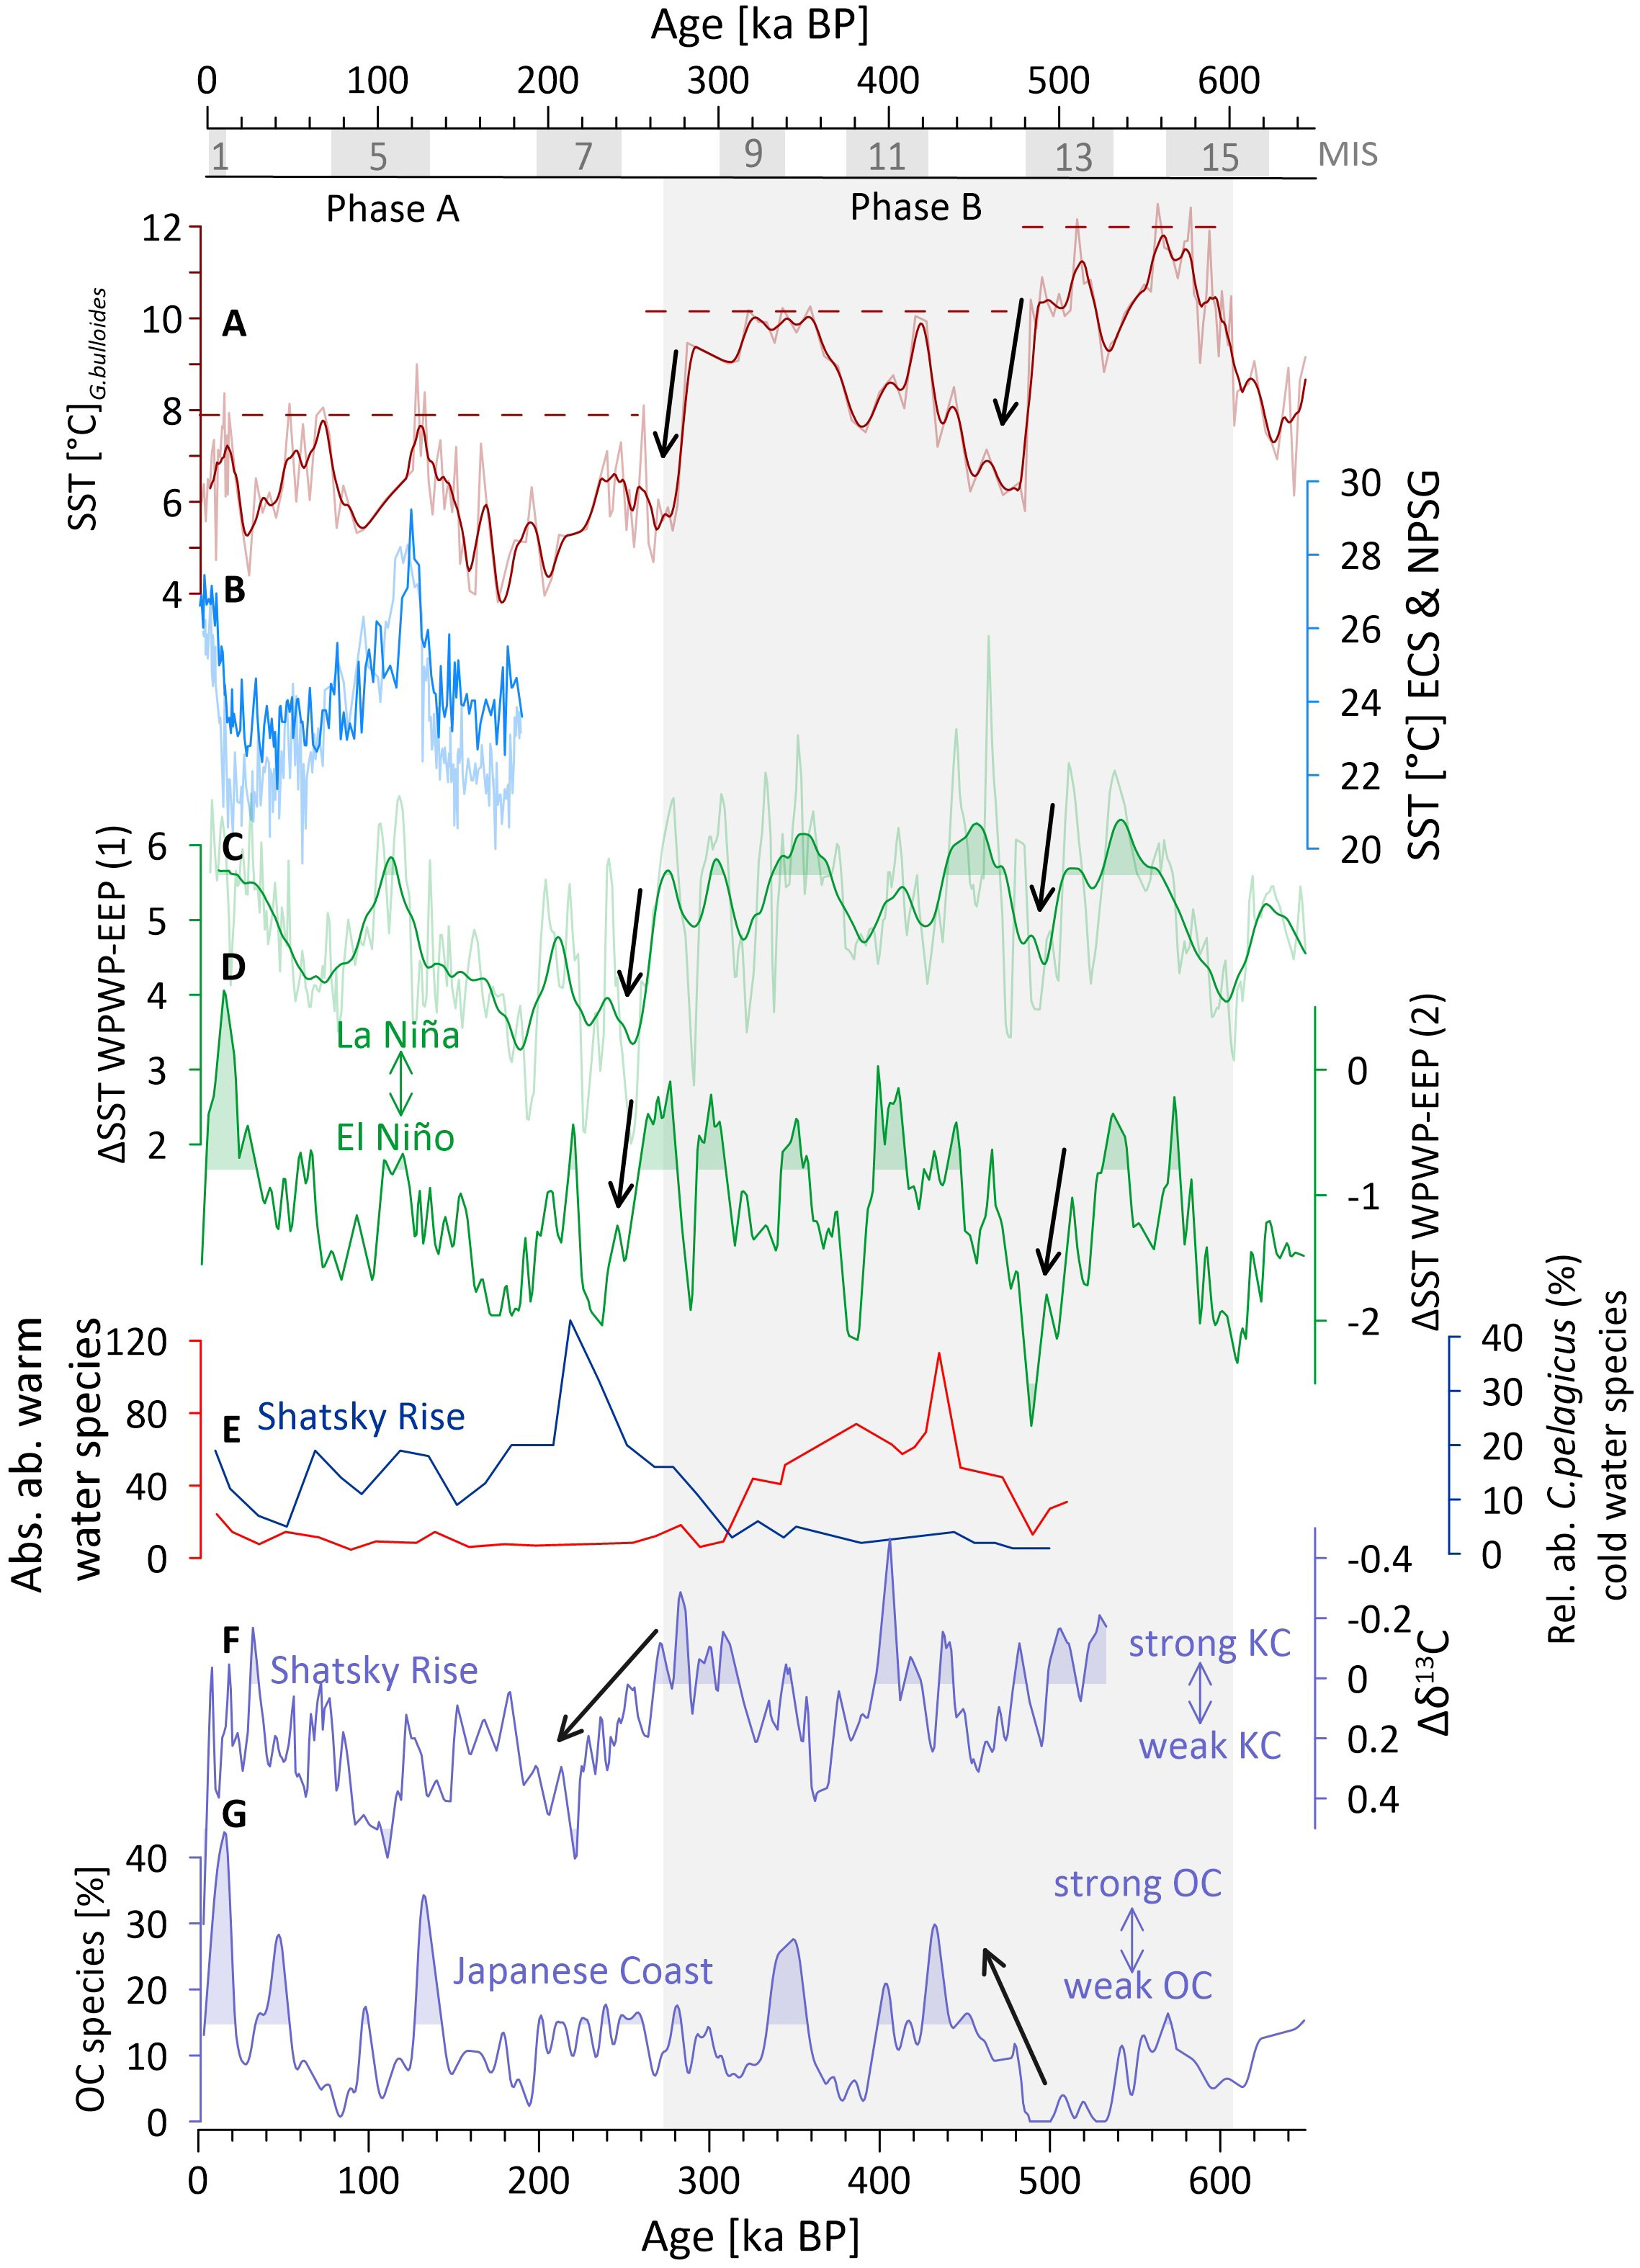
Figure 5 ENSO effect on the N Pacific oceanography. (A) SSTMg/Ca record (thin line = raw data overlain by a 10 ka unweighted smooth (thick line) at core location SO264-45. Maximum SSTMg/Ca divided into different time periods are marked as dotted lines. (B) Mg/Ca based SST from the East China Sea (ECS; light blue) and the North Pacific Subtropical Gyre (NPSG; dark blue) (Ujiié et al., 2016). (C, D) Proxy records of ENSO variability from de Garidel-Thoron et al. (2005); thin green line = complete record overlain by a 10 ka unweighted smooth = thick green line; (B) and Jia et al. (2018; green; C). High DSSTWPWP-EEP values point to more La Niña-like conditions in the tropical W Pacific. (E) Relative abundance of cold water species (blue) and absolute abundances of warm water species (red) reflecting a significant change in Kuroshio influence at Shatsky Rise (Chiyonobu et al., 2012). (F) d13C gradient between shallow- and deepdwelling planktonic foraminifera revealing Kuroshio Current strength variations at Shatsky Rise (Yamane, 2003). (G) Oyashio Current strength off the Japanese coast approximated from the abundance of radiolarian fauna typical for the OC (Matsuzaki et al., 2014). Curve fillings (B, C, E, F) mark the upper 25% of the data. Phase A and B denote two phases of different ocean settings characterized by a mode shift between a phase of extreme La Niña-like conditions (~240-650 ka) to a phase of less strong La Niña-like and more El Niño-like like conditions (~260 ka - present). Marine Isotope Stages (MIS1-17) are marked. Black arrows mark prominent transitions between phases. Phase A (0-270 ka) and B (270-600 ka) are indicated by gray boxes.
In phase B (~650-280 ka BP) we observe up to 6.5°C higher SSTMg/Ca than modern values. During this phase, the records from Jia et al. (2018) and de Garidel-Thoron et al. (2005) show several intervals of very large temperature gradients between the WPWP and the EEP pointing to prevailing La Niña-like conditions (Figure 5). From MIS 16 to MIS 15 we observe a strong increase of SSTMg/Ca from ~7.5 to >11°C, while both ENSO records indicate a shift from El Niño-like to ‘extreme’ La Niña-like conditions. This coherent shift to higher SSTs and predominant La Niña-like conditions implies an increased Kuroshio Current and thus a northward shift of the SAF through the increased amount of Kuroshio water in the Kuroshio-Oyashio transition zone. Compared to the modern SST distribution, we hypothesize that the SAF shifted at least 5° latitude northwards, so that it reached a position north of our study site (Figures 1, 6). This way surface water from the mixed water region would have reached the study site, thereby causing SSTs that were significantly higher than during times where the SAF is located south of the study site and the surface water is dominated by water from the Subarctic Current (Figures 1, 6).
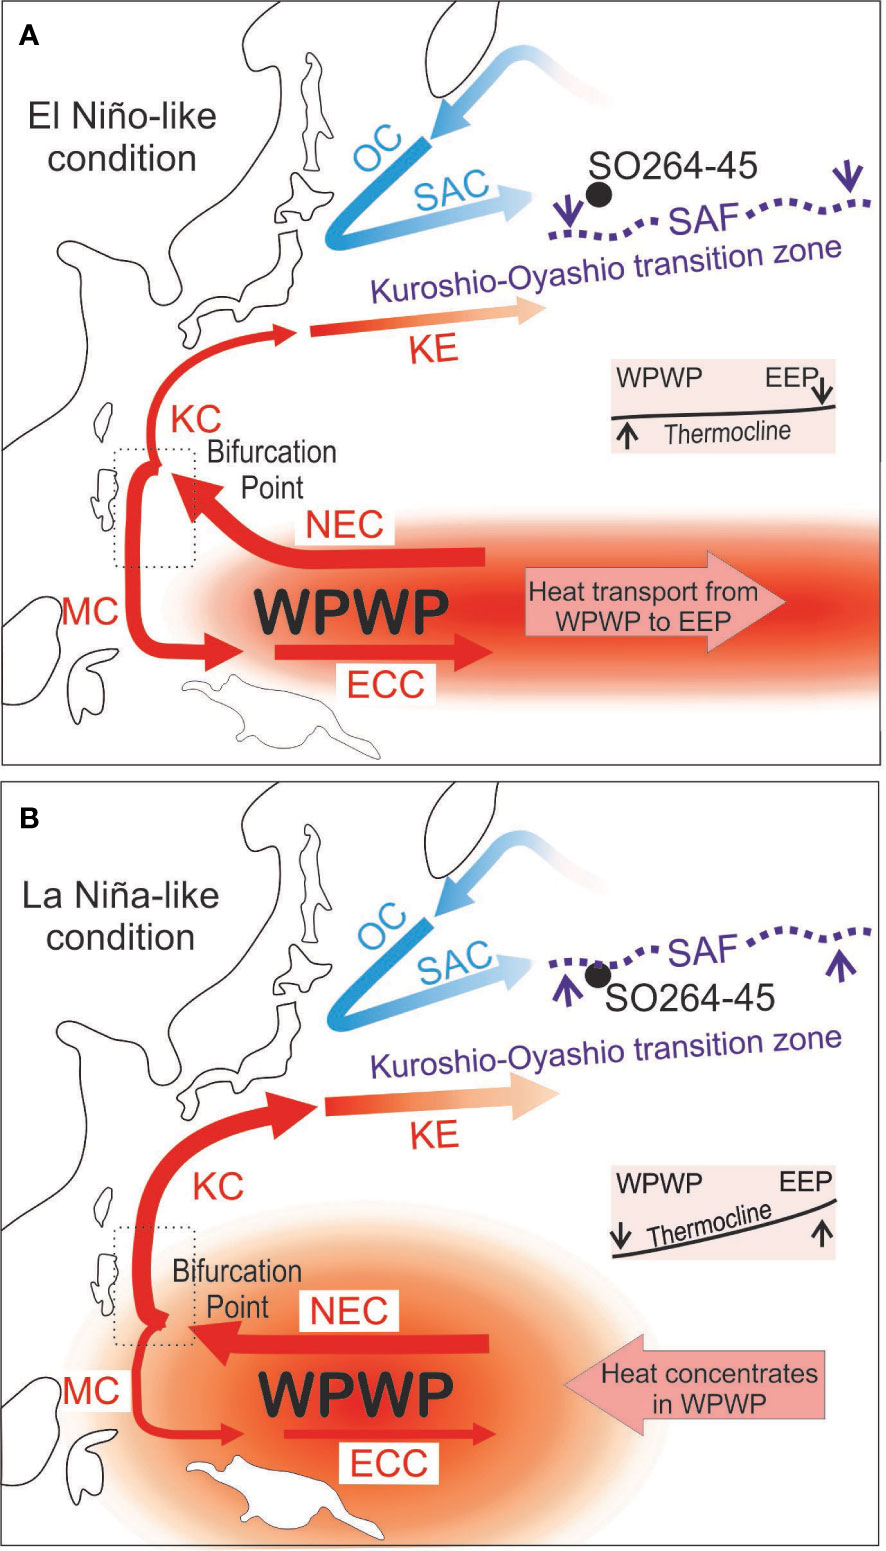
Figure 6 Schematic scenarios to explain the SST development and SAF positioning in the study region in terms of more La Niña-like (B) and more El Niño-like (A) climate conditions. The heat distribution and flux between the Western Pacific Warm Pool (WPWP) and the Eastern equatorial Pacific (EEP) are indicated by arrows and color shading in. Thicker (thinner) arrows indicate stronger (weaker) currents. ECC, Equatorial Counter Current; KC, Kuroshio Current; KE, Kuroshio Extension; MC, Mindanao Current; NEC, North Equatorial Current; OC, Oyashio Current; SAC, Subarctic Current; SAF, Subarctic Front. Gray boxes display thermocline variations in the tropical region.
At ~480 ka BP we observe an abrupt SSTMg/Ca decrease of ~4°C, which is accompanied by an abrupt and pronounced change from very strong La Niña-like to the strongest El Niño-like phase in the record from Jia et al. (2018). This change is also reflected in the record from de Garidel-Thoron et al. (2005) yet less pronounced (Figure 5). This change has most likely reduced the volume and velocity transport of the Kuroshio Current so immensely that it induced the southward displacement of the SAF to a position south of our study site (Figure 6). Between ~470-440 ka BP both tropical ENSO records show a further increase of ΔTWPWP-EEP and thus La Niña-like conditions (Figure 5). Similar to before, this change likely increased the Kuroshio Current’s volume and velocity transport and thus, caused another significant northward shift of the SAF. From here until ~280 ka BP La Niña-like conditions prevailed, particularly reflected in the record from de Garidel-Thoron et al. (2005). Minor decreases of the ΔTWPWP-EEP between ~600-480 ka BP and ~440-280 ka BP do not seem to have had major impact on the Kuroshio Current strength to induce a shift of the SAF to a position south of the study site. We hypothesize that there might be a tipping point in Kuroshio Current strength that needs to be reached in order to induce a shift of the SAF to a position north of the study site.
At ~280 ka BP we observe a second abrupt SSTMg/Ca decline by ~3.5°C (Figure 5), while the ENSO records from de Garidel-Thoron et al. (2005) and Jia et al. (2018) indicate a change from extreme La Niña-like to more El Niño-like conditions. Thus, we assume that there was another southward displacement of the SAF to a position south of our study site. From here on (phase A: 280-0 ka BP) the SSTMg/Ca is on average 3.6°C lower than in phase B and shows minor variations (~ ± 2°C) around the modern annual mean seasurface temperature (~5.5°C at ~30 m) (Figure 5). During this period both ENSO records indicate that El Niño-like conditions prevailed in the tropical Pacific, with almost no strong La Niña-like phases (except for ~20-5 ka BP in the Jia et al. (2018) record. Variations between El Niño-like and La Niña-like conditions within phase A are not corresponding to SSTMg/Ca changes, which further implies that tropical surface water entering the Kuroshio-Oyashio transition zone via the Kuroshio Current/Kuroshio Extension did no longer have an influence on the SSTMg/Ca development at the study site. The SAF likely remained south of the study site between 280-0 ka BP.
The assumption of the intensification and northward migration of the Kuroshio Current/Extension in times of more La Niña-like conditions in the tropics is supported by a study from Shatsky Rise (Yamane, 2003; core S-2; Figure 1). Shatsky Rise is located ~13° south of our core location, were the surface water is dominated by the Kuroshio Current. Yamane (2003) compared δ13C values of shallow and deep-dwelling planktonic foraminifera and interpreted small Δδ13C gradients as sustained influence of Kuroshio (Extension) water (Figure 5). This record implies that in phase B, where we observe high SSTMg/Ca there was a greater influence of the subtropical Kuroshio water at Shatsky Rise than in phase A or modern days, where we observe lower SSTMg/Ca (Figure 5). Moreover, the abrupt SSTMg/Ca decrease at ~280 ka BP (this study) goes along with Yamane’s observation of a reduced influence of the Kuroshio Current at Shatsky Rise. Another study from the Shatsky Rise (ODP 1210A) by Chiyonobu et al. (2012) indicates a decrease of warm-water species of calcareous nannofossils from 5x10⁹ specimens/m²/kyr to 2x10⁹ specimens/m²/kyr at ~300 ka BP, while the relative abundance of the cold-water species Coccolithus pelagicus increased. Notably, the time difference between the abundance change and our SSTMg/Ca decrease could be a feature of the different resolution of age models in the study of Chiyonobu et al. (2012) and our own study and is not necessarily an indicator of a different timing between Shatsky Rise and our core location.
A similar change has also been described by Bordiga et al. (2014). They observe higher primary productivity at Shatsky Rise prior to MIS 8 and lower primary productivity in younger periods. Moreover, they detected a significant change in the faunal composition between MIS 8 and 7: While the nannofossil abundance decreases, the productivity associated with biogenic opal and foraminifera increases. Similar to our assumptions, Bordiga et al. (2014) link this change to an ‘elongated state configuration’ of the Kuroshio Extension with larger meanders prior to MIS 8 in connection to more La Niña-like conditions in the equatorial Pacific (Beaufort et al., 2001; Bordiga et al., 2014; Qiu, 2019). Additionally, both Bordiga et al. (2014) and Chiyonobu et al. (2012) discuss a change in the input of eolian Asian dust connected to an intensification of the East Asian Monsoon from MIS 7 onward that might have strengthened seasonality and thus, increased alternation between intensely stratified and vertically mixed surface waters that could have contributed to the change in the productivity regime.
These simultaneous changes of the Monsoon system as well as the tropical east-west temperature gradient were likely caused by physical processes (Chiyonobu et al., 2012; Bordiga et al., 2014) as this threshold-like behavior can neither be explained by orbital variations nor modulations in ice volume (Lisiecki and Raymo, 2005).
Thus, we assume that during very strong La Niña-like conditions in the tropical Pacific, as observed temporally in phase B, the high velocity transport of the Kuroshio Current and thus, the enhanced amount of tropical water in the Kuroshio-Oyashio transition zone caused a northward shift of the SAF. During times of more El Niño-like conditions, like in phase A, the SAF stayed south of the core location, which is reflected by the temporally cooler SSTMg/Ca. Yet the temperature variations within phase A and B cannot exclusively be explained by variations in the SAF position but must have had additional influencing factors (cf. 4.1.2). It is likely that the connection between the observed changes in SSTMg/Ca at our study site and the long-term ENSO development in the tropical Pacific is not straightforward yet that it is further connected to long-term variation in the PDO and its forcing mechanisms. The PDO is connected to the tropical ENSO on shorter timescales in modern days (Newman et al., 2016); thus, changes in the long-term development could have affected these systems, which in return could have influenced the SST at our study site. Due to the high complexity of this system and missing paleo studies of the PDO, we cannot finally clarify this and instead consider a simplified model of enhanced heat transport via the Kuroshio Extension to our study site in times of very strong La Niña-like conditions.
4.1.2 Variations of the Oyashio/Subarctic current
Aside from changes of the Kuroshio Current/Extension, changes of the Oyashio/Subarctic Current are of major importance for the surface temperature development at our study site. Changes in the strength of the Oyashio Current are not necessarily linked to variations in the Kuroshio Current yet can have the same forcing mechanisms, e.g., changes in the intensity of the Aleutian low, mid latitude westerlies (Qiu, 2019) or glacial/interglacial climate variations (e.g. Ujiié et al., 2003; Matsuzaki et al., 2014). Therefore, a strengthening of the Kuroshio Current does neither imply that also the Oyashio Current becomes stronger nor weaker at the same time. The importance of variations in the Oyashio current for our study site becomes apparent when comparing our SSTMg/Ca record to the proxy record of Matsuzaki et al. (2014) (Figure 5). They investigated the radiolarian fauna east of Japan, where the Oyashio Current deviates from the coast and enters the open Pacific as Subarctic Current (core C9001C) (Figures 1, 6). Although there is no peak-to-peak correlation between increased abundances of species typical for the Oyashio Current and thus an intensification of the Oyashio and lower SSTMg/Ca at our study site, some parallels are apparent.
Between 600 and 480 ka BP, there are events of strong La Niña-like conditions in the tropics, and our SSTMg/Ca record shows its highest values while Matsuzaki et al. (2014) observes a weak Oyashio Current. At ~480 ka BP, where we observe a sudden temperature decrease at our study site there is not only a change from strong La Niña-like to strong El Niño-like conditions yet also an intensified Oyashio Current. Thus, the combination of an intensified Oyashio Current in line with the change towards strong El Niño-like conditions (and thus a weak Kuroshio Current) could have caused the a southward displacement of the SAF. Through such a southward shift of the SAF more cold subarctic water would reach our study site and could cause the observed sudden temperature decrease at ~480 ka BP.
After 480 ka BP, SSTMg/Ca increases again, which we link to several phases of strong La Niña-like conditions. Yet, even though the La Niña-like phases are similarly pronounced and long, as before 480 ka BP, the maximum SSTMg/Ca remains lower (Figure 5). We assume that this observed SSTMg/Ca difference is linked to the Oyashio Current. Between 480-390 ka BP and 360-340 ka BP the Oyashio Current is transiently enhanced (Figure 5; Matsuzaki et al., 2014). As both Currents contribute to the water of the Kuroshio-Oyashio transition zone it is likely that this enhanced influence of the Oyashio Current caused an overall lowered SST-level in the Kuroshio-Oyashio transition zone. Thus, the enhancement of the Oyashio/Subarctic Current system after 480 ka BP muted the SST-effect of the La Niña-like induced enhancement of the Kuroshio Current at our study site.
Between ~20-5 ka BP the record of Jia et al. (2018) shows another phase of very strong La Niña-like conditions in the tropical Pacific. Similar ΔTWPWP-EEP values have caused a shift of the SAF in phase B. Yet, between ~20-5 ka BP our SSTMg/Ca record does not show any significant rise (Figure 5). In contrast to previous northward migrations of the SAF in phase B, the Oyashio Current is very strong between ~20-5 ka. We hence assume that the strong Oyashio/Subarctic Current prevented a significant northwards shift of the SAF between ~20-5 ka BP.
4.1.3 Glacial-interglacial shifts of the SAF
Several studies suggest that the frontal zones in the Kuroshio-Oyashio transition area migrated northwards during interglacials and southwards during glacials at least during the last two glacial-interglacial cycles (Thompson and Shackleton, 1980; Kawahata and Ohshima, 2002; Harada et al., 2004; Yasudomi et al., 2014; Gallagher et al., 2015). Assuming that the described changes occurred throughout our entire studied time interval, such shifts could have further contributed to changes in SSTMg/Ca and δ18Osw-ivc at our study site. However, during phase A were our study site was located north of the SAF and thus dominated by subarctic water, our SSTMg/Ca record does not show changes that would fit to glacial-interglacial variations (Figures 3, 6). Therefore, we assume that if there had been a northward migration of the SAF during interglacials it can only have migrated to a position still south of our study site. In phase B, were we consider our study site to be located south of the SAF (Figure 6), the SSTMg/Ca and δ18Osw-ivc broadly follow glacial-interglacial cycles except for MIS 11-10. So if the SAF migrated further north during interglacials it could have caused warmer, more saline water from the Kuroshio-Oyashio transition to reach the study site, whereas southwards shift during glacials could have brought the SAF closer to the core location and thereby caused an increase of colder, less saline water from the Subarctic Current. Thus it is likely that glacial/interglacial induced shifts of the SAF contributed to our observed SSTMg/Ca pattern.
4.1.4 The subSSTMg/Ca record from N. pachyderma
The subSSTMg/Ca record derived from N. pachyderma is consistently lower than the SSTMg/Ca record derived from G. bulloides (Figure 3). This difference reflects firstly the deeper habitat depth of N. pachyderma in comparison to G. bulloides, where the latter inhabits water depths above the thermocline, whereas the former occurs at and below the thermocline. Thus the temperature difference between the two species indicates a stable and pronounced thermocline stratification. Secondly the seasonal bias is expressed, as G. bulloides reflects annual SSTMg/Ca, whereas N. pachyderma reflects subSSTMg/Ca, derived from the colder seasons from autumn to spring. In phase A (280-0 ka BP) our SSTMg/Ca and subSSTMg/Ca records show similar variations in amplitude in MIS 7 and 5-1, yet with an average offset of 3.5°C, while in MIS 6 the SSTMg/Ca and subSSTMg/Ca records show opposing trends.
In phase B (600-280 ka BP) the SSTMg/Ca record yields significantly (up to ~6.5°C) higher values than in phase A, while the subSSTMg/Ca record does not reflect this trend. This indicates that the dispersal of Kuroshio-Oyashio transition water in phase B was either a pure surface phenomenon, or was linked to the different temperature tolerance of both species. In the first case, water from the Kuroshio-Oyashio transition would have migrated northwards in form of a warm surface water lens, while the subsurface would have still been dominated by water from the Subarctic Current. Thus, there would have been a very pronounced shallow thermocline, as indicated in Supplementary Figure 7. However, we consider it more likely that the different temperature trends of N. pachyderma and G. bulloides are not only a phenomenon of significantly different surface and subsurface temperature evolution, but an ecological phenomenon. N. pachyderma is less tolerant to warmer temperatures and prefers values below 7°C (cf. 2.2 and Supplement 1). Therefore, it occurs less during warmer seasons than G. bulloides. We assume that in phase B, with an increased influence of Kuroshio-Oyashio transition water at the study site, temperatures in the preferred depth habitat of N. pachyderma exceeded optimal temperatures even in spring and autumn. Thus, in times of a northward displacement of the SAF N. pachyderma would most likely reflect a pure winter signal, which is significantly colder than the annual signal from G. bulloides. This change in seasonality is in accordance with plankton tow studies from the North Pacific that suggest that in modern days, N. pachyderma occurs from autumn to spring at colder sites (~50°N, ~165°E) while their abundance stays low until December at warmer sites (~40°N, ~165°E) (Taylor et al., 2018; Supplement 1).
4.2 Marine productivity changes
Higher marine productivity during deglaciations and interglacials and lower productivity during glacials as observed in our Ba/Ti record is common in the North Pacific and its marginal seas (Narita et al., 2002; Gorbarenko et al., 2004; Kienast et al., 2004; Nürnberg and Tiedemann, 2004; Jaccard et al., 2005; Brunelle et al., 2007; Shigemitsu et al., 2007; Galbraith et al., 2008; Gebhardt et al., 2008; Jaccard et al., 2010; Riethdorf et al., 2013). In our record we further observe, that the productivity already starts to increase during the deglaciations and decreases during the late interglacials. This is similar to observations at ODP Site 882 (Jaccard et al., 2010) located north of our site (Figure 1) which also shows productivity increases during deglaciations and its highest values in the early interglacials (Figure 4). A similar feature is observed for site SO202-39-3 (Korff et al., 2016) located south of our study site in the area of the Kuroshio Extension (Figures 1, 4). The forcing mechanisms for these productivity patterns, however, are still a matter of debate (Jaccard et al., 2010; Knudson and Ravelo, 2015; Korff et al., 2016). For the North Pacific, most authors suggest a change of nutrient supply, and in the subarctic marginal seas light limitation through sea ice cover and changes in stratification as main drivers for productivity changes (Narita et al., 2002; Gorbarenko et al., 2004; Kienast et al., 2004; Jaccard et al., 2005; Brunelle et al., 2007; Shigemitsu et al., 2007; Galbraith et al., 2008; Gebhardt et al., 2008; Jaccard et al., 2010; Riethdorf et al., 2013; Davis et al., 2020). As our site is located south of the area where sea ice would have a direct influence on productivity and the average winter SST exceeds 3°C, we exclude it as a forcing mechanism (Supplementary Figure 1). Therefore we conclude that the availability of nutrients or their utilization causes the observed glacial-interglacial productivity pattern.
Iron fertilization has been invoked as an important driver for nutrient sequestration efficiency and thus, an enhanced supply of the micronutrient Fe could increase productivity (Boyd et al., 2004; Harrison et al., 2004; Tsuda et al., 2003). One of the sources of Fe is aeolian transport (Hovan et al., 1991; Kawahata et al., 2000; Boyd et al., 2007; Shigemitsu et al., 2007). To test whether the Fe input via dust caused our observed productivity pattern, we compared our XRF-Fe record of core SO264-45, used as a proxy for terrigenous input via wind to our Ba/Ti record (Figure 4). The proxy records are apparently anticorrelated suggesting that Fe fertilization via dust is not the (principal) driver of marine productivity at our study site, although, we cannot say to what extent it still contributed to the observed pattern.
The amount of nutrient transport via water masses could have contributed to changes in productivity (Jaccard et al., 2005; Galbraith et al., 2007; Nishioka et al., 2011; Costa et al., 2018; Gray et al., 2018). Today, nutrient-rich water from the Oyashio/Subarctic Current dominates the upper ocean at our study site. The transported nutrients reach the mixed layer through vertical wintertime mixing (Nishioka et al., 2011). Our SSTMg/Ca record, which is linked to changes in the Kuroshio-Oyashio transition zone does not show the same fluctuations as our productivity record. Thus, although it could have contributed to changes in productivity we assume that the interplay of the Kuroshio and Oyashio Current is not the main driver for the observed productivity pattern at our study site. We do, however, consider that the amount of transported nutrients might have changed on glacial-interglacial timescales. Lembke-Jene et al. (2017) show that the export of nutrients from the Okhotsk Sea increased at the beginning of the deglacial warm phases Allerød and Preboreal, because of an enhanced input of iron and nutrient-rich terrestrial material from the Siberian hinterland via the Amur River caused by melting processes. They argue that such an increased export of nutrients from the Okhotsk Sea could have caused temporary nutrient-replete conditions in the Subarctic North Pacific. Riethdorf et al. (2013) also observe an enhanced input of terrestrial-derived organic matter from flooded shelf areas during early deglacial phases. As water from the Bering and Okhotsk Sea feeds the Oyashio/Subarctic Current, these nutrients could have reached the study site and caused an increase in productivity. Assuming that an enhanced terrestrial sourced nutrient supply from marginal seas like the Okhotsk Sea and the Bering Sea via subsurface water did not only occur on millennial- but also on glacial-interglacial timescales, this could contribute to our observed productivity pattern. Yet to further clarify on this additional proxy records on longer time scales and in the open North Pacific would be needed.
Further it has been proposed for subarctic and Antarctic sites that strong stratification during glacials limits nutrient availability at the surface while weak stratification in interglacials enables upwelling of nutrients-rich deep water thereby enhancing productivity (Jaccard et al., 2005; Brunelle et al., 2007; Galbraith et al., 2008). Yet this topic alongside the efficiency of nutrient uptake is still a matter of debate (e.g. Knudson and Ravelo, 2015) for which further studies with detailed nutrient records and very reliable control would be needed.
5 Conclusion
Through the reconstruction of Mg/Ca and δ18O based (sub)surface temperature and δ18Osw-ivc in the open Northwest Pacific and a comparison of XRF-based Ba/Ti and iron records we draw the following conclusions regarding the hydrological and productivity variations at the northern boundary of the Kuroshio-Oyashio transition zone:
-The SSTMg/Ca development at our study site is strongly related to changes in heat transport of the tropical Kuroshio Current induced by ENSO. In phases of very strong La Niña-like conditions in the tropics, the NEC bifurcation point migrates southward which enhances the velocity transport of the Kuroshio Current/Extension. This way more tropical water enters the transition zone, which causes a northward displacement of the SAF to a position north of our study site, thus a relocation of at least 5°. This way more transition water reaches our core position, which we observe as higher SSTMg/Ca in the time interval 280-600 ka BP. Further, we show that shifts of the SAF cause very abrupt strong temperature changes at our core position e.g. at 480 and 280 ka BP. Such shifts of the SAF have been proposed on shorter timescales and for areas closer to the coast, yet our SSTMg/Ca record makes it possible to track these shifts on longer time scales and into the open Pacific.
-The SSTMg/Ca development at our study site is further influenced by changes in the strength of the Oyashio/Subarctic Current. Both, the Kuroshio Current/Extension and the Oyashio/Subarctic Current contribute to the water in the Kuroshio-Oyashio transition zone so that an enhancement of the Oyashio Current can mute the effect of an enhancement of Kuroshio Current. We observe such an effect a) between 480-280 ka BP, where the enhanced influence of the Subarctic Current at our study site causes temperatures to stay lower than in the time interval 480-600 ka BP, even though there are similarly strong and long La Niña-like phases in both intervals and b) between ~20-5 ka BP, where a strong Oyashio Current seems to prevent a shift of the SAF up to a position north of our study site.
-Glacial-interglacial variations in the Kuroshio-Oyashio transition zone also influence the SSTMg/Ca development at our study site, yet they are less pronounced in our data than the mode shift between phases A and B. In phase B, where the SAF is located north of our study we observe an increase of warmer, more saline water in interglacials and colder, less saline water during glacials. We link these shifts to general glacial-interglacial variations of the Kuroshio-Oyashio transition zone and the front system.
-The productivity at our study site follows glacial-interglacial patterns with high values during the deglaciations/early interglacials and low values during glacials. Thus, we conclude that productivity is not primarily linked to the changing influences of Kuroshio/Oyashio water at our study site.
-Our Fe and Ba/Ti records are anticorrelated, thus we conclude that Fe fertilization via dust is not the (principal) driver of marine productivity at our study site. We further hypothesize that the observed productivity pattern might be linked to (a) glacial/interglacial variations in the subpolar marginal seas and the induced nutrient supply via the subarctic water masses in deglaciations because of melting processes and (b) changes in stratification that have an influence on nitrate availability and utilization.
Data availability statement
Presented data is available online at the Data Publisher for Earth and Environmental Science, PANGEA (www.pangea.de): https://doi.org/10.1594/PANGAEA.949795, https://doi.org/10.1594/PANGAEA.949771.
Author contributions
LJ, W-SC, DN and L-LJ collected the samples at sea. LJ and W-SC proceeded the XRF scanning. LJ prepared and measured the foraminiferal samples with support from DN’s working group. LJ and DN developed the age model and analyzed the data. LJ made all figures and wrote the manuscript, W-SC, DN, LL-J and RT contributed with ideas and feedback throughout the whole process of designing the study and writing the manuscript. All authors contributed to the article and approved the submitted version.
Acknowledgments
We thank the German Ministry of Education and Research (BMBF) for providing funding for expedition SO264 (SONNE-EMPEROR) and subsequent works through grants 03G0264A (GEOMAR) and 03G0264B (AWI), as well as grant 03F0785A NOPAWAC "The North Pacific in Warming Climates" (AWI). We acknowledge institutional funding from AWI and GEOMAR through the research programs “PACES-II” and “Changing Earth – Sustaining Our Future”.
Conflict of interest
The authors declare that the research was conducted in the absence of any commercial or financial relationships that could be construed as a potential conflict of interest.
Publisher’s note
All claims expressed in this article are solely those of the authors and do not necessarily represent those of their affiliated organizations, or those of the publisher, the editors and the reviewers. Any product that may be evaluated in this article, or claim that may be made by its manufacturer, is not guaranteed or endorsed by the publisher.
Supplementary material
The Supplementary Material for this article can be found online at: https://www.frontiersin.org/articles/10.3389/fmars.2023.1074431/full#supplementary-material
References
Abell J. T., Winckler G., Anderson R. F., Herbert T. D. (2021). Poleward and weakened westerlies during pliocene warmth. Nature 589, 70–75. doi: 10.1038/s41586-020-03062-1
Ayers J. M., Lozier M. S. (2012). Unraveling dynamical controls on the north pacific carbon sink. J. Geophys. Res. Ocean. 117, 1–20. doi: 10.1029/2011JC007368
Beaufort L., de Garidel-Thoron T., Mix A. C., Pisias N. G. (2001). ENSO-like forcing on oceanic primary production during the late pleistocene. Science 293, 2440–2444. doi: 10.1126/science.293.5539.2440
Bordiga M., Beaufort L., Cobianchi M., Lupi C., Mancin N., Luciani V., et al. (2013). Calcareous plankton and geochemistry from the ODP site 1209B in the NW pacific ocean (Shatsky rise): New data to interpret calcite dissolution and paleoproductivity changes of the last 450ka. Palaeogeogr. Palaeoclimatol. Palaeoecol. 371, 93–108. doi: 10.1016/j.palaeo.2012.12.021
Bordiga M., Cobianchi M., Lupi C., Pelosi N., Venti N. L., Ziveri P. (2014). Coccolithophore carbonate during the last 450 ka in the NW pacific ocean (ODP site 1209B , shatsky rise). J. Quat. Sci. 29, 57–69. doi: 10.1002/jqs.2677
Boyd P. W., Jickells T., Law C. S., Blain S., Boyle E. A., Buesseler K. O., et al. (2007). Mesoscale iron enrichment experiments 1993-2005: Synthesis and future directions. Sci. (80-. ). 315, 612–617. doi: 10.1126/science.1131669
Boyd P. W., Law C. S., Wong C. S., Nojiri Y., Tsuda A., Levasseur M., et al. (2004). The decline and fate of an iron-induced subarctic phytoplankton bloom. Nature 428, 549–553. doi: 10.1038/nature02437
Boyle E. A., Keigwin L. D. (1985). Comparison of Atlantic and pacific paleochemical records for the last 215,000 years: changes in deep ocean circulation and chemical inventories. Earth Planet. Sci. Lett. 76, 135–150. doi: 10.1016/0012-821X(85)90154-2
Boyle E., Rosenthal Y. (1996). Chemical hydrography of the south Atlantic during the last glacial maximum: Cd vs. δ13C. South Atl., 423–443. doi: 10.1007/978-3-642-80353-6_23
Brunelle B. G., Sigman D. M., Cook M. S., Keigwin L. D., Haug G. H., Plessen B., et al. (2007). Evidence from diatom-bound nitrogen isotopes for subarctic pacific stratification during the last ice age and a link to north pacific denitrification changes. Paleoceanography 22, 1–17. doi: 10.1029/2005PA001205
Caley T., Roche D. M. (2015). Modeling water isotopologues during the last glacial: Implications for quantitative paleosalinity reconstruction. Paleoceanography 30, 739–750. doi: 10.1002/2014PA002720
Chen X. J., Zhao X. H., Chen Y. (2007). Influence of El Niño/La niña on the western winter-spring cohort of neon flying squid (Ommastrephes bartramii) in the northwestern pacific ocean. ICES. J. Mar. Sci. 64, 1152–1160. doi: 10.1093/icesjms/fsm103
Chen J., Zou J., Zhu A., Shi X., Nürnberg D., Lembke-Jene L., et al. (2021). Geochemistry of surface sediments from the emperor seamount chain, north pacific. Front. Earth Sci. 9. doi: 10.3389/feart.2021.674842
Chiyonobu S., Mori Y., Oda M. (2012). Reconstruction of paleoceanographic conditions in the northwestern pacific ocean over the last 500kyr based on calcareous nannofossil and planktic foraminiferal assemblages. Mar. Micropaleontol. 96–97, 29–37. doi: 10.1016/j.marmicro.2012.07.002
Choi J., Son S. W. (2022). Seasonal-to-decadal prediction of El niño–southern oscillation and pacific decadal oscillation. NPJ Clim. Atmos. Sci. 5, 1–8. doi: 10.1038/s41612-022-00251-9
Costa K. M., McManus J. F., Anderson R. F. (2018). Paleoproductivity and stratification across the subarctic pacific over glacial-interglacial cycles. Paleoceanogr. Paleoclimatol. 33, 914–933. doi: 10.1029/2018PA003363
Croudace I. W., Rothwell R. G. (2015) Micro-XRF studies of sediment cores. Available at: http://link.springer.com/10.1007/978-94-017-9849-5.
Darling K. F., Kucera M., Kroon D., Wade C. M. (2006). A resolution for the coiling direction paradox in neogloboquadrina pachyderma. Paleoceanography 21, 1–14. doi: 10.1029/2005PA001189
Davis C. V., Myhre S. E., Deutsch C., Caissie B., Praetorius S., Borreggine M., et al. (2020). Sea Surface temperature across the subarctic north pacific and marginal seas through the past 20,000 years: A paleoceanographic synthesis. Quat. Sci. Rev. 246, 106519. doi: 10.1016/j.quascirev.2020.106519
De Boer B., Lourens L. J., Van De Wal R. S. W. (2014). Persistent 400,000-year variability of antarctic ice volume and the carbon cycle is revealed throughout the plio-pleistocene. Nat. Commun. 5, 1–8. doi: 10.1038/ncomms3999
de Garidel-Thoron T., Rosenthal Y., Bassinot F., Beaufort L. (2005). Stable sea surface temperatures in the western pacific warm pool over the past 1.75 million years. Nature 433, 294–298. doi: 10.1038/nature03189
Elderfield H., Ganssen G. (2000). Past temperature and δ18O of surface ocean waters inferred from foraminiferal Mg/Ca ratios. Nature 405, 442–445. doi: 10.1038/35013033
Emery W. J. (2001). Water types and water masses. Encycl. Ocean. Sci., 3179–3187. doi: 10.1006/rwos.2001.0108
Favorite F. (1976). Oceanography of the subarctic pacific region 1960-71. Bull. Int. North Pac. Fish. Comm. 33, 1–187.
Fontanier C., MacKensen A., Jorissen F. J., Anschutz P., Licari L., Griveaud C. (2006). Stable oxygen and carbon isotopes of live benthic foraminifera from the bay of Biscay: Microhabitat impact and seasonal variability. Mar. Micropaleontol. 58, 159–183. doi: 10.1016/j.marmicro.2005.09.004
Fuhr M., Laukert G., Yu Y., Nürnberg D., Frank M. (2021). Tracing water mass mixing from the equatorial to the north pacific ocean with dissolved neodymium isotopes and concentrations. Front. Mar. Sci. 7. doi: 10.3389/fmars.2020.603761
Galbraith E. D., Jaccard S. L., Pedersen T. F., Sigman D. M., Haug G. H., Cook M., et al. (2007). Carbon dioxide release from the north pacific abyss during the last deglaciation. Nature 449, 890–893. doi: 10.1038/nature06227
Galbraith E. D., Kienast M., Jaccard S. L., Pedersen T. F., Brunelle B. D., Sigman D. M., et al. (2008). Consistent relationship between global climate and surface nitrate utilization in the western subarctic pacific throughout the last 500 ka. Paleoceanography 23, 1–11. doi: 10.1029/2007PA001518
Gallagher S. J., Kitamura A., Iryu Y., Itaki T., Koizumi I., Hoiles P. W. (2015). The pliocene to recent history of the kuroshio and tsushima currents: a multi-proxy approach. Prog. Earth Planet. Sci. 2, 1–23. doi: 10.1186/s40645-015-0045-6
Garcia H., Weathers K. W., Paver C. R., Smolyar I., Boyer T. P., Locarnini R. A., et al. (2018). World ocean atlas 2018. volume 4: Dissolved inorganic nutrients (phosphate, nitrate and nitrate+nitrite, silicate). NOAA. Atlas. NESDIS. 84 84, 35.
Gebhardt H., Sarnthein M., Grootes P. M., Kiefer T., Kuehn H., Schmieder F., et al. (2008). Paleonutrient and productivity records from the subarctic north pacific for pleistocene glacial terminations I to V. Paleoceanography 23, 1–21. doi: 10.1029/2007PA001513
Gorbarenko, Southon J. R., Keigwin L. D., Cherepanova M. V., Gvozdeva I. G. (2004). Late pleistocene-Holocene oceanographic variability in the Okhotsk Sea: Geochemical, lithological and paleontological evidence. Palaeogeogr. Palaeoclimatol. Palaeoecol. 209, 281–301. doi: 10.1016/j.palaeo.2004.02.013
Gray W. R., Rae J. W. B., Wills R. C. J., Shevenell A. E., Taylor B., Burke A., et al. (2018). Deglacial upwelling, productivity and CO2 outgassing in the north pacific ocean. Nat. Geosci. 11, 340–344. doi: 10.1038/s41561-018-0108-6
Greaves M., Caillon N., Rebaubier H., Bartoli G., Bohaty S., Cacho I., et al. (2008). Interlaboratory comparison study of calibration standards for foraminiferal Mg/Ca thermometry. Geochem. Geophys. Geosyst. 9, 1–27. doi: 10.1029/2008GC001974
Harada N., Ahagon N., Uchida M., Murayama M. (2004). Northward and southward migrations of frontal zones during the past 40 kyr in the kuroshio-oyashio transition area. Geochem. Geophys. Geosyst. 5, 1–16. doi: 10.1029/2004GC000740
Harrison P. J., Whitney F. A., Tsuda A., Saito H., Tadokoro K. (2004). Nutrient and plankton dynamics in the NE and NW gyres of the subarctic pacific ocean. J. Oceanogr. 60, 93–117. doi: 10.1023/B:JOCE.0000038321.57391.2a
Heaton T. J., Köhler P., Butzin M., Bard E., Reimer R. W., Austin W. E. N., et al. (2020). Marine20–the marine radiocarbon age calibration curve (0–55,000 cal BP). Radiocarbon 62, 779–820. doi: 10.1017/rdc.2020.68
Helmke J. P., Bauch H. A., Röhl U., Kandiano E. S. (2008). Uniform climate development between the subtropical and subpolar northeast Atlantic across marine isotope stage 11. Clim. Past. 4, 181–190. doi: 10.5194/cp-4-181-2008
Herbert T. D., Schuffert J. D., Andreasen D., Heusser L., Lyle M., Mix A., et al. (2001). Collapse of the California current during glacial maxima linked to climate change on land. Science 80-. ). 293, 71–76. doi: 10.1126/science.1059209
Holloway M. D., Sime L. C., Singarayer J. S., Tindall J. C., Valdes P. J. (2016). Reconstructing paleosalinity from δ18O: Coupled model simulations of the last glacial maximum, last interglacial and late Holocene. Quat. Sci. Rev. 131, 350–364. doi: 10.1016/j.quascirev.2015.07.007
Hovan S. A., Rea D. K., Pisias N. G. (1991). Late pleistocene continental climate and oceanic variability recorded in Northwest pacific sediments. Paleoceanography 6, 349–370. doi: 10.1029/91PA00559
Hu D., Wu L., Cai W., Gupta A.S., Ganachaud A., Qiu B., et al. (2015). Pacific western boundary currents and their roles in climate. Nature 522, 299–308. doi: 10.1038/nature14504
Huang R. X. (2015). Oceanographic topics: Surface/Wind driven circulation. second edi (London: Elsevier Ltd.). doi: 10.1016/B978-0-12-382225-3.00280-2
Isoguchi O., Kawamura H., Oka E. (2006). Quasi-stationary jets transporting surface warm waters across the transition zone between the subtropical and the subarctic gyres in the north pacific. J. Geophys. Res. Ocean. 111, 1–17. doi: 10.1029/2005JC003402
Iwasaki S., Kimoto K., Kuroyanagi A., Kawahata H. (2017). Horizontal and vertical distributions of planktic foraminifera in the subarctic pacific. Mar. Micropaleontol. 130, 1–14. doi: 10.1016/j.marmicro.2016.12.001
Jaccard S. L., Galbraith E. D., Sigman D. M., Haug G. H. (2010). A pervasive link between Antarctic ice core and subarctic pacific sediment records over the past 800 kyrs. Quat. Sci. Rev. 29, 206–212. doi: 10.1016/j.quascirev.2009.10.007
Jaccard S. L., Haug G. H., Sigman D. M., Pedersen T. F., Thierstein H. R., Röhl U. (2005). Glacial/interglacial changes in subarctic north pacific stratification. Science 80-. ). 308, 1003–1006. doi: 10.1126/science.1108696
Jahn B., Donner B., Müller P. J., Röhl U., Schneider R. R., Wefer G. (2003). Pleistocene variations in dust input and marine productivity in the northern benguela current: Evidence of evolution of global glacial-interglacial cycles. Palaeogeogr. Palaeoclimatol. Palaeoecol. 193, 515–533. doi: 10.1016/S0031-0182(03)00264-5
Jahn B., Schneider R. R., Müller P. J., Donner B., Röhl U. (2005). Response of tropical African and East Atlantic climates to orbital forcing over the last 1.7 ma. Geol. Soc Spec. Publ. 247, 65–84. doi: 10.1144/GSL.SP.2005.247.01.04
Jia Q., Li T., Xiong Z., Steinke S., Jiang F., Chang F., et al. (2018). Hydrological variability in the western tropical pacific over the past 700 kyr and its linkage to northern hemisphere climatic change. Palaeogeogr. Palaeoclimatol. Palaeoecol. 493, 44–54. doi: 10.1016/j.palaeo.2017.12.039
Joh Y., Di Lorenzo E. (2019). Interactions between kuroshio extension and central tropical pacific lead to preferred decadal-timescale oscillations in pacific climate. Sci. Rep. 9, 1–12. doi: 10.1038/s41598-019-49927-y
Johnson Z. F., Chikamoto Y., Wang S. Y. S., McPhaden M. J., Mochizuki T. (2020). Pacific decadal oscillation remotely forced by the equatorial pacific and the Atlantic oceans. Clim. Dyn. 55, 789–811. doi: 10.1007/s00382-020-05295-2
Kaiser J., Schefuß E., Lamy F., Mohtadi M., Hebbeln D. (2008). Glacial to Holocene changes in sea surface temperature and coastal vegetation in north central Chile: high versus low latitude forcing. Quat. Sci. Rev. 27, 2064–2075. doi: 10.1016/j.quascirev.2008.08.025
Kawahata H., Ohshima H. (2002). Small latitudinal shift in the kuroshio extension (Central pacific) during glacial times: Evidence from pollen transport. Quat. Sci. Rev. 21, 1705–1717. doi: 10.1016/S0277-3791(01)00150-0
Kawahata H., Okamoto T., Matsumoto E., Ujiie H. (2000). Fluctuations of eolian flux and ocean productivity in the mid-latitude north pacific during the last 200 kyr. Quat. Sci. Rev. 19, 1279–1291. doi: 10.1016/S0277-3791(99)00096-7
Kienast S. S., Hendy I. L., Crusius J., Pedersen T. F., Calvert S. E. (2004). Export production in the subarctic north pacific over the last 800 kyrs: No evidence for iron fertilization? J. Oceanogr. 60, 189–203. doi: 10.1023/B:JOCE.0000038326.73943.aa
Kim Y. Y., Qu T., Jensen T., Miyama T., Mitsudera H., Kang H. W., et al. (2004). Seasonal and interannual variations of the north equatorial current bifurcation in a high-resolution OGCM. J. Geophys. Res. Ocean. 109, 1–19. doi: 10.1029/2003jc002013
Knudson K. P., Ravelo A. C. (2015). Enhanced subarctic pacific stratification and nutrient utilization during glacials over the last 1.2 myr. Geophys. Res. Lett. 42, 9870–9879. doi: 10.1002/2015GL066317
Korff L., von Dobeneck T., Frederichs T., Kasten S., Kuhn G., Gersonde R., et al. (2016). Cyclic magnetite dissolution in pleistocene sediments of the abyssal northwest pacific ocean: Evidence for glacial oxygen depletion and carbon trapping. Paleoceanography 31, 600–624. doi: 10.1002/2015PA002882
Kotov S., Paelike H., Kotov S., Paelike H. (2018)QAnalySeries - a cross-platform time series tuning and analysis tool. In: AGUFM. Available at: https://ui.adsabs.harvard.edu/abs/2018AGUFMPP53D1230K/abstract (Accessed April 12, 2021).
Kozdon R., Eisenhauer A., Weinelt M., Meland M. Y., Nürnberg D. (2009). Reassessing Mg/Ca temperature calibrations of neogloboquadrina pachyderma (sinistral) using paired δ44/40Ca and Mg/Ca measurements. Geochem. Geophys. Geosyst. 10, 1–14. doi: 10.1029/2008GC002169
Kuroyanagi A., Kawahata H., Nishi H., Honda M. C. (2008). Seasonal to interannual changes in planktonic foraminiferal assemblages in the northwestern north pacific: Sediment trap results encompassing a warm period related to El niño. Palaeogeogr. Palaeoclimatol. Palaeoecol. 262, 107–127. doi: 10.1016/j.palaeo.2008.02.012
Kuzmin Y. V., Burr G. S., Gorbunov S. V., Rakov V. A., Razjigaeva N. G. (2007). A tale of two seas: Reservoir age correction values (R, ΔR) for the Sakhalin island (Sea of Japan and Okhotsk Sea). Nucl. Instruments. Methods Phys. Res. Sect. B. Beam. Interact. Mater. Atoms. 259, 460–462. doi: 10.1016/j.nimb.2007.01.308
Kuzmin Y. V., Burr G. S., Jull A. J. (2001). Radiocarbon reservoir correction ages in the Peter the great gulf, Sea of Japan, and Eastern coast of the kunashir, southern kuriles (Northwestern pacific). Radiocarbon 43, 477–481. doi: 10.1017/S0033822200038364
Labeyrie L., Leclaire H., Waelbroeck C., Cortijo E., Duplessy J. C., Vidal L., et al. (1999). Temporal variability of the surface and deep waters of the northwest atlantic ocean at orbital and millennial scales. Geophys. Monogr. Ser. 112, 77–98. doi: 10.1029/GM112p0077
Lamy F., Gersonde R., Winckler G., Esper O., Jaeschke A., Kuhn G., et al. (2014). Increased dust deposition in the pacific southern ocean during glacial periods. Science 80-. ). 343, 403–407. doi: 10.1126/science.1245424
Lang N., Wolff E. W. (2011). Interglacial and glacial variability from the last 800 ka in marine , ice and terrestrial archives. Clim. Past 7, 361–380. doi: 10.5194/cp-7-361-2011
LeGrande A. N., Schmidt G. A. (2006). Global gridded data set of the oxygen isotopic composition in seawater. Geophys. Res. Lett. 33, 1–5. doi: 10.1029/2006GL026011
Lembke-Jene L., Tiedemann R., Nürnberg D., Kokfelt U., Kozdon R., Max L., et al. (2017). Deglacial variability in Okhotsk Sea intermediate water ventilation and biogeochemistry: Implications for north pacific nutrient supply and productivity. Quat. Sci. Rev. 160, 116–137. doi: 10.1016/j.quascirev.2017.01.016
Li S., Wu L., Yang Y., Geng T., Cai W., Gan B., et al. (2020). The pacific decadal oscillation less predictable under greenhouse warming. Nat. Clim. Change 10, 30–34. doi: 10.1038/s41558-019-0663-x
Lisiecki L. E., Raymo M. E. (2005). A pliocene-pleistocene stack of 57 globally distributed benthic δ 18O records. Paleoceanography 20, 1–17. doi: 10.1029/2004PA001071
Locarnini R. A., Mishonov A. V., Baranova O. K., Boyer T. P., Zweng M. M., Garcia H. E., et al. (2018). World ocean atlas 2018, volume 1: Temperature. a. mishonov, technical Editor. NOAA. Atlas. NESDIS. 1, 52.
Lohmann G., Lembke-Jene L., Tiedemann R., Gong X., Scholz P., Zou J., et al. (2019). Challenges in the paleoclimatic evolution of the Arctic and subarctic pacific since the last glacial period–the sino–German pacific–Arctic experiment (SiGePAX). Challenges 10, 13. doi: 10.3390/challe10010013
MacDonald G. M., Case R. A. (2005). Variations in the pacific decadal oscillation over the past millennium. Geophys. Res. Lett. 32, 1–4. doi: 10.1029/2005GL022478
Mantua N. J., Hare S. R., Zhang Y., Wallace J. M., Francis R. C. (1997). A pacific interdecadal climate oscillation with impacts on salmon production. Bull. Am. Meteorol. Soc 78, 1069–1079. doi: 10.1175/1520-0477(1997)078<1069:APICOW>2.0.CO;2
Matsumoto K., Oba T., Lynch-Stieglitz J., Yamamoto H. (2002). Interior hydrography and circulation of the glacial pacific ocean. Quat. Sci. Rev. 21, 1693–1704. doi: 10.1016/S0277-3791(01)00142-1
Matsuzaki K. M., Nishi H., Suzuki N., Cortese G., Eynaud F., Takashima R., et al. (2014). Paleoceanographic history of the Northwest pacific ocean over the past 740kyr, discerned from radiolarian fauna. Palaeogeogr. Palaeoclimatol. Palaeoecol. 396, 26–40. doi: 10.1016/j.palaeo.2013.12.036
Metzger E. J., Hurlburt H. E. (1996). Coupled dynamics of the south China Sea, the sulu Sea, and the pacific ocean. J. Geophys. Res. C Ocean. 101, 12331–12352. doi: 10.1029/95JC03861
Mitnik L. M., Khazanova E. S., Dubina V. A. (2020). Mesoscale and synoptic scale dynamic phenomena in the oyashio current region observed in SAR imagery. Int. J. Remote Sens. 41, 5861–5883. doi: 10.1080/01431161.2019.1701215
Mohtadi M., Romero O. E., Kaiser J., Hebbeln D. (2007). Cooling of the southern high latitudes during the medieval period and its effect on ENSO. Quat. Sci. Rev. 26, 1055–1066. doi: 10.1016/j.quascirev.2006.12.008
Morley J. J., Heusser L. E. (1997). Role of orbital forcing in east Asian monsoon climates during the last 350 kyr: Evidence from terrestrial and marine climate proxies from core RC14-99. Paleoceanography 12, 483–493. doi: 10.1029/97PA00213
Mulitza S., Boltovskoy D., Donner B., Meggers H., Paul A., Wefer G. (2003). Temperature: δ18O relationships of planktonic foraminifera collected from surface waters. Palaeogeogr. Palaeoclimatol. Palaeoecol. 202, 143–152. doi: 10.1016/S0031-0182(03)00633-3
Narita H., Sato M., Tsunogai S., Murayama M., Ikehara M., Nakatsuka T., et al. (2002). Biogenic opal indicating less productive northwestern north pacific during the glacial ages. Geophys. Res. Lett. 29, 2–5. doi: 10.1029/2001GL014320
Newman M., Alexander M. A., Ault T. R., Cobb K. M., Deser C., Di Lorenzo E., et al. (2016). The pacific decadal oscillation, revisited. J. Clim. 29, 4399–4427. doi: 10.1175/JCLI-D-15-0508.1
Nishioka J., Ono T., Saito H., Sakaoka K., Yoshimura T. (2011). Oceanic iron supply mechanisms which support the spring diatom bloom in the oyashio region, western subarctic pacific. J. Geophys. Res. Ocean. 116, 1–17. doi: 10.1029/2010JC006321
Nürnberg D. (2018). RV SONNE Fahrtbericht/Cruise report SO264 - SONNE-EMPEROR: The Plio/Pleistocene to Holocene development of the pelagic north pacific from surface to depth – assessing its role for the global carbon budget and earth ís climate, Suva (Fiji) – Yokohama (Japa. GEOMAR report, n. ser. 046. GEOMAR. Helmholtz-Zentrum. für. Ozeanforschung. Kiel. Ger.. Geophys. Monogr. Ser. 151, 1–284. doi: 10.3289/GEOMAR_REP_NS_46_2018
Nürnberg C. C., Bohrmann G., Schlüter M., Frank M. (1997). Barium accumulation in the Atlantic sector of the southern ocean: Results from 190,000-year records. Paleoceanography 12, 594–603. doi: 10.1029/97PA01130
Nürnberg D., Brughmans N., Schönfeld J., Ninnemann U., Dullo C. (2004). Paleo-export production, terrigenous flux and Sea surface temperatures around Tasmania - implications for Glacial/Interglacial changes in the subtropical convergence zone 1–32. doi: 10.1029/151GM17
Nürnberg, Tiedemann R. (2004). Environmental change in the Sea of Okhotsk during the last 1.1 million years. Paleoceanography 19, 1–23. doi: 10.1029/2004PA001023
Ogawa K., Usui T., Takatani S., Kitao T., Harimoto T., Katoh S., et al. (2006). Shipboard measurements of atmospheric and surface seawater pCO 2 in the north pacific carried out from January 1999 to October 2000 on the voluntary observation ship MS alligator liberty. Pap. Meteorol. Geophys. 57, 37–46. doi: 10.2467/mripapers.57.37
Ponomareva V., Bubenshchikova N., Portnyagin M., Zelenin E., Derkachev A., Gorbarenko S., et al. (2018). Large-Magnitude pauzhetka caldera-forming eruption in kamchatka: Astrochronologic age, composition and tephra dispersal. J. Volcanol. Geotherm. Res. 366, 1–12. doi: 10.1016/j.jvolgeores.2018.10.006
Qiu B. (2002). The kuroshio extension system: Its large-scale variability and role in the midlatitude ocean-atmosphere interaction. J. Oceanogr. 58, 57–75. doi: 10.1023/A:1015824717293
Qiu B. (2019). Kuroshio and oyashio currents. 3rd ed (Elsevier Ltd). doi: 10.1016/B978-0-12-409548-9.11295-3
Qiu B., Lukas R. (1996). Seasonal and interannual variability of the north equatorial current, the Mindanao current, and the kuroshio along the pacific western boundary. J. Geophys. Res. C Ocean. 101, 12315–12330. doi: 10.1029/95JC03204
Reynolds L. A., Thunell R. C. (1986). Seasonal production and morphologic variation of neogloboquadrina pachyderma (Ehrenberg) in the northeast pacific. Micropaleontology 32, 1. doi: 10.2307/1485696
Riethdorf J. R. (2013). Deglacial development of (sub) sea surface temperature and salinity in the subarctic northwest pacific. Paleoceanography 28, 91–104. doi: 10.1002/palo.20014
Riethdorf J. R., Nürnberg D., Max L., Tiedemann R., Gorbarenko S. A., Malakhov M. I. (2013). Millennial-scale variability of marine productivity and terrigenous matter supply in the western Bering Sea over the past 180 kyr. Clim. Past. 9, 1345–1373. doi: 10.1002/aur.1919
Sagawa T., Kuroyanagi A., Irino T., Kuwae M., Kawahata H. (2013). Seasonal variations in planktonic foraminiferal flux and oxygen isotopic composition in the western north pacific: Implications for paleoceanographic reconstruction. Mar. Micropaleontol. 100, 11–20. doi: 10.1016/j.marmicro.2013.03.013
Sarnthein M., Gebhardt H., Kiefer T., Kucera M., Cook M., Erlenkeuser H. (2004). Mid Holocene origin of the sea-surface salinity low in the subarctic north pacific. Quat. Sci. Rev. 23, 2089–2099. doi: 10.1016/j.quascirev.2004.08.008
Schiebel R., Spielhagen R. F., Garnier J., Hagemann J., Howa H., Jentzen A., et al. (2017). Modern planktic foraminifers in the high-latitude ocean. Mar. Micropaleontol. 136, 1–13. doi: 10.1016/j.marmicro.2017.08.004
Schlitzer R. (2019). Ocean data view. Available at: https://Https://Odv.Awi.De.
Shackleton N. J. (1974). Attainment of isotopic equilibrium between ocean water and the benthonic foraminifera genus uvigerina: Isotopic changes in the ocean during the last glacial. Colloq. Int. du C.N.R.S. 219, 203–210.
Shackleton N. J., Hall M. A. (1984). Oxygen and carbon isotope stratigraphy of deep Sea drilling project hole 552A: Plio-pleistocene glacial history. Initial. Rep. DSDP. Leg. 81 Southampt. to Azores., 599–609. doi: 10.2973/dsdp.proc.81.116.1984
Shackleton N. J., Opdyke N. D. (1973). Oxygen isotope and palaeomagnetic stratigraphy of equatorial pacific core V28-238: Oxygen isotope temperatures and ice volumes on a 10^5 year and 10^6 year scale. Quat. Res 3, 39–55. doi: 10.1016/0033-5894(73)90052-5
Shigemitsu M., Narita H., Watanabe Y. W. (2007). Ba, Si, U, Al, Sc, la, Th, c and 13 C/12 c in a sediment core in the western subarctic pacific as proxies of past biological production. Mar. Chem. 106, 442–455. doi: 10.1016/j.marchem.2007.04.004
Shimizu Y., Yasuda I., Ito S. I. (2001). Distribution and circulation of the coastal oyashio intrusion. J. Phys. Oceanogr. 31, 1561–1578. doi: 10.1175/1520-0485(2001)031<1561:DACOTC>2.0.CO;2
Sigman D. M., Fripiat F., Studer A. S., Kemeny P. C., Martínez-García A., Hain M. P., et al. (2021). The southern ocean during the ice ages: A review of the Antarctic surface isolation hypothesis, with comparison to the north pacific. Quat. Sci. Rev. 254. doi: 10.1016/j.quascirev.2020.106732
Sigman D. M., Hain M. P., Haug G. H. (2010). The polar ocean and glacial cycles in atmospheric CO2 concentration. Nature 466, 47–55. doi: 10.1038/nature09149
Stuiver M., Reimer P. J., Reimer R. W. (2020) CALIB 8.2. Available at: http://calib.org (Accessed 2020-10-9).
Takahashi T., Sutherland S. C., Wanninkhof R., Sweeney C., Feely R. A., Chipman D. W., et al. (2009). Climatological mean and decadal change in surface ocean pCO2, and net sea-air CO2 flux over the global oceans. Deep. Res. Part II. Top. Stud. Oceanogr. 56, 554–577. doi: 10.1016/j.dsr2.2008.12.009
Talley L. D. (1993). Distribution and formation of north pacific intermediate water. J. Phys. Oceanogr. 23, 517–537. doi: 10.1175/1520-0485(1993)023<0517:DAFONP>2.0.CO;2
Taylor B. J., Rae J. W. B., Gray W. R., Darling K. F., Burke A., Gersonde R., et al. (2018). Distribution and ecology of planktic foraminifera in the north pacific: Implications for paleo-reconstructions. Quat. Sci. Rev. 191, 256–274. doi: 10.1016/j.quascirev.2018.05.006
Thompson P. R., Shackleton N. J. (1980). North pacific palaeoceanography: Late quaternary coiling variations of planktonic foraminifer neogloboquadrina pachyderma. Nature 287, 829–833. doi: 10.1038/287829a0
Tjallingii R., Röhl U., Kölling M., Bickert T. (2007). Influence of the water content on X-ray fluorescence corescanning measurements in soft marine sediments. Geochem. Geophys. Geosyst. 8, 1–12. doi: 10.1029/2006GC001393
Tsuda A., Takeda S., Saito H., Nishioka J., Nojiri Y., Kud I., et al (2003). A mesoscale iron enrichment in the Western subarctic Pacific induces a large centric diatom bloom. Science (80-) 300, 985–961. doi: 10.1126/science.1082000
Ujiié Y., Asahi H., Sagawa T., Bassinot F. (2016). Evolution of the north paci fi c subtropical gyre during the past 190 kyr through the interaction of the kuroshio current with the surface and intermediate waters. Paleoceanography 31, 1498–1513. doi: 10.1002/2015PA002914
Ujiié Y., Ujiié H., Taira A., Nakamura T., Oguri K. (2003). Spatial and temporal variability of surface water in the kuroshio source region, pacific ocean, over the past 21,000 years: Evidence from planktonic foraminifera. Mar. Micropaleontol. 49, 335–364. doi: 10.1016/S0377-8398(03)00062-8
Waddell L. M., Hendy I. L., Moore T. C., Lyle M. W. (2009). Ventilation of the abyssal southern ocean during the late neogene: A new perspective from the subantarctic pacific. Paleoceanography, 24. doi: 10.1029/2008PA001661
Wara M. W., Ravelo A. C., Delaney M. L. (2005). Climate change: Permanent El niño-like conditions during the pliocene warm period. Science 80-. )309, 758–761. doi: 10.1126/science.1112596
Weltje G. J., Jan G., Tjallingii R. (2008). Calibration of XRF core scanners for quantitative geochemical logging of sediment cores: Theory and application calibration of XRF core scanners for quantitative geochemical logging of sediment cores: Theory and application. Earth Planet. Sci. Lett. 274, 423–438. doi: 10.1016/j.epsl.2008.07.054
Yamamoto M., Suemune R., Oba T. (2005). Equatorward shift of the subarctic boundary in the northwestern pacific during the last deglaciation. Geophys. Res. Lett. 32, 10–13. doi: 10.1029/2004GL021903
Yamane M. (2003). Late quaternary variations in water mass in the shatsky rise area, northwest pacific ocean. Mar. Micropaleontol. 48, 205–223. doi: 10.1016/S0377-8398(03)00017-3
Yasuda I. (2003). Hydrographic structure and variability in the kuroshio- oyashio transition area. J. Oceanogr. 59, 389–402. doi: 10.1023/A:1025580313836
Yasuda I., Kouketsu S., Katsumata K., Ohiwa M., Kawasaki Y., Kusaka A. (2002). Influence of Okhotsk Sea intermediate water on the oyashio and north pacific intermediate water. J. Geophys. Res. Ocean. 107, 1–11. doi: 10.1029/2001jc001037
Yasuda I., Okuda K., Shimizu Y. (1996). Distribution and modification of north pacific intermediate water in the kuroshio-oyashio interfrontal zone. J. Phys. Oceanogr. 26, 448–465. doi: 10.1175/1520-0485(1996)026<0448:DAMONP>2.0.CO;2
Yasudomi Y., Motoyama I., Oba T., Anma R. (2014). Environmental fluctuations in the northwestern pacific ocean during the last interglacial period: Evidence from radiolarian assemblages. Mar. Micropaleontol. 108, 1–12. doi: 10.1016/j.marmicro.2014.02.001
Yatsu A., Chiba S., Yamanaka Y., Ito S. I., Shimizu Y., Kaeriyama M., et al. (2013). Climate forcing and the Kuroshio/Oyashio ecosystem. ICES. J. Mar. Sci. 70, 922–933. doi: 10.1093/icesjms/fst084
Yoneda M., Uno H., Shibata Y., Suzuki R., Kumamoto Y., Yoshida K., et al. (2007). Radiocarbon marine reservoir ages in the western pacific estimated by pre-bomb molluscan shells. Nucl. Instruments. Methods Phys. Res. Sect. B. Beam. Interact. Mater. Atoms. 259, 432–437. doi: 10.1016/j.nimb.2007.01.184
Yu L., Furevik T., Otterå O. H., Gao Y. (2015). Modulation of the pacific decadal oscillation on the summer precipitation over East China: a comparison of observations to 600-years control run of Bergen climate model. Clim. Dyn. 44, 475–494. doi: 10.1007/s00382-014-2141-5
Yuan Y. C., Liu Y. G., Su J. L. (2001). Variability of the kuroshio in the East China Sea during El-niño to la niña phenomenon of 1997 and 1998. Acta Geophys. Sin. 44, 199–210. doi: 10.1002/cjg2.132
Zammit-Mangion A., Wikle C. K. (2020). Deep integro-difference equation models for spatio-temporal forecasting. Spatial. Stat 37, 100408. doi: 10.1016/j.spasta.2020.100408
Zheng X., Li A., Kao S. J., Gong X., Frank M., Kuhn G., et al. (2016). Synchronicity of kuroshio current and climate system variability since the last glacial maximum. Earth Planet. Sci. Lett. 452, 247–257. doi: 10.1016/j.epsl.2016.07.028
Zhong Y., Lu Z., Wilson D. J., Zhao D., Liu Y., Chen T., et al. (2023). Paleoclimate evolution of the north pacific ocean during the late quaternary: Progress and challenges. Geosyst. Geoenvironment. 2, 100124. doi: 10.1016/j.geogeo.2022.100124
Keywords: foraminiferal geochemistry, North Pacific, Kuroshio Current, Mg/Ca SSTs, Emperor Seamount chain, subarctic front (SAF), Ba/Ti ratio
Citation: Jacobi L, Nürnberg D, Chao W-s, Lembke-Jene L and Tiedemann R (2023) ENSO vs glacial-interglacial-induced changes in the Kuroshio-Oyashio transition zone during the Pleistocene. Front. Mar. Sci. 10:1074431. doi: 10.3389/fmars.2023.1074431
Received: 19 October 2022; Accepted: 13 March 2023;
Published: 30 March 2023.
Edited by:
Ludvig Löwemark, National Taiwan University, TaiwanReviewed by:
Li Lo, National Taiwan University, TaiwanJeroen Groeneveld, National Taiwan University, Taiwan
Copyright © 2023 Jacobi, Nürnberg, Chao, Lembke-Jene and Tiedemann. This is an open-access article distributed under the terms of the Creative Commons Attribution License (CC BY). The use, distribution or reproduction in other forums is permitted, provided the original author(s) and the copyright owner(s) are credited and that the original publication in this journal is cited, in accordance with accepted academic practice. No use, distribution or reproduction is permitted which does not comply with these terms.
*Correspondence: Lara Jacobi, bGphY29iaUBnZW9tYXIuZGU=