 Nico Lange1
 Toste Tanhua1*
 Benjamin Pfeil2
 Hermann W. Bange1
 Siv K. Lauvset3
 Marilaure Grégoire4
 Dorothee C. E. Bakker5
 Steve D. Jones2
 Björn Fiedler1
 Kevin M. O’Brien6,7
 Arne Körtzinger1,8
- 1GEOMAR, Helmholtz Centre for Ocean Research Kiel, Kiel, Germany
- 2Geophysical Institute, University of Bergen and Bjerknes Centre for Climate Research, Bergen, Norway
- 3NORCE Norwegian Research Centre, Bjerknes Centre for Climate Research, Bergen, Norway
- 4Department of Astrophysics, Geophysics and Oceanography, MAST (Modelling for Aquatic Systems) - FOCUS (Freshwater and OCeanic science Unit of reSearch), University of Liège, Liège, Belgium
- 5Centre for Ocean and Atmospheric Sciences, School of Environmental Sciences, University of East Anglia, Norwich, United Kingdom
- 6Cooperative Institute for Climate, Ocean and Ecosystem Studies, University of Washington, Seattle, WA, United States
- 7Pacific Marine Environmental Laboratory, National Oceanic and Atmospheric Administration, Seattle, WA, United States
- 8Faculty of Mathematics and Natural Sciences, Christian-Albrechts-Universität zu Kiel, Kiel, Germany
Ocean data synthesis products for specific biogeochemical essential ocean variables have the potential to facilitate today’s biogeochemical ocean data usage and comply with the Findable Accessible Interoperable and Reusable (FAIR) data principles. The products constitute key outputs from the Global Ocean Observation System, laying the observational foundation for information and services regarding climate and environmental status of the ocean. Using the Framework of Ocean Observing (FOO) readiness level concept, we present an evaluation framework for biogeochemical data synthesis products, which enables a systematic assessment of each product’s maturity. A new criteria catalog provides the foundation for assigning scores to the nine FOO readiness levels. As an example, we apply the assessment to four existing biogeochemical essential ocean variables data products. In descending readiness level order these are: The Surface Ocean CO2 Atlas (SOCAT); the Global Ocean Data Analysis Project (GLODAP); the MarinE MethanE and NiTrous Oxide (MEMENTO) data product and the Global Ocean Oxygen Database and ATlas (GO2DAT). Recognizing that the importance of adequate and comprehensive data from the essential ocean variables will grow, we recommend using this assessment framework to guide the biogeochemical data synthesis activities in their development. Moreover, we envision an overarching cross-platform FAIR biogeochemical data management system that sustainably supports the products individually and creates an integrated biogeochemical essential ocean variables data synthesis product; in short a system that provides truly comparable and FAIR data of the entire biogeochemical essential ocean variables spectrum.
1 Introduction
Covering approximately 71% of the Earth’s surface, the ocean’s importance for the earth system and our society is immense. In times of rising carbon dioxide (CO2) and climate change, the environmental status of the ocean and the associated services for society are at risk (Cooley et al., 2022). Even more so as the ocean itself takes a crucial role in “[ … ] climate by storing and transporting large amounts of heat, freshwater, and carbon, and by exchanging these properties with the atmosphere.” (Rhein et al., 2013). The Global Ocean Observing System (GOOS) has built a structure that coordinates and supports the entire range of ocean observations centered around Essential Ocean Variables (EOVs) (Moltmann et al., 2019; Snowden et al., 2019; Tanhua et al., 2019). Using the Framework of Ocean Observing (FOO) (Lindstrom et al., 2012), the International Ocean Carbon Coordination Project (IOCCP), as the GOOS expert panel for ocean biogeochemistry (BGC), defined the following eight BGC EOVs (IOCCP, 2017): Inorganic carbon, dissolved oxygen (O2), nutrients, particulate matter, dissolved organic carbon, transient tracers and nitrous oxide (N2O). A primary objective is to quantify their overall inventories, exchange fluxes and concentration trends. Generally, these quantifications advanced during the past decades, but there are still large uncertainties and many unresolved issues due to insufficient availability of BGC observations. To only mention a few examples, (i) ocean carbon sink estimates from ensemble means of global BGC ocean models and observation-based data products have become increasingly dissimilar with an offset of 1.1 GtC yr-1 in 2020 (Friedlingstein et al., 2022); (ii) models and observation-based products disagree on the strength and spatial distribution of deoxygenation (IPCC, 2019); and (iii) estimated contributions of N2O fluxes from O2 minimum zones to the global ocean source range from 4% to 50% (IPCC, 2021).
To gain an improved holistic understanding of the climate and the ocean’s environmental status, large quantities of easily accessible BGC EOV data – that are spatially and temporally well-resolved, of high quality and from multiple and complementing observing platforms – are required. In particular, it is important to make available observational data FAIR (Findable Accessible Interoperable and Reusable), and enhance the value by proper quality control. Hence, the development of BGC data management systems complying with the FAIR guiding principles for scientific data management and stewardship has become more important (Wilkinson et al., 2016; Tanhua et al., 2019b). Continuous global efforts aim for more stream-lined and user-orientated data access systems such as the World Ocean Database (Boyer et al., 2018) and the European Marine Observation and Data Network (EMODnet, Miguez et al., 2019). Further user niches are filled in by community-driven synthesis data products that apply (advanced) merging techniques to combine datasets from multiple sources to form a coherent and consistent data product. These synthesis products are either tailored around specific BGC EOVs (e.g. Surface Ocean CO2 Atlas (SOCAT), the Global Ocean Oxygen Database and Atlas (GO2DAT), the MarinE MethanE and NiTrous Oxide (MEMENTO) database) or specific observing platforms [e.g. the Global Ocean Data Analysis Project (GLODAP)].
Generally, these synthesis data products try to solve many obstacles that the current landscape of BGC data has created. Observing campaigns are mostly funded as research projects and often have very specific research questions. Consequently, a multitude of data centers are managing ocean BGC EOV data. These range from local and national data centers (e.g. the Ocean Science Information System at GEOMAR Helmholtz Center for Ocean Research Kiel; the Information and Data Centre at CSIRO National Collections and Marine Infrastructure) to regional infrastructures (e.g. the Integrated Carbon Observing System (ICOS)) or international data centers (e.g. PANGAEA; CCHDO). Hence, data mining has become increasingly difficult and time-consuming, requiring downloading datasets from different entry points, searching for duplicates, and managing different metadata. Further, BGC EOV data have many users and stakeholders who have highly diverse needs from the data, especially in terms of quality-control (QC). Consequently, a plethora of data versions, file formats and levels of documentation exist (Shepherd, 2018; Miguez et al., 2019; Tanhua et al., 2019). Synthesis data products represent one solution to these data fragmentation issues by the provision of single access points to consistent data and metadata.
Nevertheless, some data are collected but not available: for example, many datasets submitted to SOCAT include atmospheric CO2 measurements that could be useful for air-sea CO2 flux calculations but are not published as part of the official SOCAT product. Similarly, some ship-based instruments have an O2 sensor, but the measurements are not processed or archived anywhere. In addition, automated datastreams are uncommon for, in particular, reprocessed or delayed mode data. Such data has passed additional quality control, is characterized by high precision and accuracies and represents data with sufficient quality for climate studies. As a result of the lack of automation, the information exchange between multiple data systems, i.e. interoperability (ISO/IEC/IEEE, 2017), is also limited. These relatively low levels of interoperability hinder data reuse, preservation and integration, and increase associated data management costs (Snowden et al., 2019). The lack of automation also results in large elapsed times from the actual measurement to the provision of the data, i.e. in a high latency.
Thus, the many data synthesis efforts are far from complete and in “the era of big data comes to oceanography” (Abbott, 2013) there is a mandate for optimizing fit-for-purpose data synthesis products and their underlying workflows to enhance efficient and interoperable data usage (Tanhua et al., 2019b). The FOO readiness level concept (Lindstrom et al., 2012) becomes useful in this context. Applying it to existing BGC EOV products could guide both existing and new products in their development. Here we introduce such an evaluation framework for four existing BGC EOV data synthesis products: SOCAT, GLODAP, MEMENTO and GO2DAT. We first describe the methodology for assessing the products before the four BGC data synthesis products are briefly presented and their maturity is assessed. Finally, we synthesize the findings and outline our vision of a larger-scale cross-platform BGC EOV data system.
2 Method
2.1 The FOO readiness level concept
To assess the maturity of an ocean observing system the Framework of Ocean Observing has adapted the technical readiness level, a scheme developed by NASA (National Aeronotics and Space Administration) (Sadin et al., 1989), and introduced the ocean observing “readiness level” (Lindstrom et al., 2012). Following this framework, ocean observing should be seen as “[ … ] a chain of processes addressing “why to observe?” (requirement setting process), “what to observe?” (scoping of observational foci), “how to observe?” (coordination of observing elements), and “how to integrate, use and disseminate observational outcomes and understand their impacts?” (data management, analyses and creation and assessment of information products).” (Pearlman et al., 2019). The three pillars of this ocean observing value chain 1are: “Requirements”, “Observations” and “Data and Information”. For each of these pillars, FOO defined nine readiness levels and grouped these into the categories “Concept”, “Pilot” and “Mature”. A holistic approach enables the evaluation and classification of an entire ocean observing system in terms of feasibility, capacity, and impact. Here we only use the defined readiness levels for “Data Management and Information Products” (Figure 1). We restrict ourselves to climate quality data since these are strongly tied to high-quality BGC EOV synthesis data products, especially to their quality control procedures.
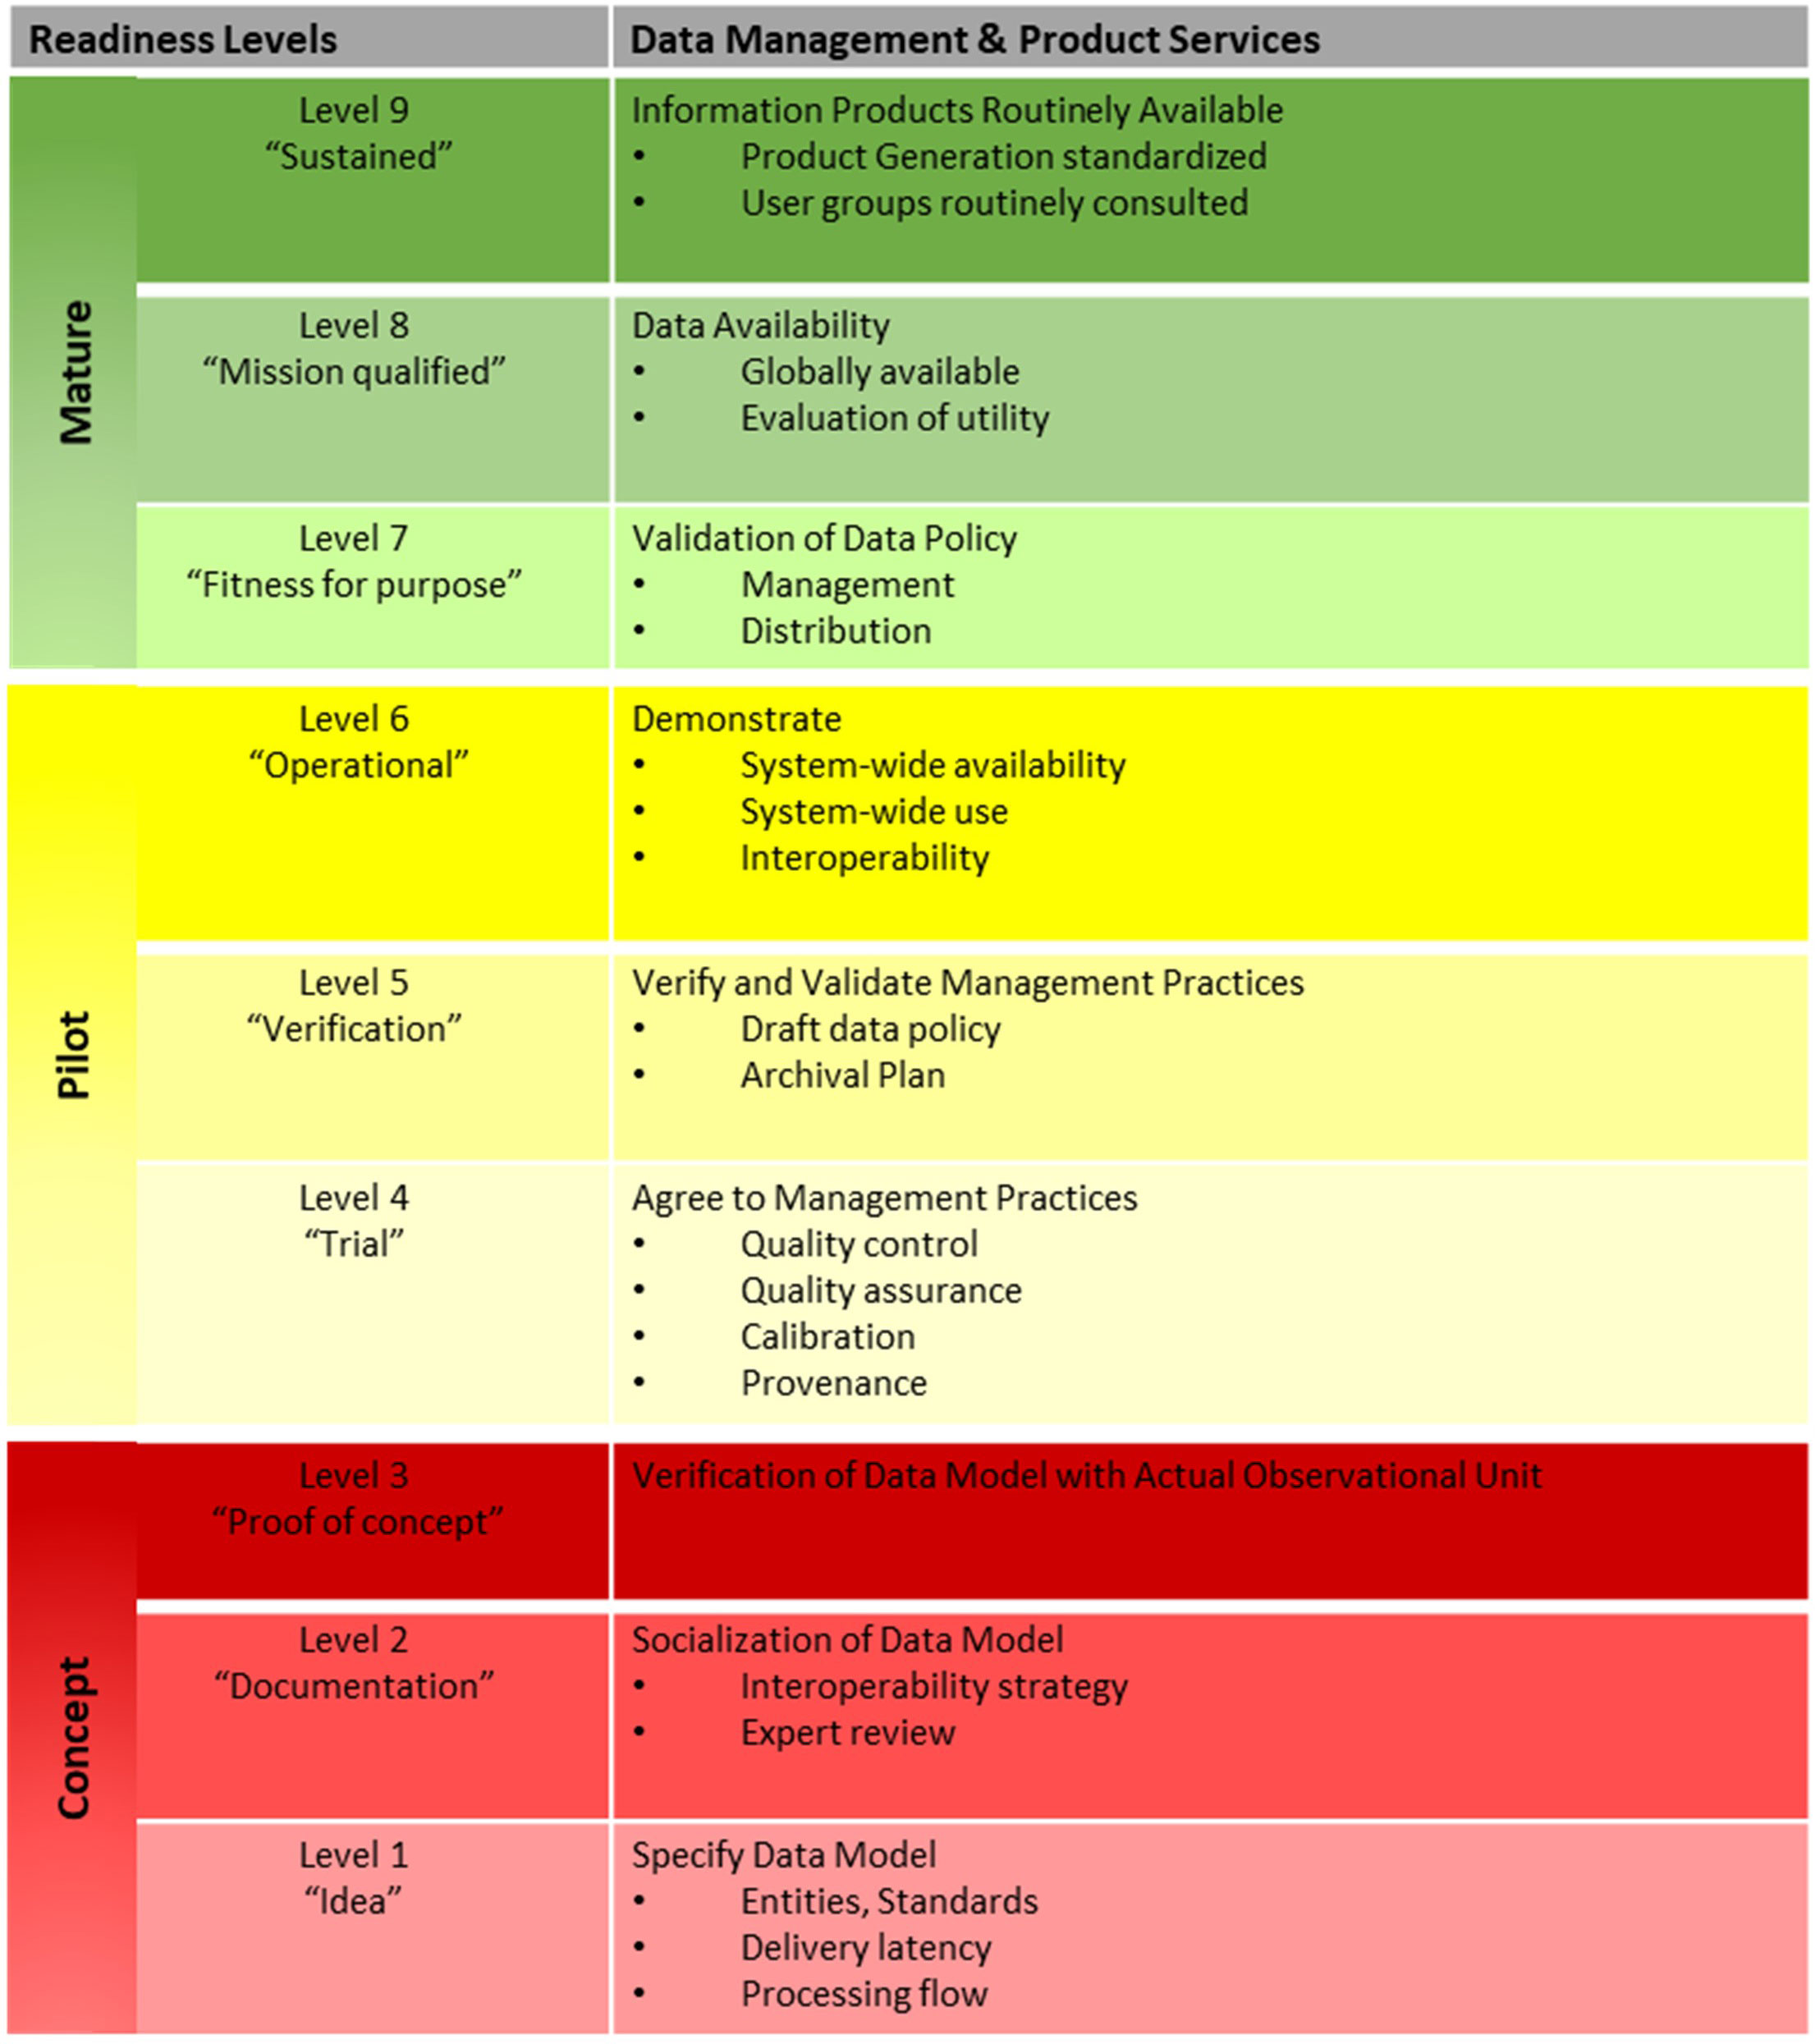
Figure 1 FOO Readiness level for Data Management and Information Products, adapted from Figure 9 in Lindstrom et al. (2012).
The nine readiness levels (Lindstrom et al., 2012) are quite general, so to suit the aim of this work, we have developed a criteria catalog (Appendix 1) which forms an objective basis for the evaluation of the individual data products. Applying the catalog assigns (weighted) scores to typical characteristics of data products on a level-by-level scheme. Full compliance with the criteria yields a 100% score for a given level, with 80% being defined as a “pass”. For example, a product passes readiness level 5 if the data management practices are verified and validated through an existing data policy and archival plan. The criteria catalog (Appendix 1) assigns equally weighted scores to “Policy”, “Archival” and “QC Verification”. These, in turn, are linked to specific data product features, such as having a data usage statement for “Policy” (Figure 2). Note that even though the order of levels is structured hierarchically, a data product can meet some requirements of higher levels before fully complying with all lower levels. Since the maturity of a data product is strongly tied to the FAIR guidelines, we have incorporated the guidelines into the criteria. Following Tanhua et al. (2019), a data product is FAIR if it has a unique persistent identifier with enriched and standardized metadata (findable), enabling access to the machine-readable data and metadata (accessible and interoperable), and can be integrated into other data sources (reusable). The degree of the implementation of the FAIR principles is reflected in the order of the FOO readiness levels. The degree of being “fit-for-purpose”, a requirement of the ocean observing value chain, is also incorporated into the criteria catalog.
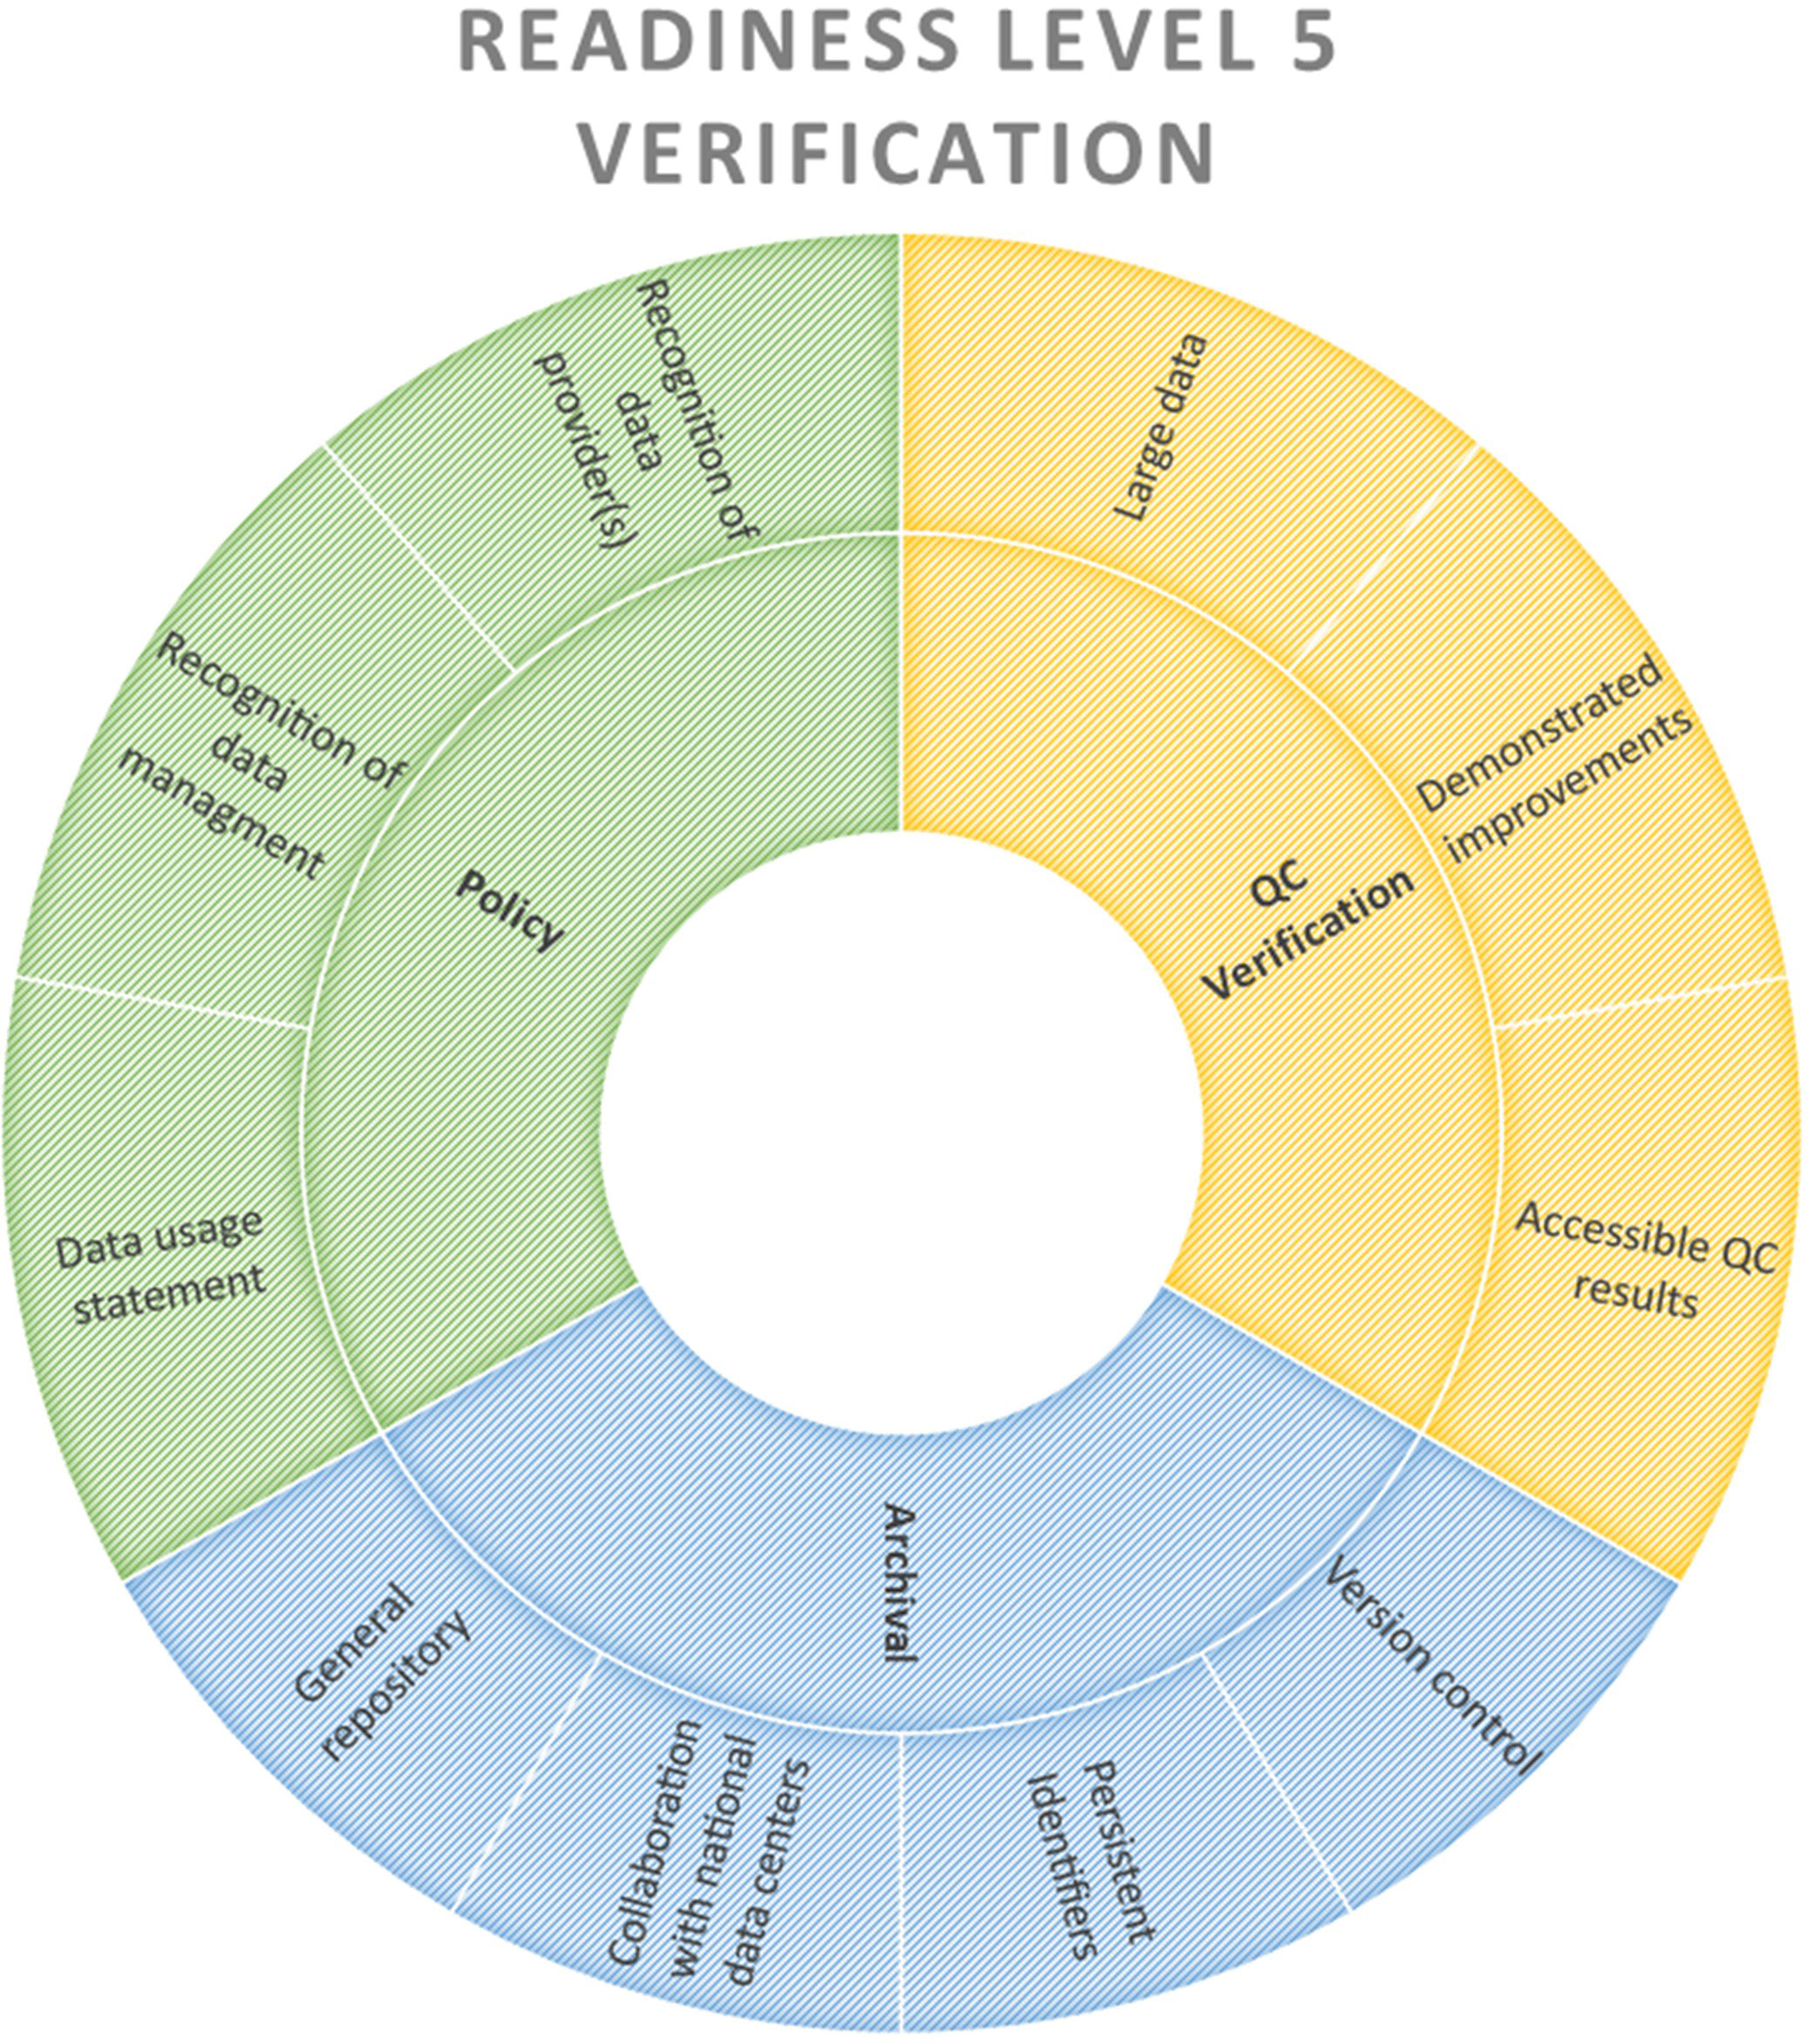
Figure 2 Score assignment scheme for readiness level 5 (Verification).
Given the diverse nature of the data, the criteria have not been further specified and are kept generic on purpose. Workflows and tools used in different products might resemble one another but are tailored toward the specific requirements of the data products. In particular, the data upload (or ingestion) system and quality control methods differ as these are tailored towards the given observing platform, sampling method (continuous or discrete), analysis type, variable (e.g. Johnson et al., 2001; Dickson et al., 2007; Pierrot et al., 2009; Maurer et al., 2021) and stakeholder. Since many research groups and products implement different QC flagging schemes, we have applied a consistent set of quality levels (adapted from ICOS, https://www.icos-cp.eu/data-services/data-collection/data-levels-quality) to describe the data flow and QC of the different products (Table 1). Typical QC examples of the different levels are range tests (level 1), the identification of spikes in space or time (level 2) and the adjustment of known biases (level 3).
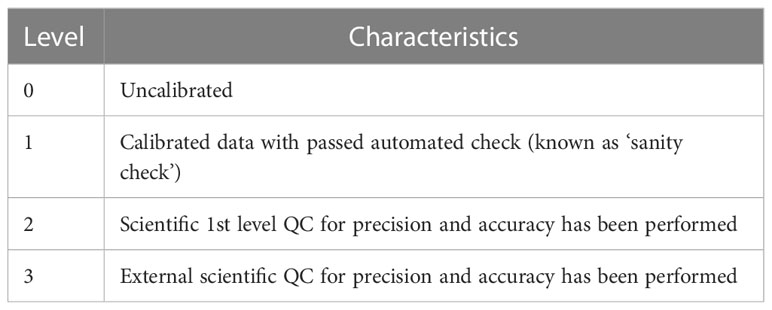
Table 1 Data quality levels.
3 Synthesis data product assessment
In the following, we will briefly describe and evaluate four available BGC EOV data synthesis products for their maturity in terms of FOO readiness. The products were selected based on the goal of covering the entire BGC EOV data synthesis product spectrum. The products cover different BGC EOVs, observing platforms and approaches (cross-platform vs. cross-EOV) and range from products in the planning phase to well-established ones.
3.1 SOCAT
The Surface Ocean CO2 Atlas (Pfeil et al., 2013; Sabine et al., 2013) is an international community-driven effort. It synthesizes in-situ surface ocean fCO2 (fugacity of carbon dioxide) measurements from ships, moored stations, autonomous and drifting surface platforms and yachts with an estimated accuracy better than 10 µatm. SOCAT increases ocean surface fCO2 data availability and forms the basis of several other data products, such as the SeaFlux data set (Gregor and Fay, 2021) and diverse scientific applications and assessments. The latter range from ocean and climate model and sensor evaluation, regional process studies of surface ocean fCO2, the detection and estimation of surface ocean acidification trends (Freeman and Lovenduski, 2015; Lauvset et al., 2015), to the quantification of the ocean carbon sink and its variation (Bakker et al., 2016; Friedlingstein et al., 2022). Thus, SOCAT represents a “[ … ] key step in the value chain based on in situ inorganic carbon measurements of the oceans, which provides policymakers in climate negotiations with essential information on ocean CO2 uptake” (Bakker et al., 2020; Guidi et al., 2020). SOCAT’s first version (Pfeil et al., 2013; Sabine et al., 2013), was released in 2011 following a call from the international marine carbon community to create a quality-controlled, publicly available synthesis product of surface ocean CO2 for the global oceans and coastal seas (IOCCP, 2007; Doney et al., 2009). SOCATv2 and SOCATv3 followed in 2013 (Bakker et al., 2014) and 2015 (Bakker et al., 2016), respectively. After the official launch of the SOCAT submission system in September 2015 (SOCAT and SOCOM, 2015), annual product releases have been accomplished. SOCATv2022 includes more than 40 million individual measurements from 1957 to 2021 from more than 100 data contributors (Bakker et al., 2022). The data product consists of 1) the collection of all individual data set files, 2) global and regional synthesis data products, 3) global (monthly, yearly and decadal) gridded products on a 1° latitude by 1° longitude grid and 4) a coastal monthly gridded product on a quarter degree grid. The main synthesis products (2, 3, 4) are based on surface water fCO2 with an estimated accuracy of better than 5 µatm (33.7 million data points), while fCO2 values with an accuracy of 5 to 10 µatm are made available separately (6.4 million data points). Recent SOCAT products contain searchable information on the organization where data providers are based, a step towards attributing data sets to funding agencies and countries.
While SOCAT synthesis products are made available via ERDDAP (Section 4.1.1.1), metadata of individual data sets in SOCAT are not yet machine-readable. Planned metadata automation will contribute to the initiative led by the Intergovernmental Oceanographic Commission of UNESCO towards a federated data system for the UN Sustainable Development Goal (SDG, UN, 2015) 14.3 (“Minimize and address the impacts of ocean acidification, including through enhanced scientific cooperation at all levels”). SOCAT also considers to include additional variables to the product, such as atmospheric CO2, dissolved inorganic carbon (DIC), total alkalinity (TA), pH, nutrients, methane (CH4) and nitrous oxide (N2O) concentrations (SOCAT and SOCOM, 2015; Bakker et al., 2016).
3.1.1 Software developments
3.1.1.1 ERDDAP
The open source software ERDDAP is used as the backbone for SOCAT data quality-control as well as providing access to data and data product. To effectively improve data interoperability, it is not enough to ensure that data are freely and openly available, though both are necessary. To reach a more diverse set of users, including domain and non-domain experts, it is critical to provide effective data services that are easy to use, support multiple data formats, and provide access to humans and machines. One tool that provides all of these capabilities is the open source software ERDDAP.
There are several benefits of using ERDDAP as a data server. Among its many features, it (i) supports dozens of popular formats; (ii) provides standards-based metadata and data services and formats; (iii) supports federated access of distributed ERDDAP data services; (iv) supports both human and machine interactions; (v) supports sub-setting of large datasets; (vi) provides improved discovery of datasets through commercial search engines; and (vii) provides support for archival of datasets. The GOOS Observations Coordination Group has adopted ERDDAP as the FAIR-compliant data server of choice for the global ocean networks.
Serving data through a tool such as ERDDAP may also help better understand data access patterns. The most accurate method of understanding data usage relies on citations, particularly when using Digital Object Identifiers (DOIs). Using a tool such as ERDDAP also make it possible to gather usage statistics on how data is being accessed, which is a useful additional metric towards a more complete and accurate view of data usage. The usage tracking capabilities of ERDDAP can thus provide a mechanism to track user access, which can largely eliminate the requirements for users to log in.
3.1.1.2 QuinCe
The European Research Infrastructure ICOS is developing QuinCe (Steinhoff et al., 2019), as a standardized online tool to ingest, process and QC underway surface ocean fCO2 measurements from diverse instruments using community-agreed algorithms. While presently QuinCe is only available to a few data providers, in future it will allow data providers to process their data transparently. That includes a record trail that links all applied changes to the original data, i.e. full data provenance is established. QuinCe can automatically export all data in several formats to data centers, near-real-time products, delayed mode products, and the SOCAT data submission system (or dashboard). QuinCe also automatically performs calibrations, data processing, and basic QC of underway instrument data from different platforms (allowing all text formats as input). An interactive user interface with time-series plots, cruise maps and a data table enables the data provider to perform detailed manual QC (Figure 3). The interactive control also enables additional manual scientific 1st QC, i.e. outlier detection, of the level 1 fCO2 data, which results in level 2 fCO2 data (World Ocean Circulation Experiment flagging scheme applied). For future traceability, QuinCe records all QC decisions.
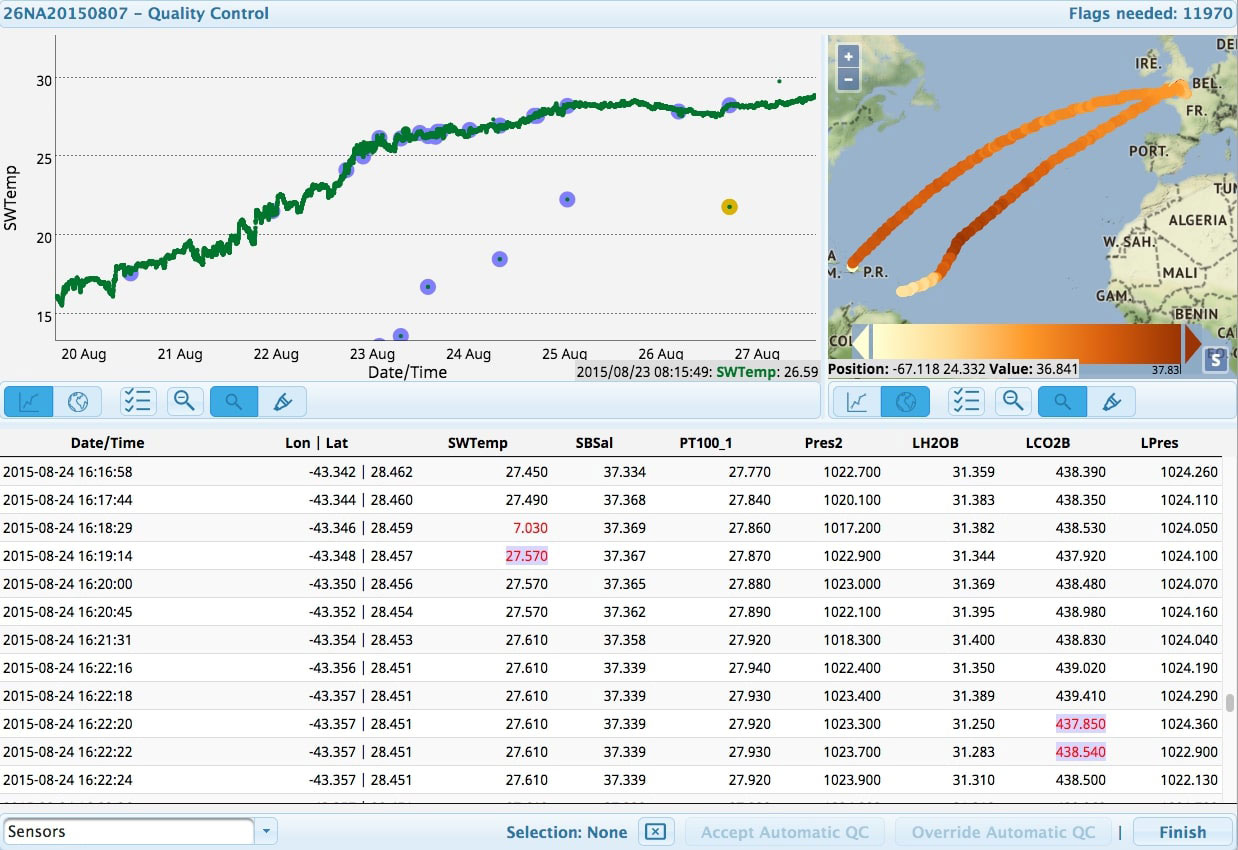
Figure 3 A screenshot of the main Quality Control page of QuinCe, showing data from sensors in plot and map form together with a table of all sensor and calculated values. Flagged values from automatic and manual QC are highlighted.
3.1.2 FOO readiness
SOCAT has implemented a clear concept and management structure “[ … ] to integrate, use and disseminate observational outcomes and understand their impacts [ … ]” (Pearlman et al., 2019). SOCAT’s well-documented data-flow concept includes all processes from archival to provision yielding (machine-readable) entities with common standards, e.g. common data formats and units. It has been tested and applied to several fCO2 observing platforms, resulting in 100% scores for readiness levels 1-3 (Figure 4).
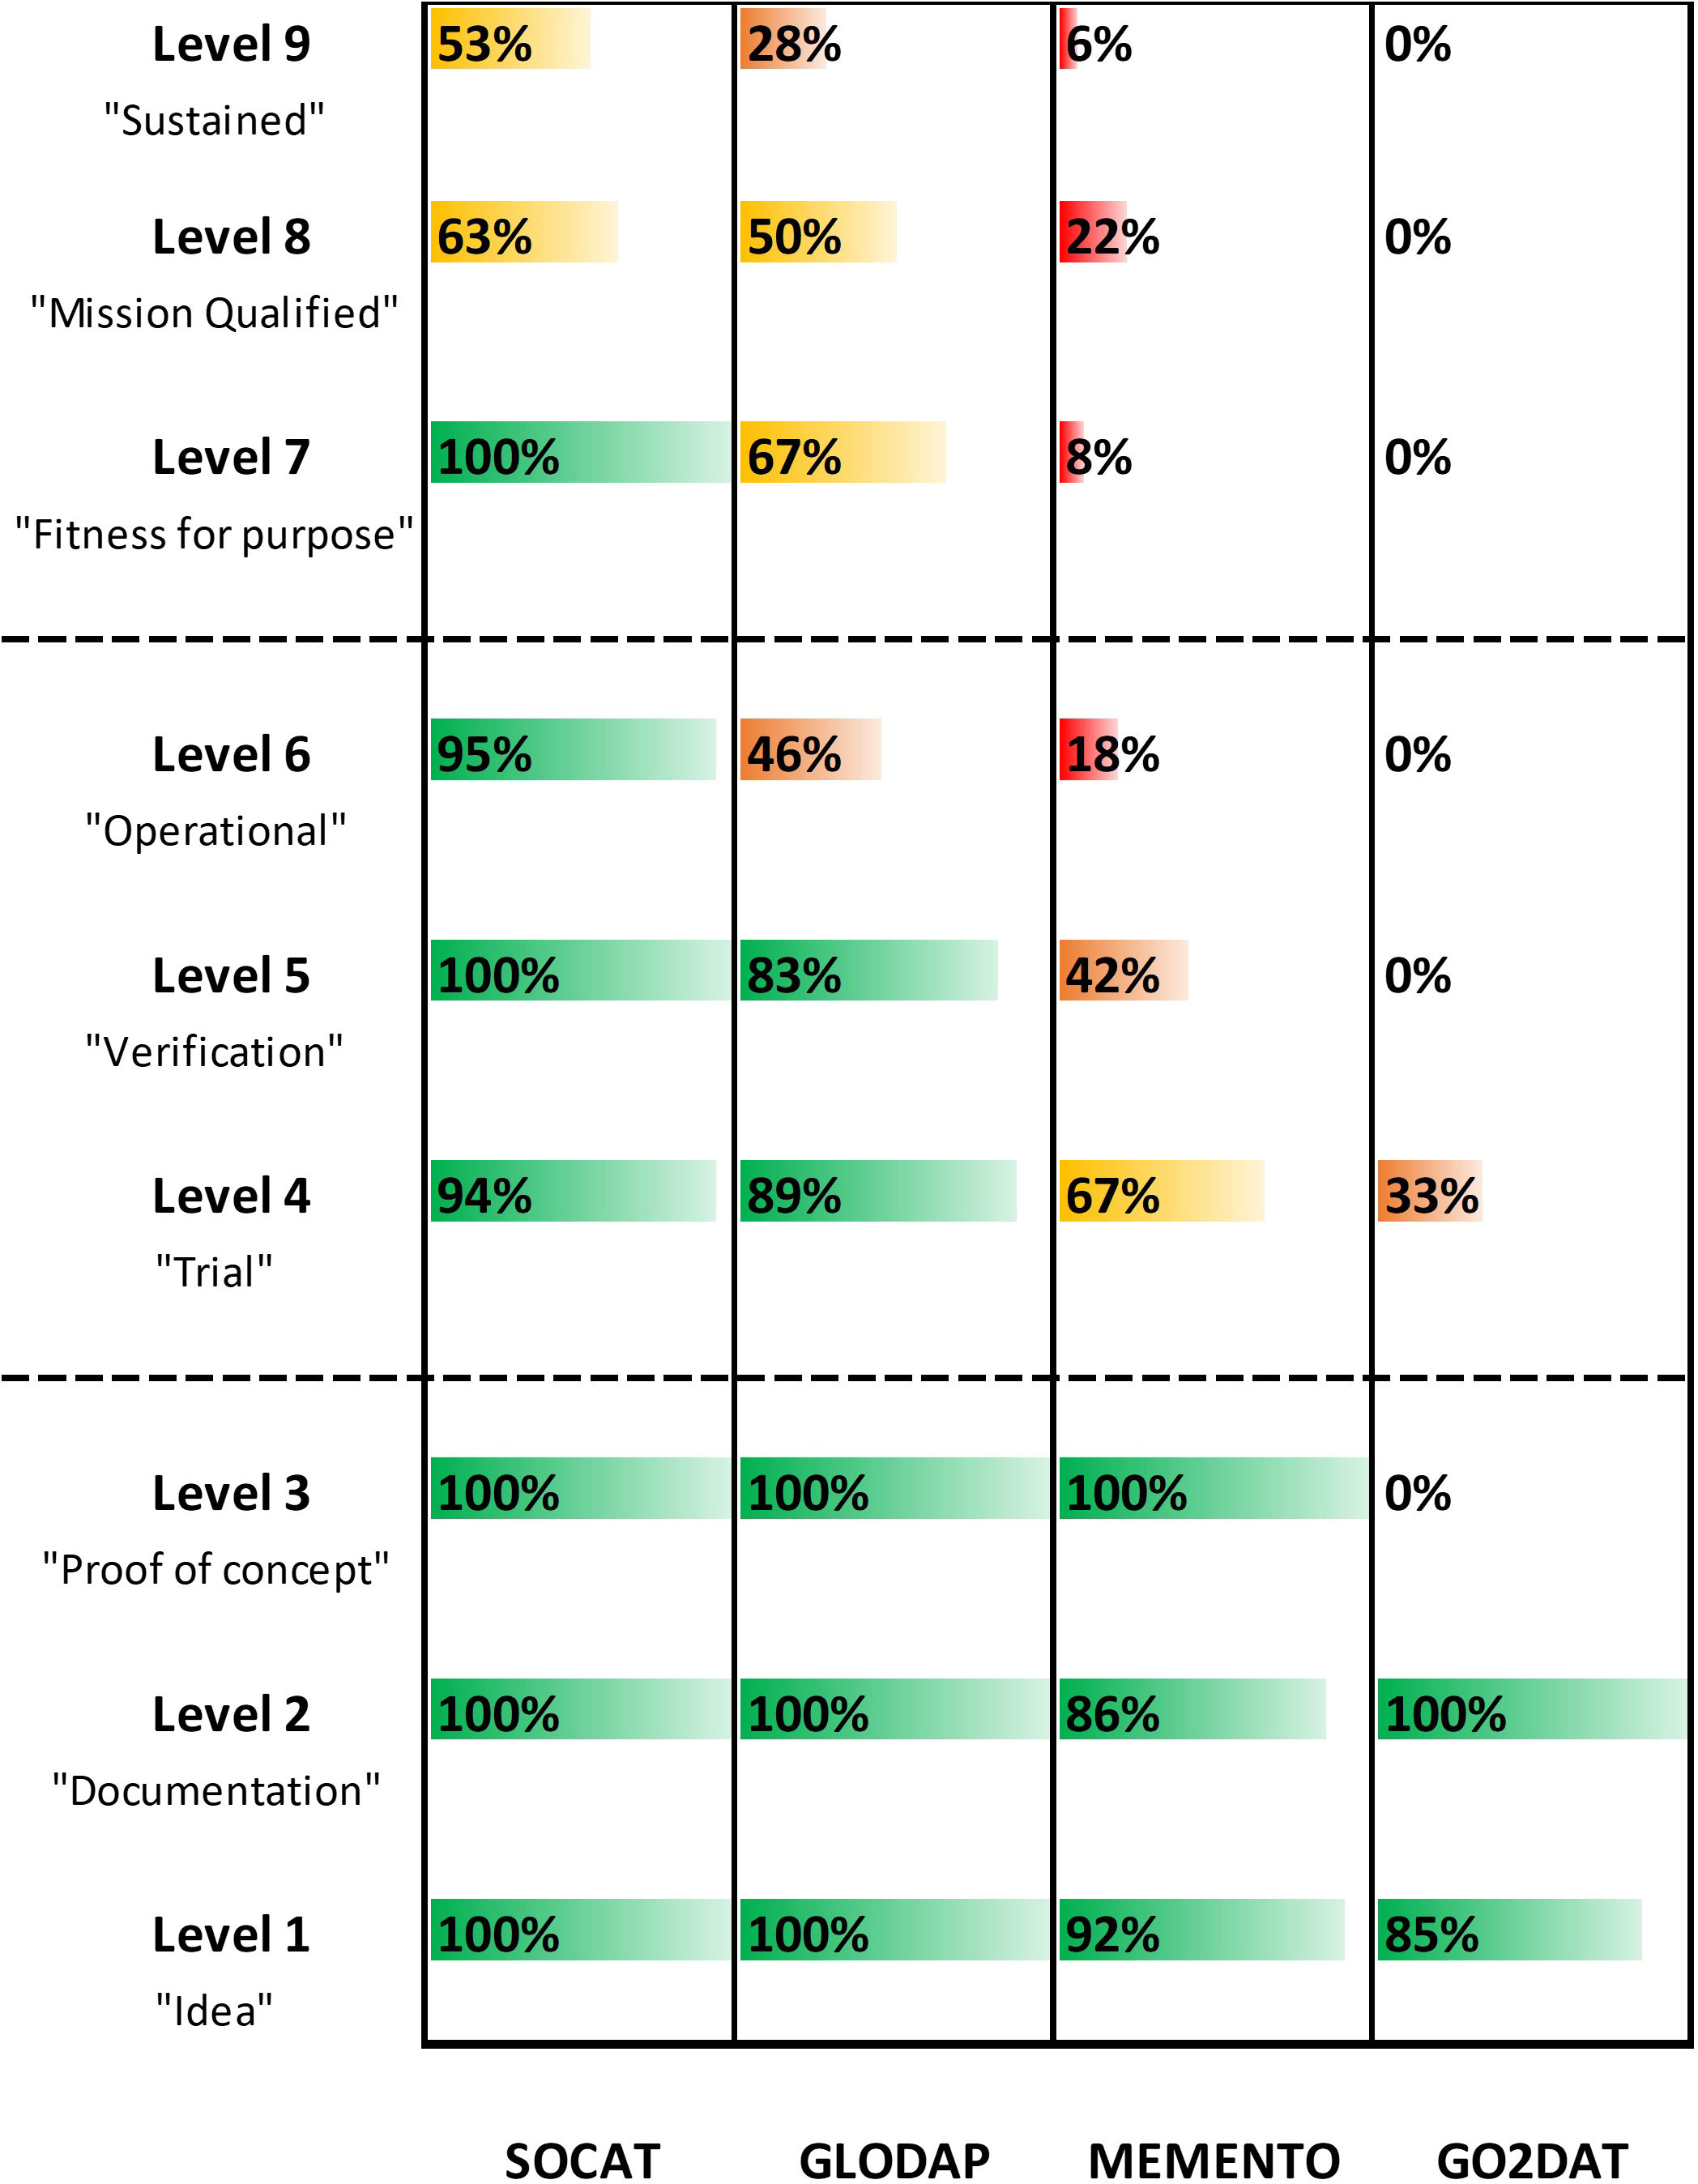
Figure 4 FOO readiness level scores of SOCAT, GLODAP, MEMENTO and GO2DAT. Green (> 80%); yellow (51% – 80%); orange (25% - 50%); red (<25%).
A best practice protocol and cook-books for the different procedures exist (Dickson et al., 2007; Wanninkhof et al., 2013; Bakker et al., 2016; Lauvset et al., 2018). The seamless data integration, data flow (SOCAT dashboard) and data extraction (Live Access Server, ERDDAP) enable version-controlled data archival and provision. This seamless data managment also enables traceable data calibration and quality control (level 1-3). Moreover, clearly outlined and defined criteria for the external QC (expert panel), i.e. 2nd QC, exist and the thorough metadata requirements enable the assignment of uncertainty categories. The growth of fCO2 data points in successive SOCAT versions and the widespread use of the SOCAT synthesis products have verified the data management practices. 40 million data points from multiple fCO2 platforms show the system-wide use- and availability of SOCAT’s data streams. Further, the recent availability of SOCAT data through ERDDAP achieves high interoperability and in combination with the SOCAT front end, SOCAT has demonstrated making fCO2 data FAIR and operational. SOCAT has passed the “Pilot” phase with scores higher than 94% for readiness levels 4 – 6. To obtain a 100% score for readiness level 4, improved data quality control for the accompanying variables, e.g. surface salinity is still needed. Also, SOCAT could benefit from a fully encompassing and transparent uncertainty propagation estimation (Merchant et al., 2017) instead of the presently “post-assigned” accuracy categories.
SOCAT’s high level of automation sets it apart from other products. This process begins with a web-based data submission tool that allows scientists to submit data to the SOCAT system using the formats they are familiar with – typically ASCII/CSV files. This is critical as it allows the data producers to interact with the SOCAT system without having to convert their data to complicated formats. The overall effect is to lessen the workload of the data providers, data managers and quality controllers. Once submitted and quality-controlled, data are accessible through easy-to-use interactive viewers and access to the various gridded products is also available. Through regular provision of global FAIR fCO2 data to “down-the-line” end-user services, such as the Global Carbon Budget (e.g. Le Quéré et al., 2018; Friedlingstein et al., 2022), SOCAT is a key step in the value chain of the EOV inorganic carbon (Guidi et al., 2020). It contributes to the ocean carbon sink’s quantification and our understanding of ocean acidification. SOCAT thus addresses the United Nations Framework Convention on Climate Change Paris agreement and the UN SGD 14.3 (ocean acidification). Being used for numerous applications and cited 792 times (since 2013; Google Scholar) as of March 2023, prove SOCAT’s utility and that it is fit for purpose. Altogether this yields a 100% score for readiness level 7. However, the evaluation of SOCAT’s utility could strongly benefit from implementing enhanced data usage metrics (Section 4.1.1.1). Also, the existence of seasonal biases (more summer data) and regional gaps (e.g. Southern Ocean), even though mainly linked to the FOO components “Requirements” and “Observation”, leave room for improvements towards a full “Mission qualified”, resulting in a 63% score for readiness level 8. Lastly, even though SOCAT has standardized the product generation, erased many bottlenecks in the data stream and is a community-driven product with constant interaction with the data providers, SOCAT is not yet a sustained data product. Above all, this is due to the non-sustained and ad-hoc funding situation.
Additionally, the lack of easily available tools for transforming raw data from instruments and sensors into a state suitable for inclusion in SOCAT is only now starting to be addressed through efforts such as QuinCe (Section 4.1.1.2), leading to an intermediate score for readiness level 9 (53%). Wide spread adoption and integration of tools like QuinCe could help enhance machine-to-machine data submission into products like SOCAT, eliminating many of the manual processes currently required.
3.2 GLODAP
The Global Ocean Data Analysis Project was initiated to enable the quantification of the anthropogenic ocean carbon sink (e.g. Key et al., 2004; Sabine et al., 2004; Gruber et al., 2019). To this end, GLODAP focuses on collecting and synthesizing interior ocean data from hydrographic cruises with carbon-relevant data. GLODAP defines carbon-relevant as data that includes at least one measurement of the following: inorganic carbon sub-variables (pH, DIC, TA and/or fCO2), carbon isotopes (C14 and/or C13) or transient tracers (CFC11, CFC12, CFC113, CCl4 and/or SF6). Through multiple layers of quality control, aiming to remove biases between cruises, GLODAP makes cruise data from various sources, from individual projects to numerous larger campaigns, consistent and comparable. With its high internal consistency of the core variables (DIC, TA, pH, nutrients, O2, salinity and transient tracers), particularly of DIC and TA (± 4 µmol kg-1), GLODAP has also become a relevant source for other scientific applications and observing platforms. One prominent example is BGC Argo floats, which rely heavily on GLODAP’s high-quality data for validation. The first version of GLODAP, GLODAPv1 (Key et al., 2004), was released in 2004. It mainly included data from the World Ocean Circulation Experiment and Joint Global Ocean Flux Study campaigns as well as other historical cruise data from the Geochemical Ocean Sections Study, Transient Tracers in the Oceans, South Atlantic Ventilation Experiment, and INDIen Gaz Ocean expeditions. In combination with the CARbon dioxide IN the Atlantic Ocean (CARINA) product (Tanhua et al., 2009; Key et al., 2010) and the PACIFIc ocean Interior CArbon (PACIFICA, Suzuki et al., 2013) product, “[ … ] these products formed the natural basis for GLODAPv2” (Key et al., 2015; Olsen et al., 2016). Version 2 benefitted from advancements in data handling, which eventually enabled yearly updates starting in 2019. In addition to the annual updates, GLODAP plan to provide regular full decadal version releases, in concert with the GO-SHIP program (Olsen et al., 2019; Sloyan et al., 2019; Olsen et al., 2020; Lauvset et al., 2021). GLODAPv2.2022 (Lauvset et al., 2022) includes more than 1.4 million samples from 1085 cruises from 1972 to 2021. The data product consists of three pillars: 1) data from the individual cruises in a consistent format with coherent QC and unit conversion, 2) a bias-adjusted data product, and 3) a global 1°x1° mapped climatology. The latter is produced only for the full version releases (the last of which was in 2016).
For the future, “[the] GLODAP team now strive for advancements on two fronts towards a semi-automated system that reduces the work intensity and associated errors. Firstly, implementing a uniform, semi-automatic and standards-compliant data ingestion system that will facilitate the data submission and quality control (QC) procedures. [ … ] Secondly, upgrading to a modern and versatile data extraction system that provide users more flexibility and options [ … ] “(Tanhua et al., 2021).
3.2.1 FOO readiness
GLODAP has implemented a clear concept and management structure as well as a well-documented data flow, which includes all processes from archival to provision. Its entities apply the common World Ocean Circulation Experiment standards, i.e. have common and consistent data formats, units and semantics. The complete data flow has been tested and applied to 14 core variables for more than 1000 cruises, resulting in 100% scores for readiness levels 1-3 (Figure 4).
Best practice protocols and standard operating procedures for the observations of the core parameters exist and are well-established (GO-SHIP). Also, the applied interpolation and calculation schemes follow the most recent literature recommendations. The application of multiple tools, including the AtlantOS QC software (Velo et al., 2021), the crossover toolbox (Tanhua et al., 2010; Lauvset and Tanhua, 2015) and comparisons to CANYON-B (Bittig et al., 2018) combined with annual expert meetings, an online adjustment table and a consistent flagging scheme, yield a traceable and system-wide quality control (level 1-3). The improvement in consistency is further given and documented for each product. The strong and exponential data point growth has verified the data management practices and shows GLODAP’s system-wide use and availability. However, to completely pass the pilot phase several shortcomings must be dealt with. First, one inorganic carbon sub-variable (fCO2) and one carbon isotope (delC14, i.e. radiocarbon content expressed in Δ14C notation) are not subject to 2nd QC. Further, the data ingestion system is dependent on rather rudimentary communication by email and the collaboration with local data centers is not all-encompassing and automated. This dependency on manual work in the ingestion system results in deficits in the version control of the original data, which in turn leads to some archived data being out of synchronization with GLODAP. Data access services and machine-readable metadata, both crucial for full interoperability, are also not incorporated in the data flow. Lastly, the given consistency estimates might be closely linked to uncertainty assignments, but they are not the same and an encompassing and transparent uncertainty estimation is still warranted. GLODAP passes Level 4 and 5 with scores of 89% and 83%, but the missing features are especially punished in level 6 “Operational” with a mediocre score of 46%.
Regarding the more mature levels, GLODAP still obtains relatively high scores. Most of all GLODAP has proven its utility and to be fit-for-purpose being cited 641 times (since 2016; Google Scholar) as of March 2023 and being used for multiple end-user services. Most prominently, GLODAP has become the primary data source for quantifying the ocean carbon sink (Sabine et al., 2004; Gruber et al., 2019; Friedlingstein et al., 2020). The Cruise Summary Table and a fair usage statement ensure that the data provider’s credibility is maintained. Nevertheless, mainly the relatively low level of automation in combination with no sustained funding hinder higher scores for all three “Mature” levels with 67%, 50% and 28% for level 7 – 9, respectively.
3.3 MEMENTO
The MarinE MethanE and NiTtrous Oxide database compiles N2O and CH4 measurements and - if available - associated data (such as atmospheric mole fractions, water temperature, salinity, dissolved O2 and nutrients) from the open and coastal oceans. It provides calculated global and regional concentration fields for the surface and deep ocean in common units and estimates of the air-sea flux density of both gases. Initially starting with a database for N2O only (Freing and Bange, 2007) a joint initiative between the Surface Ocean Lower Atmosphere Study and European CoOperation in Science and Technology Action 735 (European CoOperation in the Field of Scientific and Technical Research) resulted in the development of MEMENTO (Bange et al., 2009). MEMENTO’s main rationale is to help researchers to quantify the temporally and spatially variable N2O and CH4 oceanic distributions and their exchange with the atmosphere. N2O and CH4 are important atmospheric trace gases that act as strong greenhouse gases in the troposphere and as precursors of ozone depletion in the stratosphere (WMO, 2018; IPCC, 2021). The MEMENTO data product was used, for example, to model N2O production and consumption processes on global and regional scales (Freing et al., 2012; Suntharalingam et al., 2012; Zamora et al., 2012). Recently, data from MEMENTO were also used to estimate the global N2O and CH4 emissions from the ocean (Weber et al., 2019; Yang et al., 2020). Being publicly available since 2009, MEMENTO cooperates with the Scientific Committee on Ocean Research working group 14.3 since 2014. By November 2021, MEMENTO included more than 120000 N2O and more than 23000 CH4 measurements from over 200 measurement campaigns covering the past 57 years of observations.
Besides the ongoing data update, MEMENTO wants to “continuously improve it by including additional meta-information, allowing additional data formats, and implementing new data quality control criteria.” Further goals include the implementation of “[ … ] standard procedures that are developed within the [SCOR] working group for measuring N2O and CH4.” (Kock and Bange, 2015) and an enhanced data archive structure that is more user-friendly.
3.3.1 FOO readiness
MEMENTO has implemented a clear concept, management structure and data flow, successfully applied to both core parameters. Scores of 92%, 86% and 100% for readiness levels 1-3, respectively, reflect that MEMENTO meets most of the required concept phase criteria. Most importantly, all entities, including original data and metadata, are provided using common standards (format, semantics and units). 100% scores are not obtained because MEMENTO misses two features that are relevant for interoperability. First, the data are not openly available and require registration. Second, MEMENTO’s data management concept does not include archiving original data sets (such as bottle files, etc.) of individual cruises. Still, MEMENTO clearly passes the concept phase.
With a strong emphasis on the consistency and quality of the included data, MEMENTO meets all QC and quality assurance requirements of readiness level 4. But the important and heavily weighted traceability of applied changes, i.e. the provenance criteria, is not fulfilled. This missing feature, which limits the level 4 score to 67%, means that MEMENTO has not passed the first pilot phase level. Readiness levels 5 and 6 reveal further shortcomings of MEMENTO regarding the pilot phase criteria. These include the lack of transparency and verification of the QC, limited archiving features, lack of established links to data centers and version control, as well as the lack of interoperability. Especially the latter strongly affects level 6 scores, which in turn is heavily influenced by the missing DOI of the product. MEMENTO stays below the 50% mark for both levels with 42% and 18%.
Nonetheless, MEMENTO already meets some of the crucial criteria of the higher “Maturity” levels. It has addressed its societal drivers and is cited 89 times (since 2009; Google Scholar) as of March 2023. Moreover, it does provide a gridded product covering the entire globe. However, the low level of automation and other deficits, such as relatively low utility scores and non-sustained funding, strongly limit the scores for readiness level 7-9, with all levels being below 25%.
3.4 GO2DAT
The main scientific rationale of the Global Ocean Oxygen Database and ATlas (GO2DAT) lies in the understanding and prediction of ocean O2 changes at daily to climate scales: “A better knowledge base of the spatial and temporal variations in marine O2 will improve our understanding of the ocean O2 budget, and allow for better quantification of the Earth’s carbon and heat budgets, net global primary production and for adopting sustainable fisheries and aquaculture management.” (Grégoire et al., 2021).
The first version of GO2DAT is “under construction”, but in the recently published roadmap towards GO2DAT (Grégoire et al., 2021), the GO2DAT team envisions a consistent and FAIR cross-platform database that targets all available O2 measurements from the coastal and open ocean from both Eulerian and Lagrangian platforms. Thus, GO2DAT shall include O2 measurements from ships (Winkler data and CTD-O2 sensor data), Argo floats, gliders, moorings, underway sensors and benthic boundary layer data. To tackle the lack of uniformity in data treatments a key characteristic of GO2DAT will be the definition of a “community-agreed, fully documented metadata format and a consistent quality control procedure and quality flagging (QF) system”. In addition to the database, several regularly updated “stacked” gridded products of O2 concentration, O2 partial pressure (pO2) and the degree of saturation with respect to atmospheric O2 for the coastal and global ocean with sub-seasonal to multi-decadal resolution, are planned.
GO2DAT datasets and products will improve our understanding and estimation of the deoxygenation trend and mechanisms. Since 1950 the open ocean O2 content has decreased (medium confidence) by a few percent (i.e. 0.5-3%) (IPCC, 2019) and the Oxygen Minimum Zones, which are permanent features of the open ocean, are expanding. However, models and observation-based products disagree on the amount and spatial distribution of deoxygenation. Different data sets and mapping procedures explain only part of these differences. In the global coastal ocean, the reference distribution of hypoxic sites is that assembled by Diaz and Rosenberg (2008), showing the worldwide distribution of regions affected by hypoxia at least once, as referred to in the literature. This effort has been valuable but should be updated and amended with the large volume of (sometimes disparate) quantitative information on coastal O2 concentrations, including inventories of the frequency, timing, duration, intensity and spatial extension of the hypoxic events, and links to the original data contained in a globally accessible database.
3.4.1 FOO readiness
Given the recently published community-agreed roadmap (Grégoire et al., 2021), GO2DAT already passes the readiness levels 1 “Idea” and 2 “Documentation”. The roadmap describes in detail the encompassing entities and the data flow. The ingestion and archival system are clearly outlined and envisioned to build upon synchronized two-way data links between existing assembly centers (e.g. national data centers or regional hubs such as EMODnet) and an envisioned GO2DAT global data assembly center. The importance of metadata is emphasized in that “GO2DAT will ensure that data in each level are assigned an uncertainty and that sufficient metadata to interpret this uncertainty exists [ … ] to assess the suitability of the data for a particular purpose (e.g. mean state, variability, climate trend assessment).” (Grégoire et al., 2021). Similarly, the need for automated assignment of persistent identifiers (i.e. DOIs) to submitted datasets, enabling data tracking and download statistics, is described. The envisioned data flow features that will ensure interoperability are also depicted. These include detailed descriptions on the harmonization and standardization procedures and also general concepts of the envisioned QC. The GO2DAT team formulates its aim of annual releases of synthesized and mapped O2 data, including sub-products restricted to a defined set of O2 measuring techniques. The team also describes an envisioned interactive web platform, including data visualization tools, where the data products are easy to find and openly accessible. This front-end is envisioned to foster communication between users, data generators and product developers, directly implementing the FOO feedback cycle. The well-documented concept results in 85% for readiness level 1 and full compliance, i.e. 100%, for level 2. However, the concept idea has neither been proven nor verified yet. Hence, GO2DAT does not comply with any criteria of readiness levels 3 and above, except that quality assurance protocols for all targeted O2 observing platforms exist (33% for readiness level 4).
4 Discussion and conclusion
4.1 Synthesis of data product assessment
The new criteria catalog and scoring system were successfully applied to the four selected data synthesis products. The so-determined readiness level scores and maturity of each product are listed in Table 2. SOCAT is the most mature product, reaching the “Mature” status by being “Fit for purpose”. GLODAP passes the “Verification” level and represents the only product in the “Pilot” phase. MEMENTO and GO2DAT are in the “Concept” phase. However, MEMENTO also complies with the “Proof of Concept” level. GO2DAT is the most recent initiative with the publication of a community-agreed roadmap (Grégoire et al., 2021). At this stage, its maturity is capped at the “Documentation” level. Nonetheless, all living products provide consistent and comparable level 3 data.
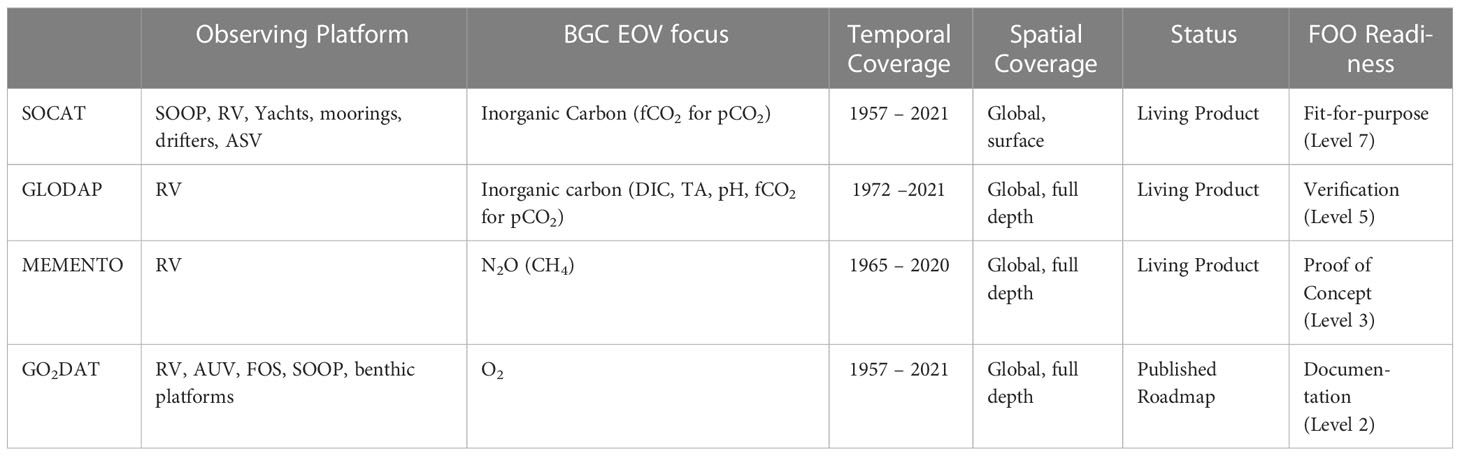
Table 2 Main characteristics and FOO readiness of GLODAP, SOCAT, MEMENTO and GO2DAT. Acronyms: Ships Of OPportunity (SOOP); Research Vessel (RV); Autonomous Surface Vehicle (ASV); Autonomous Underwater Vehicle (AUV); Fixed Ocean Station (FOS);.
During the assessment, we could identify some critical and common approaches, which all four products share, independent of their different foci and state of development. To begin with, it is a pre-requisite for the success of a product to follow a clear mandate, i.e. to have a clear mission. Since the four products are community-driven, this is implicitly fulfilled. All products recognize the importance of not only the synthesis itself but also the importance of accompanying original data and metadata. Also, the importance of known and common standards and a clearly outlined QC is reflected in the individual data products’ workflow. And even though the actual 2nd QC methods of how to reach level 3 data differ from in-depth metadata checks (SOCAT) to bias corrections (GLODAP and MEMENTO), all products (in-) directly foster the usage of best practices by “rewarding” high-quality data in one way or another.
The diverging readiness levels of the products can mostly be linked to the varying implementations of critical features. Two themes that are reoccurring in the evaluation process are i) the extent to which the principles of FAIR and ii) the degree to which automation processes are incorporated at multiple readiness levels in the criteria catalog. Most prominently incorporated by SOCAT’s automated ingestion and extraction system. In particular its built-in version control, as well as interoperable data access for humans and machines (ERDDAP), fulfill multiple criteria throughout the readiness level catalog. Similarly, GLODAP’s cruise summary table and adjustment table provide good examples of how to increase a product’s maturity. These features should be used as blueprints for other synthesis products. Lastly, we want to stress one essential feature that no product has: long-term funding. This lack hinders the products from becoming fully sustainable and mature and directly puts the mandate of delivering comparable, consistent, high-quality ocean BGC observations at risk.
Generally, the readiness concept and the criteria catalog developed here provide - for the first time - an objective basis to assess the maturity of information and data products. The result of the assessment, i.e. the ranking, is in line with the number of citations of the different data products, serving as an independent proxy for the readiness of each product and proving the reliability of the FOO readiness levels. We have chosen to distribute the impact on the final scores equally among individual features and key characteristics, see Section 3.1. Of course, discussions of this equal weighting approach are appropriate, and we want to encourage the community to improve the scoring scheme. Also, we are aware of the risks associated with applying the readiness level approach to data products with clearly different foci. It is indeed easier for a product with a narrow focus, e.g. one type of observing platform and one key variable only, to obtain a mature level than for a product with multiple variables from multiple observing platforms. However, the latter product might tackle a bigger task or mandate. For this reason, we want to stress that the readiness level of a product should not be confused with the importance and utility of the product. The readiness should rather be used to identify steps a product needs to take to realize its full potential.
4.2 Outlook
The assessment excluded further data management efforts related to EOV BGC data which do not provide consistent and synthesized data of multiple data sources, e.g. the highly advanced BGC Argo database. These efforts also display important elements of the marine BGC data landscape but the here applied readiness level assessment is tailored specifically towards data synthesis products. However, the capabilities of ERDDAP diffuse the delimitation between more general databases and synthesis products increasingly. Widening the scope of this assessment to also include BGC EOV databases such as BGC Argo displays a future challenge.
In our vision, the ocean observation system should be independent of project-based research funds along the entire ocean observing value chain. We are in support of a sustained financing model, which could be realized through “[ … ] an international entity with a subscription-based or a binding Nationally Defined Contributions model, with a backbone/core ocean observing capability [ … ]” (European Marine Board, 2021, page 14). Such a financing model would have to include the management of BGC data and would resolve the lack of long-term funding experienced by synthesis products.
4.2.1 An overarching BGC EOV data management system
Presently, much work is put into the data providers and the synthesis product management teams (Figure 5, top). The former must not only measure and analyze but provide their data to and comply with the requirements of multiple data repositories and products. The latter must mine data from multiple and very heterogenic sources. This leads to much manual labor with respect to data QC and formatting, but it also leads to long durations from the observation to the data provision and common data gaps. A typical consequence of the present data system is that unnecessary repetition of similar work- and data flows is applied occasionally to the same dataset.
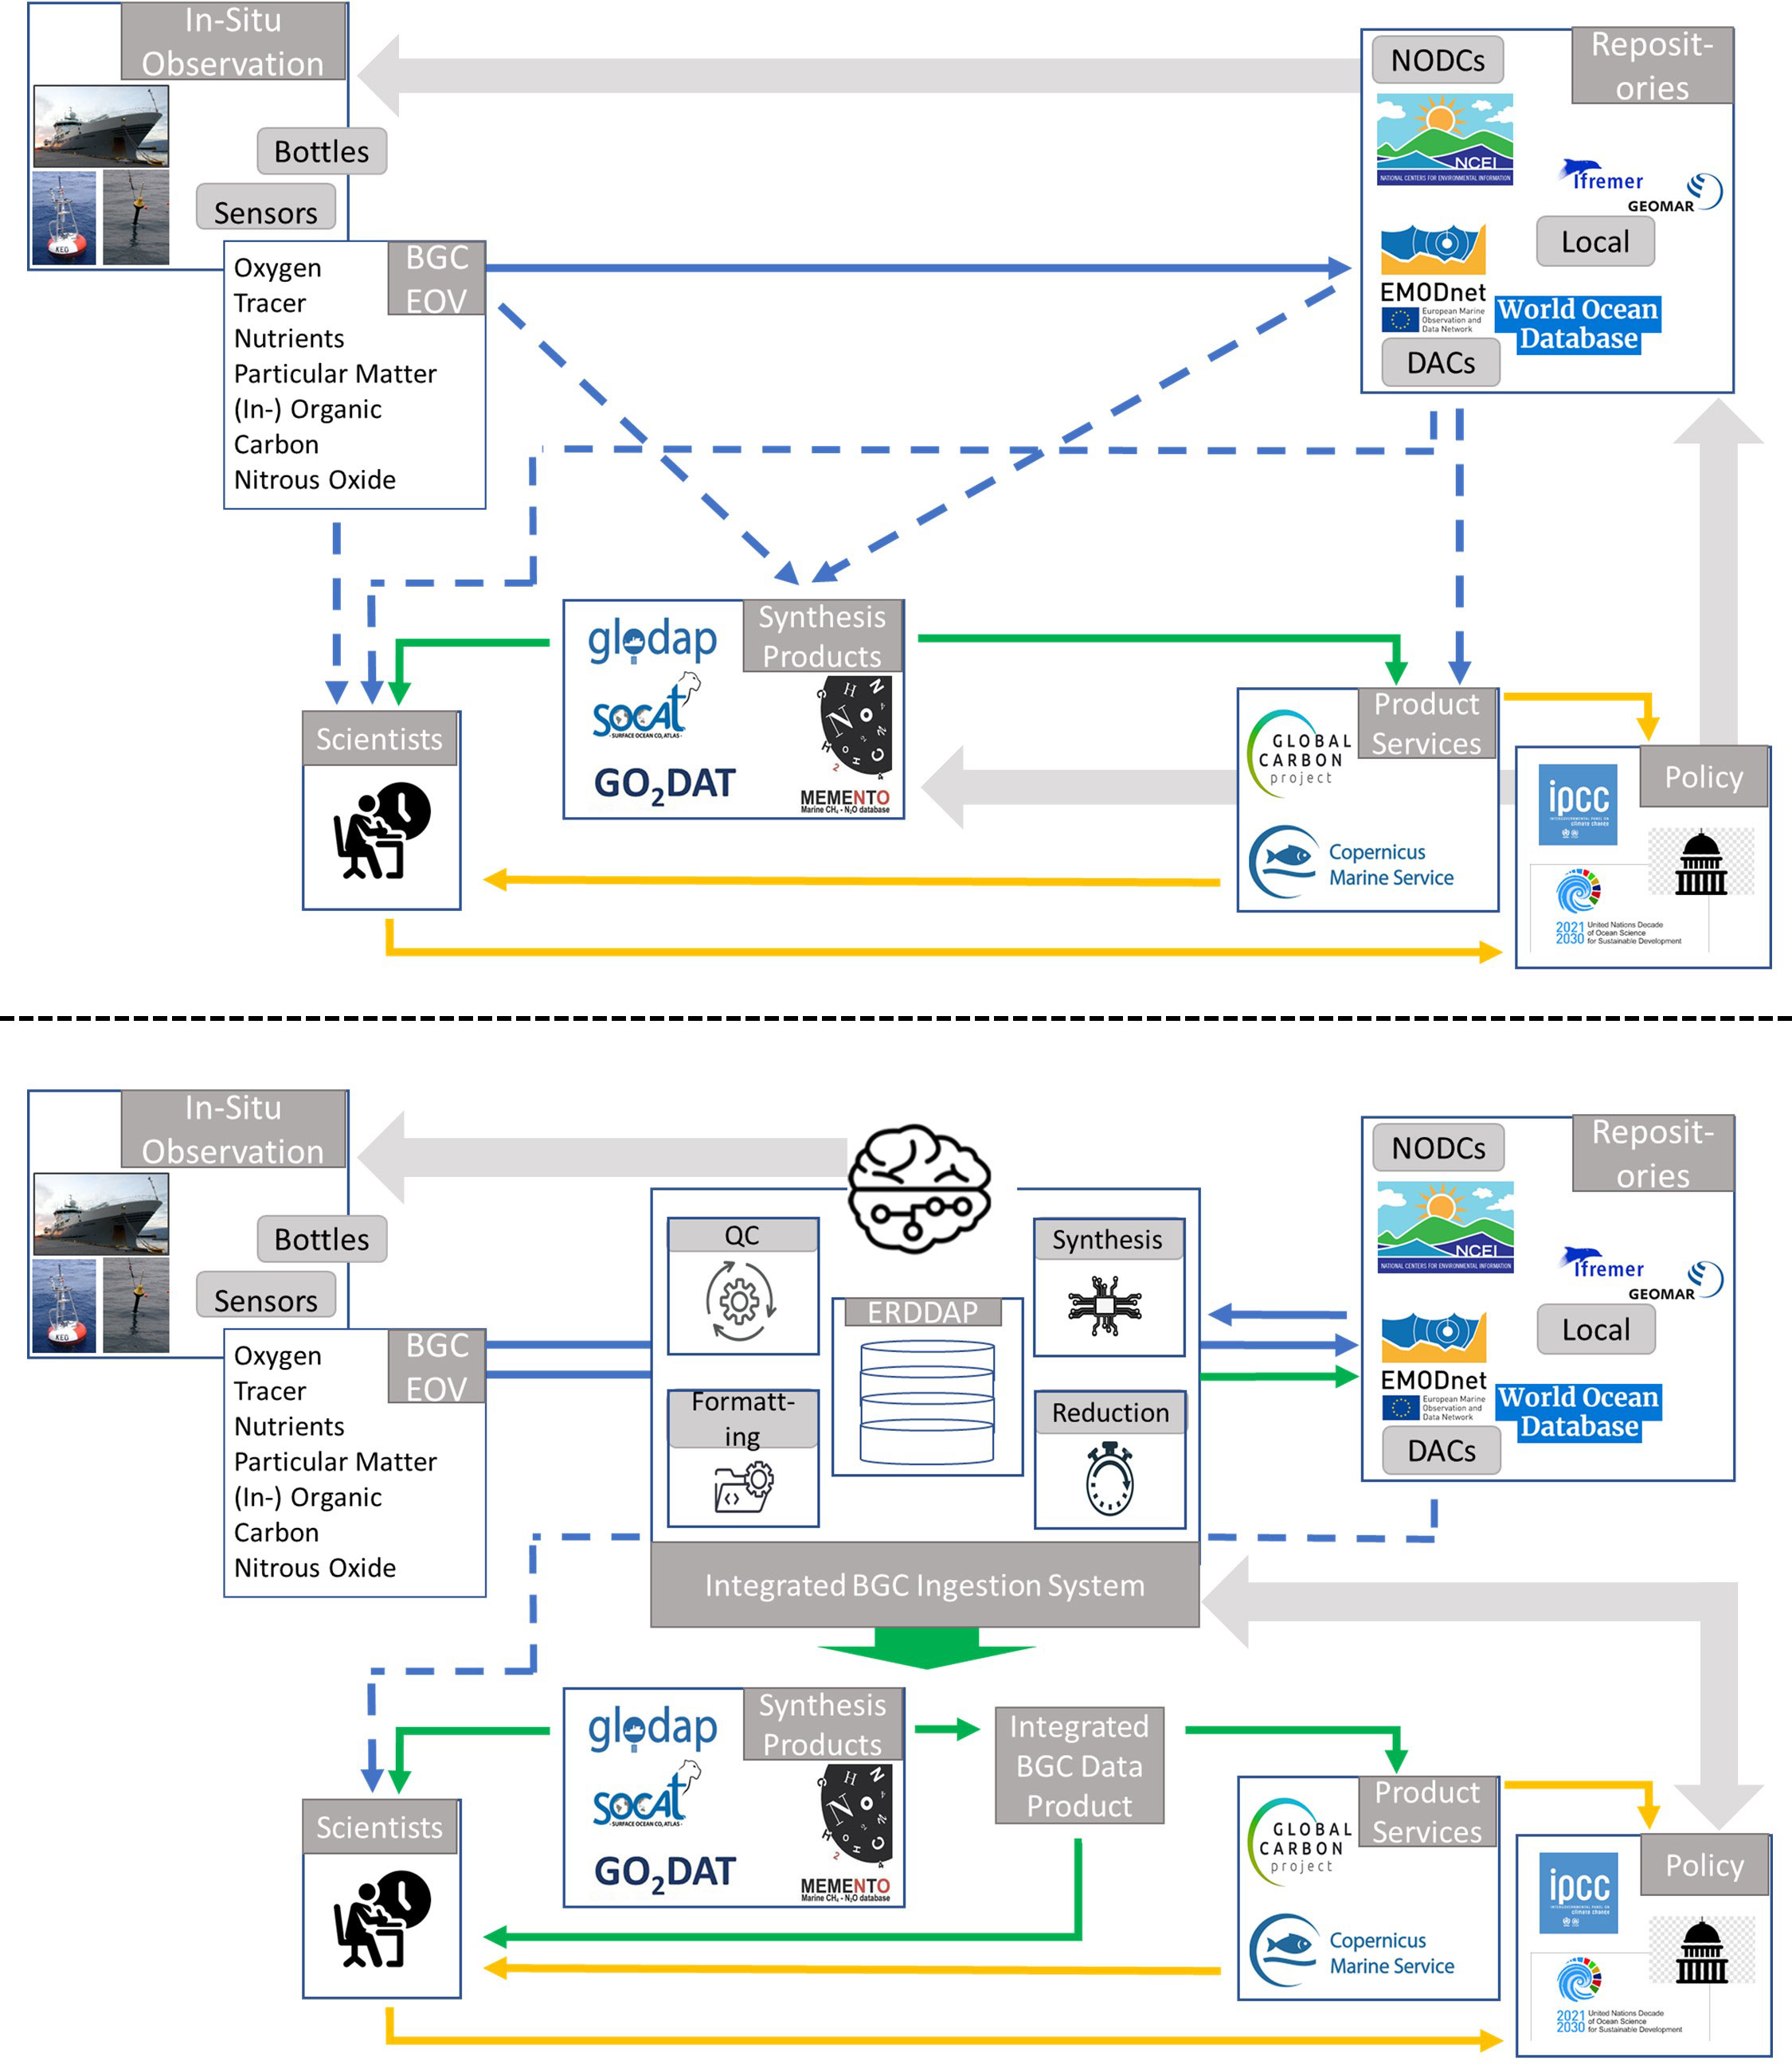
Figure 5 Top) Schematic of the current BGC data management system; Bottom) Schematic of the envisioned BGC data management system. Blue arrows show heterogenic (individual source) data flows; Green arrows show FAIR, consistent and QC’d data flows; Yellow arrows show information and service flows. Solid lines indicate strong and well-established links whereas dotted lines indicate rather weaker links with common data gaps. Grey arrows represent feedback between the FOO ocean data value chain pillars “Requirements”, “Observations” and “Data and Information”. For readability not all feedbacks are shown, e.g. the direct feedback between “Requirements” and “Observations” is not shown.
Regarding the readiness of the entire spectrum of marine BGC observations, we need to obtain an overarching, more mature, sustainable BGC data management system with more reliable and FAIR data. A system that fully embraces the guideline “measure once – use many times” (Lindstrom et al., 2012; Snowden et al., 2019), crosses the bridge between the different BGC observing systems and products and can incorporate data with high resolution in space (horizontal and in-depth) and time (high frequency and long-term).
We envision a transparent and consistent seamless one-submission-only data flow management structure that is easy for the data providers and users alike and efficient as a system (Figure 5, bottom). ERDDAP services are at the heart of the centralized system, which is connected to all repositories with a two-way ingestion scheme. Further, a set of QuinCe alike software tools is implemented to automate and streamline the entire BGC EOV data processes from formatting to reduction to QC (level-0 to level-2) to submission. In our vision, this centralized system enables machine-to-machine data transfer for all data types (real-time, near-real-time and delayed mode) and data quality levels. It diminishes the need for manual data handling and results in interoperable data. Data would be consistent, more quickly available and all changes applied in the data life cycle would be easy to track. Importantly, this system allows scientists to work in the data formats they are most comfortable with but also supports higher level, self-describing data formats such as netCDF. This is crucial in that it supports data interoperability using data and metadata standards and conventions but does not require data producers to be data management experts. The synthesis products could focus purely on 2nd QC tasks to provide level 3 data. To complete the data system, an integrated BGC data product could combine all the different synthesis products and provide intercomparable and FAIR cross-platform and cross BGC EOV data to scientists and down-the-line services. Here, the interoperability and comparability of the different products will be enhanced to the full extent. On top of erasing existing semantic differences between the different products, the data would undergo another layer of QC. The “integrated BGC QC” would be purely dedicated to analyzing (and assigning) the given BGC EOV uncertainties of the different products. This additional QC leads to a consistent application of uncertainties for BGC EOV data from various sources (i.e. platform, measurement- and analysis type). Hence, data are made truly comparable, independent of their origin. And through a one-stop shop the data are easy to take up by different users.
The overarching system also improves the ability to identify data gaps in space and time and can partially guide the GOOS BGC observational strategy, implementing the FOO feedback loop on a larger and more encompassing scale (Figure 5, bottom). But above all, the system is set up to increase the FOO readiness of all BGC EOV observations and data products.
This vision should not be seen isolated from existing BGC data management efforts, which pursue a similar target. By no means do we aim at reinventing the wheel with yet another portal. The envisioned system should rather highlight what is needed for sustainable BGC data and guide the future development of existing BGC data management efforts accordingly.
Data availability statement
The original contributions presented in the study are included in the article/Supplementary Material. Further inquiries can be directed to the corresponding author.
Author contributions
NL and TT conceived the study, NL coordinated the author contributions, wrote and edited the manuscript, NL and TT contributed to tables and figures. TT, BF, BP, HB, SL, MG, DB, SJ, KO’B and AK contributed to the manuscript ideas and text. All authors contributed to the article and approved the submitted version.
Funding
NL, TT, BF and BP acknowledge support from the EuroSea project (Grant agreement ID: 862626). KO’B acknowledges support from NOAA’s Global Ocean Monitoring and Observation Program and notes that this publication is partially funded by the Cooperative Institute for Climate, Ocean, & Ecosystem Studies (CIOCES) under NOAA Cooperative Agreement NA20OAR4320271. BP, SJ and SL acknowledge support from the Research Council of Norway project ICOS Norway and OTC, phase 2 (grant number 296012). DCEB is grateful for support from the UK’s Natural Environment Research Council CUSTARD (Carbon Uptake and Seasonal Traits in Antarctic Remineralisation Depth) project (NE/P02/263/1).
Acknowledgments
We thank the funding agencies and the data management projects that have made this work possible through dedicated funding for the data management activities and improvements. We thank the many researchers responsible for the collection of data and quality control for their contributions to these data products. The Surface Ocean CO2 Atlas is an international effort, endorsed by the International Ocean Carbon Coordination Project, the Surface Ocean Lower Atmosphere Study and the Integrated Marine Biosphere Research program, to deliver a uniformly quality-controlled surface ocean CO2 database. This paper contributes to the science plan of the Surface Ocean Lower Atmosphere Study, which is supported by the U.S. National Science Foundation via the Scientific Committee on Oceanic Research.
Conflict of interest
The authors declare that the research was conducted in the absence of any commercial or financial relationships that could be construed as a potential conflict of interest.
Publisher’s note
All claims expressed in this article are solely those of the authors and do not necessarily represent those of their affiliated organizations, or those of the publisher, the editors and the reviewers. Any product that may be evaluated in this article, or claim that may be made by its manufacturer, is not guaranteed or endorsed by the publisher.
Supplementary material
The Supplementary Material for this article can be found online at: https://www.frontiersin.org/articles/10.3389/fmars.2023.1078908/full#supplementary-material
Glossary
Abbreviations
ASCII, American Standard Code for Information Interchange; ASV, Autonomous Surface Vehicle; AtlantOS, Atlantic Ocean Observing Systems; AUV, Autonomous Underwater Vehicle; BGC, BioGeoChemical; CANYON, CArbonate system and Nutrients concentration from hYdrological properties and Oxygen using a Neural-network; CARINA, CARbon dioxide IN the Atlantic Ocean; CSV, Comma Separated Value; CTD, Conductivity, Temperature and Depth; DIC, Dissolved Inorganic Carbon; DOI, Digital Object Identifier; EMODnet, European Marine Observation and Data Network; EOV, Essential Ocean Variable; FAIR, Findable Accessible Interoperable Reusable; FOO, Framework of Ocean Observation; FOS, Fixed Ocean Station; GLODAP, Global Ocean Data Analysis Project; GO2DAT, Global Ocean Oxygen Database and Atlas; GOOS, Global Ocean Observing System; GO-SHIP,Global Ocean Ship-based Hydrographic Investigations Program; ICOS, Integrated Carbon Observing System; IOCCP, International Ocean Carbon Coordination Project; IPCC, Intergovernmental Panel on Climate Change; MEMENTO, MarinE MethanE and NiTrous Oxide; NetCDF Network Common Data Form; PACIFICA, PACIFic ocean Interior Carbon; QC, Quality Control; QF, Quality Flagging; RV, Research Vessel; SCOR, Scientific Committee on Oceanic Research; SDG, Sustainable Development Goal; SOCAT, Surface Ocean CO2 Atlas; SOCOM, Surface Ocean pCO2 Mapping intercomparison; SOOP , Ship Of Opportunity Program; TA, Total Alkalinity; UNESCO, United Nations Educational, Scientific and Cultural Organization; WMO, World Meteorological Organization.
Footnotes
- ^ a term broadly defined as a set of value-adding activities that one or more communities perform in creating and distributing goods and services (Longhorn and Blakemore, 2007)
References
Abbott M. (2013). The era of big data comes to oceanography. Oceanogr. 26, 7–8. doi: 10.5670/oceanog.2013.68
Bakker D. C. E., Alin S., Bates N., Becker M., Castaño-Primo R., Cosca C., et al. (2020) SOCAT version 2020: key in the value chain of surface ocean CO2 measurements. Available at: https://www.socat.info/wp-content/uploads/2020/06/2020_Poster_SOCATv2020_release.pdf.
Bakker D. C. E., Alin S. R., Becker M., Bittig H., Castaño-Primo R., Feely R. A., et al. (2022) SOCAT version 2022 for quantification of ocean CO2 uptake. Available at: https://www.socat.info/wp-content/uploads/2022/06/2022_Poster_SOCATv2022_release.pdf.
Bakker D. C. E., Lauvset S. K., Wanninkhof R., O'Brien K., Olsen A., Pfeil B., et al. (2019) SOCAT version 2019: 26 million in situ surface ocean CO2 observations. Available at: https://www.socat.info/wp-content/uploads/2019/06/2019_Poster_SOCATv2019_release.pdf.
Bakker D. C. E., Pfeil B., Landa C. S., Metzl N., O’Brien K. M., Olsen A., et al. (2016). A multi-decade record of high quality fCO2 data in version 3 of the surface ocean CO2 atlas (SOCAT). Earth Sys. Sci. Data 8, 383–413. doi: 10.5194/essd-8-383-2016
Bakker D. C. E., Pfeil B., Smith K., Hankin S., Olsen A., Alin S. R., et al. (2014). An update to the surface ocean CO2 atlas (SOCAT version 2). Earth Sys. Sci. Data 6, 69–90. doi: 10.5194/essd-6-69-2014
Bange H. W., Bell T. G., Cornejo M., Freing A., Uher G., Upstill-Goddard R. C., et al. (2009). MEMENTO: a proposal to develop a database of marine nitrous oxide and methane measurements. Environ. Chem. 6, 195–197. doi: 10.1071/EN09033
Bittig H. C., Steinhoff T., Claustre H., Fiedler B., Williams N. L., Sauzède R., et al. (2018). An alternative to static climatologies: robust estimation of open ocean CO2 variables and nutrient concentrations from T, s, and O2 data using Bayesian neural networks. Front. Mar. Sci. 5. doi: 10.3389/fmars.2018.00328
Boyer T. P., Baranova O. K., Coleman C., Garcia H. E., Grodsky A., Locarnini R. A., et al. (2018). World ocean database 2018 Vol. 87. Ed. Mishonov A. V. (NOAA Atlas NESDIS). Available at: https://www.ncei.noaa.gov/sites/default/files/2020-04/wod_intro_0.pdf.
Cooley S., Schoeman D., Bopp L., Boyd P., Donner S., Ghebrehiwet D. Y., et al. (2022). Ocean and coastal ecosystems and their services. in Climate change 2022: impacts, adaptation, and vulnerability. contribution of working group II to the sixth assessment report of the intergovernmental panel on climate change. Chapter 3. IPCC AR6 WGII (Cambridge University Press). https://www.ipcc.ch/report/ar6/wg2/downloads/report/IPCC_AR6_WGII_FinalDraft_Chapter03.pdf.
Diaz R. J., Rosenberg R. (2008). Spreading dead zones and consequences for marine ecosystems. Science 321 (5891), 926–929. doi: 10.1126/science.1156401
Dickson A. G., Sabine C. L., Christian J. R. (2007). Guide to best practices for ocean CO2 measurements. PICES Special Publ. 3, 191, 2007.3. doi: 10.25607/OBP-1342
Doney S. C., Tilbrook B., Roy S., Metzl N., Le Quéré C., Hood M., et al. (2009). Surface ocean CO2 variability and vulnerability. Deep-Sea Res. Pt. II 56, 504–511. doi: 10.1016/j.dsr2.2008.12.016
European Marine Board. (2021). Sustaining in situ ocean observations in the age of the digital ocean. EMB Policy Brief 9, 14. doi: 10.5281/zenodo.4836060
Freeman N. M., Lovenduski N. S. (2015). Decreased calcification in the southern ocean over the satellite record. Geophys. Res. Lett. 42, 1834–1840. doi: 10.1002/2014GL062769
Freing A., Bange H. W. (2007). Towards a global database of oceanic nitrous oxide measurements. IMBER Update 8, 3–4.
Freing A., Wallace D. W. R., Bange H. W. (2012). Global oceanic production of nitrous oxide. Phil. Trans. R. Soc. 367 (1593), 1245–1255. doi: 10.1098/rstb.2011.0360
Friedlingstein P., Jones M. W., O'Sullivan M., Andrew R. M., Bakker D. C. E., Hauck J., et al. (2022). Global carbon budget 2021. Earth Sys. Sci. Data 14, 1917–2005. doi: 10.5194/essd-14-1917-2022
Friedlingstein P., O'Sullivan M., Jones M. W., Andrew R. M., Hauck J., Olsen A., et al. (2020). Global carbon budget 2020. Earth Syst. Sci. Data 12, 3269–3340. doi: 10.5194/essd-12-3269-2020
Grégoire M., Garçon V., Garcia H., Breitburg D., Isensee K., Oschlies A., et al. (2021). A global ocean oxygen database and atlas for assessing and predicting deoxygenation and ocean health in the open and coastal ocean. Front. Mar. Sci. 8. doi: 10.3389/fmars.2021.724913
Gregor L., Fay A. R. (2021). SeaFlux data set: air-sea CO2 fluxes for surface pCO2 data products using a standardised approach. Zenodo. doi: 10.5281/zenodo.4133802
Gruber N., Clement D., Carter B. R., Feely R. A., van Heuven S., Hoppema M., et al. (2019). The oceanic sink for anthropogenic CO2 from 1994 to 2007. Science 363, 1193–1199. doi: 10.1126/science.aau5153
Guidi L., Fernandez Guerra A., Canchaya C., Curry E., Foglini F., Irisson J.-O., et al. (2020). Big data in marine science. Eds. Alexander B., Heymans J. J., Muñiz Piniella A., Kellett P., Coopman J. (Ostend, Belgium: Future Science Brief 6 of the European Marine Board). doi: 10.5281/zenodo.3755793
IOCCP (2007). Surface ocean CO2 variability and vulnerabilities workshop (Paris, France: UNESCO), 11–14. Available at: http://www.ioccp.org/.
IOCCP (2017). GOOS Biogeochemistry Essential Ocean Variables (EOVs) - Specification Sheets. Version: 25.08.2017. Available at: http://www.ioccp.org/index.php/foo. accessed on: 18.04.2023
IPCC (2019). IPCC special report on the ocean and cryosphere in a changing climate. Eds. Pörtner H.-O., Roberts D. C., Masson-Delmotte V., Zhai P., Tignor M., Poloczanska E., Mintenbeck K., Alegría A., Nicolai M., Okem A., Petzold J., Rama B., Weyer N. M. Cambridge University Press, Cambridge, UK and New York, NY, USA, pp. 3-35. doi: 10.1017/9781009157964.001
IPCC (2021). “Climate change 2021: the physical science basis,” in Contribution of working group I to the sixth assessment report of the intergovernmental panel on climate change. Eds. Masson-Delmotte V., Zhai P., Pirani A., Connors S. L., Péan C., Berger S., Caud N., Chen Y., Goldfarb L., Gomis M. I., Huang M., Leitzell K., Lonnoy E., Matthews J. B. R., Maycock T. K., Waterfield T., Yelekçi O., Yu R., Zhou X. X. X. B. (Cambridge, United Kingdom and New York, NY, USA: Cambridge University Press). doi: 10.1017/9781009157896
ISO/IEC/IEEE (2017). International standard - systems and software engineering–vocabulary SO/IEC/IEEE 24765:2017 (E), 1–541. doi: 10.1109/IEEESTD.2017.8016712
Johnson G. C., Robbins P. E., Hufford G. E. (2001). Systematic adjustments of hydrographic sections for internal consistency. J. Atmos. Oceanic Technol. 18, 1234–1244. doi: 10.1175/1520-0426(2001)018
Key R., Kozyr A., Chris S., Lee K., Wanninkhof R., Bullister J., et al. (2004). A global ocean carbon climatology: results from global data analysis project (GLODAP). Global Biogeochem. Cycles 18. doi: 10.1029/2004GB002247
Key R. M., Olsen A., van Heuven S., Lauvset S. K., Velo A., Lin X., et al. (2015). “Global ocean data analysis project, version 2 (GLODAPv2),” in ORNL/CDIAC-162, ND-P093 (Oak Ridge, Tennessee: Carbon Dioxide Information Analysis Center, Oak Ridge National Laboratory, US Department of Energy). doi: 10.3334/CDIAC/OTG.NDP093_GLODAPv2
Key R. M., Tanhua T., Olsen A., Hoppema M., Jutterström S., Schirnick C., et al. (2010). The CARINA data synthesis project: introduction and overview. Earth Syst. Sci. Data 2, 105–121. doi: 10.5194/essd-2-105-2010
Kock A., Bange H. W. (2015). Counting the ocean's greenhouse gas emissions. Eos Earth Space Sci. News 96, 10–13. doi: 10.1029/2015EO023665
Lauvset S. K., Currie K., Metzl N., Nakaoka S.-I., Bakker D. C. E., Sullivan K., et al. (2018) SOCAT quality control cookbook -for SOCAT version 7. Available at: https://www.socat.info/wp-content/uploads/2019/01/2018_SOCAT_QC_Cookbook_for_SOCAT_Version_7.pdf (Accessed 01/11/2020).
Lauvset S., Gruber N., Landschützer P., Olsen A., Tjiputra J. (2015). Trends and drivers in global surface ocean pH over the past 3 decades. Biogeosci. 12, 1285–1298. doi: 10.5194/bg-12-1285-2015
Lauvset S. K., Lange N., Tanhua T., Bittig H. C., Olsen A., Kozyr A., et al. (2021). An updated version of the global interior ocean biogeochemical data product, GLODAPv2.2021. Earth Syst. Sci. Data 13, 5565–5589. doi: 10.5194/essd-13-5565-2021
Lauvset S., Tanhua T. (2015). A toolbox for secondary quality control on ocean chemistry and hydrographic data. Limnol. Oceanogr. Methods, 11601–11608. doi: 10.1002/lom3.10050
Lauvset S. K., Lange N., Tanhua T., Bittig H. C., Olsen A., Kozyr A., et al. (2022). GLODAPv2.2022: the latest version of the global interior ocean biogeochemical data product. Earth Sys. Sci. Data 14 (12), 5543–5572. doi: 10.5194/essd-14-5543-2022
Le Quéré C., Andrew R. M., Friedlingstein P., Sitch S., Hauck J., Pongratz J., et al. (2018). Global carbon budget 2018. Earth Syst. Sci. Data 10, 2141–2194. doi: 10.5194/essd-10-2141-2018
Lindstrom E., Gunn J., Fischer A., McCurdy A., Glover L., Alverson K., et al. (2012). “A framework for ocean observing,” in By the task team for an integrated framework for sustained ocean observing (Paris: UNESCO). doi: 10.5270/OceanObs09-FOO
Longhorn R. A., Blakemore M. J. (2007). Geographic information - value, pricing, production, and consumption. 1st edition (Boca Raton: CRC Press).
Maurer T. L., Plant J. N., Johnson K. S. (2021). Delayed-mode quality control of oxygen, nitrate, and pH data on SOCCOM biogeochemical profiling floats. Front. Mar. Sci. 8. doi: 10.3389/fmars.2021.683207
Merchant C. J., Paul F., Popp T., Ablain M., Bontemps S., Defourny P., et al. (2017). Uncertainty information in climate data records from earth observation. Earth Syst. Sci. Data 9, 511–527. doi: 10.5194/essd-9-511-2017
Miguez M., Belen A., Novellino A., Vinci M., Claus S., Calewaert J., et al. (2019). The European marine observation and data network (EMODnet): visions and roles of the gateway to marine data in Europe. Front. Mar. Sci. 6. doi: 10.3389/fmars.2019.00313
Moltmann T., Turton J., Zhang H., Nolan G., Gouldman C., Griesbauer L., et al. (2019). A global ocean observing system (GOOS), delivered through enhanced collaboration across regions, communities, and new technologies. Front. Mar. Sci. 6. doi: 10.3389/fmars.2019.00291
NOAA (2022) ERDDAP: easier access to scientific data. Available at: https://www.ncei.noaa.gov/erddap/information.html#:~:text=ERDDAP%20is%20a%20data%20server,and%20make%20graphs%20and%20maps.
Olsen A., Key R. M., van Heuven S., Lauvset S. K., Velo A., Lin X. H., et al. (2016). The global ocean data analysis project version 2 (GLODAPv2) - an internally consistent data product for the world ocean. Earth Syst. Sci. Data 8, 297–323. doi: 10.5194/essd-8-297-2016
Olsen A., Lange N., Key R. M., Tanhua T., Álvarez M., Becker S., et al. (2019). GLODAPv2.2019 – an update of GLODAPv2. Earth Sys. Sci. Data 11 (3), 14371461. doi: 10.5194/essd1114372019
Olsen A., Lange N., Key R. M., Tanhua T., Bittig H. C., Kozyr A., et al. (2020). An updated version of the global interior ocean biogeochemical data product, GLODAPv2.2020. Earth Syst. Sci. Data 12, 3653–3678. doi: 10.5194/essd-12-3653-2020
Pearlman J., Bushnell M., Coppola L., Karstensen J., Buttigieg P. L., Pearlman F., et al. (2019). Evolving and sustaining ocean best practices and standards for the next decade. Front. Mar. Sci. 6. doi: 10.3389/fmars.2019.00277
Pfeil B., Olsen A., Bakker D. C. E., Hankin S., Koyuk H., Kozyr A., et al. (2013). A uniform, quality controlled surface ocean CO2 atlas (SOCAT). Earth Sys. Sci. Data 5, 125–143. doi: 10.5194/essd-5-125-2013
Pierrot D., Neill C., Sullivan K., Castle R., Wanninkhof R., Naigur H., et al. (2009). Recommendations for autonomous underway pCO2 measuring systems and data-reduction routines. Deep Sea Res. Part II: Topical Stud. Oceanogr. 56, 512–522. doi: 10.1016/j.dsr2.2008.12.005
Rhein M., Rintoul S. R., Aoki S., Campos E., Chambers D., Feely R. A., et al. (2013). “Observations: ocean,” in Climate change 2013: the physical science basis. contribution of working group I to the fifth assessment report of the intergovernmental panel on climate change. Eds. Stocker T. F., Qin D., Plattner G.-K., Tignor M., Allen S. K., Boschung J., Nauels A., Xia Y., Bex V., Midgley P. M. (Cambridge, United Kingdom and New York, NY, USA: Cambridge University Press).
Sabine C., Feely R., Gruber N., Key R., Lee K., Bullister J., et al. (2004). The oceanic sink for anthropogenic CO2. Sci. (New York N.Y.) 305, 367–371. doi: 10.1126/science.1097403
Sabine C. L., Hankin S., Koyuk H., Bakker D. C. E., Pfeil B., Olsen A., et al. (2013). Surface ocean CO2 atlas (SOCAT) gridded data products. Earth Sys. Sci. Data 5, 145–153. doi: 10.5194/essd-5-145-2013
Sadin S. R., Frederick P. P., Rosen R. (1989). The NASA technology push towards future space mission systems. Acta Astronautics 20, 73–77. doi: 10.1016/0094-5765(89)90054-4
Shepherd I. (2018). European Efforts to make marine data more accessible. Ethics Sci. Environ. Polit. 18, 75–81. doi: 10.3354/esep00181
Sloyan B. M., Wanninkhof R., Kramp M., Johnson G. C., Talley L. D., Tanhua T., et al. (2019). The global ocean ship-based hydrographic investigations program (GO-SHIP): a platform for integrated multidisciplinary ocean science. Front. Mar. Sci. 6. doi: 10.3389/fmars.2019.00445
Snowden D., Tsontos V., Handegard N. O., Zarate M., O'Brien K., Casey K., et al. (2019). Data interoperability between elements of the global ocean observing system. Front. Mar. Sci. 6. doi: 10.3389/fmars.2019.00442
SOCAT and SOCOM (2015). “SOCAT (Surface ocean CO2 atlas) and SOCOM (Surface ocean pCO2 mapping intercomparison) event,” in Report. SOLAS (Surface OceanLower Atmosphere Study) Open Science Conference (University of Kiel, Kiel, Germany) 7 September 2015. Available at: http://www.socat.info/upload/2015_SOCAT_and_SOCOM_Event_Report.pdf.
Steinhoff T., Gkritzalis T., Lauvset S. K., Jones S., Schuster U., Olsen A., et al. (2019). Constraining the oceanic uptake and fluxes of greenhouse gases by building an ocean network of certified stations: the ocean component of the integrated carbon observation system. ICOS-Oceans. Front. Mar. Sci. 6. doi: 10.3389/fmars.2019.00544
Suntharalingam P., Buitenhuis E., Le Quere C., Dentener F., Nevison C., Butler J. H., et al. (2012). Quantifying the impact of anthropogenic nitrogen deposition on oceanic nitrous oxide. Geophys. Res. Lett. 39, Artn L07605. doi: 10.1029/2011gl050778
Suzuki T., Ishii M., Aoyama A., Christian J. R., Enyo K., Kawano T., et al. (2013). “PACIFICA data synthesis project,” in ORNL/CDIAC-159, NDP-092, carbon dioxide information analysis center, oak ridge national laboratory, u. s (Oak Ridge, TN, USA: Department of Energy).
Tanhua T., Lauvset S., Lange N., Olsen A., Álvarez M., Diggs S., et al. (2021). A vision for FAIR ocean data products. Commun. Earth Environment 2, 136. doi: 10.1038/s43247-021-00209-4
Tanhua T., McCurdy A., Fischer A., Appeltans W., Bax N., Currie K., et al. (2019). What we have learned from the framework for ocean observing: evolution of the global ocean observing system. Front. Mar. Sci. 6. doi: 10.3389/fmars.2019.00471
Tanhua T., Pouliquen S., Hausman J., O'Brien K., Bricher P., de Bruin T., et al. (2019b). Ocean FAIR data services. Front. Mar. Sci. 6. doi: 10.3389/fmars.2019.00440
Tanhua T., Steinfeldt R., Key R. M., Brown P., Gruber N., Wanninkhof R., et al. (2009). Atlantic Ocean CARINA data: overview and salinity adjustments. Earth Syst. Sci. Data Discuss 2, 241–280. doi: 10.5194/essdd-2-241-2009
Tanhua T., van Heuven S., Key R. M., Velo A., Olsen A., Schirnick C. (2010). Quality control procedures and methods of the CARINA database. Earth Syst. Sci. Data 2, 205–240. doi: 10.5194/essd-2-35-2010
UN (2015) Draft outcome document of the united nations summit for the adoption of the post2015 development agenda. draft resolution submitted by the President of the general assembly, sixty-ninth session, agenda items 13 (a) and 115, A/69/L.85 (New York: UN) (Accessed 12, 2015).
Velo A., Jesús C., Fiz F. P., Toste T., Lange N. (2021). AtlantOS ocean data QC: software packages and best practice manuals and knowledge transfer for sustained quality control of hydrographic sections. Zenodo. doi: 10.5281/zenodo.4532402
Wanninkhof R., Bakker D. C. E., Bates N., Olsen A., Steinhoff T., Sutton A. J. (2013). Incorporation of alternative sensors in the SOCAT database and adjustments to dataset quality control flags (Oak Ridge, Tennessee: Carbon Dioxide Information Analysis Center, Oak Ridge National Laboratory, US Department of Energy). Available at: http://cdiac.ornl.gov/oceans/Recommendationnewsensors.pdf. doi: 10.3334/CDIAC/OTG.SOCAT_ADQCF
Weber T., Wiseman N. A., Kock A. (2019). Global ocean methane emissions dominated by shallow coastal waters. Nat. Commun. 10, 4584. doi: 10.1038/s41467-019-12541-7
Wilkinson M. D., Dumontier M., Aalbersberg I. J. J., Appleton G., Axton M., Baak A., et al. (2016). The FAIR guiding principles for scientific data management and stewardship. Sci. Data 3, 160018. doi: 10.1038/sdata.2016.18
WMO (2018). WMO greenhouse gas bulletin. the state of greenhouse gases in the atmosphere based on global observations through 2017. Geneva: World Meteorological Organization, No. 14
Yang S., Chang B. X., Warner M. J., Weber T. S., Bourbonnais A. M., Santoro A. E., et al. (2020). Global reconstruction reduces the uncertainty of oceanic nitrous oxide emissions and reveals a vigorous seasonal cycle. Proc. Natl. Acad. Sci. doi: 10.1073/pnas.1921914117
Keywords: data synthesis product, essential ocean variable, FAIR, technical readiness level, GLODAP, SOCAT, MEMENTO, GO2DAT
Citation: Lange N, Tanhua T, Pfeil B, Bange HW, Lauvset SK, Grégoire M, Bakker DCE, Jones SD, Fiedler B, O’Brien KM and Körtzinger A (2023) A status assessment of selected data synthesis products for ocean biogeochemistry. Front. Mar. Sci. 10:1078908. doi: 10.3389/fmars.2023.1078908
Received: 24 October 2022; Accepted: 12 April 2023;
Published: 26 April 2023.
Edited by:
Takafumi Hirata, Hokkaido University, JapanReviewed by:
Shin-ichiro Nakaoka, National Institute for Environmental Studies (NIES), JapanPiotr Kowalczuk, Polish Academy of Sciences, Poland
Copyright © 2023 Lange, Tanhua, Pfeil, Bange, Lauvset, Grégoire, Bakker, Jones, Fiedler, O’Brien and Körtzinger. This is an open-access article distributed under the terms of the Creative Commons Attribution License (CC BY). The use, distribution or reproduction in other forums is permitted, provided the original author(s) and the copyright owner(s) are credited and that the original publication in this journal is cited, in accordance with accepted academic practice. No use, distribution or reproduction is permitted which does not comply with these terms.
*Correspondence: Toste Tanhua, dHRhbmh1YUBnZW9tYXIuZGU=