 Jan El Kassar1*†
 Bennet Juhls2†
 Martin Hieronymi3
 Rene Preusker1
 Anne Morgenstern2
 Jürgen Fischer1
 Pier Paul Overduin2
- 1Department of Geosciences, Institute of Meteorology, Working Group (WG) Radiation and Remote Sensing, Freie Universität Berlin (FUB), Berlin, Germany
- 2Geosciences, Permafrost Research, Alfred Wegener Institute Helmholtz Centre for Polar and Marine Research (AWI), Potsdam, Germany
- 3Institute of Carbon Cycles, Helmholtz-Zentrum Hereon, Geesthacht, Germany
In the past decades the Arctic has experienced stronger temperature increases than any other region globally. Shifts in hydrological regimes and accelerated permafrost thawing have been observed and are likely to increase mobilization of organic carbon and its transport through rivers into the Arctic Ocean. In order to better quantify changes to the carbon cycle, Arctic rivers such as the Lena River in Siberia need to be monitored closely. Since 2018, a sampling program provides frequent in situ observations of dissolved organic carbon (DOC) and colored dissolved organic matter (CDOM) of the Lena River. Here, we utilize this ground truth dataset and aim to test the potential of frequent satellite observations to spatially and temporally complement and expand these observations. We explored all available overpasses (~3250) of the Ocean and Land Colour Instrument (OLCI) on Sentinel-3 within the ice-free periods (May – October) for four years (2018 to 2021) to develop a new retrieval scheme to derive concentrations of DOC. OLCI observations with a spatial resolution of ~300 m were corrected for atmospheric effects using the Polymer algorithm. The results of this study show that using this new retrieval, remotely sensed DOC concentrations agree well with in situ DOC concentrations (MAPD=10.89%, RMSE=1.55 mg L−1, r²=0.92, n=489). The high revisit frequency and wide swath of OLCI allow it to capture the entire range of DOC concentrations and their seasonal variability. Estimated satellite-derived DOC export fluxes integrated over the ice-free periods of 2018 to 2021 show a high interannual variability and agree well with flux estimates from in situ data (RMSD=0.186 Tg C, MAPD=4.05%). In addition, 10-day OLCI composites covering the entire Lena River catchment revealed increasing DOC concentration and local sources of DOC along the Lena from south to north. We conclude that moderate resolution satellite imagers such as OLCI are very capable of observing DOC concentrations in large/wide rivers such as the Lena River despite the relatively coarse spatial resolution. The global coverage of remote sensing offers the expansion to more rivers in order to improve our understanding of the land-ocean carbon fluxes in a changing climate.
1 Introduction
Arctic temperatures increase four times faster than global temperatures (Rantanen et al., 2022). At the same time, high latitude rivers and their catchments are strongly affected by climate change. The discharge and biogeochemistry at the mouth of a river is a direct response to processes in the terrestrial and aquatic environment within a defined upstream area (Holmes et al., 2013). Measuring the suspended and dissolved load in Arctic rivers can therefore be a tool for observing the impact of climate change to their catchments. Warming and consequently degrading permafrost is expected to mobilize large amounts of organic carbon that was previously stored in frozen soil and sediment, which is then susceptible to decomposition, sedimentation and/or transport via rivers into the Arctic Ocean (Guo et al., 2007; Frey & McClelland, 2009; Wild et al., 2019). Major changes in riverine land-to-sea fluxes of organic matter, especially dissolved organic matter and its colored dissolved fraction (colored dissolved organic matter, CDOM), can affect the Arctic Ocean in multiple ways, such as decreasing transparency of the water, increasing radiative heating of the surface waters (Soppa et al., 2019; Pefanis et al., 2020), and acidification of the shelf waters (Semiletov et al., 2016). These processes will change the marine ecosystem and primary production in the Arctic shelf seas (Terhaar et al., 2021).
Organic carbon in aquatic systems is classified as dissolved organic carbon (DOC), the carbon fraction of dissolved organic matter (DOM), and particulate organic carbon (POC), the carbon contained within living (e.g., phytoplankton, zooplankton) and non-living (detritus) material. Once offshore, most POC is deposited in shelf sea sediments (Charkin et al., 2011; Wegner et al., 2013) whereas DOM is subject to slow microbial decomposition, (photo)mineralization, and further transport into the central Arctic Ocean (Carlson & Hansell, 2015; Brüchert et al., 2018; Juhls et al., 2019).
The Arctic Ocean contains only 1% of the global ocean volume (Menard & Smith, 1966; Opsahl et al., 1999) but receives 10% of global river discharge (Aagaard & Carmack, 1989) and an annual total riverine DOC flux of 25–36 Tg (Raymond et al., 2007). Of all Arctic rivers, the Lena River has the highest annual DOC flux (5.7 to 7.3 Tg C yr-1) (Stedmon et al., 2011; Holmes et al., 2012; McClelland et al., 2016; Juhls et al., 2020), which varies strongly between the seasons (Juhls et al., 2020). During winter, when the river is covered with ice, only about 10% of the annual DOC flux is exported (Holmes et al., 2012; Juhls et al., 2020), while the bulk of the DOC is associated with the spring freshet. Warming air temperatures, permafrost thaw and changing precipitation are lengthening the ice-free period (Prowse et al., 2011), shifting the timing and magnitude of the hydrograph and catchment DOC sources (Ye et al., 2003).
Estimates of DOC fluxes for Arctic rivers have high uncertainties due to insufficient observations. In situ monitoring of Arctic rivers in their mouth regions is challenging due to their remoteness. While the daily discharge of the big Arctic rivers has been monitored at gauging stations for many decades (Peterson et al., 2002; McClelland et al., 2006; Shiklomanov et al., 2021), sampling is a logistical challenge, especially during ice break-up and the critical freshet period. Despite these challenges, Arctic rivers have been monitored within the PARTNERS and ArcticGRO programs (e.g., Stedmon et al., 2011; Holmes et al., 2012; McClelland et al., 2016), providing year-round and interannual estimates of changing water composition for a set of circumpolar rivers that drain into the Arctic Ocean. However, the number of samples for each river has been limited to about 3-7 samples per year. In ArcticGRO the Lena River is sampled in Zhigansk (66.766°N, 123.374°E), approximately 800 km upstream from the river mouth and 500 km upstream of the gauge station at Kyusyur (Figure 1). Changes to the load of organic carbon in these final 800 km of the river are not reflected in estimates of land-to-sea fluxes based on these samples. To further improve DOC export flux estimates and to better capture the seasonal variability, a new sampling program of the Lena River began in April 2018 with a sampling frequency of every few days over the whole year. This sampling program is located in the central Lena River delta, at the Samoylov Island Research Station about 80 km upstream of the river mouth (Figure 1). The sampling program and initial data are described by Juhls et al. (2020). Analyses include DOC concentrations and CDOM absorption.
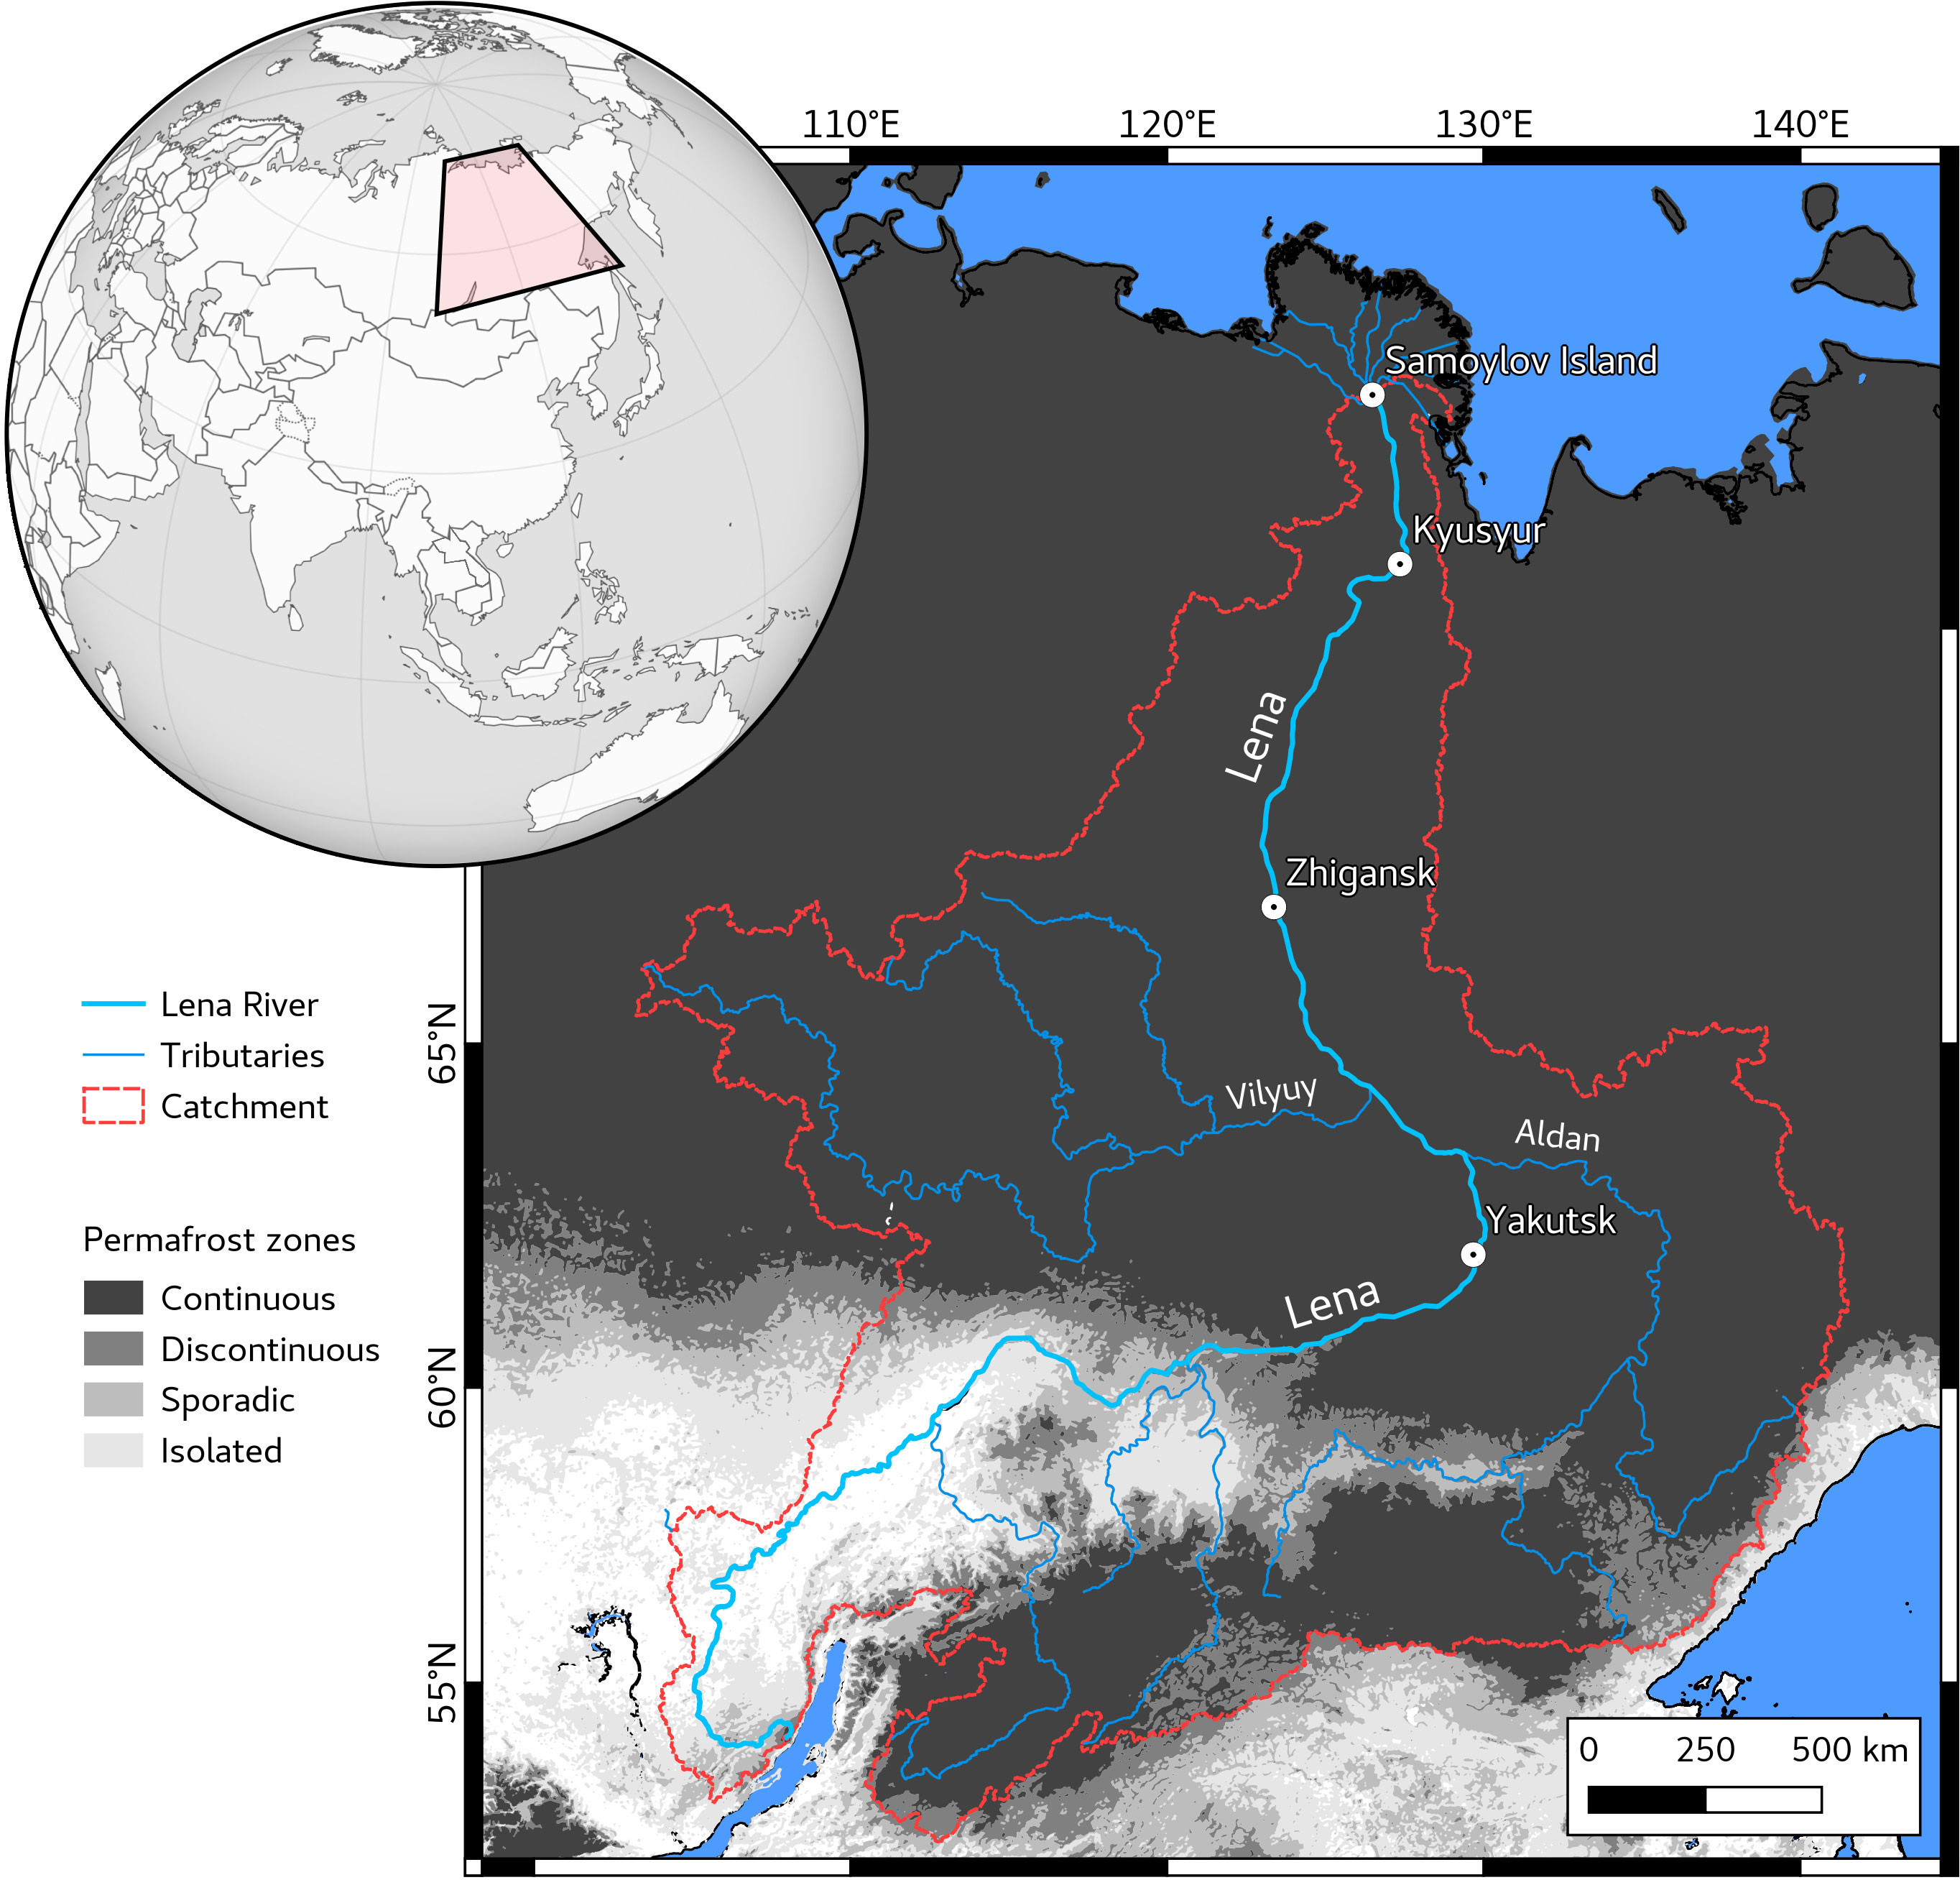
Figure 1 Map of the Lena River, its catchment and underlying permafrost zones (from Obu et al., 2019).
Optical remote sensing offers an alternative way to monitor the organic carbon load of surface waters and provides the chance to monitor the river along its entire course, although only during the ice-free season with sufficient sunlight. DOC itself does not have distinct spectral features which makes direct retrievals from remote sensing unfeasible. Thus, we aim at deriving the colored fraction of the dissolved organic matter (CDOM) that we can then translate to DOC using a stable relationship for the Lena River. CDOM strongly absorbs light in the short wavelength range and is a known proxy for concentrations of DOC in inland and coastal waters (Matsuoka et al., 2013; Juhls et al., 2019). Thanks to the robust relationship between CDOM absorption (aCDOM(λ)) and DOC concentration (e.g., Matsuoka et al., 2017; Juhls et al., 2019), satellite-derived aCDOM(λ) can be used to derive DOC concentrations. While there are a number of studies using remote sensing to estimate surface water DOC concentrations in Arctic coastal and shelf waters (Fichot et al., 2016; Matsuoka et al., 2017; Juhls et al., 2019; Soppa et al., 2019; Lewis & Arrigo, 2020; Juhls et al., 2022), only a few studies show the potential of using satellite data for the retrieval of aCDOM(λ) and DOC in Arctic rivers (Griffin et al., 2011; Herrault et al., 2016; Griffin et al., 2018; Huang et al., 2019). These studies make use of high resolution satellite sensors such as SPOT5, Landsat TM, ETM+ and OLI or Sentinel-2 MSI. While these satellite sensors have a suitable spatial resolution (10 to 30 m) to monitor narrow river channels, their revisit frequency and swath width are relatively low (several days and 185 - 290 km, respectively). Strong seasonal variations in DOC concentrations can thus not be captured. Additionally, the sparse availability of in situ data limits the number of matchups with satellite data and can impede a thorough validation of the retrieval. While individual scenes are large enough to capture specific segments of a river’s reach (Griffin et al., 2011), they are not large enough to estimate watershed-scale variability in DOC concentration. Other polar-orbiting sensors such as the Ocean and Land Colour Imager (OLCI) on the Sentinel-3 satellites have a much higher revisit frequency (multiple times per day in polar regions), better spatial coverage (1270 km swath), and better spectral characteristics (more bands and narrower spectral response functions (SRF)). However, OLCI’s spatial resolution is much coarser (300 m at full resolution), which is sufficient only for wide rivers.
Aquatic color remote sensing and the retrieval of constituents such as aCDOM(λ) is challenging in inland and coastal waters (IOCCG, 2000) and even more so if used in high latitudes (IOCCG, 2015). The major challenges are 1) the atmospheric correction (AC) of the signal the satellite received; and 2) the retrieval of the water constituents from the atmospherically corrected reflectance. AC is one of the most critical parts in any study on water bodies utilizing remote sensing since it attempts to remove the influence of the atmosphere (e.g., molecular scattering, aerosol scattering, and gaseous absorption) and adjacency effects (e.g., contributions from adjacent snow, ice or land pixels) on the signal of interest, which is used to derive information about water constituents. The signal of interest – the water-leaving reflectance (ρW) – is only a fraction of the total signal a satellite instrument receives. In combination with the ambiguity of the signal from the water body, this can decrease the overall quality of ACs.
One of the major difficulties for the retrieval of water constituents is the strong variability of type and concentration of constituents with varying optical properties that create ambiguity and can produce similar reflectance spectra. Disentangling the contributions to the optical properties of the water and deducing the concentration of each constituent over a wide selection of water types remains difficult. For OLCI there are multiple retrieval schemes that derive a diverse catalog of optical parameters such as aCDOM(λ), some of which show reasonable performance in optically complex Arctic coastal waters despite the described challenges (Matsuoka et al., 2013; Hieronymi et al., 2017; Juhls et al., 2019). However, these retrieval algorithms show large uncertainties in aCDOM(λ) or do not capture the full range of aCDOM(λ) in Arctic rivers such as the Lena. This is likely related to the difficulty in separating the fraction of absorption from non-algal particles (NAP) and CDOM (IOCCG, 2000; Babin et al., 2003). Griffin et al. (2011); Griffin et al. (2018) and Huang et al. (2019) showed that regional empirical band ratios developed solely for the retrieval of aCDOM(λ) and consequently estimated DOC concentration perform well in Arctic rivers.
We hypothesize that moderate resolution imagers such as OLCI offer both a higher revisit frequency and finer spectral resolution while still resolving inland waters such as lakes and rivers. In this study, we present a new regional retrieval to derive DOC concentration in the Lena River using optical remote sensing.
With the help of the retrieval, we test the potential of high revisit frequency Sentinel-3 OLCI satellite data to monitor organic carbon load, estimate DOC fluxes and identify the geographical and temporal heterogeneity of river organic carbon concentration along the entire Lena River throughout the ice-free period.
2 Data and methods
2.1 Study area
In this study, we focus on the Lena River, which is one of the largest Arctic rivers, exporting about 588 km³ yr-1 to the Arctic Ocean (Holmes et al., 2012). About 70% of the catchment lies in the zone of continuous permafrost, 24% in the zones of discontinuous, sporadic, and isolated permafrost, and 6% is free of permafrost. 72% of the catchment is covered by mostly evergreen forest, 12% is covered by shrubland and 3% is covered by wetland (Amon et al., 2012). The two main tributaries are the Vilyuy River and the Aldan River (Figure 1). The Lena River has a total length of about 4300 km and its width ranges from 2 to 10 km in most parts of its stretch, depending both on latitude and season. During boreal winter (November to April) the majority of the Lena is frozen over and discharge is at its lowest. Ice break-up usually occurs in the end of May, simultaneously with the annual peak in discharge. Strong precipitation events in the catchment can create smaller peaks in discharge later in the year. The warming climate of the Arctic leads to a shift towards earlier break-ups, later freeze-ups and an increase in winter-discharge (Juhls et al., 2020).
2.2 In situ data
Samples for in situ CDOM absorption (aCDOM(λ)) and concentrations of dissolved organic carbon (DOC) were taken at the Research Station Samoylov Island in the central Lena River Delta (Figure 1). 199 samples for paired aCDOM(λ) and DOC measurements were used in this study. They covered the ice-free periods of four years. Details on sample processing and analysis of the samples are described in Juhls et al. (2020). Samples were collected at daily to weekly intervals. In order to obtain daily data for aCDOM(λ) and DOC from the samples, we linearly interpolated between sampling dates. The temporal distance between two real samples exceeded two days in only 3% of interpolated daily data. A daily sampling rhythm was maintained during the ice break-up period, which is the period of most significant and rapid changes. This makes linear interpolation sufficient, since the significant variations in DOC along the hydrograph happen on a weekly scale (except during the spring freshet, Juhls et al., 2020).
To estimate DOC fluxes, we used the discharge of the Lena River published by ArcticGRO (Shiklomanov et al., 2021). The discharge data were corrected for the distance difference between the gauge station at Kyusyur and water sampling station at Samoylov Island (more details in Juhls et al., 2020).
2.3 Satellite data
2.3.1 Download and subsetting
We downloaded all available Sentinel-3 A/B OLCI L1 full resolution scenes from https://finder.creodias.eu/for the period from May to October for the years 2018 to 2021, which covered the sampling site (126.47°N, 72.371°E). In total, we found and used 3257 scenes. See Figure 2 for a detailed depiction of all available scenes per day.
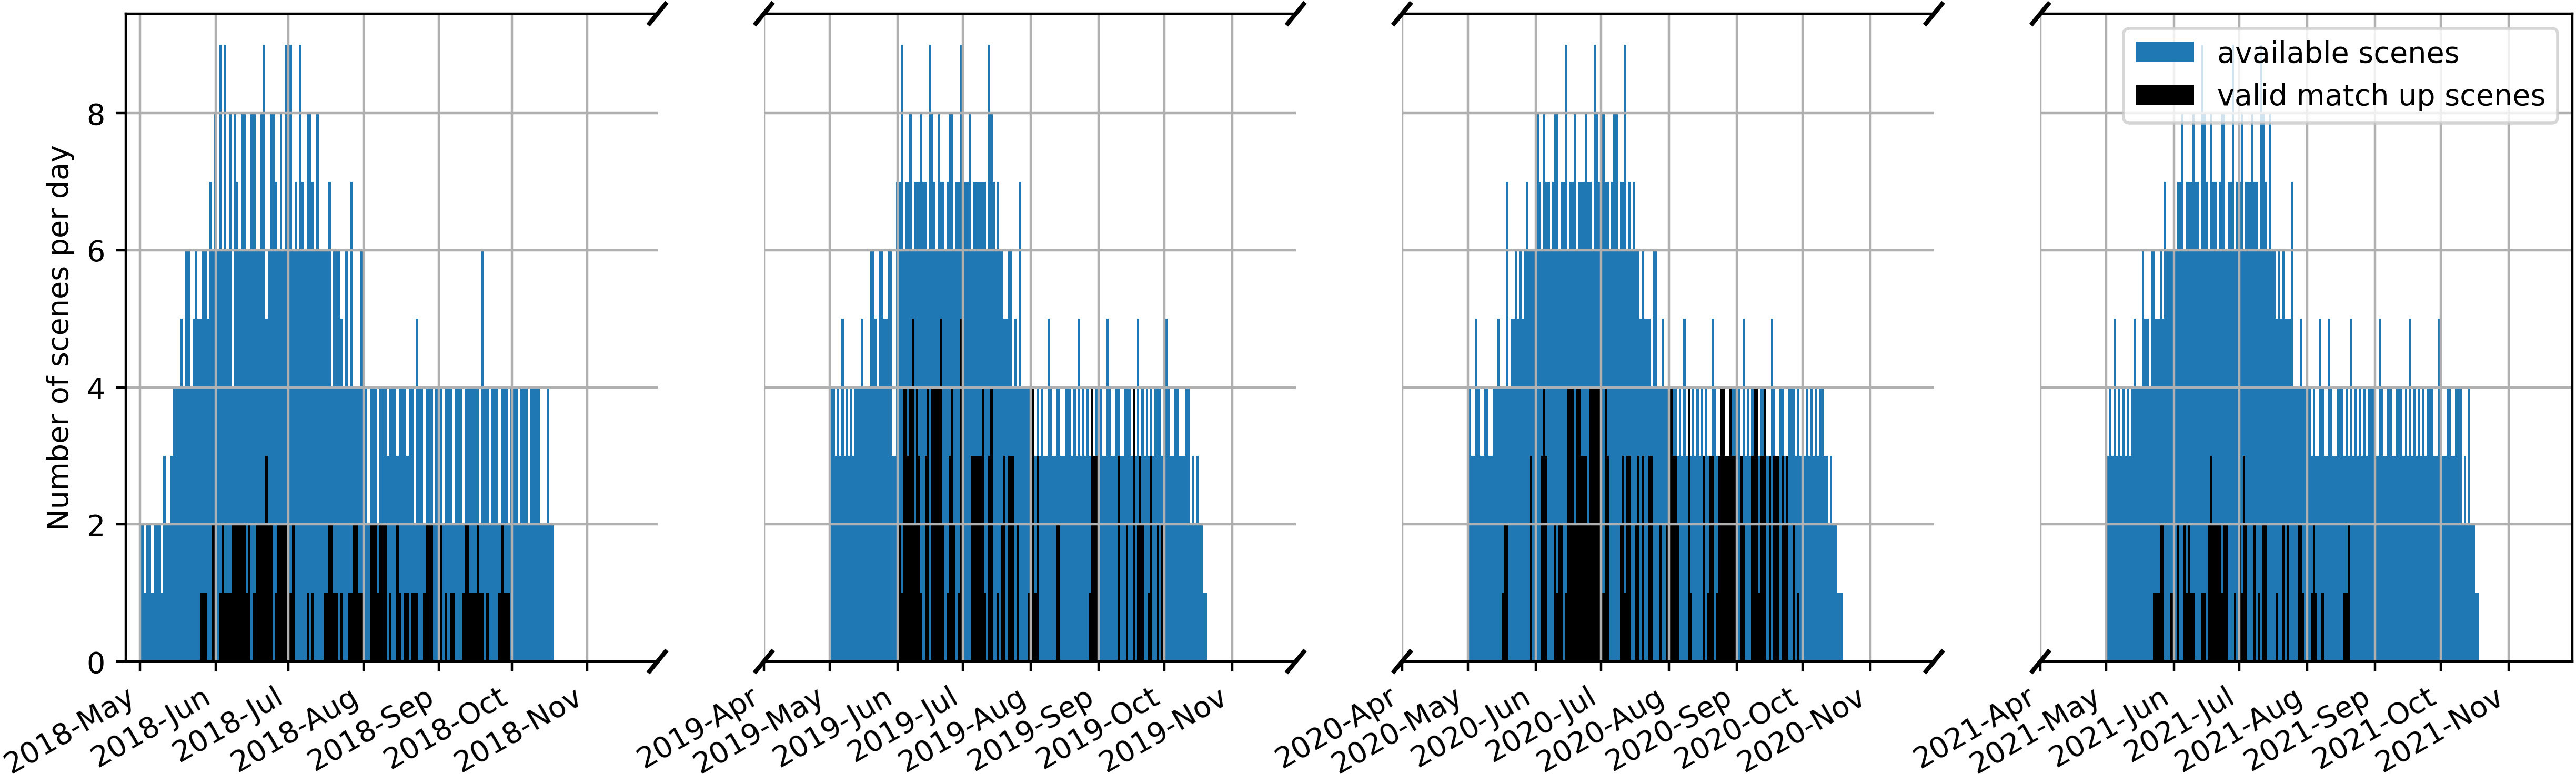
Figure 2 Number of available Sentinel-3 OLCI scenes (blue) and used Sentinel-3 OLCI scenes (black) per day.
2.3.2 Atmospheric correction
Atmospheric correction of satellite imagery is one of the most critical steps towards reliable estimates of water constituents such as DOC. The atmospheric contribution to the satellite signal can be >90% above dark rivers like the Lena River with high CDOM content (IOCCG, 2010). In this work, we used the AC method Polymer (v4.13) for retrieving normalized water-leaving reflectances (ρW(λ)) (Steinmetz et al., 2011; Steinmetz & Ramon, 2018). Polymer was originally developed for oceanic and coastal waters, but shows good results for inland waters and marginal seas, too (Qin et al., 2017; Warren et al., 2019). Moreover, Polymer is relatively robust to land or snow/ice adjacency effects, which is essential for river remote sensing. Since, to our best knowledge, no radiometric data from the Lena River water are available, a direct radiometric validation is not possible. However, in previous studies on satellite-retrieved DOC, Polymer showed a good performance and demonstrated a high robustness for Arctic waters impacted by riverine fluxes (Juhls et al., 2022). This is in line with findings by König et al. (2019) that even in very high latitudes with sun zenith angles of >60°, surrounded by ice potentially causing adjacency effects, Polymer performs best and produces reasonable results even in the high contrast Arctic sea ice.
2.3.3 Extraction and temporal and spatial collocation with in situ data
Pixels from all processed satellite swaths were collocated with the data collected at Samoylov Island. Reflectances were then filtered according to the flags CLOUD_BASE, L1_INVALID, NEGATIVE_BB, OUT_OF_BOUNDS, EXCEPTION, THICK_AEROSOL, HIGH_AIR_MASS, INCONSISTENCY provided by the Polymer AC and the duplicate flag provided by the OLCI Level 1 data. Furthermore, all pixels that contained any negative ρW in any of the bands in the visible range were excluded. The water level and subsequently the width of the channels of the Lena River is very variable. Thus, since we wanted to obtain as many matchups spanning as wide a range of conditions as possible, we decided against a rigid river-land-mask. Instead, we applied a simple land mask using an empirically determined threshold value of 0.03 for the atmospherically corrected reflectance at 865 nm (ρNIR, NIR: near infrared). This threshold was set very restrictively in order to exclude any mischaracterisation of a land pixel as water. As a result, most satellite observations were extracted within the deep part of the wide main channel of the Lena River (Figure 3).
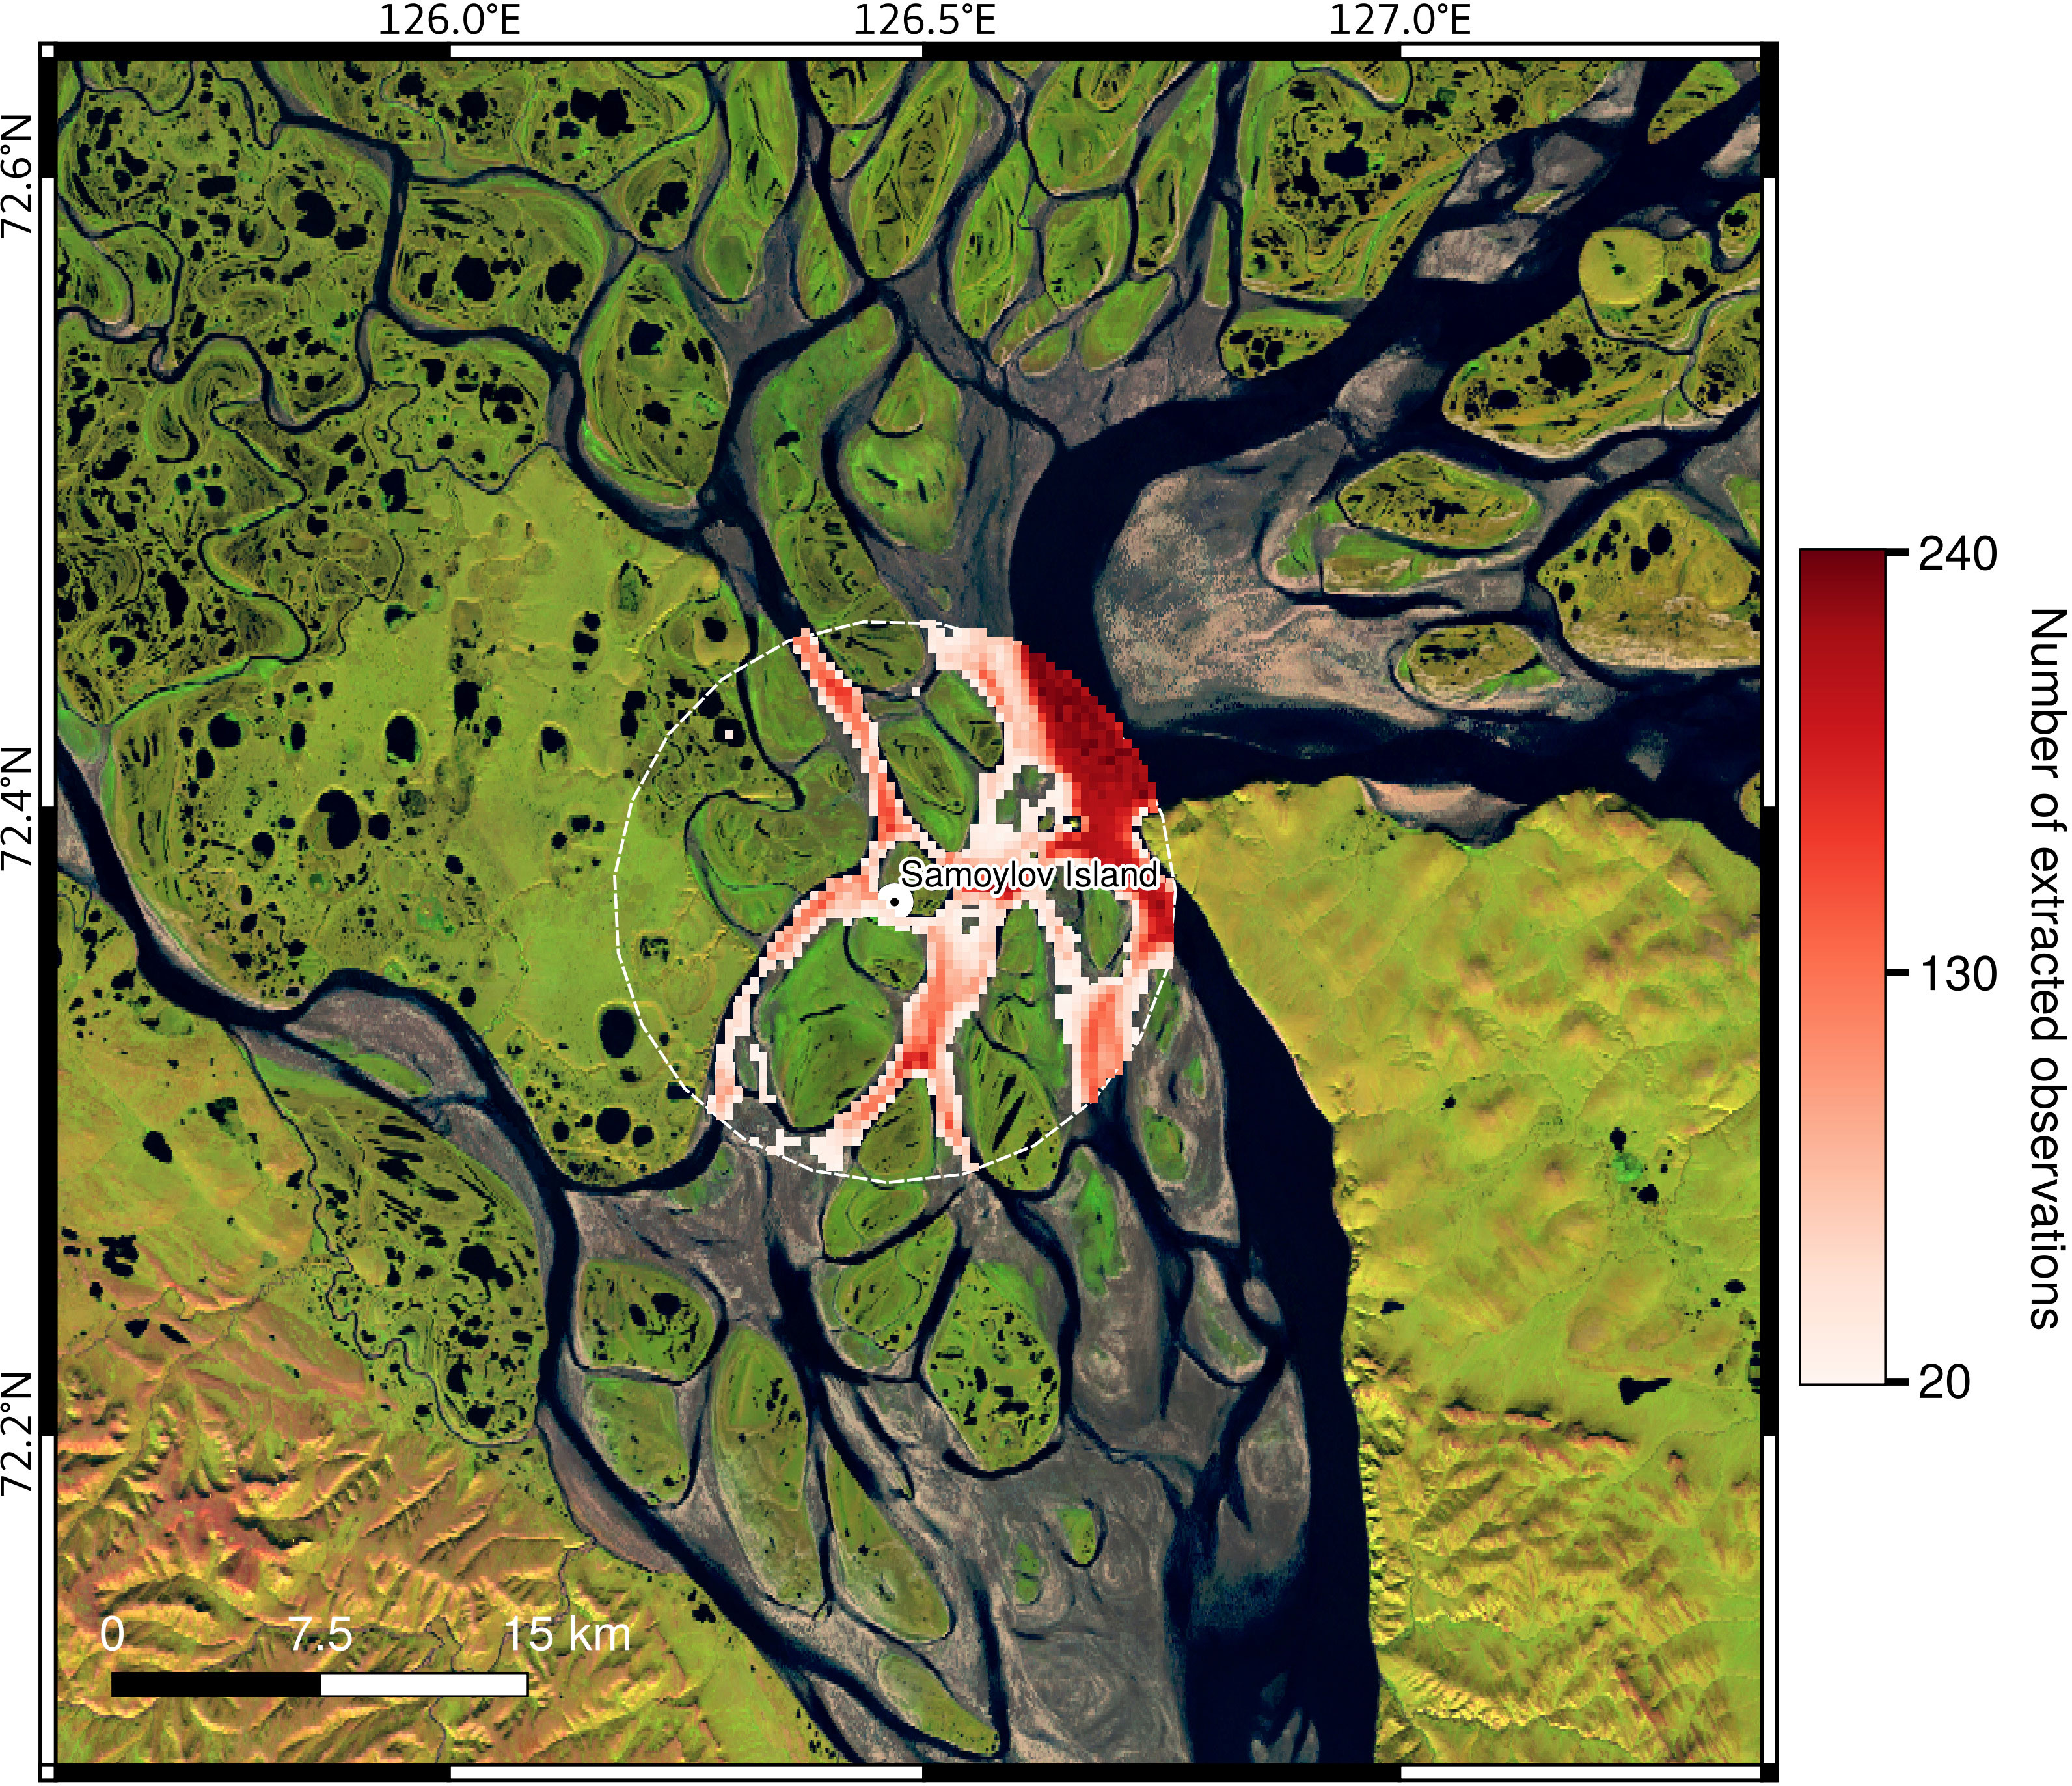
Figure 3 Central Lena River Delta and the 10 km radius around Samoylov Island (white dashed line) where satellite observations were extracted. Red colors show the number of extracted satellite observations for each pixel within the radius. Background image is a multi-year mosaic of Landsat 8 OLI created with google earth engine.
The filtered data were then regridded on a 300 by 300 m grid (0.0089° by 0.0027°, geographic projection). All valid pixels within a 10 km radius around Samoylov Island were treated as individual measurements per collocated in situ observation and used for the development and evaluation of the algorithm described in the following section. We chose this approach because in the branched river landscape the water-leaving reflectances in a 10 km radius can be very heterogeneous and the homogeneity criterion usually used for matchups (i.e., 3x3 or 5x5 macro-pixel with a coefficient of variation <15%, (e.g., EUMETSAT, 2019)) cannot be applied. Instead, all pixels that were not masked by Polymer are used for algorithm development, not just the median values. This also allows for a better quantification of uncertainties for the regression coefficients. Furthermore, in situ measurements from an expedition in August 2019 (Fuchs et al., 2022) show a very small variability (range of 0.6 mg L-1 between minimum and maximum) in DOC concentration for >20 measurements for different depths at >10 locations across ~100 km in the Lena River Delta. Given that the Lena River is well mixed (Gonçalves-Araujo et al., 2015; Laukert et al., 2017) and channels are directly connected throughout the year (Juhls et al., 2021), we assume a strong homogeneity of dissolved constituents (i.e., DOC) on small regional scales.
All available swaths within 24 hours of an in situ observation were taken into consideration. We were able to find 489 scenes (~15% of all scenes) with valid pixels that fit the matchup-criteria. The scenes were distributed over 249 days (i.e., multiple scenes per day, see Figure 2) and contained a sum of about 120000 pixels. These matchup-pixels were used for the evaluation and algorithm development. The number of available days per year with matchups varied between 37 to 79. In situ data were available from 20 April 2018 until 23 August 2021 and satellite data were limited to the time span of available in situ data.
2.4 Bootstrapping and evaluation metrics
In our study, the main tool for finding a suitable relationship and retrieval algorithm for aCDOM(λ) is the bootstrapping approach. Bootstrapping describes the repeated creation of random subsamples of a dataset and their analysis in order to find statistical measures and their associated accuracy (Efron & Tibshirani, 1994). We use this approach to find the optimal retrieval of aCDOM(λ) from satellite observations of the Lena River. We used a repetition of 1000 times and a random sample size of 80 matchups per repetition. Before random sampling, data were separated into equal bins along the target variable (i.e. in situ aCDOM(λ)) and the predictor (i.e. ρW ratio). Bins which contained less than one point were discarded, in order to dispose of any extreme outliers. Ideally, this approach results in a linear relationship between the predictor and the target variable, indicated by a high Pearson Correlation Coefficient. The parameters of this relationship were estimated using the orthogonal distance regression (ODR). By minimizing the orthogonal distance function for each data-pair to a polynomial function the relationship between two datasets can be found (Boggs & Rogers, 1990). We are looking for the relationship between the predictor (satellite observation) and the target variable (in situ observation). This gives us the fit parameters offset (α) and slope (β). In the end, the median of all estimated fit parameters yields the optimal model to retrieve aCDOM(λ) from ρW. In order to ensure an independent evaluation of the retrieval, pixels that were used in the bootstrapping were discarded from the statistical assessment. Both in algorithm development and in algorithm evaluation, we used the Pearson Correlation Coefficient (R²), Bias, Mean Absolute Percentage Deviation (MAPD) and Root Mean Square Deviation (RMSD) defined as follows:
where COV is the covariance and σ denotes the standard deviation.
where N is the number of data pairs.
2.5 DOC satellite retrieval development
While many studies that retrieve aCDOM(λ) from optical remote sensing focus on λ=443 nm, we focus on aCDOM(λ) at λ=254 nm (aCDOM(254)) because this wavelength represents the lignin absorption peak, which is a tracer for terrestrial organic matter (Fichot et al., 2016). Since most DOC in rivers originates from land, at 254 nm the relationship between aCDOM(λ) and DOC is strongest.
In the first step, we tested the exponential of the ratios of all available ρW bands (eratio) against in situ measured aCDOM(254) to find the optimal bands for the ratio describing the level of aCDOM(254) in the Lena River. After that, a fit was calculated for the ratio of the chosen bands using the bootstrapping method described above.
Overall, there were several reflectance ratios (red over green) that exhibited strong correlations with in situ measured aCDOM(254). The ρW(674)/ρW(560) and ρW(681)/ρW(620) bands performed best (R²= 0.95-0.96). The performance using ρW(665)/ρW(560) showed only a slightly lower R² (0.94). We chose the bands ρW(665) and ρW(560) for several reasons: 1) the red and green bands from Polymer AC show much lower uncertainties than the blue spectral range, 2) increased CDOM absorption considerably reduce the water-leaving signal in all but the green-red range, 3) the band at ρW(681) may be influenced by chlorophyll-a fluorescence and introduce a further source of uncertainty and, lastly, 4) these bands were also available on OLCI’s predecessor, the Medium Resolution Imaging Spectrometer (MERIS), to allow the application of this retrieval to MERIS full-resolution images in the future.
The initial fit for aCDOM(254)SAT follows:
where α= –33.675 and β = 34.434
Due to the co-variation of shape and height of ρW spectra (Supplementary Figure 1), we assume that sediment load co-varies with aCDOM(λ) most of the time. Despite increasing absorption by CDOM the water-leaving reflectances at 620 nm increased. This increase in overall signal is caused by corresponding increases in backscattering by sediments in the Lena River. We attributed the high residuals of the initial fit (initial aCDOM(254)SAT - aCDOM(254)in situ) to the influence of sediment and found a strong negative correlation to loge(ρW (620)) at R²= -0.72. In order to reduce the influence of sediment concentration variation on our aCDOM(254) retrieval, we fitted (using the bootstrap method described above) the residuals with loge(ρW (620)).
where α= –130.857 and β =–31.267
The final retrieval for aCDOM(254) can be described as (Supplementary Figure 2):
In order to compare with other aCDOM(λ) retrieval algorithms, we also report the equation for 443 nm (Supplementary Information).
The good relationship we determined between the red-green ratio and in situ measured aCDOM was confirmed by forward simulations using a simple bio-optical IOP model and aligns well with findings of other studies which relied on red-green ratios to retrieve CDOM (e.g., Mabit et al., 2022).
Satellite-retrieved aCDOM(254) was then converted to DOC concentration using an ODR linear regression fit (Equation 8) for in situ aCDOM(254) and DOC in the ice-free periods. (Supplementary Figure 3). From this follows:
For the matchup comparison with the in situ data, we calculated the median of the satellite-retrieved aCDOM(254)SAT and DOCSAT.
2.6 DOC fluxes
Daily in situ and satellite DOC fluxes are calculated using the daily DOC concentrations and the in situ measured discharge is corrected for the distance between Kyusyur (location of gauge station) and Samoylov Island (see Juhls et al. (2020) for details). For the DOCSAT concentrations, a daily average was taken over DOCSAT that was retrieved within a 20 km radius around Samoylov Island and interpolated linearly between available observations. The DOC fluxes (both from in situ and satellite) were then integrated over the longest time period available for each of the four years with the exception of 2021, where in situ observations are not yet available after the end of August. The investigated periods were between the beginning of June and end of September for the years 2018 to 2020 and between the beginning of June to the end of August for 2021.
2.7 DOCSAT-transects along the Lena River
By mosaicking multiple satellite overpasses, we created 10-day composite maps of the DOCSAT concentrations of the Lena River on the regular 0.0089° by 0.0027° grid. Note that this leads to slightly coarser (~500 m) and finer (~250 m) resolutions in lower and higher latitudes, respectively. From these composites we extracted the DOC concentrations along a transect following the main Lena River stem (light blue in Figure 1) from 111.49°N, 59.00°E to 126.70°N, 72.29°E. We applied the same data filtering criteria as described above. A gaussian filter was applied to reduce the noise in the DOCSAT fields and transects. Where no satellite data could be extracted along the centerline, the transect was filled with linear interpolation.
3 Results
3.1 Retrieval of CDOM absorption at 254 nm
In total, about 35% of all available matchup pixels were used in the bootstrap. The remaining matchups are shown in Figure 4. The high correlation (R²=0.89), a slope of 1.0, and the low negative bias of 1.18 m−1 indicate the good performance of the retrieval algorithm. At higher aCDOM(254) levels, higher deviation from the linear fit results in the elevated RMSD of 16.16 m−1 and MAPD of 12.83%. However, only in a very few cases (<2%) relative aCDOM(254)SAT errors exceed 3 standard deviations (62%, 44.5 m−1) when compared to aCDOM(254)in situ(Supplementary Figure 4). In the very first satellite observations of each year as well as in the mid to late September 2019 higher relative differences appear more frequently.
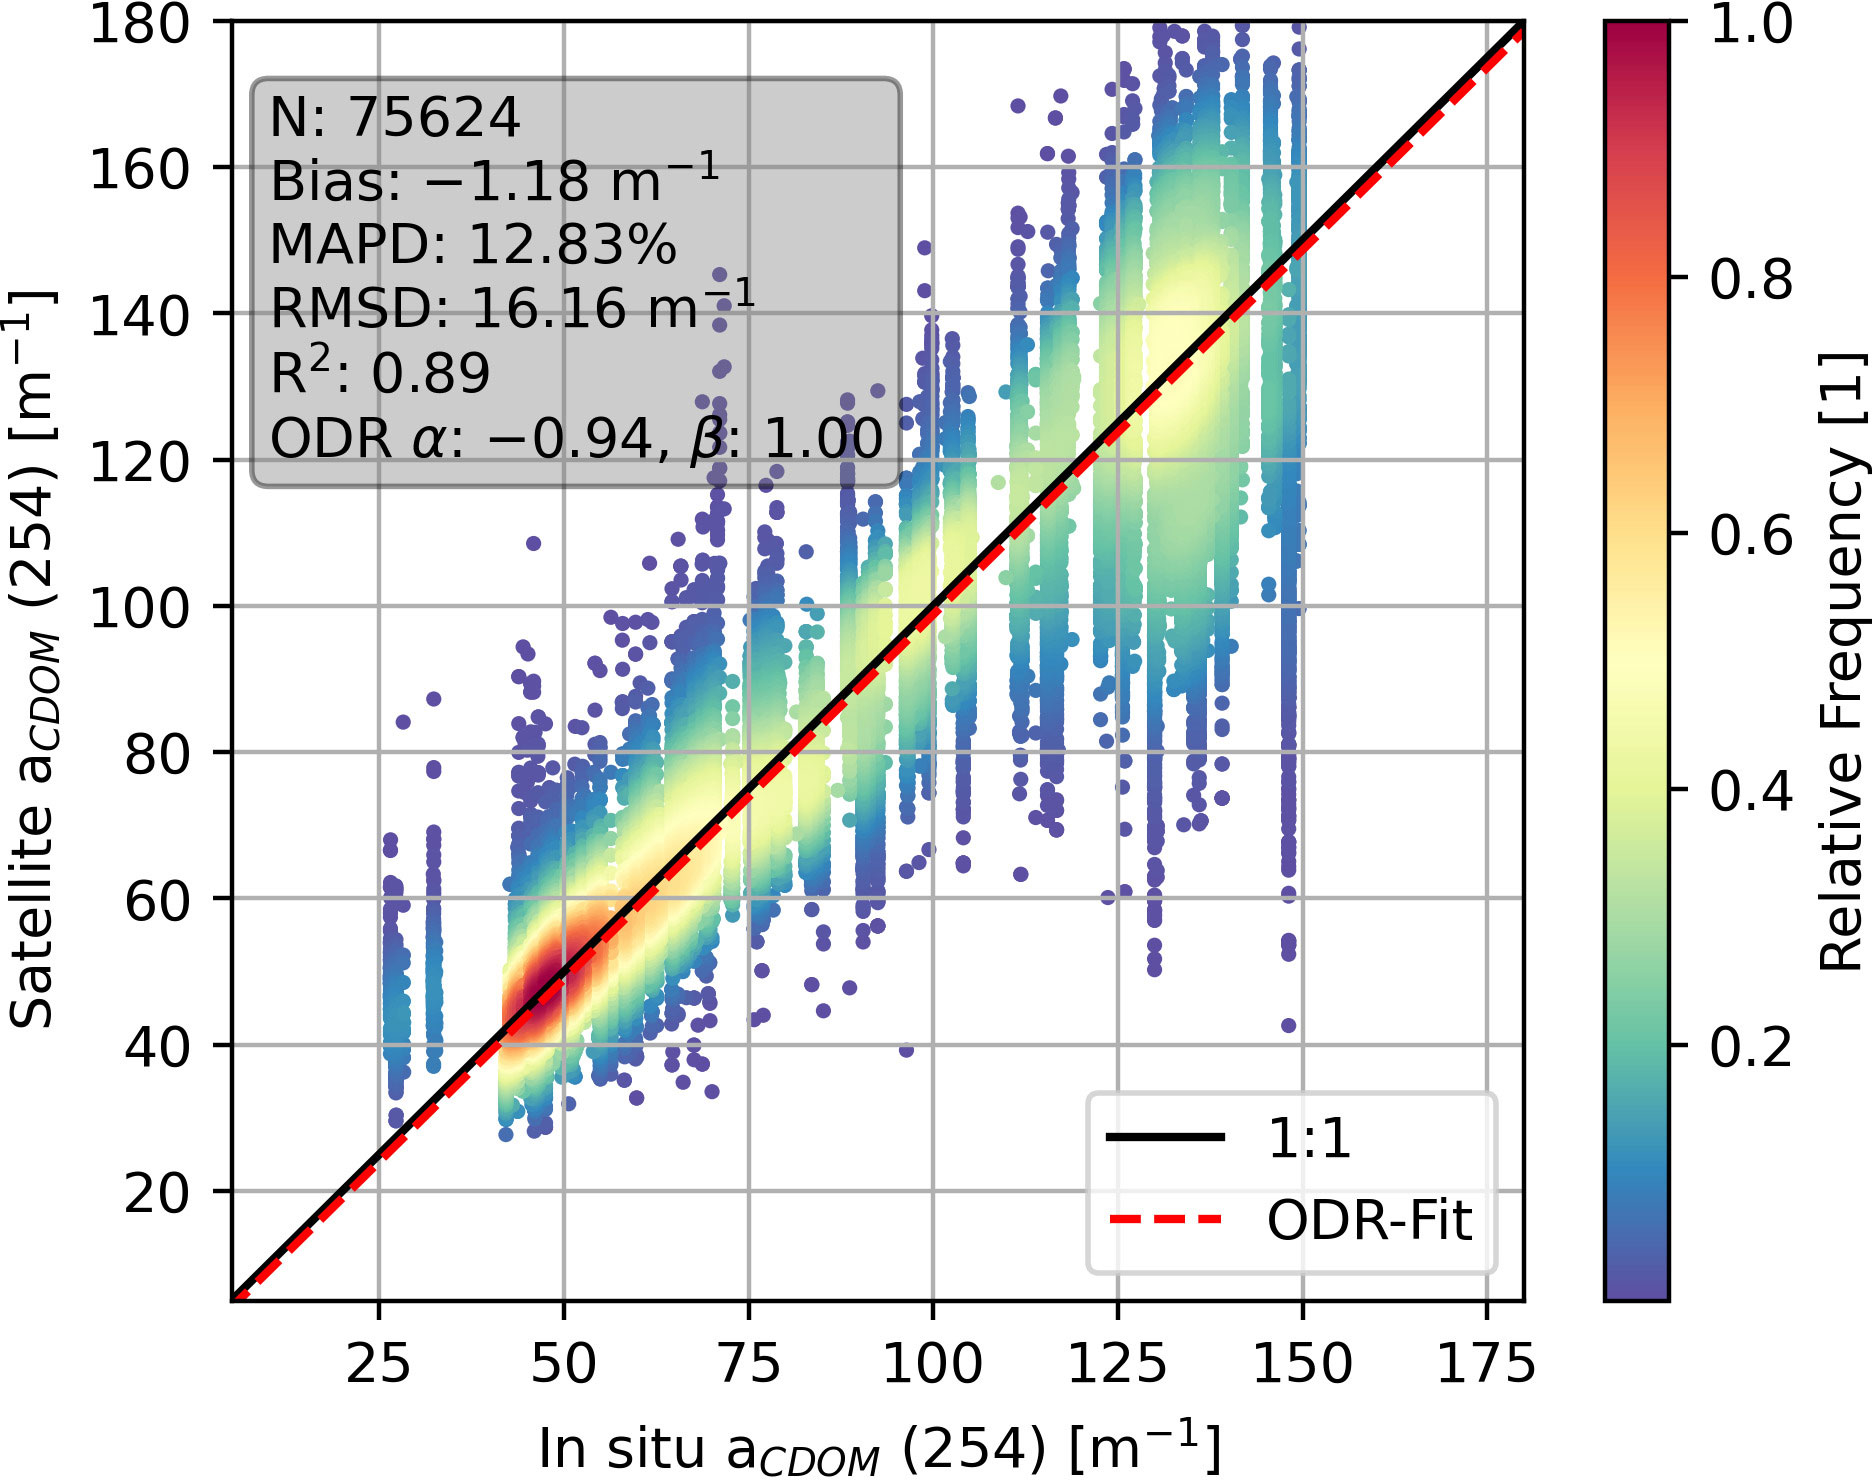
Figure 4 Evaluation of the aCDOM(254) algorithm by comparing in situ measured and satellite-derived aCDOM(254). Only data that were not used in the bootstrapping are shown here. The color of points indicates the relative frequency of occurrence.
3.2 Monitoring DOC concentrations with Sentinel-3 OLCI
The DOCSAT concentrations were retrieved with data from the twin satellites Sentinel-3 A and B for the period between end of May and end of September for the years 2018 to 2021. A high number of valid satellite observations – often multiple per day – could be retrieved within this period (Figure 2). The DOCSAT retrieval scheme model reported in this study, shows a good agreement with the in situ DOC concentrations (R²: 0.92, BIAS: 0.12 mg L-1, MAPD: 10.89%, RMSD: 1.55 mg L−1) (Figure 5). For all four years, satellite observations for DOC are available before the concentration peak during spring freshet when ice is still present in some parts of the Lena River. The complete range of seasonal variability can be retrieved from satellite with the highest concentration in spring after the ice break-up and lowest in dry summer months (Figure 6). The timing and height of the DOCSAT concentration peaks in spring are captured with only small deviations when compared to in situ observations (<10 days,< 14%). In 2021, the satellite observation density is lower compared to the other year. In consequence, both the spring freshet and a peak in late summer cannot be captured with high certainty by satellite data. Overall, the performance of the satellite retrieval shows no systematic dependence on the year or season. In contrast to the overestimation of aCDOM(254)in situin September 2019, there is no significant deviation in DOCSAT when compared to in situ DOC (Supplementary Figure 5).
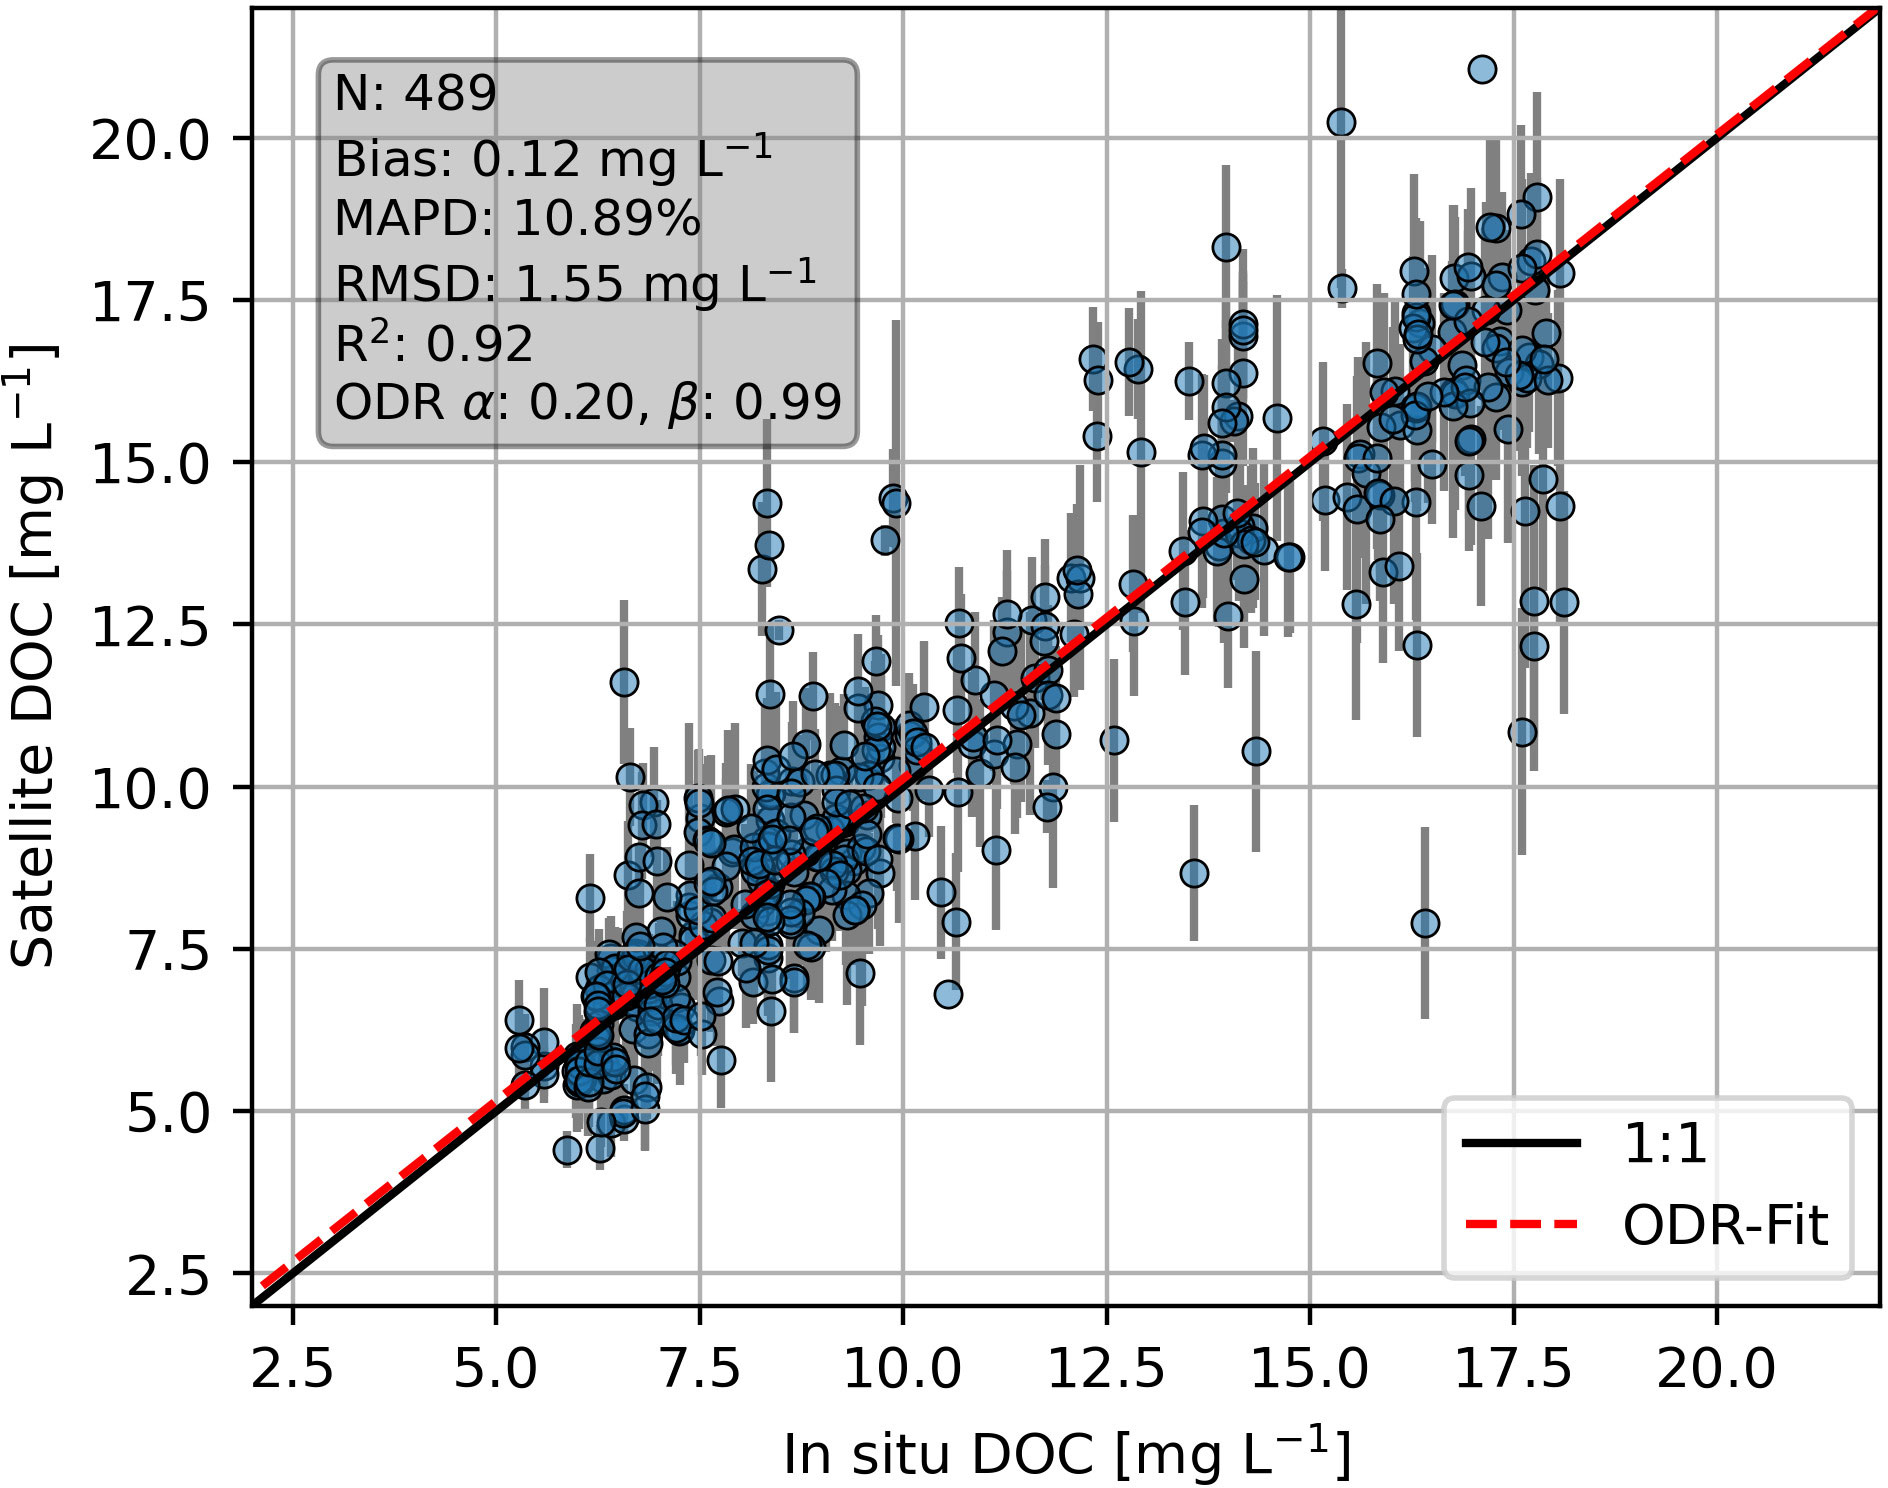
Figure 5 Matchup comparison between in situ measured DOC concentrations and DOCSAT concentrations using the new exp-band ratio. The grey vertical bars indicate the standard deviation associated with the median DOCSAT values.
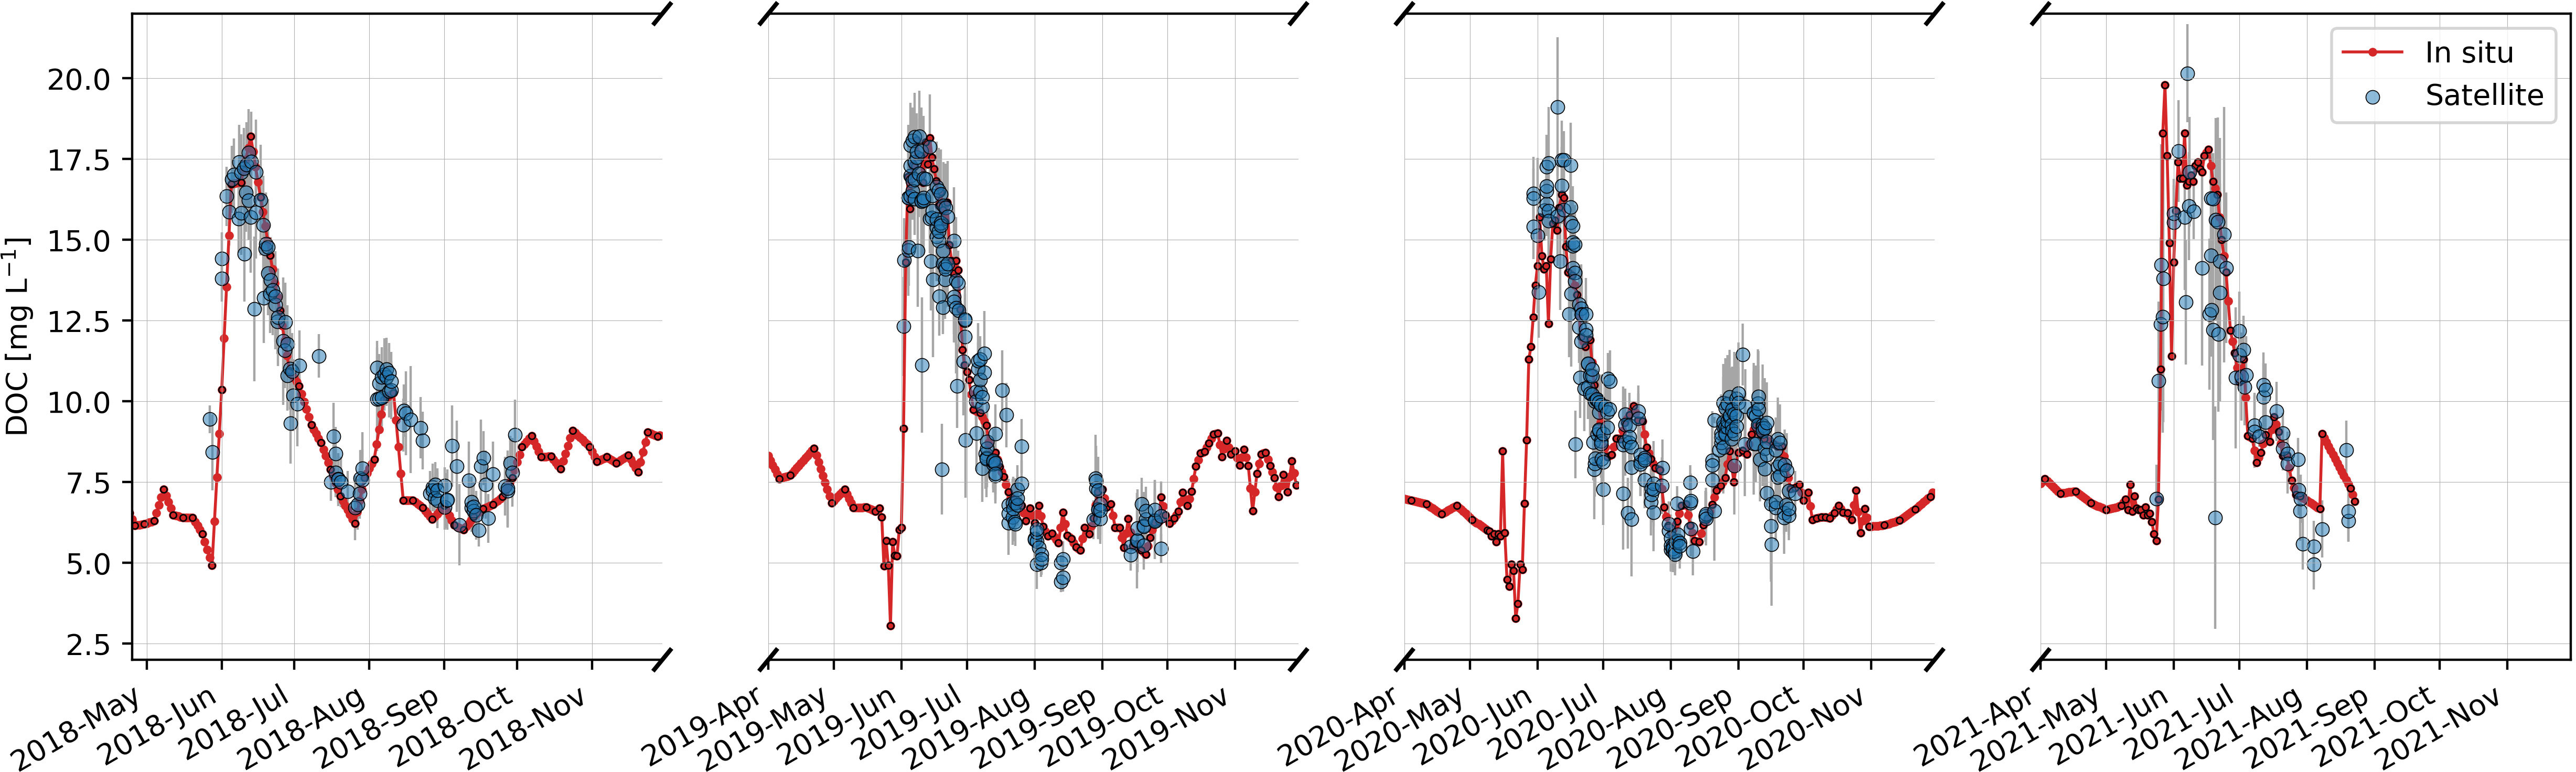
Figure 6 Time series (2018 to 2021) for the summer months with in situ measured DOC concentration (red line) and DOCSAT concentration (blue circles). The grey vertical bars show the standard deviation associated with the median DOCSAT values. Black outlines around the in situ data mark an actual sample. Only satellite observations with a corresponding in situ sample are shown.
3.3 Daily and integrated DOC fluxes
We calculated the DOC fluxes for the ice-free period (early June to end of September) for each year using in situ data and satellite data (Figure 7). The flux estimates (mean of in situ and satellite-derived) show high interannual variations from 3.48 Tg C (in 2019) to 5.3 Tg C (in 2018). The flux within the ice-free period accounts for up to 75% of the annual flux (based on year-round in situ data).
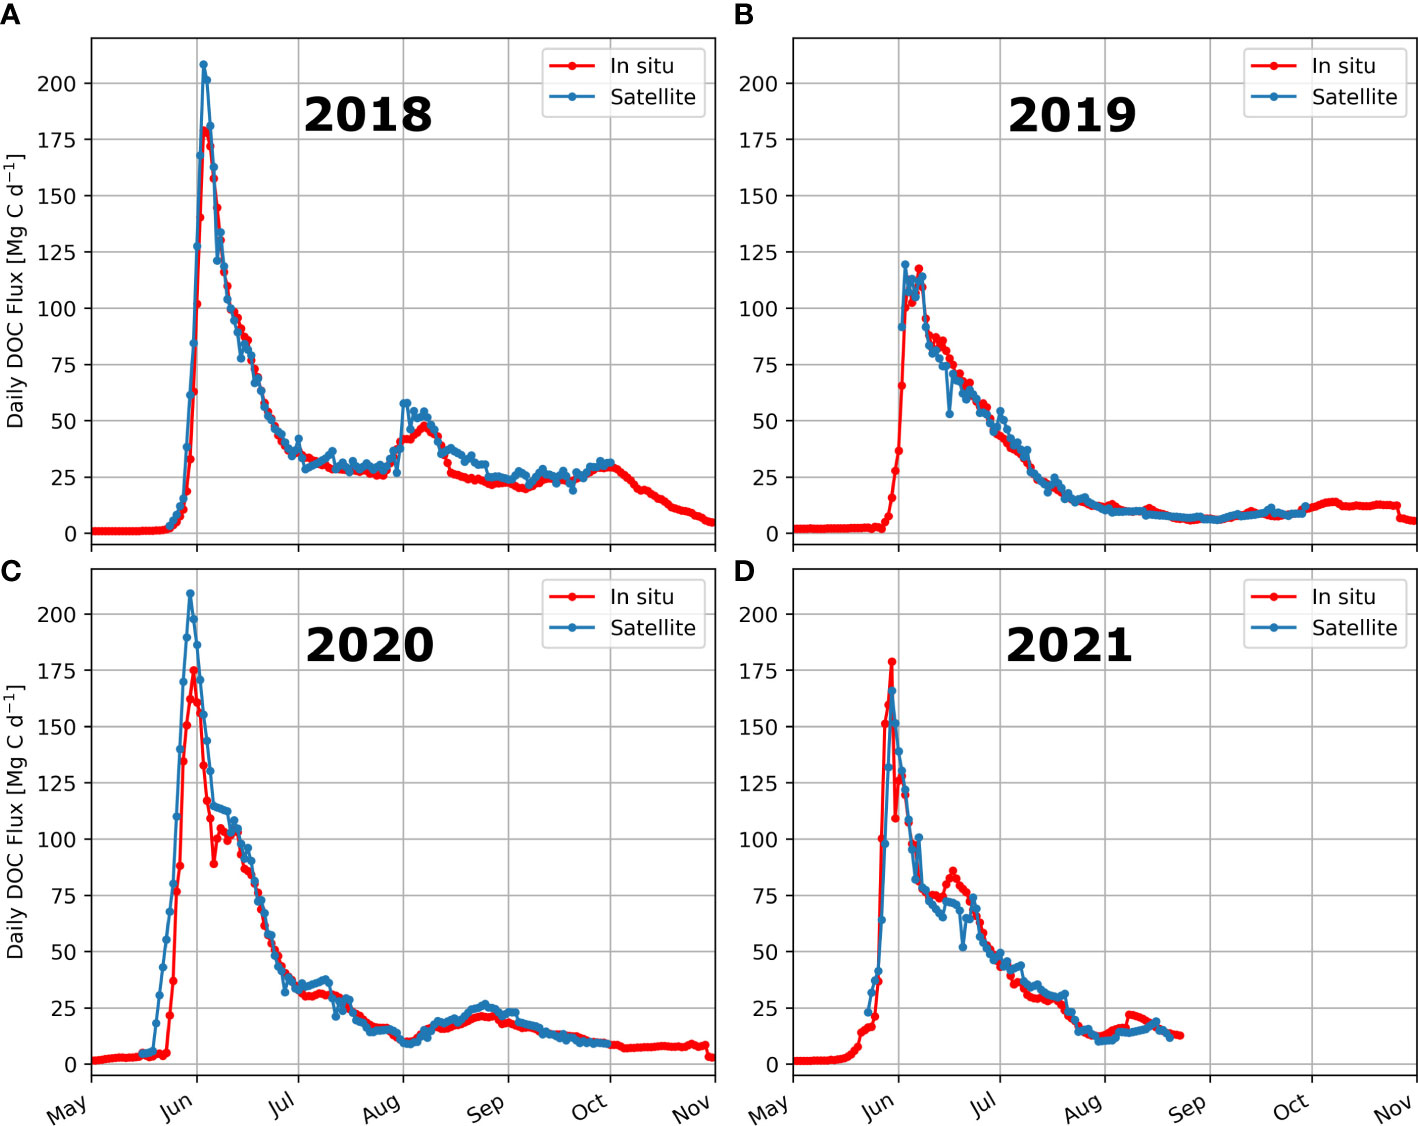
Figure 7 Daily DOC fluxes estimated from in situ samples (red) and satellite observations (blue) for (A) 2018, (B) 2019, (C) 2020, and (D) 2021.
A comparison of DOC fluxes estimated with in situ measured DOC and remotely sensed DOCSAT (both linearly interpolated to daily resolution) shows that range and timing of peaks and lows in daily DOC fluxes are captured without substantial differences (R²=0.97, MAPD=19.92%, RMSD=9.68 Mg C d−1, Supplementary Figure 6). Interannual variations of the concentration peak height during the spring freshet in early June are captured almost identically by both observation methods. In 2018 and 2020, satellite observations slightly overestimate the spring concentration peak compared to the in situ data.
The lower observation density in 2021 compared to the other years, likely leads to the higher difference between in situ and satellite-based estimations of DOC-fluxes. Overall DOCSAT fluxes are within +/-6.02% of the in situ derived fluxes (Table 1).
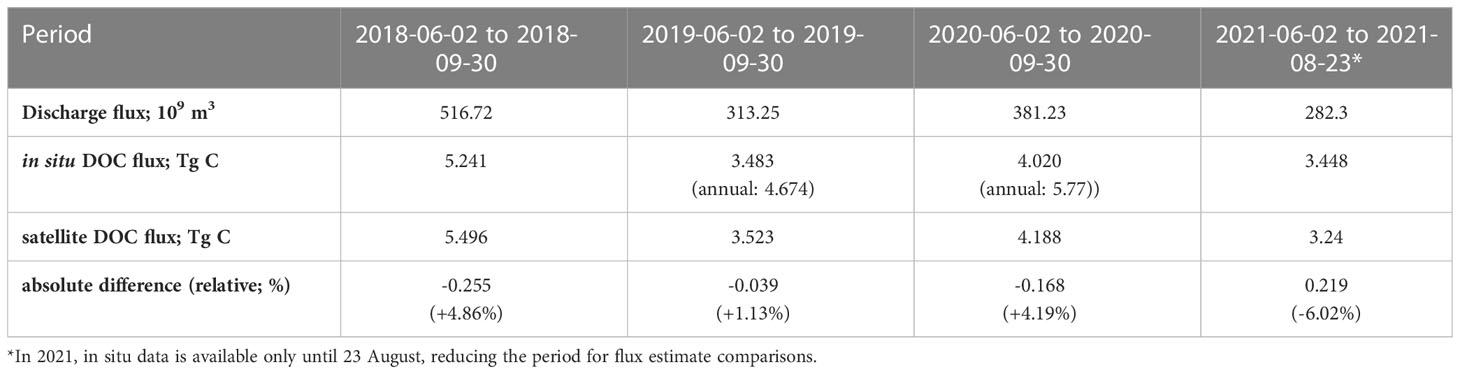
Table 1 Discharge, in situ measured DOC flux and satellite DOC flux and corresponding deviation for the four years. .
3.4 DOCSAT concentrations along the main course of the Lena River
Using all available satellite observations within a 10-day period, we are able to show a synoptic picture of DOCSAT concentrations along the entire main Lena River (Figure 1) over a total length of more than 3000 km. Figure 8 shows the DOCSAT concentration maps for two periods: a) first 10 days of June during the peak annual discharge, and b) 10 days at the end of August/beginning of September during the low flow period.
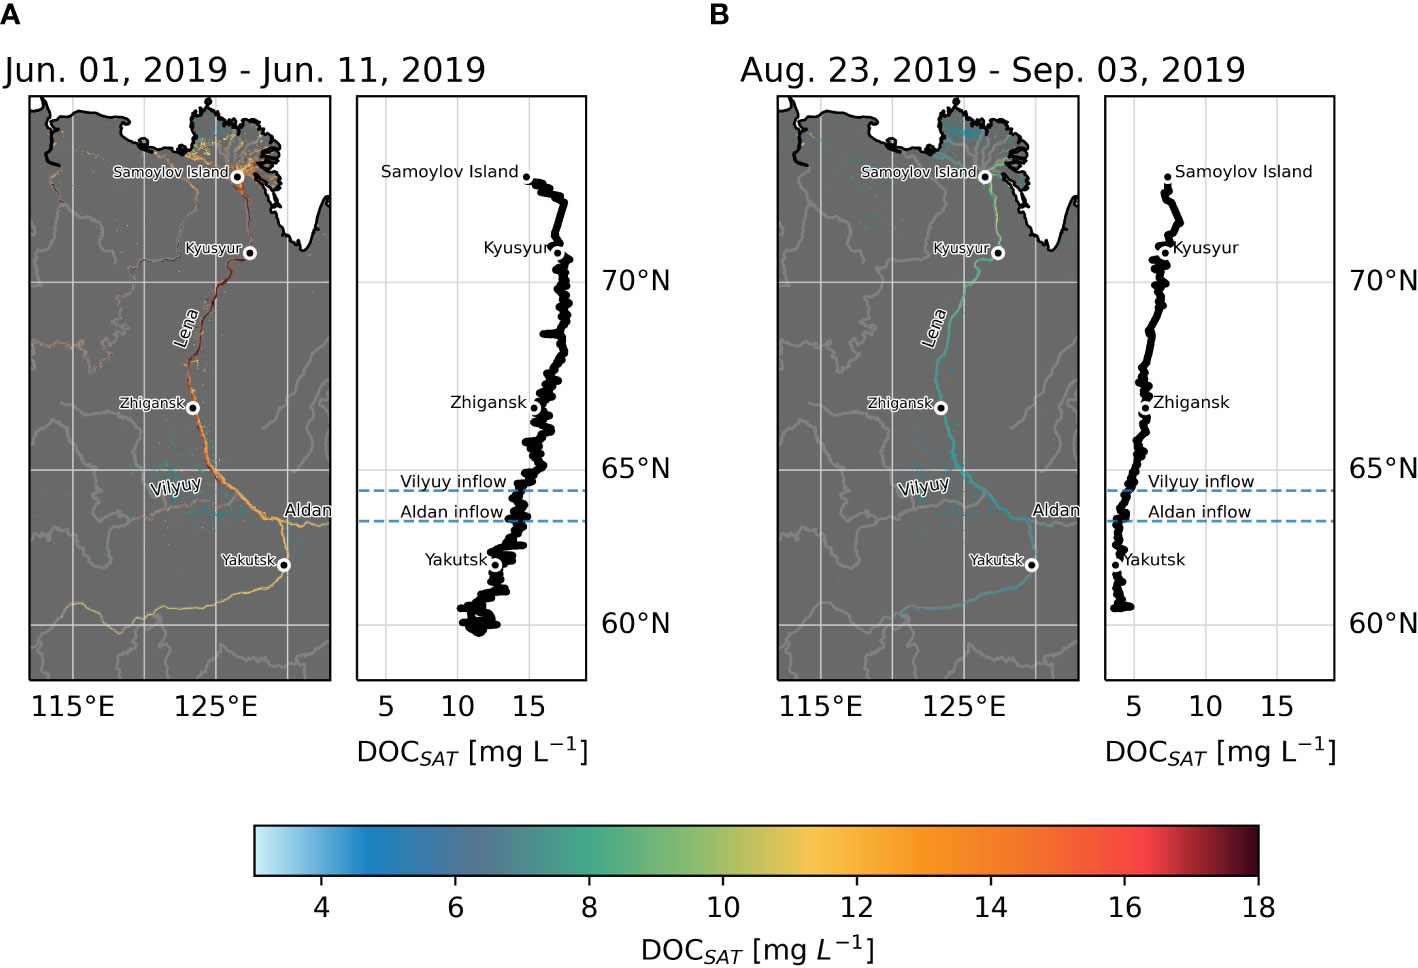
Figure 8 10-day Sentinel-3 OLCI DOCSAT concentration composites for the Lena River catchment and extracted transect along the main Lena River stem for (A) early June 2019 and (B) late August/beginning of September 2019.
In June (Figure 8A), DOCSAT concentrations range between 10.1 and 18.6 mg L-1, whereas during the summer period (Figure 8B), concentrations range between 3.4 and 8.5 mg L-1. The satellite-extracted DOC concentrations in both periods show a downstream increase along most of the Lena River. In the June composite, the DOCSAT concentrations are sharply decreasing before reaching the delta. In the summer composite, DOCSAT concentrations are at a considerably lower level (<4 mg L-1) upstream. After the confluence of the two biggest tributaries – the Aldan and Vilyuy River – DOCSAT concentration increases until the Lena River reaches the delta.
4 Discussion
4.1 Potential for monitoring DOC concentration, their fluxes and catchment variability with Sentinel-3 OLCI
Our results demonstrate the potential of monitoring DOC concentrations with remote sensing (Sentinel-3 OLCI) to complement and extend in situ DOC monitoring (Figures 6, 7). Despite the challenge of persistent cloud cover, the entire ice-free period can be monitored with OLCI due to the frequent revisit time of Sentinel-3 and the resulting high frequency of valid observations. In many cases, multiple valid observations per day could be obtained (Figure 2). Thus, the full seasonal variability of DOC concentration as well as most short-term events can be captured. The high observational density allows more direct estimates of DOCSAT fluxes (simple linear interpolation between observations) without the need to employ load estimator models (e.g., LOADEST, Runkel et al., 2004) as was done in many previous studies that reported flux estimates (e.g., Raymond et al., 2007; Holmes et al., 2012; Wild et al., 2019). These models rely on the relationship of discharge to DOC concentrations, which is not always stable and can thus lead to substantial errors.
Figure 7 and Table 1 show that flux estimates from in situ and satellite observations agree well for the years 2018 to 2020 (1.13 to 4.86%). Only in 2021, the difference between both flux estimates is higher (6%). The slightly higher DOCSAT fluxes in 2018 and 2020 are a result of the overestimation during the spring freshet. This higher difference in flux estimates is likely the result of extensive and very persistent cloud-cover in August 2021 in combination with exceptionally wide-spreading smoke plumes originating from wildfires over the extraction region. Due to the lower satellite observation density in that period, not all of the short-term DOC concentration increase (visible in the in situ observation) could be captured by satellite monitoring. However, in two cases in August 2021 the distance between samples exceeded eight days. This is also visible in a “jump” in DOC concentrations between two non-interpolated samples while before and after these two samples extended gaps can be seen (Figure 5). The absence of data might veil local extreme points similar to a feature seen in August 2018 while DOCSAT indicates such tendencies. This further underlines the merit of high frequency satellite observations to complement gaps in in situ records.
This study presents, to our knowledge, the first ever satellite-derived quasi-daily summer DOC concentration monitoring and flux estimates of DOC of the Lena River. Previous studies, which reported flux estimates, were based entirely on in situ samples (Raymond et al., 2007; Stedmon et al., 2011; Holmes et al., 2012; Wild et al., 2019). Other studies that employed remote sensing to monitor DOCSAT concentrations in Arctic rivers (Griffin et al., 2011; Herrault et al., 2016; Griffin et al., 2018; Huang et al., 2019) used single scenes from a variety of optical satellite sensors, however, not including Sentinel-3 OLCI to show the potential of remote sensing regarding its quality compared to in situ data. Nevertheless, they did not provide daily or even weekly time series or flux estimates for longer periods. In a study focusing on the Chesapeake Bay estuary in lower latitudes, Cao & Tzortziou (2021) showed that a combined use of Landsat-8 OLI and Sentinel-2 MSI data can result in up to weekly observations.
The main reason for the usage of sensors with higher spatial resolution (SPOT5, Landsat TM, ETM+ and OLI or Sentinel-2 MSI) is that they offer the application of remote sensing on smaller rivers, but at the same time they are very limited in their capacity for monitoring due to their substantially lower revisit frequency (resulting in only a few to dozen valid observations per year) when compared to Sentinel-3 OLCI. For big rivers such as the Lena River, however, the coarser spatial resolution of Sentinel-3 OLCI compared to, e.g., Sentinel-2 MSI does not affect the capability to find sufficient valid pixels in the river channel and even still allows observing cross channel variability at wide parts of the Lena River (Supplementary Figure 7). In addition, OLCI’s higher spectral resolution and narrower spectral response functions compared to Sentinel-2 MSI (Supplementary Figure 8) allows better spectral characterization of optically active constituents such as CDOM. In order to enable a flexible use of the presented retrieval, only bands that can be found both in Sentinel-3 OLCI and on its predecessor Envisat MERIS (2002 to 2012) were used. The inclusion of MERIS data in future studies will substantially extend the time series to almost two decades (MERIS: 2002 to 2012, OLCI: 2016 to present).
Since optical remote sensing observations are limited to the ice-free period, combinations of using satellite data, in situ data and models can help to obtain year-round fluxes. Bertin et al. (2022) used satellite-derived observations from the Moderate Imaging Spectrometer (MODIS) in the coastal bays surrounding the Mackenzie Delta in combination with a load estimation model to obtain export DOC fluxes of the Mackenzie River. However, the authors point out that the 1 km spatial resolution of MODIS is not sufficient to extract the signal within the river channels.
Influences of oceanic waters and processes such as flocculation within the coastal zones might alter the original river DOC concentration and affect export flux estimates. Even without the use of models to complement the ice-covered period, for the Lena River, most of the annual DOC export can be observed solely by satellite remote sensing since up to 75% of the annual DOC flux is transported in summer during the ice-free season. Permafrost thaw related changes in organic carbon fluxes from Arctic rivers are expected to affect mostly the warm periods in summer, when active permafrost degradation and mobilization of organic carbon can be observed. Therefore, despite the limitation of optical remote sensing for DOC monitoring a limited period in the year due to light and ice conditions, it is still a valuable tool for identifying potential future trends. In addition, as the ice cover duration shortens with ongoing warming, the period amenable to remote sensing lengthens.
The use of Sentinel-3 OLCI at full resolution not only allows monitoring the river at a single location, due to the large overlapping swaths and resulting frequent coverage it also offers the opportunity to map the DOCSAT concentration along large parts of the river and its catchment to identify up/downstream trends or local sinks and sources of DOC. Two examples of large-scale 10-day composites (Figure 7) show the potential of remote sensing to capture the geographical variability of DOC concentration within the main Lena River. In both composites, the increase of DOC concentrations from south to north indicates a downstream accumulation of DOC in the Lena River across its catchment. This downstream loading of DOCSAT agrees with findings by Griffin et al. (2011) for the Kolyma River despite the substantially smaller scales that were investigated in that study (300 km compared to >3000 km in this study). The very high DOCSAT concentrations within the southern parts of the Lena River and the sharp decrease at the very downstream end in the spring period (early June, Figure 7A) likely reflects the spring ice break-up and the pulse of associated short-term annual maximum peak of DOC concentrations (Figure 6) draining through the Lena River into the Arctic Ocean. In the late-summer composite (Figure 7B), we could identify substantial inflows of high DOC concentrations from tributaries (Aldan and Vilyuy River) resulting in the increase of Lena River DOCSAT concentrations downstream of the confluences. The large-scale 10-day composites contain DOCSAT observations for almost the entire length of the Lena River and parts of its tributaries and further demonstrates the advantage of Sentinel-3 OLCI compared to other satellites with higher spatial resolution but substantial lower revisit frequency and swath width. Since the DOCSAT shown in the composites is based on aCDOM(254) SAT from a locally tuned retrieval, degrading accuracy for other locations of the river is to be expected. While the exact quantities of aCDOM(254)SAT and DOCSAT might be off by a certain factor, we are confident that general trends and gradients will be retained.
4.2 Advances and challenges of optical remote sensing to monitor rivers
The aCDOM(254)SAT retrieval algorithm developed and applied in this study shows a reasonably good performance (R²=0.89, Bias=-1.18 m−1, RMSD=16.16 m−1, MAPD=12.83%). The striping along the y-axis is caused by the allocation of a high number of pixels from single scenes per in situ measurement within the 10 km radius around Samoylov Island. Including all pixels results in a significant variability of retrieved aCDOM(254)SAT, however, the vast majority of pixels (see colour in Figure 4 indicating the relative frequency) align with the 1:1 line, indicated by the yellow to red colour. The overestimation of aCDOM(254) and subsequently DOC during the extremely chaotic period within the ice break-up in late May to early June (Supplementary Figure 5) could be related to remnants of submerged ice or floating debris influencing the satellite retrieval. There are several further possible factors throughout the ice-free period that might influence the performance of DOCSAT concentration retrieval such as the residual influence of phytoplankton (e.g., phycocyanin absorption peak at 620 nm), which is not yet accounted for in the retrieval algorithm. CDOM and DOC are assumed to be distributed homogeneously in the Lena River within a few kilometers and within the water column. However, in some cases there are slight gradients in satellite-retrieved concentrations, e.g., between the edge and center of the river stem, which are likely related to retrieval errors due to the impact of particles. Applying the median over all available satellite pixels within a 10 km radius we get a value that represents the current state fairly well. Missing pixels (i.e., ice, clouds, non-converged AC) in a given scene reduce the number of available pixels and can constrain available pixels to a certain area. This might introduce biases and explain some of the larger deviations. None of the following factors had a significant effect on the performance parameters: the number of pixel observations, the standard deviation of the pixels (ρW(665)/ρW(560)) corresponding to a matchup, the spatial distance of the pixels to the in situ measurement (up to 10 km), or the temporal offset to an in situ observation within a 24-hour time frame.
Nevertheless, the retrieval presented in this study substantially outperforms other state-of-the-art aCDOM(λ) retrieval for optically complex and/or coastal Arctic waters. Using the same atmospheric correction (Polymer), the aCDOM(443,440) retrieval algorithms Garver–Siegel–Maritorena model for the Arctic (gsmA) (Matsuoka et al., 2013) and the OLCI Neural Network Swarm (ONNS) (Hieronymi et al., 2017) deliver significantly poorer performances when compared to in situ data (Supplementary Figure 9). Of the two algorithms, ONNS shows better results at a R² of 0.43 and RMSD of 2.6 m−1, however, it fails to resolve the higher aCDOM(440). This shows that for waters that are optically dominated by one constituent (in this case CDOM), a locally tuned custom algorithm is superior to algorithms that retrieve a set of constituents over a wide array of optical water types. However, band-ratio algorithms such as the one presented in this study need to be adapted if they are planned to be used in other regions or rivers with the same accuracy and precision. This applies both to the satellite retrieval of aCDOM(λ) and especially its conversion to DOCSAT, for which sufficient in situ data and matchups are necessary that cover the entire range of occurring concentration. Furthermore, the choice of atmospheric correction algorithm and resulting spectra can influence the performance of aCDOM(λ) retrievals. The algorithm presented in this study was developed with spectra that were corrected using Polymer. The other retrieval schemes (i.e., ONNS, gsmA) might perform better with spectra from different atmospheric corrections. In the case of the ONNS algorithm, neural networks and a blending of their results are chosen through an optical water type classification. Reflectances from the atmospheric correction Case 2 Regional CoastColour (C2RCC, Brockmann et al., 2016) are better exploitable than reflectances from Polymer using the water type classification scheme of ONNS and Juhls et al. (2022) showed that aCDOM(440)SAT from ONNS performed worked better with C2RCC spectra, rather than Polymer spectra. A new atmospheric correction is currently under development specially designed for ONNS (Hieronymi et al., 2023). Optical remote sensing at high latitudes suffers from a number of challenges. The polar night, low sun elevation in shoulder seasons, and ice and cloud cover substantially reduce the period in which river water can be monitored by remote sensing. The Arctic is prone to a frequent and persistent cloud cover and, in addition, wildfires emit smoke, which can impede optical remote sensing or at least make atmospheric correction even more challenging. Wildfire induced smoke has heavily influenced the observation density in 2021, when large parts of northern Siberia were covered in dense smoke plumes. Another challenge for using remote sensing for river monitoring is the sufficient widths of the river channel relative to the satellite sensor resolution to ensure uncontaminated pixels far enough from the shoreline. Due to the strong seasonality of the hydrograph, the width of the Lena River decreases with lower water level in late summer, reducing the potential number of valid river pixels that are not influenced by the land. Smaller channels that can be observed at high water levels disappear at low water levels.
Despite these challenges, depending on the number of available clear-sky pixels, a composite spanning the whole catchment of the Lena River can be created using just one to two days of OLCI data. Such composites allow insights into the large-scale distribution of DOCSAT in the Lena River and its short-term dynamics.
5 Conclusion
Satellite sensors such as Sentinel-3 OLCI are traditionally not thought of as capable of monitoring inland waters such as rivers. This study shows that despite being limited to large rivers there is a big potential in the use of moderate resolution imagers for inland river monitoring. We present a new DOCSAT retrieval scheme for Sentinel-3 OLCI for the Lena River that shows a good agreement with in situ data collected in the Lena River Delta. The high revisit frequency of the polar orbiting Sentinel-3 satellites can overcome the persistent cloud or wildfire smoke coverage and provides a striking density of remotely sensed observations for surface river water DOC concentrations. Using these high density observations, we were able to calculate DOCSAT fluxes for the spring to fall period for four consecutive years which agree highly with DOC fluxes calculated with in situ data. The limitation of optical remote sensing to the ice-free season is compensated by the low DOC fluxes within the ice-covered period. Thus, we can still capture up to 70-75% of the annual DOC flux. Remotely sensed observations are and will become an even more important tool to capture intra-annual and interannual differences and potential trends in DOC fluxes that might be associated with climate change and permafrost thaw induced mobilization of organic carbon. In addition to monitoring DOC fluxes at a single location of the Lena River, we used 10-day Sentinel-3 OLCI composites to derive the DOC concentration along the Lena River. This enabled us to identify increases in DOC concentration from north to south on large scales and helped to pinpoint the tributaries Aldan and Vilyuy as important sources for DOC in the Lena River. The synoptical capacities of satellite-derived observations can provide crucial information to improve our understanding of sources, dynamics and fate of organic carbon in Arctic rivers.
Continuous in situ monitoring of Arctic rivers means high logistical and financial costs and is often limited to single locations and/or short time periods. This study shows that satellite-borne DOC monitoring can spatially and temporally complement and expand in situ observations to provide a better spatio-temporal coverage. In future studies, the global coverage of satellites can be exploited to expand this work on other (Arctic) rivers if sufficient in situ data availability allows an evaluation of the quality of remotely sensed observations. Further, data from other satellite sensors such as MERIS can be used with the presented DOCSAT retrieval scheme in order to expand time series and detect potential trends during the past 20 years that can reveal the impact of climate change and expected consequent carbon mobilization from thawing permafrost in the Arctic. One of the challenges for spatially and temporally expanding the satellite monitoring of rivers is the high amount of data and computation power that is needed. Cloud storage and processing could play an important role in making these feasible.
Data availability statement
The datasets presented in this study can be found in online repositories. The names of the repository/repositories and accession number(s) can be found below: The in situ data sets used here are partly already and will further be made available online: https://doi.org/10.1594/PANGAEA.913197.
Author contributions
The initial idea and concept and methodology was developed by JE and BJ. Data acquisition and processing was done by JE, BJ, RP and MH. The writing of the original draft was led by JE and BJ and PO, MH, AM, RP, and JF contributed. Review and editing were done by JE, BJ, PO, MH, AM, RP, JF. All authors contributed to the article and approved the submitted version.
Funding
BJ has been funded by the European Space Agency (ESA) as part of the Climate Change Initiative (CCI) fellowship (ESA ESRIN/Contract No. 4000133761/21/I-NB). This research has been supported by the EU Horizon 2020 programme (Nunataryuk, grant no. 773421). MH has been funded by the Helmholtz research programme “Changing Earth – Sustaining our Future” Subtopic 4.1.
Acknowledgments
The Lena River Water Monitoring was conducted in the frame of the Russian-German LENA Expeditions and based at Research Station Samoylov Island. We thank all colleagues and station staff involved in the organizational and logistical support of the monitoring program. We especially thank Sergey Volkov, Andrei Astapov, and Ekaterina Abramova for the water sampling on Samoylov Island. Further we thank Antje Eulenburg, Martha Lütjen, Pia Esterl, Birgit Heim and Henrike Walther for their expertise and dedication to the analysis. For logistical support related to the Samoylov Lena River monitoring and Lena expeditions we thank Dr. Sofia Antonova, Jan Kahl, and Volkmar Aßmann. We acknowledge support by the Open Access Publication Initiative of Freie Universität Berlin.
Conflict of interest
The authors declare that the research was conducted in the absence of any commercial or financial relationships that could be construed as a potential conflict of interest.
Publisher’s note
All claims expressed in this article are solely those of the authors and do not necessarily represent those of their affiliated organizations, or those of the publisher, the editors and the reviewers. Any product that may be evaluated in this article, or claim that may be made by its manufacturer, is not guaranteed or endorsed by the publisher.
Supplementary material
The Supplementary Material for this article can be found online at: https://www.frontiersin.org/articles/10.3389/fmars.2023.1082109/full#supplementary-material
References
Aagaard K., Carmack E. C. (1989). The role of sea ice and other fresh water in the Arctic circulation. J. Geophysical Res. 94 (C10), 14485. doi: 10.1029/jc094ic10p14485
Amon R. M. W., Rinehart A. J., Duan S., Louchouarn P., Prokushkin A., Guggenberger G., et al. (2012). Dissolved organic matter sources in large Arctic rivers. Geochimica Cosmochimica Acta 94, 217–237. doi: 10.1016/j.gca.2012.07.015
Babin M., Stramski D., Ferrari G. M., Claustre H., Bricaud A., Obolensky G., et al. (2003). Variations in the light absorption coefficients of phytoplankton, nonalgal particles, and dissolved organic matter in coastal waters around Europe. J. Geophysical Research: Oceans 108 (7), 3211–3231. doi: 10.1029/2001jc000882
Bertin C., Matsuoka A., Mangin A., Babin M., le Fouest V. (2022). Merging satellite and in situ data to assess the flux of terrestrial dissolved organic carbon from the Mackenzie river to the coastal Beaufort Sea. Front. Earth Sci. 10 (January). doi: 10.3389/feart.2022.694062
Boggs P. T., Rogers J. E. (1990). Orthogonal distance regression. Center for Computing and Applied Mathematics, US Department of Commerce 1989, 183–194. doi: 10.1090/conm/112/1087109
Brockmann C., Doerffer R., Peters M., Stelzer K., Embacher S., Ruescas A., et al. (2016). “Evolution of the C2RCC neural network for Sentinel 2 and 3 for the retrieval of ocean colour products in normal and extreme optically complex waters,” in Proceeding of Living Planet Symposium, Prague: ESA SP, Volume 740. Available at: https://www.brockmann-consult.de/wp-content/uploads/2017/11/sco1_12brockmann.pdf.
Brüchert V., Bröder L., Sawicka J. E., Tesi T., Joye S. P., Sun X., et al. (2018). Carbon mineralization in laptev and East Siberian sea shelf and slope sediment. Biogeosciences 15 (2), 471–490. doi: 10.5194/bg-15-471-2018
Cao F., Tzortziou M. (2021). Capturing dissolved organic carbon dynamics with landsat-8 and sentinel-2 in tidally influenced wetland–estuarine systems. Sci. Total Environ. 777, 145910. doi: 10.1016/j.scitotenv.2021.145910
Carlson C. A., Hansell D. A. (2015). “DOM sources, sinks, reactivity, and budgets,” in Biogeochemistry of marine dissolved organic matter: Second edition. doi: 10.1016/B978-0-12-405940-5.00003-0
Charkin A. N., Dudarev O. V., Semiletov I. P., Kruhmalev A. V., Vonk J. E., Sánchez-García L., et al. (2011). Seasonal and interannual variability of sedimentation and organic matter distribution in the buor-khaya gulf: The primary recipient of input from Lena river and coastal erosion in the southeast laptev Sea. Biogeosciences 8 (9), 2581–2594. doi: 10.5194/bg-8-2581-2011
Efron B., Tibshirani R. J. (1994). An introduction to the bootstrap (New York, USA: Chapman and Hall/CRC). doi: 10.1201/9780429246593
EUMETSAT (2019) Recommendations for sentinel-3 OLCI ocean colour product validations in comparison with in situ measurements-matchup protocols. Available at: http://www.eumetsat.int.
Fichot C. G., Benner R., Kaiser K., Shen Y., Amon R. M. W., Ogawa H., et al. (2016). Predicting dissolved lignin phenol concentrations in the coastal ocean from chromophoric dissolved organic matter (CDOM) absorption coefficients. Front. Mar. Sci. 3 (FEB). doi: 10.3389/fmars.2016.00007
Frey K. E., McClelland J. W. (2009). Impacts of permafrost degradation on arctic river biogeochemistry. Hydrological Processes 23 (1), 169–182. doi: 10.1002/hyp.7196
Fuchs M., Palmtag J., Juhls B., Overduin P. P., Grosse G., Abdelwahab A., et al. (2022). High-resolution bathymetry models for the Lena delta and kolyma gulf coastal zones. Earth System Sci. Data 14 (5), 2279–2301. doi: 10.5194/essd-14-2279-2022
Gonçalves-Araujo R., Stedmon C. A., Heim B., Dubinenkov I., Kraberg A., Moiseev D., et al. (2015). From fresh to marine waters: Characterization and fate of dissolved organic matter in the Lena river delta region, Siberia. Front. Mar. Sci. 2. doi: 10.3389/fmars.2015.00108
Griffin C. G., Frey K. E., Rogan J., Holmes R. M. (2011). Spatial and interannual variability of dissolved organic matter in the kolyma river, East Siberia, observed using satellite imagery. J. Geophysical Research: Biogeosciences 116 (3), 1–12. doi: 10.1029/2010JG001634
Griffin C. G., McClelland J. W., Frey K. E., Fiske G., Holmes R. M. (2018). Quantifying CDOM and DOC in major Arctic rivers during ice-free conditions using landsat TM and ETM+ data. Remote Sens. Environ. 209 (October 2017), 395–409. doi: 10.1016/j.rse.2018.02.060
Guo L., Ping C. L., Macdonald R. W. (2007). Mobilization pathways of organic carbon from permafrost to arctic rivers in a changing climate. Geophysical Res. Lett. 34 (13), 1–5. doi: 10.1029/2007GL030689
Herrault P. A., Gandois L., Gascoin S., Tananaev N., le Dantec T., Teisserenc R. (2016). Using high spatio-temporal optical remote sensing to monitor dissolved organic carbon in the Arctic river yenisei. Remote Sens. 8 (10), 803–820. doi: 10.3390/rs8100803
Hieronymi M., Bi S., Müller D., Schütt E. M., Behr D., Brockmann C. (2023). Ocean color atmospheric correction methods in view of usability for different optical water types. Front. Mar. Sci 10.
Hieronymi M., Müller D., Doerffer R. (2017). The OLCI neural network swarm (ONNS): A bio-geo-optical algorithm for open ocean and coastal waters. Front. Mar. Sci. 4 (MAY). doi: 10.3389/fmars.2017.00140
Holmes R. M., Coe M. T., Fiske G. J., Gurtovaya T., Mcclelland J. W., Shiklomanov A. I., et al. (2013). “Climate change impacts on the hydrology and biogeochemistry of Arctic rivers,” in Climatic change and global warming of inland waters: Impacts and mitigation for ecosystems and societies, 3–26.
Holmes R. M., McClelland J. W., Peterson B. J., Tank S. E., Bulygina E., Eglinton T. I., et al. (2012). Seasonal and annual fluxes of nutrients and organic matter from Large rivers to the Arctic ocean and surrounding seas. Estuaries Coasts 35 (2), 369–382. doi: 10.1007/s12237-011-9386-6
Huang J., Wu M., Cui T., Yang F. (2019). Quantifying DOC and its controlling factors in major arctic rivers during ice-free conditions using sentinel-2 data. Remote Sens. 11 (24), 2904–2924. doi: 10.3390/rs11242904
IOCCG (2000) IOCCG report number 03: Remote sensing of ocean colour in coastal, and other optically-complex, waters. Available at: http://www.vliz.be/imis/imis.php?module=ref&refid=134621&request=147862.
IOCCG (2010) IOCCG report number 10: Atmospheric correction for remotely-sensed ocean-colour products. Available at: http://www.ioccg.org/reports/report10.pdf.
IOCCG (2015) IOCCG report number 16: Ocean colour remote sensing in polar seas general introduction. Available at: www.ioccg.org/reports/IOCCG_Report_16_2015.pdf.
Juhls B., Antonova S., Angelopoulos M., Bobrov N., Grigoriev M., Langer M., et al. (2021). Serpentine (Floating) ice channels and their interaction with riverbed permafrost in the Lena river delta, Russia. Front. Earth Sci. 9 (July). doi: 10.3389/feart.2021.689941
Juhls B., Matsuoka A., Lizotte M., Bécu G., Overduin P. P., el Kassar J., et al (2022). Seasonal dynamics of dissolved organic matter in the Mackenzie delta, Canadian Arctic waters: Implications for ocean colour remote sensing. Remote Sens. Environment 283, 113327–113346. doi: 10.1016/j.rse.2022.113327
Juhls B., Paul Overduin P., Hölemann J., Hieronymi M., Matsuoka A., Heim B., et al. (2019). Dissolved organic matter at the fluvial-marine transition in the laptev Sea using in situ data and ocean colour remote sensing. Biogeosciences 16 (13), 2693–2713. doi: 10.5194/bg-16-2693-2019
Juhls B., Stedmon C. A., Morgenstern A., Meyer H., Hölemann J., Heim B., et al. (2020). Identifying drivers of seasonality in Lena river biogeochemistry and dissolved organic matter fluxes. Front. Environ. Sci. 8 (May). doi: 10.3389/fenvs.2020.00053
König M., Hieronymi M., Oppelt N. (2019). Application of sentinel-2 msi in arctic research: Evaluating the performance of atmospheric correction approaches over arctic sea ice. Front. Earth Sci. 7 (February). doi: 10.3389/feart.2019.00022
Laukert G., Frank M., Bauch D., Hathorne E. C., Rabe B., von Appen W. J., et al. (2017). Ocean circulation and freshwater pathways in the Arctic Mediterranean based on a combined Nd isotope, REE and oxygen isotope section across fram strait. Geochimica Cosmochimica Acta 202, 285–309. doi: 10.1016/j.gca.2016.12.028
Lewis K. M., Arrigo K. R. (2020). Ocean color algorithms for estimating chlorophyll a, CDOM absorption, and particle backscattering in the Arctic ocean. J. Geophysical Research: Oceans 125 (6), 1–23. doi: 10.1029/2019JC015706
Mabit R., Araújo C. A. S., Singh R. K., Bélanger S. (2022). Empirical remote sensing algorithms to retrieve SPM and CDOM in québec coastal waters. Front. Remote Sens. 3 (April). doi: 10.3389/frsen.2022.834908
Matsuoka A., Boss E., Babin M., Karp-Boss L., Hafez M., Chekalyuk A., et al. (2017). Pan-Arctic optical characteristics of colored dissolved organic matter: Tracing dissolved organic carbon in changing Arctic waters using satellite ocean color data. Remote Sens. Environ. 200 (December 2016), 89–101. doi: 10.1016/j.rse.2017.08.009
Matsuoka A., Hooker S. B., Bricaud A., Gentili B., Babin M. (2013). Estimating absorption coefficients of colored dissolved organic matter (CDOM) using a semi-analytical algorithm for southern Beaufort Sea waters: Application to deriving concentrations of dissolved organic carbon from space. Biogeosciences 10 (2), 917–927. doi: 10.5194/bg-10-917-2013
McClelland J. W., Déry S. J., Peterson B. J., Holmes R. M., Wood E. F. (2006). A pan-arctic evaluation of changes in river discharge during the latter half of the 20th century. Geophysical Res. Lett. 33 (6), 1–4. doi: 10.1029/2006GL025753
McClelland J. W., Holmes R. M., Peterson B. J., Raymond P. A., Striegl R. G., Zhulidov A. V., et al. (2016). Particulate organic carbon and nitrogen export from major Arctic rivers. Global Biogeochemical Cycles 30 (5), 629–643. doi: 10.1002/2015GB005351
Menard H. W., Smith S. M. (1966). Hypsometry of ocean basin provinces. J. Geophysical Res. 71 (18), 4305–4325. doi: 10.1029/JZ071i018p04305
Obu J., Westermann S., Bartsch A., Berdnikov N., Christiansen H. H., Dashtseren A., et al. (2019). Northern hemisphere permafrost map based on TTOP modelling for 2000–2016 at 1 km2 scale. Earth-Science Rev. 193 (April), 299–316. doi: 10.1016/j.earscirev.2019.04.023
Opsahl S., Benner R., Amon R. M. W. (1999). Major flux of terrigenous dissolved organic matter through the Arctic ocean. Limnology Oceanography 44 (8), 2017–2023. doi: 10.4319/lo.1999.44.8.2017
Pefanis V., Losa S. N., Losch M., Janout M. A., Bracher A. (2020). Amplified Arctic surface warming and Sea ice loss due to phytoplankton and colored dissolved material. Geophysical Res. Lett. 47 (21). doi: 10.1029/2020GL088795
Peterson B. J., Holmes R. M., McClelland J. W., Vörösmarty C. J., Lammers R. B., Shiklomanov A. I., et al. (2002). Increasing river discharge to the Arctic ocean. Science 298 (5601), 2171–2173. doi: 10.1126/science.1077445
Prowse T., Alfredsen K., Beltaos S., Bonsal B., Duguay C., Korhola A., et al. (2011). Past and future changes in arctic lake and river ice. Ambio 40 (SUPPL. 1), 53–62. doi: 10.1007/s13280-011-0216-7
Qin P., Simis S. G. H., Tilstone G. H. (2017). Radiometric validation of atmospheric correction for MERIS in the Baltic Sea based on continuous observations from ships and AERONET-OC. Remote Sens. Environ. 200 (August), 263–280. doi: 10.1016/j.rse.2017.08.024
Rantanen M., Karpechko A. Y., Lipponen A., Nordling K., Hyvärinen O., Ruosteenoja K., et al. (2022). The Arctic has warmed nearly four times faster than the globe since 1979. Commun. Earth Environ. 3 (1), 1–10. doi: 10.1038/s43247-022-00498-3
Raymond P. A., McClelland J. W., Holmes R. M., Zhulidov A. V., Mull K., Peterson B. J., et al. (2007). Flux and age of dissolved organic carbon exported to the Arctic ocean: A carbon isotopic study of the five largest arctic rivers. Global Biogeochemical Cycles 21 (4), 1–9. doi: 10.1029/2007GB002934
Runkel R. L., Crawford C. G., Cohn T. A. (2004). Load estimator (LOADEST): A FORTRAN program for estimating constituent loads in streams and rivers. Techniques Methods U.S. Geological Survey. U.S. Department Interior 4, 69. doi: 10.3133/tm4A5
Semiletov I., Pipko I., Gustafsson Ö., Anderson L. G., Sergienko V., Pugach S., et al. (2016). Erratum: Acidification of East Siberian Arctic shelf waters through addition of freshwater and terrestrial carbon (Nature geoscience, (2016) 9 (361-365)). Nat. Geosci. 9 (6), 368. doi: 10.1038/ngeo2726
Shiklomanov A. I., Holmes R. M., McClelland J. W., Tank S. E., Spencer R. G. M. (2021). ArcticGRO discharge dataset (Arctic Great Rivers Observatory). Available at: https://www.arcticrivers.org/data.
Soppa M. A., Pefanis V., Hellmann S., Losa S. N., Hölemann J., Janout M. A., et al. (2019). Assessing the influence of water constituents on the radiative heating of laptev Sea shelf waters. Front. Mar. Sci. 6 (APR). doi: 10.3389/fmars.2019.00221
Stedmon C. A., Amon R. M. W., Rinehart A. J., Walker S. A. (2011). The supply and characteristics of colored dissolved organic matter (CDOM) in the Arctic ocean: Pan Arctic trends and differences. Mar. Chem. 124 (1–4), 108–118. doi: 10.1016/j.marchem.2010.12.007
Steinmetz F., Deschamps P.-Y., Ramon D. (2011). Atmospheric correction in presence of sun glint: Application to MERIS. Optics Express 19 (10), 9783. doi: 10.1364/oe.19.009783
Steinmetz F., Ramon D. (2018). “Sentinel-2 MSI and sentinel-3 OLCI consistent ocean colour products using POLYMER,” in Remote sensing of the open and coastal ocean and inland waters. Eds. Frouin R. J., Murakami H. (Honolulu, USA: SPIE), 13. doi: 10.1117/12.2500232
Terhaar J., Lauerwald R., Regnier P., Gruber N., Bopp L. (2021). Around one third of current Arctic ocean primary production sustained by rivers and coastal erosion. Nat. Commun. 12 (1), 1–10. doi: 10.1038/s41467-020-20470-z
Warren M. A., Simis S. G. H., Martinez-Vicente V., Poser K., Bresciani M., Alikas K., et al. (2019). Assessment of atmospheric correction algorithms for the sentinel-2A MultiSpectral imager over coastal and inland waters. Remote Sens. Environ. 225 (March), 267–289. doi: 10.1016/j.rse.2019.03.018
Wegner C., Bauch D., Hölemann J. A., Janout M. A., Heim B., Novikhin A., et al. (2013). Interannual variability of surface and bottom sediment transport on the laptev Sea shelf during summer. Biogeosciences 10 (2), 1117–1129. doi: 10.5194/bg-10-1117-2013
Wild B., Andersson A., Bröder L., Vonk J., Hugelius G., McClelland J. W., et al. (2019). Rivers across the Siberian Arctic unearth the patterns of carbon release from thawing permafrost. Proc. Natl. Acad. Sci. United States America 116 (21), 10280–10285. doi: 10.1073/pnas.1811797116
Keywords: Sentinel-3, Ocean and Land Colour Instrument (OLCI), CDOM, DOC, Lena River, fluxes, monitoring, Arctic
Citation: El Kassar J, Juhls B, Hieronymi M, Preusker R, Morgenstern A, Fischer J and Overduin PP (2023) Optical remote sensing (Sentinel-3 OLCI) used to monitor dissolved organic carbon in the Lena River, Russia. Front. Mar. Sci. 10:1082109. doi: 10.3389/fmars.2023.1082109
Received: 27 October 2022; Accepted: 03 March 2023;
Published: 17 March 2023.
Edited by:
Javier A. Concha, European Space Research Institute (ESRIN), ItalyReviewed by:
Yan Bai, Ministry of Natural Resources, ChinaZhidan Wen, Northeast Institute of Geography and Agroecology (CAS), China
Copyright © 2023 El Kassar, Juhls, Hieronymi, Preusker, Morgenstern, Fischer and Overduin. This is an open-access article distributed under the terms of the Creative Commons Attribution License (CC BY). The use, distribution or reproduction in other forums is permitted, provided the original author(s) and the copyright owner(s) are credited and that the original publication in this journal is cited, in accordance with accepted academic practice. No use, distribution or reproduction is permitted which does not comply with these terms.
*Correspondence: Jan El Kassar, amFuLmVsa2Fzc2FyQG1ldC5mdS1iZXJsaW4uZGU=
†These authors have contributed equally to this work and share first authorship