 Manal Hamdeno
 Aida Alvera-Azcaráte
- 1GeoHydrodynamics and Environment Research (GHER)/ Freshwater and OCeanic Science Unit of reSearch (FOCUS), University of Liège, Liège, Belgium
- 2Oceanography Department, Faculty of Science, Alexandria University, Alexandria, Egypt
Marine Heatwaves (MHWs) are considered one of the main consequences of global warming. MHWs negatively affect ecosystems, threaten economies, and intensify storms. In this work, we investigated the main characteristics of MHWs in the Mediterranean Sea from 1982 to 2020 and examined the relationship between their frequency and teleconnection patterns (e.g., East Atlantic Pattern (EAP) and East Atlantic/Western Russian Pattern (EATL/WRUS)). We then focused on the most intense MHW events that occurred in 2019 in the western Mediterranean Sea (WMB) and eastern Mediterranean Sea (EMB) by examining the link between the SST anomaly (SSTA) and various atmospheric forcings during these events. Our results showed that MHWs were more frequent and intense in the WMB than in the EMB on temporal and spatial scales, while the duration of MHWs was longer in the EMB. The trend of MHW frequency and duration in the Mediterranean Sea between 1982 and 2020 was about 1.3 ± 0.25 events/decade and 3.6 ± 1.16 days/decade, respectively. More than half of all MHW events in the Mediterranean Sea were recorded in the last decade (2011-2020). The results also showed that the EAP plays an important role in modulating MHW frequency in the Mediterranean Sea, with a strong positive correlation of 0.74, while the EATL/WRUS was strongly negatively correlated with MHW frequency in the EMB, with a correlation of about -0.60. In 2019, six MHW events were observed in the WMB, three of which were classified as strong events (SST exceeded two times the climatological threshold), while two events were detected and classified as strong events in the EMB. In the WMB, the 2019 MHWs extended to a depth of about 20 meters into the water column, while the MHWs in the EMB extended to greater depths of over 50 meters. The strong MHW events in the WMB were associated with a large positive heat flux anomaly and a shallow mixed layer. In the EMB, the high SSTA associated with MHW events caused heat loss from the ocean to the atmosphere and was associated with a shallow mixed layer and anomalously low mean sea level pressure. Finally, a negative relationship between the SSTA and surface Chl-a concentrations was observed during the 2019 MHW events. This negative influence of MHWs on Chl-a was more pronounced in the WMB than in the EMB, suggesting that the WMB MHW events were intense enough to infer a response to chlorophyll-a concentrations.
1 Introduction
Large-scale episodes of unusually high ocean temperatures, known as marine heatwaves (MHWs), have recently become a major concern in climate change research (Marx et al., 2021; Mohamed et al., 2022b) because of their destructive impacts on marine ecology and ecosystems (Olita et al., 2007; Selig et al., 2010; Bond et al., 2015; Frölicher and Laufkötter, 2018; Darmaraki et al., 2019a; Darmaraki et al., 2019b; Sen Gupta et al., 2020). MHWs have ecological and socioeconomic impacts, including coral bleaching, mortality of benthic communities, decrease in sea surface productivity, and loss of seagrass beds and kelp forests (Garrabou et al., 2009; Eakin et al., 2010; Chefaoui et al., 2018; Hughes et al., 2018; Le Grix et al., 2021). In addition, some organisms respond to MHW by shifting their geographic distribution, which in turn impacts fisheries and ecosystems both locally and globally (Mills et al., 2013; Kuroda and Yokouchi, 2017). MHW can result from atmospheric forcing, oceanic processes, or a combination of both, and the contribution of these factors can vary from event to event depending on the season and geographic location. Air-sea interactions, particularly heat and wind fluxes, are the most common causes of recorded MHWs (Mavrakis and Tsiros, 2019; Smale et al., 2019; Benthuysen et al., 2020; Ibrahim et al., 2021; Miyama et al., 2021). Overheating of the ocean surface due to anomalous air-sea heat flux is the most common cause of MHWs (Olita et al., 2007; Schlegel et al., 2021). Another important and well-documented cause of MHWs is heat advection by ocean currents, which can form areas of warm water (Oliver et al., 2017; Holbrook et al., 2019). Winds can either enhance or suppress warming during an MHW event, and large-scale atmospheric and oceanic teleconnection patterns can influence the likelihood of an MHW occurring in specific regions (Garrabou et al., 2009; Holbrook et al., 2019; Mohamed et al., 2021; Mohamed et al, 2022a).
The Mediterranean Sea lies between 30° to 46°N and 5°50’ W to 36°E as shown in Figure 1. It is a semi-enclosed basin separating Europe and North Africa. It covers a total area of 2.5 million km2. The average depth of the Mediterranean Sea is 1460 meters and the maximum depth is 5267 meters in the Greek Matapan Trench. The Strait of Sicily divides the Mediterranean Sea into two deep basins, and connects the Western Mediterranean (WMB) with the Ionian Sea. The Mediterranean Sea is connected to the Atlantic Ocean through the Strait of Gibraltar and to the Black Sea through the Dardanelles (Longhurst, 2007). The Mediterranean Sea is characterized by high salinity, high temperature and high density. In the Mediterranean, the net evaporation exceeds precipitation and drives an anti-estuarine circulation through the Strait of Gibraltar, contributing to very low nutrient concentrations (Tanhua et al., 2013). It plays a fundamental role in regulating regional climate (Pastor et al., 2020). Most of the processes of global ocean circulation occur within it, such as deep-water formation and thermohaline circulation. Summers in the Mediterranean are hot and dry, while winters are wet and cool (Criado-Aldeanueva and Soto-Navarro, 2020). The Mediterranean is also known for its distinctive regional features, which include strong seasonal temperature and precipitation contrasts, strong wind systems, heavy precipitation, and Mediterranean cyclones (Lionello et al., 2006; Nadia et al., 2006; Allam et al., 2020). The Mediterranean Sea is considered a hotspot of climate change (Skliris et al., 2012; Pastor et al., 2020; Soukissian and Sotiriou, 2022). Moreover, it is an area where offshore wind energy is currently in the development phase. The main intense wind regimes found in the Mediterranean Sea are, for example, the sirocco, a wind that blows from the Sahara desert towards the Mediterranean Sea and reaches high speeds especially in spring and autumn, the tramontana, a northerly wind that occurs in many Mediterranean countries, Mistral is a strong northwesterly wind that blows across the Rhône Valley into the Gulf of Lion in France, the Etesians are seasonal northerly winds that blow across the Aegean Sea in summer, and Bora is a northeasterly wind that blows in the Adriatic Sea, especially from November to March (Soukissian and Sotiriou, 2022). These wind systems shape the wind climate of the basin and influence SST variability and water circulation in the Mediterranean Sea (Soukissian and Sotiriou, 2022). The Mediterranean region is not only a climate change hotspot, but also a true biodiversity hotspot (Mannino et al., 2017; Criado-Aldeanueva and Soto-Navarro, 2020). Although it represents only a small portion of the world’s oceans, it hosts an unusually rich and diverse biota. It hosts about 17,000 species that account for 4-18% of the world’s marine biodiversity (Mannino et al., 2017).
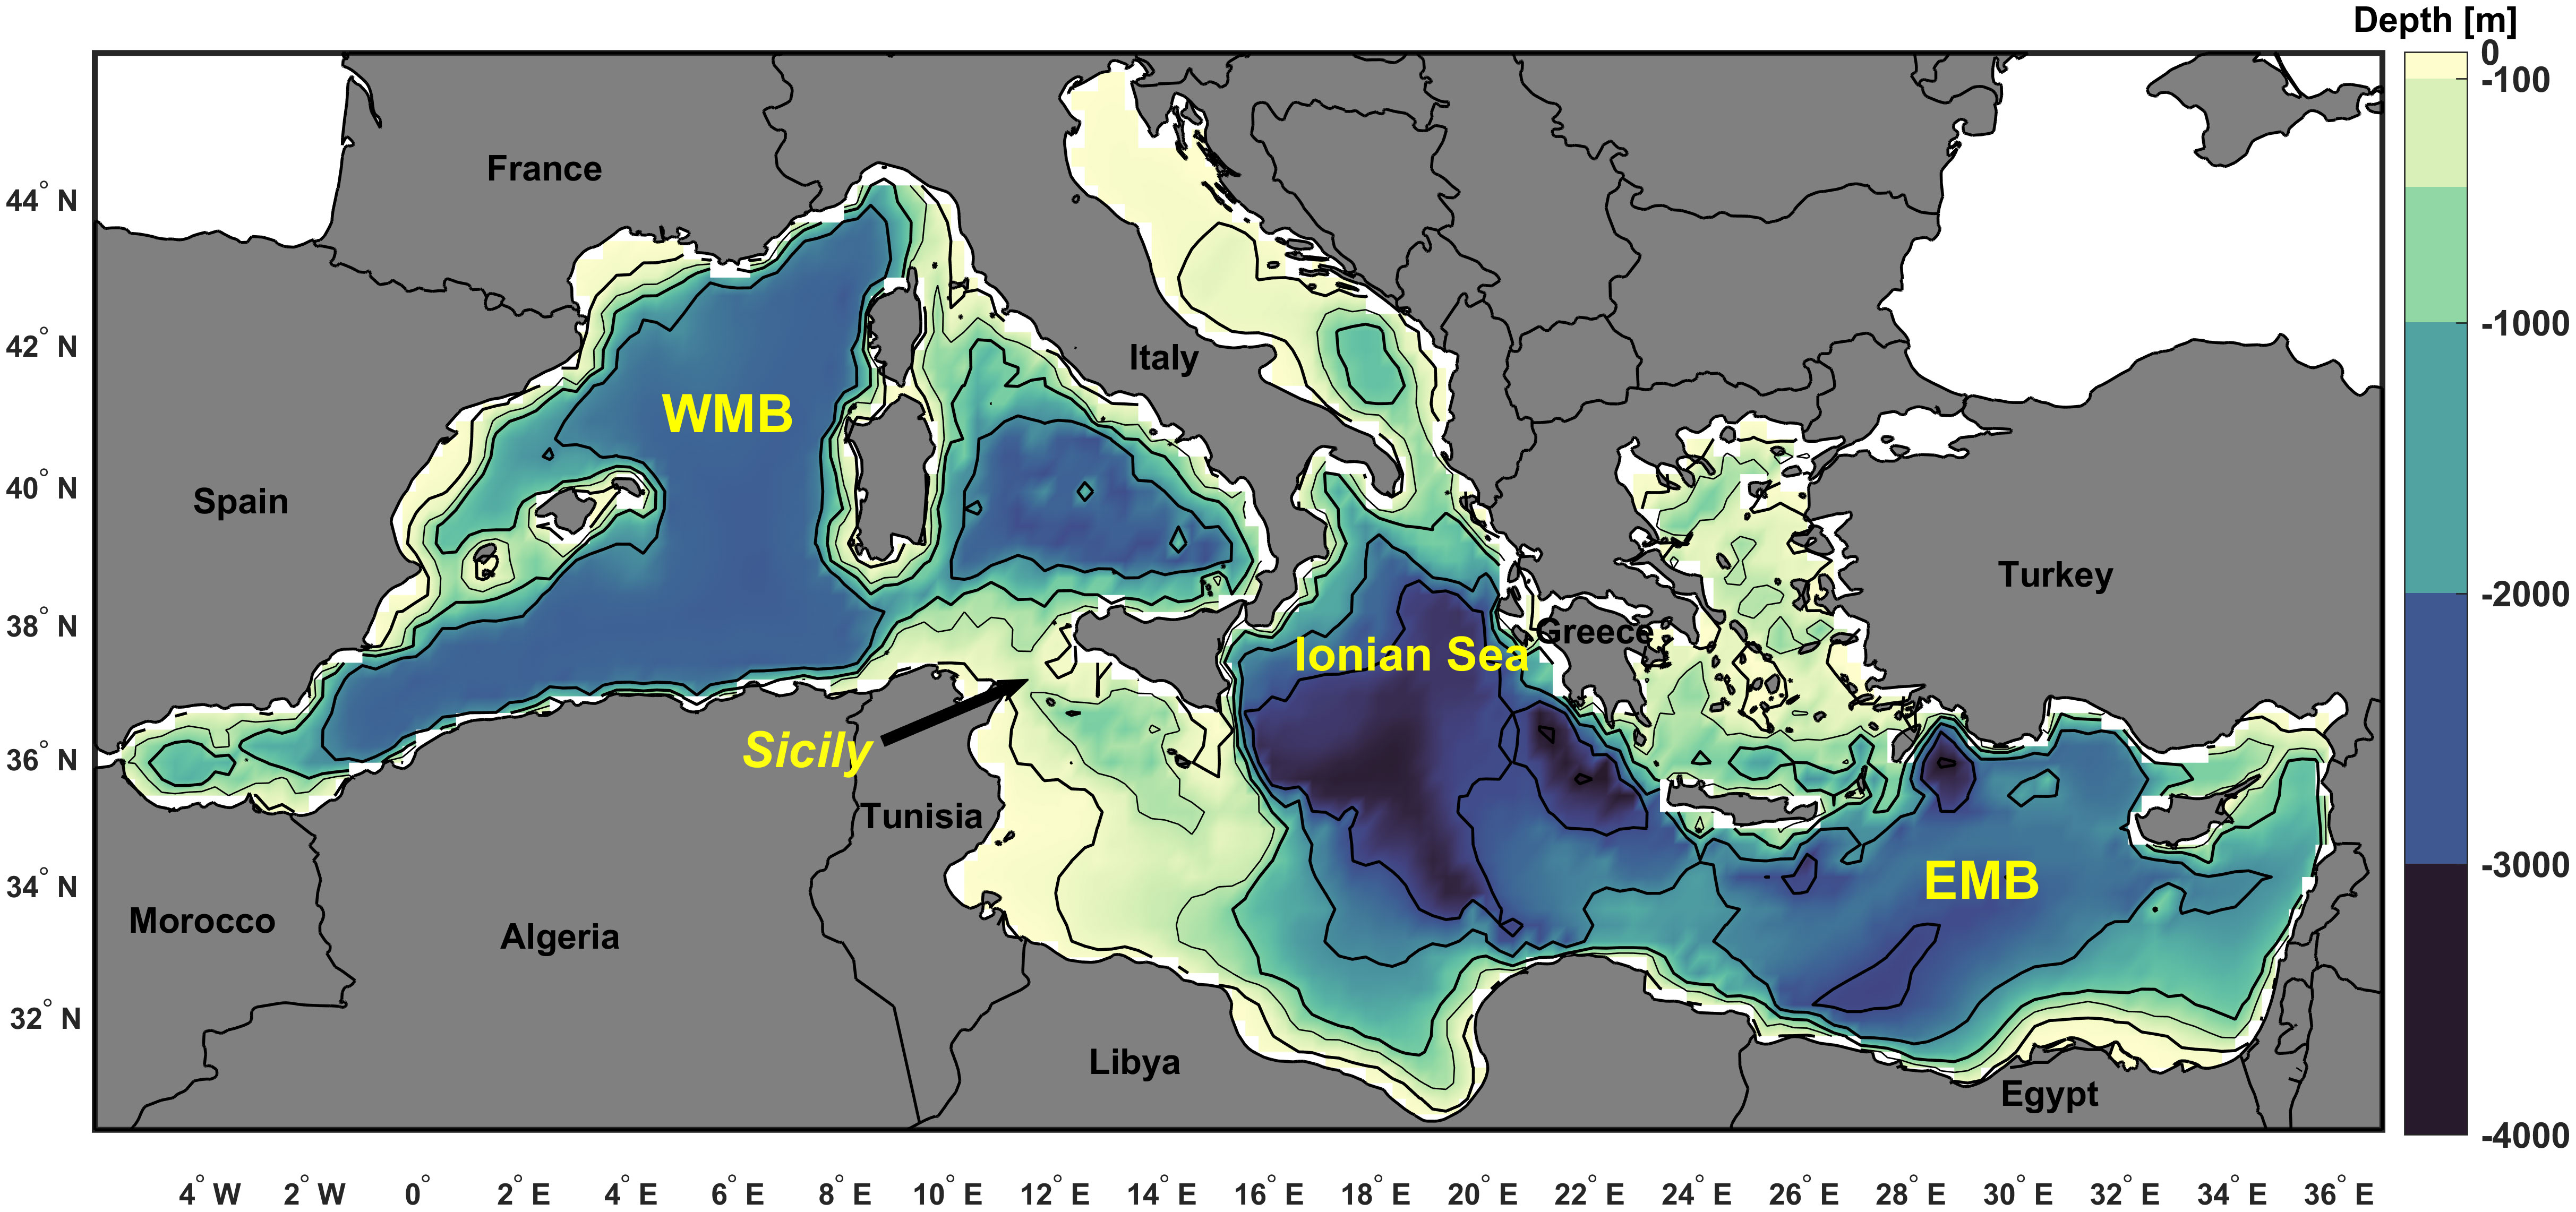
Figure 1 The Mediterranean Sea with the main geographic features (e.g., countries). The bathymetry is according to the GEBCO bathymetric dataset (www.gebco.net).
In the Mediterranean, SST variations are mainly controlled by variations in air-sea heat flux, vertical mixing, and horizontal heat advection. The inflow of North Atlantic surface water at the Strait of Gibraltar provides an important source of heat to the basin and balances the net heat loss from the sea surface and from the Mediterranean Sea. The Mediterranean Sea is one of the first ocean regions where temperature increase has been linked to the greenhouse effect, global warming, and large-scale climate variability (Bethoux et al., 1990; Skliris et al., 2012; Mohamed et al., 2019a). Due to the uniqueness and importance of the Mediterranean Sea ecosystem, some studies have focused on MHW events that have occurred in this region, using different approaches. For example, Sparnocchia et al. (2006) and Olita et al. (2007) have studied the MHW event that occurred in the WMB in 2003 which is one of the earliest known strong MHW events. During this event, SST anomalies reached ~3°C above the climatological mean due to a sharp increase in air temperature and a decrease in wind stress and air-sea exchange. This MHW event lasted more than a month. The same factors observed as driving the anomalous SST warming in the Eastern Mediterranean (EMB) during the 2007 heatwave, which was 5°C above the climatological average (Mavrakis and Tsiros, 2019). Ibrahim et al. (2021) examined the spatial variability and trends of MHWs in the EMB from 1982 to 2020 and found that the mean frequency and duration of MHW in the EMB have increased by 40% and 15%, respectively, over the past two decades. They also found that the 2020 MHW events was associated with a decrease in wind stress, an increase in air temperature, and an increase in mean sea level pressure. Recently, Juza et al. (2022) studied subregional MHWs in the Mediterranean Sea between 2012 and 2020. They found that subregional trend estimates for mean and maximum MHW intensity, mean duration, and number of events varied by 0.06-013 °C/decade, 0.26-0.55 °C/decade, 1.23-3.82 days/decade, and 1.1-1.8 events/decade, respectively. In addition, the study concluded that the most intense and near-surface events preferentially occur in summer and fall when the water column is most stratified, and that MHWs propagate deeper in the water column in winter when wind-driven vertical mixing weakens the stratification.
There is little knowledge about the variability of MHWs in the Mediterranean region and how it might be affected by large-scale climate variability. In our study, we focused on the relationship between the frequency of MHWs in the Mediterranean Sea and their relationship with the variability of large-scale climate modes (e.g., East Atlantic Pattern (EAP) and East Atlantic/West Russian Pattern (EATL/WRUS)) because they have been found to be correlated with the long-term warming trend in the Mediterranean Sea and to directly influence SST variability in the region (Bethoux et al., 1990; Skliris et al., 2012; Mohamed et al., 2019a). The East Atlantic Pattern (EAP) is the second prominent mode of low-frequency variability over the North Atlantic and occurs as the leading mode in all months. The EAP is structurally similar to the North Atlantic Oscillation (NAO) and consists of a north-south dipole of anomaly centers spanning the North Atlantic from east to west (Barnston and Livezey, 1987). The positive phase of the EAP is accompanied by above-average surface temperatures in Europe during all months. The East Atlantic/West Russian pattern (EATL/WRUS) is one of three prominent teleconnection patterns that affect Eurasia throughout the year (Barnston and Livezey, 1987). The EATL/WRUS pattern consists of four main anomaly centers. The positive phase is associated with positive height anomalies over Europe and northern China and negative height anomalies over the central North Atlantic and north of the Caspian Sea. The main surface temperature anomalies associated with the positive phase of the EATL/WRUS pattern reflect below-average temperatures over much of western Russia and northeastern Africa.
Most MHW research conducted in the Mediterranean region either focused on specific events (e.g., Sparnocchia et al. (2006); Olita et al. (2007); Mavrakis and Tsiros (2019)) or examined MHWs without investigating their relationship with the variability of large-scale climate modes (e.g., Ibrahim et al. (2021); Juza et al. (2022)). In the current study, we attempted to provide a comprehensive analysis of MHWs in the Mediterranean Sea. Thus, the objective of this work is to investigate the long-term spatiotemporal variability of SST and MHW in the Mediterranean Sea between 1982 and 2020. This work also compares the interannual variability of MHW occurrence in the WMB and EMB to gain a better understanding of whether the two basins are subject to coherent or different variability in their MHWs. The relationship between the frequency of MHWs and the variability of large-scale climate modes (e.g., EAP and EATL/WRUS) will also be investigated.
In summer 2019, Western Europe (France, Switzerland, Austria, Germany, Czech Republic, Italy, and Spain) was hit by two extreme atmospheric heatwaves that exceeded historical records by more than 1°C (Vautard et al., 2020; Sánchez-Benítez et al., 2022). These heatwaves had significant impacts on society, including several thousand deaths, and were considered the deadliest global disaster of 2019 (Vautard et al., 2020). The devastating impact of the 2019 heatwaves in Europe on society and human well-being prompted us to investigate how the effects of such events might affect the ocean. Therefore, we focused on the MHW events that occurred between June and December 2019 and their relationship to the heat flux anomaly, mixed layer depth anomaly (MLDa), and atmospheric variables (such as the air temperature anomaly (Ta), mean sea level pressure anomaly (MSLPa), and wind stress anomaly (WSa)). Finally, we examined the effects of the high SST anomaly (SSTA) on surface chlorophyll-a (Chl-a) concentrations in the WMB and EMB between June and December 2019.
2 Materials and methods
2.1 Datasets
Daily SST data from January 1982 to December 2020 are from the National Oceanic and Atmospheric Administration Optimum Interpolation Sea Surface Temperature NOAA OISST (Reynolds et al., 2007). This dataset is an interpolation of SST remote sensing values from AVHRR imagery into a regular 0.25° x 0.25° grid with daily temporal resolution. Mediterranean Sea data were extracted from the global data.
The European Centre for Medium-Range Weather Forecasts (ECMWF) ERA5 was used to obtain atmospheric variables and heat flux components (Hersbach et al., 2020). Atmospheric variables used were winds at 10 m (U10 and V10), air temperature at 2 m, and pressure at mean sea level. The total net flux at the sea surface was calculated using net shortwave radiation, net longwave radiation, latent heat flux, and sensible heat flux. The data set has a spatial resolution of 0.25° x 0.25° and an hourly time step.
Daily MLD and potential temperature at different water depths are from the Copernicus Marine Service (CMEMS) Ocean Data product. The data used is a physical reanalysis product generated by a numerical system consisting of a hydrodynamic model from the Nucleus for European Modelling of the Ocean (NEMO) and a variational data assimilation procedure (OceanVAR) for vertical temperature profiles. The horizontal grid resolution of the model is 0.04° x 0.04° and it has a daily temporal resolution (Escudier et al., 2020).
Daily average chlorophyll-a concentrations were taken from the Copernicus Marine Service (CMEMS). The dataset is newly processed surface chlorophyll concentrations from multiple satellite observations and daily climatology from SeaWiFS. The dataset has a spatial resolution of 0.04° x 0.04° and a daily temporal resolution (Garnesson et al., 2022).
Finally, the normalized time series of the East Atlantic Pattern (EAP) and the East Atlantic/West Russian Pattern (EATL/WRUS) were obtained from the NOAA Climate Prediction Centre.
2.2 Methods of analysis
2.2.1 The SST variability and trends
Empirical orthogonal functions (EOFs) analysis (Thomson and Emery, 2014) was used to assess the predominant spatiotemporal characteristics of SST variability from 1982 to 2020, using the monthly de-seasonalized and detrended SST dataset to focus on non-seasonal variability. Thus, before decomposing EOF, the seasonal cycle and linear trends were removed from the monthly mean SST anomalies in each grid cell, and each point time series was divided by its standard deviation to normalize SST (Fenoglio-Marc et al., 2012; Mohamed et al., 2019b). The mean seasonal cycle was estimated by calculating the monthly mean values for each calendar month at each grid point.
The SST anomalies were calculated by removing the historical climatological mean (1982-2020) at each grid point from the SST values at the same location (grid). The strong seasonal signal was removed from the SSTA data in each grid cell to obtain a de-seasonalized maps and time series (Skliris et al., 2012). This was done by subtracting the climatological mean of each calendar month from the corresponding months in all years. The least squares method (Wilks, 2019) was used to estimate linear trends in the deseasonalized monthly SSTA. The Modified Mann–Kendall test (MMK) (Hamed and Ramachandra Rao, 1998; Wang et al., 2020) was used to test the statistical significance of the trends. In this study, the significance level was set at p ≤ 0.05 to ensure that all reported trends were statistically significant at least at the 95% confidence level.
2.2.2 MHWs calculations and relation with the other variables
In this work, we applied the standard MHW definition of Hobday et al. (2016) to daily SST data from January 1982 to December 2020 to identify MHWs at the surface throughout the study period (1982-2020) and below the surface between June and December 2019. As defined by Hobday et al. (2016) an MHW is an unusually warm water event that persists for at least five or more consecutive days and during which SST exceeds the seasonally variable 90th percentile threshold. The climatological mean and 90th percentile threshold are calculated in each grid cell for each calendar day of the year using daily SST data over a 39-year (1982-2020). Two consecutive MHW events with a gap of 2 days or less are considered a single event. Each MHW event is described by a set of metrics as follows: Duration (in days) is “the time between the start and end dates of an event”, Frequency (in events) is “the number of events that occurred each year”, Mean Intensity (°C) is “the average SSTA values during the duration of the event”, Maximum Intensity (°C) is “the highest SSTA during an event”, Cumulative Intensity (°C.days) is “the integrated SSTA over the duration of the event”, and total days (in days) is “the sum of MHW days in each year” (Hobday et al., 2016; Hobday et al., 2018).
We used the MATLAB toolbox M_MHW to determine all MHW metrics (Zhao and Marin, 2019). Annual statistics and time series for MHW frequency and duration were calculated from 1982 to 2020 for each region (whole Mediterranean, EMB, and WMB). Linear trends in SSTA and MHW characteristics are estimated using the least squares method (Wilks, 2019) and their statistical significance is determined using the Modified Mann-Kendall test (MMK) at the 95% confidence level, which takes autocorrelation into account when assessing the significance of the trend (Hamed and Ramachandra Rao, 1998; Wang et al., 2020).
The annual temporal variations in these MHW characteristics are correlated with teleconnection patterns such as EAP, EATL/WRUS, and NAO to better understand the relationship between MHW and atmospheric-oceanic connections.
We used ERA5 data (e.g., U10, V10, air temperature, mean sea level pressure, and heat flux components) to examine atmospheric conditions during the most intense MHW event that occurred between June and December 2019 in both the WMB and EMB. Daily mean values of atmospheric variables were calculated by averaging hourly data. Atmospheric variables and MLD anomalies were constructed in the same manner as for SST based on a daily climatology from 1982 to 2020.
We estimated the surface net heat flux QT in W/m2 from June to December 2019 according to Thomson and Emery (2014) and as described in Pinardi et al. (2003) and Nagy et al, (2017), Nagy et al, (2021) as follows:
Where Qs is the amount of heat absorbed by the ocean from incident solar radiation in W/m2, Qb is heat loss from back radiation in W/m2, Qc is sensible heat loss from convection and conduction in W/m2, and Qe is heat loss from evaporation (latent heat) from the ocean surface in W/m2.
The wind stress components in east and north directions (τwx, τwy) were calculated according to Hellerman and Rosenstein (1983) and described by Nagy et al. (2020) in N/m2,
where ρa = 1.2 (kg/m3) is the density of air, CD is the drag coefficient and computed according to Hellerman and Rosenstein (1983), and (W) is the wind speed component (m/s), which represents the magnitude of the wind vector and is calculated as the square root of the summation of the squares of the wind components. Daily averages of atmospheric parameters were obtained by averaging hourly data.
Finally, we examined the role of SSTA during MHW events in modulating surface productivity (Chl-a) by calculating their correlation and comparing their time series between June and December 2019.
3 Results
3.1 Mediterranean SST variability and trends (1982-2020)
The first three EOF modes of SSTA explain about 76.57% of the total deseasoned variance in the SST data, as shown in Figure 1 in the supplementary material. The first mode explains 55.42% of the total deseasoned SST variance (Supplementary Figure 1A). The spatial pattern shows positive values throughout the Mediterranean Sea, indicating an in-phase oscillation of the entire basin around the steady-state mean. The highest SSTA variability was observed over the WMB and the Adriatic Sea. The lowest SSTA variability was observed in the EMB, with minimal amplitude in the Aegean Sea and Levantine Basin. This SST variability is due to two reasons: the first reason is the presence of strong and persistent winds such as Tramontane and Mistral in the northwestern Mediterranean Sea and the Etesian winds in the Levantine Basin (Pastor et al., 2018; Pastor et al., 2020); the second reason is the input of external water masses, such as the cold water inflow from the Atlantic Ocean through the Strait of Gibraltar into the Alboran Sea and the cold water inflow from the Black Sea through the Strait of Dardanelles into the Aegean Sea (Skliris et al., 2011; Skliris et al., 2012; Mohamed et al., 2019a). In the corresponding PC1 time series, the highest positive peak of interannual variability was found in the summers of 2003 and 2017, which were the warmest summers during our period of record as shown in Figure 2. The highest negative peak was observed in the winters of 1984 and 1996, the coldest winter during the study period (Supplementary Figure 1B). These results are in good agreement with Skliris et al. (2012) and Mohamed et al. (2019a). The second mode of SSTA explains about 15.56% of the total deseasoned variance in the SST data (Supplementary Figure 1C). The spatial distribution is a dipole with opposite variations between the WMB and EMB sub-basins. Maximum variability was found in the WMB, while maximum variability of opposite sign was observed in the Levantine and Aegean basins in the EMB. The corresponding PC2 time series show an alternation of positive and negative trends during the 1982-2020 period (Supplementary Figure 1D). The highest positive peak of interannual variability was found in the summers of 1985 and 1988, while the highest negative peak was observed in December 1984 and 2020. The third SSTA mode explains about 5.59% of the total deseasoned variance (Supplementary Figure 1E). The spatial distribution of this mode shows an out-of-phase oscillation of the central and western/eastern parts of the Mediterranean Sea. The highest variability was observed in the WMB (i.e., Alboran Sea) and EMB, while the lowest variability was observed in the central Mediterranean in the Ionian and Adriatic Seas (Supplementary Figure 1F). These results are consistent with those of Mohamed et al. (2019a) who studied the interannual variability and trends of SST from 1993 to 2017 and found the same pattern of distribution of the first three SST EOFs with different magnitudes.
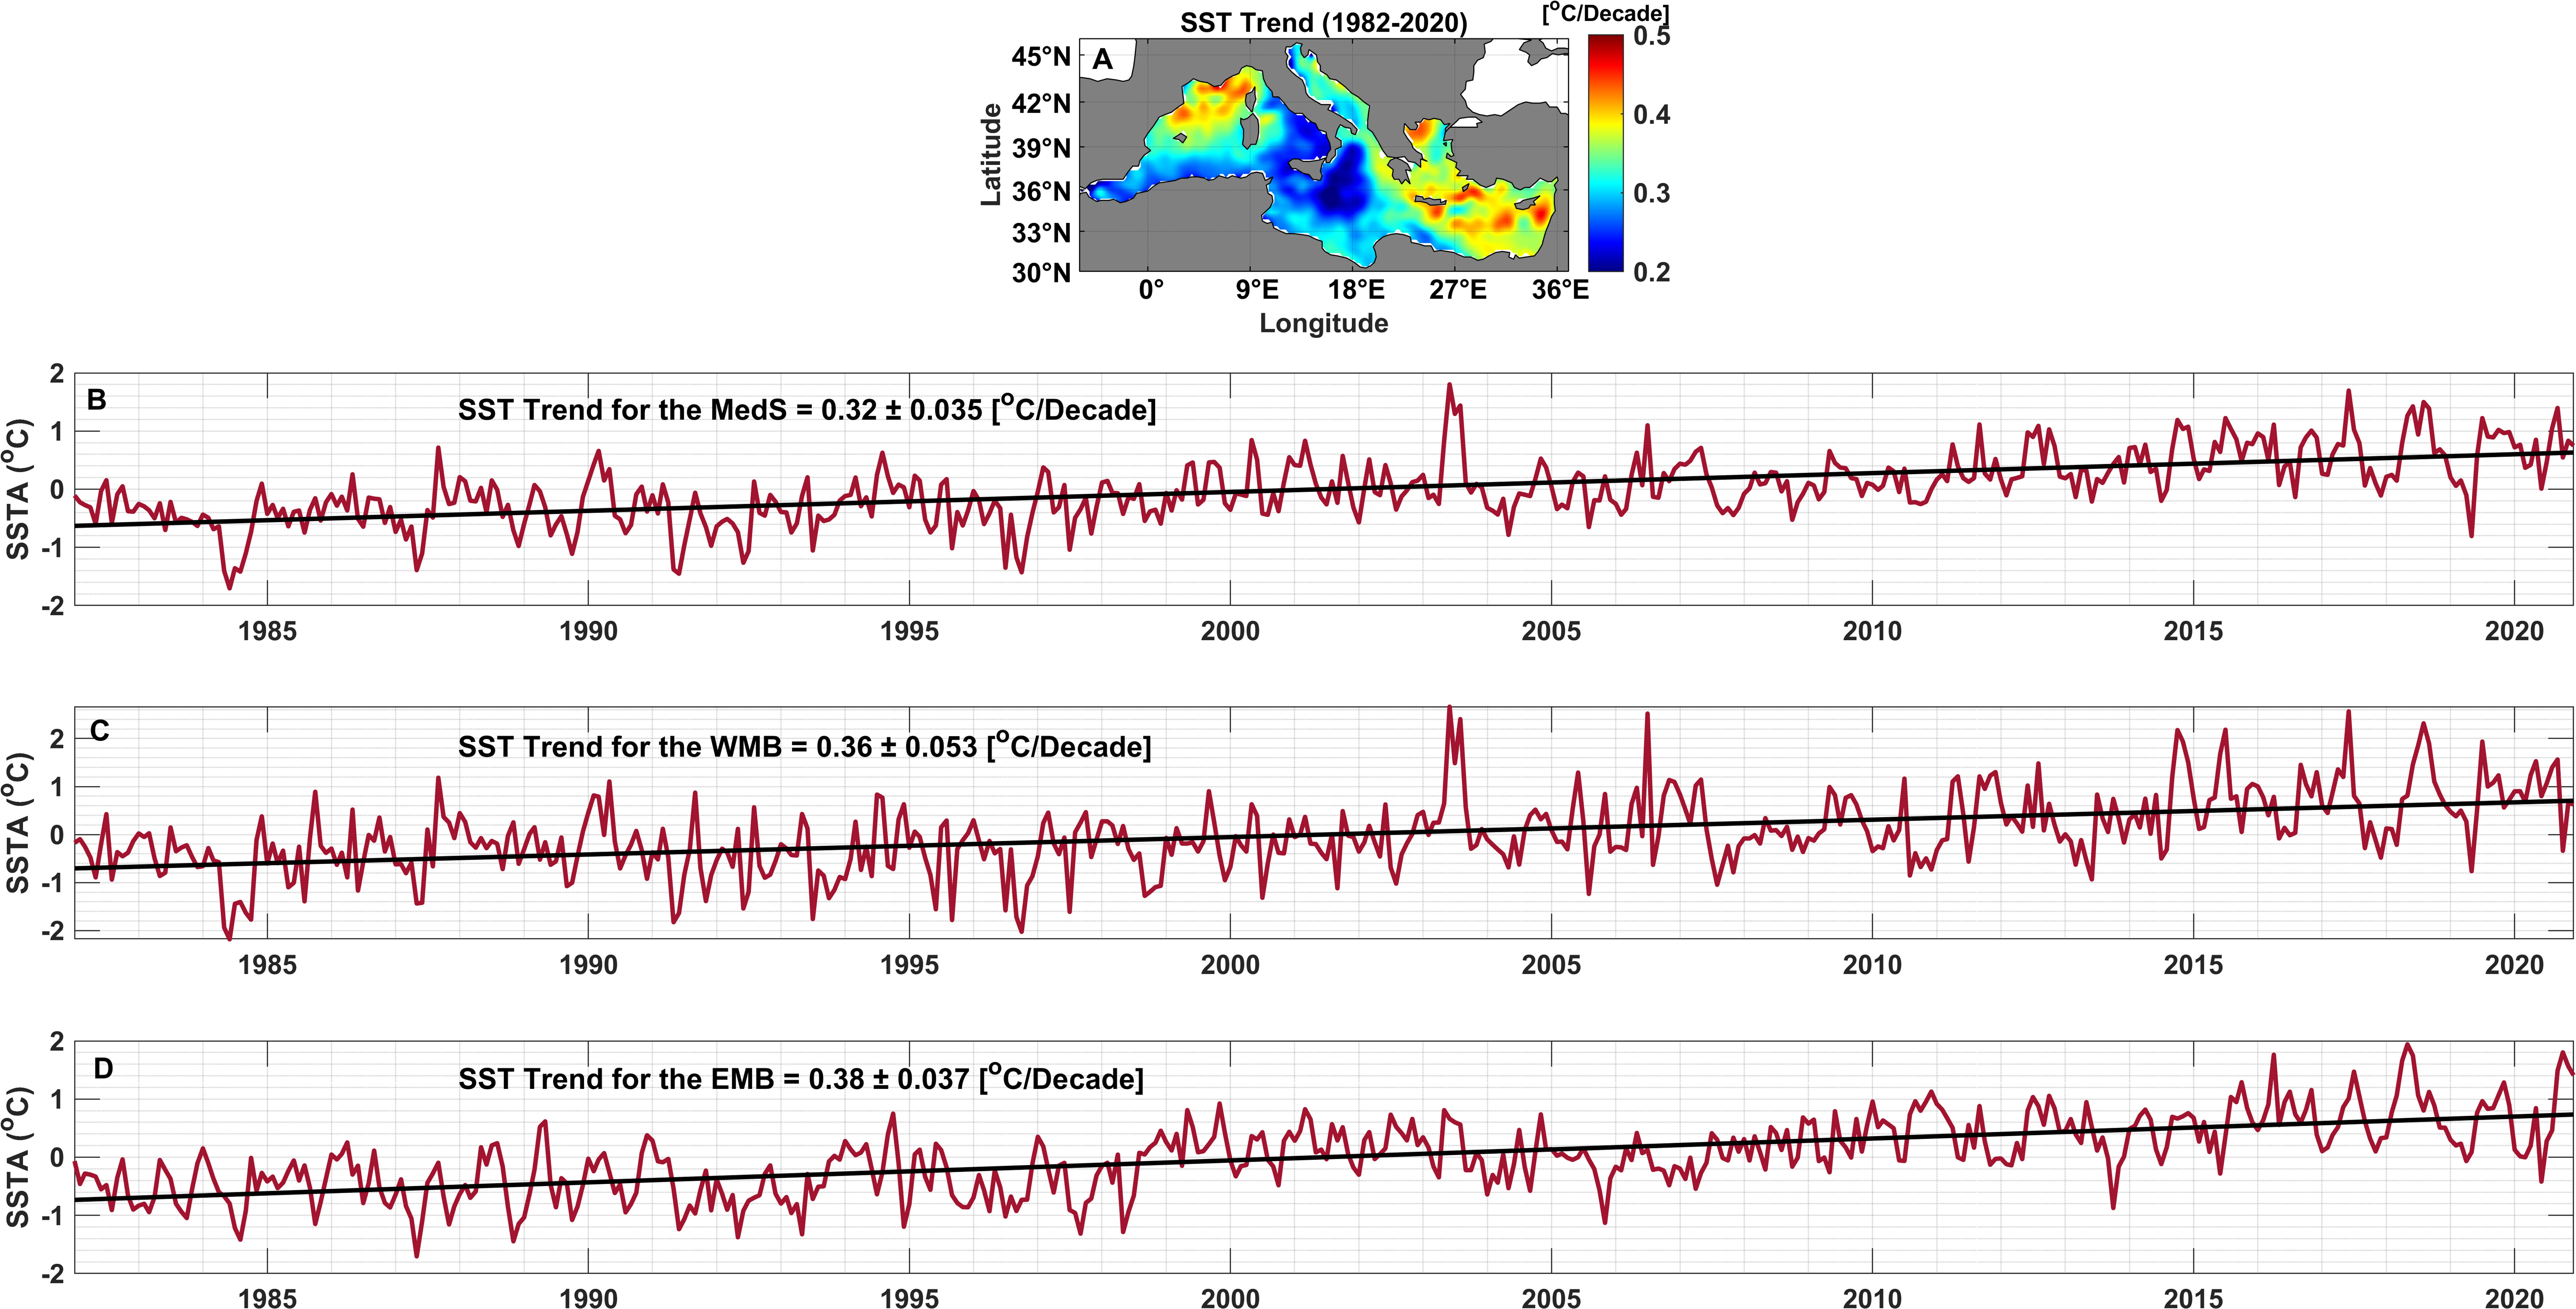
Figure 2 The spatial and temporal trend of Mediterranean SST from 1982 to 2020. (A) The spatial trend map of deseasonalized SST in °C/decade and the temporal trend of monthly averaged SSTA for the whole Mediterranean Sea (B), WMB (C), and EMB (D). The SSTA trend is shown by the solid black line.
Figure 2A shows the spatial trend map of deseasonalized SST from 1982 to 2020 in the Mediterranean Sea. A statistically significant (p< 0.05) trend was observed throughout the region with a 95% confidence interval. The linear trend in the Mediterranean Sea is not uniform, ranging from 0.2 to 0.5°C/decade. The WMB basin off the Gulf of Lions and the EMB basin in the Levantine Basin showed the strongest SST trends (> 0.45°C/decade). The lowest SST trends were observed in the Alboran and Ionian Seas (< 0.25°C/decade). Figures 2B–D shows temporal trends in monthly SSTA in the Mediterranean Sea, WMB, and EMB from 1982 to 2020. The temporal SSTA trends in the entire Mediterranean Sea, WMB, and EMB were 0.32 ± 0.035°C/decade, 0.36 ± 0.053°C/decade, and 0.38 ± 0.037°C/decade, respectively. In the WMB, the highest SSTA vaues were observed in 2003, 2006, 2014, 2015, 2017, and 2018, while in the EMB, the highest SSTA vaues were recorded in 2016, 2017, 2018, and 2020.
3.2 Marine heatwaves in the Mediterranean Sea (1982 - 2020)
In this section, we discuss the interannual variability of MHWs in the Mediterranean Sea between 1982 and 2020 and compare their occurrence in the WMB and EMB. We also show all the mean characteristics of MHWs during the study period. Finally, this section also discusses the relationship between MHW frequency and the EAP and EATL/WRUS climate modes.
3.2.1 Mediterranean Sea marine heatwaves interannual variability (1982-2020)
The temporal variability of the frequency and duration of MHWs and their relationship to annual SST in the Mediterranean Sea, WMB, and EMB during the study period are shown in Figures 3A–D. The annual MHW frequency in the Mediterranean Sea and its sub-basins varied from 0 to 7 events/year (Figure 3A). It can also be observed that the annual MHW frequency doubled during the last ten years of the study period. In the WMB, the highest annual MHW frequency (> 5 events/year) was recorded in 2006, 2011, 2012, and from 2015 to 2020, while in the EMB it was observed only in 2010 and 2016. A difference is observed between the variability of annual MHW duration in the WMB and EMB during the study period (Figure 3C). In the WMB, the annual MHW duration varied between 5 and 35 days/year, while in the EMB it varied between 5 and 47 days/year. The longest MHW duration (> 20 days/year) was recorded in the WMB in 2003, 2014, 2016, 2018, and 2020, while it was observed in the EMB in 2013 and from 2015 to 2020. During the study period (1982-2020), 96 MHW events occurred throughout the Mediterranean Sea, with a total of 1495 MHW days. More than half (54%) of the MHW events with 65.9% of the total MHW days have occurred in the last decade (2011-2020).
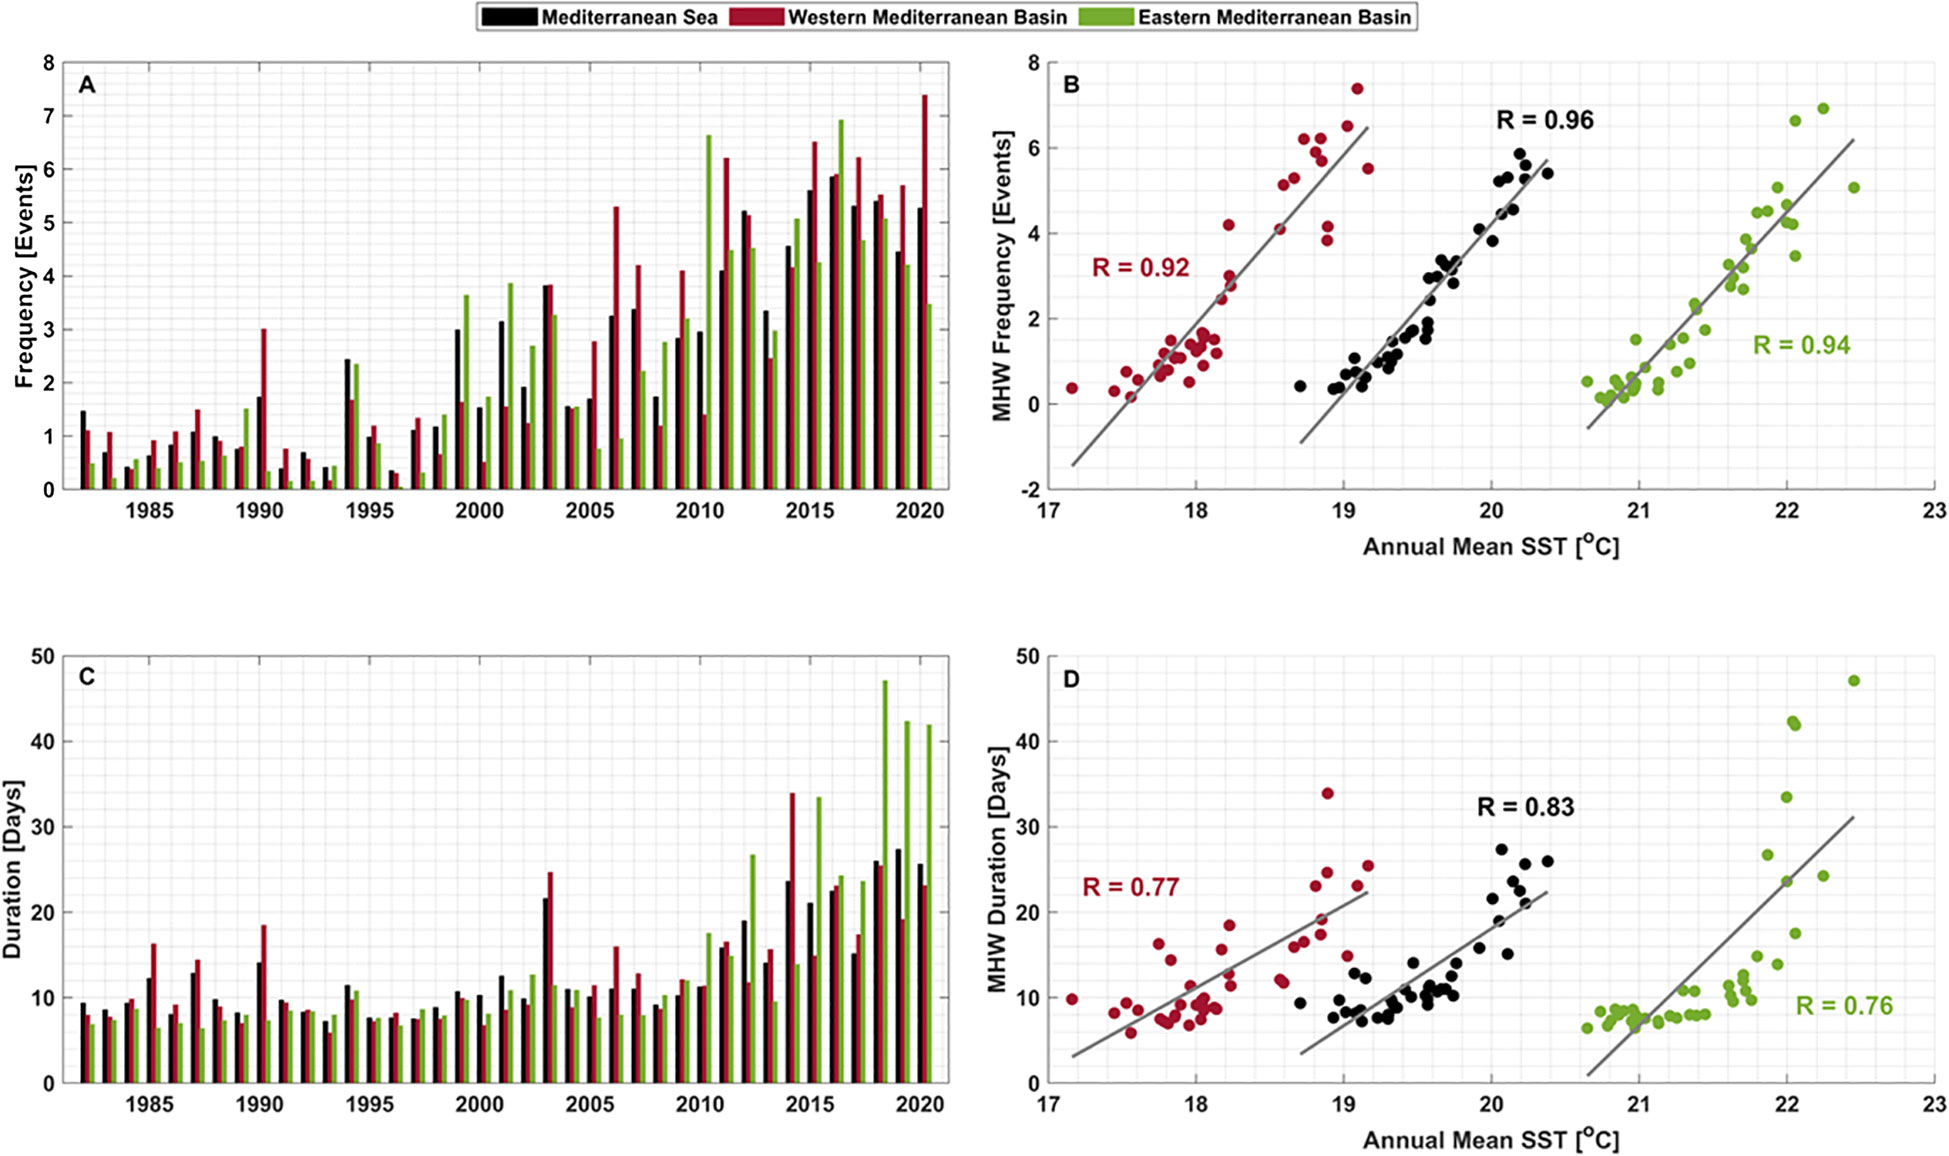
Figure 3 Interannual variability of MHW metrics, (A) annual mean MHW frequency (events/year), (B) scatterplots of annual mean SST versus annual mean MHW frequency, (C) annual mean MHW duration (days/year), and (D) scatterplots of annual mean SST versus annual mean MHW duration. The colors black, red, and green represent the entire Mediterranean Sea, the WMB, and the EMB, respectively.
Throughout the study period, the correlation between the regional annual mean SST and the annual mean MHW frequency and duration was calculated for Mediterranean Sea, WMB, and EMB and shown in Figures 3B, D, respectively. The strongest relationship was found between SST and MHW frequency, with correlation coefficients of 0.96, 0.92, and 0.94 for Mediterranean Sea, WMB, and EMB, respectively.
3.2.2 Mediterranean Sea marine heatwaves characteristics (1982-2020)
Figures 4A–F shows the spatial distribution of annual mean MHW characteristics across the Mediterranean Sea from 1982 to 2020. The Mediterranean Sea exhibits high spatial variability in MHW properties. The mean annual MHW frequency varied between 1.5 and 3.5 events, with the highest mean frequency values recorded in the northern part of the WMB, the Adriatic Sea, and the Aegean Sea (Figure 4A). The mean MHW duration ranged from 10 to more than 25 days (Figure 4B), with the longest MHW duration observed in the southeastern part of the EMB (Levantine Basin).
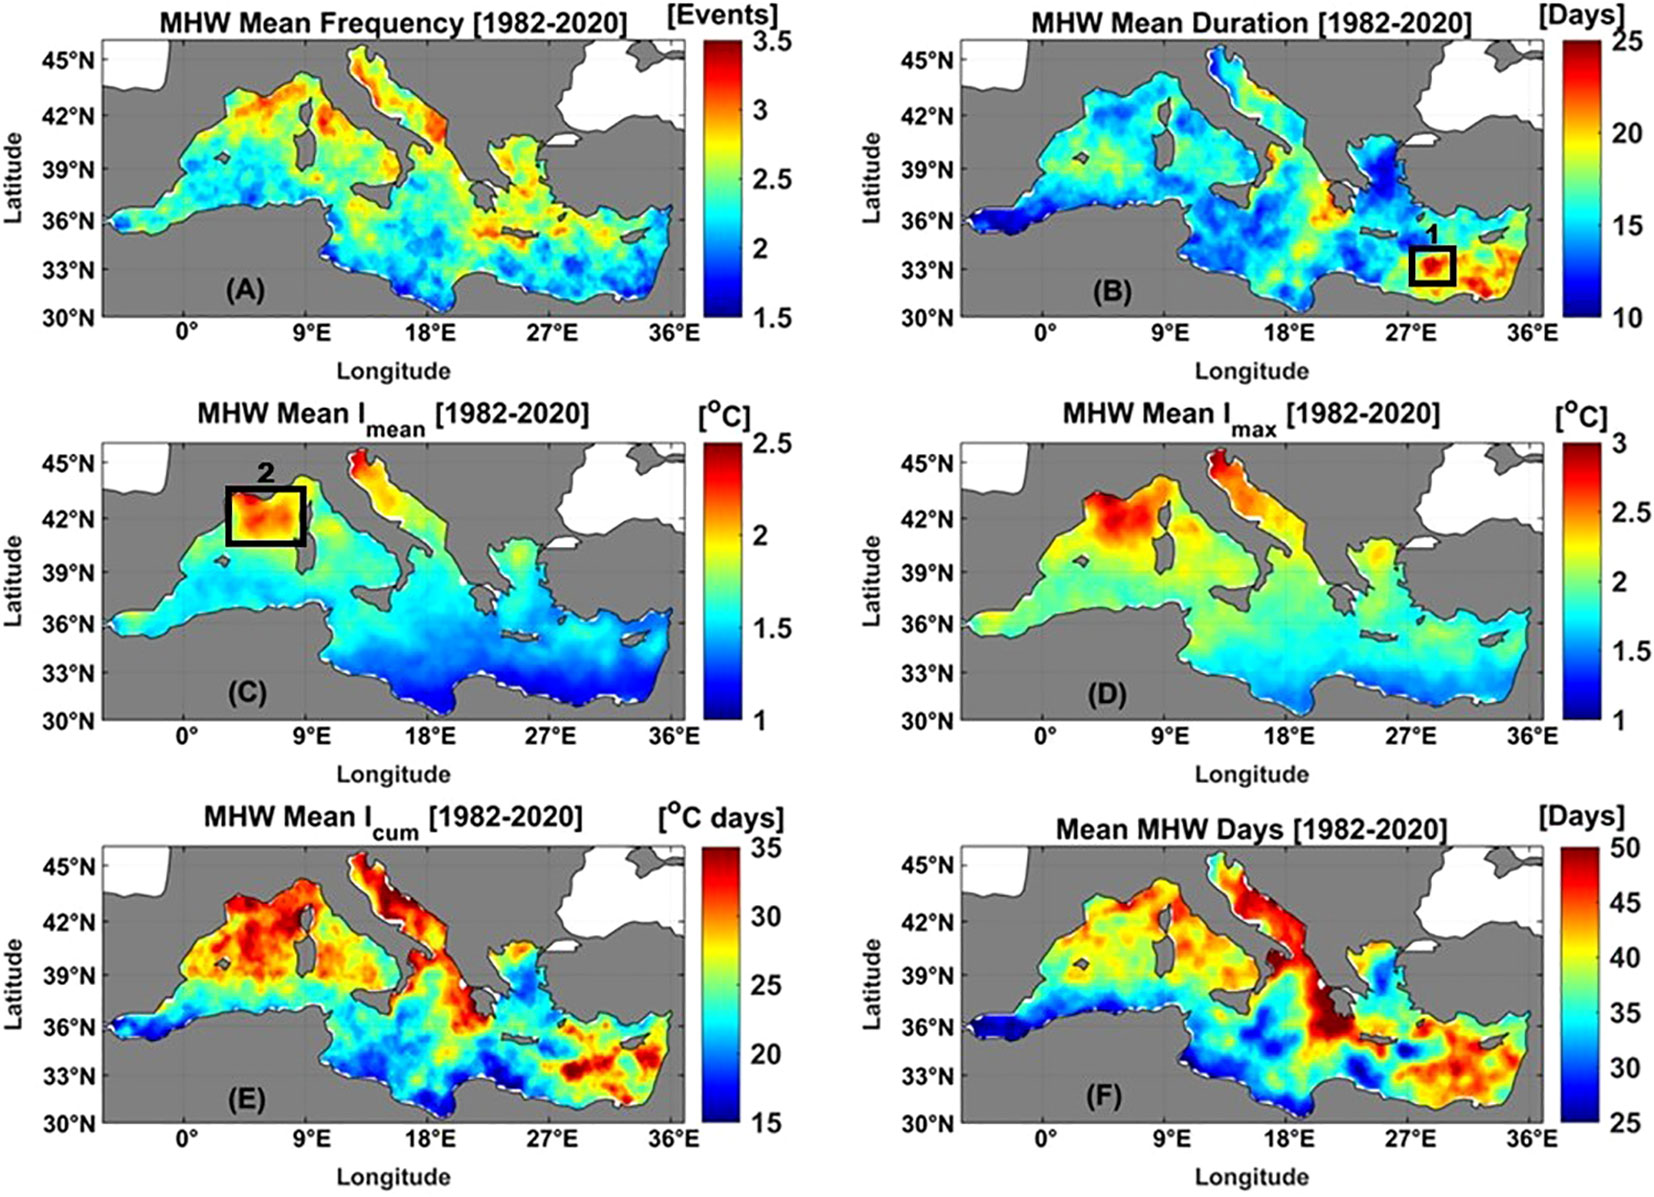
Figure 4 Main characteristics of marine heatwaves in the Mediterranean Sea during the study period (1982-2020), (A) mean MHW frequency (events), (B) MHW duration (days), (C) mean MHW intensity Imean (°C), (D) maximum MHW intensity Imax (°C), (E) MHW cumulative intensity Icum (°C.days), and (F) MHW total days (days). The black rectangles on panel B and C is showing the selected study regions that represents the EMB and the WMB, respectively.
The mean and maximum annual MHW intensities (Imean and Imax) showed the same pattern of spatial distribution with slightly different magnitudes (Figures 4C, D). The most intense MHWs were observed in the northern part of the WMB and in the northern Adriatic Sea. Moreover, both the mean annual cumulative MHW intensity (Icum) and the total number of days showed the same pattern of spatial variability (Figures 4E, F). Figure 4E shows that the mean annual MHW Icum varied between 15 and 35 °C. days, with the highest values (> 30 °C. days) found in the northern WMB, Adriatic Sea, and eastern part of the EMB. Mean annual MHW total days ranged from 25 to more than 50 days, with the highest values observed in the eastern Ionian Sea (Figure 4F).
The linear trend of MHW metrics (frequency, duration, intensity, and total days) was calculated for the entire Mediterranean Sea from 1982 to 2020, and their significance was tested with a 95% confidence interval. A significant linear trend (p< 0.05) was found for all MHW metrics. The trend for the frequency of MHWs was 1.3 ± 0.246 events/decade and for the duration of MHWs the trend was estimated to be 3.6 ± 1.16 days/decade. For the mean and maximum intensity of MHWs, the trends were 0.06 ± 0.04 °C/decade and 0.12 ± 0.06°C/decade, respectively. Finally, the trend of the cumulative intensity of MHWs was 6.69 ± 2.18 °C. days/decade and it was 27.84 ± 6.33 days/decade for the total days of MHWs.
3.2.3 Relationship between MHW and climate indices
Below, we examine the possible relationship between the climate indices (EAP and EATL/WRUS) and the annual frequency of MHW for the entire study area. Spatial correlation maps and linear correlations between the two climate indices and MHW frequency throughout the study area were calculated and plotted (see Figures 5A–D). A statistically significant high (> 0.65) positive correlation was observed between the EAP and MHW frequency in the Mediterranean Sea with a linear correlation of 0.74 (Figures 5A, B). The highest correlation values were found in WMB, EMB, and the Adriatic Sea. The lowest spatial correlation was found in the Ionian Sea and Alboran Sea. The spatial correlation between EATL/WRUS and MHW frequency varied between -0.1 and -0.7 with a linear correlation of -0.44 (Figures 5C, D). The highest negative (~ -0.6) correlation was observed in the EMB (Levantine Basin and Aegean Sea).
Figure 5 The relationship between annual MHW frequency and teleconnection patterns over the Mediterranean Sea from 1982 to 2020. The correlation map between MHW frequency and Eastern Atlantic pattern (A) and the scatter plot between them (B). The correlation map between the MHW frequency and the East Atlantic/West Russian pattern (C) and the scatter plot between them (D).
A comparison of the annual time series of MHW frequency (Figure 3A) and the annual time series of EAP (Figure 6A) also showed that both distributions were in very good agreement. Thus, between 1987 and 1994, the frequency of MHWs varied between 0 and 2 events/year, and this low frequency was related to low SSTA values (negative anomalies or close to zero; see Figure 2B) and the negative phase of the EAP. During the strong positive phase of the EAP (2012 - 2020), the frequency of MHWs was high, varying between 3 and 8 events/year, and the highest SSTA was observed during the study period in these years (Figure 2B). The negative correlation between the EATL/WRUS and MHW frequency was also observed when comparing their annual time series between 1982 and 2020 (Figures 3A, 6B).
Figure 6 The annual time series from 1982 to 2020 of (A) the Eastern Atlantic Pattern (EAP), and (B) the East Atlantic/West Russian Pattern (EATL/WRUS). The red and blue bars refer to the positive and negative phases of the climate indices, respectively.
3.3 Marine heatwave events in the Mediterranean Sea (June – December 2019)
To evaluate MHW events that occurred between June and December 2019 at the surface and subsurface in both the WMB and EMB, we selected a region representing each basin. As shown in Figure 4B, Region 1 represents the EMB, and this region suffers from the longest MHWs in the entire Mediterranean basin. Region 2, on the other hand, represents the WMB (Figure 4C), and this region suffers from the strongest MHWs that occurred in the entire region. The vertical extent of the MHWs was calculated at different depth levels using the same method used to calculate the MHWs at the surface. The temperature threshold was calculated based on the climatological mean of the water temperature at each depth (at the surface and at different levels of the water column); the results are shown in Figures 7–9. The MHW events in each basin were categorized as moderate (when SST exceeds the threshold), strong (when SST exceeds the threshold by a factor of two), severe (when SST exceeds the threshold by a factor of three), or extreme (when SST exceeds the threshold by a factor of four) according to the categorization scheme of Hobday et al. (2018).
Figure 7 MHW events between June and December 2019 in (A) WMB and (B) EMB. The yellow shaded area refers to the MHW event. The black solid line represents the SST, the black dotted line represents the climatology, the red solid line represents the threshold, and the red dotted lines define the MHW categories. The MHW categories are moderate (when SST exceeds the threshold), strong (when SST exceeds 2X threshold), severe (when SST exceeds 3X threshold), or extreme (when SST exceeds 4X threshold).
Figure 7A shows that six MHW events occurred in the WMB between June and December 2019. The Imean ranged from 1.81°C to 5.27°C, the Imax ranged from 2.25°C to 6.42°C, and the duration of the MHW events ranged from 5 to 20 days. Regarding the severity of the MHW events, three MHW events in the WMB were classified as strong (i.e., the SST exceeded twice the 90th percentile difference) and the remaining events were classified as moderate. The first strong event in the WMB basin lasted 15 days (26/06 to 10/07), and the Imean and Imax values associated with this event were the highest intensity values measured in the WMB basin during the study period. The second strong event in the WMB lasted 6 days (22/07 to 27/07) with an Imean and Imax of 4.14 and 4.8°C, respectively. Finally, the third strong MHW event in the WMB lasted 11 days (24/08 to 3/09) with an Imean and Imax of 4.18°C and 5.38°C, respectively. During the same period, there were only two MHW events in the EMB basin (Figure 7B). Comparing the EMB MHW events with the WMB events, these two events are characterized by low intensity (~ 2°C) and long duration (21 days for the first event and 159 days for the second), and both were classified as strong events in the EMB (Figure 7B).
To evaluate at what level the effect of the defined MHW events ended, subsurface MHW was calculated for both the WMB and EMB at the different depth levels from June to December 2019, see Figures 8 and 9. In the WMB, only the three strong categorized events extended to 15 m depth in the water column (Figures 8A–C), and the effect of these events ended at 20 m depth (Figure 8D). In the EMB, the effect of the MHW extended deeper than in the WMB, reaching to depths of 50 m. As in the WMB, the MHW in the EMB reached the subsurface only in the areas where the SST exceeded twice the threshold (Figure 9).
Figure 8 The penetration of MHW events into the water column in the WMB at different depths (A) 5m, (B) 10m, (C) 15m, and (D) 20m. The red shaded area refers to the MHW event. The black solid line represents the water temperature, the black dotted line represents the climatology, and the red solid line represents the threshold.
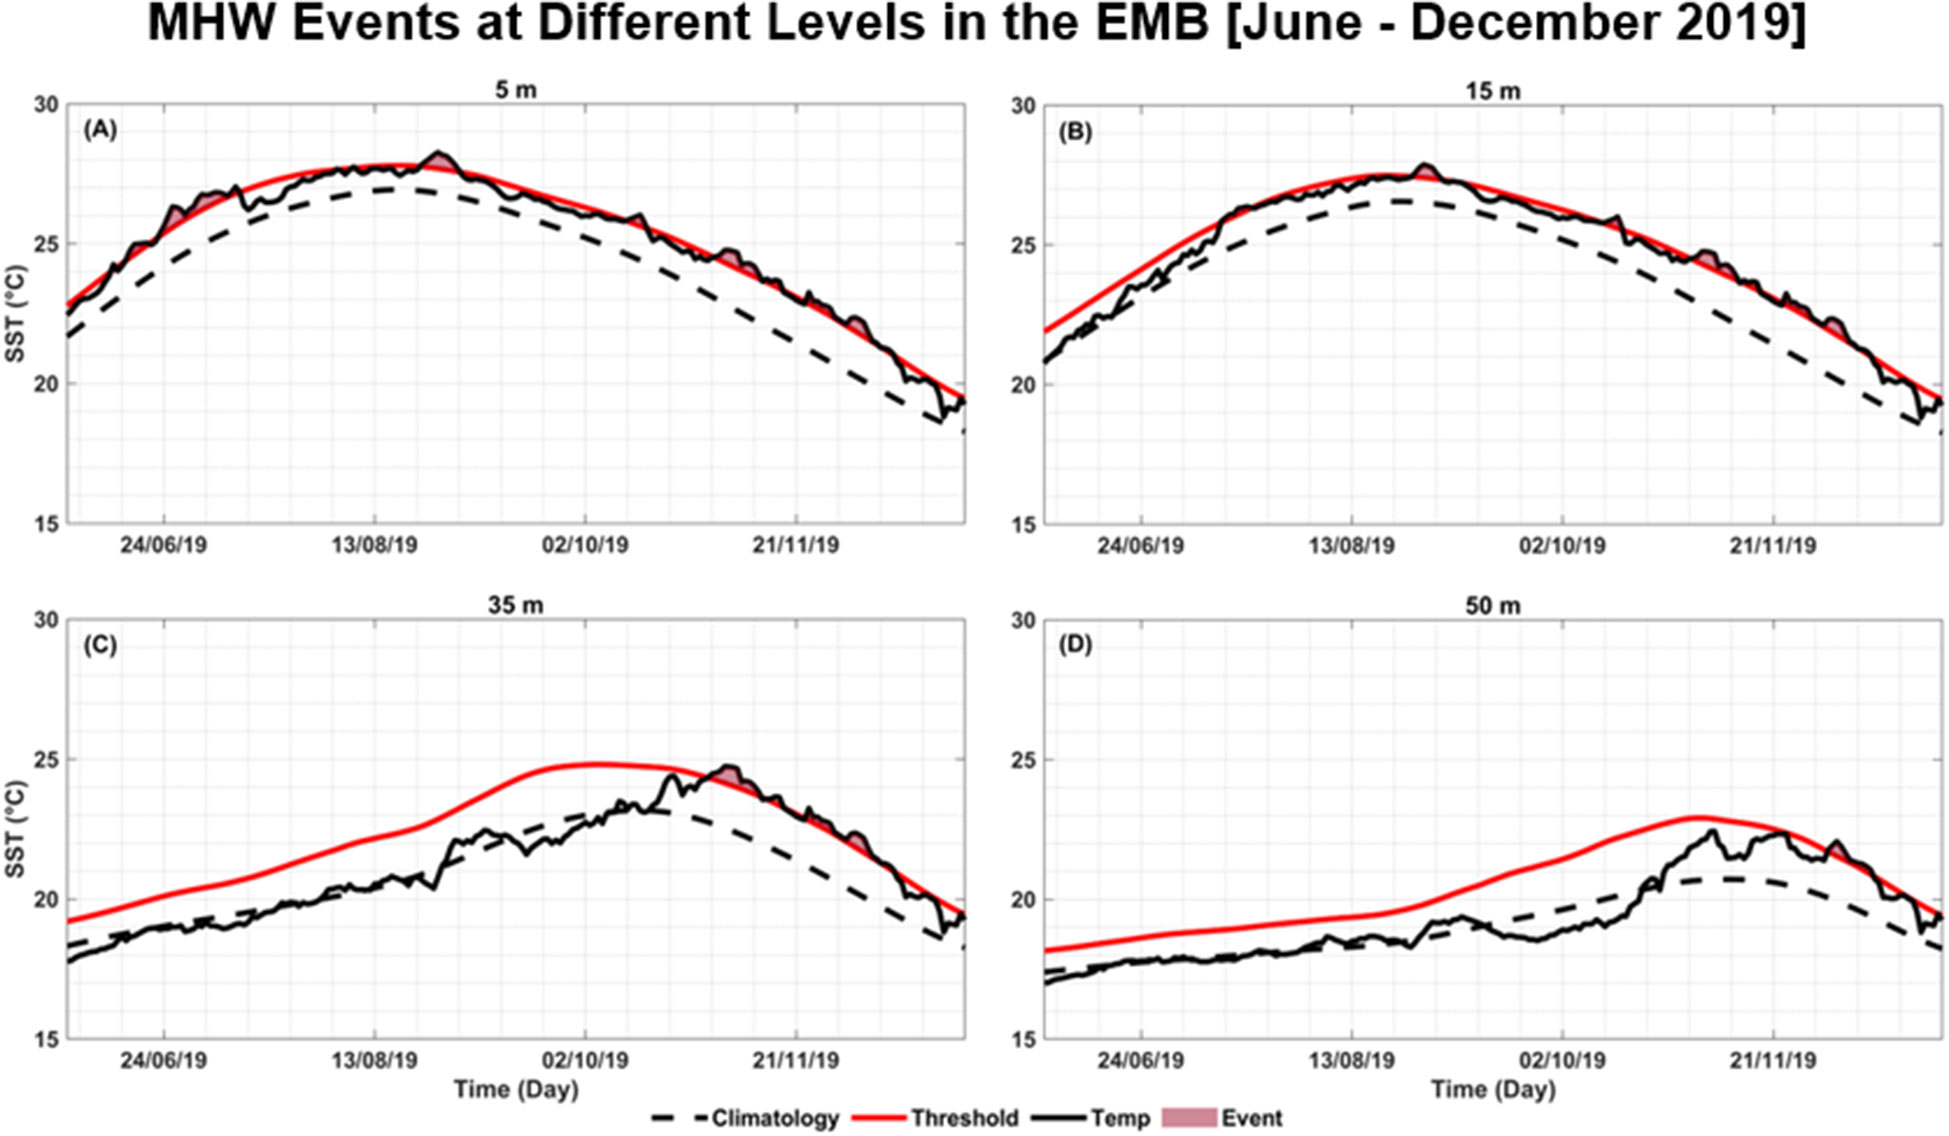
Figure 9 The penetration of MHW events into the water column in the EMB at different depths (A) 5m, (B) 15m, (C) 35m, and (D) 50m. The red shaded area refers to the MHW event. The black solid line represents the water temperature, the black dotted line represents the climatology, and the red solid line represents the threshold.
3.3.1 Atmospheric conditions associated with the 2019 marine heatwaves in the Mediterranean Sea
In this section, we examine the link between atmospheric conditions (e.g., heat flux, air temperature, mean sea level pressure, and wind stress) and MHW events that occurred in the WMB and EMB between June and December 2019. We focus here on those events that are classified as strong events (i.e., SST exceeded twice the threshold) and had the ability to penetrate deep into the water column (as discussed in Section 3.3). For both WMB and EMB, the atmospheric variable anomalies were compared to the SSTA during the duration of the MHW events (Figures 10, 11, and Supplementary Figures 2-4).
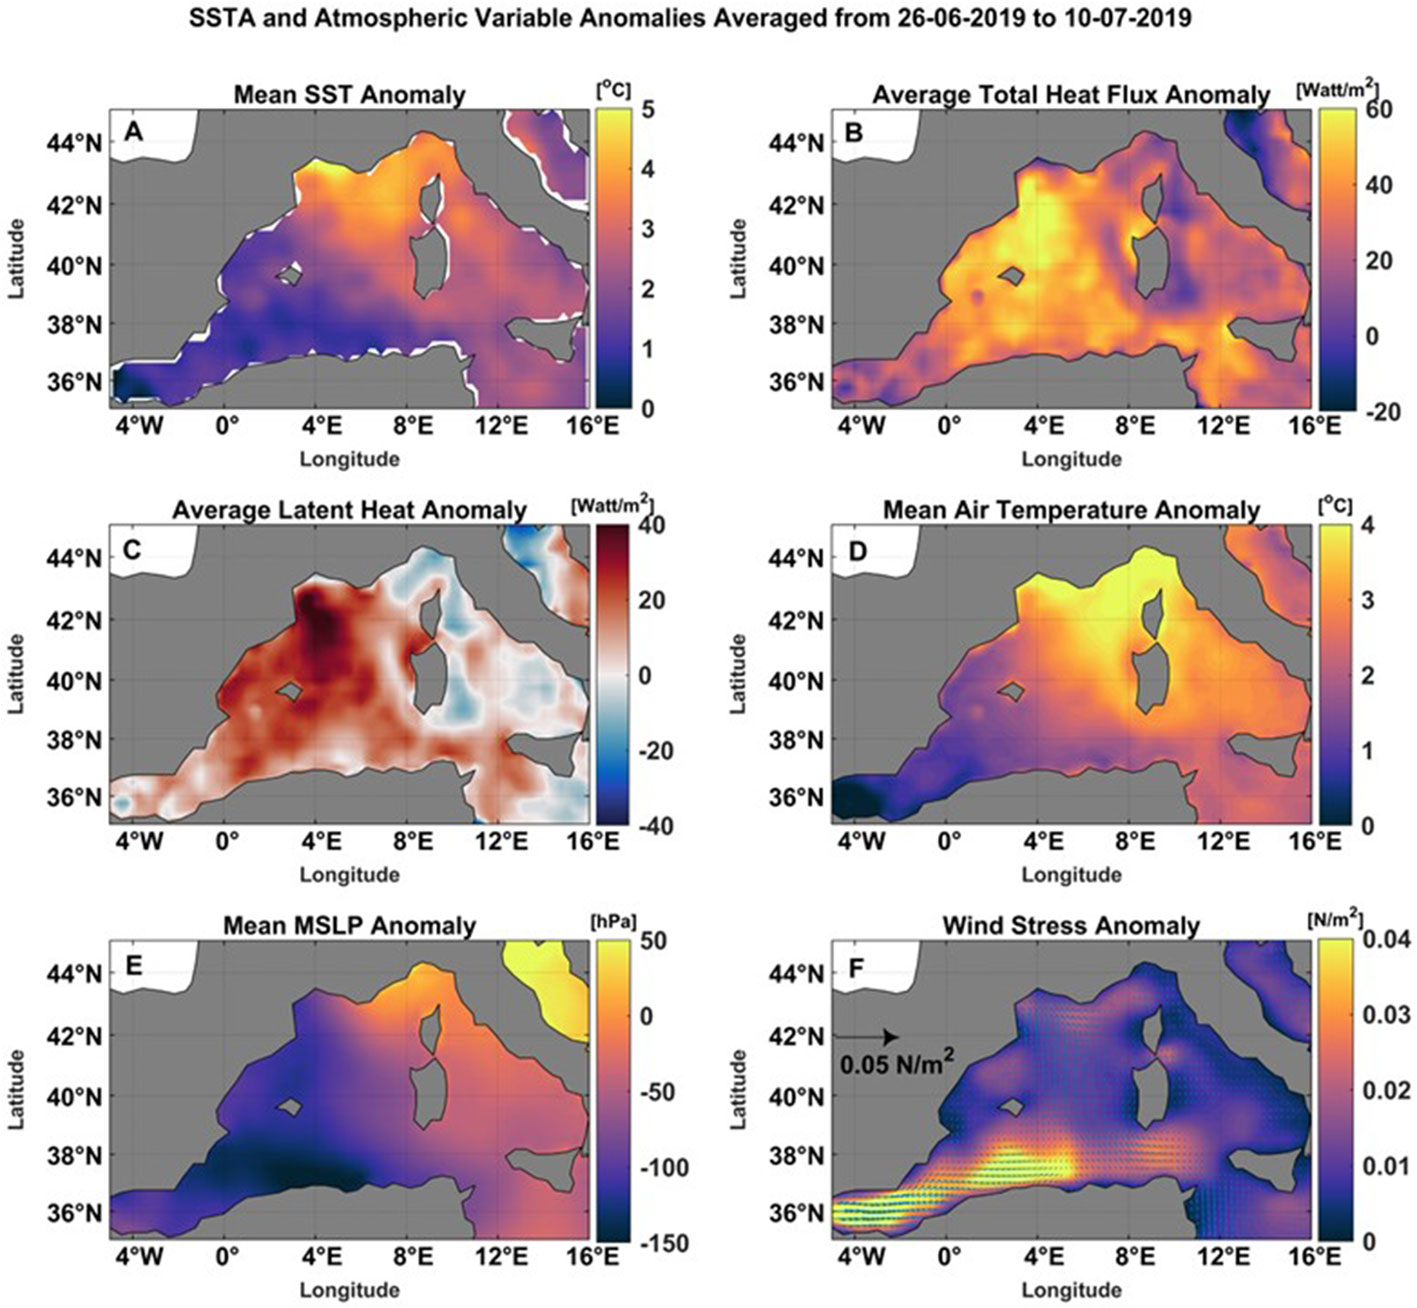
Figure 10 The mean (A) SST anomaly [°C], (B) total heat flux anomaly [W/m2], (C) latent heat flux anomaly [W/m2], (D) air temperature anomaly [°C], (E) mean sea level pressure anomaly [hPa], and (F) wind stress anomaly [N/m2] during the MHW event (26 June-10 July 2019) in the WMB. Note that the anomalies were calculated based on 1982-2020 climatology from ERA5 hourly data.
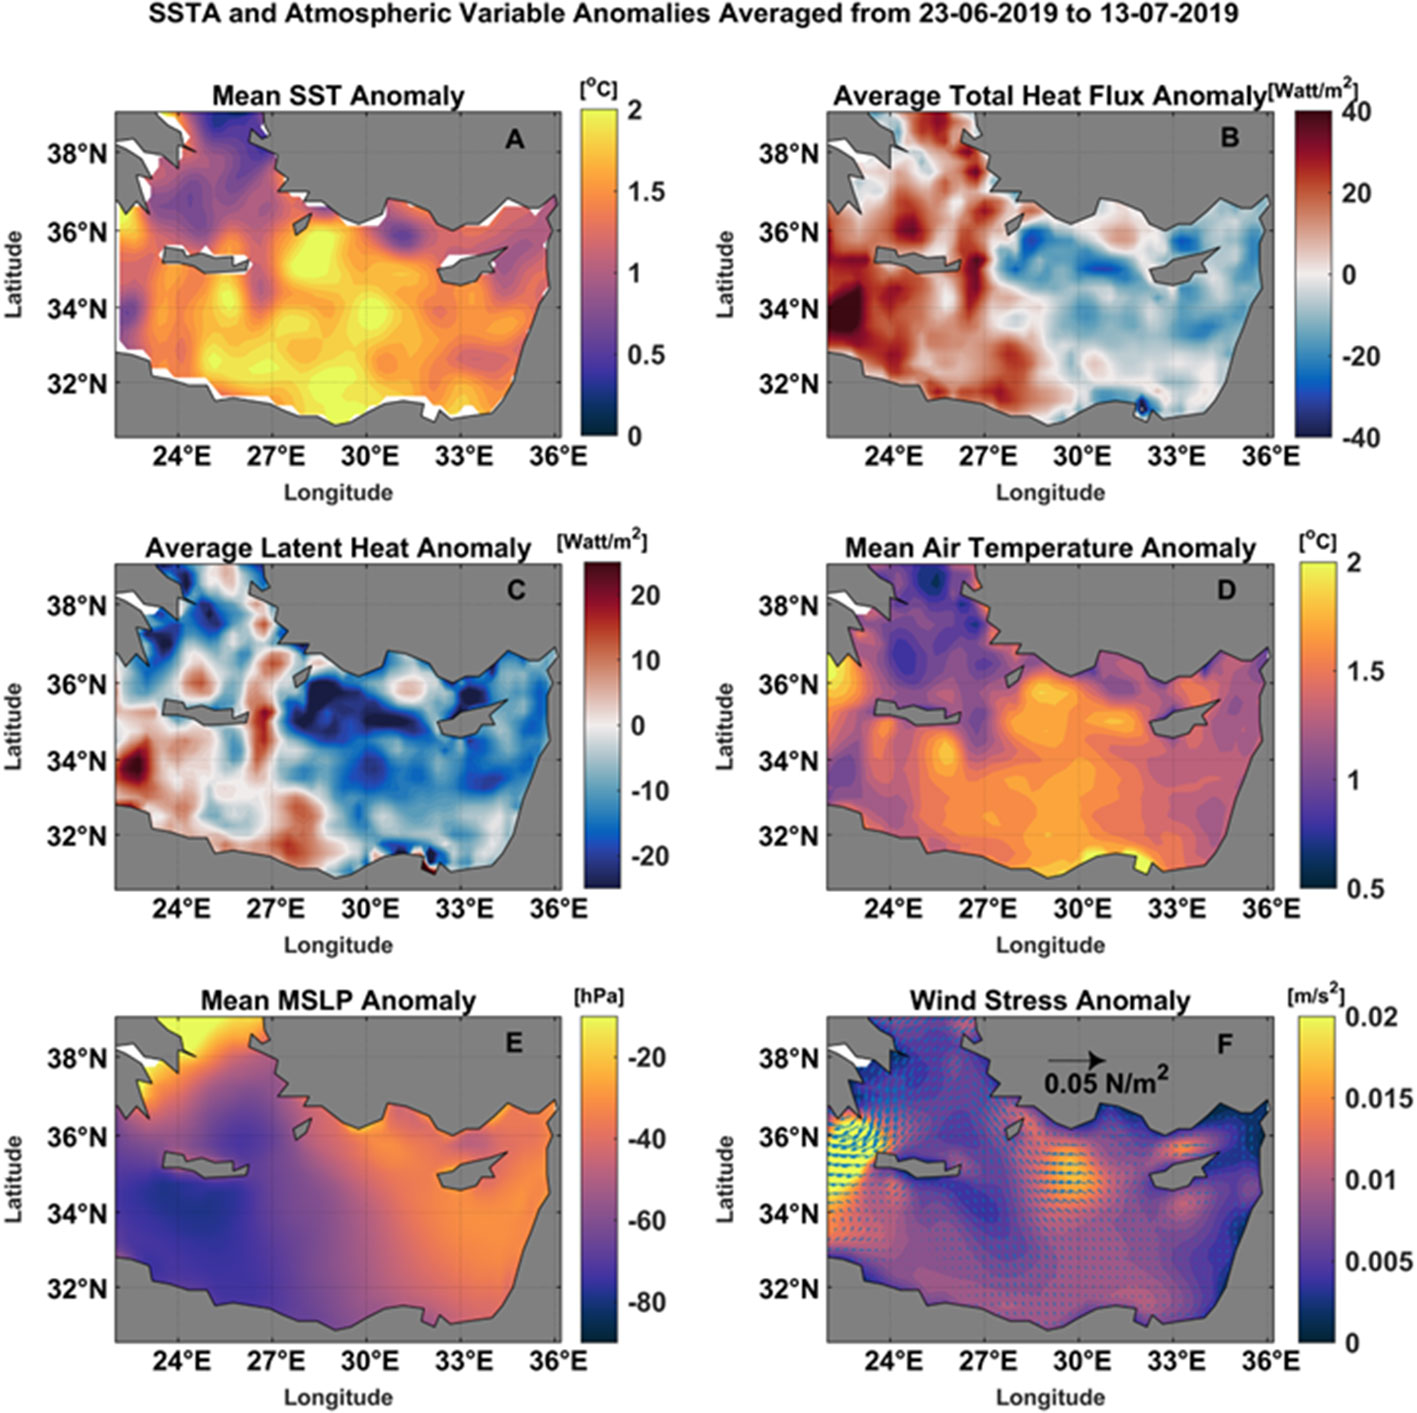
Figure 11 The mean (A) SST anomaly [°C], (B) total heat flux anomaly [W/m2], (C) latent heat flux anomaly [W/m2], (D) air temperature anomaly [°C], (E) mean sea level pressure anomaly [hPa], and (F) wind stress anomaly [N/m2] during the MHW event (23 June-13 July 2019) in the EMB. Note that the anomalies were calculated based on 1982-2020 climatology from ERA5 hourly data.
In the WMB, during the first MHW event (26/06/2019 to 10/07/2019), it was observed that the areas of the WMB that suffered from high SSTA (> 4°C) also suffered from high QT anomaly (> 50 W/m2), high positive anomaly (> 30 W/m2) of latent heat flux, high positive anomaly of air temperature (> 3.5°C), negative MSLP anomaly (< -50 hPa), and close to the mean value of wind stress (i.e., Wind stress anomaly ~ 0 N/m2), as shown in Figure 10. During the second strong event that occurred in the WMB between 22-27 July 2019, areas with high SSTA (> 4°C) had positive anomalies in total heat flux (> 20 W/m2), latent heat (> 20 W/m2), air temperature (> 2.5°C), and MSLP (~ 10 hPa), while the wind stress anomaly was below average (see Supplementary Figure 2). During the last strong MHW event (Aug. 24, 2019, to Sept. 03, 2019) that occurred in the WMB, the high SSTA was combined with the same atmospheric conditions as the second event, but on a larger scale (see Supplementary Figure 3).
Atmospheric conditions associated with the 2019 MHW events were different in the EMB than in the WMB. During the first event, which occurred between 23/06/2019 and 13/07/2019 in the EMB, the high SSTA was accompanied by a negative anomaly of the total heat flux (> 20 W/m2) and latent heat (> 15 W/m2), as well as a high temperature anomaly (> 1.5°C), a low MSLP system (~50 hPa below average), and slightly above average wind stress (Figure 11). In addition, during the second MHW event, which occurred in the EMB between July 22 and December 27, 2019, the same atmospheric conditions were associated with the high SSTA as during the first event, but with higher values (see Supplementary Figure 4).
3.3.2 The 2019 Mediterranean MHWs and the depth of the mixed layer
The temporal variability of the SSTA and MLD anomaly in Mediterranean Sea between June and December 2019 is shown in Figure 12. Here we aim to find out the relationship between MLD variability and the occurrence of MHWs. In both Mediterranean basins, a decrease in mixing layer thickness was observed during MHW events. In the WMB, MLD decreased by 2 to 10 m below average during high SSTA associated with MHW events (Figure 12A). In the EMB, MLD decreased 2 to 18 m below the mean during MHW events (Figure 12B). The time lag between MLDa and SSTA variability was calculated from June to December 2019 for the WMB and EMB. In the WMB, a time lag of 2 days was observed between the MLDa and the SSTA, meaning that the MLD shoaled 2 days before the SSTA increased, whereas in the EMB, the time lag between the MLDa and the SSTA was 1 day.
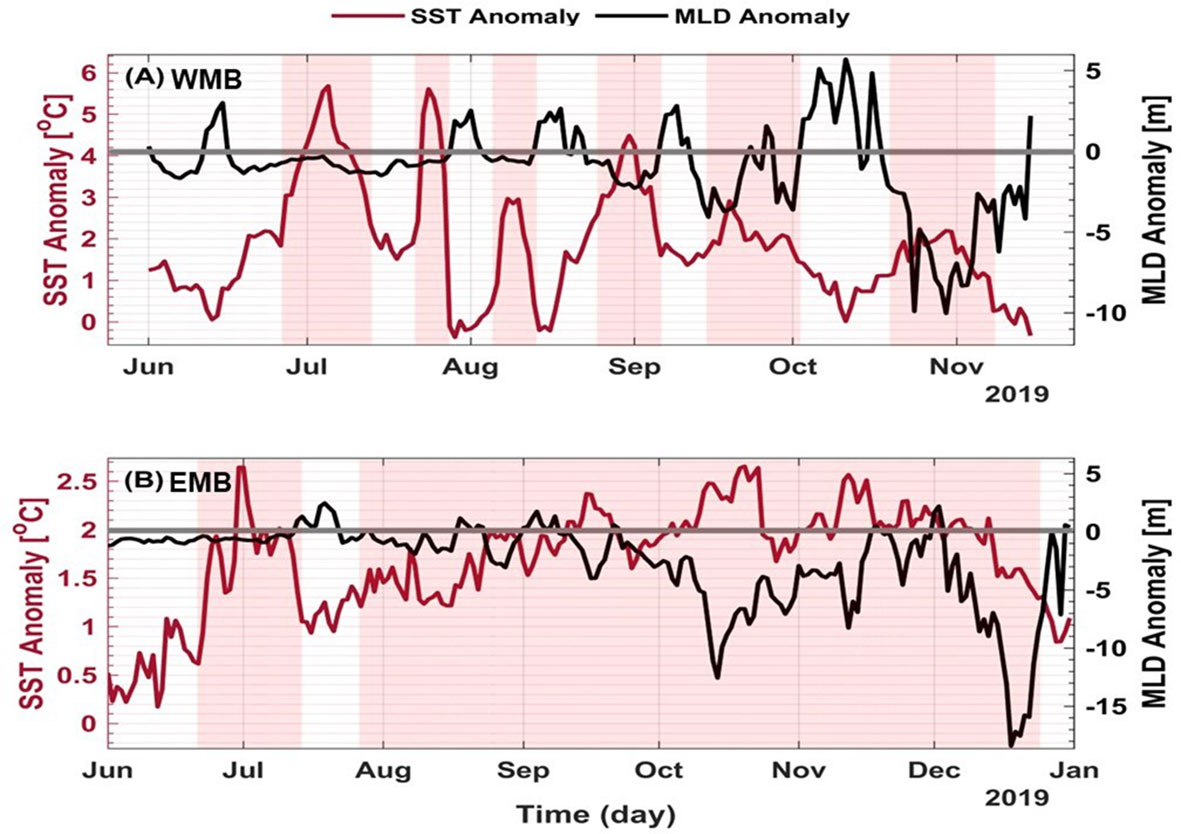
Figure 12 Time series of SSTA (red line) and mixed layer depth anomaly (black line) for (A) the WMB and (B) the EMB between June and December 2019. The red shaded areas represent the MHW periods.
3.3.3 The role of 2019 MHWs in modulating surface productivity in Mediterranean Sea
Figures 13A–C shows the temporal variation of SSTA versus log Chl-a concentration in the WMB (Gulf of Lion) during the three strong MHW events that occurred between June and December 2019. During the first and second events (Figures 13A, B), an inverse relationship between SSTA and Chl-a concentration is observed, with a decrease in Chl-a concentration occurred during the MHW events. During the third event (Figure 13C), there is no clear evidence of the influence of the MHW event on the surface Chl-a variability. In the EMB (Levantine basin), the same comparison was made between the SSTA and log Chl-a concentrations (Figures 14A, B). During the first event, which occurred from late June to mid-July 2019, a decrease in Chl-a concentration was observed during the MHW event, while there was no clear relationship between SSTA and Chl-a concentration during the second event. In addition, the correlation between SSTA and Chl-a was calculated over the same period (June to December 2019) in both Mediterranean basins. A negative correlation (R = - 0.49) was found between the SSTA and the Chl-a in the WMB (Figure 15A). While the correlation between SSTA and Chl-a in the EMB was low and insignificant (Figure 15B).
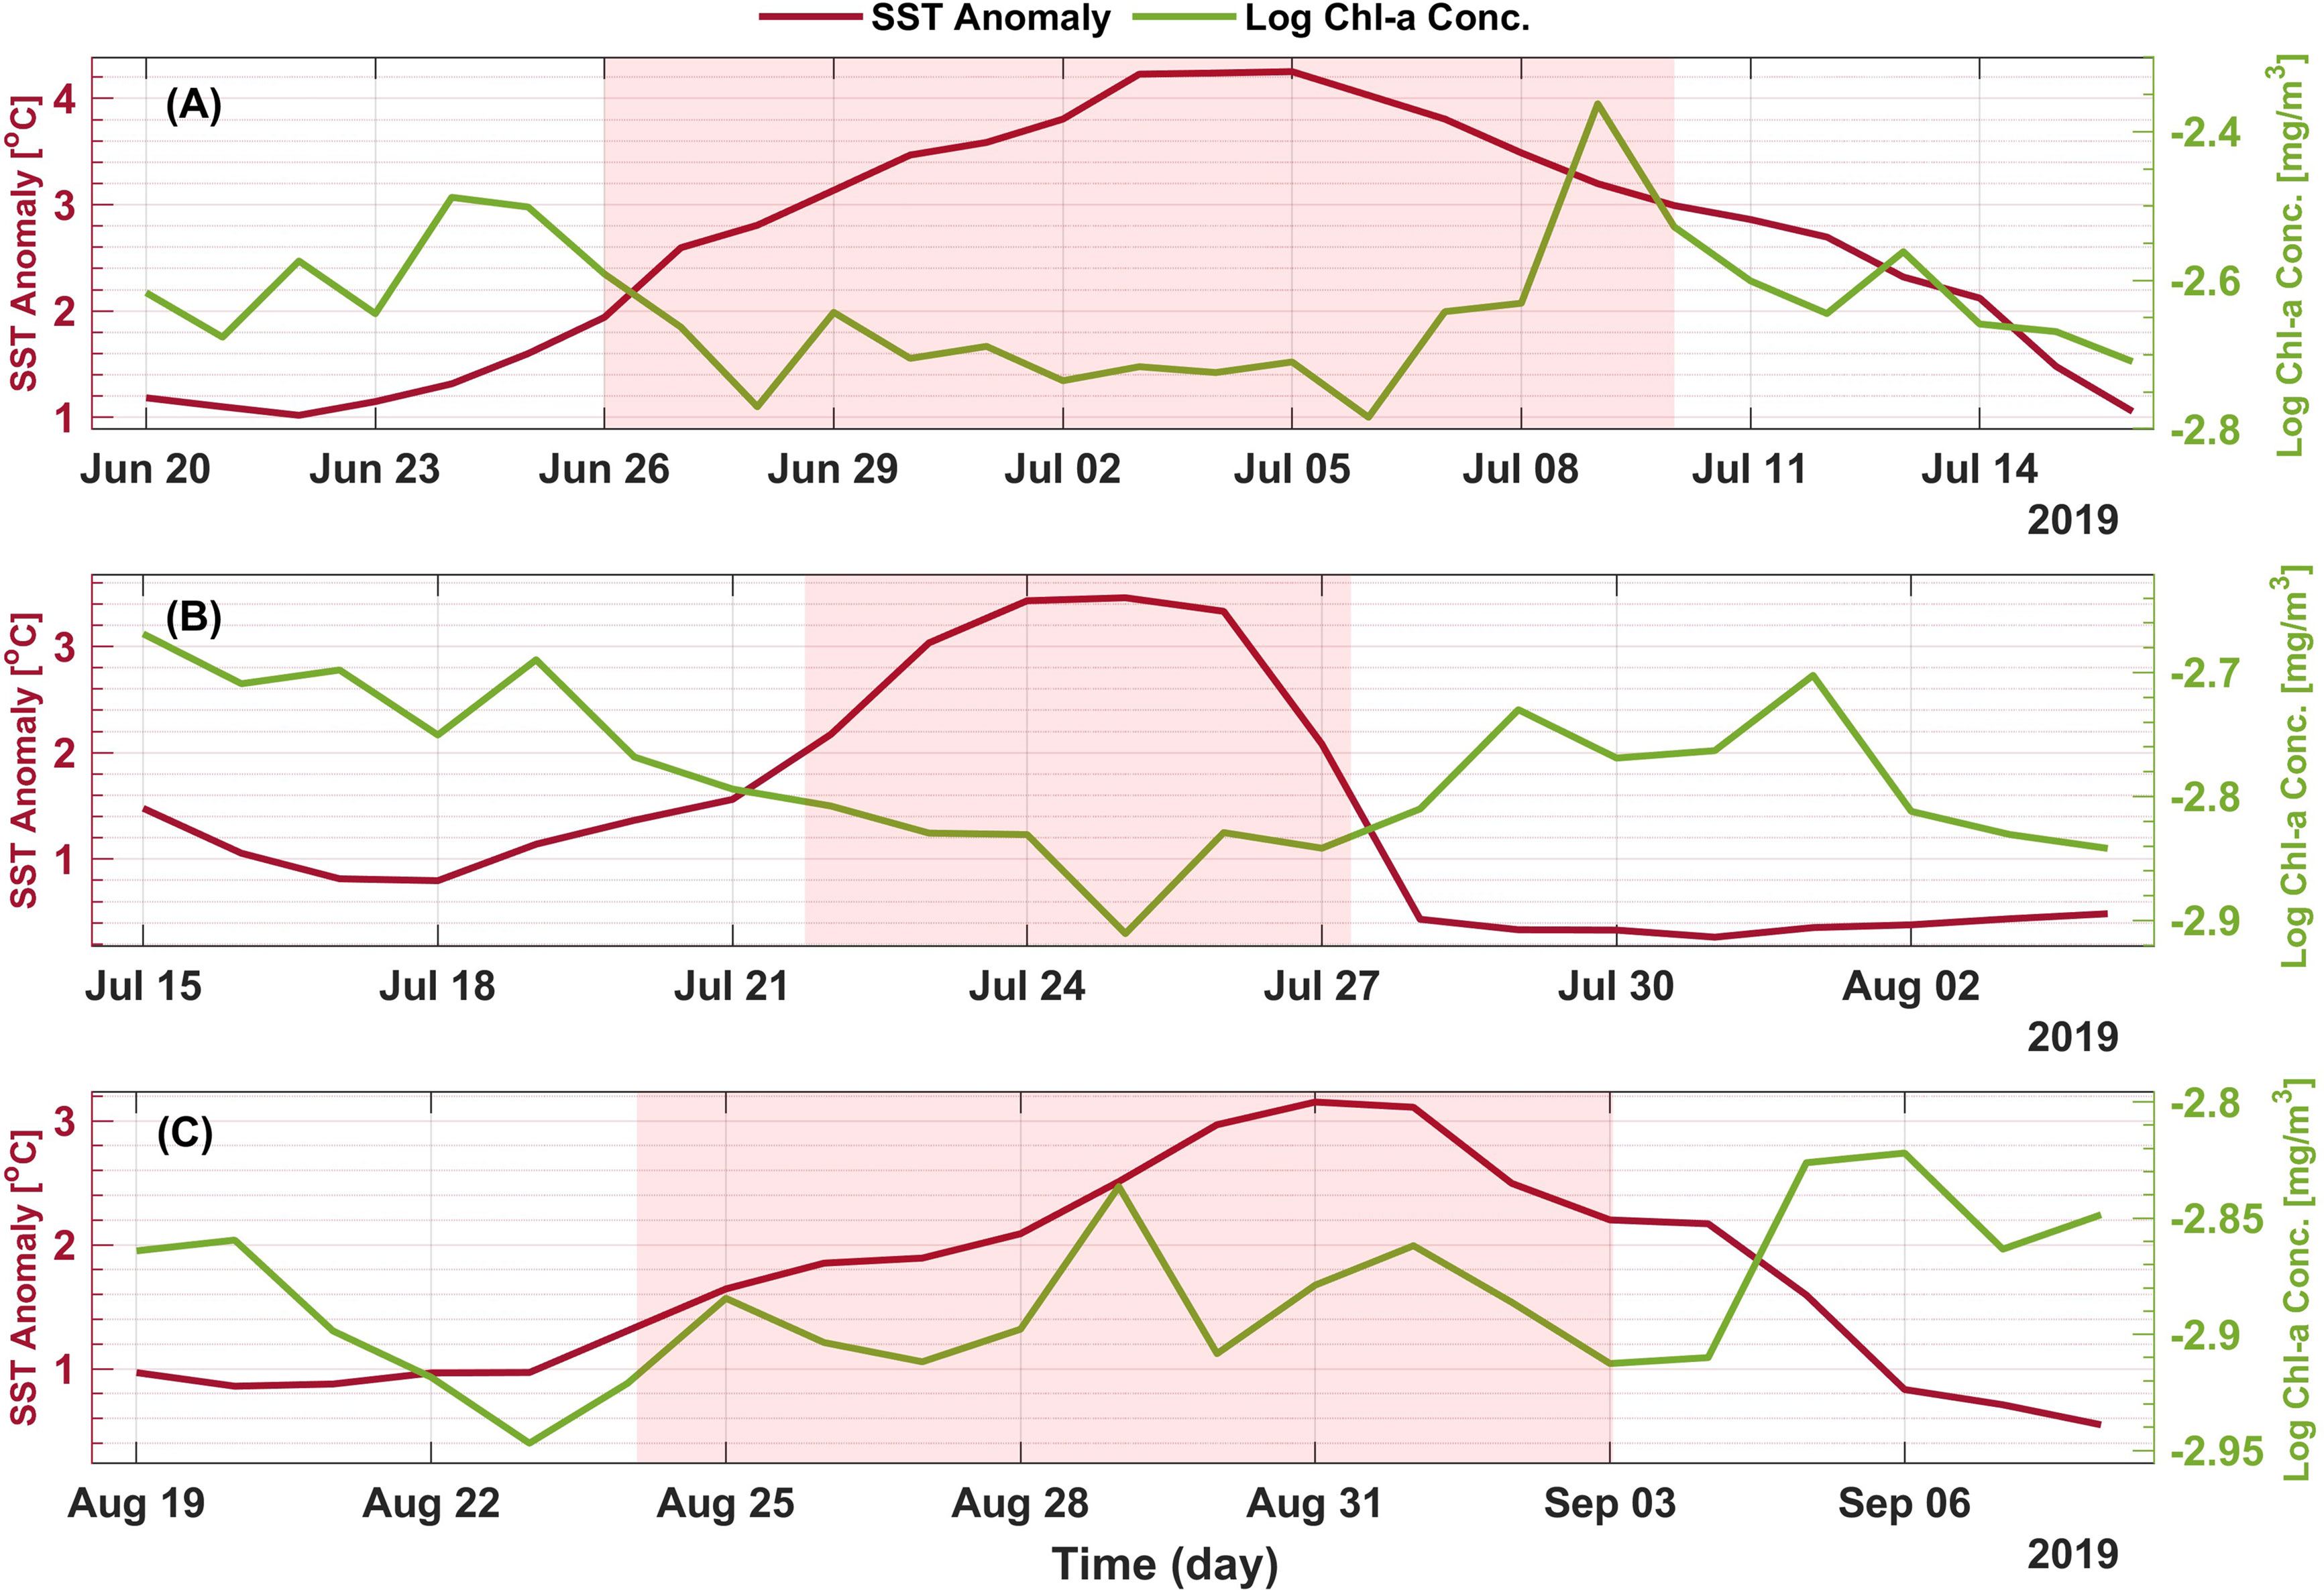
Figure 13 Time series of SSTA (red line) and log Chl-a concentration (green line) in the WMB during the three strong MHW events between June and September 2019. (A) shows the first event, (B) shows the second event, and (C) shows the third event. The red shaded areas are the duration of the MHW events.

Figure 14 Time series of SSTA (red line) and log Chl-a concentration (green line) in the EMB during MHW events between June and December 2019. (A) shows the first event and (B) shows the second event. The red shaded areas are the duration of the MHW events.
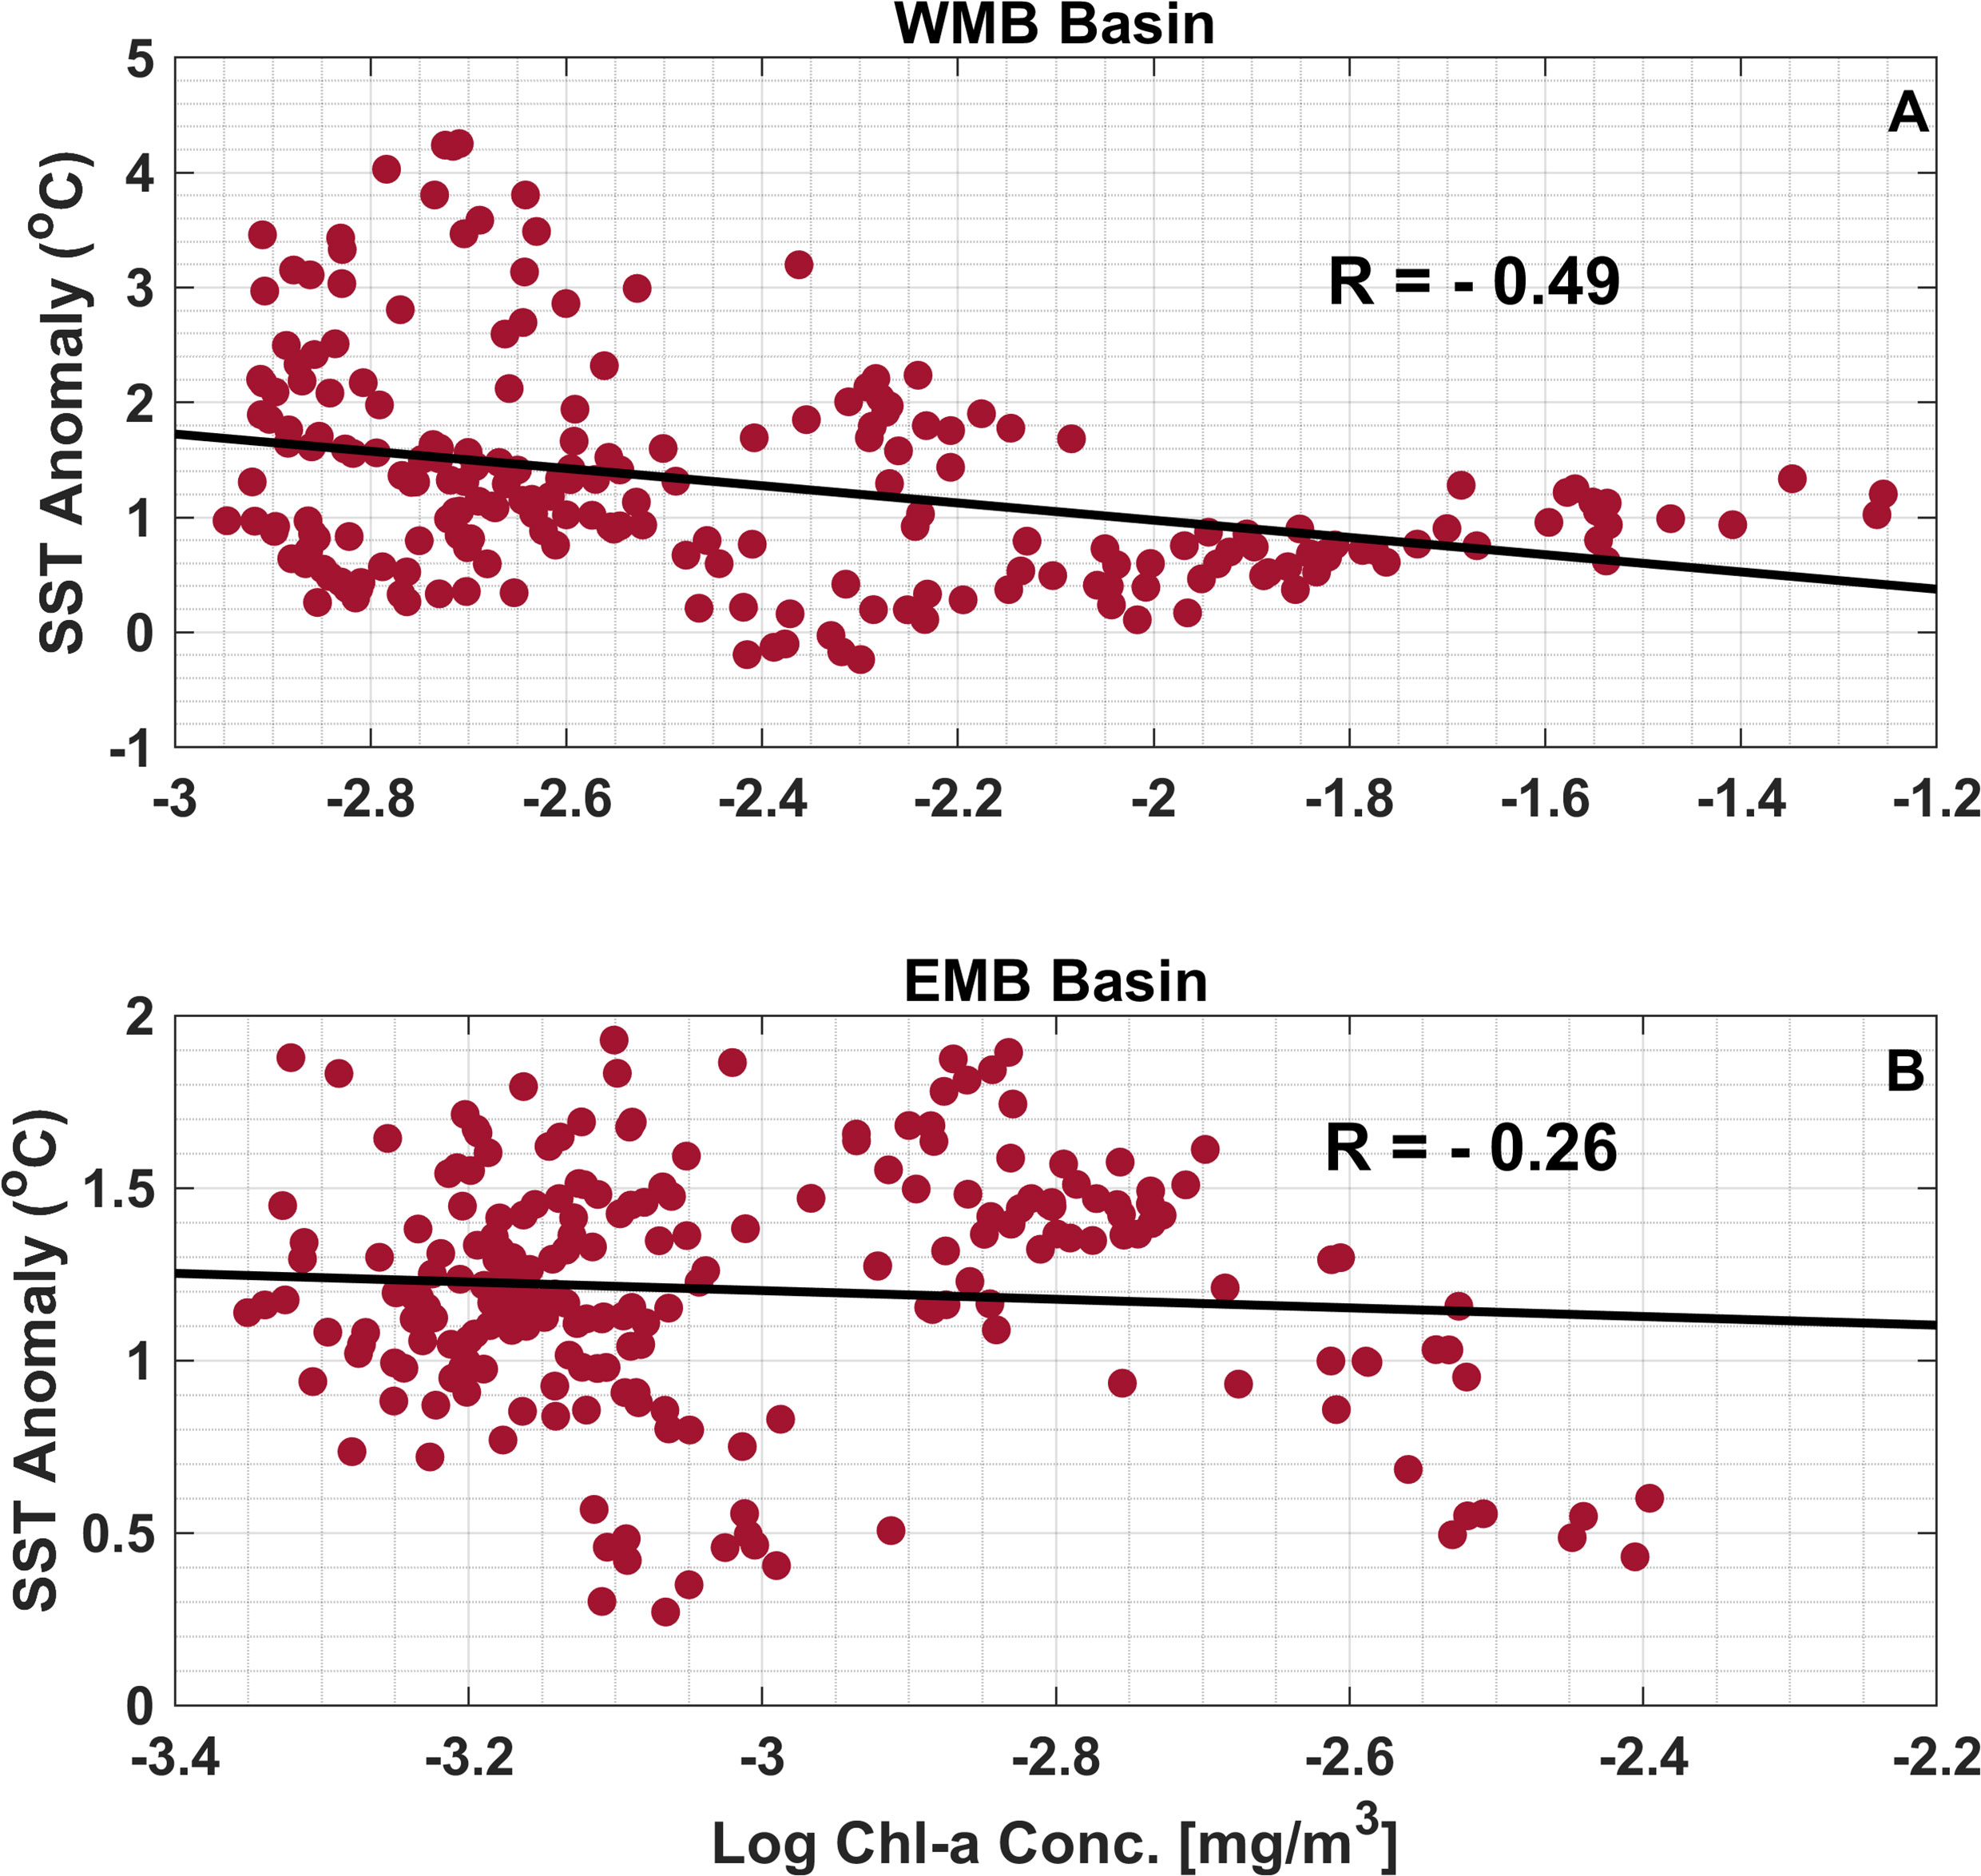
Figure 15 Scatter plots of daily mean SST versus log Chl-a concentration for (A) WMB and (B) EMB between June and December 2019, with the black line representing the best-fit linear curve.
4 Discussion
In the last decade, the number of MHW has increased in the Mediterranean Sea, especially off the Gulf of Lion and the Tyrrhenian Sea in the WMB and the Levantine Basin in the EMB. During the study period (1982-2020), 96 MHW events occurred throughout the Mediterranean Sea, with a total of 1495 MHW days. During the last decade (2011-2020), more than half (54%) of the events occurred with 65.9% of the total MHW days. Our results also revealed that MHWs were more frequent and intense in the WMB than in the EMB, while the duration of MHWs was longer in the EMB. The 2019 MHW events occurred in the WMB and EMB along with other extreme events such as atmospheric heatwave and a Medicane (Mediterranean Hurricane). Detailed descriptions of the main results are provided in the following discussion sections.
4.1 The trends of the SST and marine heatwaves (1982-2020)
The spatiotemporal variability of the monthly SSTA was estimated using the EOF analysis. The spatial EOF pattern of the first mode that explained 55.42% of the SSTA variance showed an in-phase oscillation of the whole Mediterranean Sea. This can indicate an in-phase heating or cooling (gain or loss of heat) of the whole Mediterranean water volume. The highest SSTA variability was observed over the western part of the Mediterranean Sea with maximum amplitude off the Gulf of Lion, the Tyrrhenian Sea, and the Adriatic Sea (Figure 1A). Our SSTA trend analysis for the period from 1982 to 2020 showed high spatial variability of the linear SSTA throughout the Mediterranean Sea (Figure 2A). The linear trend analysis showed a nonuniform SSTA trend of 0.2 to 0.5°C/decade throughout the Mediterranean Sea. The strongest trend was observed in the WMB basin off the Gulf of Lions and in the EMB basin in the Levantine Basin. The long-term trends of SST are in good agreement with what was observed from Skliris et al. (2012); Pastor et al. (2020); Ibrahim et al. (2021). From 1985 to 2008, Skliris et al. (2012) found an average warming rate of about 0.37 °C/decade for the Mediterranean Sea and 0.26 °C/decade and 0.42 °C/decade for the WMB and EMB, respectively. Recent studies that have conducted long SST trend analyses, such as Pastor et al. (2020), have estimated a warming of 0.35 °C/decade over the Mediterranean Sea from 1982 to 2019. Ibrahim et al. (2021) calculated that the average rate of warming of the EMB between 1982 and 2020 was 0.33 ± 0.04 °C/decade. The areas that recognized by high SSTA variability and trends were characterized by the presence of MHWs. In the WMB, MHWs were characterized by their high frequency and intensity, whereas in the EMB, MHWs were characterized by their long duration (Figures 3, 4). Furthermore, for the entire Mediterranean Sea, the increasing trend in SSTA (0.32 ± 0.035 °C/decade) from 1982 to 2020 was combined with a trend of 1.3 ± 0.246 events/decade for the frequency of MHWs and a trend of 3.6 ± 1.16 days/decade for the MHWs duration. The estimated MHW trends are consistent with the results of Juza et al. (2022), who estimated trends in MHW frequency and duration between 2012 and 2020 to be 1.1-1.8 events/decade and 1.23-3.82 days/decade, respectively.
4.2 Marine heatwaves frequency and climate indices (1982-2020)
To date, no study has compared the relative effects of large-scale climate modes variability on the occurrence of MHWs in the Mediterranean Sea. In the present work, we investigated the relationship between MHW frequency and the two climate indices EAP and EATL/WRUS in the Mediterranean during the study period (1982-2020). Our results showed a strong positive correlation between the EAP and MHW frequency in the Mediterranean region with a linear correlation of 0.74 (Figures 5A, B), and the spatial correlation maps between the EAP and MHW frequency showed high correlation values over the entire Mediterranean Sea. A comparison of the annual time series of MHW frequency (Figure 3A) and the annual time series of EAP (Figure 6A) also showed that both distributions were in very good agreement. Thus, between 1987 and 1994, the frequency of MHWs varied between 0 and 2 events/year, and this low frequency was related to low SSTA values (negative anomalies or close to zero; see Figure 2B) and the negative phase of the EAP. During the strong positive phase of the EAP (2012 - 2020), the frequency of MHWs was high, varying between 3 and 8 events/year, and the highest SSTA was observed during the study period in these years (Figure 2B). The above results agree well with those of Skliris et al. (2012), who found that the long-term warming trend in the Mediterranean was strongly correlated with the EAP between 1985 and 2008.
A negative correlation was found between EATL/WRUS and MHW frequency in the Mediterranean Sea with a linear correlation of -0.44 (Figures 5C, D), and the spatial correlation maps showed the highest negative correlation in the Levantine Basin and the Aegean Sea. This high correlation is due to the fact that the main surface temperature anomalies associated with the positive phase of the EATL/WRUS pattern reflect below-average temperatures over much of western Russia and northeastern Africa, so they mainly affect the EMB. The negative correlation between the EATL/WRUS and MHW frequency was also observed when comparing the annual time series of both values between 1982 and 2020 (Figures 3A, 6B).
The relationship between MHW frequency and the NAO (The North Atlantic Oscillation) was also studied for the entire Mediterranean region during the study period, but the correlation between them was low and insignificant.
4.3 2019 marine heatwaves in the Mediterranean Sea
As a case study for MHWs in the Mediterranean region, we focused on events that occurred between June and December 2019. After identifying the 2019 MHW events in both the WMB and EMB, we investigated their link with atmospheric forcings and MLD variability, as well as their impact on Chl-a concentrations. The characteristics of the MHW events (Imean, Imax, and duration) that occurred in each Mediterranean basin and their corresponding MHWonset, MHWpeak, and MHWend dates and category are shown in Table 1.
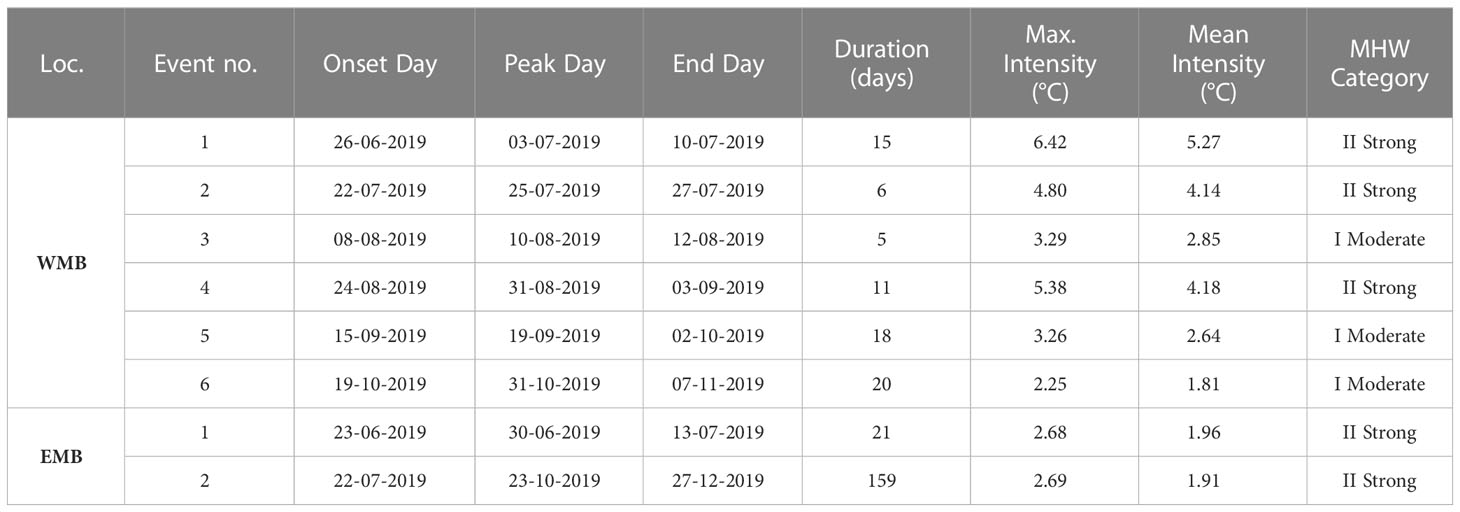
Table 1 MHW events characteristics in the WMB and EMB between June and December 2019.
Between June and December 2019, six MHW events were detected in the WMB, three of which were classified as strong events, while only two events were detected in the EMB during the same period, both of which were classified as strong events (Figure 7). The vertical extent of these MHW events was calculated to know how deep they could propagate (Figures 8 , 9). The results showed that only the strong events (i.e., when SST exceeded twice the climatological threshold) extended deep into the water column. In the WMB, MHW events extended to a depth of 20 m, whereas in the EMB they extended deeper than 50 m. The extent of MHW in the Mediterranean Sea was also investigated by Juza et al. (2022), who studied subregional MHW in the Mediterranean Sea between 2012 and 2020. Juza et al. (2022) concluded that the potential temperature associated with MHWs reaches a deeper layer in the EMB than in the WMB, which is consistent with our results. However, they found that the 2012-2020 distributions of potential temperature were positive up to 50-150 m in the WMB and up to 400 m in the EMB. This difference between our results and theirs could be due to the fact that they used in situ data for their analysis and averaged them over the 2012-2020 period while looking for the extent of the positive potential temperature anomaly. We, on the other hand, used a physical reanalysis of potential temperature generated by NEMO, and we calculated MHWs at different depths using the definition of Hobday et al. (2016) and focused our analysis on MHW events that occurred between June and December 2019. Moreover, we noticed that the subsurface MHWs that occurred in the autumn months (October to December) penetrates to the deeper water (35m and 50m depth; Figures 9C, D) than the ones that occurred in the summer months (August and September) especially in the EMB. This could be attributed to the strong vertical mixing that occurs in the autumn and winter, which contributing to the higher propagation of the MHWs in these months while the strong stratification of the water column during the summer is decreasing the propagation of the surface MHWs to the deeper water layers. These results are consistent with Juza et al. (2022).
The link between atmospheric forcing anomalies (i.e., total heat flux, latent heat flux, air temperature, mean sea level pressure, and wind stress) and SSTA during MHW events at both WMB and EMB between June and December 2019 was examined (Figures 10 , 11, and Supplementary Figures 2-4). The relationship between atmospheric variable anomalies and SSTA during MHW events differed from the WMB and EMB, and the association of these MHW events with other extreme events (e.g., atmospheric heatwaves and medicanes) was also different in the two basins. In the WMB, during the events between June and December 2019, we found that the high anomaly of SST was associated with a high anomaly of total heat flux, latent heat flux, and air temperature, while the MSLP anomaly was below the climatological average during the first event and significantly higher during the other two events; moreover, the wind stress anomaly was close to zero during the three events. In the EMB, during the same period, the SSTA of the two MHW events that occurred during this period was associated with a negative anomaly in total heat flux, latent heat, and MSLP, while the air temperature anomaly was positive and wind stress was slightly above average. In both basins, the MHW events were associated with a shallow MLD (shallower than the average; Figure 12), and cross-correlation showed a 2-day lag between the MLDa and SSTA in the WMD and 1 day in the EMB. A shallower mixing layer is associated with a lower heat capacity, which could further enhance SST warming and contribute to the formation of MHWs. The lag of a day or two between the shallow MLD and the increase in SSTA cannot be alone the cause of an MHW event. However, in MHWs, there is a combination of factors that can interact to cause an MHW, such as high heat fluxes and low wind speeds. These factors, when combined with the shallow MLD, can lead to an increase in temperature in the surface layer of the ocean. And for such extreme events as MHWs, a one- or two-day change in a variable can lead to an anomalous increase in SST, and thus an MHW. In addition, the long-term reduction in mean mixed layer depth also has important implications for the magnitude of SST extremes (Amaya et al., 2020, Amaya et al, 2021).
We also investigated the possible interactions between the 2019 MHW events in both basins with other extreme events such as atmospheric heatwaves and medicanes. Our study found that the WMB MHW events that occurred between June and July 2019 coincided with the atmospheric heatwaves that hit Western Europe during the same period (Vautard et al., 2020). This observation is consistent with the results we obtained when studying the atmospheric conditions during the WMB MHW events. Therefore, it is believed that the MHW events that occurred in the WMB during the summer of 2019 were mainly due to the atmospheric heatwaves that struck Europe. The abrupt increase in air temperature during these heatwaves resulted in a strong heat transfer from the atmosphere to the ocean, which in turn led to an anomalous increase in SST and then MHW. On the other hand, a Medicane named Scott occurred in the EMB on October 25and 26, 2019. According to news reports, Medicane Scott hit the Sinai Peninsula, the Palestinian territories, and parts of Israel and Egypt, bringing rough seas, strong tropical winds, and up to 200 mm of rain to the affected regions. Such storms are unusual this far east in the Mediterranean, and the driving force reported is the exceptionally warm water temperatures at this location (2-4°C warmer than normal for this time of year; https://modis.gsfc.nasa.gov/gallery/individual.php?db_date=2019-10-26#). The occurrence of the longest MHW event in the EMB (July 22-December 27, 2019) coincided with the occurrence of Medicane Scott. The peak day of this MHW event was October 23, 2019, with an intensity of 2.69 °C (Table 1), and this event caused anomalously high heat loss from the ocean to the atmosphere and high latent heat flux (Supplementary Figure 3). According to our results on the EMB MHW event and the reports on Medicane Scott, the MHW event that occurred between July and December 2019 in the EMB might be contributed to the formation of Medicane Scott.
Finally, the role of MHWs in modulating the Chl-a concentrations in both basins was studied (Figures 13–15). The SSTA associated with MHW events is inversely proportional to Chl-a concentration in both the WMB and EMB basins only during the events with the highest MHW intensity (Figures 13–14). This suggests that the MHWs must be intense and long enough to cause a significant response in chlorophyll concentration. For example, the first two MHW events in the WMB resulted in a decrease in Chl-a concentration at the surface, while the last event did not have a clear significant effect on Chl-a, which could be because the intensity of this event was lower than the other two events. In addition, the first MHW event in the EMB had an impact on Chl-a, while the second event had no impact on Chl-a, which could be due to the very long duration (158 days) of this event and that it also occurred from late July to late December, so the impact of the MHW event on Chl-a could be mitigated by the SST drop in November and December, the beginning of the winter season in our study region.
5 Conclusions and suggestions for future studies
Our main objective was to identify the main spatiotemporal characteristics of MHWs in the Mediterranean Sea using a 39-year (1982–2020) analysis of high-resolution satellite-based SST data. Moreover, in this study we focused on the 2019 MHW events that occurred in the Mediterranean sub-basins (WMB and EMB), their vertical extent, interactions with atmospheric forcings and their impact on surface Chl-a concentrations.
Our main findings in this study are summarized as follows:
● The pattern of SSTA trend between 1982 and 2020 showed high spatial variability over the Mediterranean Sea with trend values between 0.2 and 0.5°C/decade and high values recorded in the WMB basin off the Gulf of Lions and in the EMB basin in the Levantine Basin, which are the same areas distinguished by frequent, intense, and prolonged MHWs during the study period.
● The spatial maps of MHW characteristics between 1982 and 2020 showed a high spatial variability of MHWs over the Mediterranean basins. Thus, the most frequent and intense MHWs were observed in the WMB and the longest MHWs were found in the EMB. The trend in the frequency and duration of MHWs between 1982 and 2020 was estimated to be 1.3 ± 0.246 events/decade and 3.6 ± 1.16 days/decade, respectively.
● More than half (54%) of the MHW events that occurred across the Mediterranean, with 66% of the total MHW days, occurred in the last decade (2011-2020).
● MHW frequency correlated with climate modes during the study period. A strong positive correlation (R = 0.74) was found between the EAP and MHW frequency throughout the Mediterranean, while MHW frequency was negatively correlated with the EATL/WRUS, with a correlation of -0.44.
● Between June and December 2019, six MHWs were detected in the WMB, three of which were classified as strong events, while two events occurred in the EMB, both of which fell into the strong MHWs category.
● The results showed that only the strong events (i.e., when SST exceeded twice the climatological threshold) extended deep into the water column. In the WMB, MHW events extended to a depth of 20 m, whereas in the EMB they extended deeper than 50 m.
● The propagation of the MHWs in the autumn and early winter months (October, November, and December) were higher than their propagation in the summer months (August and September) especially in the EMB.
● The WMB MHW events were associated with a large flux of heat from the atmosphere to the ocean and a decrease in MLD. Moreover, the first two events in the western Mediterranean were synchronized with the occurrence of a strong atmospheric heatwaves that hit Western Europe between June and July 2019. Therefore, we believe that these atmospheric heatwaves and the large heat flux absorbed by the ocean surface, along with the shallow MLD, were the driving forces behind the WMB MHW events between June and December 2019.
● The events of EMB MHW were associated with heat loss from the ocean to the atmosphere. Therefore, we assume that the air-sea flux did not cause the increase in SSTA, but that the high SSTA during the MHWs caused the anomalous upward net heat flux, consistent with the reports of Miyama et al. (2021). Moreover, this anomalously high heat flux absorbed by the atmosphere might be contributed to the formation of Medicane Scott, which occurred between October 25 and 26, 2019.
● Finally, a negative relationship was found between SSTA and surface Chl-a concentrations, and this negative influence of MHWs on Chl-a was more evident in the WMB than in the EMB.
To the best of our knowledge, this study attempted to determine the link between MHW and atmospheric forcings and their interactions with other extreme events during the study period. This could be considered as a first step to better understand that the severity of MHWs is not only directly caused by their occurrence, but also by their interactions with other atmospheric conditions that may lead to other catastrophic extreme events. Therefore, for future work, we propose to investigate the combination between MHWs and other extreme events in the region such as storms, atmospheric heatwaves, low chlorophyll-a events, and extreme nutrient and oxygen depletion events which is also suggested by (Leonard et al., 2014; Le Grix et al., 2021; Hamdeno et al., 2022). Due to the rapid increase in the frequency, days, and intensity of MHW, it is also necessary to quantify their potential impacts on the overall ecological components, structures, functioning, and overall health of the Mediterranean Sea. Therefore, for better regional ocean management, further studies should focus on ecosystem services and assess the socioeconomic impacts of MHWs.
Data availability statement
The original contributions presented in the study are included in the article/Supplementary Material. Further inquiries can be directed to the corresponding author.
Author contributions
The following are the authors’ contributions to the paper: AA-A and MH designed the study; MH collected the data and performed the analysis; MH and AA-A interpreted the findings; MH and AA-A wrote the draft manuscript. The results were reviewed by all authors. All authors contributed to the article and approved the submitted version.
Funding
This work benefits financial support of the Aspirant F.R.S.-FNRS (Fonds de la Recherche Scientifique de Belgique, Communauté Française de Belgique) through funding the position of AB and funding a Aspirant - ASP grant.
Acknowledgments
The authors would like to thank the organizations that provided the data sources for this work, including NOAA for the OISST_V2 data, ECMWF for the ERA5 data, and CMEMS for providing surface ocean observations such as Chl-a concentration data. Our gratitude also extends to all GHER members. The authors would also like to thank the reviewers who will be reviewing this paper.
Conflict of interest
The authors declare that the research was conducted in the absence of any commercial or financial relationships that could be construed as a potential conflict of interest.
Publisher’s note
All claims expressed in this article are solely those of the authors and do not necessarily represent those of their affiliated organizations, or those of the publisher, the editors and the reviewers. Any product that may be evaluated in this article, or claim that may be made by its manufacturer, is not guaranteed or endorsed by the publisher.
Supplementary material
The Supplementary Material for this article can be found online at: https://www.frontiersin.org/articles/10.3389/fmars.2023.1093760/full#supplementary-material
Supplementary Figure 1 | The first three EOF (left)/PC (right) (spatial variation/temporal variation) modes of SSTA in the Mediterranean Sea from 1982 to 2020.
Supplementary Figure 2 | The mean (A) SST anomaly [°C], (B) total heat flux anomaly [W/m2], (C) latent heat flux anomaly [W/m2], (D) air temperature anomaly [°C], (E) mean sea level pressure anomaly [hPa], and (F) wind stress anomaly [N/m2] during the MHW event (22 July-27 July 2019) in the WMB. Note that the anomalies were calculated based on 1982-2020 climatology from ERA5 hourly data.
Supplementary Figure 3 | The mean (A) SST anomaly [°C], (B) total heat flux anomaly [W/m2], (C) latent heat flux anomaly [W/m2], (D) air temperature anomaly [°C], (E) mean sea level pressure anomaly [hPa], and (F) wind stress anomaly [N/m2] during the MHW event (24 August-3 September 2019) in the WMB. Note that the anomalies were calculated based on 1982-2020 climatology from ERA5 hourly data.
Supplementary Figure 4 | The mean (A) SST anomaly [°C], (B) total heat flux anomaly [W/m2], (C) latent heat flux anomaly [W/m2], (D) air temperature anomaly [°C], (E) mean sea level pressure anomaly [hPa], and (F) wind stress anomaly [N/m2] during the MHW event (22 July-27 December 2019) in the EMB. Note that the anomalies were calculated based on 1982-2020 climatology from ERA5 hourly data.
References
Allam A., Moussa R., Najem W., Bocquillon C. (2020). “Chapter 1 - hydrological cycle, Mediterranean basins hydrology,” in Water resources in the Mediterranean region. Eds. Zribi M., Brocca L., Tramblay Y., Molle F. (Elsevier), 1–21. doi: 10.1016/B978-0-12-818086-0.00001-7
Amaya D. J., Alexander M. A., Capotondi A., Deser C., Karnauskas K. B., Miller A. J., et al. (2021). Are long-term changes in mixed layer depth influencing north pacific marine heatwaves? Bull. Am. Meteorological Soc. 102, S59–S66. doi: 10.1175/BAMS-D-20-0144.1
Amaya D. J., Miller A. J., Xie S.-P., Kosaka Y. (2020). Physical drivers of the summer 2019 north pacific marine heatwave. Nat. Commun. 11, 1903. doi: 10.1038/s41467-020-15820-w
Barnston A. G., Livezey R. E. (1987). Classification, seasonality and persistence of low-frequency atmospheric circulation patterns. Monthly Weather Rev. 115, 1083–1126. doi: 10.1175/1520-0493(1987)115<1083:CSAPOL>2.0.CO;2
Benthuysen J. A., Oliver E. C. J., Chen K., Wernberg T. (2020). Editorial: Advances in understanding marine heatwaves and their impacts. Front. Mar. Sci. 7. doi: 10.3389/fmars.2020.00147
Bethoux J. P., Gentili B., Raunet J., Tailliez D. (1990). Warming trend in the western Mediterranean deep water. Nature 347, 660–662. doi: 10.1038/347660a0
Bond N. A., Cronin M. F., Freeland H., Mantua N. (2015). Causes and impacts of the 2014 warm anomaly in the NE pacific. Geophysical Res. Lett. 42, 3414–3420. doi: 10.1002/2015GL063306
Chefaoui R. M., Duarte C. M., Serrão E. A. (2018). Dramatic loss of seagrass habitat under projected climate change in the Mediterranean Sea. Glob Change Biol. 24, 4919–4928. doi: 10.1111/gcb.14401
Criado-Aldeanueva F., Soto-Navarro J. (2020). Climatic indices over the Mediterranean Sea: A review. Appl. Sci. 10, 5790. doi: 10.3390/app10175790
Darmaraki S., Somot S., Sevault F., Nabat P. (2019a). Past variability of Mediterranean Sea marine heatwaves. Geophys. Res. Lett. 46, 9813–9823. doi: 10.1029/2019GL082933
Darmaraki S., Somot S., Sevault F., Nabat P., Cabos Narvaez W. D., Cavicchia L., et al. (2019b). Future evolution of marine heatwaves in the Mediterranean Sea. Clim Dyn 53, 1371–1392. doi: 10.1007/s00382-019-04661-z
Eakin C. M., Morgan J. A., Heron S. F., Smith T. B., Liu G., Alvarez-Filip L., et al. (2010). Caribbean Corals in crisis: Record thermal stress, bleaching, and mortality in 2005. PloS One 5, e13969. doi: 10.1371/journal.pone.0013969
Escudier R., Clementi E., Omar M., Cipollone A., Pistoia J., Aydogdu A., et al (2020). Mediterranean Sea Physical Reanalysis (CMEMS MED-Currents) (Version 1) Data set. Copernicus Monitoring Environment Marine Service (CMEMS). doi: 10.25423/CMCC/MEDSEA_MULTIYEAR_PHY_006_004_E3R1
Fenoglio-Marc L., Schöne T., Illigner J., Becker M., Manurung P., Khafid (2012). Sea Level change and vertical motion from satellite altimetry, tide gauges and GPS in the Indonesian region. Mar. Geodesy 35, 137–150. doi: 10.1080/01490419.2012.718682
Frölicher T. L., Laufkötter C. (2018). Emerging risks from marine heat waves. Nat. Commun. 9, 650. doi: 10.1038/s41467-018-03163-6
Garnesson P., Mangin A., Bretagnon M. (2022). OCEAN COLOUR PRODUCTION CENTRE satellite observation Copernicus-GlobColour products. doi: 10.48670/moi-00281
Garrabou J., Coma R., Bensoussan N., Bally M., Chevaldonné P., Cigliano M., et al. (2009). Mass mortality in northwestern Mediterranean rocky benthic communities: effects of the 2003 heat wave. Global Change Biol. 15, 1090–1103. doi: 10.1111/j.1365-2486.2008.01823.x
Hamdeno M., Nagy H., Ibrahim O., Mohamed B. (2022). Responses of satellite chlorophyll-a to the extreme Sea surface temperatures over the Arabian and omani gulf. Remote Sens. 14, 4653. doi: 10.3390/rs14184653
Hamed K. H., Ramachandra Rao A. (1998). A modified Mann-Kendall trend test for autocorrelated data. J. Hydrology 204, 182–196. doi: 10.1016/S0022-1694(97)00125-X
Hellerman S., Rosenstein M. (1983). Normal monthly wind stress over the world ocean with error estimates. J. Phys. Oceanogr. 13, 1093–1104. doi: 10.1175/1520-0485(1983)013<1093:NMWSOT>2.0.CO;2
Hersbach H., Bell B., Berrisford P., Hirahara S., Horányi A., Muñoz-Sabater J., et al. (2020). The ERA5 global reanalysis. Q.J.R. Meteorol. Soc 146, 1999–2049. doi: 10.1002/qj.3803
Hobday A. J., Alexander L. V., Perkins S. E., Smale D. A., Straub S. C., Oliver E. C. J., et al. (2016). A hierarchical approach to defining marine heatwaves. Prog. Oceanography 141, 227–238. doi: 10.1016/j.pocean.2015.12.014
Hobday A., Oliver E., Sen Gupta A., Benthuysen J., Burrows M., Donat M., et al. (2018). Categorizing and naming marine heatwaves. Oceanog 31(2), 162173. doi: 10.5670/oceanog.2018.205
Holbrook N. J., Scannell H. A., Sen Gupta A., Benthuysen J. A., Feng M., Oliver E. C. J., et al. (2019). A global assessment of marine heatwaves and their drivers. Nat. Commun. 10, 2624. doi: 10.1038/s41467-019-10206-z
Hughes T. P., Anderson K. D., Connolly S. R., Heron S. F., Kerry J. T., Lough J. M., et al. (2018). Spatial and temporal patterns of mass bleaching of corals in the anthropocene. Science 359, 80–83. doi: 10.1126/science.aan8048
Ibrahim O., Mohamed B., Nagy H. (2021). Spatial variability and trends of marine heat waves in the Eastern Mediterranean Sea over 39 years. JMSE 9, 643. doi: 10.3390/jmse9060643
Juza M., Fernández-Mora À., Tintoré J. (2022)Sub-Regional marine heat waves in the Mediterranean Sea from observations: Long-term surface changes, Sub-surface and coastal responses (Accessed March 25, 2022).
Kuroda H., Yokouchi K. (2017). Interdecadal decrease in potential fishing areas for pacific saury off the southeastern coast of Hokkaido, Japan. Fish. Oceanogr. 26, 439–454. doi: 10.1111/fog.12207
Le Grix N., Zscheischler J., Laufkötter C., Rousseaux C. S., Frölicher T. L. (2021). Compound high-temperature and low-chlorophyll extremes in the ocean over the satellite period. Biogeosciences 18, 2119–2137. doi: 10.5194/bg-18-2119-2021
Leonard M., Westra S., Phatak A., Lambert M., van den Hurk B., McInnes K., et al. (2014). A compound event framework for understanding extreme impacts. WIREs Climate Change 5, 113–128. doi: 10.1002/wcc.252
Lionello P., Malanotte-Rizzoli P., Boscolo R., Alpert P., Artale V., Li L., et al. (2006). “The Mediterranean climate: An overview of the main characteristics and issues,” in Developments in earth and environmental sciences Mediterranean. Eds. Lionello P., Malanotte-Rizzoli P., Boscolo R. (Elsevier), 1–26. doi: 10.1016/S1571-9197(06)80003-0
Longhurst A. R. (2007) “Chapter 9 - THE ATLANTIC OCEAN,” in Ecological geography of the Sea, 2nd ed.Ed. Longhurst A. R. (Burlington: Academic Press), 131–273. doi: 10.1016/B978-012455521-1/50010-3
Mannino A. M., Balistreri P., Deidun A. (2017). The marine biodiversity of the Mediterranean Sea in a changing climate: The impact of biological invasions . IntechOpen. doi: 10.5772/intechopen.69214
Marx W., Haunschild R., Bornmann L. (2021). Heat waves: a hot topic in climate change research. Theor. Appl. Climatol 146, 781–800. doi: 10.1007/s00704-021-03758-y
Mavrakis A. F., Tsiros I. X. (2019. The abrupt increase in the Aegean sea surface temperature during June 2007 – a marine heatwave event? Weather 74, 201–207. doi: 10.1002/wea.3296
Mills K. E., PERSHING A. J., BROWN C. J., CHEN Y., CHIANG F.-S., HOLLAND D. S., et al. (2013). Fisheries management in a changing climate: Lessons from the 2012 ocean heat wave in the Northwest Atlantic. Oceanography 26, 191–195. doi: 10.5670/oceanog.2013.27
Miyama T., Minobe S., Goto H. (2021). Marine heatwave of Sea surface temperature of the oyashio region in summer in 2010–2016. Front. Mar. Sci. 7. doi: 10.3389/fmars.2020.576240
Mohamed B., Abdallah A. M., Alam El-Din K., Nagy H., Shaltout M. (2019a). Inter-annual variability and trends of Sea level and Sea surface temperature in the Mediterranean Sea over the last 25 years. Pure Appl. Geophys. 176, 3787–3810. doi: 10.1007/s00024-019-02156-w
Mohamed B., Ibrahim O., Nagy H. (2022a). Sea Surface temperature variability and marine heatwaves in the black Sea. Remote Sens. 14, 2383. doi: 10.3390/rs14102383
Mohamed B., Mohamed A., Alam El-Din K., Nagy H., Elsherbiny A. (2019b). Sea Level changes and vertical land motion from altimetry and tide gauges in the southern levantine basin. J. Geodynamics 128, 1–10. doi: 10.1016/j.jog.2019.05.007
Mohamed B., Nagy H., Ibrahim O. (2021). Spatiotemporal variability and trends of marine heat waves in the red Sea over 38 years. JMSE 9, 842. doi: 10.3390/jmse9080842
Mohamed B., Nilsen F., Skogseth R. (2022b)Marine heatwaves characteristics in the barents Sea based on high resolution satellite dat–2020 (Accessed June 12, 2022).
Nadia P., Zavatarelli M., Arneri E., Crise A., Ravaioli M. (2006). The physical, sedimentary and ecological structure and variability of shelf areas in the Mediterranean Sea. Harvard University Press, Cambridge, MA The Sea, Volume 14B: The Global Coastal Ocean
Nagy H., Elgindy A., Pinardi N., Zavatarelli M., Oddo P. (2017). A nested pre-operational model for the Egyptian shelf zone: Model configuration and validation/calibration. Dynamics Atmospheres Oceans 80, 75–96. doi: 10.1016/j.dynatmoce.2017.10.003
Nagy H., Lyons K., Nolan G., Cure M., Dabrowski T. (2020). A regional operational model for the north East Atlantic: Model configuration and validation. J. Mar. Sci. Eng. 8, 673. doi: 10.3390/jmse8090673
Nagy H., Mohamed B., Ibrahim O. (2021). Variability of heat and water fluxes in the red Sea using ERA5 dat–2020. J. Mar. Sci. Eng. 9, 1276. doi: 10.3390/jmse9111276
Olita A., Sorgente R., Natale S., Gaber?ek S., Ribotti A., Bonanno A., et al. (2007). Effects of the 2003 European heatwave on the central Mediterranean Sea: surface fluxes and the dynamical response. Ocean Sci. 3, 273–289. doi: 10.5194/os-3-273-2007
Oliver E. C., Benthuysen J. A., Bindoff N. L., Hobday A. J., Holbrook N. J., Mundy C. N., et al. (2017). The unprecedented 2015/16 Tasman Sea marine heatwave. Nat. Commun. 8, 16101. doi: 10.1038/ncomms16101
Pastor F., Valiente J. A., Khodayar S. (2020). A warming Mediterranean: 38 years of increasing Sea surface temperature. Remote Sens. 12, 2687. doi: 10.3390/rs12172687
Pastor F., Valiente J. A., Palau J. L. (2018). Sea Surface temperature in the Mediterranean: Trends and spatial pattern–2016. Pure Appl. Geophys. 175, 4017–4029. doi: 10.1007/s00024-017-1739-z
Pinardi N., Allen I., Demirov E., De Mey P., Korres G., Lascaratos A., et al. (2003). The Mediterranean ocean forecasting system: First phase of implementatio–2001. Annales Geophysicae 21, 3–20. doi: 10.5194/angeo-21-3-2003
Reynolds R. W., Smith T. M., Liu C., Chelton D. B., Casey K. S., Schlax M. (2007). Daily high-Resolution-Blended analyses for Sea surface temperature. G.J. Climate 20, 5473–5496. doi: 10.1175/2007JCLI1824.1
Sánchez-Benítez A., Goessling H., Pithan F., Semmler T., Jung T. (2022). The July 2019 European heat wave in a warmer climate: Storyline scenarios with a coupled model using spectral nudging. J. Climate 35, 2373–2390. doi: 10.1175/JCLI-D-21-0573.1
Schlegel R. W., Oliver E. C. J., Chen K. (2021). Drivers of marine heatwaves in the Northwest Atlantic: The role of air–Sea interaction during onset and decline. Front. Mar. Sci. 8. doi: 10.3389/fmars.2021.627970
Selig E. R., Casey K. S., Bruno J. F. (2010). New insights into global patterns of ocean temperature anomalies: Implications for coral reef health and management: Global variability in temperature anomalies on coral reefs. Global Ecol. Biogeography 19, 397–411. doi: 10.1111/j.1466-8238.2009.00522.x
Sen Gupta A., Thomsen M., Benthuysen J. A., Hobday A. J., Oliver E., Alexander L. V., et al. (2020). Drivers and impacts of the most extreme marine heatwave events. Sci. Rep. 10, 19359. doi: 10.1038/s41598-020-75445-3
Skliris N., Sofianos S. S., Gkanasos A., Axaopoulos P., Mantziafou A., Vervatis V. (2011). Long-term sea surface temperature variability in the Aegean Sea. Adv. Oceanography Limnology 2, 125–139. doi: 10.1080/19475721.2011.601325
Skliris N., Sofianos S., Gkanasos A., Mantziafou A., Vervatis V., Axaopoulos P., et al. (2012). Decadal scale variability of sea surface temperature in the Mediterranean Sea in relation to atmospheric variability. Ocean Dynamics 62, 13–30. doi: 10.1007/s10236-011-0493-5
Smale D. A., Wernberg T., Oliver E. C. J., Thomsen M., Harvey B. P., Straub S. C., et al. (2019). Marine heatwaves threaten global biodiversity and the provision of ecosystem services. Nat. Clim. Change 9, 306–312. doi: 10.1038/s41558-019-0412-1
Soukissian T., Sotiriou M.-A. (2022). Long-term variability of wind speed and direction in the Mediterranean basin. Wind 2, 513–534. doi: 10.3390/wind2030028
Sparnocchia S., Schiano M. E., Picco P., Bozzano R., Cappelletti A. (2006). The anomalous warming of summer 2003 in the surface layer of the central ligurian Sea (Western Mediterranean). Ann. Geophys. 24, 443–452. doi: 10.5194/angeo-24-443-2006
Tanhua T., Hainbucher D., Schroeder K., Cardin V., Álvarez M., Civitarese G. (2013). The Mediterranean Sea system: A review and an introduction to the special issue. Ocean Sci. 9, 789–803. doi: 10.5194/os-9-789-2013
Thomson R. E., Emery W. J. (2014). Data analysis methods in physical oceanography (Elsevier Inc.: Amsterdam, The Netherlands). doi: 10.1016/C2010-0-66362-0
Vautard R., Aalst M., Boucher O., Drouin A., Haustein K., Kreienkamp F., et al. (2020). Human contribution to the record-breaking June and July 2019 heatwaves in Western Europe. Environ. Res. Lett. 15, 094077. doi: 10.1088/1748-9326/aba3d4
Wang F., Shao W., Yu H., Kan G., He X., Zhang D., et al. (2020). Re-evaluation of the power of the Mann-Kendall test for detecting monotonic trends in hydrometeorological time series (Accessed March 10, 2022).
Wilks D. S. (2019). Statistical methods in the atmospheric sciences (Cambridge, MA: Academic Press). doi: 10.1016/C2017-0-03921-6
Keywords: marine heatwaves, Mediterranean Sea, trends, interannual variability, teleconnection patterns, ERA-5
Citation: Hamdeno M and Alvera-Azcaráte A (2023) Marine heatwaves characteristics in the Mediterranean Sea: Case study the 2019 heatwave events. Front. Mar. Sci. 10:1093760. doi: 10.3389/fmars.2023.1093760
Received: 09 November 2022; Accepted: 17 February 2023;
Published: 08 March 2023.
Edited by:
Yongsheng Wu, Fisheries and Oceans Canada (DFO), CanadaReviewed by:
Michael Dowd, Dalhousie University, CanadaAidin Jabbari, Bedford Institute of Oceanography (BIO), Canada
Hui Wu, East China Normal University, China
Copyright © 2023 Hamdeno and Alvera-Azcaráte. This is an open-access article distributed under the terms of the Creative Commons Attribution License (CC BY). The use, distribution or reproduction in other forums is permitted, provided the original author(s) and the copyright owner(s) are credited and that the original publication in this journal is cited, in accordance with accepted academic practice. No use, distribution or reproduction is permitted which does not comply with these terms.
*Correspondence: Manal Hamdeno, bWguZWxhd2FkeUB1bGllZ2UuYmU=