 Stephen C. Dobbs1*
 Charles K. Paull2
 Eve M. Lundsten2
 Roberto Gwiazda2
 David W. Caress2
 Mary McGann3Marianne M. Coholich1Maureen A. L. Walton4
 Nora M. Nieminski5
 Tim McHargue1
 Stephan A. Graham1
- 1Department of Earth and Planetary Sciences, Stanford Doerr School of Sustainability, Stanford University, Stanford, CA, United States
- 2Monterey Bay Aquarium Research Institute, Moss Landing, CA, United States
- 3Pacific Coastal and Marine Science Center, U.S. Geological Survey, Menlo Park, CA, United States
- 4Ocean Sciences Division, U.S. Naval Research Laboratory, Stennis Space Center, MS, United States
- 5Pacific Coastal and Marine Science Center, U.S. Geological Survey, Santa Cruz, CA, United States
A high-resolution multibeam survey from a portion of the San Simeon Channel (offshore Morro Bay, California) captured a zone of recurring troughs and ridges adjacent to prominent submarine meander bends. Through an integrated study using surveying data, sediment core analysis, radiocarbon dating, and stable isotope measurements, we hypothesize that turbidity current event frequency was higher during the late Pleistocene than at present conditions. We speculate that the rise in sea-level following the Last Glacial Maximum sequestered sedimentation largely to the shelf during the Holocene. This work suggests that the occurrence of sediment gravity flows in this region, particularly away from any submarine channels, is appreciably lower than at times of continental shelf subaerial exposure.
1 Introduction
The continental slope offshore Morro Bay (central California; Figure 1) is a proposed site for offshore wind energy development due to its high resource potential from high offshore wind speeds and its proximity to power grid infrastructure (Bureau of Ocean Energy Management (BOEM), 2018). Studies by the Bureau of Ocean Energy Management and the U.S. Geological Survey provided geophysical assessments of offshore fault systems (Walton et al., 2021) and biological habitat characterization (Kuhnz et al., 2021; Cochrane et al., 2022a; Kuhnz et al., 2022) in the region. As noted by Walton et al. (2021), there remains a critical need for understanding the sediment dynamics of the region to evaluate the structural feasibility of offshore wind farm development in the area.
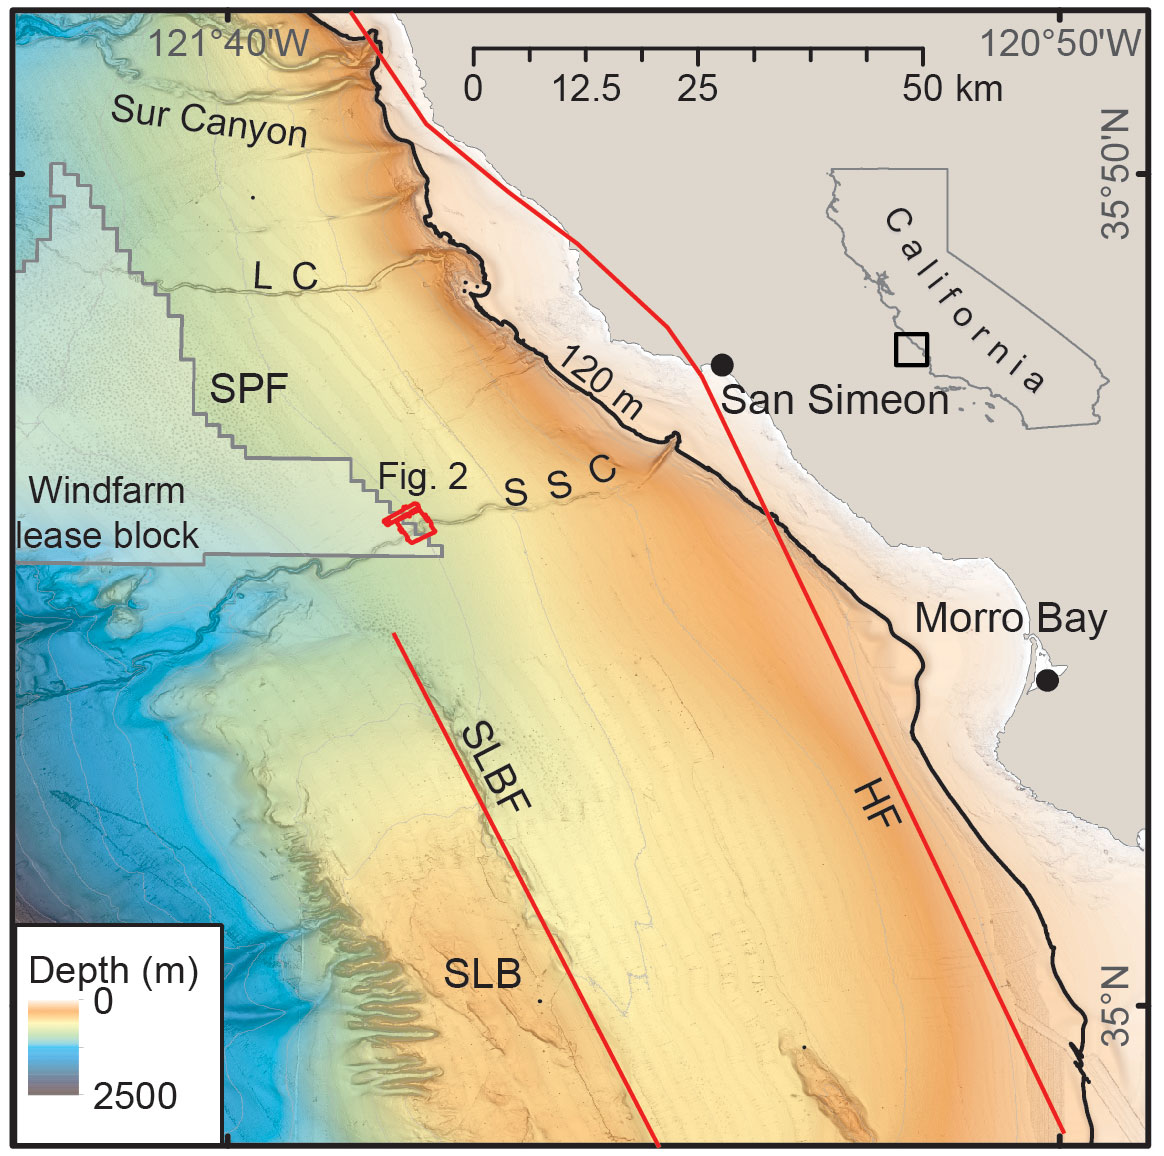
Figure 1 Regional map of the Morro Bay continental slope. SSC, San Simeon Channel; LC, Lucia Chica Channel; SPF, Sur Pockmark Field; SLB, Santa Lucia Bank; SLBF, Santa Lucia Bank Fault; HF, Hosgri Fault. Red lines are approximate locations of labeled faults. High-resolution survey and paired sub-bottom profiles of the San Simeon Channel bend highlighted in red outline (Figure 2). Gridded gray polygon outlines the proposed leasing block for offshore windfarm development.
We present an integrated dataset of high-resolution multibeam bathymetry, sub-bottom profiles, sediment core analysis, radiocarbon dates, and stable isotope analysis of seafloor sediments to assess the sedimentation history of the Morro Bay continental slope. Specifically, we focus on a survey that images a meander bend of the San Simeon Channel (Figures 1, 2) and use sediment cores collected in this area to speculate as to the recurrence of sediment gravity flows in the region from the late Pleistocene to present.
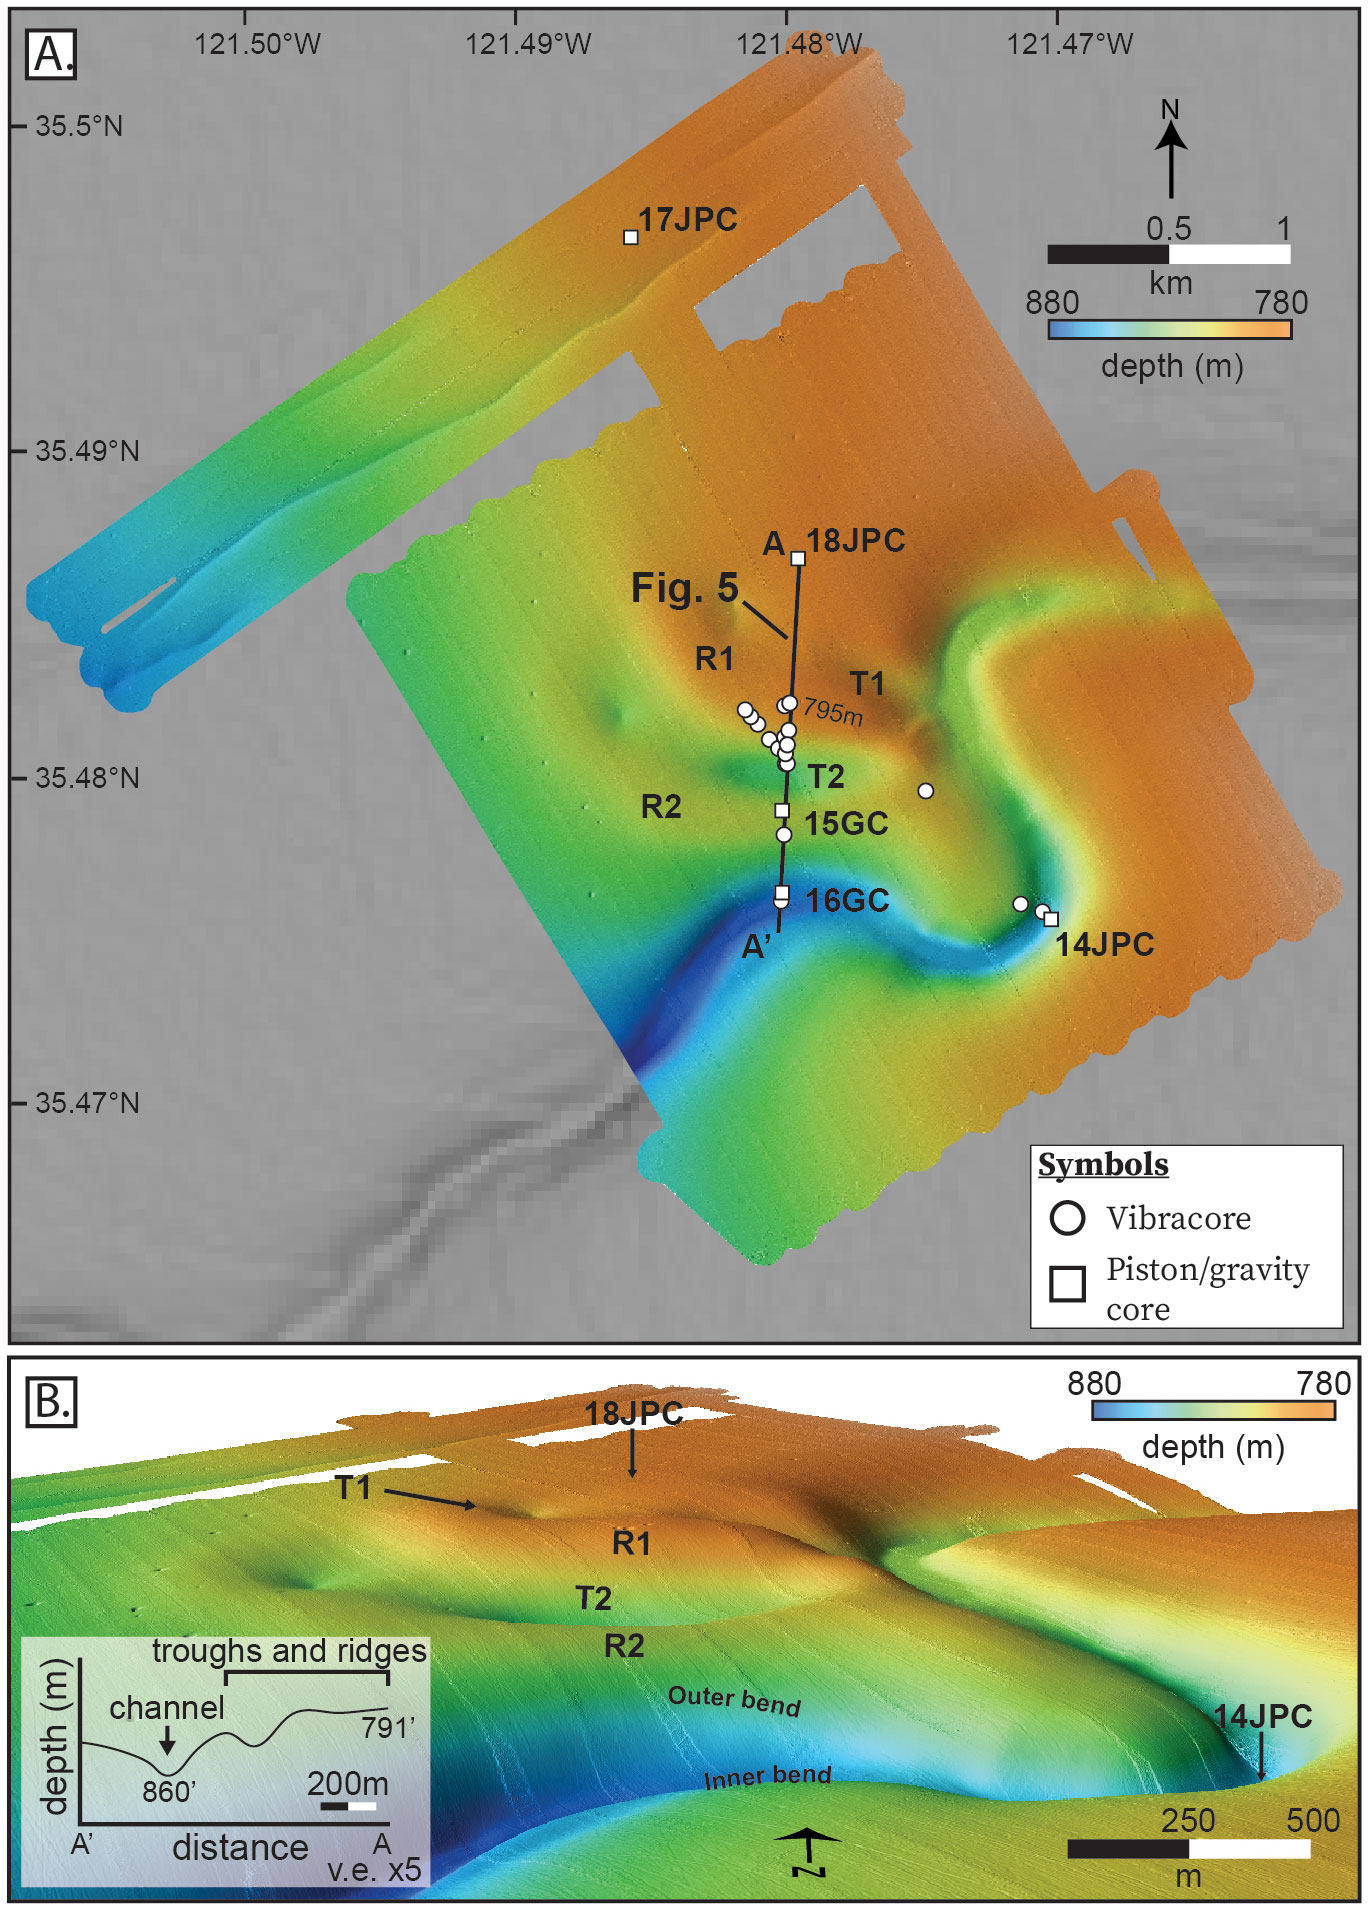
Figure 2 (A) Local 1m resolution bathymetric survey of the San Simeon Channel meander bend and adjacent troughs (T1–T2) and ridges (R1–R2). (B) Perspective view looking north (vertical exaggeration = 5x) highlighting both the meanders and the trough-and-ridge bathymetry. A-A’ bathymetric profile of trough-and-ridge bathymetry and channel (chirp profile shown in Figure 5).
2 Geologic Background
The San Simeon Channel is located offshore central California on the northern margin of the Santa Maria basin (McCulloch, 1987; McCulloch, 1989). The structural basin is bounded to the northeast by the Hosgri Fault (Wagner, 1974) and to the southwest by the Santa Lucia Bank Fault that parallels the narrow Santa Lucia Bank structural high (McCulloch, 1989). The San Simeon Channel bisects the southeastern margin of the Sur Pockmark field (Figure 1; Paull et al., 2002). The channel system heads on the outer continental shelf approximately 10 km southwest from the town of San Simeon. The San Simeon Channel appears to be a single confined channel that transects the continental slope until its intersection with a submarine canyon at the edge of the continental slope (Figure 1). While much of the existing work in this area has focused on the tectono-stratigraphic history of the offshore California margin (e.g., Hoskins and Griffiths, 1971; Irwin and Dennis, 1979; Page et al., 1979; Ross and McCulloch, 1979; Saleeby, 1986; McCulloch, 1987; McCulloch, 1989) and the dextral slip history of the offshore Neogene San Gregorio-Hosgri Fault zone (e.g., Graham and Dickinson, 1978; Dickinson et al., 2005; Johnson et al., 2018), little is known about the submarine geomorphology and sediment transport processes occurring in the area (Paull et al., 2002; Maier et al., 2011; Maier et al., 2012; Maier et al., 2013; Dobbs et al., 2020; Dobbs et al., 2021; Walton et al., 2021).
3 Methods
3.1 Ship-based and AUV mapping and sub-bottom profiling
Prior to 2017, the morphology and structure of the continental slope offshore California from San Simeon to Morro Bay was poorly known. Multibeam, chirp sub-bottom profile, and sparker seismic reflection surveys by the National Oceanic and Atmospheric Administration (NOAA) hydrographic survey vessels Rainier and Fairweather during 2017-2019 (Cochrane et al., 2022b) greatly improved the bathymetric model shown in Figure 1. The ship-based bathymetric resolution varies with seafloor depth from about 3 m at the 120 m deep shelf edge to about 20 m at 2000 m depth. Survey-capable autonomous underwater vehicles (AUVs) provide higher resolution topography and sub-bottom profiler data in deep water by operating at a constant low altitude. During 2018-2019, the Monterey Bay Aquarium Research Institute (MBARI) conducted 18 surveys (Kennedy et al., 2021) with its Dorado-class Mapping AUVs (Caress et al., 2008) along the Morro Bay continental slope from R/V Rachel Carson. The AUVs were equipped with 400 kHz Reson 7125 multibeam and 1-6 kHz sweep Edgetech chirp sub-bottom profiler sonars. The surveys were flown at a 50 m altitude with a 150 m survey line spacing, producing 1 m lateral resolution bathymetry and sub-bottom profiles penetrating up to 40 m of the subsurface with ~10 cm vertical resolution. Multibeam, sidescan, and sub-bottom profiler data were processed using the open-source software MB-System (Caress et al., 2008), which is capable of processing and displaying swath mapping sonar data. Data processing include editing of multibeam bathymetry, pitch and roll bias adjustment, and various corrections related to tides, navigation and sidescan data. This paper utilizes AUV survey mission 20180427m1 (Figure 2), which maps a bend of the San Simeon Channel.
3.2 Coring surveys
Vibracoring and groundtruthing surveys were conducted from the MBARI R/V Western Flyer using the Doc Ricketts ROV. Sea-bed video, shallow (<30 cm) push cores, and 1.5 m long vibracores were acquired from the seafloor with the ROV between February and November 2019. Additionally a cruise the R/V Bold Horizon collected deep-penetrating (up to seven meters of penetration) piston and gravity cores in September 2019. Three piston cores (14JPC, 17JPC, 18JPC) and two gravity cores (15GC, 16GC) were collected from the San Simeon Channel at the 800 mwd survey (Figure 2). These cores were processed at the U.S. Geological Survey core laboratory in Santa Cruz, California. Cores were cut into 150-cm sections and then ran through a multi-sensor core logger (MSCL) system that measured core depth and width, gamma density, p-wave velocity, loop sensor magnetic susceptibility, and electrical resistivity at 1-cm intervals. Cores were then split and photographed using the MSCL camera. Detailed sedimentological core descriptions were made using these data for each core, which were then sub-sampled for radiocarbon, grain size measurements, and stable isotope analyses.
3.3 Radiocarbon dating
A total of 33 sediment samples were collected for radiocarbon age dating. Sample sites were selected either at equal intervals or directly underneath turbidite horizons to provide a maximum depositional age of sediment gravity flow events. Mixed planktonic or benthic foraminifera were picked from 2-cm thick intervals of sediment. Foraminifera were analyzed at the National Ocean Sciences Accelerator Mass Spectrometry facility at the Woods Hole Oceanographic Institute. The global-average marine record of radiocarbon is ~650 years from 0–11.6 Ka and 750-1000 years further back in time (Heaton et al., 2020). A 59 ± 134-year regional marine radiocarbon reservoir correction (ΔR20) was used for the planktic foraminiferal samples based on 40 samples located from 35°N-40°N in the 14CHRONO Marine 20 Reservoir Database (http://calib.org/marine/), and 1100 ± 200 years for the benthic foraminiferal samples (reinterpretation of Kienast and McKay, 2001 based on Heaton et al., 2020). The CALIB 8.2 software was used to calibrate the ages using the reservoir-corrected values (Stuiver et al., 2022). All ages are reported in calendar years before present. Radiocarbon data associated with this article are compiled in McGann et al. (2023).
3.4 Stable isotope geochemistry and grain size measurements
Piston and gravity cores were sampled for paired grain size and stable isotope analyses. Downcore samples were collected every 50 cm. Where present, selected sand-rich event beds were also sampled at as little as 1 cm spacing. Samples were analyzed for weight percent organic nitrogen (δ15Norganic) and total weight percent carbon (TC) by combusting them in tin capsules. The same materials were prepared in silver capsules, acidified with 1N hydrochloric acid to dissolve any inorganic carbon, and remeasured to obtain total weight percent organic carbon (TOC) and δ13Corganic.Total inorganic carbon (IC) was calculated as the difference between TC and TOC. Analyses were performed on a Thermo Scientific EA IsoLink IRMS System with a Delta V Advantage coupled to a SmartFlash EA via ConfloIV interface at Stanford University. Data were standardized using reference material IAEA-600 (caffeine, -27.771 ± 0.043 ‰VPDB; Coplen et al., 2006). Bulk carbonate δ13C and δ18O were measured on a Thermo Scientific MAT252 mass spectrometer coupled to a Kiel III carbonate device. Bulk carbonate δ13C and δ18O are reported with respect to VPBD, and δ15N with respect to air. Accuracy of the isotopic measurements was ensured by using reference material NBS19 (limestone, +1.95 ‰VPDB; Coplen et al., 2006) as a standard.
We used a Beckman-Coulter LS 13320 Laser Particle Size Analyzer (LPSA) at the San José State University Moss Landing Marine Laboratories to measure the distribution of grain sizes in each sample. This instrument analyzes small amounts (0.5–2 g) of sediment and uses combined principles of laser diffraction and polarized intensity differential scattering to resolve grain sizes between 0.04–2000 μm (Beckman Coulter Inc, 2003). These data were then compared between samples by plotting them as frequency distributions.
4 Results
4.1 Bathymetry
The AUV bathymetric survey imaged a portion of the San Simeon Channel from 770–875 mwd (Figure 2). The image reveals a single confined, moderately sinuous (sinuosity coefficient = 1.48) submarine channel that is approximately 200 m wide. In the upper portion of the survey, channel thalweg to levee relief is ~15 m while the lower portion of the survey reaches reliefs of ~32 m. Three prominent meanders are captured in the survey region, with approximate orthogonal bends in channel directions. Adjacent to the channel between 790-832 mwd is a series of bathymetric troughs and ridges that make up an area measuring ~1.5 km2 (labeled T1-R1 and T2-R2; Figure 2A). The shallowest trough (T1; maximum relief = 11 m; average side slopes = 5°; Figure 2A) is followed by the most prominent ridge (R1) and trough (T2) pair between 792-832 mwd, which has a maximum ridge-to-trough relief of 38 m and an average side slope 18° (Figure 2A). One more ridge is present in this area (R2), which has a maximum ridge-to-trough relief of 14 m, an average side slope ~7°, and abuts the outer bend of the lowermost meander in the survey. All side slopes are appreciably greater than the regional gradient, which is ~3°.
4.2 Subsurface profiles
A grid of chirp subsurface profiles was oriented approximately orthogonal to the regional gradient, which captured ~40 m of sub-bottom stratigraphy. We divide these reflections based on variations of acoustic properties. The shallowest level of reflections is primarily an acoustically transparent unit ranging from 0–0.01 s (~0–9 m) in thickness (Figure 3). This unit tends to drape over bathymetry in greater thickness where local relief is at a minimum and thins where relief is higher (e.g., toward the ridges and troughs). Below the drape layer is a combination of continuous, high amplitude acoustic reflections that are interbedded with acoustically transparent layers (Figure 3). This acoustic facies makes up most of the out-of-channel stratigraphy. This facies tends to thin away from the channel axis (Figures 3A, B). In some instances, the relatively younger interbedded reflections near the channel appear to have aggraded on top of the relatively older interbedded units (Figures 3C, D). The final acoustic facies is defined by poorly imaged, discontinuous packages of reflections that appear near or at the current channel’s location (Figures 3A, B, E–G). This unit appears to be bound to regions proximal to the channel and does not appear in the out-of-channel stratigraphy.
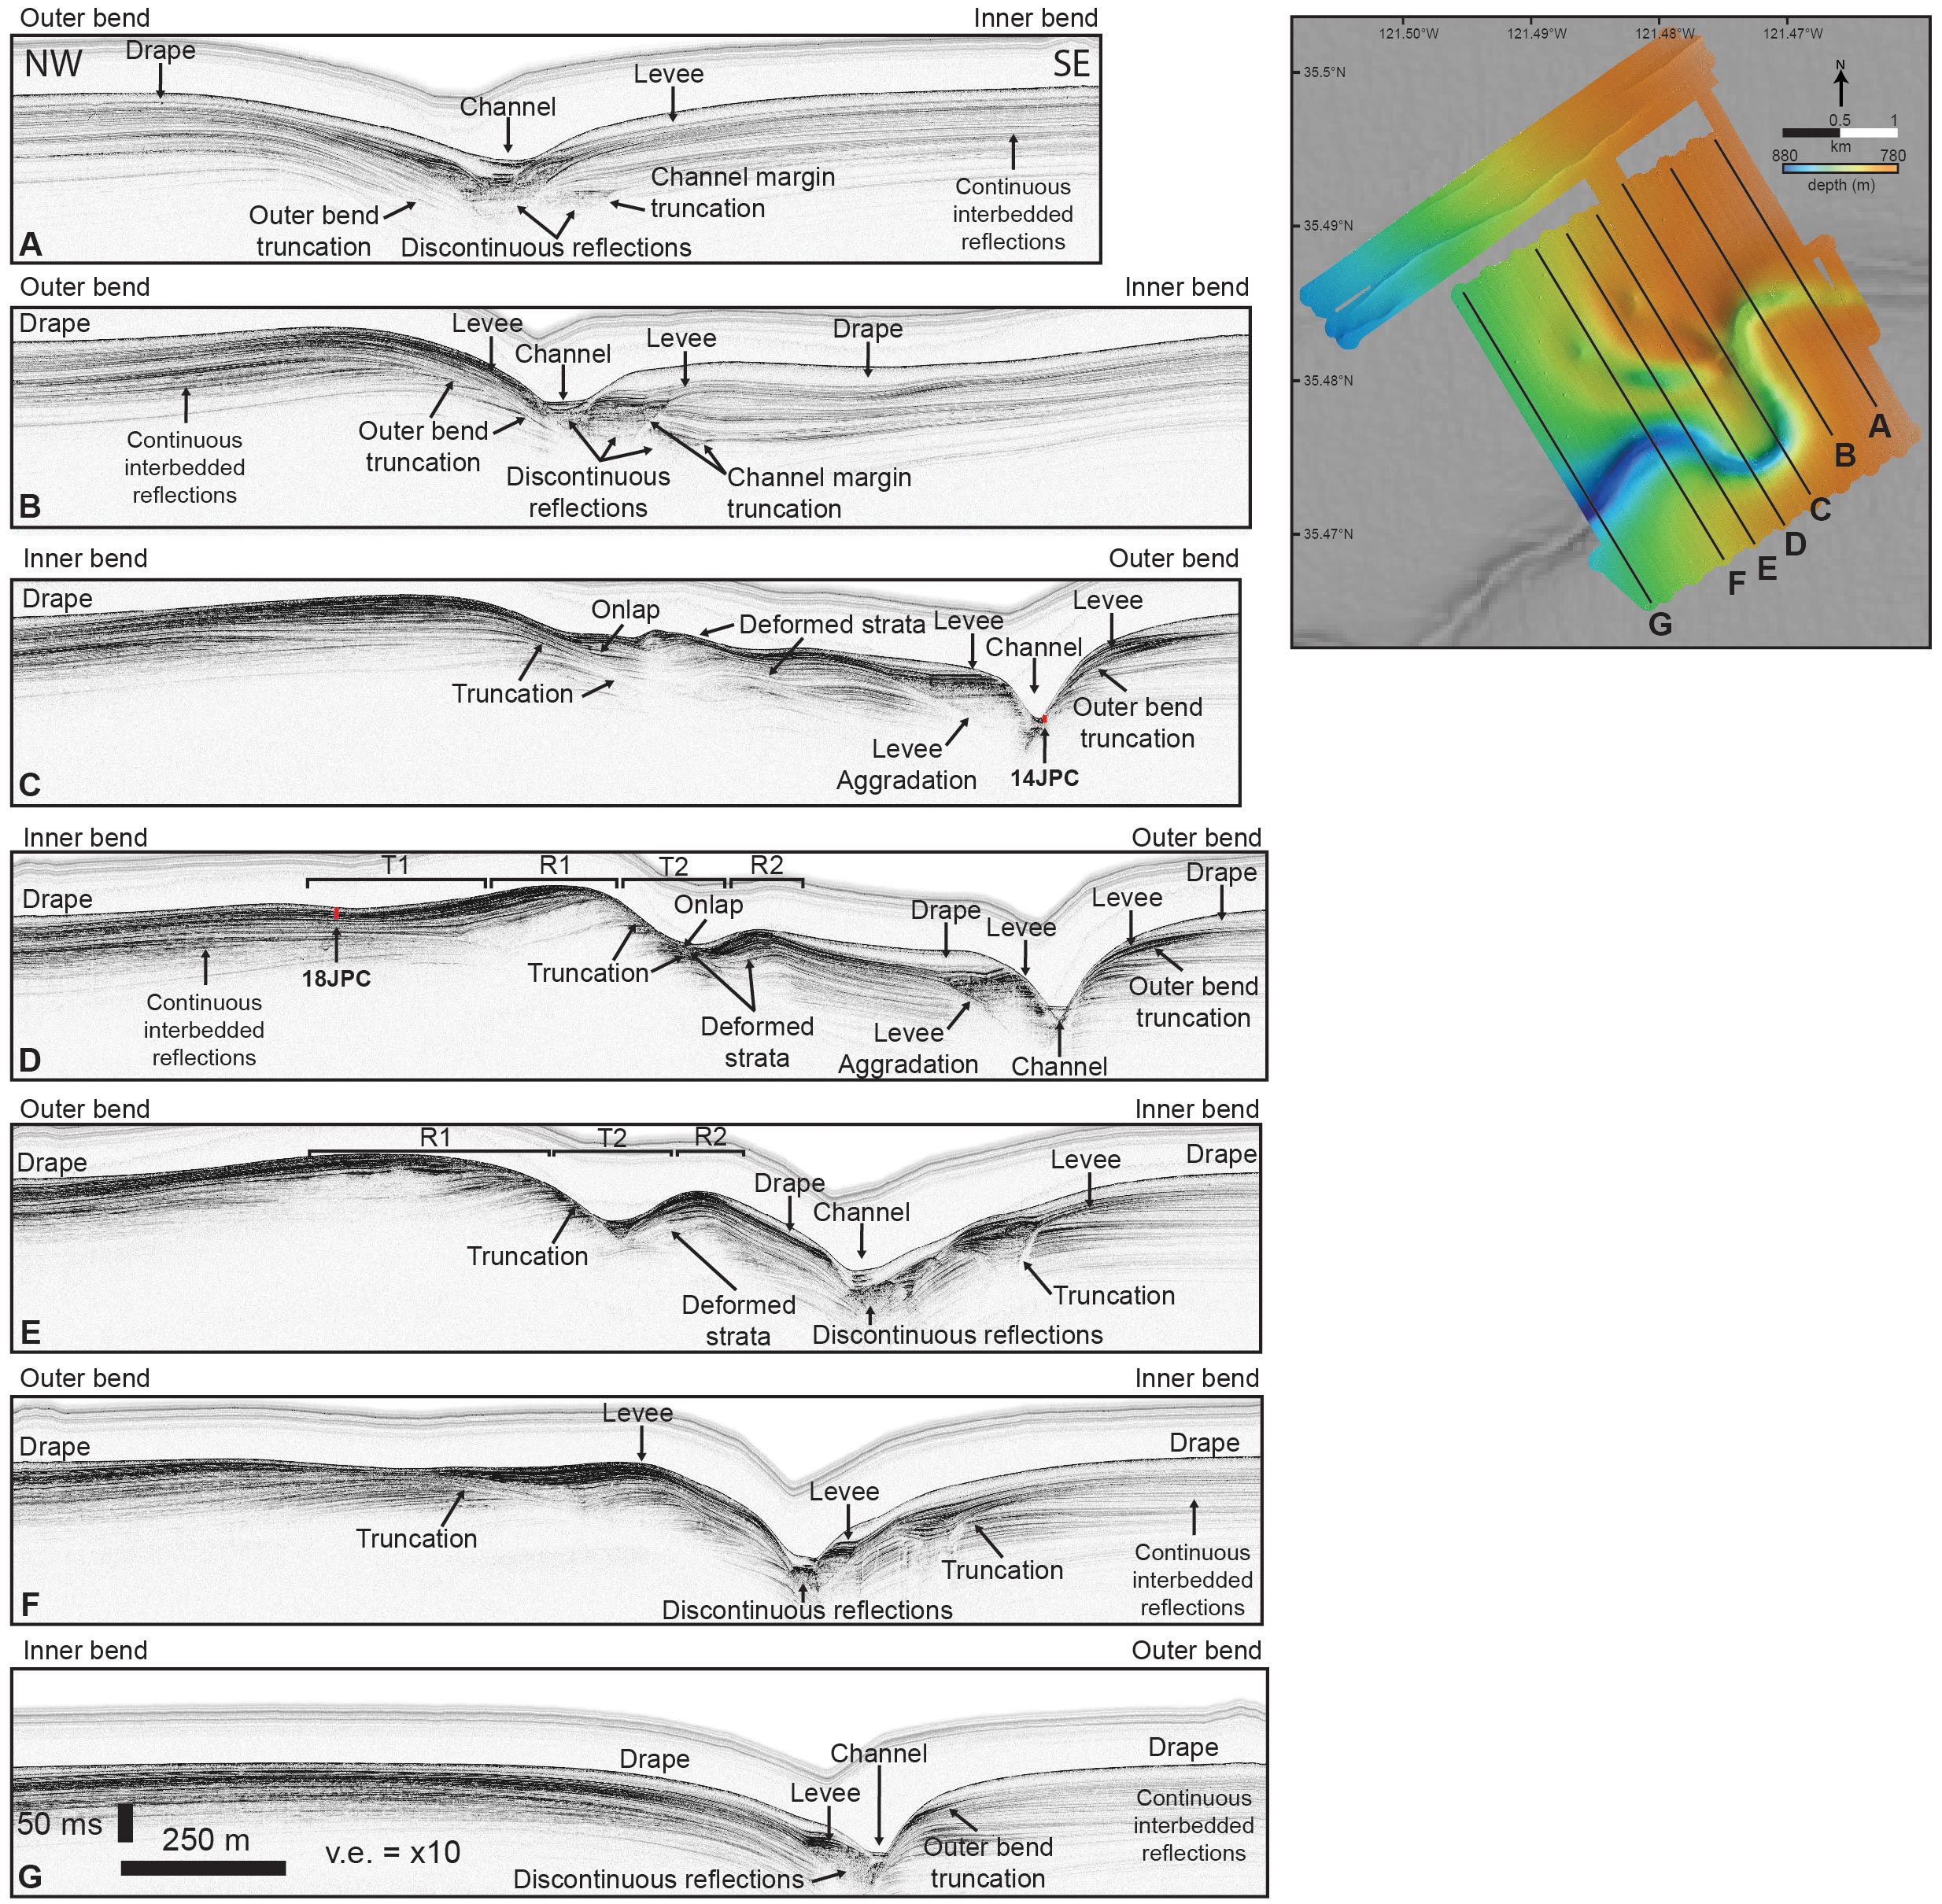
Figure 3 Annotated chirp profiles and map view locations from the AUV bathymetric survey. Locations of 14JPC and 18JPC (Figure 5) and approximate penetration depths are noted by the red rectangles. All profiles from left to right trend from northwest to southeast. (A–G) refer to the location of the cross sections relative to the plan view survey image (right).
Several important geometric relationships are noted in these profiles. The outer bend of the shallowest meander displays truncation of older, interbedded reflections and is overlain by younger reflections (Figures 3A, B). While the shallowest meander’s inner bend records erosion at the margin of the channel that has subsequently been infilled by a combination of discontinuous and interbedded, flat-lying reflections. Interbedded packages near the channel are either truncated at the edge of the channel or dip toward the channel axis. Away from the channel, these interbedded units appear to be either sub-horizontal (Figures 3A, G) or moderately dip away from the channel margins (Figure 3B). The latter case appears to be most common on the side of the channel where the trough-and-ridge bathymetry exists, suggesting that the bathymetric influence of these features may propagate into the regions above and below the zone of troughs and ridges.
Subsurface profiles across the trough-and-ridge bathymetry reveal zones of deformation and truncation. At depths just above T1 near the channel margin, strata appear to be moderately deformed, which then onlap onto truncated, interbedded stratigraphy moving away from the channel (Figure 3C). This deformed unit is overlain by aggradational, interbedded reflections adjacent to the current location of the channel axis (Figures 3C, D). Chirp profiles that capture the maximum relief between the trough-ridge pairs reveal that strata making up the R1-T2 slope appear to be truncated at or near the modern surface of the seafloor (Figures 3D, E). The reflections making up the R2-T2 slope appear to be back-tilted in the direction away from the location of the channel, and onlap on the truncation surface of the R1-T2 slope (Figures 3D, E). At depths below the zone of highest relief created by the ridges and troughs, a truncated surface overlain by interbedded reflections can still be identified propagating into the subsurface (Figure 3F). On the southeastern side of channel, making up an inner bend of a meander, interbedded reflections appear to be truncated and infilled by flat-lying, interbedded reflections (Figures 3E, F). At depths below the bathymetric influence of the ridges and troughs, channel levees appear to be flat lying and do not show signs of deformation (Figure 3G).
4.2.1 Bathymetric and subsurface profile interpretations
We first use the variation in acoustic properties across groupings of the subsurface reflections to make inferences as to the sedimentological character of the subsurface stratigraphy and then make interpretations of the channel’s history based on observed geometric relationships. The draping geometry of the acoustically transparent packages making up the shallowest level of stratigraphy suggests that this is a drape layer made up primarily of mud derived from hemipelagic fall out of fine-grained material from the water column (Figure 3). Sediment cores from these layers (discussed in section 4.3) are homogeneously mud. This suggests that the area has received predominantly hemipelagic sediments in recent times and few sediment gravity flows from the channel, an observation noted in other regions across the California continental slope (Paull et al., 2002; Maier et al., 2011; Walton et al., 2021). The interbedded acoustic reflections making up most of the strata are most likely a function of imaging sediment layers with contrasting acoustic impedances such as couplets of sand and mud. These reflections are a most likely a combination of channel levee and overbank deposits. Sediment cores taken from this unit are composed of interbedded fine-grained sand and mud (Figure 3D; section 4.3). The observation that these facies tend to thin away from the channel suggests these are levee and overbank deposits derived from overspilt or unconfined turbidity currents moving down the San Simeon Channel. Discontinuous strata near the channel axis are most likely coarser-grained channel fill facies derived from the densest parts of turbidity currents flowing through the San Simeon Channel. This observation comports with the discovery of coarse-grained shell hash from sediment cores sampling the channel thalweg (Figure 3C; section 4.3). Location of channel fill facies appears to have migrated away from the inner bends of meanders, causing an increase in channel sinuosity over time (Figures 3A, B). This is also indicated by the presence of truncated levee strata at the outer bends of channel meanders (Figures 3A–D) and aggradational levee facies on the inner bends (Figures 3C, D). These observations combined suggest that channel movement was accommodated via deposition on the inner bends and erosion on the outer bends.
The presence of deformed levee and overbank deposits and a zone of truncated strata at the R1-T2 slope suggests that some amount of structural deformation has occurred in this location. Back tilting and onlapping of R2 strata onto the R1-T2 slope and the difference in height of R2 relative to the crest height of R1 suggest that normal fault movement may be responsible for the current trough-and-ridge bathymetry (Figures 3C–F). Truncation of levee strata making up an inner bend of a meander in the deeper portion of the San Simeon Channel survey may be a channel cut that was later infilled with flat-lying levee deposits (Figures 3E, F). Alternatively, this feature could be a surface where channel-wall failure occurred. For a more detailed discussion as to the possible origin of these features, please refer to the supplemental text.
4.3 Sedimentology and radiocarbon age results
Sediment cores collected throughout the San Simeon Channel survey reveal that the continuous, interbedded acoustic reflections captured from chirp profiles are associated with interbedded fine-grained sand beds and muds while transparent reflections draping the upper portion of the surface are made up of muds. Piston core 14JPC penetrated ~4.5 m of sediment within the axis of the channel (Figure 3C). Three prominent sand beds were identified in this core, ranging from 10–23 cm in thickness (Figure 4). These sands are defined by sharp basal contacts that fine-upward, which are characteristic of turbidite sequences (Bouma, 1962). The lowermost sand bed is interbedded with fine-grained sand and medium to coarse-grained shell hash material. Occasional mud-filled burrows and mottled textures found within these units suggest that these beds were moderately bioturbated (Figure 4). A calibrated radiocarbon age of 5.72 Ka below the first sand bed provides a Holocene maximum depositional age for this event. The two other sand beds are bracketed by Pleistocene radiocarbon ages at 19.1 and 33.5 Ka, respectively.
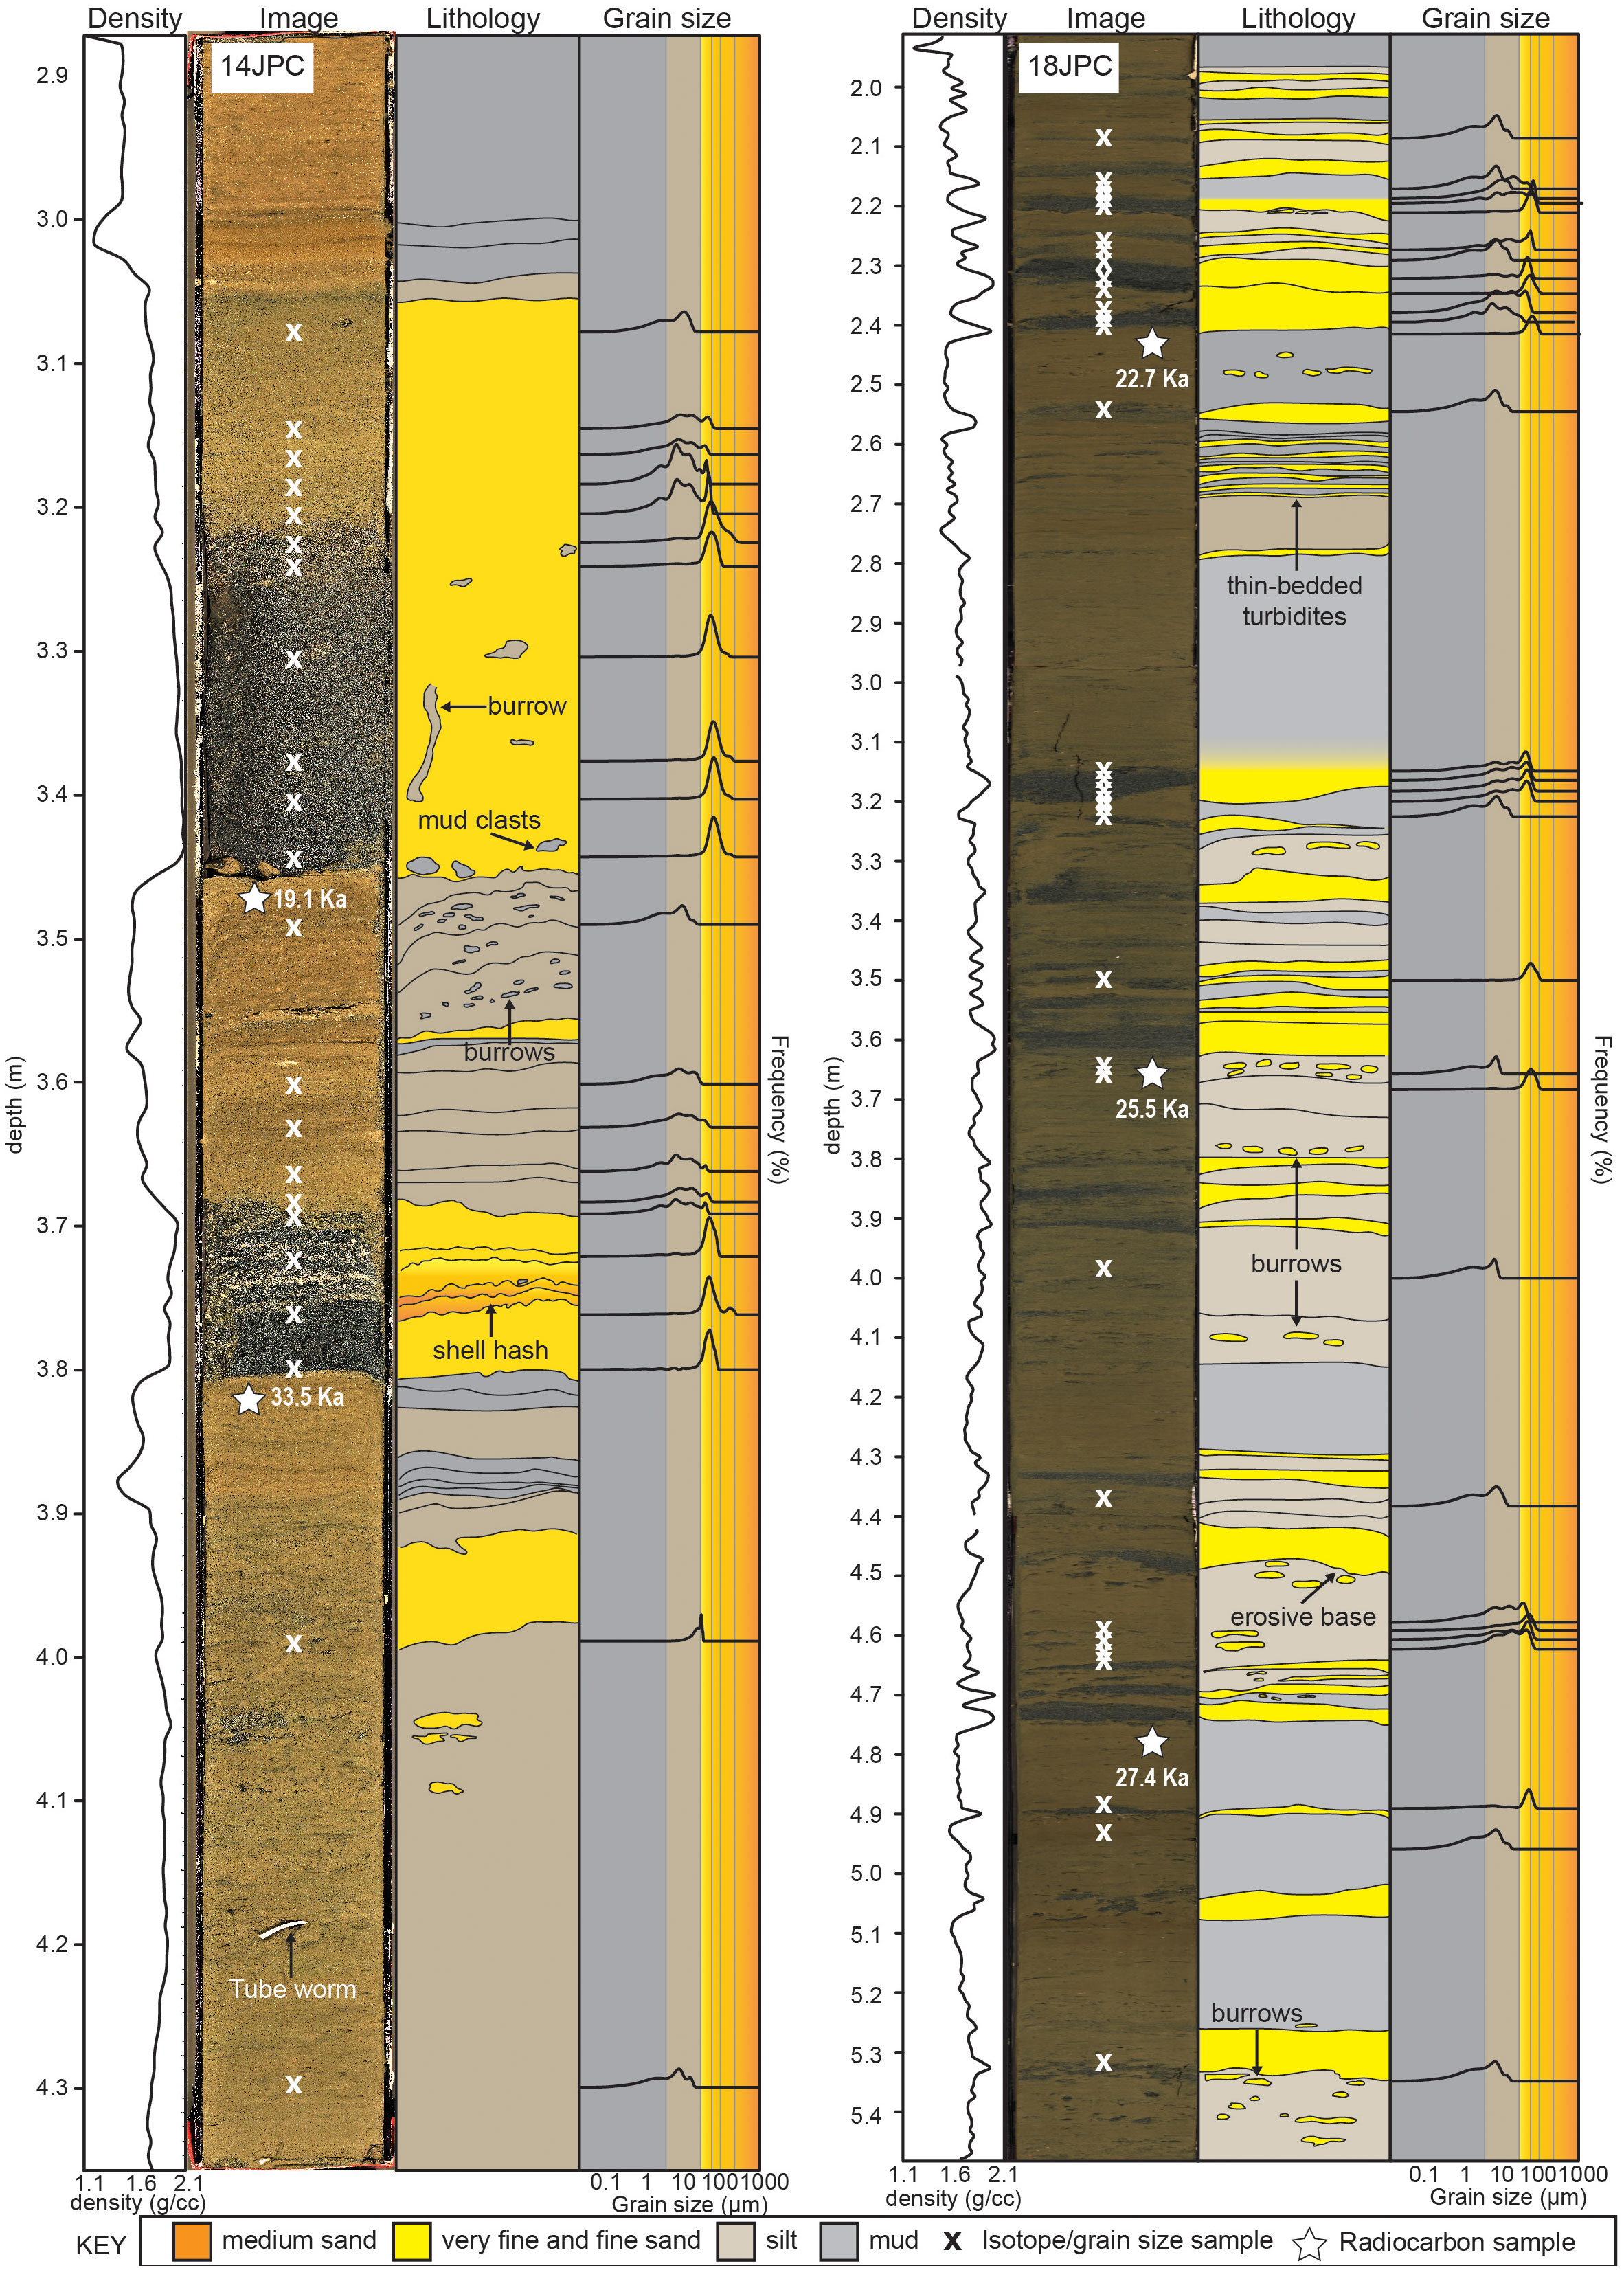
Figure 4 Density logs, photographs, descriptions, and grain size frequency plots of jumbo-piston cores 14JPC and 18JPC. Xs mark the sample location for both grain size and isotopic analyses. Stars mark radiocarbon sample locations. Note these are selected portions of the cores, not the entire cores. The apparent variation in core color between 14JPC and 18JPC is a function of camera settings when photographs were collected and not indicative of difference between material.
Both a vibracore transect and two piston cores were taken outside of the channel to characterize the sedimentology of the ridges and troughs (Figures 2A, 4). Piston core 18JPC penetrated ~7 m of sediment at the bathymetric high of the trough-and-ridge bathymetry (Figures 2A, 3D, 4). This core contained at least 42 individually identified sand beds ranging from <1 to 10 cm in thickness. Many of these beds have sharp boundaries into underlying muddy units. Sand beds and overlying muds commonly have mottled textures suggestive of extensive mixing from bioturbation. We interpret these sand beds to be of sediment gravity flow in origin due to their sharp bases and grain size. Six calibrated radiocarbon ages sampled underneath sand beds constrain the timing of events to the Pleistocene (13.8–37.5 Ka). Vibracores collected down a transect of the exposed strata on the R1-T2 slope reveal that, similarly to 18JPC, these sediments are made up of interbedded muds and fine-grained turbidites (Figure 5). The calibrated radiocarbon ages of samples from underneath sand beds become progressively older down-dip of the exposed strata, which range from 18.8 Ka at the crest of R1 to >50 Ka midway down the R1-T2 slope (Figure 5). Piston core 17JPC penetrated ~7 m of subsurface stratigraphy near the northern edge of the survey. This core is made up entirely of mud and clay, with no obvious signs of sedimentation styles other than hemipelagic deposition. This observation is consistent with the chirp profiles, which identified the drape dominant layer as being up to 9 m thick in this region. Three calibrated radiocarbon ages sampled at 0.36 m, 3.5 m, and 7.0 m yield ages of 1.02 Ka, 12.9 Ka, and 21.9 Ka, respectively.
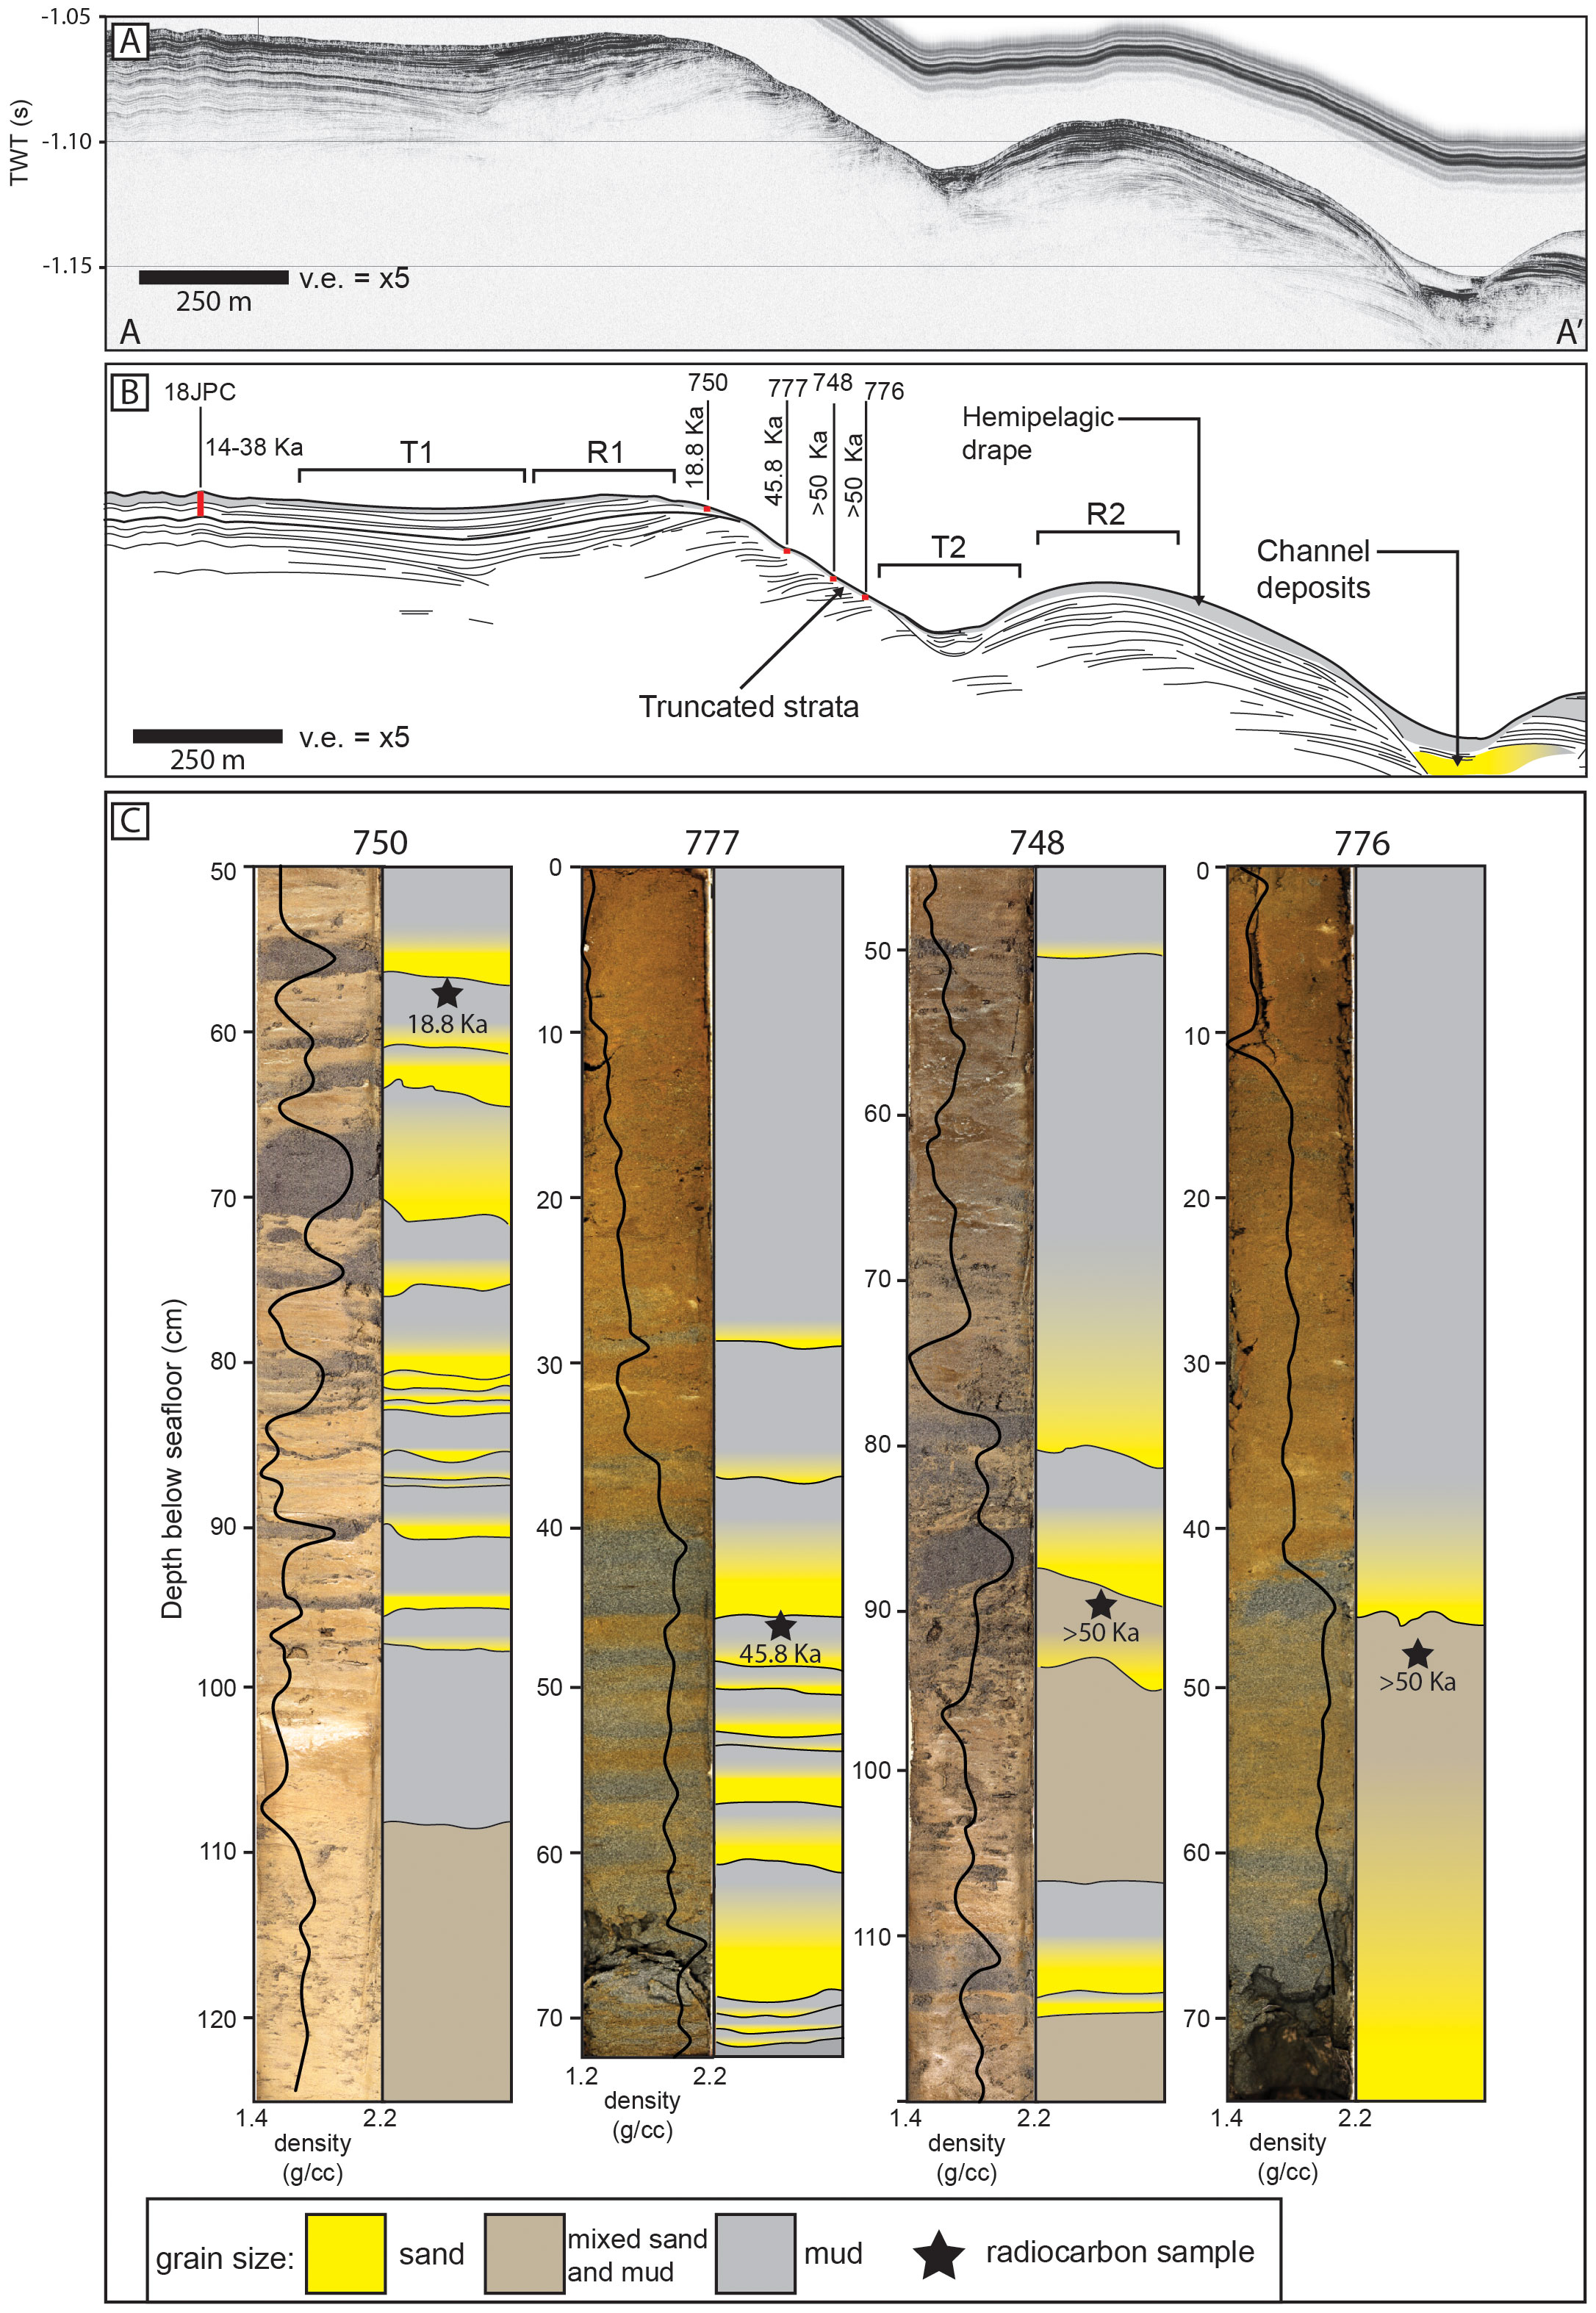
Figure 5 (A) Chirp profile perpendicular to approximate strike of the troughs and ridges (vertical exaggeration = x5). Location shown in Figure 2A (A-A’). (B) Annotated interpretation of subsurface acoustic reflections from above chirp profile with locations of vibracores (750, 777, 748, 776) and jumbo-piston core 18JPC. Locations of cores and approximate penetration depths are noted by the red rectangles. Note the zone of truncation at the R1-T2 slope that exposes Pleistocene-aged turbidites. (C) Images, density logs, and grain size interpretation of vibracores exposed along a R1-T2 surface shown in (A, B) Note the high amount of sand beds in all cores. T1, Trough 1; R1, Ridge 1; T2, Trough 2; R2, Ridge 2.
To provide an approximate sedimentation rate for each core, we used a linear regression of depth versus age for each sediment core with ≥2 radiocarbon samples. Modeled ages were extrapolated from the regression to assign age estimations of sediment intervals in the cores. The radiocarbon results from both sand-rich and mud-rich cores from the San Simeon piston and gravity cores yield an average sedimentation rate of 19 cm/ky, which is similar to the results from other samples taken from the Morro Bay slope (18 cm/ky; Figure 6; Coholich et al., 2022; Lundsten et al., 2022). Within uncertainty, there is no observed variation in sedimentation rates between sandy and muddy cores, and rates appear to be approximately linear.
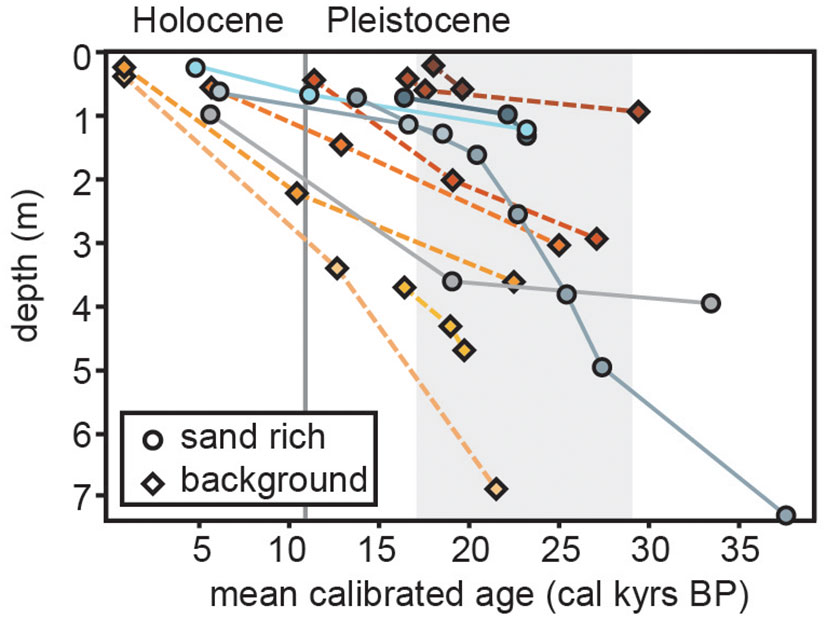
Figure 6 Plot of mean calibrated radiocarbon ages versus sample depth. A regression of all ages results in an average sedimentation rate of 19 cm/ky. Gray rectangle indicates approximate timing of the Last Glacial Maximum.
4.4 Stable isotope geochemistry
We report 129 analyses of bulk sediment samples for stable isotopic analysis of total organic carbon (TOC), δ15Norganic, δ13Corganic, C:N values, and bulk carbonate values of δ13Ccarbonate and δ18Ocarbonate from piston and gravity cores 14JPC, 15GC, 16GC, 17JPC, and 18JPC. Mean weight percent organic carbon from all analyses is 1.6%. At each site TOC values decrease with depth. Isotopic δ15Norganic values range from 3.51–8.56‰, with an average value of 6.09‰. In addition, δ15Norganic values tend to decrease down core. Analyses of δ13Corganic range from -23.46 to -21.69‰ with an average of -22.45‰. On balance, δ13Corganic values become more negative down core. Ratios of C:N range between 8.37–23.02 with a mean value of 11.20. Delta 13Ccarbonate and δ18Ocarbonate values range from -7.96‰ to -0.04‰ and -6.54‰ to 2.64‰, respectively. Values of δ13Ccarbonate tend to become less negative downcore while δ18Ocarbonate becomes more positive.
5 Discussion
5.1 Sand frequency variation between the Holocene and Pleistocene
Sand beds were counted in each core and assigned an age according to their modeled regression age and then plotted as a histogram and kernel density estimate function of sand bed occurrences from all the sediment cores with age data (Figure 7). We test the null hypothesis that the above sand occurrence distribution is not significantly different from a randomly distributed Poisson function. A χ2 test statistic measuring the difference between a Poisson distribution centered at the mean of observed sand bed occurrences returns a p-value < 1 x 10-15. Thus, we can reject the null hypothesis that these data are not significantly different from each other.
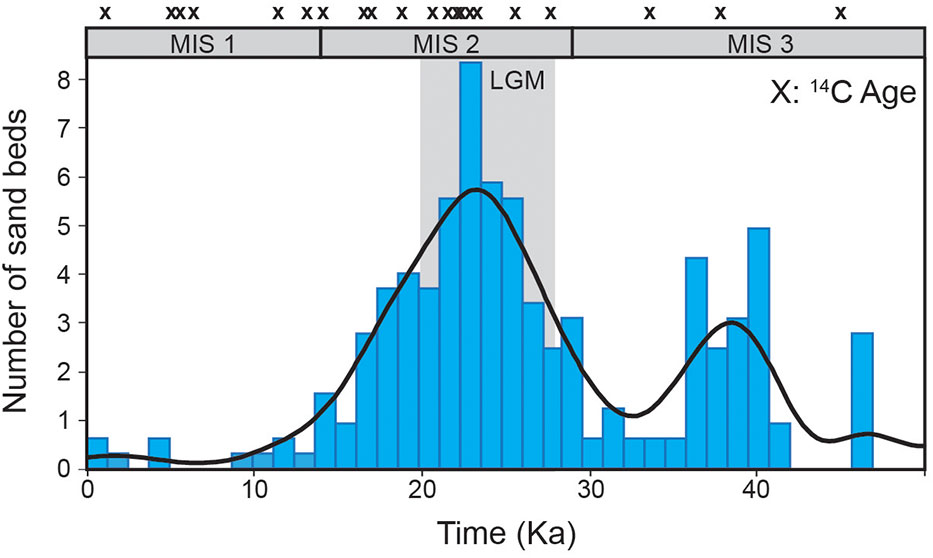
Figure 7 Kernel density estimate and histogram of sand occurrences over time from all sediment cores from the San Simeon Channel. Xs mark locations of radiocarbon ages used to calibrate the age regression for the sand beds. Note the increase in sand occurrences centered around the Last Glacial Maximum (gray rectangle; LGM). MIS 1–3, Marine Isotope Stages 1–3.
The peak of these data is centered at approximately 23 Ka, with ~70% of all sand intervals between 18–25 Ka. This corresponds with the most recent sea-level lowstand, the Last Glacial Maximum. Widely used sequence-stratigraphic models (e.g., Vail et al., 1977) suggest that submarine canyon and fan deposition will occur in its greatest amounts during sea-level lowstands, when continental shelves are subaerially exposed and fluvial systems are able to connect directly with submarine canyons at the shelf edge. Several exceptions, however, have been noted wherein submarine canyon and fan systems are able to continue to deposit material during the most recent highstand (e.g., La Jolla Fan, southern offshore California; Covault et al., 2007; Normark et al., 2009; Sharman et al., 2021). This depends on several factors, including the width of the continental shelf, canyon-head intersection with littoral current cells, and/or the amount of sediment flux from fluvial sources for canyon systems to persist throughout sea-level highstands. The shelf edge distance from shore is relatively far at approximately 8 km from the head of the San Simeon Channel (Figure 1). Moreover, likely fluvial sources for the San Simeon Channel are small coastal catchments a part of the Santa Lucia Range, which do not include sources from large, regional rivers. Combined, this suggests that the limiting factor to channel activity at the San Simeon Channel is access to a terrestrial source. Given that the shelf only begins to widen a short distance (~30 km) north of the San Simeon Channel, it is unlikely that south-directed littoral cells are robust enough to move sufficient quantities of sediment to maintain Holocene channel activity that is noted in other channel systems (e.g., Delgada Canyon; Smith et al., 2018). Canyon-fan systems within the Southern California Borderland of similar source catchment size and shelf-edge width have been shown to be most sensitive to fluvial connectivity in order to maintain channel activity (Carlsbad and Oceanside Fans; Sharman et al., 2021). Thus, we suggest that enhanced sand bed frequency during the latest lowstand in the San Simeon Channel is evidence for a sea-level control on sediment gravity flow rates in this region (Figure 8).
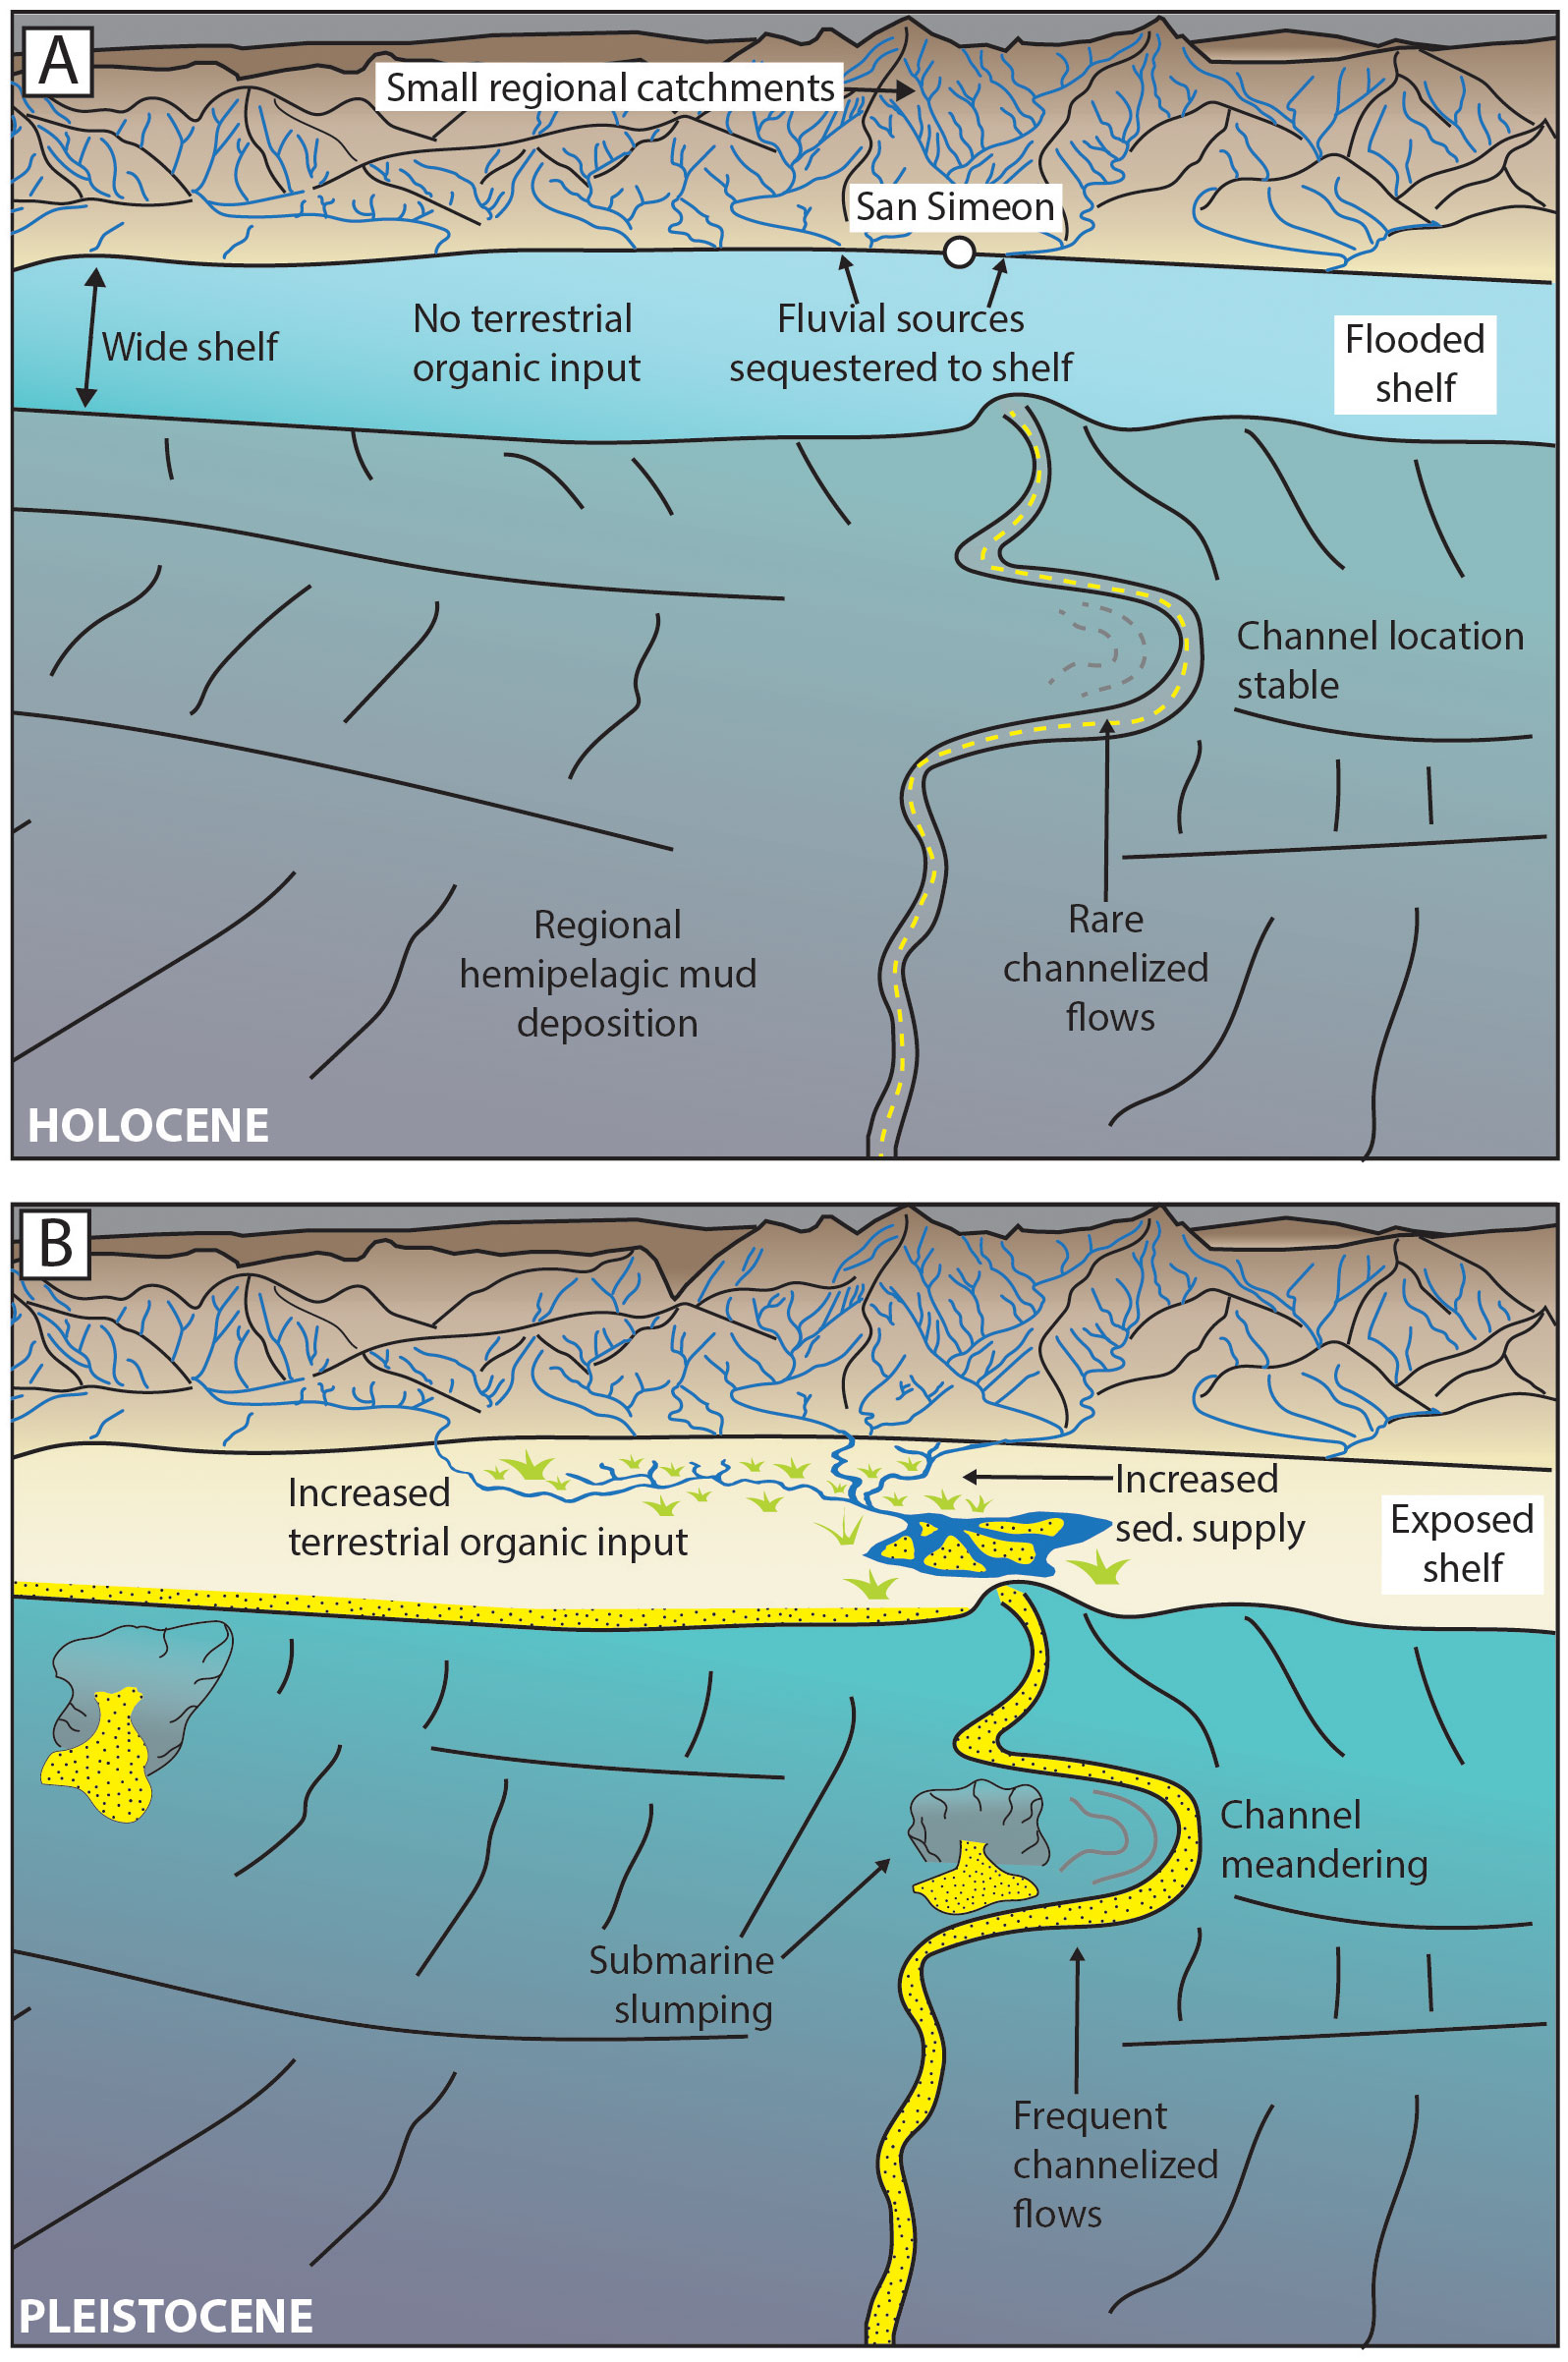
Figure 8 Schematic depiction of variation in Morro Bay continental slope sedimentation dynamics between the Pleistocene and Holocene. (A) Holocene style sedimentation. Sea-level transgression flooded the continental shelf, preventing deposition onto the slope. A regional hemipelagic drape of mud covered the slope. (B) Pleistocene style sedimentation. Lowered sea levels exposed the continental shelf, allowing for fluvial systems to propagate to the shelf edge. Higher rates of sedimentation led to more active channel activity.
This observed correlation relies on the assumption that our age model accurately reflects the true age distribution of the turbidites. By sampling hemipelagic muds directly below turbidite beds, we have opted to measure a maximum depositional age for the above deposits. However, it is difficult to omit the possibility of varying amounts of erosion of hemipelagic materials by the overlying flows, which can yield artificially older ages (Urlaub et al., 2013). We address this potential complication by plotting our stable isotopic data from hemipelagic samples versus regressed age and comparing their results to local and global isotopic trends (Figure 9). These data are from piston and gravity cores taken from the study area, as well as an additional piston core from the Sur Pockmark Field (Figures 1, 2). In these data we see a consistent shift in δ13Ccarbonate and δ18Ocarbonate commonly associated with the boundary between marine isotope stages 1 and 2 at the termination of the Last Glacial Maximum and the start of sea-level transgression (e.g., Shakun et al., 2015). This same trend is observed in late Pleistocene benthic oxygen and carbon isotopic records offshore central and southern California at ODP sites 1011, 1012, and 1018 (Andreasen et al., 2000). Weight percent of total organic carbon (TOC) also predictably increases ~1% C by weight at the regressed age boundary between MIS 1–2, which is commonly cited as an effect of increased marine derived organics following sea-level rise at the start of the Holocene. The shift to more positive δ13Corganic and δ15Norganic values and a lower mean C:N ratio in younger sediments is indicative of increased sourcing from marine organic matter as the continental shelves became inundated during the Holocene transgression (Meyers, 1994). We argue, given our regressed age data appear to match the global paleoenvironmental isotopic trends observed at the Pleistocene–Holocene boundary, that our radiocarbon age data from several sediment cores across Morro Bay can be regressed into a reasonably sound age model. These observations also bolster the hypothesis that the head of the San Simeon Channel had been sequestered to the flooded continental shelf edge by the early Holocene, which lowered the rate of sediment gravity flow occurrence through the system.
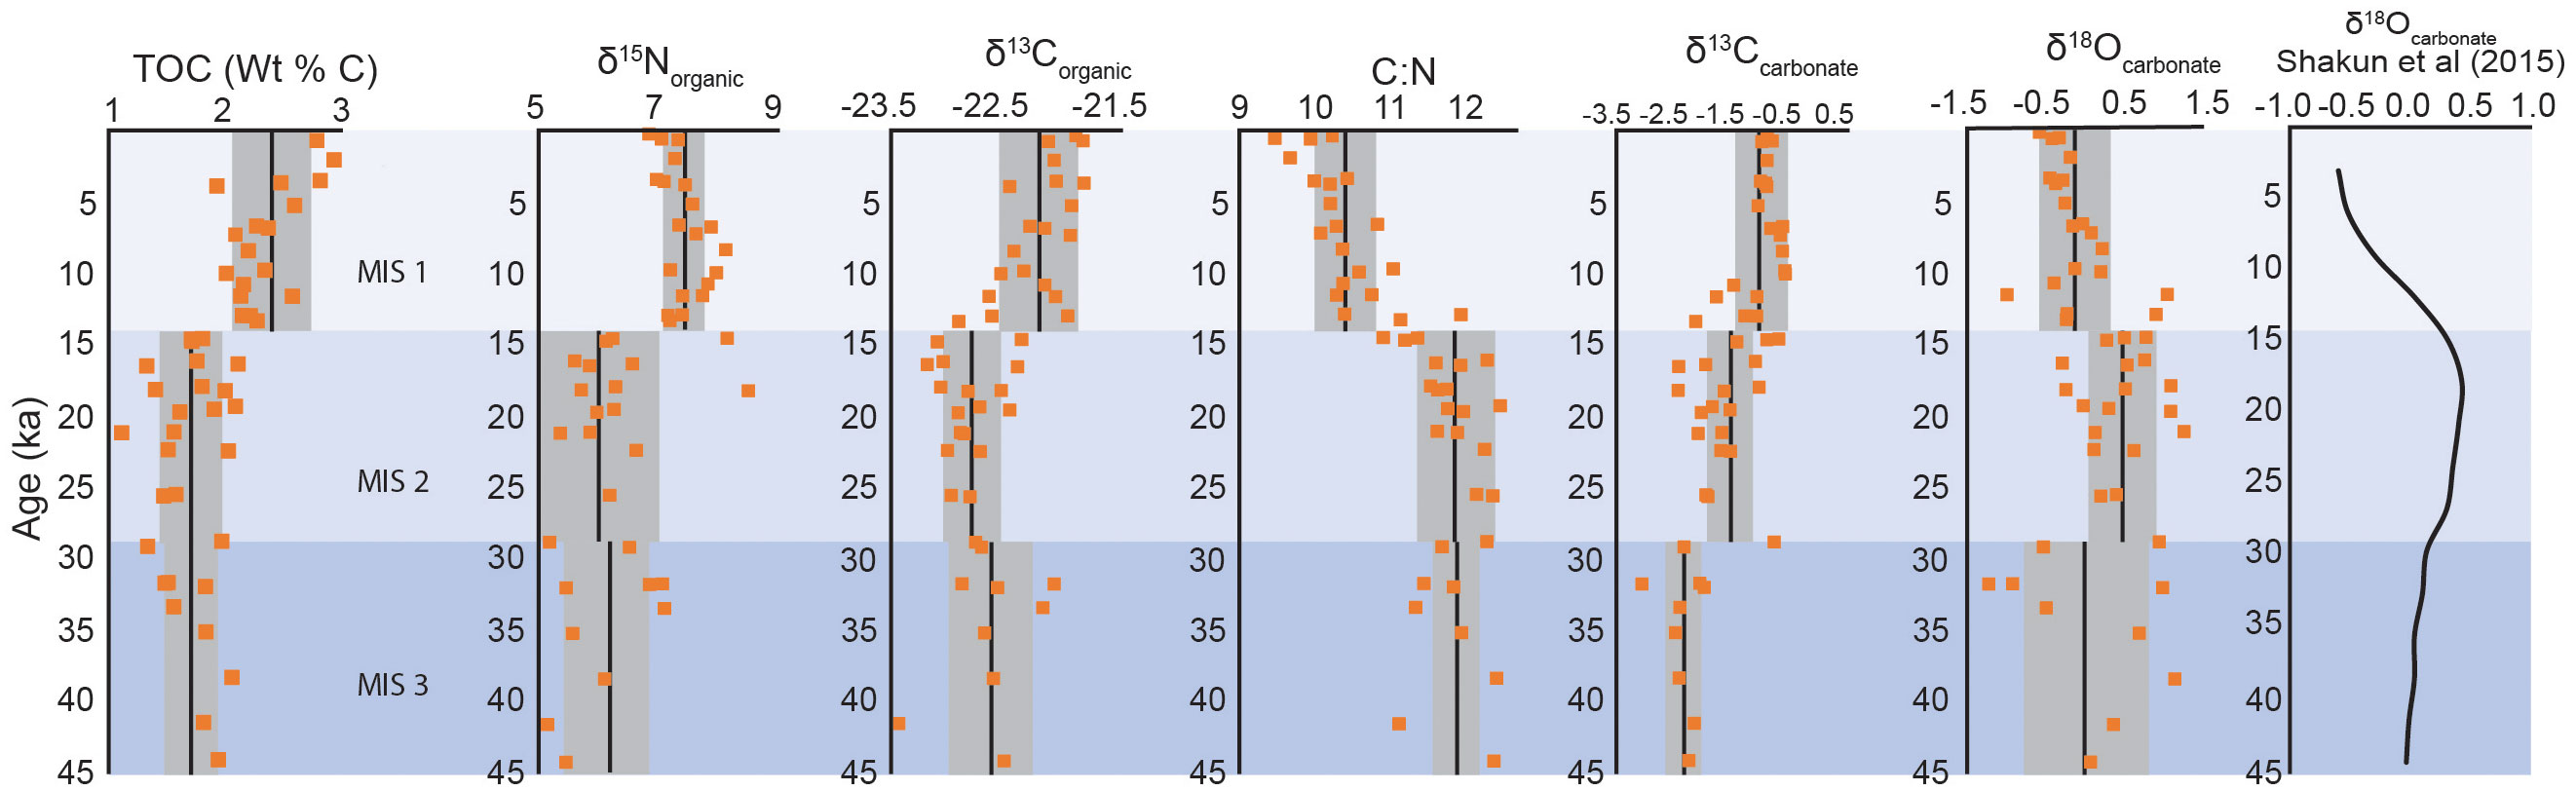
Figure 9 Isotopic data of all planktonic foraminifera measured in this study plotted versus regressed radiocarbon ages. Varying hues of blue divide the Marine Isotope Stages 1–3 (MIS 1–3). Averages (black centerlines) and ±1 standard deviation (gray rectangles) are presented for each isotopic stage. Note that the ~1‰ negative shift in δ18Ocarbonate corresponds to globally calibrated records of temperature-corrected planktonic isotope curves generated by others (e.g., Shakun et al., 2015).
Large (M ≥ 7) earthquakes may lead to destabilization of the continental slope and subsequent coeval turbidity currents (Goldfinger et al., 2012). The San Simeon Channel heads near San Gregorio-Hosgri Fault, which has an estimated generative potential of a M7.8 earthquake (Wells and Coppersmith, 1994). Recent geophysical efforts by Walton et al. (2021) offshore Morro Bay found no evidence of Quaternary slip along the Santa Lucia Bank Fault. However, the presence of turbidites captured from sediment cores down slope the eastern flank of the of Santa Lucia Bank (Figure 1)—a zone without a direct connection to submarine channels—suggests that shaking via the proximal Quaternary fault systems such as the San Andreas or San Gregorio-Hosgri Faults could have acted as a trigger for mass sediment transport in the region (Walton et al., 2021). Yet, radiocarbon dating of turbidites in the region presented herein did not identify any modern deposits that align with known local and historical earthquakes, such as the 1927 Lompoc, Calif, M7.0 or 1952 Piedras Blancas M6.2 earthquakes (Mueller, 2018). Thus, the lack of correlation between dated turbidites and historical earthquakes precludes any discussion regarding a paleoseismic control on turbidite distributions. Such a hypothesis awaits a broader study that incorporates regional age data from multiple channels on the Morro Bay slope in order to be tested.
5.2 Turbidity current geohazard potential offshore Morro Bay
Sediment gravity flow event frequency has diminished greatly since the Pleistocene. During the Holocene, channelized flows are rare and confined to the San Simeon and Lucia Chica Channels. The predominant sedimentation style during the Holocene is hemipelagic fallout of mud. Thus, the history of the Morro Bay continental slope during the Holocene, away from any submarine channels, has been mostly quiescent. However, a small portion of the proposed wind farm leasing blocks does intersect the San Simeon Channel (Figure 1), which has experienced Holocene flow events.
6 Conclusions
We use an integrated dataset of multibeam bathymetry, sediment cores, radiocarbon samples, and isotopic data to assess how sediment has been mobilized across the Morro Bay continental slope from the latest Pleistocene to present. We note that sand bed distributions counted from sediment cores from the San Simeon Channel cluster around the Last Glacial Maximum. We argue the most likely control for this turbidite clustering is lowstand sea-level during the Last Glacial Maximum. Lowered sea-levels exposed the continental shelf, incentivizing fluvial incisement of the shelf and propagation of shelf-edge deltas. The change in sedimentation style between the Holocene and Pleistocene suggests that modern sediment gravity flow events are rare and restricted to channels.
Data availability statement
The original contributions presented in the study are included in the article/Supplementary Material, further inquiries can be directed to the corresponding author/s.
Author contributions
CP and SG were the primary advisors of the project and were involved in all portions of the manuscript. TM and MC were involved in the sediment core analysis and seismic data interpretation. MM was involved in radiocarbon analysis and sediment core processing. NN and MW were involved in sediment core analysis. MW was also involved in the seismic data interpretation. RG and EL were involved in sediment core processing and data reduction for stable isotopic analyses. EL also produced figure 1 and was integral to data management for the entire project. DC was the primary scientist and engineer responsible for acquiring AUV bathymetry data. All authors contributed to the article and approved the submitted version.
Funding
Support for this work was provided by the David and Lucile Packard Foundation and the Stanford Project on Deep-water Depositional Systems.
Acknowledgments
Thanks to Dave Mucciarone for stable isotopic analyses, the R/Vs Western Flyer, Bold Horizon, Rachel Carson, and the NOAA ship Rainer crews, ROV pilots, and AUV operators. Additional thanks to Don Lowe for his assistance with sediment core interpretation. The US Bureau of Ocean Energy Management in part funded the acquisition of sediment cores for this project. Three reviews and three USGS internal reviews improved the quality and clarity of the manuscript. Any use of trade, firm, or product names is for descriptive purposes only and does not imply endorsement by the U.S. Government.
Conflict of interest
The reviewer [CG] declared a past co-authorship with the author [MW] to the handling Editor.
Publisher’s note
All claims expressed in this article are solely those of the authors and do not necessarily represent those of their affiliated organizations, or those of the publisher, the editors and the reviewers. Any product that may be evaluated in this article, or claim that may be made by its manufacturer, is not guaranteed or endorsed by the publisher.
Supplementary material
The Supplementary Material for this article can be found online at: https://www.frontiersin.org/articles/10.3389/fmars.2023.1099472/full#supplementary-material
Supplementary Figure 1 | (A) Annotated perspective view looking northwest at submarine slump scarp and deposit. Vertical exaggeration = x5. (B) Subsurface chirp line Z-Z’ imaging the slip surface and folded allochthonous mass. The presence of a minor depression above the primary slip surface may be evidence of a secondary retrogressive failure surface. (C) Enhanced view of inset rectangle in B. Note the contact between the slip surface and slump, which shows potential drag folds.
References
Andreasen D. H., Flower M., Harvey M., Chang S., Ravelo A. C. (2000). ““Data report: late pleistocene oxygen and carbon isotopic records from sites 1011, 1012, and 1018”,” in Proceedings of the ocean drilling program. Eds. Lyle M., Koizumi I., Richter C., Moore T. C. Jr (College Station, TX: Ocean Drilling Program), 141–144. doi: 10.2973/odp.proc.sr.167.225.2000
Beckman Coulter Inc (2003). LS 13 230 particle size analyzer manual PN 7222061A (Miami, Florida: Particle Characterization Group).
Bouma A. H. (1962). “Sedimentology of some flysch deposits,” in A graphic approach to facies interpretation (Amsterdam: Elsevier), 168 p.
Bureau of Ocean Energy Management (BOEM). (2018). Commercial leasing for wind power development on the outer continental shelf (OCS) offshore California (Call for information and nominations) in federal register 83:203 (October 19, 2018) p. 53096 (Camarillo, California: Bureau of Ocean Energy Management. OCS Study BOEM 2021-044), 56 p.
Caress D. W., Thomas H., Kirkwood W. J., McEwen R., Henthorn R., Clague D. A., et al. (2008). “High-resolution multibeam, sidescan, and subbottom surveys using the MBARI AUV”, in Marine habitat mapping technology for Alaska. Eds. Reynolds J. R., Greene H. G. (Fairbanks, AK: Alaska Sea Grant for North Pacific Research Board), 47–69. doi: 10.4027/mhmta.2008.04
Cochrane G. R., Kuhnz L. A., Dartnell P., Gilbane L., Walton M. A. (2022b). Multibeam echosounder, video observation, and derived benthic habitat data offshore of south-central California in support of the bureau of ocean energy management Cal DIG I, offshore alternative energy project (Santa Cruz, CA: U.S. Geological Survey data release). doi: 10.5066/P9QQZ27U
Cochrane G. R., Kuhnz L. A., Gilbane ,. L., Dartnell P., Walton M. A. L., Paull C. K. (2022a). California Deepwater investigations and groundtruthing (Cal DIG) I, volume 3–benthic habitat characterization offshore morro bay, California: U.S. geological survey open-file report 2022–1035 (Reston, VA: Bureau of Ocean Energy Management OCS Study BOEM 2021–045), 18 p. doi: 10.3133/ofr20221035
Coholich M. M., Paull C. K., Walton M. A., Caress D., McGann M., Lundsten E. M., et al. (2022). Mechanisms of sand deposition within the Lucia chica submarinechannel system, offshore California, U.S.A. SEPM virtual bouma conference. (Bouma Deep Water Geoscience Conference: Society of Sedimentary Geology).
Coplen T. B., Brand W. A., Gehre M., Groning M., Meijer H. A. J., Toman B., et al. (2006). New guidelines for delta c-13 measurements. Anal Chem. 78 (7), 2439–2441. doi: 10.1021/ac052027c
Covault J. A., Normark W. R., Romans B. W., Graham S. A. (2007). Highstand fans in the California borderland: The overlooked deep-water depositional systems. Geology 35 (9), 783–786. doi: 10.1130/G23800A.1
Dickinson W. R., Ducea M. N., Rosenberg L. I., Greene F. G., Graham S. A., Clark J. C., et al. (2005). Net dextral slip, neogene San Gregorio-hosgri fault zone, coastal California: Geologic evidence and tectonic implications. Geol Soc. America Special Paper 391, 43. doi: 10.1130/SPE391
Dobbs S. C., Addison J. A., Cochrane G. R., Gwiazda R., Lorenson T. R., Lundsten E. M., et al. (2020). Submarine waveform field records enhanced frequency of sediment transport event during the pleistocene, offshore morro bay, California. Am. Geophys Union. AGU Fall Meeting Abstracts, EP065-11.
Dobbs S. C., Addison J. A., Coholich M. M., Gwiazda R., Lundsten E. M., McGann M., et al. (2021). Increased frequency of out-of-channel sediment gravity flows are coincident with late pleistocene falling sea-level offshore morro bay, California. Int. network submarine canyon Invest. Sci. exchange Conf. 5, 11.
Goldfinger C., Nelson C. H., Morey A. E., Johnson J. R., Patton J., Karabanov E., et al. (2012). Turbidite event history–methods and implications for Holocene paleoseismicity of the cascadia subduction zone (Reston, VA: U.S. Geological Survey Professional Paper 1661–F), 170 p.
Graham S. G., Dickinson W. R. (1978). Evidence for 115 kilometers of right slip on the San Gregorio-hosgri fault trend. Science 199 (4325), 179–181. doi: 10.1126/science.199.4325.179
Heaton T. J., Kohler P., Butzin M., Bard E., Reimer R. W., Austin W. E. N., et al. (2020). Marine20 – the marine radiocarbon age calibration curve (0–55,000 ca BP). Radiocarbon 62(4), 779–820. doi: 10.1017/RDC.2020.68
Hoskins E. G., Griffiths J. R. (1971). Hydrocarbon potential of northern and central California offshore. Am. Assoc. Petroleum Geologists Memoir 15, 212–228. doi: 10.1306/M15370C16
Irwin W. P., Dennis M. D. (1979). “Geologic structure section across southern klamath mountains, coast ranges and seaward from point delgada, California,” in Geological society of America map and chart series MC-28D, scale 1:250,000. (Boulder, Colo: Geological Society of America).
Johnson S. Y., Watt J. T., Hartwell S. R., Kluesner J. W. (2018). Neotectonics of the big sur bend, San Gregorio-hosgri fault system, central California. Tectonics 37, 1930–1954. doi: 10.1029/2017TC004724
Kennedy D. J., Walton M. A. L., Cochrane G. R., Paull C. K., Caress D. W., Anderson K., et al. (2021). “Donated AUV bathymetry and chirp data collected during Monterey bay aquarium research institute cruises in 2018-2019 offshore of south-central California,” in U.S. geological survey data release. (Santa Cruz, CA: US Geological Survey). doi: 10.5066/P97QM7NF
Kienast S. S., McKay J. L. (2001). Sea Surface temperatures in the subarctic northeast pacific reflect millennial-scale climate oscillations during the last 16 kyrs. Geophys Res. Lett. 28, 1563–1566. doi: 10.1029/2000GL012543
Kuhnz L. A., Gilbane L., Cochrane G. R., Paull C. K. (2021). California Deepwater investigations and groundtruthing (Cal DIG) I, volume 1–biological site characterization offshore morro bay, camarillo (CA): Bureau of ocean energy management outer continental shelf (OCS) study BOEM 2021–037. (Santa Cruz, CA: US Geological Survey), 67 p.
Kuhnz L. A., Gilbane L., Cochrane G. R., Paull C. K. (2022). Multi-factor biotopes as a method for detailed site characterization in diverse benthic megafaunal communities and habitats in deep-water off Morro Bay, California. Deep Sea Research Part I: Oceanographic Research Papers 190, 103872. doi: 10.1016/j.dsr.2022.103872.
Lundsten E., Paull C. K., Caress D. W., Gwiazda R., Kuhnz L., Walton M., et al. (2022). One of north america’s largest pockmark fields offshore big sur, California is maintained over time by intermittent, non-channelized gravity flow events. Particulate Gravity Currents Environ. conference.
Maier K. L., Fildani A., McHargue T. R., Paull C. K., Graham S. A., Caress D. W. (2012). Punctuated deep-water channel migration: High-resolution subsurface data from the Lucia chica channel system, offshore California, U.S.A. J. Sedimentary Res. 82 (1), 1–8. doi: 10.2110/jsr.2012.10
Maier K. L., Fildani A., Paull C. K., Graham S. A., McHargue T. R., Caress D. W., et al. (2011). The elusive character of discontinuous deep-water channels: New insights from Lucia chica channel system, offshore California. Geology 39 (4), 327–330. doi: 10.1130/G31589.1
Maier K. L., Fildani A., Paull C. K., McHargue T. R., Graham S. A., Caress D. W. (2013). Deep-sea channel evolution and stratigraphic architecture from inception to abandonment from high-resolution autonomous underwater vehicle surveys offshore central California. Sedimentology 60 (4), 935–960. doi: 10.1111/j.1365-3091.2012.01371
McCulloch D. S. (1987). ““Regional geology and hydrocarbon potential of offshore central california”,” in Geology and resource potential of the continental margin of Western north America and adjacent oceans Beaufort Sea to Baja California: Houston, Texas, vol. 6 . Eds. Grantz A., Vedder J. G. (Washington, DC (United States: Circum-Pacific Council for Energy and Mineral Resources), 353–401.
McCulloch D. S. (1989). ““Evolution of the offshore central California margin”,” in The Eastern pacific ocean and Hawaii. Eds. Winterer E. L., Hussong D. M., Decker R. W. (Boulder, CO: Geological Society of America), 439–470. doi: 10.1130/DNAG-GNA-N.439
McGann M., Paull C. K., Lundsten E. M., Gwiazda R., Walton M. A. L., Nieminski N. M., et al. (2023). Radiocarbon age dating of biological material from cores collected off morro bay (California. U.S: Geological Survey data release). doi: 10.5066/P9FWTKZQ
Meyers P. A. (1994). Preservation of elemental and isotopic source identification of sedimentary organic matter. Chem. Geology 144, 289–302. doi: 10.1016/0009-2541(94)90059-0
Mueller C. S. (2018). Earthquake catalogs for the USGS national seismic hazard maps. Seismol. Res. Lett. 90(1), 251–261. doi: 10.1785/0220170108.
Normark W. R., Piper D. J. W., Romans B. W., Covault J. A., Dartnell P., Sliter R. W. (2009). ““Submarine canyon and fan systems of the California continental borderland”,” in Earth science in the urban ocean: The southern California continental borderland, vol. 454 . Eds. Lee H. J., Normark W. R. (Boulder, CO: Geological Society of America), 141–168. doi: 10.1130/2009.2454(2.7
Page B. M., Wagner H. C., McCulloch D. S., Silver E. A., Spotts J. H. (1979). Geologic cross section of the continental margin off San Luis obispo, and southern coast ranges, and the San Joaquin valley, California. Geol Soc. America Map Chart Ser. MC-28G. 12 p., 1 map, scale 1:250,000.
Paull C. K., Ussler I. I. I. W., Maher N., Greene H. G., Rehder G., Lorenson T., et al. (2002). Pockmarks off big sur, California. Mar. Geology 181 (4), 323–335. doi: 10.1016/S0025-3227(01)00247-X
Ross D. C., McCulloch D. S. (1979). Cross section of the southern coast ranges and San Joaquin valley from offshore point sur to madera, California. Geol Soc. America Map Chart Ser. MC 28-B, 4 p.
Saleeby J. B. (1986). C-2 central California offshore to Colorado plateau. Geol Soc. America. Centennial Continent/Ocean Transect 10, 2 sheets with text, scale 1:500,000. C-2, p. 1–63. doi: 10.1130/DNAG-COT-C-2
Shakun J. D., Lea D. W., Lisiecki L. E., Raymo M. E. (2015). An 800-kyr record of global surface ocean δ18O and implications for ice volume-temperature coupling. Earth Planetary Sci. Lett. 426, 58–68. doi: 10.1016/j.epsl.2015.05.042
Sharman G. R., Covault J. A., Stockli D. F., Sickmann Z. T., Malkowski M. A., Johnstone S. A. (2021). Detrital signals of coastal erosion and fluvial sediment supply during glacio-eustatic sea-level rise, southern California, USA. Geology 49 (12), 1501–1505. doi: 10.1130/G49430.1
Smith M. E., Werner S. H., Buscombe D., Finnegan N. J., Sumner E. J., Mueller E. R. (2018). Seeking the shore: Evidence for active submarine canyon head incision due to coarse sediment supply and focusing of wave energy. Geophys Res. Lett. 45, 12,403–12,413. doi: 10.1029/2018GL080396
Stuvier M., Reimer P. J., Reimer R. W. (2022). CALIB radiocarbon calibration, CALIB rev. 8. Radiocarbon 35, 215–230.
Urlaub M., Talling P. J., Masson D. G. (2013). Timing and frequency of large submarine landslides: Implications for understanding triggers and future geohazard. Quaternary Sci. Rev. 72, 63–82. doi: 10.1016/j.quascirev.2013.04.020
Vail P. R., Mitchum R. M. Jr., Thompson S. III (1977). Seismic stratigraphy and global changes of Sea level, part 4: Global cycles of relative changes of Sea level,” in Seismic stratigraphy — applications to hydrocarbon exploration. Ed. Payton C. E.(Tulsa, OK: The American association of petroluem geologists.), 83–97. doi: 10.1306/M26490C6
Wagner H. C. (1974). Marine geology between cape San martin and pt. Sal, south-central California offshore. U.S. Geol Survey Open-File Rep. 74–252, 1–17. doi: 10.3133/ofr74252
Walton M. A. L., Paull C. K., Cochrane G., Addison J., Caress D., Gwiazda R., et al. (2021). California Deepwater investigations and groundtruthing (Cal DIG) I, volume 2: Fault and shallow geohazard analysis offshore morro bay (Camarillo (CA: U.S. Department of the Interior, Bureau of Ocean Energy Management. OCS Study BOEM 2021-044), 56 p.
Keywords: submarine channels, offshore California, sediment gravity flows, Last Glacial Maximum, marine geology
Citation: Dobbs SC, Paull CK, Lundsten EM, Gwiazda R, Caress DW, McGann M, Coholich MM, Walton MAL, Nieminski NM, McHargue T and Graham SA (2023) Sediment gravity flow frequency offshore central California diminished significantly following the Last Glacial Maximum. Front. Mar. Sci. 10:1099472. doi: 10.3389/fmars.2023.1099472
Received: 15 November 2022; Accepted: 06 February 2023;
Published: 16 February 2023.
Edited by:
Veerle Ann Ida Huvenne, University of Southampton, United KingdomReviewed by:
Xiwu Luan, Qingdao National Laboratory for Marine Science and Technology, ChinaChris Goldfinger, Oregon State University, United States
Elda Miramontes, University of Bremen, Germany
Copyright © 2023 Dobbs, Paull, Lundsten, Gwiazda, Caress, McGann, Coholich, Walton, Nieminski, McHargue and Graham. This is an open-access article distributed under the terms of the Creative Commons Attribution License (CC BY). The use, distribution or reproduction in other forums is permitted, provided the original author(s) and the copyright owner(s) are credited and that the original publication in this journal is cited, in accordance with accepted academic practice. No use, distribution or reproduction is permitted which does not comply with these terms.
*Correspondence: Stephen C. Dobbs, c2Nkb2Jic0BzdGFuZm9yZC5lZHU=