 Karin Kvale
 Claire Hunt
 Aidan James3
 Wolfgang Koeve
- 1Environmental Processes and Modelling, GNS Science, Lower Hutt, New Zealand
- 2Biogeochemical Modelling, GEOMAR Helmholtz Centre for Ocean Research Kiel, Kiel, Germany
- 3Centre for Environmental Policy, Faculty of Natural Sciences, Imperial College London, London, United Kingdom
Microplastic is a ubiquitous marine pollutant whose small dimensions make it biologically available to phytoplankton and zooplankton. These organisms are crucial as the basis of the marine food web and for the export of organic material in the form of faecal pellets from the surface to deeper in the water column, forming a long-term carbon sink. Previous laboratory studies have demonstrated empirically that ingestion of low density microplastics reduces the sinking rates of zooplankton faecal pellets. This study uses a complex earth system model to analyse this effect and assess its wider impacts in a changing climate. Results show that the slowing of faecal pellet sinking stimulates changes to ecosystems regionally and reduces ocean carbon uptake by about 4.4 Pg C between the years 1950-2100, 0.24% of anthropogenic emissions over this time. However, perturbation of organic particle fluxes is significant, especially in gyres, and of the order of climate change impacts over the same time period. We calculate that plastics carbon has a 3 orders of magnitude greater impact on marine ecosystems than atmospheric carbon over our centennial timescale. Large uncertainties in model parameters and simplistic model structure suggest our results should be interpreted as motivation to further investigate parameter estimation, calcification responses to pollution, and the combined effects of multiple impact mechanisms on ecosystems.
1 Introduction
The current exponential growth in marine environmental plastic pollution is fuelling a consequent simultaneous increase in marine microplastic pollution. Microplastics are defined as small plastic pieces less than 5 mm in length (Law and Thompson, 2014) and may be either intentionally manufactured at these dimensions (for instance, plastic microbeads in personal care products) or result from the breakdown of larger plastic pieces (such as vehicle tyre shreds). Many of these microplastic particles are buoyant and accumulate at the sea surface resulting in an increasing microplastic inventory at shallow depths where phytoplankton and zooplankton proliferate (Richon et al., 2022). Three major biological removal pathways for microplastic from the surface ocean have been hypothesized: biofouling by bacteria and algae increasing the buoyancy of low-density microplastics, causing them to sink or oscillate in the upper ~ 80 meters (Kooi et al., 2016; Kooi et al., 2017), and incorporation of microplastics into sinking zooplankton faecal pellets and marine snow flocculates (Galloway et al., 2017).
Phytoplankton are primary producers, using available nutrients and light and forming the base of the marine food web (Litchman et al., 2015). Coccolithophores also produce calcite shells, and these calcifying phytoplankton not only contribute organic material but their calcification also helps to regulate surface ocean alkalinity, the buffer capacity of seawater and therefore air-sea CO2 exchange (Balch, 2018). Both are grazed by zooplankton, which egest faecal pellets that fall towards the ocean floor, removing particulate organic matter (POM) from the surface and aggregating with other particles to form marine snow (Alldredge, 1979; Alldredge and Silver, 1988). In this way carbon is exported from the ocean surface to deeper levels. In the water column a proportion of this POM is broken down by bacteria in a process called remineralisation, converting the organic carbon to dissolved inorganic carbon (DIC) and releasing nutrients such as phosphorous and nitrogen to be once more available to phytoplankton. However, zooplankton grazing on phytoplankton also graze on buoyant microplastic particles which can reduce the density of their faecal pellets, slowing their rate of descent (Cole et al., 2016; Wieczorek et al., 2019; Shore et al., 2021).
Laboratory studies have established the faecal pellet slowing effect for low-density microplastics and the literature has proposed that if occurring at sufficiently large scales, the efficiency of the biological pump could be reduced (Cole et al., 2016; Wieczorek et al., 2019; Shore et al., 2021). This is because slowed pellet sinking would lead to the release of a greater fraction of the remineralised carbon higher in the water column and reduce the amount of pellet-associated carbon sequestered in the deep ocean.
Reduced biological pump efficiency from slowed microplastic-laden pellet sinking joins a growing list of concerning microplastic-microbiota interaction mechanisms that might lead to an unquantified increase in atmospheric CO2 and contribute to global warming g (recently reviewed by Shen et al., 2020; Galgani and Loiselle, 2021; MacLeod et al., 2021; Kvale, 2022). Microplastic-microbiota interactions are likely to be simultaneously affected by the physical and chemical effects of climate change (Kvale et al., 2020a; Kvale et al., 2020b; Kvale et al., 2021; Kvale and Oschlies, 2022) complicating the estimation of carbon cycle impacts. Here, we test the hypothesis that faecal pellet slowing by microplastic can influence the global carbon cycle at century timescales, using a complex earth system model. We examine resulting air-sea gas exchange as well as the storage of remineralised carbon by the biological pump in a future hypothetical strong pollution, strong climate change scenario.
2 Methods
2.1 Model description
Here we apply a model of ocean microplastic interaction with the base of the marine food web and biogeochemistry, embedded within an Earth System Model of intermediate complexity (Figure 1). The microplastic model used in this study is modified from Kvale et al. (2020b) and fully described there. The marine biogeochemistry is described in Keller et al. (2012); Kvale et al. (2015b). The Earth System Model, the University of Victoria Earth System Climate Model (UVic ESCM) version 2.9 is described in Weaver et al. (2001); Meissner et al. (2003); Eby et al. (2009). Briefly, the UVic ESCM is a coarse-resolution (1.8° × 3.6° × 19 ocean depth layers) ocean-atmosphere-biosphere-cryosphere-geosphere model. The ocean levels increase in thickness from 50 m in the surface layer. Atmospheric processes are simplistically represented as a two dimensional energy moisture-balance model. The biogeochemistry resolves dissolved inorganic carbon and alkalinity, as well as oxygen, nitrate and phosphate ocean tracers. A seasonally cycling iron mask parametrizes iron limitation for primary producers (Keller et al., 2012). Phytoplankton are represented by three functional types: ordinary phytoplankton, calcifying phytoplankton, and nitrogen fixing diazotrophs (Keller et al., 2012; Kvale et al., 2015b). Calcifying phytoplankton and a single zooplankton class produce particulate inorganic carbon (carbonate) at a fixed ratio (4%) from particulate organic carbon production. This ratio was determined by model tuning in Kvale et al. (2015b) to achieve optimal fit against observed alkalinity and dissolved inorganic carbon (DIC) distributions (Key et al., 2004). Carbonate ballasts associated organic carbon and dissolves quasi-thermodynamically following the parametrisation of Aumont et al. (2003) but allowing for supersaturated dissolution (Milliman et al., 1999). The sediment model (Archer, 1996) is not activated for these simulations because water-sediment carbon interaction operates over timescales longer than those examined here.
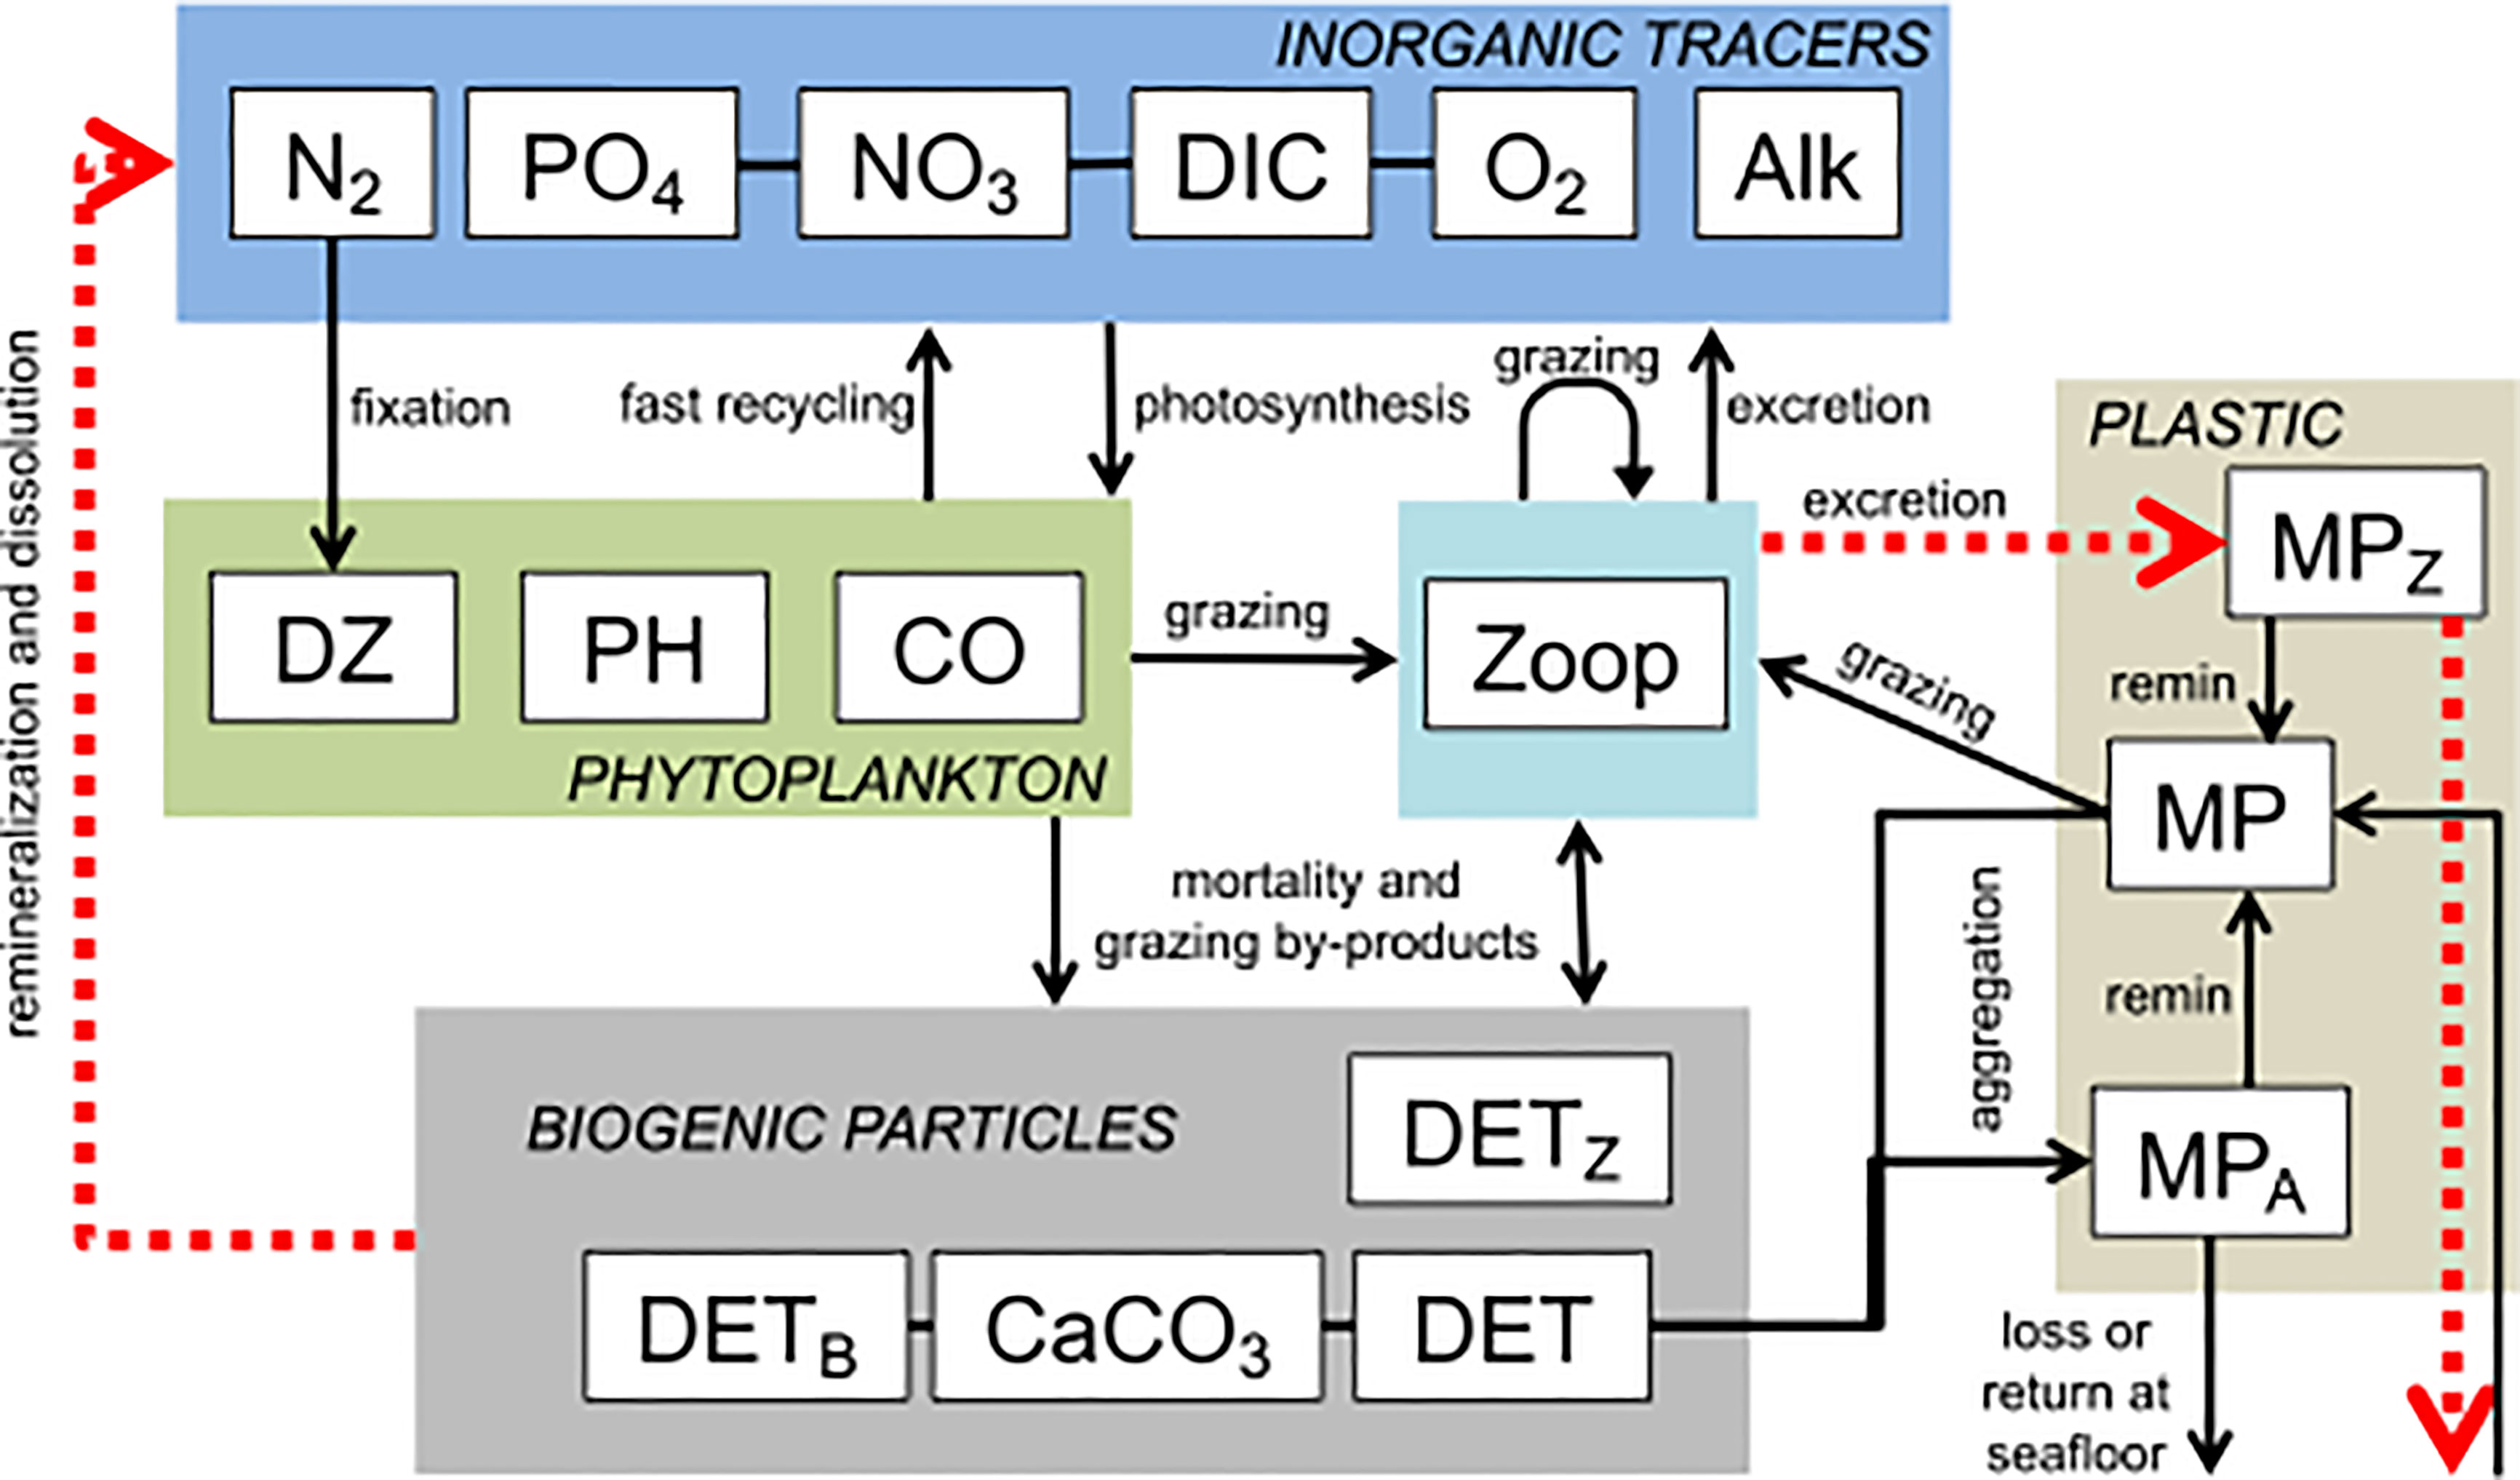
Figure 1 Model schematic modified from Kvale et al. (2020b). State variables are shown in rectangles and are categorized in labelled, coloured rectangles. Black lines show mass flux (in nitrogen units for the biological variables) or particle fluxes (microplastic). Marine snow is produced as a fixed fraction of the free (unattached) organic detritus (DET) pool. Microplastic (MP) aggregates with this marine snow, entering the MPA (marine snow entrained MP) pool. MPA sinks at the aggregate rate, with a fraction reaching the seafloor considered to be lost from the ocean. Detrital remineralization releases the MPA from marine snow aggregates at the rate of detrital remineralization. MP is also grazed by zooplankton (Zoop) and excreted into a pellet-bound MPZ pool. Pellet-bound MPZ sinks and is released back to the free (unattached) MP pool at the rate of detrital remineralization, but some is also lost at the seafloor. In the experiments reported here, faecal pellet-bound detritus (DETz) as well as pellet-bound microplastic sinking speed is determined by Eqns. 13. Fluxes impacted by this modification are shown in red, dashed arrows. Details on the biogeochemical aspects of the model are previously described (Kvale et al., 2015b).
The microplastics model represents three plastics partitions in the ocean using concentration units of particles per cubic metre (Kvale et al., 2020b). For simplicity, this model does not resolve particle size, type or breakdown. Unattached microplastic (MP) enters along coastlines and major shipping routes using a scaling against regional CO2 pemissions to approximate population density and degree of industrialization. These unattached microplastic particles trace passively, but a fixed portion of the particles in each grid cell are prescribed a rise rate to approximate a quasi-buoyant body of microplastic in the ocean. Because size and type is not considered, all unattached microplastic is uniformly appealing and interacts equivalently with zooplankton and marine snow. Zooplankton ingest and then excrete the microplastic, which is then bound in a faecal pellet partition (MPZ). Ingestion is calculated with a Holling II function which considers the grazing preference for microplastic over other types of food, and the total amount of food available (Kvale et al., 2020b). Faecal pellet microplastic sinks and is released back to the unattached plastic pool at the rate of detrital remineralisation. If the faecal pellet reaches the seafloor before returning to the unattached pool, a prescribed portion is considered lost from the ocean and the remainder returned to the unattached pool. The third partition is formed by the aggregation of the unattached partition with marine snow (MPA). Marine snowaggregates are produced as a fixed fraction from phytoplankton detritus formation, and microplastic aggregates with it using a Monod function to approximate a saturation threshold for the organic aggregate: microplastic ratio (Kvale et al., 2020b). Once bound in marine snow, this microplastic partition sinks at the rate of organic detritus and is released back to the unattached partition at the rate of detrital remineralisation. As with faecal pellet plastic, any marine snow bound plastic which reaches the seafloor either returns to the water column as unattached microplastic, or is considered lost to the system, with the return portion being prescribed.
Explicit three-dimensional modelling of biofouling vertical trajectories of several common microplastic sizes and types by others suggests that on average, biofouling has the potential to produce particle maximum concentrations within the upper 50 meters (Fischer et al., 2022), which would be completely within our model’s surface depth layer. The Kvale et al. (2020b) model represents this biofouling and defouling implicitly by biological uptake dynamics that include large losses to the temperature-dependent microbial fast recycling loop (Kvale et al., 2015a; Kvale et al., 2015b).
The microplastic model contains seven unconstrained parameters: the input rate of microplastic to the ocean, the fraction of unattached microplastic which rises, the fraction of phytoplankton detritus which aggregates into marine snow flocculates, the microplastic uptake coefficient for marine snow, the fractional return of microplastic at the seafloor, the zooplankton grazing preference for microplastic, and the microplastic substitution ratio for food in a zooplankton’s diet. These seven parameters were subjected to extensive sensitivity testing in Kvale et al. (2020b) and the reader is referred to the Supplemental Information accompanying that manuscript. While 14 of the parameter tests were identified as the most probable solution space, it was not possible to further narrow the candidate parameter sets. Thus, in that and subsequent publications (e.g., Kvale et al., 2020b; Kvale et al., 2021; Kvale and Oschlies, 2022) a set of three representative parameter combinations were used to describe robust features of the 14 member “most likely” ensemble.
In the Kvale et al. (2020b) model, the sinking rate of faecal pellets was not altered by the presence of microplastics. However, studies have shown that the sinking rate of faecal pellets can decrease when low density microplastics are included in their matrix (Cole et al., 2016; Coppock et al., 2019). To investigate the biogeochemical and ecological effects of slowed faecal pellet sinking in the presence of microplastic contamination, we use the experimentally derived linear relationship between increasing faecal pellet density (decreasing microplastic content) and increasing sinking rate (Cole et al., 2016):
The theoretical faecal pellet sinking rate (Rsink) in meters per day depends upon a scaling (m; 411.4 meters cm3 day-1 g-1) multiplied by the faecal pellet density (ρpellet) in g per cm-3 and added to c (-432.0 meters per day), the y-intercept of Cole et al. (2016), their Figure 3A). This linear relationship was obtained by feeding polystyrene microbeads to C. helgolandicus, a species of copepod (Cole et al., 2016), and applies to purely organic as well as plastic-laden pellets.
We calculate the faecal pellet density for Equation 1 in each model grid cell from the density of organic material held in faecal pellets (ρpellet0) and the density of microplastic (ρmp) in g per cm-3, each multiplied respectively by the proportion of mass of organic material (D) and the proportion of mass of microplastic in faecal pellets (MPZ) for the grid cell:
Microplastic is simplistically assumed to have a density of 1.05 g cm-3 as this is the density of polystyrene beads used by Cole et al. (2016). However, the base biogeochemical model does not explicitly represent organic particle density. It instead applies a linear rate of increase to all particle sinking rates (wp(z)) following Berelson (2001). All organic detritus, including faecal pellets, sink at a rate from 14 meters per day at the ocean surface (wp0 in Equation 3), increasing at a rate of 2 cm per day for each meter increase in model ocean depth (z) (to a maximum of 130 m d-1 in the deepest parts of the ocean):
The motivation of this parametrisation is the observation of increased sinking rates with depth due to the loss of organic material by remineralisation as the particles settle (Berelson, 2001). When the organic material remineralizes, this leaves behind the denser siliceous or carbonate components of the pellet, thereby increasing the settling rates (Berelson, 2001). Thus in the base biogeochemical model, implicit particle densities for faecal pellets are assumed to increase from the surface to the deep ocean. This simplistic parametrisation is computationally efficient and produces a good agreement with observed nutrient, carbon, and oxygen distributions (Kvale et al., 2015b). Inserting the model pellet sinking rate range of 14 to 130 m d-1 in Equation 1, we obtain the implicit model pellet density range of 1.084 (surface) - 1.366 (bottom) in g per cm-3. Zooplankton faecal pellet densities vary widely in nature (e.g., 1.07 - 1.37 g cm-3; Butler and Dam, 1994 and 1.7 g cm-3; Ploug et al., 2008). We apply our calculated range of implicit faecal pellet densities to Equation 2 in our modelling framework, so that at each model depth level, and for each grid cell’s faecal pellet and faecal pellet microplastic content, a unique density ρpellet is obtained. This ρpellet is applied in Equation 1 to obtain the pellet sinking speed for each grid cell in the model.
Unit conversions are required in order to calculate the mass ratios of faecal pellets to microplastic in faecal pellets for each grid cell in Equation 2. Model units for microplastic are particles m-3. Microplastic particle concentrations are converted to grams m-3 using a conversion of 236000 tonnes = 51.2 ×10¹² particles (van Sebille et al., 2015), or 4.6 ×10⁻³ grams per particle, as is already applied in other parts of the model (Kvale et al., 2020b). This conversion is similar to the 4.8 ×10⁻³ grams per particle of the larger size (20.6 μm) polystyrene beads used by Cole et al. (2016). Mass conversion for the smaller sized (7.3 μm) polystyrene beads used by Cole et al. (2016) is 2 × 10⁻⁴ grams per particle and results in overall denser faecal pellets for the same microplastic particle concentrations. Model units of organic faecal pellet material are mmol N m-3. Nitrogen units are converted to grams of nitrogen using the molar mass 14 g N per mol. We use the average faecal pellet content (30 μg N: 1 mg faecal pellet) from Morales (1987) to convert to a mass in grams of pellets per grid cell.
To illustrate the effect of Eqns. 1 and 2 on Equation 3, we apply them to a published high surface plastic concentration simulation from Kvale et al. (2021), using model output of globally averaged organic detritus and microplastic concentrations with depth. This model simulation has been forced with rapidly increasing atmospheric CO2 as well as rapidly increasing microplastic pollution rates, and therefore represents an extreme pollution and climate change scenario projected to the year 2100. When no microplastic is present, the calculated depth-dependent faecal pellet sinking rate is unchanged from the default model configuration value (Figure 2, black line). At increasing concentrations of microplastic, deviation of Rsink from Rsink0 becomes increasingly significant (see the additional slowing between years 2000 and 2100, dashed versus solid lines in Figure 2). The mass conversion of simulated microplastics to small or larger-size polystyrene can also exert a significant influence on calculated faecal pellet sinking rates (see blue versus red lines in Figure 2).
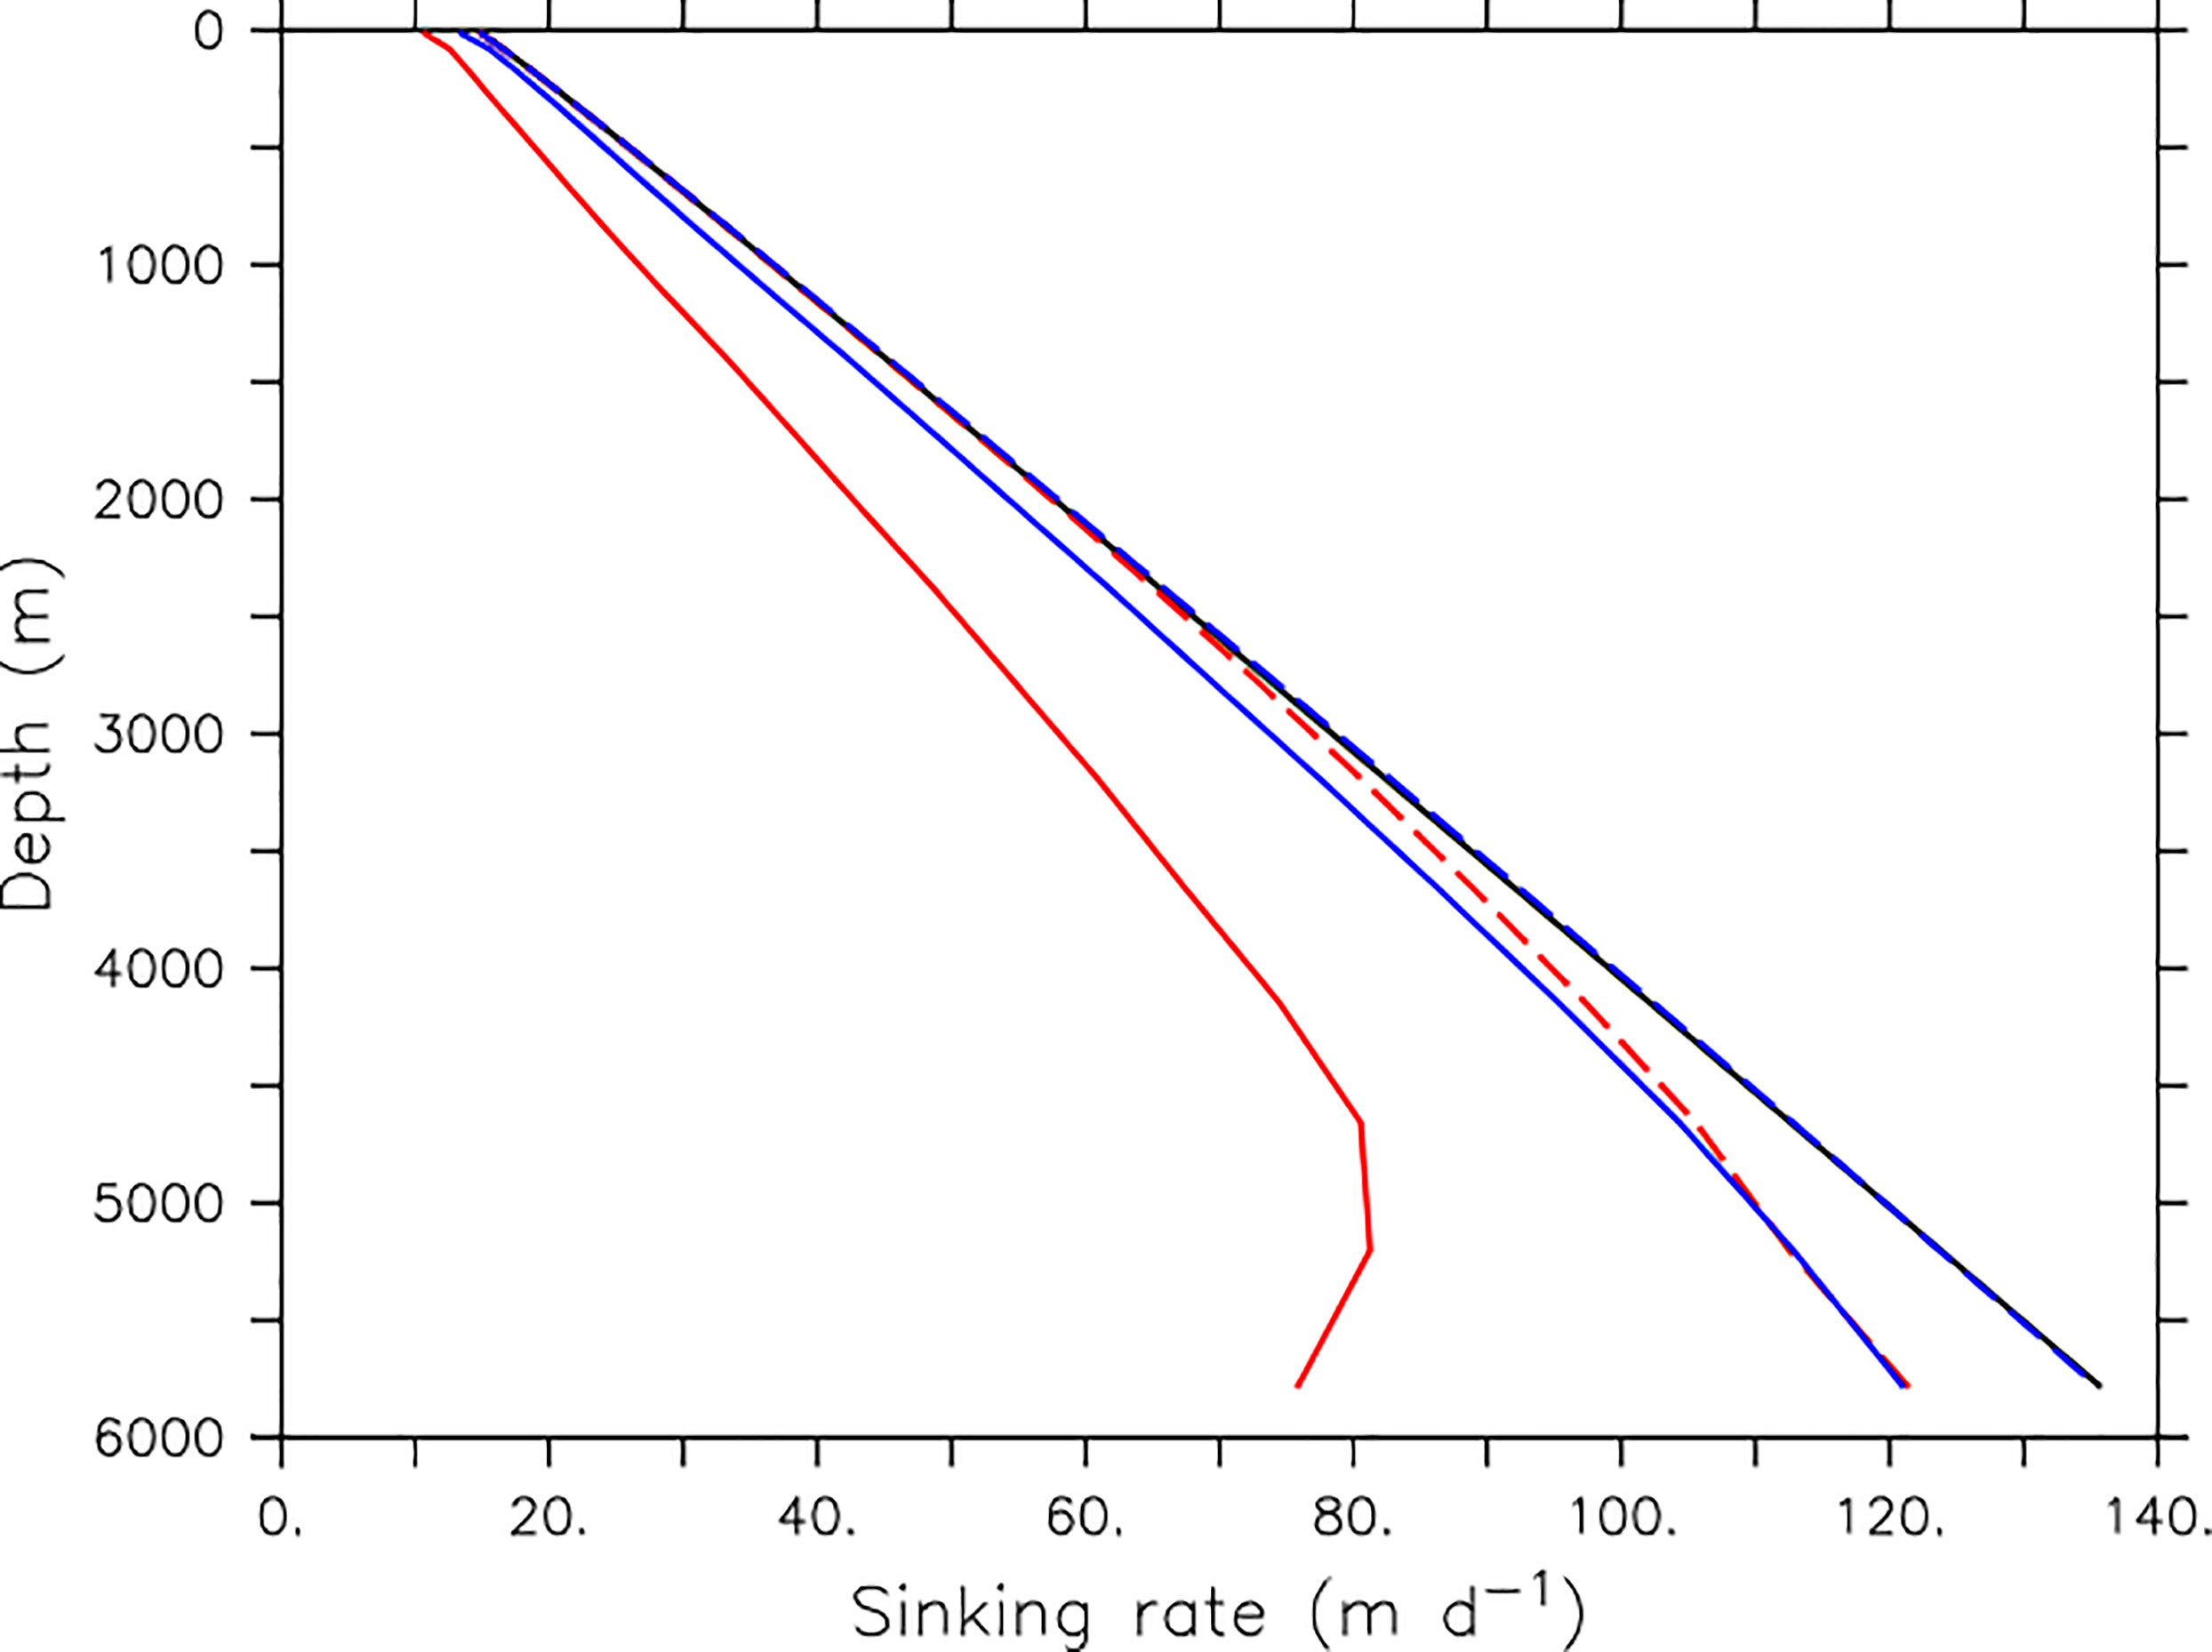
Figure 2 Calculated faecal pellet sinking rates. Black line is the default model parametrisation (Equation 3), which increases linearly with depth. Blue and red lines include rate modification following Equation 2, based on microplastic contamination and faecal pellet concentrations taken from Kvale et al. (2021) high-surface microplastic concentration output. Dashed lines use microplastic and faecal pellet concentrations from the year 2000, solid lines use model output from the year 2100. Blue colour indicates the assumption of all microplastic having the mass of small-size polystyrene beads, red colour indicates the assumption of all microplastic having the mass of large-size polystyrene beads (Cole et al., 2016).
Note that the faecal pellet density calculation (Equation 2) occurs for each grid cell and thus the applied faecal pellet sinking rate depends strongly on the ratio of faecal pellet microplastic to faecal pellets in each grid cell. This parametrisation permits feedbacks, i.e. biogeochemical side effects of slowed surface pellet export due to microplastic contamination will affect both the microplastic and faecal pellet concentrations throughout the water column and therefore adjust sinking rates. This possibility of feedbacks is not represented in our offline calculations in Figure 2, but is represented in our fully-coupled experimental framework which is described below.
2.2 Experimental framework
We adapt the experimental framework previously used by Kvale et al. (2020b); Kvale et al. (2021); Kvale and Oschlies (2022). The UVic ESCM is first equilibrated at year 1765 boundary conditions, including agricultural greenhouse forcing and land ice. Historical CO2 forcing is next applied from year 1765 to 1950. From 1950 to 2100 the model is then forced with both historical CO2 forcing (to 2005) and a high-end CO2 concentration projection (RCP8.5; Riahi et al., 2007; Meinshausen et al., 2011) (Figure 3). Microplastic is introduced to the ocean model from year 1950 and the pollution rate increases 8.4% per year (Geyer et al., 2017). The total amount of microplastic added to the ocean is fractionally reduced from a calculated maximum potential pollution rate, which was tuned to fall close to the 275 million metric tonnes of plastic waste generated by coastal countries at year 2010 (Jambeck et al., 2015). We repeat this simulation sequence for three variants of the model; the first being the default, linearly increasing faecal pellet sinking rate version (CNTL) and the second (SLOWbig) and third (SLOWsmall ) being the density-modified slowed faecal pellet sinking rate version described by Equation3. The CNTL model includes zooplankton ingesting microplastic and therefore also simulates the corresponding biogeochemical response of ecosystems as described by Kvale et al. (2021). For SLOWbig we apply the mass conversion of large-size polystyrene microbeads (4.6 × 10⁻³ grams per particle), and for SLOWsmall we apply the mass conversion of small-size polystyrene microbeads (2.× 10-4 grams per particle) from Cole et al. (2016). By comparing the model outputs of CNTL and SLOW, we can assess the biogeochemical impact of microplastic-slowed faecal pellet sinking rates in a warming climate. By comparing the model outputs of SLOWbig and SLOWsmall we can assess the sensitivity of our model results to the assumed microplastic particle size. In a final step, we simulate a climate-change only scenario that does not include any microplastic pollution effects (CNTLclim). We do this in order to give climate warming context to the changes in ecosystems induced by microplastics pollution.
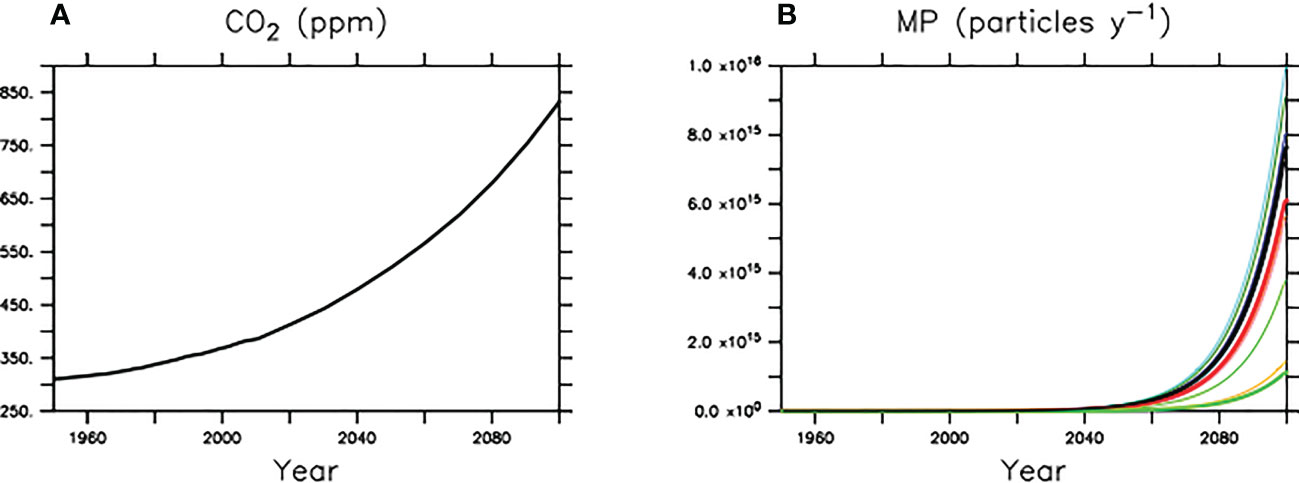
Figure 3 Earth system and microplastic model forcing. All models use equivalent CO2 forcing (A), but microplastic input rates are varied (B).
Microplastic model parameters remain poorly constrained. Therefore, in our exploration of the hypothesis that microplastic-slowed faecal pellet sinking impacts global ocean carbon cycling we apply our three model variants to 14 microplastic model parameter combinations. These combinations were obtained in Kvale et al. (2020b) using Latin Hypercube methodology (McKay et al., 1979). Three hundred unique microplastic parameter combinations, representing the whole of the possible parameter value combination space, were used to force the model between the years 1950-2100. About half of the simulations were found to be numerically unstable, and the survivors were further eliminated if the pollution inventory exceeded 9 × 10¹⁴ particles at the year 2010 (Kvale et al., 2020b). This cut-off was applied based on Eriksen et al. (2014) estimating 3 × 10¹² large-size microplastic particles in the upper ocean in the year 2010, plus a 1-2 orders of magnitude assumed sub-surface inventory. However, this estimate might be under-estimated by two or three orders of magnitude, as more recent surveys have found very high subsurface concentrations of small-size microplastics around gyres (Zhao et al., 2022). The model microplastic parameter combinations which remained numerically stable throughout the simulations, and which produced plausible global microplastic inventories, represent a range of microplastic model parameter values and vary with respect to their pollution rates, the fraction of unattached microplastic that rises, the fraction of phytoplankton detritus which aggregates into marine snow, the marine snow-microplastic uptake coefficient, the fraction of microplastic which is lost to the seafloor, the zooplankton grazing preference for microplastic, and the mass of microplastic which is assumed to substitute for the same mass of food in a zooplankton’s diet. A second Latin Hypercube sampling that includes updated elimination criteria is planned for the future, but is outside the scope of the present sensitivity study.
In the following section, we present the most robust biogeochemical responses across the model ensemble to microplastic slowing of faecal pellet sinking rates. We provide ensemble mean responses from the members of SLOWsmall , SLOWbig, and CNTL, respectively, in order to provide a full-ensemble comparison. We also distinguish when model responses (SLOW - CNTL) do not agree in sign within the ensemble (indicating strong response dependency on parameter values), and calculate the standard deviation of model response (SLOW - CNTL) in each ensemble. If the standard deviation of the model response is smaller than the ensemble mean response (SLOW - CNTL) then we define the response as robust (indicating low response dependency on parameter values). By examining a high-pollution, high-CO2 emissions scenario, we quantify the maximum multi-decadal perturbation potential of ocean biogeochemistry to the threat of microplastic pollution slowing faecal pellet sinking whilst undergoing strong climate change.
3 Results
Ten of fourteen members of the SLOWbig model ensemble, and three members of the SLOWsmall ensemble became numerically unstable (state variable concentrations blowing up to either fantastically large or fantastically negative values and aborting the run) with respect to surface microplastic concentrations before completing 151 years of simulation. Numerical instability was not correlated with any microplastic model parameter, i.e. not plastic input rate, zooplankton grazing preference for microplastic, et cetera. This result suggests both that microplastic particle distribution is highly sensitive to slowing faecal pellet sinking and that feedbacks between slowed microplastic and organic particle sinking can be significant, and therefore that repeating extensive parameter ensemble testing including slowed pellet sinking and different microplastic particle mass assumptions would be worthwhile in the future for model comparison against modern ocean data. Because of the numerical instabilities, we therefore restrict our main analysis to the mean response of the 11 members of SLOWsmall which completed 151 years of simulation. Ecological and biogeochemical responses of the numerically stable SLOWbig model ensemble are of a larger magnitude and with greater inter-model disagreement, and are provided in the Supplemental Information.
3.1 Regionally nuanced particle flux responses to slowed pellet sinking
3.1.1 Decreased faecal pellet fluxes in tropical upwelling zones, the North Pacific and North Atlantic
Slowed sinking rates in microplastic-laden faecal pellets causes only regional reductions in faecal pellet flux below 130 m depth in the eastern tropical Pacific and Atlantic upwelling zones, and the North Pacific and Atlantic Oceans by the year 2100 (Figure 4, top left panel). This is a counter-intuitive result, as a widespread decrease of pellet fluxes is predicted on the basis of the hypothesis that more slowly sinking pellets ought to undergo more remineralisation higher in the water column, therefore leaving fewer pellets to sink out of the upper ocean. Standard deviation within the SLOWsmall-CNTL ensemble difference is relatively large in the tropical upwelling regions, but the response is robust. Regions in which the response is not robust are shaded in light grey in Figure 4 and include suppressed pellet fluxes in the North Pacific and North Atlantic basins. In these regions, the magnitude of the model response is more sensitive to microplastic model parameter values. By contrast, reduced flux regions shaded in dark grey (the western tropical Pacific, the eastern subtropical Atlantic, and the Arctic) are those in which the sign of the response in faecal pellet flux does not agree across the model ensemble members.
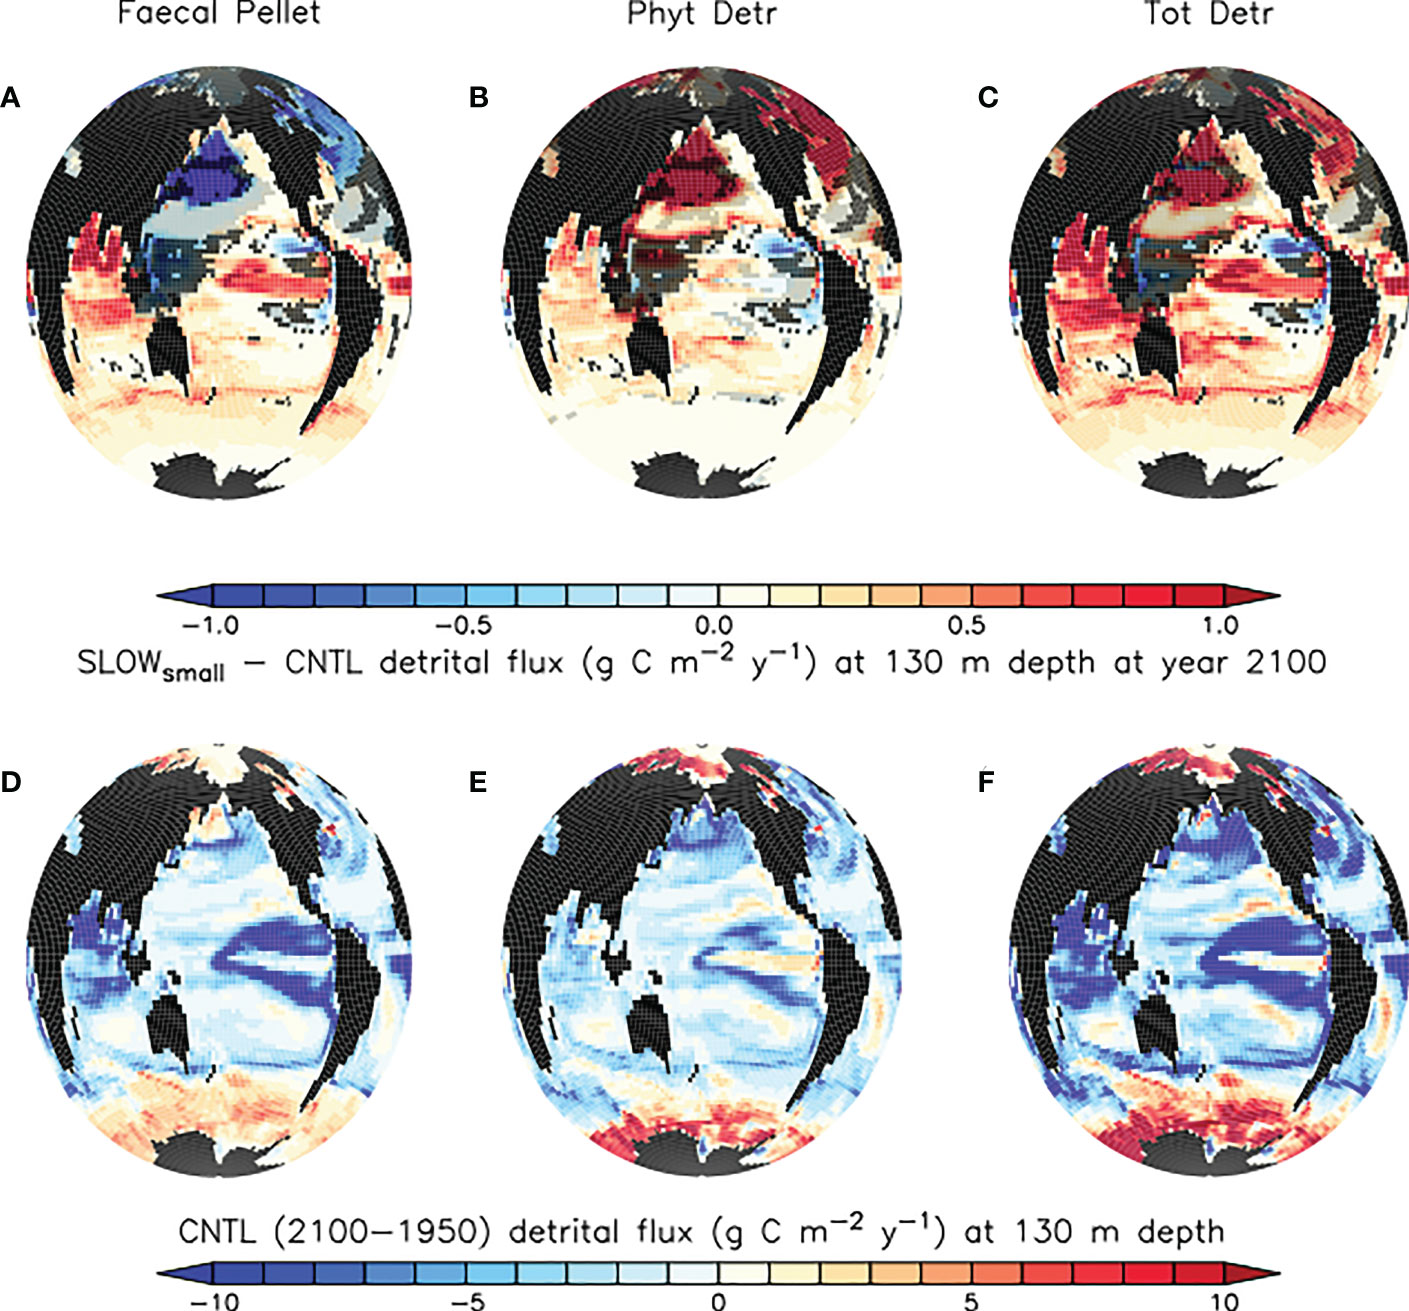
Figure 4 (A–C) model ensemble mean differences (SLOWsmall - CNTL) in simulated organic particle flux at 130 m depth at the year 2100. Trends in regions shaded in light grey are not robust (see definition in the text). Trends in regions shaded dark grey do not agree in sign across the model ensemble. Panels (D–F) CNTL model ensemble organic particle flux change between years 1950 and 2100 at 130 m depth. Differences in SLOWbig - CNTL are generally larger and are provided as Supplemental Figure S1.
3.1.2 Increased faecal pellet fluxes in the tropics and subtropics
In the tropical and subtropical oceans and Southern hemisphere, shoaling of pellet remineralisation results in a robust increase in pellet fluxes. An increase in pellet fluxes due to slowed pellet sinking suggests changes to the whole ecosystem result in more grazing activity by zooplankton and therefore a net increase in pellets produced. Figure 4, top middle panel displays a corresponding robust increase in phytoplankton detrital flux in the same regions. A clue to the drivers of this net increase in detrital fluxes may be found in the growth limitation map for generic phytoplankton (Figure 5), which shows these regions to be largely nitrate-limited in SLOWsmall. A net increase in total detrital fluxes (shown in Figure 4, top right panel) indicates a widespread alleviation of nitrate limitation across the tropical and subtropical ocean when microplastic slows faecal pellet sinking. The additional nutrient supply in nutrient-limited regions largely does not show up in surface maps of phosphate and nitrate response (Figure 6) because limiting nutrients are used immediately and do not accumulate. However, a robust increase in net primary production (NPP) is apparent in these middle and low latitudes (Figure 7). Nitrogen fixation response in these regions show a mean model ensemble increase, although the sign of the response is not uniform across the ensemble for most of the open Atlantic and Pacific ocean basins (Figure 7). An increase in nitrogen fixation is however robust in the tropical Indian and eastern tropical Pacific, and this additional source of nitrate to the surface ocean contributes to the net increase in productivity in the nitrate-limited surface ocean. Tropical and sub-tropical nitrate limitation has been demonstrated in this model to be very sensitive to upstream nitrogen fixation (Yao et al., 2022). But also, zooplankton excretion is an important pathway for the rapid recycling of nutrients, including nitrate, in the upper ocean in these regions (Kvale et al., 2021). In our model, zooplankton ingestion of microplastic leads to a net loss of nutrients from the already nutrient poor surface ocean, which decreases net primary production and export fluxes (Kvale et al., 2021). But shoaled pellet remineralisation counteracts this loss of nutrient recycling. Thus paradoxically, the slowed sinking of pellets by microplastic benefits zooplankton in nutrient limited growth regimes, who find a net increase in available food due the additional fertilisation via enhanced pellet remineralisation.
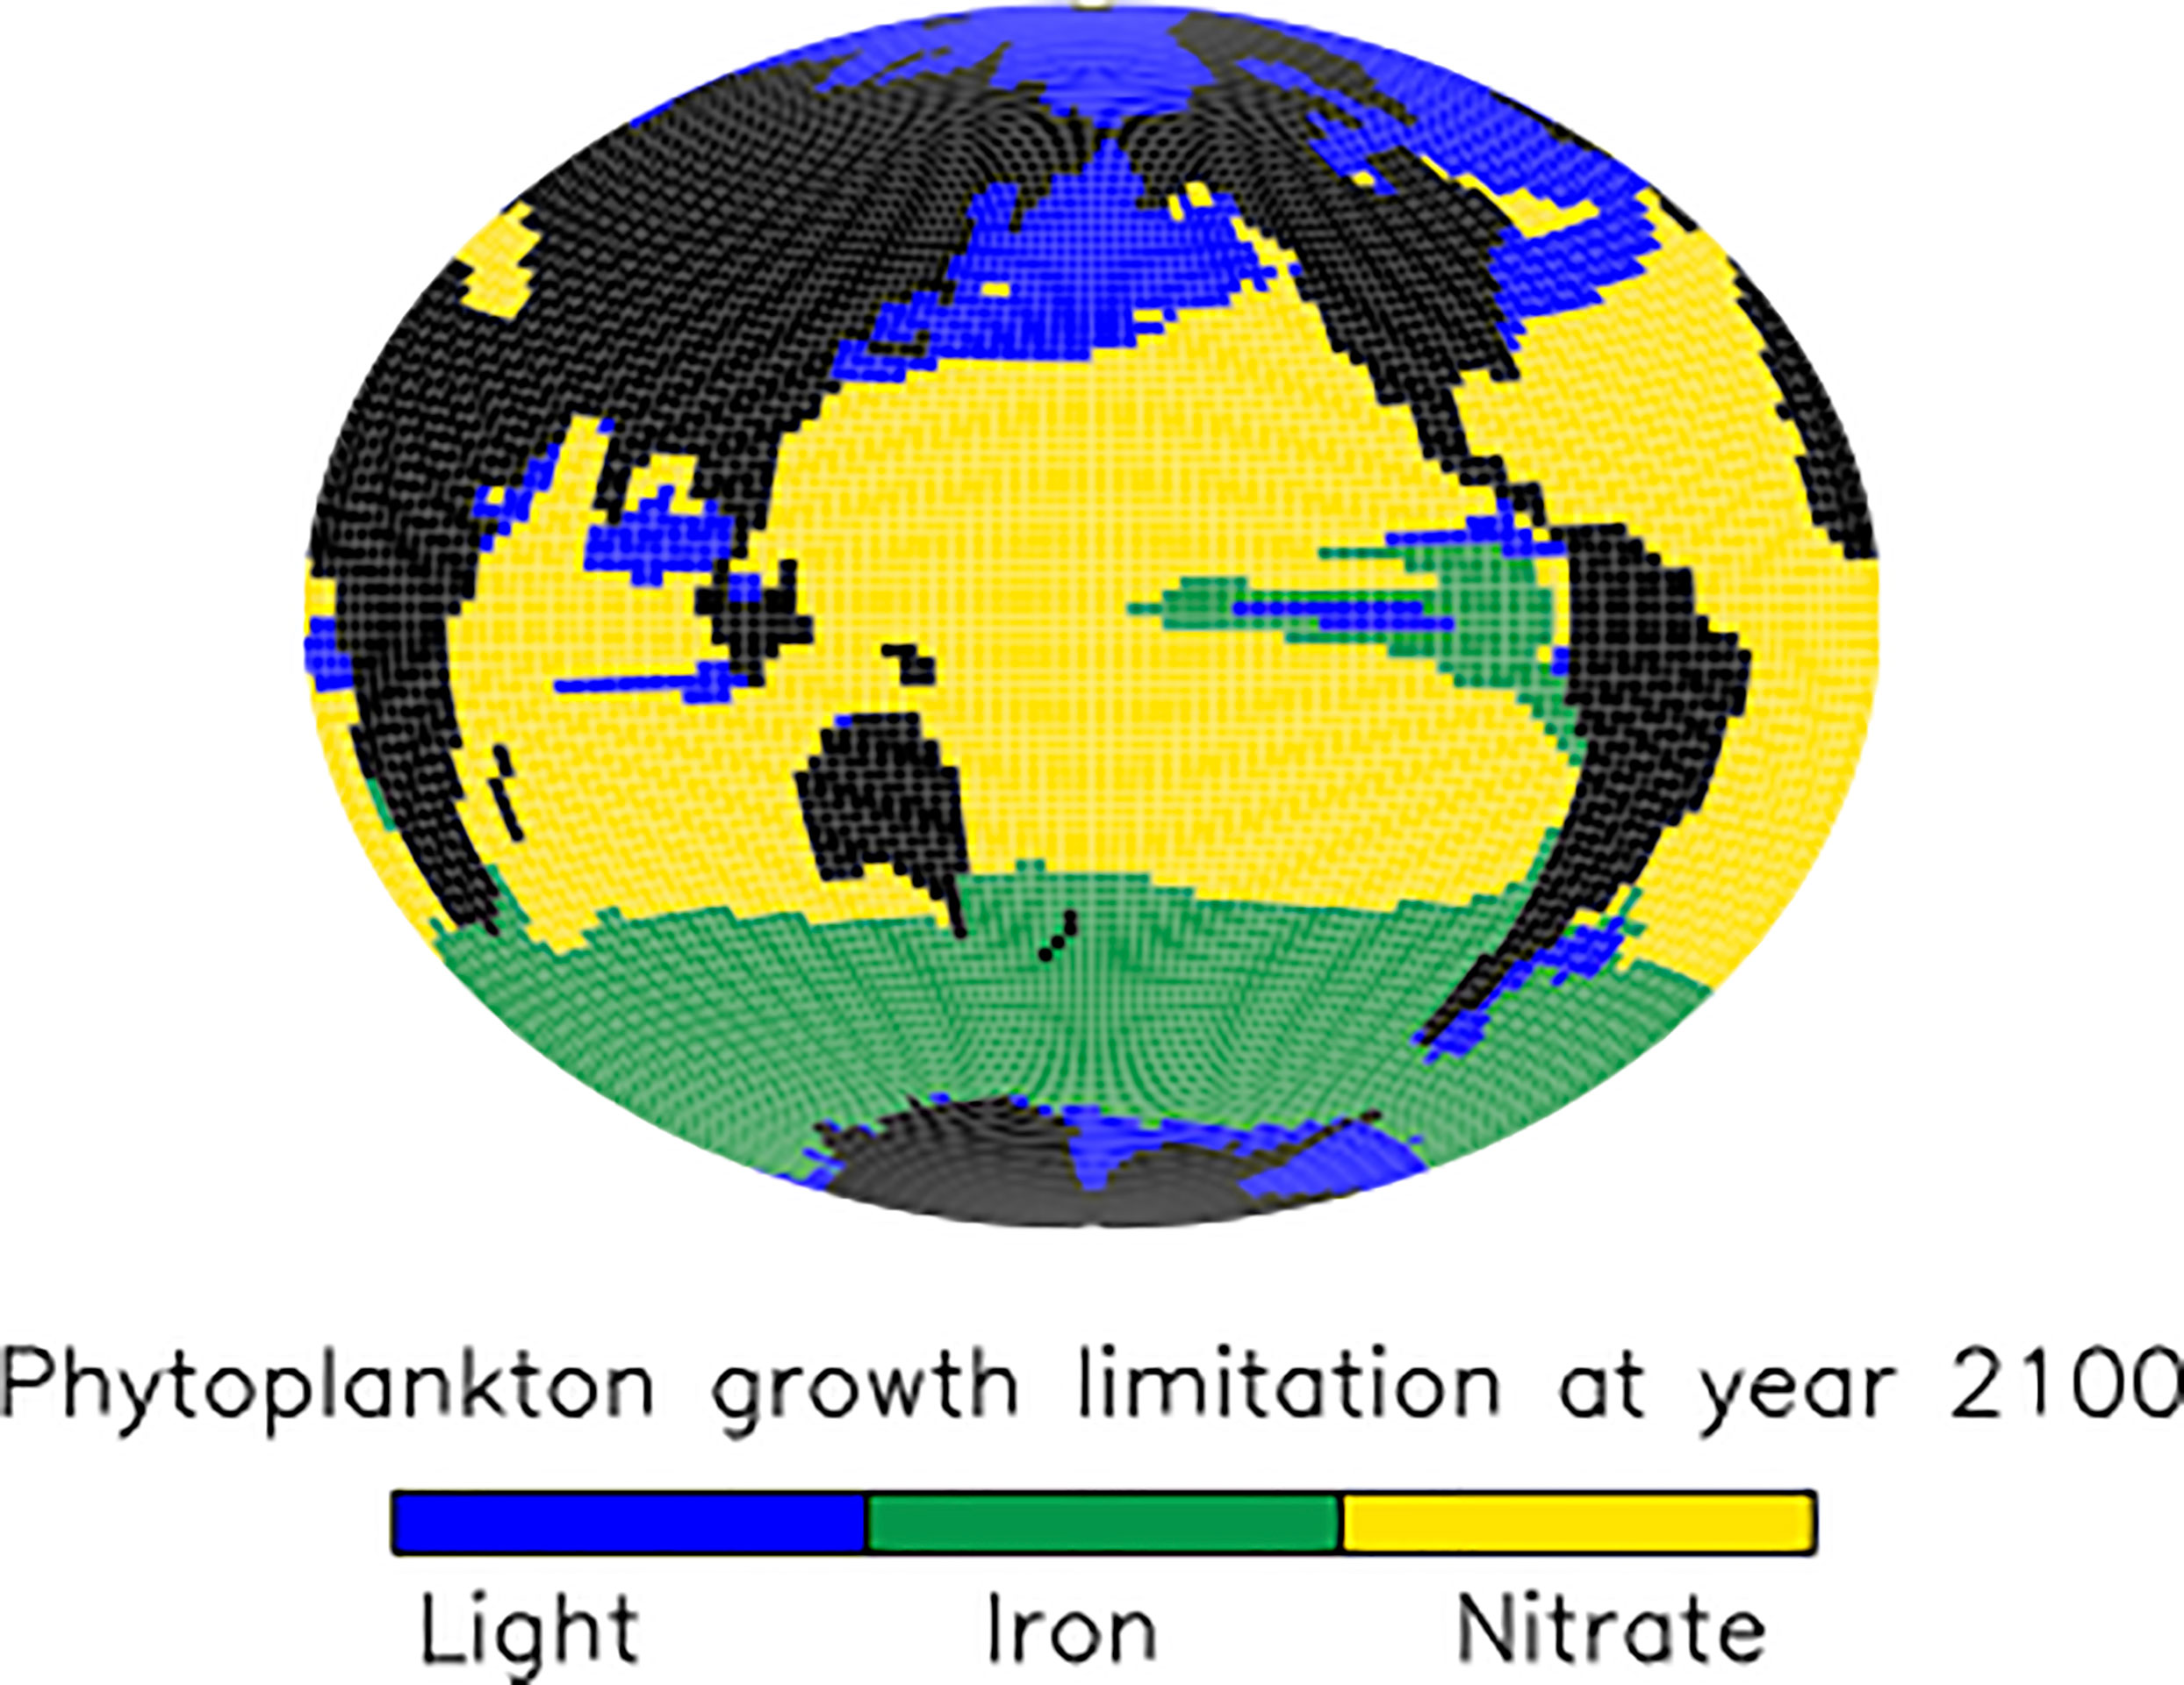
Figure 5 SLOWsmall ensemble mean phytoplankton bottom-up growth limitation factors at the year 2100.
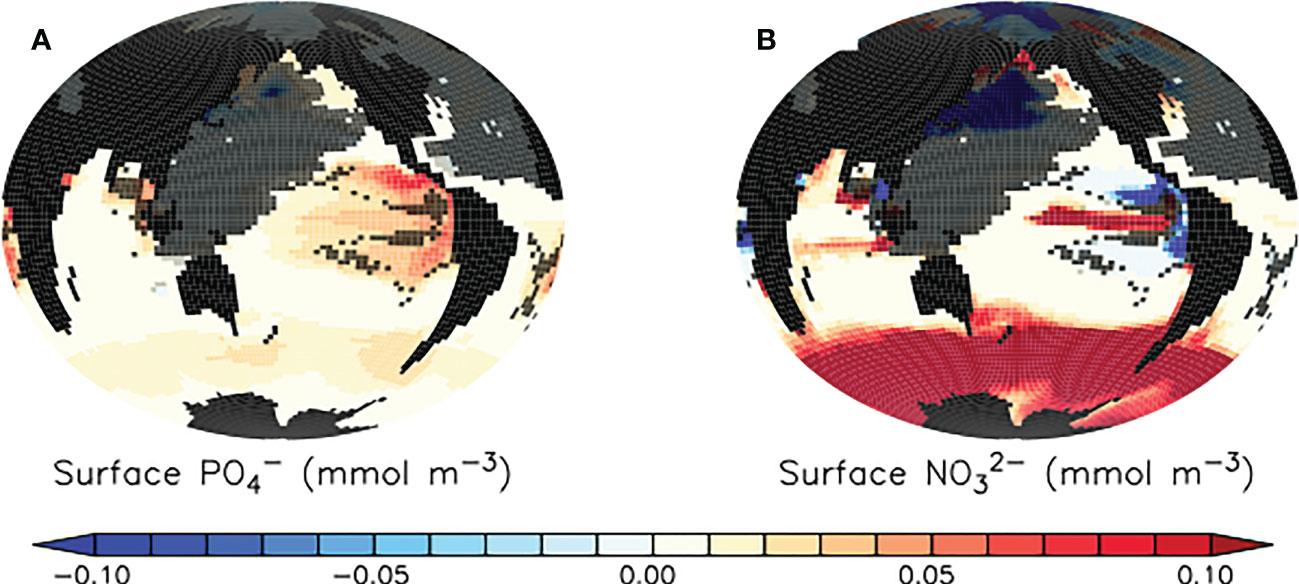
Figure 6 Model ensemble mean differences (SLOWsmall - CNTL) in simulated surface phosphate (A) and nitrate (B) at the year 2100. Trends are robust except for where they are shaded in dark grey. Trends in regions shaded in dark grey also do not agree in sign across the model ensemble. Differences in SLOWbig - CNTL are provided as Supplemental Figure S3.
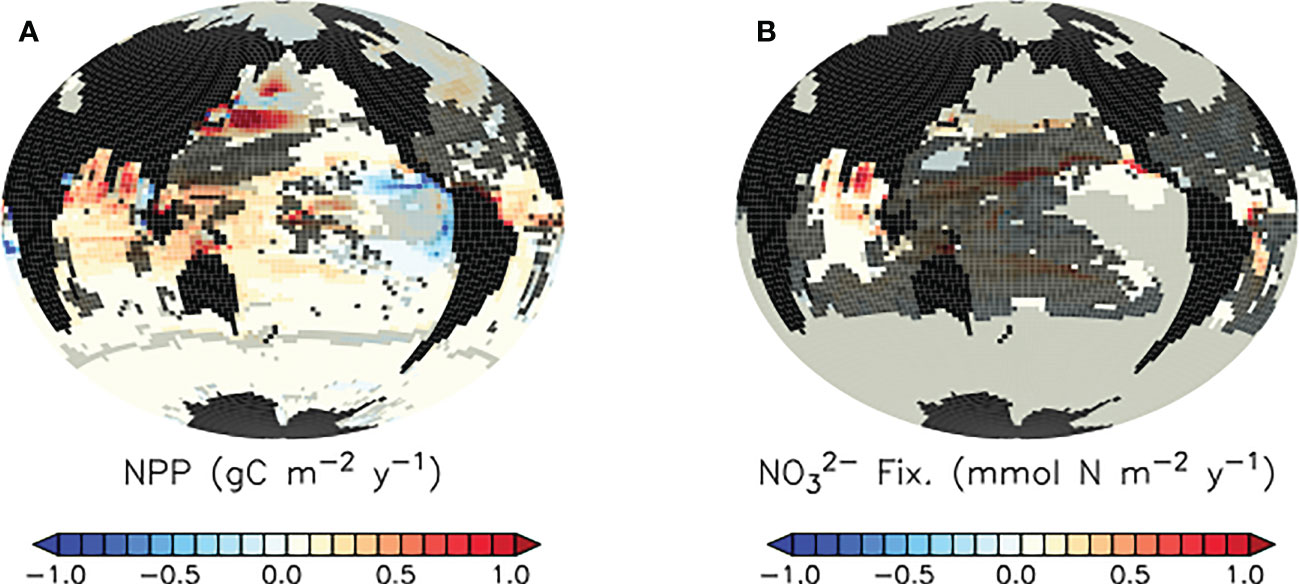
Figure 7 Model ensemble mean differences (SLOWsmall - CNTL) in simulated net primary production (A) and nitrogen fixation (B) at the year 2100. Trends in regions shaded in light grey are highly variable in magnitude across the model ensemble. Trends in regions shaded in dark grey do not agree in sign across the model ensemble. Differences in SLOWbig - CNTL are provided as Supplemental Figure S2.
3.1.3 Increased total organic particle fluxes in the North Pacific and North Atlantic
The large but model-dependent decrease of faecal pellet flux in the North Pacific and North Atlantic due to the slowing of faecal pellet sinking increases phytoplankton detrital flux more than it offsets its loss, leading to a net increase in total detrital fluxes in these regions (Figure 4, top right panel). The high-latitude North Pacific and North Atlantic are not generally nutrient-limited in our model (Figure 5), therefore it cannot be a shoaling of nutrient recycling that holds an explanation (noting also, that the SLOWsmall ensemble members’ response of North Pacific and North Atlantic surface nutrients to slowed pellet sinking does not even agree). Instead, primary producer populations in these regions are controlled by zooplankton grazing. When zooplankton consume microplastic as a part of their diet, this alleviates top-down control on primary producers (approximated in Figure 8 as the difference in annual grazing flux of organic material normalised by the prey biomass) which then respond with a net increase in primary production (Figure 7). Thus in the high latitude North Pacific and Atlantic, dual effects exacerbate organic detrital flux response: zooplankton ingest microplastic which reduces the top-down control, and the slowed sinking of microplastic-laden faecal pellets increases zooplankton exposure to (and therefore ingestion of) microplastic. These dual effects explain why the sign of the response in net primary production and detrital fluxes is robust across the model ensemble, but the magnitudes are highly model-dependent. These dual effects do not cause a uniform increase in net detrital fluxes in the tropical upwelling zones because shoaled pellet remineralisation consumes sufficient oxygen higher in the water column to shoal the oxygen minimum zone and increase denitrification (which occurs at concentrations below 5 mmol O2m-3 in our model), which reduces surface nitrate concentrations, and therefore net primary production (Figure 7), in the upwelling zones (Figure 6).
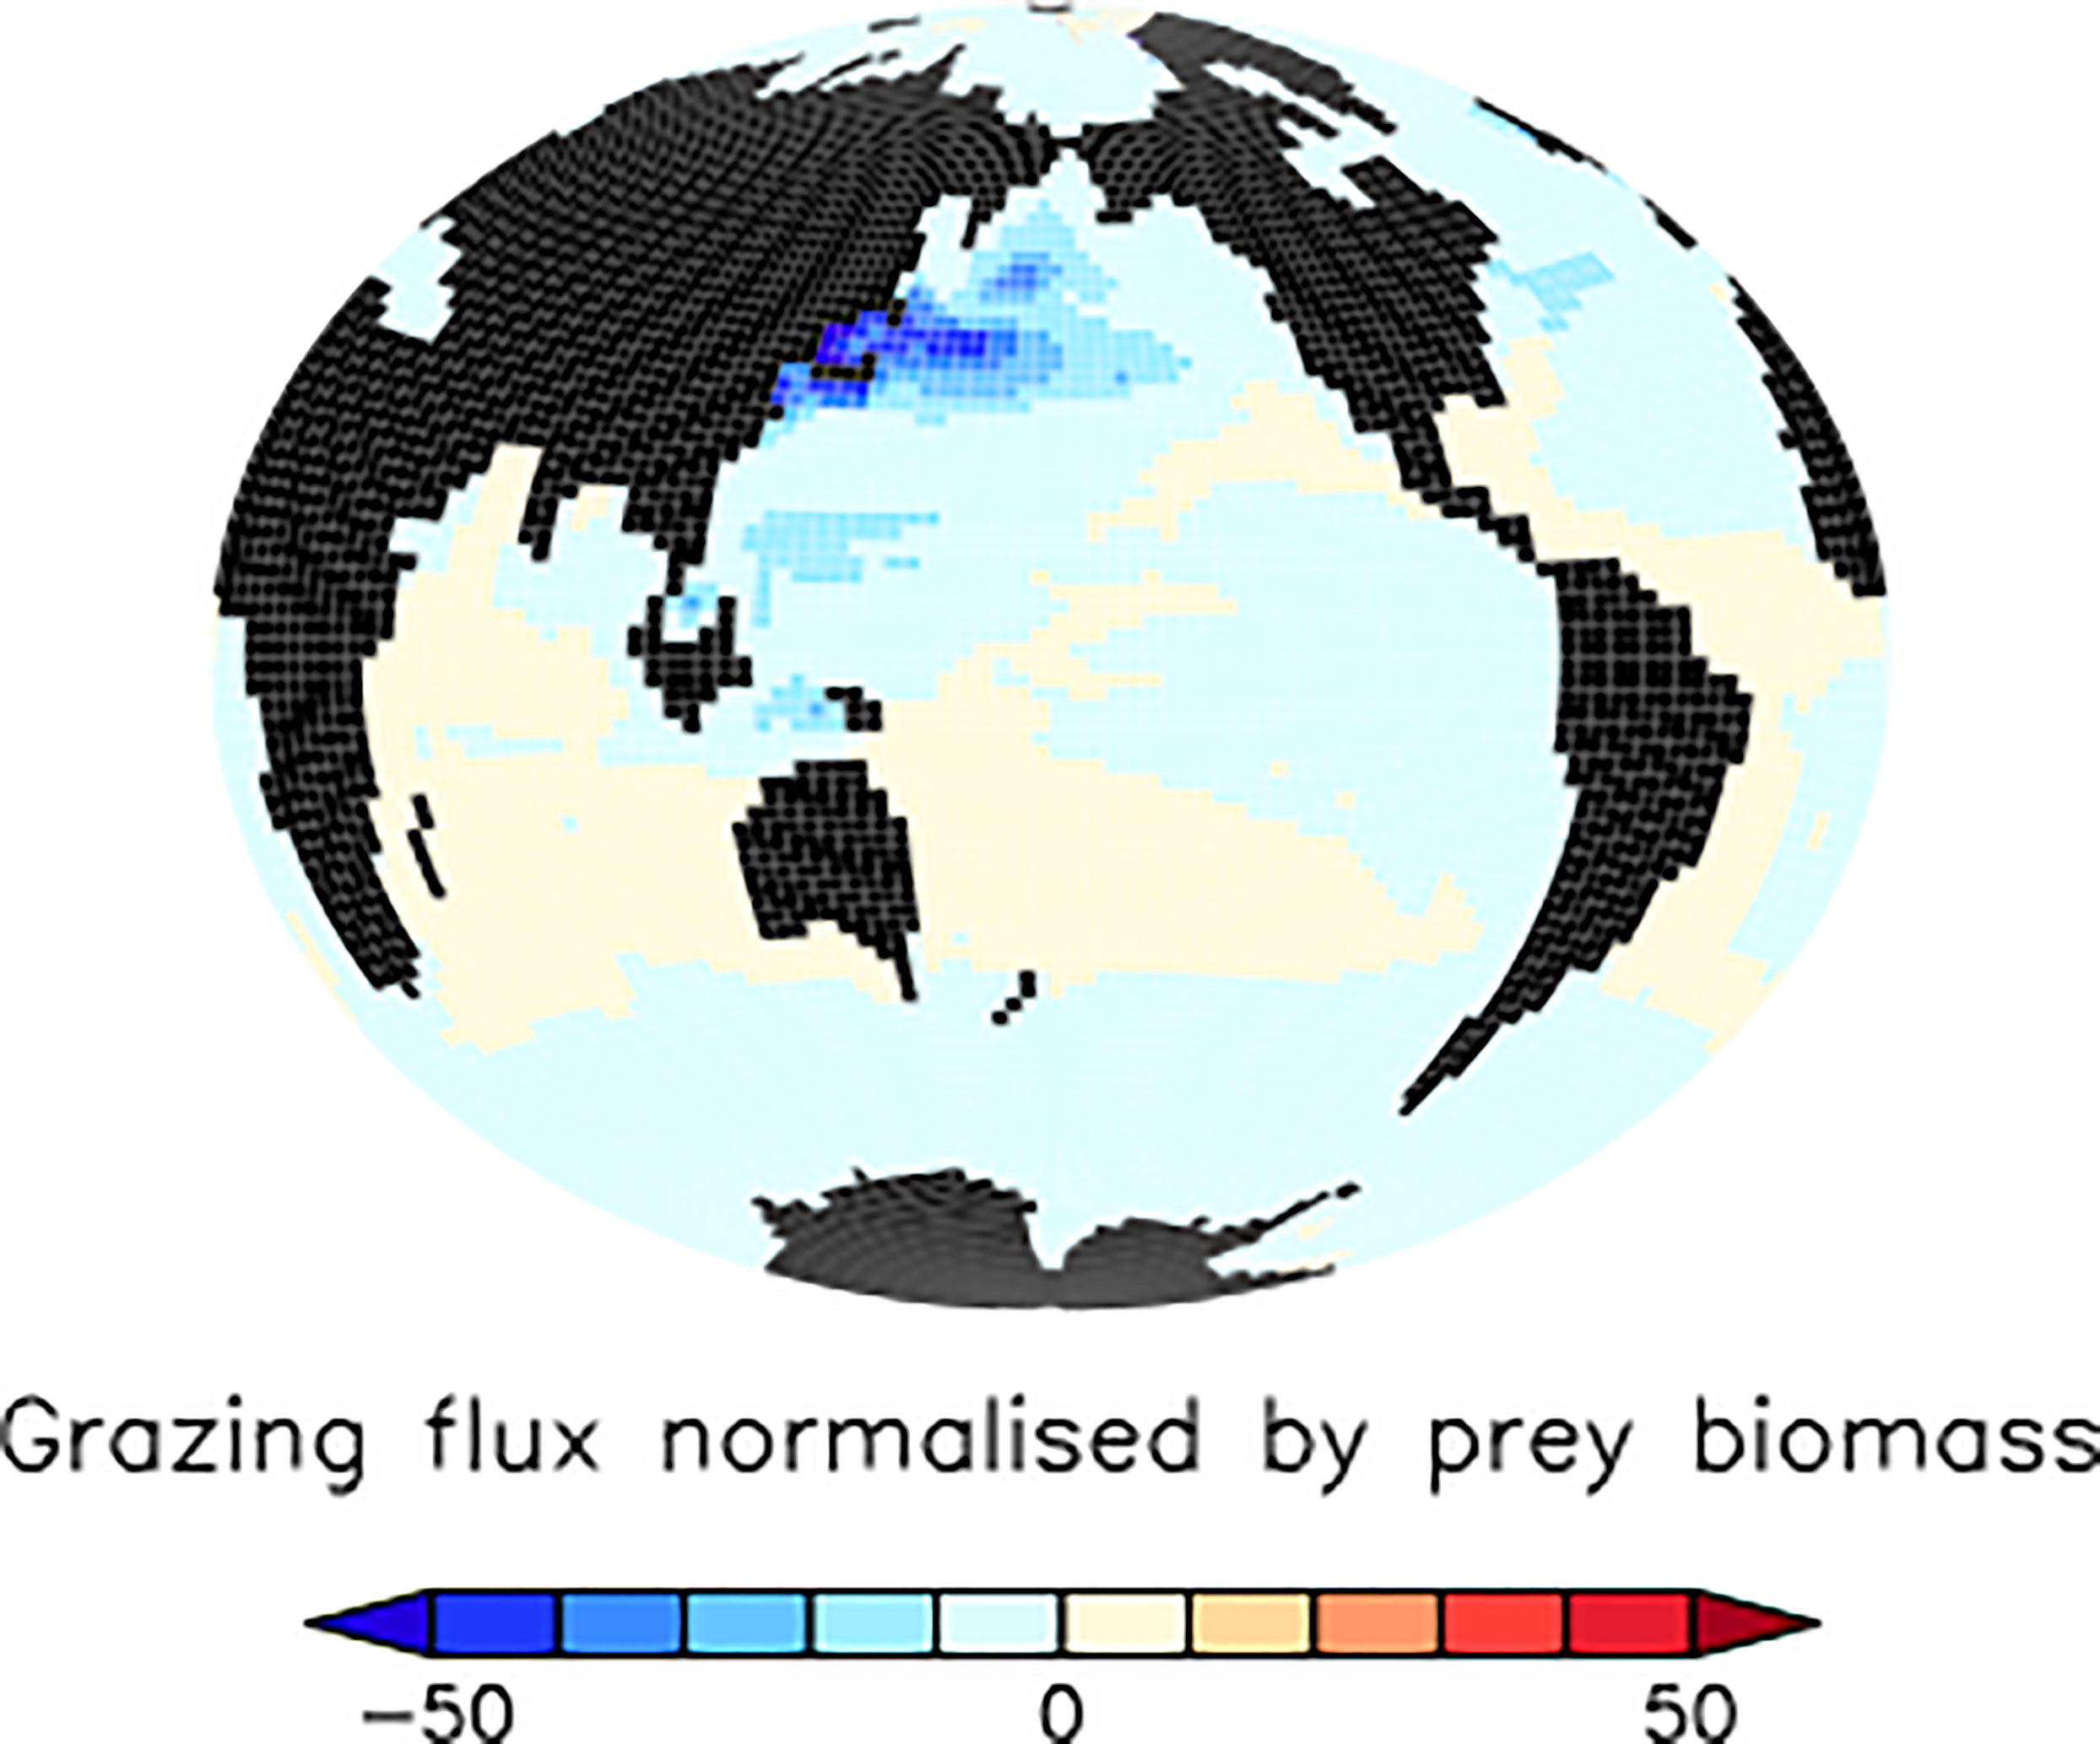
Figure 8 Model ensemble mean differences (SLOWsmall - CNTL) in simulated annual grazing flux of organic matter normalised by prey biomass (per year) at the year 2100. This metric approximates top-down grazing control on ecosystems, where negative values indicate a reduction of grazing control in SLOWbig relative to CNTL.
3.1.4 Robust loss of top-down control on polar ecosystems
The exaggerated loss of top-down control on subpolar and polar ecosystems appears to be the only robust model result in our SLOWbig ensemble (Figure S1), with a more than 10x larger mean ensemble response that also extends to the Southern Ocean when a larger microplastic particle size (and therefore, stronger slowing of pellets per microplastic particle) is assumed. In the subtropical and tropical ocean, members of the SLOWbig ensemble do not agree on even the sign of the response in all types of detrital flux to slowed pellet sinking by microplastic incorporation, which suggests a close balance between the counteracting effects of slowed pellet sinking increasing upper ocean nutrient concentrations and zooplankton ingestion of microplastic causing a loss of upper ocean nutrient recycling when larger plastic particle mass is assumed. This lack of inter-model ensemble agreement in SLOWbig detrital flux response extends to low latitude net primary productivity and nitrogen fixation (Figure S2). As with SLOWsmall but to a greater extent, surface nutrients in the high latitudes in SLOWbig are strongly reduced in ensemble average by the alleviation of top-down control (Figure S3), although not all ensemble members agree in sign of the response and a large standard deviation also exists in the response across members, suggesting again high sensitivity of surface nutrient response to microplastic particle mass assumption blue
3.1.5 Mitigation of climate warming impacts
The detrital flux changes reported above occur against a background of generally declining organic particle fluxes in the middle and low-latitudes due to climate warming (CNTL; Figure 4, bottom row). The CNTL simulations also include the biogeochemical response of ecosystems to zooplankton ingestion of microplastic as described by Kvale et al. (2021), which generally act to exacerbate the organic particle export effects of climate warming (enhanced export in nutrient replete regions, reduced export in nutrient limited ones). The reason for the CNTL decline in organic particle flux over most of the global ocean is both the expansion of stratification (Kvale et al., 2020a; Kvale and Oschlies, 2022), and the declining upper ocean zooplankton excretion of nutrients (Kvale et al., 2020a; Kvale et al., 2020b), both of which increase nutrient limitation for primary producers. In our model, nitrate is the major growth limitation factor for phytoplankton across most of the middle to low latitudes (Figure 5) and both mechanisms strengthen this limitation. The increase in net particle fluxes over most of the global ocean due to slowed pellet sinking (Figure 4) is thus more accurately described as “less-of-a-decrease”, or a mitigation of the climate warming/zooplankton ingestion response. When faecal pellet sinking rates slow due to microplastic contamination, this shoals pellet remineralisation (See Section 3.2 below) and shortens the recycling time of their nutrients back into phytoplankton. Climate change induced nutrient limitation is thus somewhat alleviated in the subtropical and tropical ocean, North Pacific and North Atlantic. However, in the Southern Ocean and tropical upwelling zones the model response to slowed pellet sinking slightly enhances the larger climate-induced detrital trends (Figure 4). In the eastern tropical Pacific, it is the locally expanded nitrate deficiency (Figure 6) that further reduces already declining detrital export. In the Southern Ocean, it is the additional loss of top-down control on primary producers (Figure 8) that further encourages growth already accelerated by warming temperatures.
3.1.6 Strongest ecosystem impacts do not overlap with largest microplastic concentrations
The strongest surface nutrient enhancement that occurs as a result of microplastic-slowed faecal pellet sinking is in regions with generally low microplastic concentrations (Figures 6, 9). This is because microplastics accumulate most rapidly in the stratified surface regions (regions with low biological productivity attributable to strong nutrient limitation; Figure 5). Shoaling of pellet remineralisation in these regions provides additional nutrients to the surface that are rapidly taken up by biological activity, so a net nutrient enhancement is not apparent (Figure 6). It is the regions that are light limited (Figure 5); the Southern Ocean, North Pacific and Atlantic, parts of the Indian Ocean, which demonstrate an enhancement of surface nutrients because phytoplankton do not exploit the additional nutrients completely. In our model, iron limitation is prescribed as a seasonally cyclic limitation factor not affected by particle remineralisation (Keller et al., 2012). Thus, iron-limited regions in our model respond more similarly to regions that are light or temperature limited (and, ultimately, top-down limited by grazing).
3.1.7 Microplastic surface concentration trends are not robust
We find no coherent ensemble response of microplastic surface concentrations to slowed pellet sinking (Figure 9, shaded regions) despite robust responses in the biogeochemistry. Robust net increases in North Pacific, low latitude, and Southern Ocean detrital fluxes (Figure 4) result in both relative increases and decreases in surface ocean microplastic concentrations. A lack of biogeochemical dependence on surface microplastic concentrations has been reported for this model previously (Kvale et al., 2021; Kvale and Oschlies, 2022) and can be explained by the relatively fast interaction timescales of microplastic and biological processes, which saturate these interactions at fairly low microplastic concentrations. This result has important implications for monitoring, as it demonstrates that it might not be possible to ascertain from ambient microplastic concentrations whether (or to what degree) biogeochemical fluxes are impacted by plastic pollution.
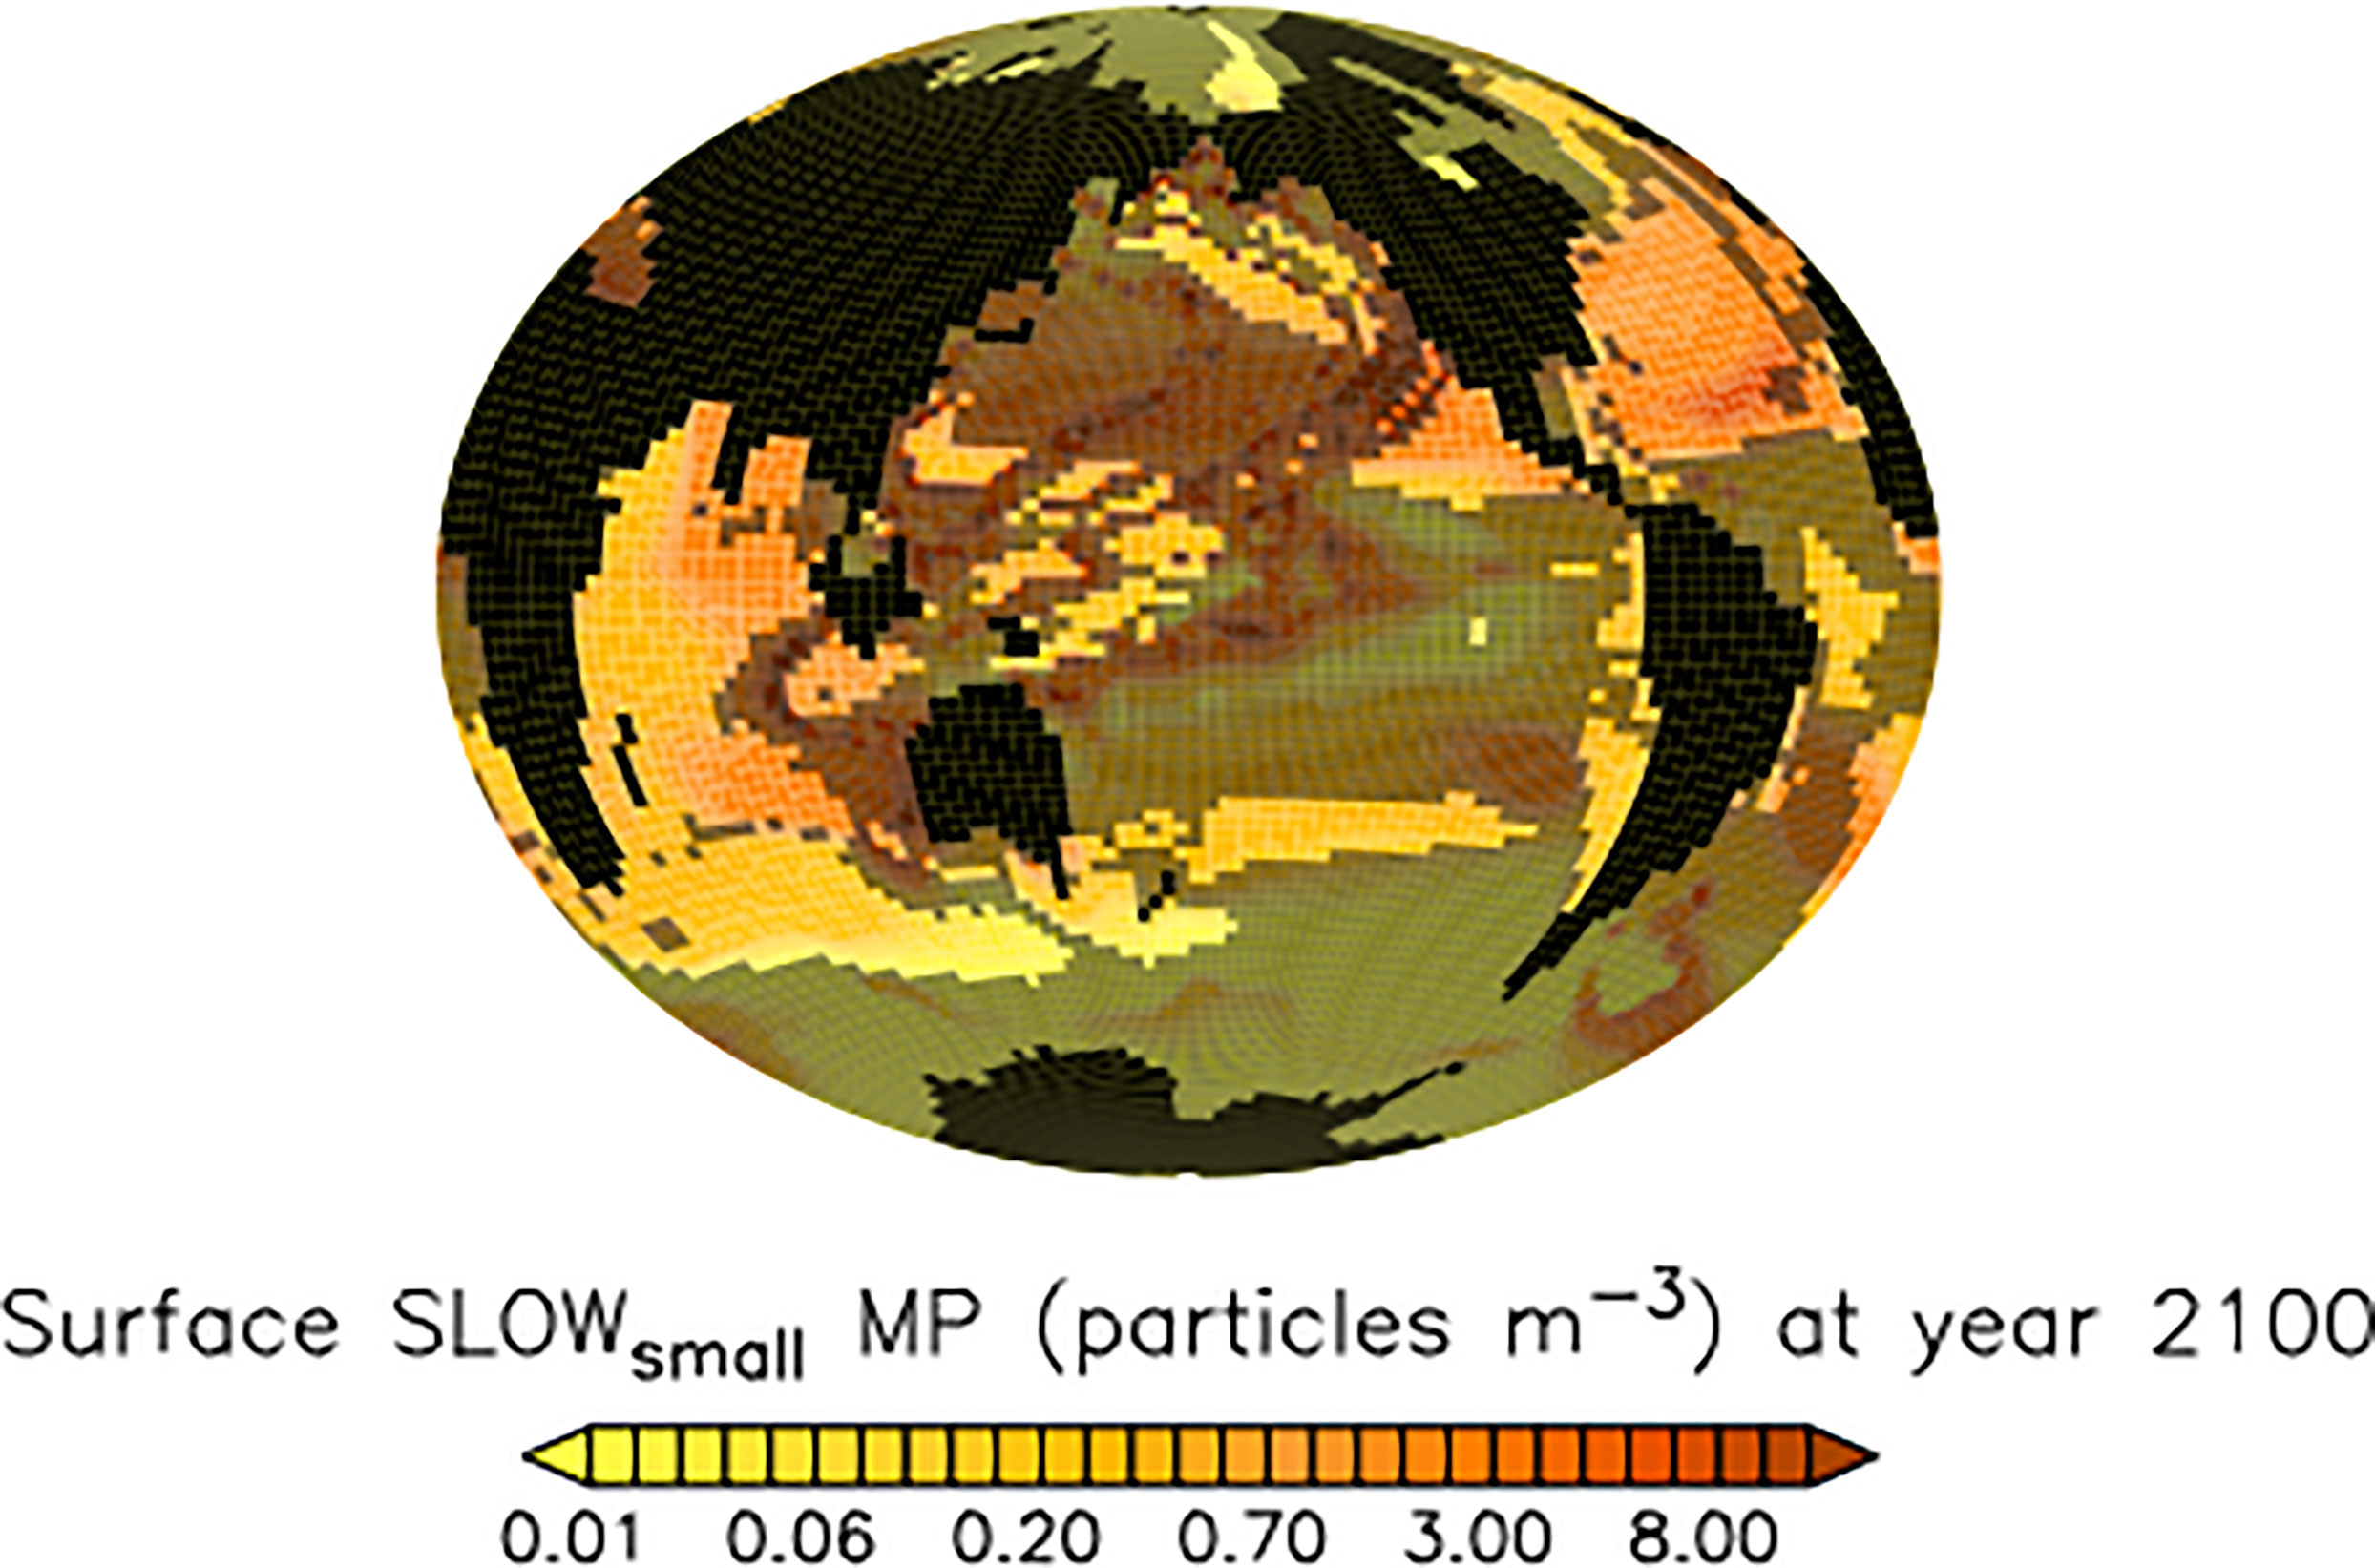
Figure 9 Model ensemble mean microplastic surface concentrations (SLOWsmall) at the year 2100. Shaded regions are highly variable in magnitude across the model ensemble and also do not agree in sign with respect to concentration response.
3.2 Globally coherent carbon cycle responses to ecosystem changes
The ecosystem response to the slowing of faecal pellet sinking by microplastic determines the response in air-sea gas exchange of carbon. In our simulations, calcifying phytoplankton in the tropics benefit from surface nutrient additions caused by shoaled pellet remineralisation, and calcium carbonate (CaCO3) production is generally enhanced (Figure 10).
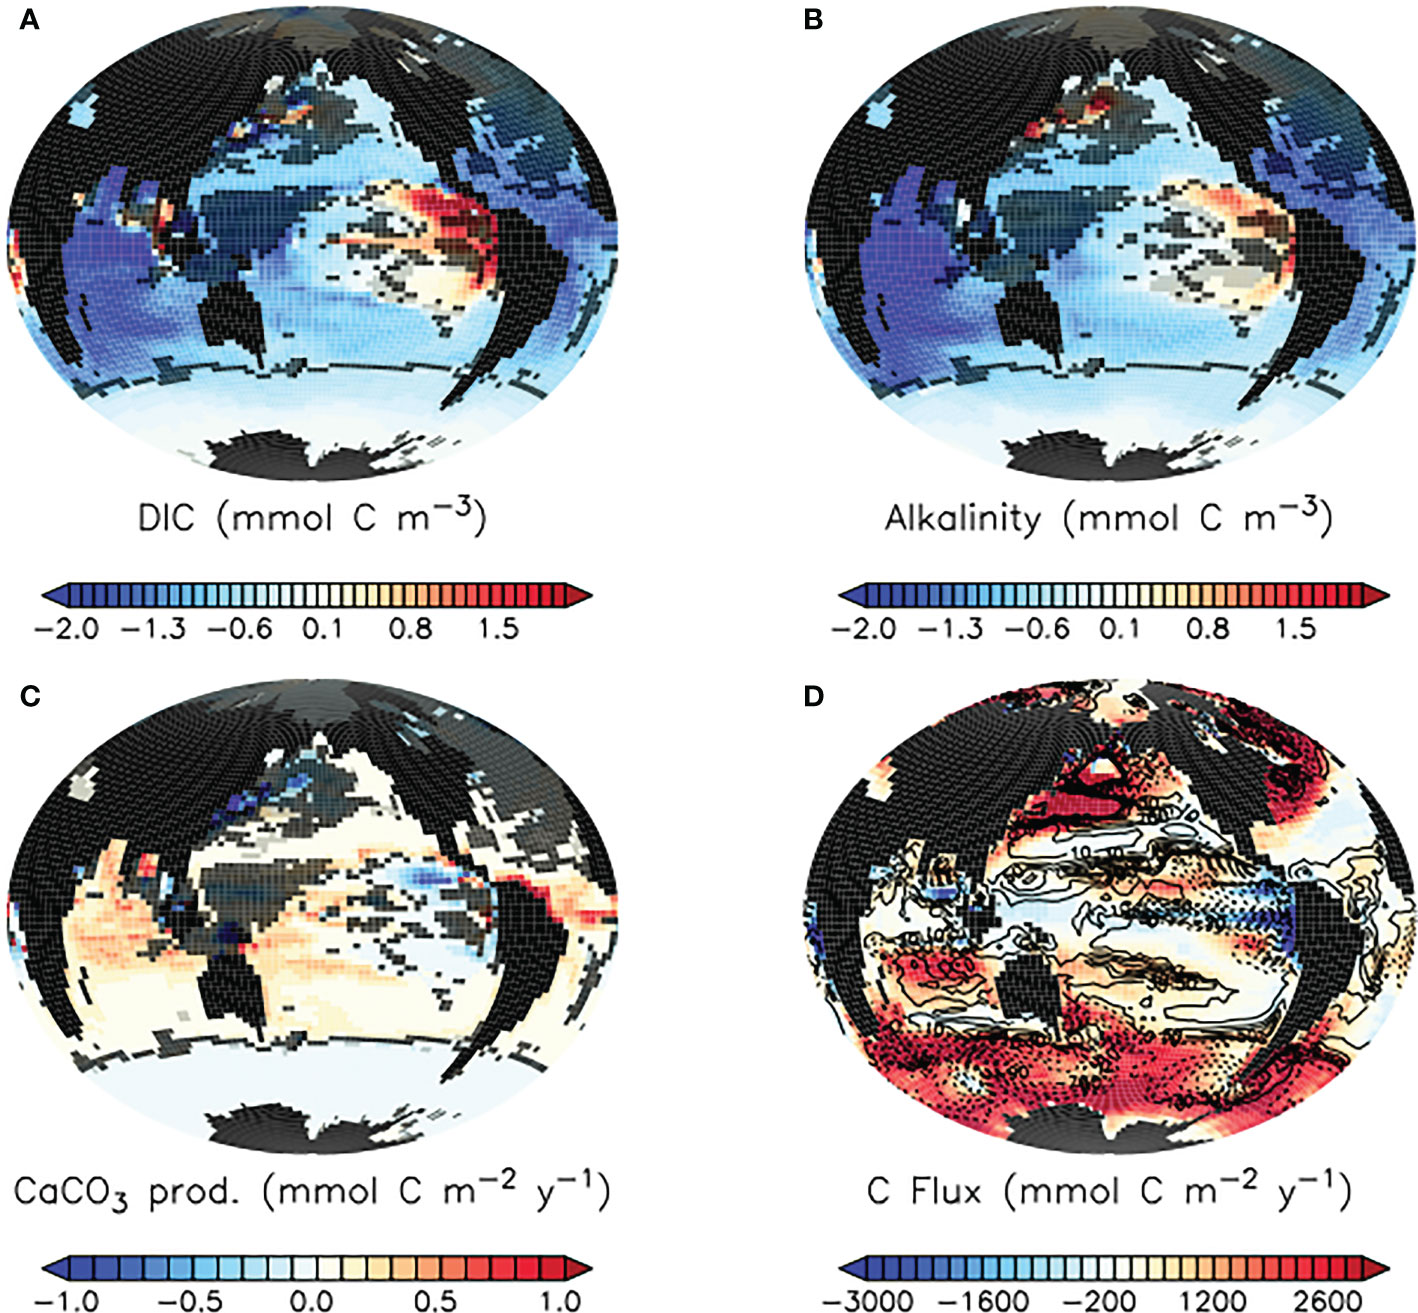
Figure 10 Model ensemble mean differences (SLOWsmall - CNTL) in simulated surface dissolved inorganic carbon (A), alkalinity (B), and carbonate production by plankton (C), and SLOWsmall model ensemble mean air-sea carbon fluxes (D) at the year 2100. In (A–C), model response in regions shaded in light grey are highly variable in magnitude across the model ensemble. Model response in regions shaded in dark grey do not agree in sign across the model ensemble. In panel D,positive values represent fluxes into the ocean while negative values are fluxes out of the ocean. Overlaid in panel (D) are SLOWsmall - CNTL model ensemble mean carbon flux differences in mmol C m-2 y-1. Dashed contours indicate enhanced carbon outgassing in blue shaded regions, and reduced carbon uptake in red shaded regions. Differences in SLOWbig - CNTL are provided as Supplemental Figure S4.
3.2.1 Robust reduction of ocean carbon buffer
Carbonate production consumes alkalinity, and our model demonstrates a robust SLOWsmall ensemble loss of surface alkalinity across the middle and low latitude ocean as a response to the slowing of faecal pellet sinking by microplastic contamination (Figure 10). The largest alkalinity losses occur in the tropical and subtropical ocean, where our model simulates high rates of calcification and the largest increases in calcification. In the Pacific, the severity of the surface alkalinity suppression in SLOWsmall relative to CNTL is mitigated by the decreased calcification in the eastern tropical upwelling zones. Enhanced upper-ocean remineralisation due to shoaled pellet sinking also has a secondary reducing influence on surface alkalinity, but enhanced remineralisation does not lead to higher surface concentrations of dissolved inorganic carbon (DIC) (Figure 10). The reason for this is twofold. Firstly, the reduction of surface alkalinity by enhanced calcification reduces the ocean surface buffer, which reduces the ability of the surface ocean to “hold” DIC and thus lowers its concentration. A reduced buffer slows the flux of carbon from the atmosphere into the ocean in regions of carbon uptake, such as western boundary currents (Figure 10). Secondly, regions of net flux of carbon out of the ocean, such as tropical upwelling zones, experience enhanced air-sea gas exchange when pellet remineralisation is shoaled (Figure 10), leaving less DIC to advect downstream at the surface. Thus, while regional differences in net particle flux response arise due to microplastic contamination of faecal pellets, a globally coherent reduction of surface ocean buffer and response towards enhanced carbon storage in the atmosphere emerges. These responses are robust across the SLOWsmall model ensemble, and magnitudes do not vary significantly except for in the western tropical Pacific, parts of the North Pacific, and North Atlantic (where calcification response sign does not agree across all members). Fortunately, the net effect on global air-sea gas exchange is small in the context of anthropogenic forcing and result in a reduction by 4.44 Pg C of CO2 taken up by the ocean between 1950 and 2100 in SLOWsmall relative to CNTL in ensemble average, 0.24% of the total fossil carbon emissions over this time.
Because the SLOWbig ensemble does not demonstrate a robust low latitude impact of slowed pellet sinking on detrital fluxes, it also does not demonstrate a coherent increase in calcification and consequent decline in low latitude surface DIC and alkalinity, except for regionally in the Indian Ocean (Figure S4). In this set of model simulations, it is the release of top-down control on Southern Ocean primary producers (which reduces regional calcifier populations in favour of ordinary phytoplankton) that increases surface alkalinity and DIC and leads to an increase in the Southern Ocean and North Pacific buffer. Atmospheric CO2 uptake by the ocean is consequentially enhanced by an ensemble average of 11 Pg C over the 1950 - 2100 period.
3.2.2 Small reduction in ocean biological carbon storage
Below the ocean’s surface, the imprint of the biological carbon pump is approximated using apparent oxygen utilisation (AOU = O2sat – O2, the deviation of actual oxygen concentration from saturation). Higher values of AOU indicate greater amounts of remineralised carbon (Koeve et al., 2020), with the subsurface tropical ocean and North Pacific being two important locations of carbon storage in this form (Figure 11). At year 2100, the slowing of faecal pellet sinking by microplastic contamination and resulting ecological response has increased upper ocean AOU above 1000 meters depth on zonal average, and reduced it below. The impact on Southern Ocean-sourced AOU is somewhat stronger in the SLOWbig ensemble (Figure S5), due to the enhanced detrital export from this region in that configuration. However, across all models in both SLOW ensembles the simulated responses of AOU to slowed pellet sinking are very small (less than a 1% change) relative to background values. In comparison, zonal mean AOU values in CNTLclim at year 2100 (Figure 11, right column) reveal a 1-2 orders of magnitude greater sensitivity to climate warming over this time period.
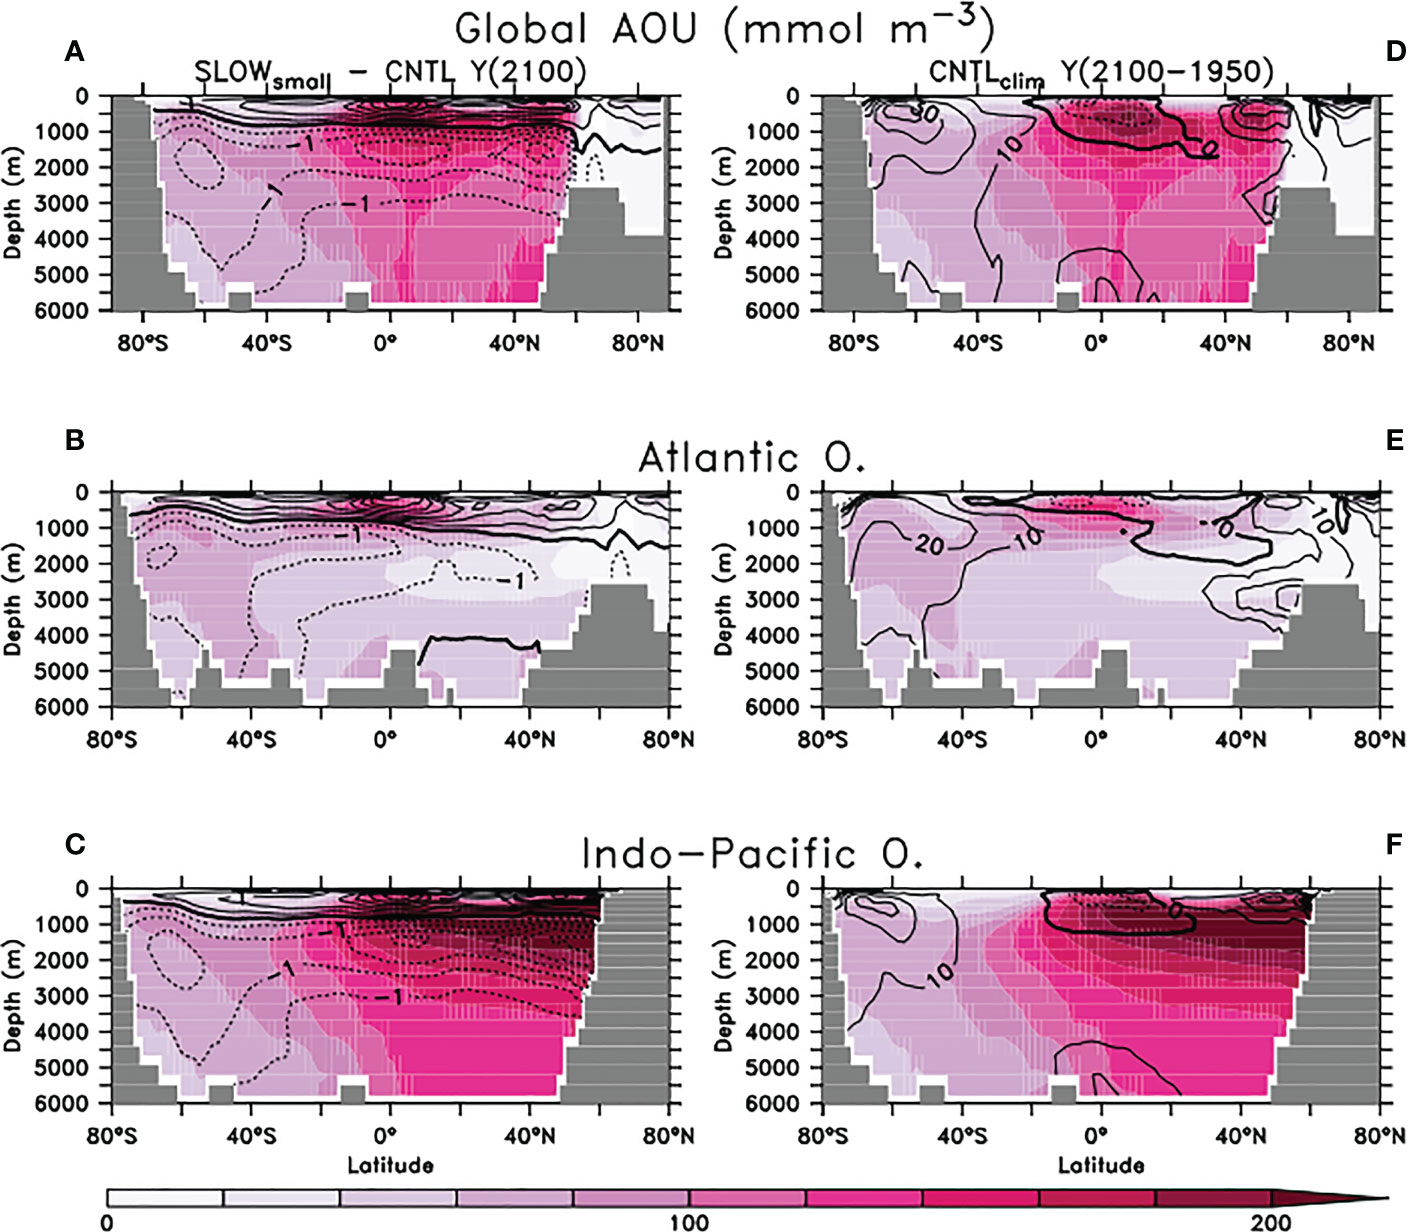
Figure 11 Panels (A–C): SLOWsmall model ensemble zonal mean apparent oxygen utilisation (AOU) at year 2100 globally (A), Atlantic (B), and Indo-Pacific (C). Overlaid are SLOWsmall - CNTL model ensemble zonal mean AOU differences in mmol O2 m-3. Dashed contours indicate reduced oxygen utilisation. AOU in SLOWbig is provided as Supplemental Figure S5. (D–F) CNTLclim zonal mean AOU at year 2100, separated by basin as with panels (A–C). Overlaid is the CNTLclim AOU change between years 1950 and 2100.
3.3 Significance of the biogeochemical responses
In the previous sections we demonstrate that the alteration of ecosystems, particle fluxes, and biogeochemical cycling that results from microplastic slowing of faecal pellet sinking has only a small impact on global air-sea carbon exchange. How significant are these changes regionally?
3.3.1 Slowed pellet fluxes mitigate climate warming impacts
Figure 12 provides climate change context to the alteration of organic particle fluxes at the year 2100. In the SLOWsmall ensemble average, the slowing of faecal pellets by microplastic increases net particle fluxes at 130 m depth by as much as 50% of their year 2100 rates, with the proportionally largest changes to fluxes in regions with only very small background rates, such as the relatively unproductive subtropical gyres. This influence can be compared to the ongoing effects of climate warming in CNTLclim (not including any influences of microplastic ingestion on zooplankton), shown in Figure 12 between the years 1950 and 2100. Climate warming over this time has a comparable magnitude influence on organic particle fluxes in these low productivity regions. Over most of the global ocean the slowing of faecal pellets by microplastic has a mitigative influence on particle flux responses to climate warming, although nowhere is the influence sufficient to change the sign of the climate change response. Integrated globally, total detrital fluxes at 130 m depth decrease by 0.58 Pg C annually by the year 2100 due to climate warming only (CNTLclim ), but slowed pellet sinking due to microplastic contamination enhances total detrital fluxes at 130 m depth by 0.16 Pg C at the year 2100 (SLOWsmall - CNTL). Thus, we report a global mitigative influence of slowed pellet sinking on total detrital flux response to climate change of about 28% at the year 2100.
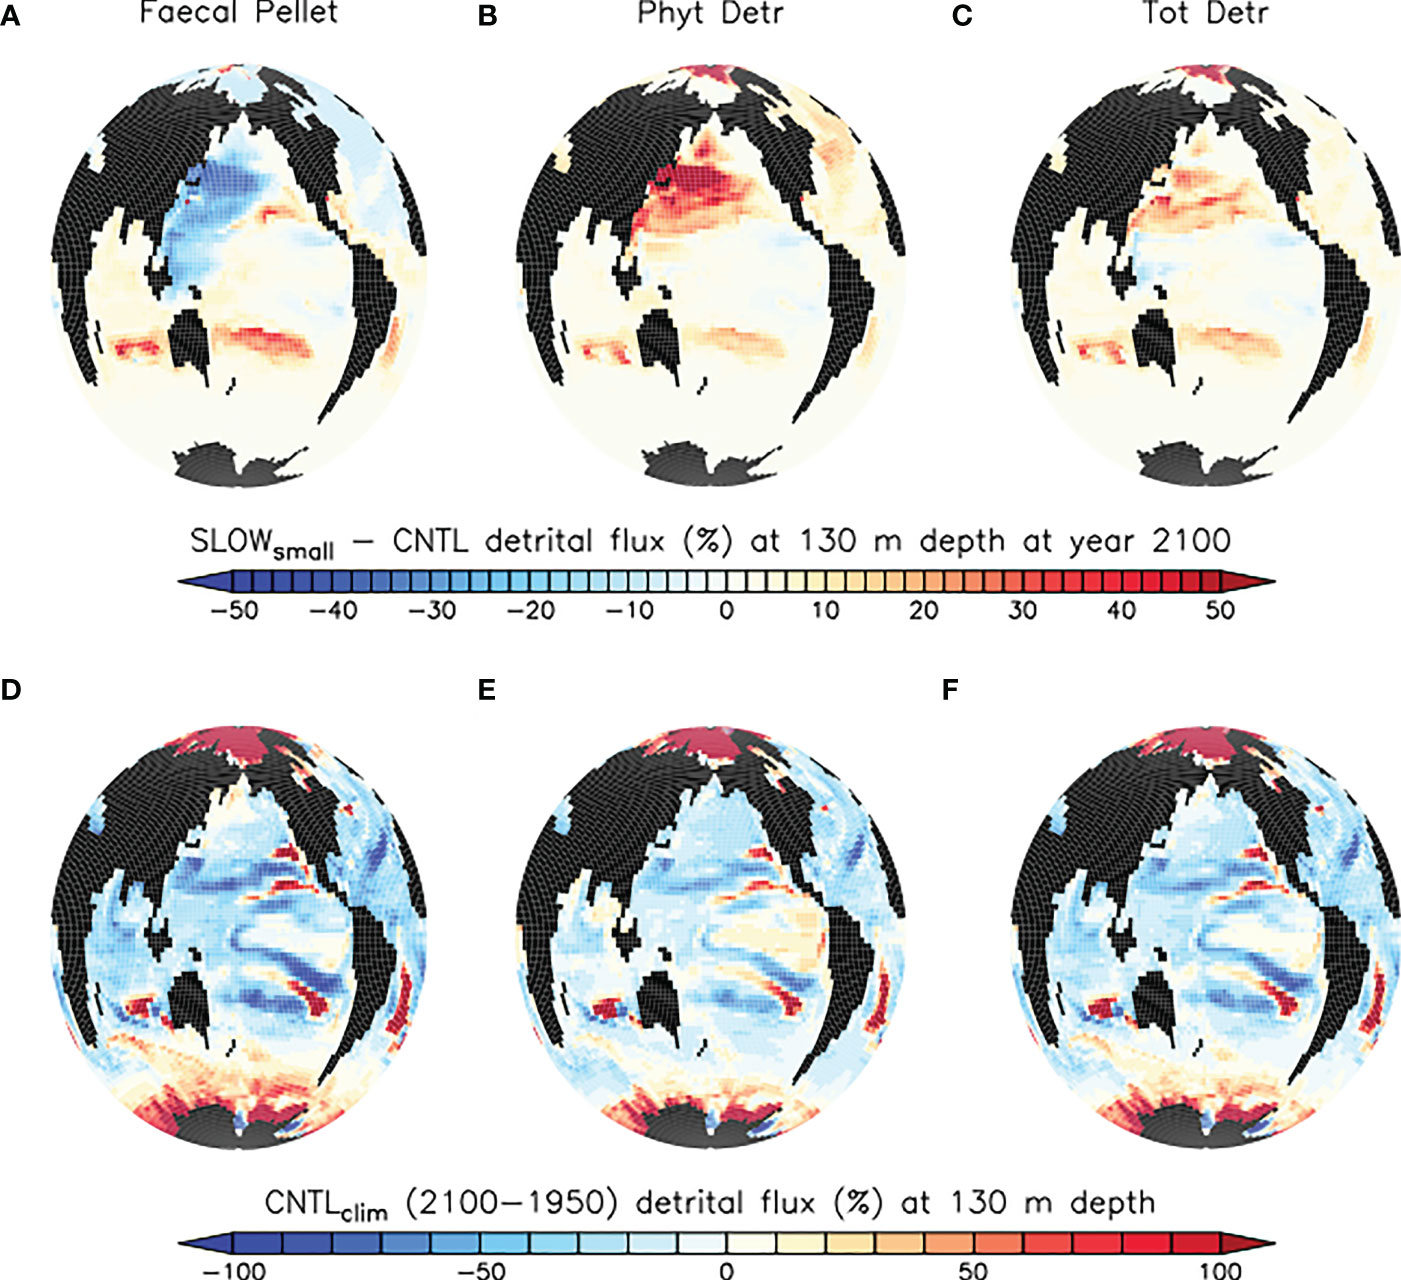
Figure 12 (A–C) model ensemble mean differences (SLOWsmall - CNTL) in simulated organic particle flux at 130 m depth at the year 2100, normalised against CNTL and provided as a percentage. (D–F) changes in particle flux arising due to climate change, CNTLclim years 2100-1950. Note the different scales applied to top and bottom row panels.
3.3.2 Carbon mass framework reveals the greater potency of microplastic
The smaller influence of microplastic pollution than climate warming on ocean biogeochemical change is less reassuring when a carbon mass framework is applied to the analysis. We do this acknowledging the widespread application of emission metrics to non-CO2 greenhouse gases to estimate the radiative forcing, temperature change or other climatic effects that arise from them in a CO2-equivalent framework (Masson-Delmotte et al., 2021). Instead of comparing radiative forcing or temperature change per unit of mass of material, we instead examine the potential for ecosystem or biogeochemical change over 151 years per mass of carbon released to the environment over that time.
Consider that between 1950 and 2100, the SLOWsmall ensemble average microplastic particle release is 7.35 × 10¹⁶ microplastic particles, or 0.015 Pg of plastic. If it is assumed that plastic is generally 83% carbon (Stubbins et al., 2021) this equates to 0.012 Pg C released as microplastic particles to the marine environment over this time. By comparison, the historical forcing plus RCP8.5 atmospheric CO2 scenario over the same time period (1950-2100) has released 1874 Pg C. Figures 13, 14 reveal a more than factor 1000 greater impact of carbon-as-microplastics on particle fluxes and water column AOU per global emissions than carbon-as-greenhouse-gas. This is a crude approximation of carbon impact, because we do not consider equilibration timescales for change, but on the decades and century-scale the microplastics-carbon influence on ecosystems might be considerably stronger than climate warming.
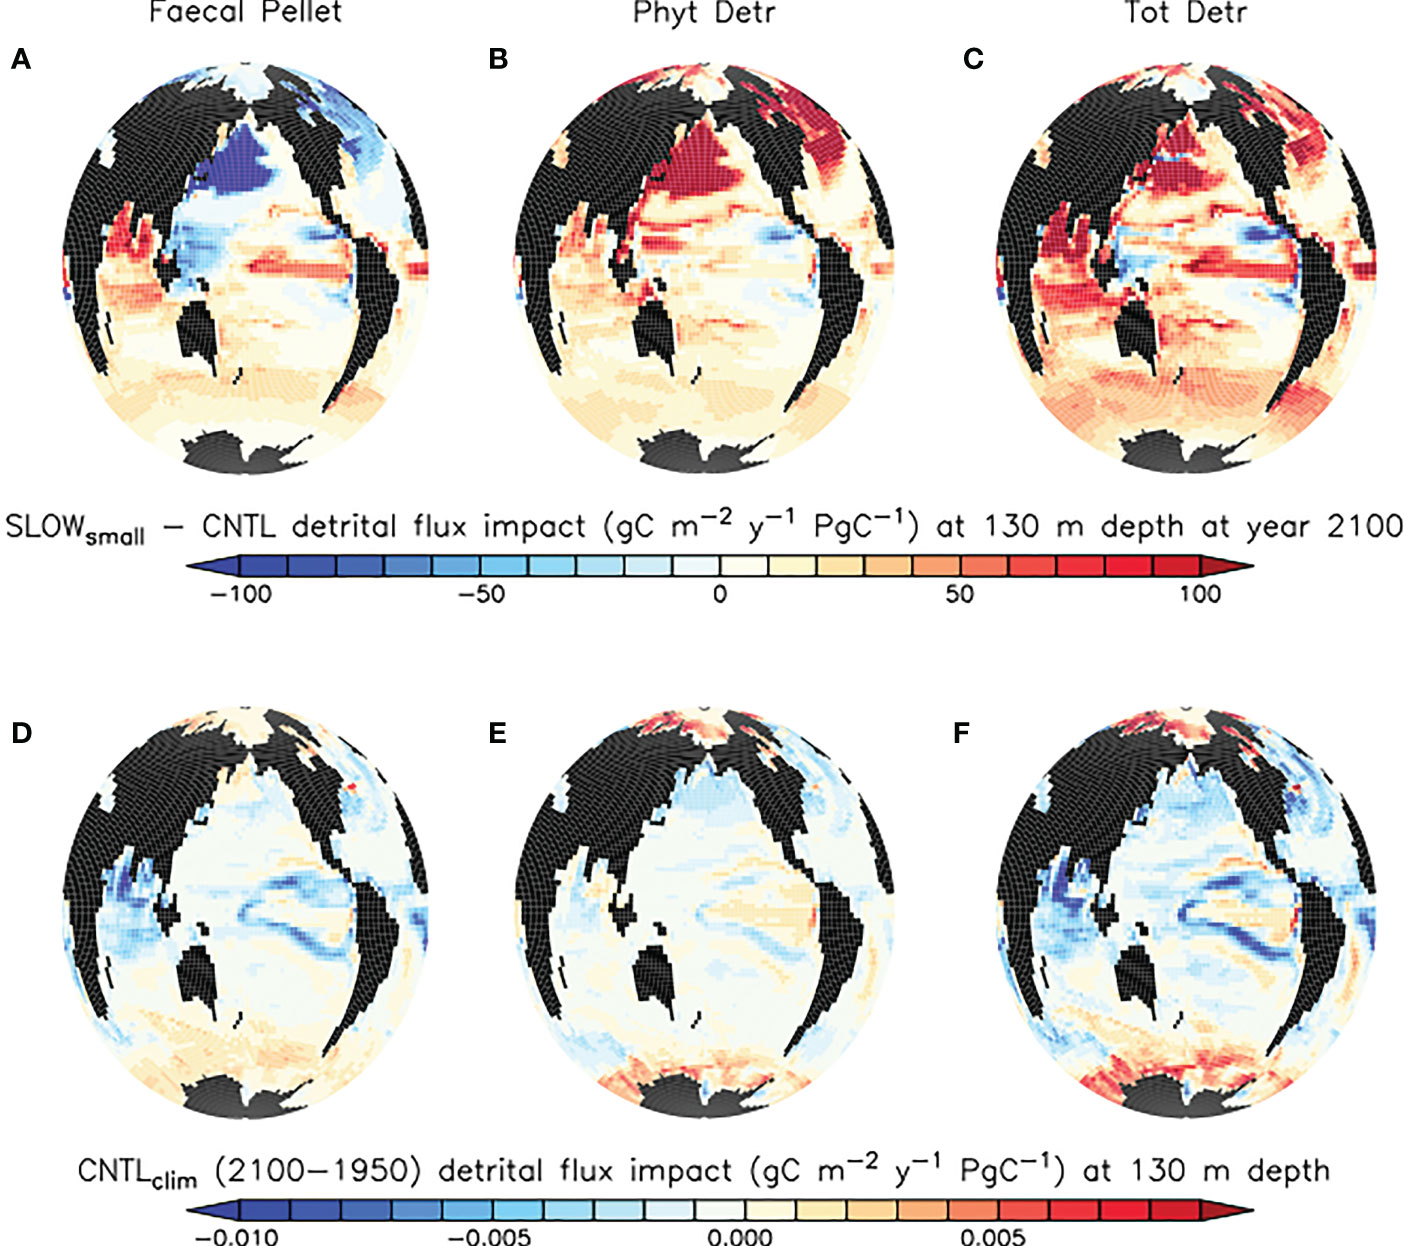
Figure 13 (A–C) model ensemble mean differences (SLOWsmall - CNTL) in simulated organic particle flux at 130 m depth at the year 2100, normalised against model ensemble average cumulative microplastic particle release (in Pg C of plastic). (D–F) changes in particle flux arising due to climate change, CNTLclim years 2100-1950, normalised against cumulative diagnosed carbon emissions over the same time period (in Pg C of CO2 ). Note the different scales applied to top and bottom row panels.
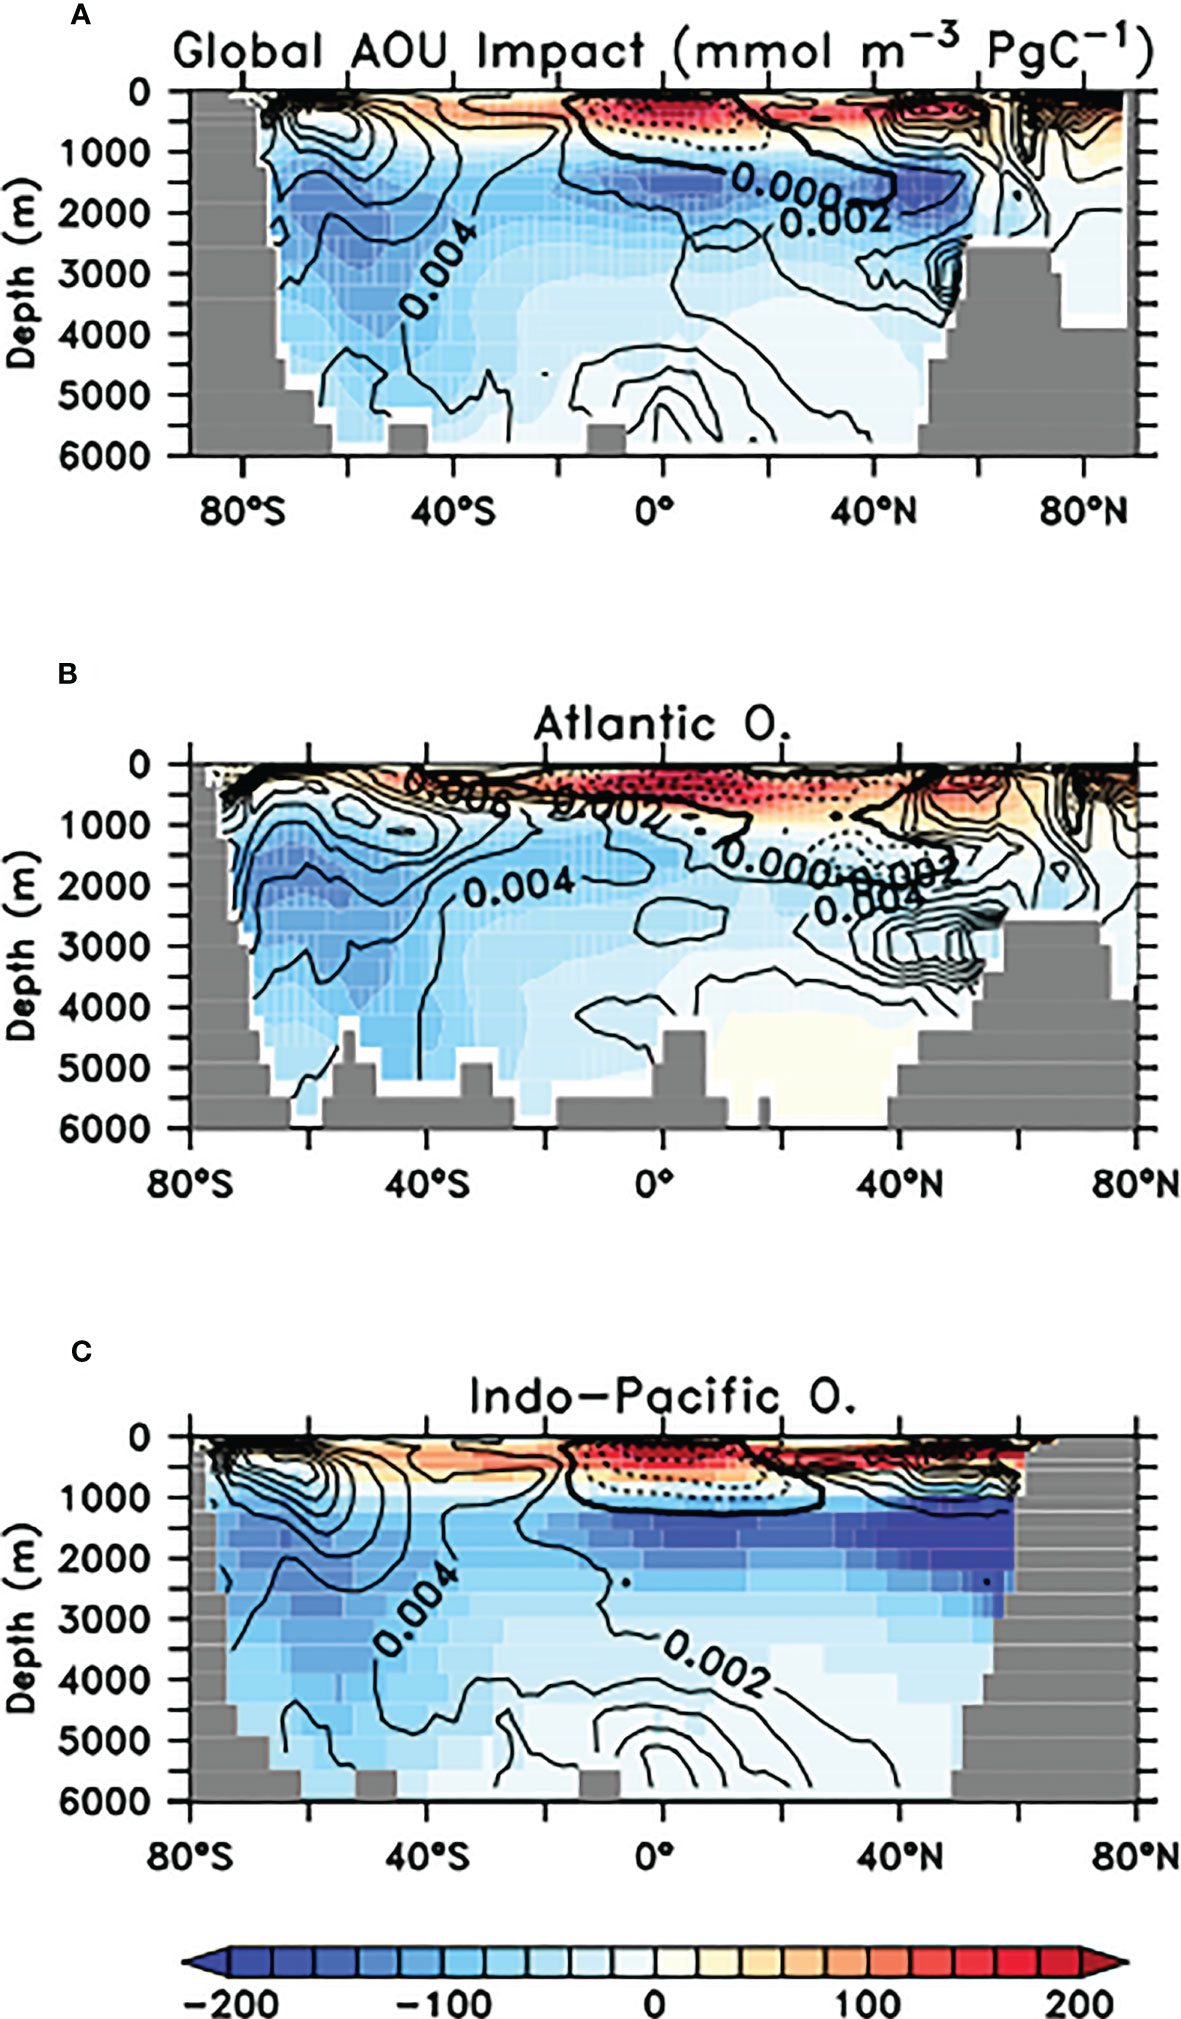
Figure 14 SLOWsmall- CNTL model ensemble zonal mean AOU differences in mmol O2 m−3 at year 2100, normalised against model ensemble average cumulative microplastic particle release globally (in Pg C of plastic; (A)) and by Atlantic (B) and Indo-Pacific (C) Contours shows change in AOU in CNTLclim between years 1950-2100, normalised against cumulative diagnosed carbon emissions (in Pg C of CO2) over the same time period. Dashed contours indicate reduced oxygen utilisation.
4 Discussion
4.1 Summary of impacts, mechanisms and feedbacks
Similar to the previously described deoxygenation from microplastic ingestion by zooplankton (Kvale et al., 2021), we find that ecosystems display divergent responses, depending on whether they are limited by macronutrients or not. The schematic in Figure 15 summarises the ecosystem and carbon export effects that arise from microplastic slowing faecal pellet sinking. Slowed pellet sinking shoals remineralisation and releases both microplastics and nutrients closer to the ocean surface. In regions that are not limited by nutrients, such as the equatorial upwelling zones and high latitudes, additions of nutrients to the surface ocean do not affect primary producers. However, net detrital flux is increased by the erosion of top-down control on primary producers due to a positive feedback loop between zooplankton exposure to microplastic enhancing its ingestion, and slowing pellet sinking rates increasing their exposure. This feedback is prevented in upwelling systems where low-oxygen subsurface waters permit denitrification that limits nitrate availability downstream. In nutrient-limited environments, calcifying phytoplankton benefit from regional additions of nutrients that advect out of nutrient-replete regions as well as local enhancement of surface nutrients due to shoaled pellet remineralisation. Enhanced calcification reduces surface alkalinity and weakens the ocean carbon buffer, which leads to a minor global decrease in atmosphere-to-ocean carbon flux. Shoaled pellet remineralisation in the eastern tropical Pacific and Atlantic upwelling zones simultaneously increases the release of ocean carbon, causing a net shift to carbon held in the atmosphere. However, microplastic particle mass is a key assumption and larger microplastics can alter the balance between mechanisms, preventing the large-scale enhancement of calcification and actually increasing ocean carbon uptake. Thus, understanding ecosystem impacts of microplastics contamination in the real ocean will require careful characterization of both ecosystem structure as well as the microplastics themselves.
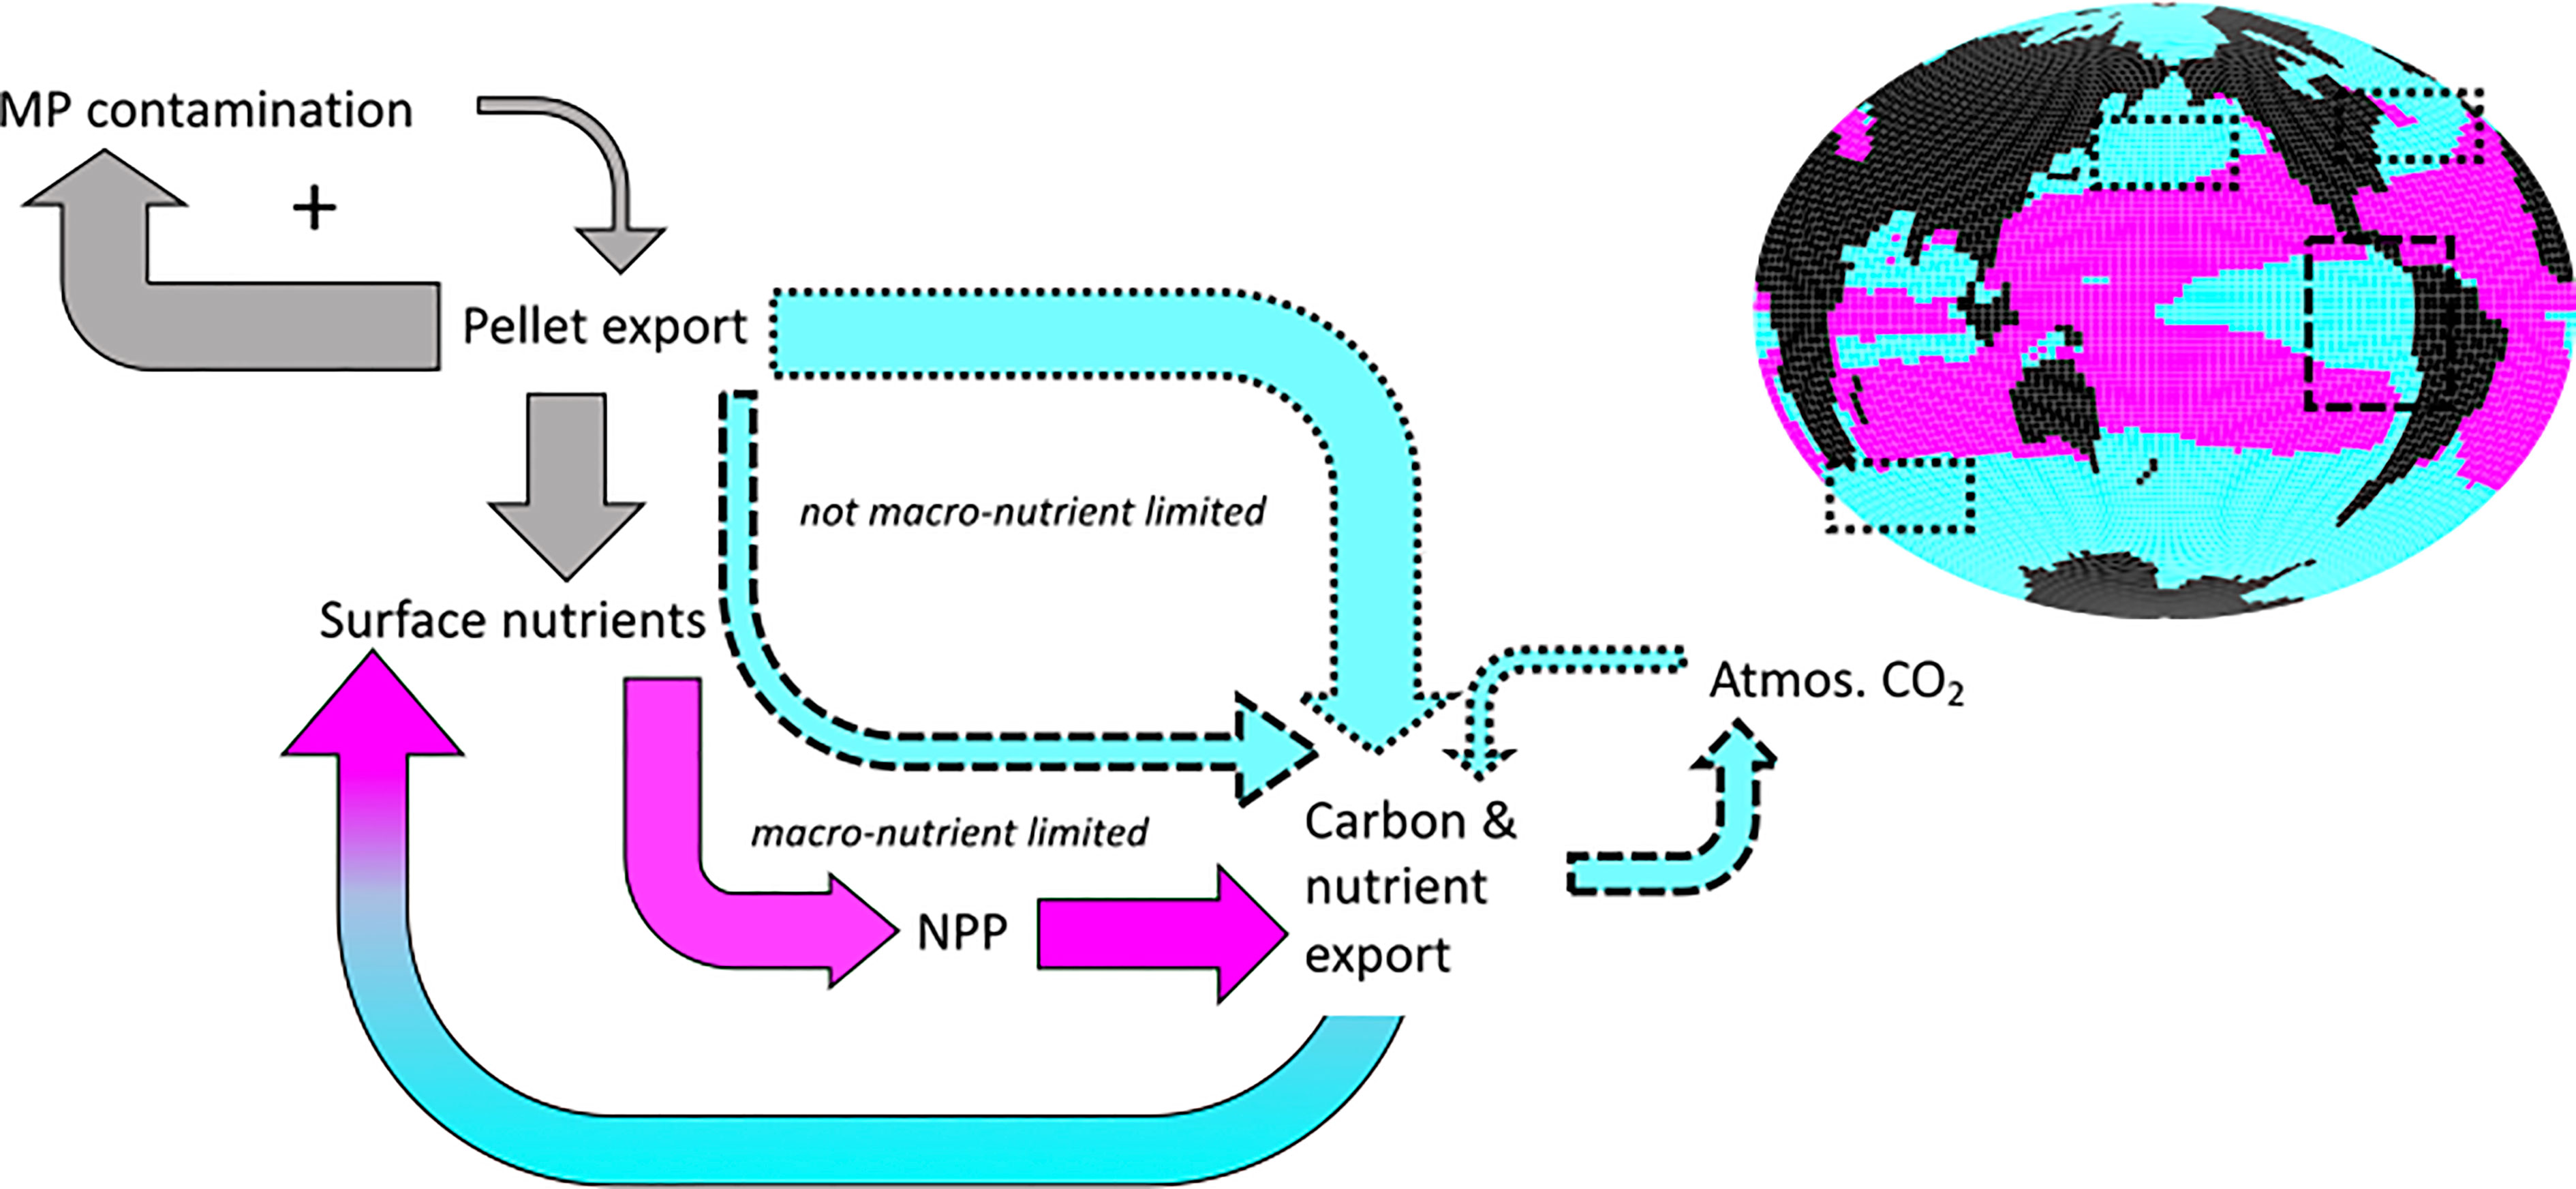
Figure 15 Microplastic biogeochemical effects and feedbacks in SLOWsmall. Increases are shown with fat arrows, decreases are shown with thin arrows. Grey colour denotes global ocean surface effects, blue colour denotes surface effects dominating in nutrient replete regions, and pink colour denotes surface effects dominating in nutrient limited regions. Impacts on air-sea gas exchange are negligible over human timescales. The plus symbol indicates a positive feedback on microplastic contamination.
4.2 Nuanced confirmation of the reduced biological pump efficiency hypothesis
These simulated responses tentatively confirm the hypothesis derived from the Cole et al. (2016) study that a shoaling of pellet remineralisation can weaken the ocean uptake of atmospheric carbon, for smaller-sized microplastic particles. However, it is the adjustment of the whole ecosystem to the slowed pellet sinking that determines the response of air-sea gas exchange over the global ocean. Only the eastern tropical Pacific and Atlantic upwelling zones demonstrate a response similar to what is predicted, in that a shoaling of remineralisation enhances surface DIC and increases ocean carbon release. Elsewhere it is the adjustment of ecological competition between phytoplankton functional types and the reduction of top-down control that determines whether the ocean carbon sink will respond. This result serves as a reminder that extrapolation of experimental results from individual- to global-scale is not always appropriate, as has been noted in other biogeochemical modelling exercises, e.g. Taucher et al. (2022).
We report ecosystem changes due to microplastic-slowed pellet sinking that show both large and small variability across our model ensembles. Impacts in the Southern Ocean and the central tropical and sub-tropical ocean basins tend to be uniform in magnitude and sign across our SLOWsmall ensemble, suggesting that these impacts (regional enhancement of organic particle fluxes, surface nutrients, NPP, and calcification) are robust and relatively quantifiable features of a microplastic-slowed pellet sinking regime. In contrast, corresponding impacts in the high latitude North Atlantic and North Pacific are more variable across the model ensemble and depend more on model parameter values. This robustness discrepancy might be explained bythe dominant mechanism being bottom-up (alleviation of nutrient limitation) in the Southern Ocean and subtropics but top-down (grazing suppression) in the high-latitude North Pacific and Atlantic. What this says about both SLOW model ensembles demonstrating poor agreement with respect to surface microplastics concentration trends is uncertain. Numerical instability of the SLOWbig ensemble was unfortunate and limits our discussion with respect to the impact of plastic mass assumptions, although we note the top-down impacts are apparently more robust than bottom-up impacts in this ensemble. Teasing apart the deeper mechanisms for parameter (in)sensitivities in regional responses is something we leave to the future.
Fortunately, our results suggest that over a century timescale the biological carbon pump responds by no more than about 1% in basin average to a microplastic-slowing of faecal pellet sinking rates. A weakening of remineralized carbon storage in the deep ocean is concerning over multi-century timescales and longer, and it is not clear from our simulations if sustained microplastic pollution would continue to weaken the biological pump over these longer timescales. Answering this question would require the application of microplastic particle breakdown, which our model does not resolve. Over the nearer term, the net air-sea gas exchange is hardly impacted, even when using the larger-sized microplastic particle assumption. This is an anticipated result because neither adjustment of particle fluxes nor the biological pump itself have been demonstrated to influence ocean carbon uptake over human timescales (Koeve et al., 2020; Wilson et al., 2022). Regionally, however, changes to ecosystem function can be significant and of the same order as climate warming impacts, with alteration of phytoplankton detrital fluxes exceeding 50% in the North Pacific and disproportionate impacts on low-productivity gyres. This finding is worrisome, given the amount of carbon released to the surface ocean as microplastic in our simulations is approximately 0.0006% of the amount released as atmospheric emissions over the same time period.
4.3 Model study limitations
Beyond slowed pellet sinking, microplastics have been shown to have other adverse impacts on ocean ecosystems (recently reviewed by Galgani and Loiselle, 2021; Kvale, 2022). Microplastics can reduce zooplankton population size (Shore et al., 2021) by stunting egg production (Heindler et al., 2017) juvenile development (Jeong et al., 2017), and by increasing chance of death (Zhang et al., 2019). Other studies suggest microplastics can reduce growth rates of phytoplankton (Besseling et al., 2014; Sjollema et al., 2016). Microplastic aggregating with marine snow has been shown to increase the rate at which it sinks (Long et al., 2015; Porter et al., 2018). Additionally, microplastics also increase the rate at which marine snow aggregates (Michels et al., 2018). None of these impacts are considered in our modelling framework, but all potentially influence global biogeochemistry. Likewise, our simplistic approach neglects the full characterisation of microplastic polymer types found in the real ocean. Higher-density polymers such as PET have been found deeper in water column sampling (Galgani et al., 2022) and may therefore exert different ecological pressures to the low-density polystyrene we characterise our microplastics as. Polyethylene and polypropylene are less dense and more abundant than polystyrene (Pabortsava and Lampitt, 2020), with possibly a stronger impact on faecal pellet sinking. Likewise, because we do not account for microplastic particle size, our microplastic inventories and the relative exposure of the simulated food web may be considerably different to real-world exposures (Kooi and Koelmans, 2019; Kooi et al., 2021). Better quantification of very small microplastics (Zhao et al., 2022) to nanoplastic distribution and abundances can help to improve this aspect of our model. Neglecting size fractions also means we cannot account for variable egestion or zooplankton-mediated particle breakdown, which would impact the pellet density. Lastly, our model reduces the complex food webs of the real ocean to only three phytoplankton functional types and a single zooplankton grazer, and does not account for the buffering potential of flexible stoichiometry (Tanioka and Matsumoto, 2017) and community adaptation (Martiny et al., 2022), which could reduce the magnitude of our reported ecological impacts.
4.4 Final thoughts
Despite the limitations of our modelling approach we conclude that marine microplastic pollution can influence ecosystems via regionally disparate mechanisms with globally coherent impacts on carbon cycling. These impacts are unlikely to be significant for carbon cycling over the next century, but warrant further investigation over longer timescales and with a larger variety of modelling approaches. Of particular interest to carbon cycling is the impact of environmentally-relevant microplastic contamination on biological calcification. More experimental data on this would be welcome. Other ecological impacts are potentially more significant and of the same order as climate change impacts. In terms of ecological impacts, quantifying the relative strength of multiple disruptive microplastic effects (zooplankton ingestion, slowed pellet sinking, and still others we do not consider here) will be crucial in quantifying net impact. Empirical demonstration that impacts on individuals scale to ecosystem level is expected to remain a challenge until in-situ data collection is improved. Established frameworks in the climate-carbon space, including metrics for assessment of non-CO2 greenhouse gas climate impacts in terms of their CO2 equivalence, can be usefully re-purposed for examining global-scale ecological impacts from plastics contamination. Such metrics that calculate CO2 equivalence (or in our case, carbon equivalence of a potential impact) over a variety of timescales will be vital for defining the planetary boundary threat of plastics (Steffen et al., 2015) and will permit plastics researchers to exploit the rich literature on intolerable climate impacts (e.g. Petschel-Held et al., 1999; Kvale et al., 2012; Steffen et al., 2018) in defining such a boundary. Lastly, our finding of poor correlation between surface microplastic concentrations and ecological perturbation, and a high model dependence on microplastic model parameter values furthermore suggests that any confidence to be gained in estimates of biogeochemical impact must be solidly based in experimental work focussed on parameter estimation. We look forward to future developments in this area.
Data availability statement
The original contributions presented in the study are publicly available. This data can be found here: https://zenodo.org/record/7378987#.Y6HNmnbP1dg.
Author contributions
KK and AJ designed the model experiments. KK wrote the model code and ran the simulations. AJ, KK, CH, WK analysed the model results. KK and CH wrote the paper with comments from WK. All authors contributed to the article and approved the submitted version.
Funding
This project was supported by the New Zealand Ministry of Business, Innovation and Employment (MBIE) through the Global Change through Time programme (Strategic Science Investment Fund, contract C05X1702).
Acknowledgments
The authors would like to acknowledge computer resources made available by Kiel University. Figure plotting used the Ferret plotting programme. Ferret is a product of NOAA’s Pacific Marine Environmental Laboratory.
Conflict of interest
The authors declare that the research was conducted in the absence of any commercial or financial relationships that could be construed as a potential conflict of interest.
Publisher’s note
All claims expressed in this article are solely those of the authors and do not necessarily represent those of their affiliated organizations, or those of the publisher, the editors and the reviewers. Any product that may be evaluated in this article, or claim that may be made by its manufacturer, is not guaranteed or endorsed by the publisher.
Supplementary material
The Supplementary Material for this article can be found online at: https://www.frontiersin.org/articles/10.3389/fmars.2023.1111838/full#supplementary-material
References
Alldredge A. L. (1979). The chemical composition of macroscopic aggregates in two neretic seas1. Limnol. Oceanogr. 24, 855–866. doi: 10.4319/lo.1979.24.5.0855
Alldredge A. L., Silver M. W. (1988). Characteristics, dynamics and significance of marine snow. Prog. Oceanogr. 20, 41–82. doi: 10.1016/0079-6611(88)90053-5
Archer D. (1996). A data-driven model of the global calcite lysocline. global. Biogeochem. Cycles 10, 511–526. doi: 10.1029/96GB01521
Aumont O., Maier-Reimer E., Blain S., Monfray P. (2003). An ecosystem model of the global ocean including fe, Si, p colimitations. Global Biogeochem. Cycles 17, 1060. doi: 10.1029/2001GB001745
Balch W. M. (2018). The ecology, biogeochemistry, and optical properties of coccolithophores. Annu. Rev. Mar. Sci. 10, 71–98. doi: 10.1146/annurev-marine-121916-063319
Berelson W. M. (2001). Particle settling rates increase with depth in the ocean. Deep Sea Res. Part II: Topical Stud. Oceanogr. 49, 237–251. doi: 10.1016/S0967-0645(01)00102-3
Besseling E., Wang B., Lurling M., Koelmans A. A. (2014). Nanoplastic affects growth of s. obliquus and reproduction of d. magna. Environ. Sci. Technol. 48, 12336–12343. doi: 10.1021/es503001d
Butler M., Dam H. G. (1994). Production rates and characteristics of fecal pellets of the copepod acartia tonsa under simulated phytoplankton bloom conditions: Implications for vertical fluxes. Mar. Ecol. Prog. Ser. 114, 81–91. doi: 10.3354/meps114081
Cole M., Lindeque P. K., Fileman E., Clark J., Lewis C., Halsband C., et al. (2016). Microplastics alter the properties and sinking rates of zooplankton faecal pellets. Environ. Sci. Technol. 50, 3239–3246. doi: 10.1021/acs.est.5b05905
Coppock R. L., Galloway T. S., Cole M., Fileman E. S., Queiros A. M., Lindeque P. K. (2019). Microplastics alter feeding selectivity and faecal density in the copepod, calanus helgolandicus. Sci. total Environ. 687, 780–789. doi: 10.1016/j.scitotenv.2019.06.009
Eby M., Zickfeld K., Montenegro A., Archer D., Meissner K. J., Weaver A. J. (2009). Lifetime of anthropogenic climate change: Millennial time scales of potential CO2 and surface temperature perturbations. J. Climate 22, 2501–2511. doi: 10.1175/2008JCLI2554.1
Eriksen M., Lebreton L. C. M., Carson H. S., Thiel M., Moore C. J., Borerro J. C., et al. (2014). Plastic pollution in the world’s oceans: More than 5 trillion plastic pieces weighing over 250,000 tons afloat at sea. PloS One 9, 1–15. doi: 10.1371/journal.pone.0111913
Fischer R., Lobelle D., Kooi M., Koelmans A., Onink V., Laufkotter C., et al. (2022). Modelling submerged biofouled microplastics and their vertical trajectories. Biogeosciences 19, 2211–2234. doi: 10.5194/bg-19-2211-2022
Galgani L., Goßmann I., Scholz-Bottcher B., Jiang X., Liu Z., Scheidemann L., et al. (2022). Hitchhiking into the deep: How microplastic particles are exported through the biological carbon pump in the north atlantic ocean. Environ. Sci. Technol. 56, 15638–15649. doi: 10.1021/acs.est
Galgani L., Loiselle S. A. (2021). Plastic pollution impacts on marine carbon biogeochemistry. Environ. Pollut. 268, 115598. doi: 10.1016/j.envpol.2020.115598
Galloway T. S., Cole M., Lewis C. (2017). Interactions of microplastic debris throughout the marine ecosystem. Nat. Ecol. Evol. 1, 116. doi: 10.1038/s41559-017-0116
Geyer R., Jambeck J. R., Law K. L. (2017). Production, use, and fate of all plastics ever made. Sci. Adv. 3, e1700782. doi: 10.1126/sciadv.1700782
Heindler F. M., Alajmi F., Huerlimann R., Zeng C., Newman S. J., Vamvounis G., et al. (2017). Toxic effects of polyethylene terephthalate microparticles and di(2-ethylhexyl)phthalate on the calanoid copepod, parvocalanus crassirostris. Ecotoxicol. Environ. Saf. 141, 298–305. doi: 10.1016/j.ecoenv.2017.03.029
Jambeck J. R., Geyer R., Wilcox C., Siegler T. R., Perryman M., Andrady A., et al. (2015). Plastic waste inputs from land into the ocean. Science 347, 768–771. doi: 10.1126/science.1260352
Jeong C.-B., Kang H.-M., Lee M.-C., Kim D.-H., Han J., Hwang D.-S., et al. (2017). Adverse effects of microplastics and oxidative stress-induced MAPK/Nrf2 pathway-mediated defense mechanisms in the marine copepod paracyclopina nana. Sci. Rep. 7, 41323. doi: 10.1038/srep41323
Keller D. P., Oschlies A., Eby M. (2012). A new marine ecosystem model for the university of Victoria earth system climate model. Geosci. Model. Dev. 5, 1195–1220. doi: 10.5194/gmd-5-1195-2012
Key R., Kozyr A., Sabine C., Lee K., Wanninkhof R., Bullister J., et al. (2004). A global ocean carbon climatology: Results from GLODAP. Global Biogeochem. Cycles 18, GB4031. doi: 10.1029/2004GB002247
Koeve W., Kahler P., Oschlies A. (2020). Does export production measure transient changes of the biological carbon pump’s feedback to the atmosphere under global warming? Geophys. Res. Lett. 47, e2020GL089928. doi: 10.1029/2020GL089928
Kooi M., Koelmans A. A. (2019). Simplifying microplastic via continuous probability distributions for size, shape, and density. Environ. Sci. Technol. Lett. 6, 551–557. doi: 10.1021/acs.estlett.9b00379
Kooi M., Nes E. H., Scheffer M., Koelmans A. A. (2017). Ups and downs in the ocean: Effects of biofouling on vertical transport of microplastics. Environ. Sci. Technol. 51, 7963–7971. doi: 10.1021/acs.est.6b04702
Kooi M., Primpke S., Mintenig S. M., Lorenz C., Gerdts G., Koelmans A. A. (2021). Characterizing the multidimensionality of microplastics across environmental compartments. Water Res. 202, 117429. doi: 10.1016/j.watres.2021.117429
Kooi M., Reisser J., Slat B., Ferrari F. F., Schmid M. S., Cunsolo S., et al. (2016). The effect of particle properties on the depth profile of buoyant plastics in the ocean. Sci. Rep. 6, 33882. doi: 10.1038/srep33882
Kvale K. (2022). Implications of plastic pollution on global marine carbon cycling and climate. Emerging Topics Life Sci 6 (4), 359–369. doi: 10.1042/ETLS20220013
Kvale K., Friederike Prowe A. E., Oschlies A. (2020a). A critical examination of the role of marine snow and zooplankton fecal pellets in removing ocean surface microplastic. Front. Mar. Sci. 6. doi: 10.3389/fmars.2019.00808
Kvale K. F., Meissner K. J., Keller D. P. (2015a). Potential increasing dominance of heterotrophy in the global ocean. Environ. Res. Lett. 10. doi: 10.1088/1748-9326/10/7/074009}
Kvale K., Meissner K., Keller D., Schmittner A., Eby M. (2015b). Explicit planktic calcifiers in the university of Victoria earth system climate model, version 2.9. Atmosphere–Ocean 53 (3), 332–350. doi: 10.1080/07055900.2015.1049112
Kvale K., Oschlies A. (2022). Recovery from microplastic-induced marine deoxygenation may take centuries. Nat. Geosci 16 (2023), 10–12. doi: 10.1038/s41561-022-01096-w
Kvale K., Prowe A. E. F., Chien C. T., Landolfi A., Oschlies A. (2020b). The global biological microplastic particle sink. Sci. Rep. 10, 16670. doi: 10.1038/s41598-020-72898-4
Kvale K., Prowe A. E. F., Chien C.-T., Landolfi A., Oschlies A. (2021). Zooplankton grazing of microplastic can accelerate global loss of ocean oxygen. Nat. Commun. 12, 2358. doi: 10.1038/s41467-021-22554-w
Kvale K., Zickfeld K., Bruckner T., Meissner K. J., Tanaka K., Weaver A. J. (2012). Carbon dioxide emission pathways avoiding dangerous ocean impacts. Weather Climate Soc. 4212–229. doi: 10.1175/WCAS-D-11-00030.1
Law K. L., Thompson R. C. (2014). Microplastics in the seas. Science 345, 144–145. doi: 10.1126/678science.1254065
Litchman E., de Tezanos Pinto P., Edwards K. F., Klausmeier C. A., Kremer C. T., Thomas M. K. (2015). Global biogeochemical impacts of phytoplankton: a trait-based perspective. J. Ecol. 103, 1384–1396. doi: 10.1111/1365-2745.12438
Long M., Moriceau B., Gallinari M., Lambert C., Huvet A., Raffray J., et al. (2015). Interactions between microplastics and phytoplankton aggregates: Impact on their respective fates. Mar. Chem. 17539 –46. doi: 10.1016/j.marchem.2015.04.003
MacLeod M., Arp H. P. H., Tekman M. B., Jahnke A. (2021). The global threat from plastic pollution. Science 373, 61–65. doi: 10.1126/science.abg5433
Martiny A. C., Hagstrom G. I., DeVries T., Letscher R. T., Britten G. L., Garcia C. A., et al. (2022). Marine phytoplankton resilience may moderate oligotrophic ecosystem responses and biogeochemical feedbacks to climate change. Limnol. Oceanogr. 67, S378–S389. doi: 10.1002/lno.12029
Masson-Delmotte V., Zhai P., Pirani A., Connors S. L., Pean C., Berger S., et al. (2021). Climate change 2021: The physical science basis (Cambridge, UK and New York, NY: Cambridge University Press).
McKay M. D., Beckman R. J., Conover W. J. (1979). A comparison of three methods for selecting values of input variables in the analysis of output from a computer code. Technometrics 21, 239–245. doi: 10.2307/1268522
Meinshausen M., Smith S. J., Calvin K., Daniel J. S., Kainuma M. L. T., Lamarque J.-F., et al. (2011). The RCP greenhouse gas concentrations and their extensions from 1765 to 2300. Climatic Change 109, 213–241. doi: 10.1007/s10584-011-0156-z
Meissner K., Weaver A., Matthews H., Cox P. (2003). The role of land surface dynamics in glacial inception: A study with the uvic earth system model. Climate Dynam. 21, 515–537. doi: 10.1007/s00382-003-0352-2
Michels J., Stippkugel A., Lenz M., Wirtz K., Engel A. (2018). Rapid aggregation of biofilm covered microplastics with marine biogenic particles. proceedings of the royal society b. Biol. Sci. 285, 20181203. doi: 10.1098/rspb.2018.1203
Milliman J., Troy P., Balch W., Adams A., Li Y., Mackenzie F. (1999). Biologically mediated dissolution of calcium carbonate above the chemical lysocline? Deep-Sea Res. Part I-Oceanogr. Res. Pap. 46, 1653–1669. doi: 10.1016/S0967-0637(99)00034-5
Morales C. E. (1987). Carbon and nitrogen content of copepod faecal pellets: effect of food concentration and feeding behavior. Mar. Ecol. Prog. Ser. 36, 107–114. doi: 10.3354/meps036107
Pabortsava K., Lampitt R. S. (2020). High concentrations of plastic hidden beneath the surface of the Atlantic ocean. Nat. Commun. 11, 4073. doi: 10.1038/s41467-020-17932-9
Petschel-Held G., Schellnhuber H.-J., Bruckner T., Toth F. L., Hasselmann K. (1999). The tolerable windows approach: Theoretical and methodological foundations. Climatic Change 41, 303–331. doi: 10.1023/A:1005487123751
Ploug H., Iversen M. H., Fischer G. (2008). Ballast, sinking velocity, and apparent diffusivity within marine snow and zooplankton fecal pellets: Implications for substrate turnover by attached bacteria. Limnol. Oceanogr. 53, 1878–1886. doi: 10.4319/lo.2008.53.5.1878
Porter A., Lyons B. P., Galloway T. S., Lewis C. (2018). Role of marine snows in microplastic fate and bioavailability. Environ. Sci. Technol. 52, 7111–7119. doi: 10.1021/acs.est.8b01000
Riahi K., Gruebler A., Nakicenovic N. (2007). Scenarios of long-term socio-economic and environmental development under climate stabilization. Technol. Forecasting Soc. Change 74, 887–935. doi: 10.1016/j.techfore.2006.05.026
Richon C., Gorgues T., Paul-Pont I., Maes C. (2022). Zooplankton exposure to microplastics at global scale: Influence of vertical distribution and seasonality. Front. Mar. Sci. 9. doi: 10.3389/fmars.2022.947309
Shen M., Huang W., Chen M., Song B., Zeng G., Zhang Y. (2020). (micro)plastic crisis: Un-ignorable contribution to global greenhouse gas emissions and climate change. J. Cleaner Production 254, 120138. doi: 10.1016/j.jclepro.2020.12013
Shore E. A., deMayo J. A., Pespeni M. H. (2021). Microplastics reduce net population growth and fecal pellet sinking rates for the marine copepod, acartia tonsa. Environ. pollut. 284, 117379. doi: 10.1016/j.envpol.2021.117379
Sjollema S. B., Redondo-Hasselerharm P., Leslie H. A., Kraak M. H., Vethaak A. D. (2016). Do plastic particles affect microalgal photosynthesis and growth? Aquat. Toxicol. 170, 259–261. doi: 10.1016/j.aquatox.2015.12.002
Steffen W., Richardson K., Rockstrom J., Cornell S. E., Fetzer I., Bennett E. M., et al. (2015). Planetary boundaries: Guiding human development on a changing planet. Science 347, 1259855. doi: 10.1126/science.1259855
Steffen W., Rockstrom J., Richardson K., Lenton T. M., Folke C., Liverman D., et al. (2018). Trajectories of the earth system in the anthropocene. Proc. Natl. Acad. Sci. 115, 8252–8259. doi: 10.1073/pnas.1810141115
Stubbins A., Law K. L., Munoz S. E., Bianchi T. S., Zhu L. (2021). Plastics in the earth system. Science 373, 51–55. doi: 10.1126/science.abb0354
Tanioka T., Matsumoto K. (2017). Buffering of ocean export production by flexible elemental stoichiometry of particulate organic matter. Global Biogeochem. Cycles 31, 1528–1542. doi: 10.1002/2017GB005670
Taucher J., Bach L. T., Prowe A. E. F., Boxhammer T., Kvale K., Riebesell U. (2022). Enhanced silica export in a future ocean triggers global diatom decline. Nature 605, 696–700. doi: 10.1038/s41586-022-04687-0
van Sebille E., Wilcox C., Lebreton L., Maximenko N., Hardesty B. D., van Franeker J. A., et al. (2015). A global inventory of small floating plastic debris. Environ. Res. Lett. 10, 124006. doi: 10.1088/1748-9326/10/12/124006
Weaver A., Eby M., Wiebe E., Bitz C., Duffy P., Ewen T., et al. (2001). The UVic earth system climate model: Model description, climatology, and applications to past, present and future climates. Atmosphere-Ocean 39, 361–428. doi: 10.1080/07055900.2001.9649686
Wieczorek A. M., Croot P. L., Lombard F., Sheahan J. N., Doyle T. K. (2019). Microplastic ingestion by gelatinous zooplankton may lower efficiency of the biological pump. Environ. Sci. Technol. 53, 5387–5395. doi: 10.1021/acs.est.8b07174
Wilson J. D., Andrews O., Katavouta A., de Melo Vir´ıssimo F., Death R. M., Adloff M., et al. (2022). The biological carbon pump in cmip6 models: 21st century trends and uncertainties. Proc. Natl. Acad. Sci. 119, e2204369119. doi: 10.1073/pnas.220436911
Yao W., Kvale K. F., Koeve W., Landolfi A., Achterberg E., Bertrand E. M., et al. (2022). Simulated future trends in marine nitrogen fixation are sensitive to model iron implementation. Global Biogeochem. Cycles 36, e2020GB006851. doi: 10.1029/2020GB006851
Zhang C., Jeong C.-B., Lee J.-S., Wang D., Wang M. (2019). Transgenerational proteome plasticity in resilience of a marine copepod in response to environmentally relevant concentrations of microplastics. Environ. Sci. Technol. 53, 8426–8436. doi: 10.1021/acs.est.9b02525
Keywords: microplastic (MP), ocean pollution, climate change, carbon cycle, biogeochemistry, modelling
Citation: Kvale K, Hunt C, James A and Koeve W (2023) Regionally disparate ecological responses to microplastic slowing of faecal pellets yields coherent carbon cycle response. Front. Mar. Sci. 10:1111838. doi: 10.3389/fmars.2023.1111838
Received: 30 November 2022; Accepted: 25 January 2023;
Published: 09 February 2023.
Edited by:
Gert Everaert, Flanders Marine Institute, BelgiumReviewed by:
Ana Isabel Catarino, Flanders Marine Institute, BelgiumGiuseppe Suaria, National Research Council (CNR), Italy
Copyright © 2023 Kvale, Hunt, James and Koeve. This is an open-access article distributed under the terms of the Creative Commons Attribution License (CC BY). The use, distribution or reproduction in other forums is permitted, provided the original author(s) and the copyright owner(s) are credited and that the original publication in this journal is cited, in accordance with accepted academic practice. No use, distribution or reproduction is permitted which does not comply with these terms.
*Correspondence: Karin Kvale, ay5rdmFsZUBnbnMuY3JpLm56