 Changlin Li1,2
 Yu Guo
 Zhenhua Ma
 Chuanxin Qin
- 1Key Laboratory of Efficient Utilization and Processing of Marine Fishery Resources of Hainan Province, Sanya Tropical Fisheries Research Institute, Sanya, China
- 2South China Sea Fisheries Research Institute, Chinese Academy of Fishery Sciences, Guangzhou, China
- 3Fangchenggang Fisheries Technology Extension Station, Fangchenggang, China
The fatty acid composition in organisms can reflect the trophic level, feeding habits, and utilization of local resources. In the present study, the living resources of different functional areas (artificial reef area, shellfish area, macroalgae area) in the Zhelin Bay Marine Ranch were investigated, and fatty acid analysis was used to elucidate the trophic relations across the food web. The results showed that 22:6ω3 FA (docosahexaenoic acid, DHA), 20:5ω3 FA (eicosapentaenoic acid, EPA), 16:1ω7 FA, and 16:0 FA are fatty acid biomarkers that distinguish carnivorous, omnivorous, and herbivorous organisms. The ratios of DHA/EPA, polyunsaturated fatty acids/saturated fatty acids (PUFA/SFA), and sum of ω3 fatty acids/sum of ω6 fatty acids (Σω3/Σω6) can be used as an important basis to assess the trophic level and feeding habits of organisms. In the comparison of the food web structure of different functional areas, the DHA/EPA ratio of carnivorous organisms in the Artificial Reef area was higher than that in other functional areas due to the abundant living resources, indicating that the food web of the Artificial Reef area presents lower stability to cope with perturbations. Furthermore, MixSIAR was used to quantitatively estimate the diet composition of consumers in the Zhelin Bay Marine Ranch based on their fatty acids. The results of the present study are a valuable contribution to understanding the trophic relationships in the Zhelin Bay Marine Ranch and provide theoretical support for future planning and construction of marine ranches.
1 Introduction
The study of the marine food web has been a persistent topic in the marine ecosystem, management, and spatial planning. Food webs represent the trophic interactions (predator–prey) that occur in an ecosystem, are the basis of material circulation and energy flow in the ecosystem (Bascompte, 2009; Thompson et al., 2012), and are key drivers of ecosystem structure, function, and stability (Dunne, 2006). The study of food webs can help us understand the interactions and energy flow process between organisms and provide a quantifiable framework for biodiversity patterns and energy flows in ecosystems. Furthermore, food web models can be used as quantitative approaches to evaluate ecosystem performance (Samhouri et al., 2009; Tam et al., 2017). Studies of marine ecosystem stability through food webs have also been widely reported. Rodriguez et al. (2022) compared the food web structure and stability of marine ecosystems at different latitudes, providing a management tool to evaluate marine ecosystem modifications resulting from biological invasions and other anthropogenic impacts as well as climate change. Li et al. (2022) analyzed the seasonal variations, structure, stability, and function of a typical artificial reef food web, providing useful information for future restoration plans of the marine ecosystem.
Several techniques have been used to analyze food web ecology to study food sources and trophic relationships, such as stomach content analysis, stable isotope ratios, DNA-based methods, and fatty acid biomarkers (Troedsson et al., 2009; Traugott et al., 2013; Parzanini et al., 2019; Pan et al., 2021). Stomach content has been the most widely used, the majority of the knowledge generated to date derived from this method. However, stomach content analysis presents several biases; only the transient feeding conditions of organisms before collection can be determined, representing snapshots of recent meals. On the other hand, most soft-bodied prey are difficult to identify given their rapid digestion; analysis results tend to the foods that are difficult to digest and may therefore not be a reliable indicator of long-term diet estimates (Iverson, 2009). More recently, stable isotopes have been used to more specifically identify food web relationships and the strength of interactions among dominant taxa in the marine environment (Alfaro et al., 2006; Connelly et al., 2014; Bergamino and Richoux, 2015; Schoo et al., 2018). Stable isotope ratios of carbon and nitrogen can accurately determine the trophic position and the contribution of food source of organisms in a food web (Schoo et al., 2018). Due to different metabolic rates of different tissues, isotope fractionation will exist in tissues of marine organisms, such as fish (Blanco et al., 2009), crustaceans (Day et al., 2023), mollusks (Cabanellas-Reboredo et al., 2009; Deudero et al., 2009), and macroalgae (Viana et al., 2015); the distribution of stable isotopes may be different among organs, which will bias the results of the survey. The promising new methods are DNA-based methods for detecting prey DNA that is contained in the stomach/gut of predator. Similar to stomach content analysis, DNA-based methods require DNA information from soft-bodied prey are difficult to identify and can only reflect the transient feeding conditions of the predator before capture (Traugott et al., 2013).
Fatty acid analysis has been extensively used in qualitative studies on trophic relationships in food webs (Kelly and Scheibling, 2012; Guerrero and Rogers, 2020; Guo et al., 2020). As higher trophic levels, consumers are enriched in fatty acid through the food web; fatty acid analysis is mainly based on the composition of biological fatty acids to study nutritional relationships and can reflect the diet of consumers (Iverson et al., 1997; Iverson et al., 2004). Non-essential fatty acid can be synthesized by the consumer and show high fractionation in the organism, but for essential fatty acid, this cannot be synthesized de novo by the consumer but can only be obtained from diet. Furthermore, these fatty acids are particularly important for the growth and development of high trophic organisms, were more likely accumulated in organisms (Dalsgaard et al., 2003; Závorka et al., 2023), and can therefore be useful as dietary tracers in food web analysis. As some fatty acids are often incorporated by their consumers without being modified, the fatty acid markers commonly used in trophic studies can be either single fatty acids associated with a particular type of organism or a ratio of fatty acids. For example, 16:1ω7 and 20:5ω3 (eicosapentaenoic acid, EPA) are diatom fatty acid markers (Budge and Parrish, 1998; Lee et al., 2006); 18:1ω9 and 22:6ω3 (docosahexaenoic acid, DHA) are zooplankton fatty acid markers. The ratio of 22:6ω3 (DHA) to 20:5ω3 (EPA) is used to assess the proportion of dinoflagellates to diatoms in the diet (El-Sabaawi et al., 2010). A high ratio of DHA to EPA could also indicate a carnivorous diet (Stowasser et al., 2009), whereas a high ratio of Σω3 to Σω6 indicates an herbivorous diet (El-Karim et al., 2016).
Marine ranching consists of artificial ecosystems built using modern marine technology and management, which have the functions of environmental protection, resource restoration, and fishery output (National Natural Science Foundation of China, 2019). Investigating fatty acid composition in marine ranching will help in the artificial building and management of marine ranch. Food-web indicators can be reflected from fatty acid analysis and are useful to summarize complex information concerning marine ecosystem status (Hayes et al., 2015; Geijzendorffer et al., 2016). Fatty acid analysis can reflect the average trophic level of organisms in the food web and can be associated with the number of carnivorous organisms and trophic species to evaluate the stability of the marine ecosystems (Rodriguez et al., 2022). In addition, fatty acid analysis can be used to assess basal food sources and quantify energy flows in food webs (Parrish, 2013) and has been correlated with changes in ecosystem function (e.g., primary productivity; Pethybridge et al., 2012) and structure (e.g., reorganization of fish communities or regime shifts; Litzow et al., 2006) of marine ranching. Evaluations of ecosystems from fatty acid analysis can provide theoretical support for the planning and construction of marine ranching.
Zhelin Bay is an important fishing ground of the north South China Sea. However, increased fishing effort in this area has led to a substantial decline in its fishery resources (Wang et al., 2019). Thus, to enhance fishery resources, the area was selected as a location for constructing a marine ranching system. The Zhelin Bay Marine Ranch is located in the coastal waters of the Zhelin Bay and Nanao Island in eastern Guangdong Province. The total area is 206.7 km2. It was established in 2011 and divided into five functional zones, including an artificial reef area, cage aquaculture area, stock enhancement area, shellfish area, and macroalgae area (Ma et al., 2019). Because the cage aquaculture area and stock enhancement area have just been demarcated and did not exercise its function, we just investigated three other functional areas. In the present study, the fatty acid composition of organisms in different functional areas of the Zhelin Bay Marine Ranch was investigated to explore differences in the food webs among different functional areas, analyze the trophic relationships in the food web in the Zhelin Bay Marine Ranch, and provide theoretical support for the planning and construction of marine ranches in the future.
2 Materials and methods
2.1 Study area
The study area is located in the coastal site of the Zhelin Bay, Guangdong Province, China (116°55′E–117°14′E, 23°27′N–23°35′N, Figure 1). The Zhelin Bay is characterized by a subtropical climate with an annual average temperature of 21°C. Three functional areas were investigated, the artificial reef area (AR), shellfish area (SH), and macroalgae area (MA). Special artificial reef structures were dropped in the artificial reef area to attract organisms to settle and breed. In the shellfish area, cage rearing and cone rearing are carried out, and high-quality shellfish seedlings are cultivated for bottom-seeding multiplication. The macroalgae area was created by raising macroalgae on the sea bed and on rafts to repair the environment and improve marine primary productivity.
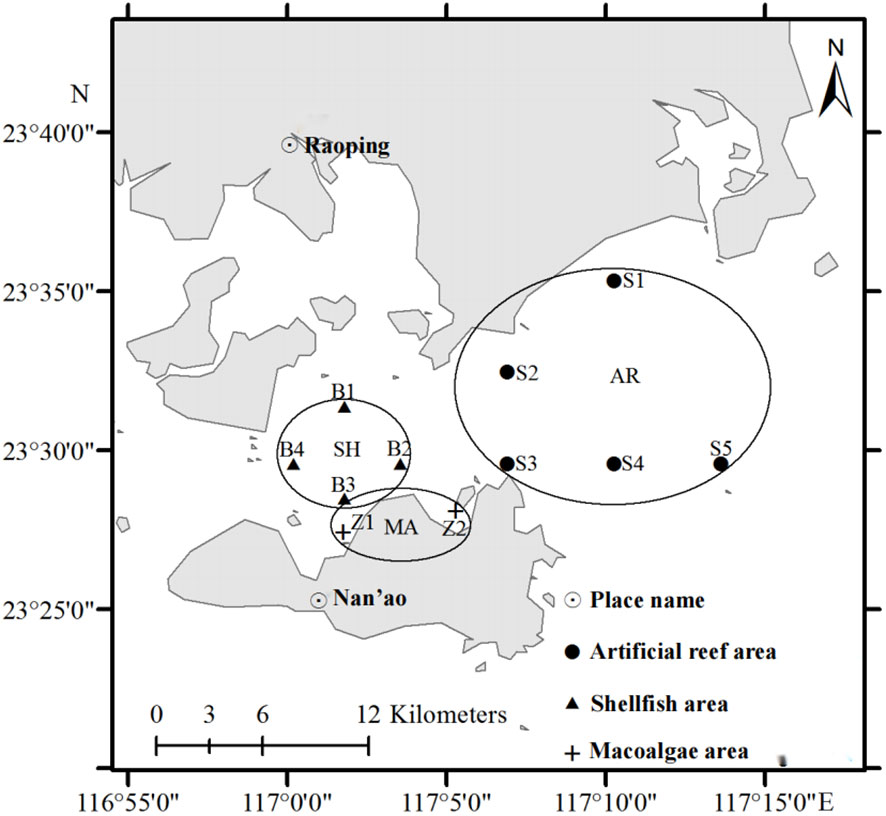
Figure 1 Sampling stations in the Zhelin Bay Marine Ranch.
2.2 Sampling
The sampling stations in each functional area are shown in Figure 1. Samples were collected in April, September, and November 2012. The samples were collected in the functional areas using trawls and gill nets. A total of 66 species were collected in this study, including 25 Crustacea species, 24 Osteichthyes species, 11 Gastropoda species, two Cephalopoda species, two Callobranchia species, and two algal species. In the sampling results of different functional areas, 41 species were collected from the artificial reef area, 31 from the shellfish area and 12 from the macroalgae area (Supplementary Material). Samples were frozen in liquid nitrogen and transported to the laboratory and stored at -80°C until they could be analyzed, less than 3 months later.
2.3 Fatty acid analysis
For the analysis of the fatty acid composition, samples were subjected to freeze drying at -60°C in a vacuum freeze dryer (Scientz-10 N, China) and then ground into powder using a tissue lyser (Tissuelyser-48, Shanghai Jingxin Industrial Development Co., Ltd., China). Fatty acids were extracted with chloroform–methanol (2:1, V/V) following the method of Folch et al. (1957). Fatty acid methyl esters (FAMEs) were prepared by transesterification with 0.4 M KOH in methanol and detected by gas chromatography using the method of Meng et al. (2017). The fatty acid content was measured by the normalization method. All measurements were performed in triplicate.
2.4 MixSIAR modeling
MixSIAR was used to estimate the diet composition of consumers in the Zhelin Bay Marine Ranch in different sampling months (Guerrero and Rogers, 2020). 16.1ω7, 18.1ω9, 18.3ω6, 18.3ω3, 20.4ω6, 20.5ω3, and 22.6ω3 were selected as qualitative FA signatures to estimate the diet composition. The MixSIAR mixing model is a Bayesian mixing model developed to analyze uncertainty associated with variation in isotope or fatty acid values of both sources and consumers, fractionation values, and concentration dependence to determine the contribution of food sources to consumers. The model uses a source file consisting of mean ± SD fatty acid profiles of food sources and a file of consumer fatty acid profiles. The organisms in the Zhelin Bay Marine Ranch were divided into cephalopods, squillids, shrimp, crab, and fish as consumers. Mollusks, crustaceans, sediment organic matter (SOM), and particulate organic matter (POM, unpublished data) were considered the potential food sources in the Zhelin Bay Marine Ranch.
2.5 Statistical analysis
The fatty acid signature analysis was conducted using SPSS Statistics 20.0 (IBM, Armonk, NY, USA). Principal component analysis (PCA) was performed using the R package ggbiplot (Version 0.55). Sampling station maps were created using ArcGIS 10.0.
3 Results
3.1 Fatty acid compositions of organisms
A total of 84 fatty acid signatures were obtained (Supplementary Material). The lipid contents are summarized in Table 1. The most abundant fatty acids in consumers were 16:0, 18:0, and 18:1ω9, which accounted for more than 50% of the total fatty acids. In macroalgae, the most abundant fatty acid was 16:0, accounting for 61.65% of the total fatty acids. In the artificial reef area, herbivorous species had the highest total fatty acid (TFA) contents (mean = 20.88 mg g-1, n = 3), followed by carnivorous (mean = 15.58 mg g-1, n = 27), and omnivorous (mean = 14.86 mg g-1, n = 36) species. In the shellfish area, the total fatty acid content of carnivorous species was 16.61 mg g-1, which was higher than that of herbivorous (mean = 15.02 mg g-1, n = 3) and omnivorous (mean = 13.95 mg g-1, n = 20) species. In the macroalgae area, the TFA contents showed the following descending order: macroalgae (mean = 17.13 mg g-1, n = 3) > carnivorous species (mean = 16.88 mg g-1, n = 4) > omnivorous species (mean = 12.88 mg g-1, n = 6).
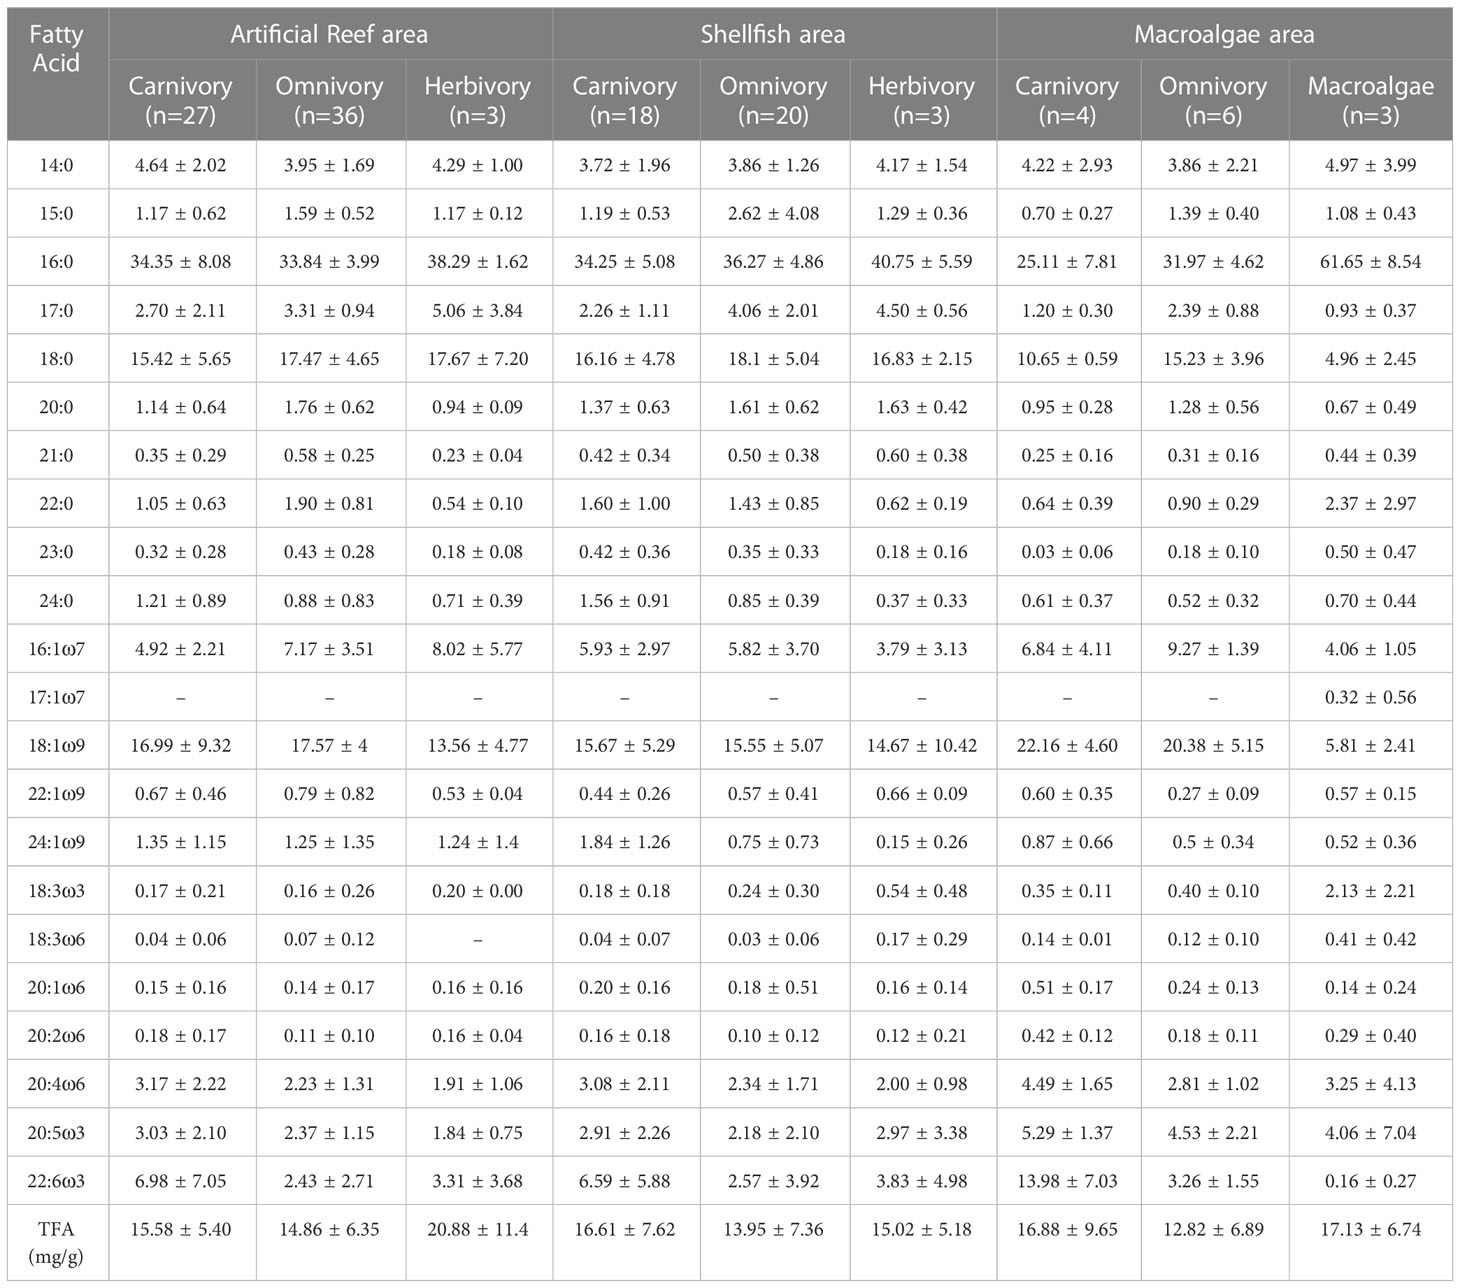
Table 1 Fatty acid compositions of organisms with different feeding habits in the Zhelin Bay Marine Ranch (mean ± SD%).
The total saturated fatty acid (SFA), monounsaturated fatty acid (MUFA), and polyunsaturated fatty acid (PUFA) proportions are shown in Figure 2. The SFA content was the highest in all consumers in all functional areas, followed by the MUFA content and PUFA content. The total SFA content in macroalgae was higher than that in consumers, but the total MUFA content in macroalgae was lower than that in consumers. For the different functional areas, the PUFA contents in carnivorous species were higher than those in herbivorous and omnivorous species. The fatty acid signature of the artificial reef area was similar to that of the shellfish area, and the differences in the SFA, MUFA, and PUFA contents were all less than 4.09% in these two functional areas. In the macroalgae area, the SFA contents of carnivorous and omnivorous species were lower than those in the other two functional areas, whereas the MUFA and PUMA contents were higher than those in the other two functional areas. The SFA content of algae (78.28%) was higher than that of consumer species.
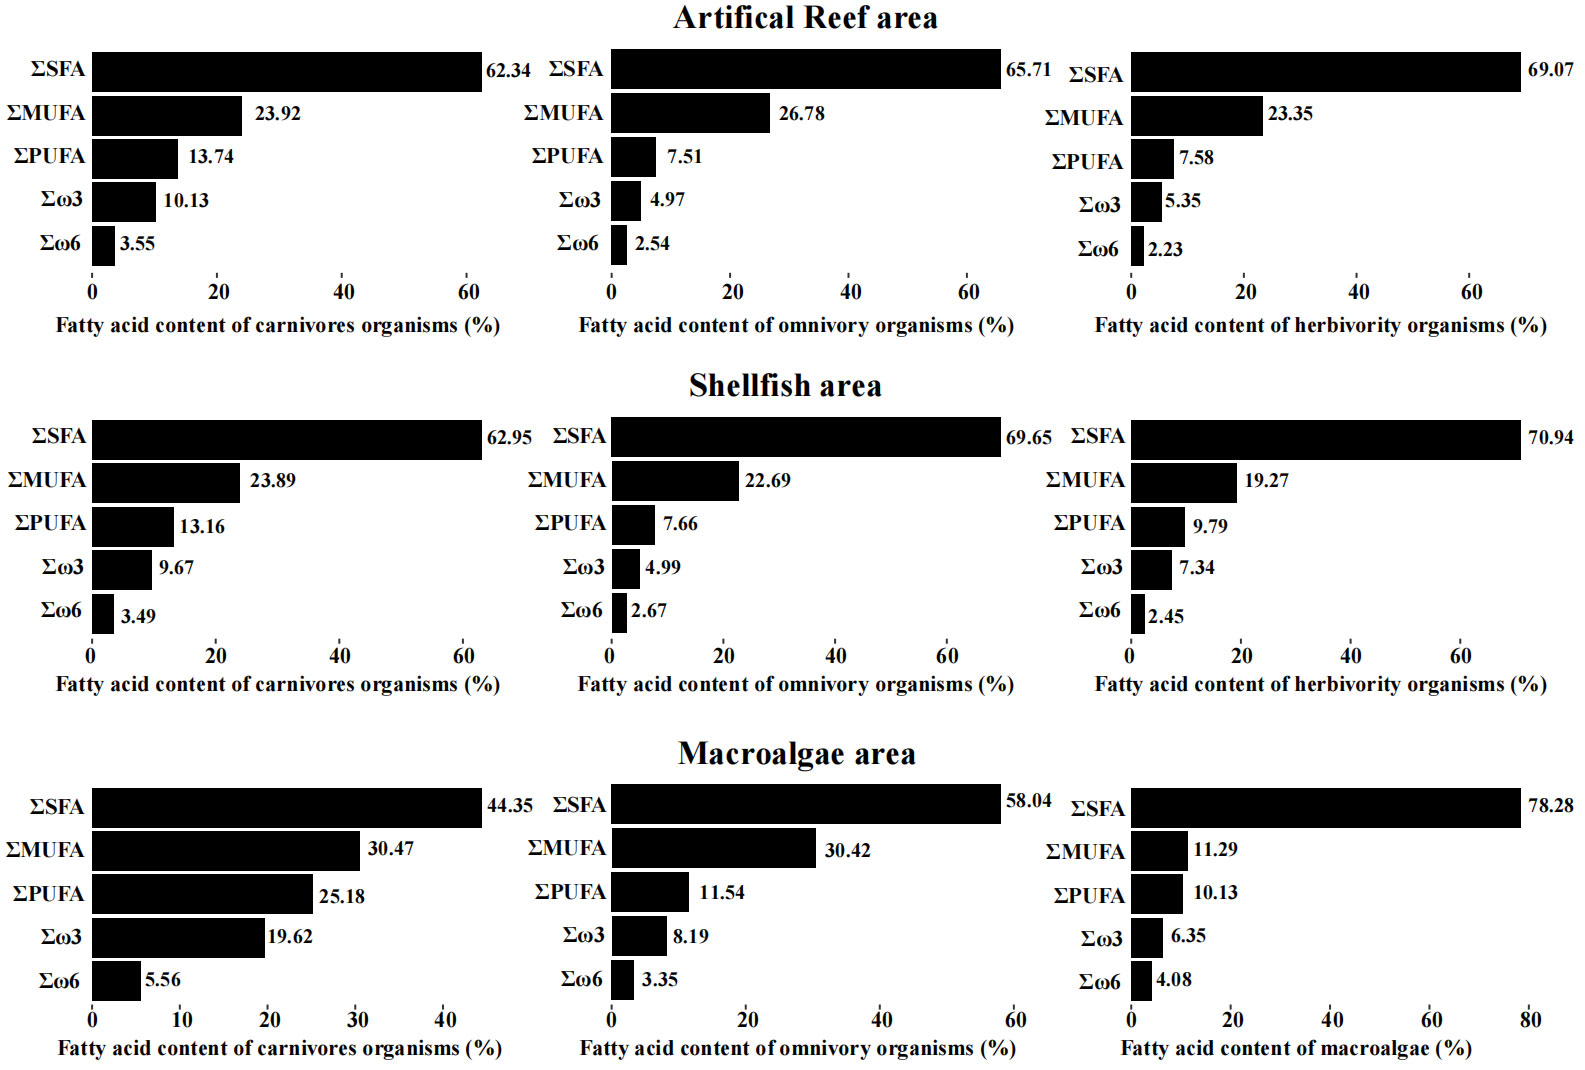
Figure 2 Fatty acid compositions in the different functional areas.
3.2 Principal component analysis
Eight representative fatty acids (16:0, 18:0, 16:1ω7, 18:1ω9, c20.4w6 (arachidonic acid, ARA), 20:5ω3 (EPA), 22:1ω9, and 22:6ω3 (DHA)) with high contents were selected for PCA. As shown in Figure 3A, principal components 1 (PC1) and 2 (PC2) resulting from the PCA of fatty acids in the artificial reef area explained 37.3 and 27.3% of the variance, respectively. The fatty acids with influential loadings on PC1 were 18:1ω9 and 16:1ω7 and on PC2 were 16:0, EPA, and DHA. The PCA (Figure 3A) revealed a positive correlation between 16:0 and DHA and carnivorous organisms, a positive correlation between 18:0 and 18:1ω9 and omnivorous organisms, and a positive correlation between 18:0 and DHA and herbivorous organisms.
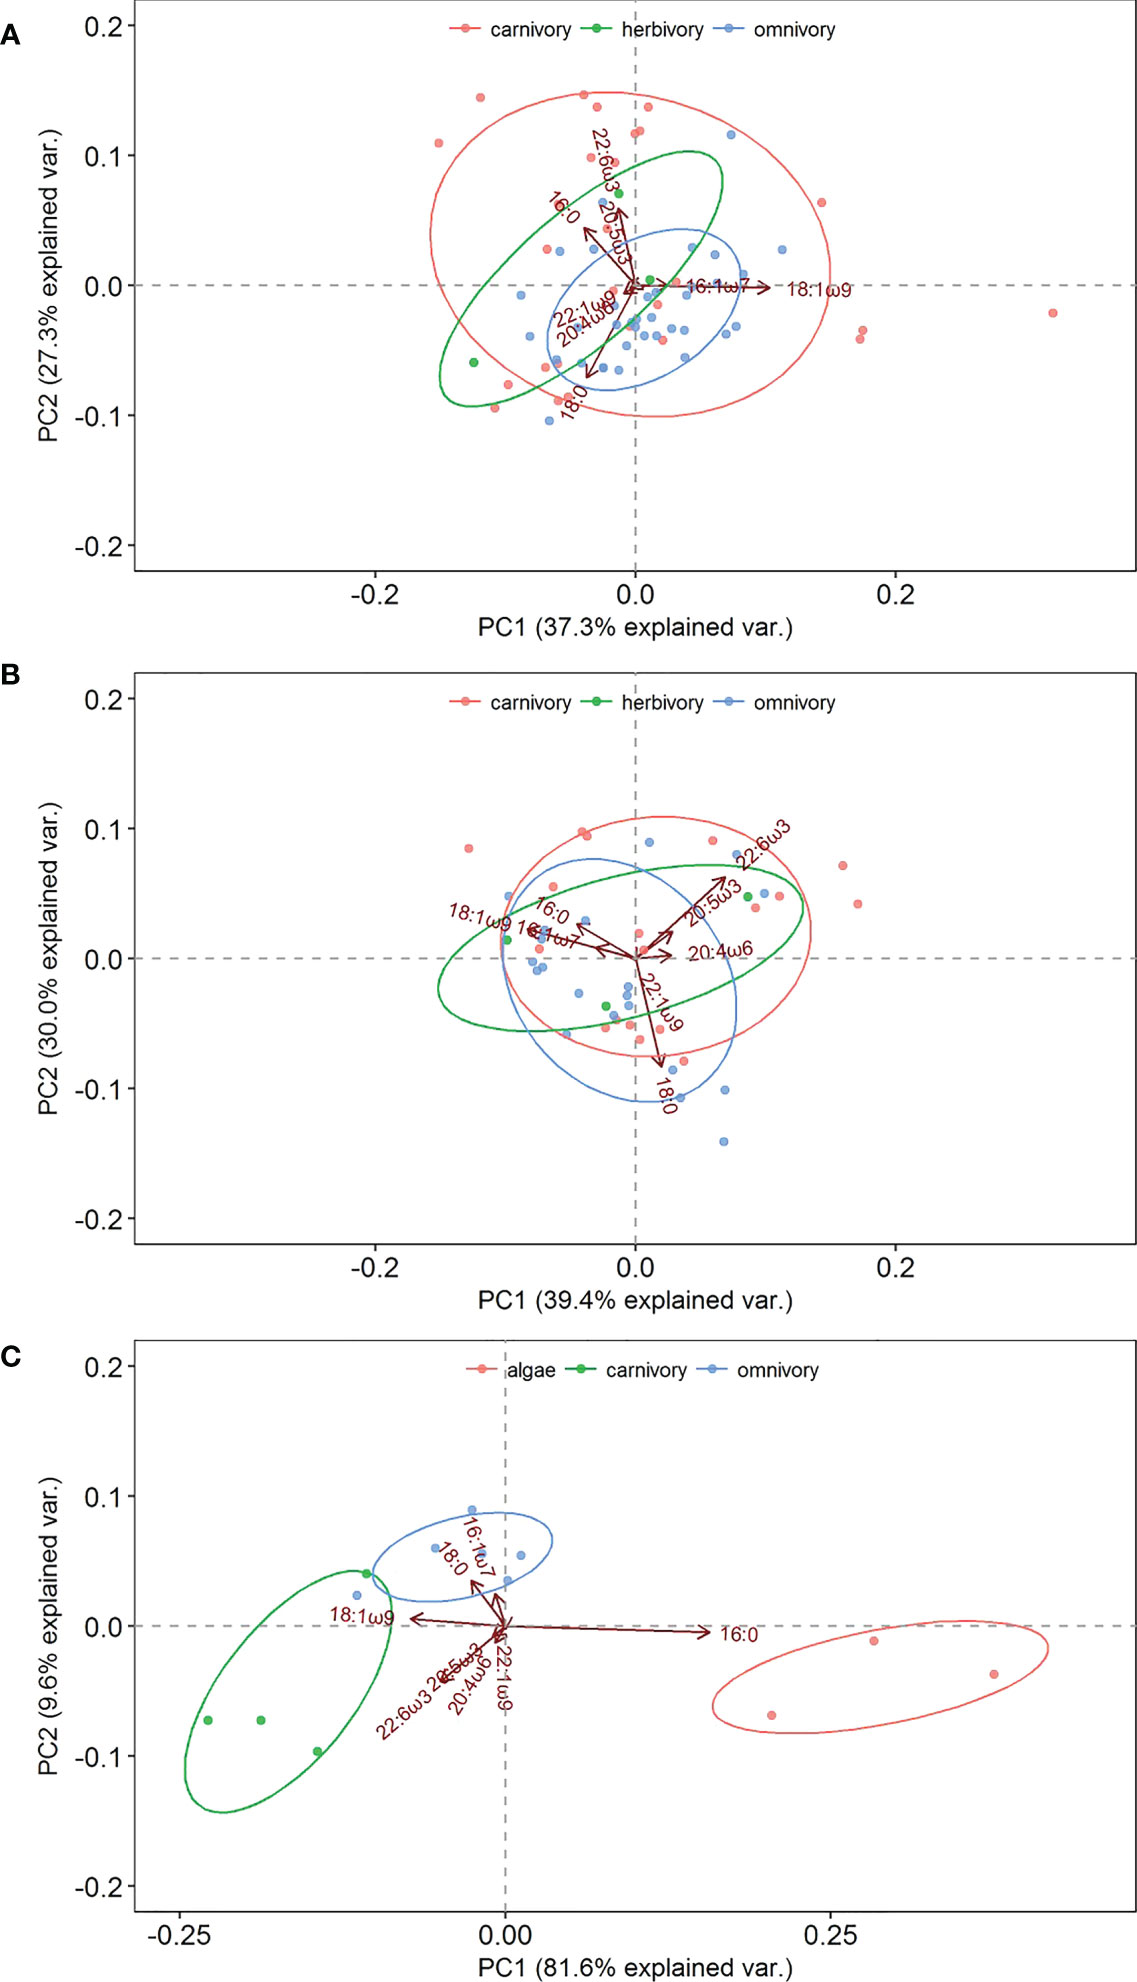
Figure 3 Principal component analysis (PCA) of the fatty acid composition of three functional areas. (A) artificial reef area; (B) shellfish area; (C) macroalgae area.
PC1 and PC2 of fatty acids in the shellfish area explained 39.4 and 30.0% of the variance, respectively. The fatty acids with influential loadings on PC1 were 18:0, ARA, and 22:1ω9 and on PC2 were 16:0, 16:1ω7, and 18:1ω9. EPA and DHA displayed positive PC1 and PC2 values (Figure 3B). The fatty acids EPA and DHA were positively correlated with carnivorous organisms, 18:0 and 18:1ω9 were positively correlated with omnivorous organisms, and 18:1ω9 and DHA were positively correlated with herbivorous organisms.
PC1 and PC2 of biological fatty acids in the macroalgae area explained 81.6 and 9.6% of the variance, respectively. As shown in Figure 3C, 16:0 was positively loaded on PC1, and 16:1ω7, 18:0, and 18:1ω9 were positively loaded on PC2. The fatty acids 18:1ω9 and DHA were positively correlated with carnivorous organisms, 16:1ω7 and 18:0 were positively correlated with omnivorous organisms, and 16:0 was positively correlated with macroalgae.
3.3 Analysis of fatty acid characteristics
The composition of 20:4ω6 (ARA), 20:5ω3 (EPA), 22:6ω3 (DHA), Σω3 fatty acids (the sum of 18:3ω3, EPA, and DHA), and Σω6 fatty acids (the sum of 18:3ω6, 20:1ω6, 20:2ω6, and ARA) of different organisms are shown in Figure 4. As shown in Figure 4A, the compositions of ARA and EPA in organisms with different feeding habits were all less than 10%. As shown in Figure 4B, the DHA composition of most carnivorous organisms was higher than that of omnivorous organisms, and the organisms with DHA contents over 10% were mainly carnivorous. Figure 4C shows that the composition of ω3 fatty acids of most organisms was higher than that of ω6 fatty acids, and some of the organisms with higher ω3 fatty acid compositions were omnivorous and herbivorous.
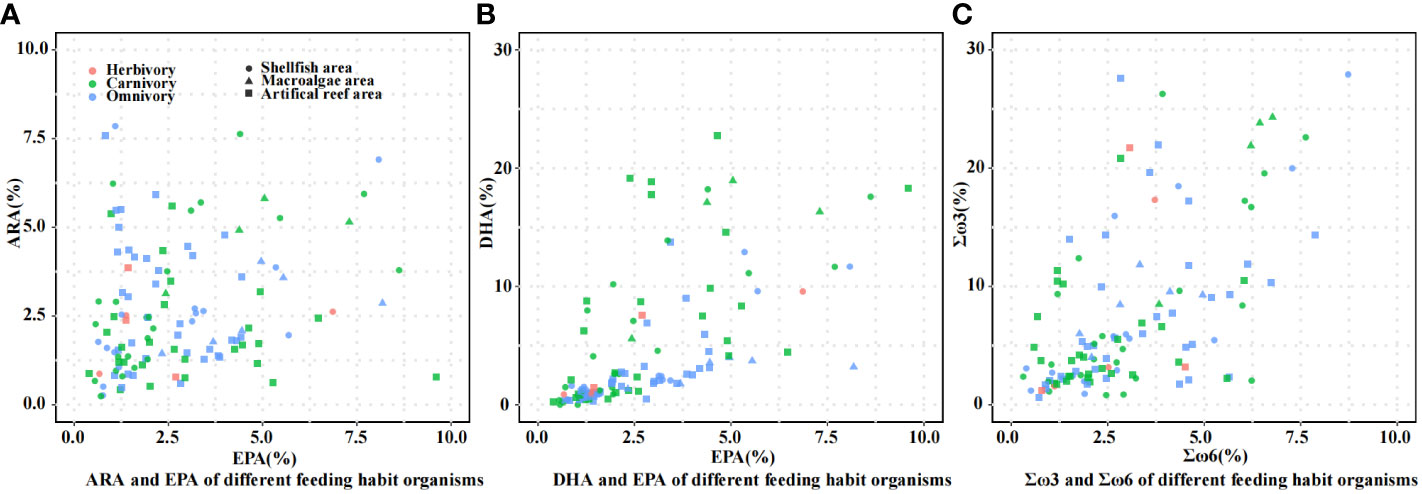
Figure 4 Fatty acid compositions of organisms with different feeding habits. (A) ARA and EPA of different feeding habit organisms; (B) DHA and EPA of different feeding habit organisms; (C) Σω3 and Σω6 of different feeding habit organisms.
The distributions of the ARA/EPA, DHA/EPA, and Σω3/Σω6 ratios of different organisms are shown in Figure 5. As shown in Figure 5A, gastropod species had the highest ARA/EPA ratio (mean = 2.26, n = 14), followed by Crustacea (mean = 1.63, n = 59), Lamellibranchia (mean = 1.45, n = 3), teleosts (mean = 0.84, n = 38), and cephalopods (mean = 0.41, n = 3). For DHA/EPA, teleosts had the highest DHA/EPA ratio (mean = 3.03), followed by cephalopods (mean = 2.47), Palmibranchia (mean = 1.23), crustaceans (mean = 0.74), and gastropods (mean = 0.61) (Figure 5B). The highest mean Σω3/Σω6 values were observed in Cephalopoda (mean = 3.38), followed by Gastropoda (mean = 3.25), Teleost (mean = 2.97), Crustacea (mean = 2.57), and Lamellibranchia (mean = 2.25). The value distributions of ARA/EPA, DHA/EPA, and Σω3/Σω6 in different functional areas and organisms with different feeding habits are shown in Figures 5D–I.
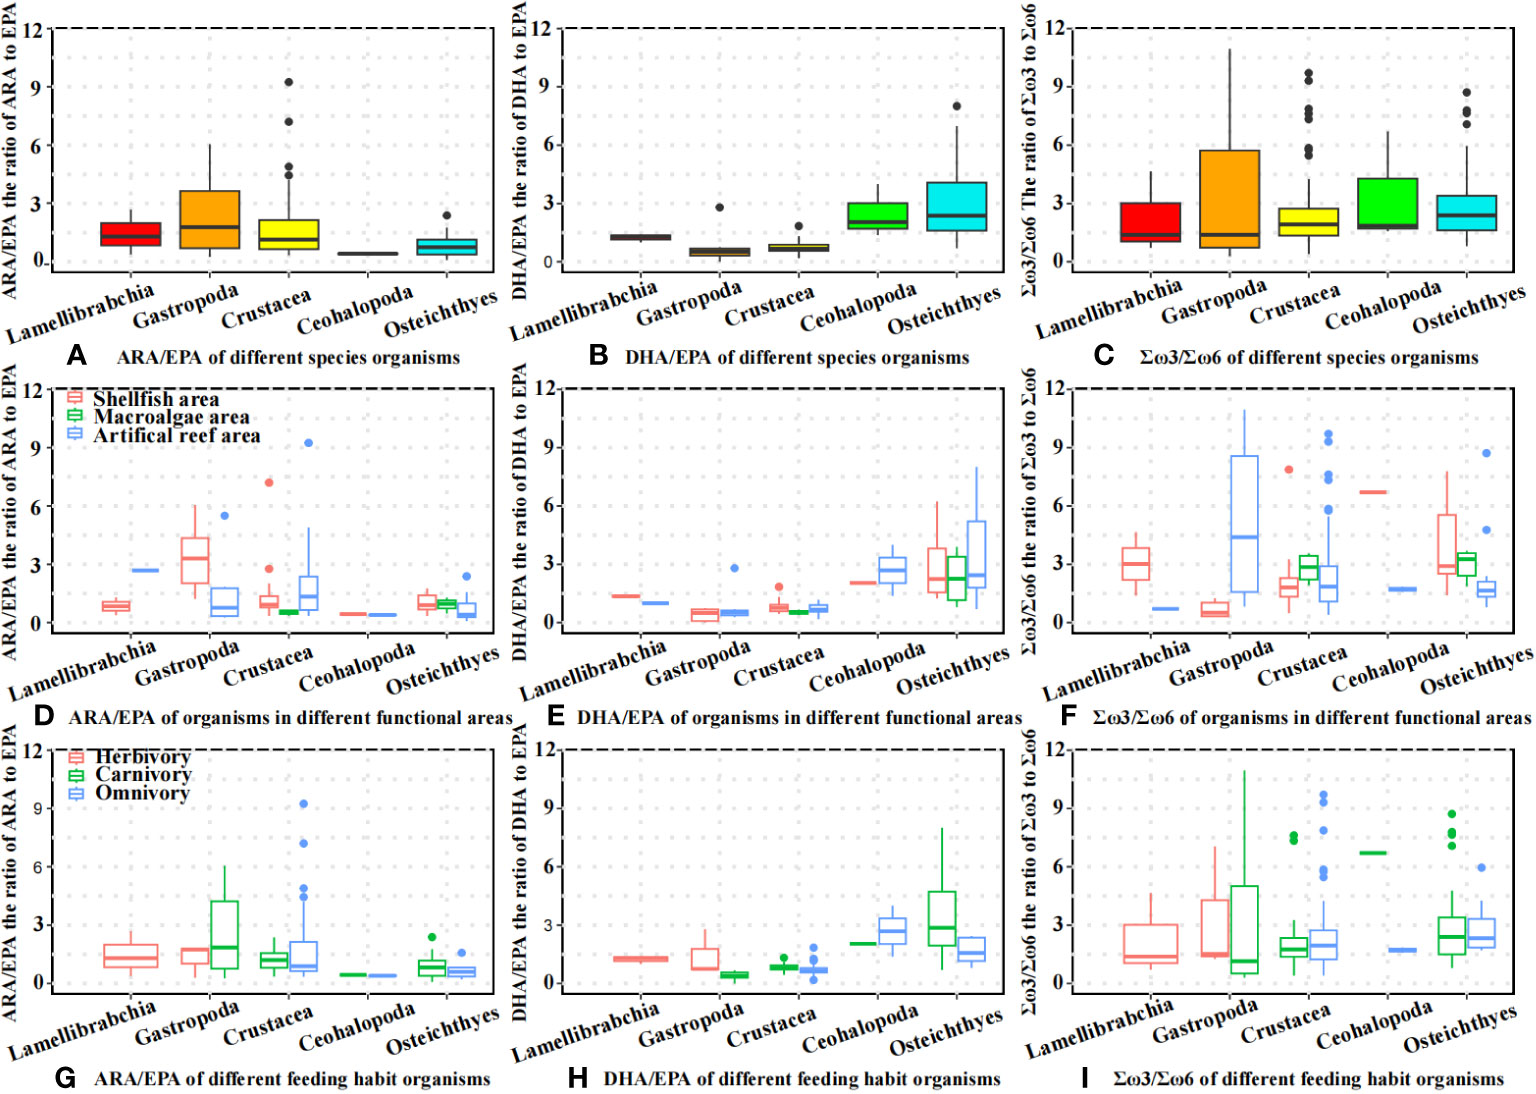
Figure 5 Fatty acid ratio of different organisms. (A) ARA/EPA of different species organisms; (B) DHA/EPA of different species organisms; (C) Σω3/Σω6 of different species organisms; (D) ARA/EPA of organisms in different functional areas; (E) DHA/EPA of organisms in different functional areas; (F) Σω3/Σω6 of organisms in different functional areas; (G) ARA/EPA of different feeding habit organisms; (H) DHA/EPA of different feeding habit organisms; (I) Σω3/Σω6 of different feeding habit organisms.
3.4 Diet estimation of consumers
We used the Bayesian mixing model MixSIAR to quantitatively estimate the diet composition of consumers in the Zhelin Bay Marine Ranch based on their fatty acids. As shown in Figure 6 and Table 2, we selected POM, SOM, mollusks, and crustaceans as the most important diet contributors of the consumers in the Zhelin Bay Marine Ranch. MixSIAR estimated a contribution of 0.5%–3.8% SOM, 0.3%–10.1% POM, 21.2%–96.9% crustaceans, and 3.0%–67.6% mollusks. The dietary contribution of crustaceans to consumers increased in September, especially that of cephalopods, squillids, and fish, and the contribution of mollusks increased in April. The dietary contribution of POM was higher than that of shrimp and crab in November and September, and the contribution of SOM was higher than that of fish in November.

Figure 6 Diet composition of species in the Zhelin Bay Marine Ranch.
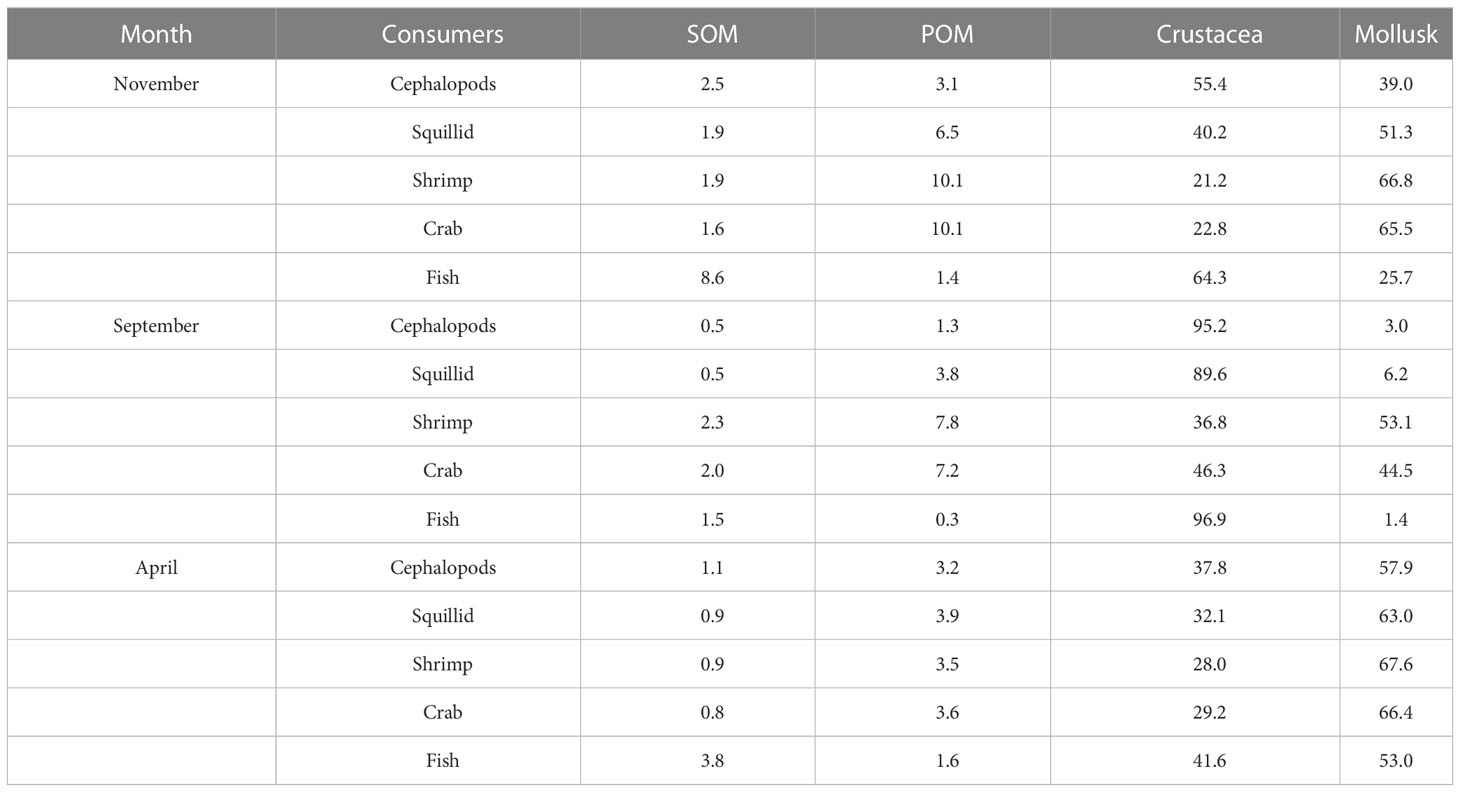
Table 2 Average contribution of potential food sources to consumers’ diets in different.
4 Discussion
Biological fatty acids are mainly composed of saturated fatty acids (SFAs), monounsaturated fatty acids (MUFAs), and polyunsaturated fatty acids (PUFAs). Among them, unsaturated fatty acids (e.g., c20:4ω6, c20:5ω3, c22:6ω3) play an important role in biological activities (Saito and Aono, 2014) and can be used as biomarkers in trophic studies. The DHA/EPA value of organisms in this investigation was compared with the results of stable-isotope-derived trophic levels in the Zhelin Bay marine ranch (Lin et al., 2018) (Figure 7).

Figure 7 Trophic level and DHA/EPA ratios of organisms in the Zhelin Bay Marine Ranch.
As shown in Figure 7, the higher the trophic level, the higher the DHA/EPA ratio in organisms. This pattern is more obvious in osteichthyes and cephalopods, but in crustaceans, the increase of the DHA/EPA ratio is not obvious with the increase of the trophic level, indicating a more flexible diet of crustaceans. In a recent study, crustaceans have been shown to feed benthic microalgae, marine phytoplankton, bivalves, and benthos (Ji et al., 2019), which are rich in EPA (El-Sabaawi et al., 2010), causing a low DHA/EPA ratio in crustaceans. EPA, DHA, and other unsaturated fatty acids can be accumulated in organisms by food processing (Dalsgaard et al., 2003). Although Solea ovata, Cynoglossus semilaevis, Parachaeturichthys polynema, and Trypauchen vagina have high trophic levels, they feed on a low DHA and EPA content diet, like crustaceans and benthos (Hu et al., 2016), causing a low DHA/EPA ratio. Trichiurus haumela and Argyrosomus argentatus are carnivorous fish with higher trophic levels, and they feed on fish and cephalopods (Zhang et al., 1981), which have a higher content of EPA and DHA, so the DHA/EPA ratio was higher in T. haumela and A. argentatus. In addition, omnivorous fish Leiognathus brevirostris and Osteomugil ophuyseni (EPA content: 4.54% and 4.96%) feed on diatoms and copepods; the content of EPA was higher than that in other organisms, causing a low DHA/EPA ratio. In conclusion, the DHA/EPA ratio can not only reflect the trophic level of organisms but also assess the proportion of diatoms in the diet. Organisms that feed on benthic organisms, diatoms, have a lower DHA/EPA ratio, and organisms that feed on fish and cephalopods generally have a higher DHA/EPA ratio. In addition, when using the DHA/EPA ratio to reflect the trophic level, it is necessary to combine other techniques, such as stable isotope analysis.
Fatty acids can serve as biomarkers commonly used in diet studies of predators. The 20:5ω3 (EPA) and 22:6ω3 (DHA) found in aquatic organisms cannot be biosynthesized by the organisms; rather, they are derived from dietary sources (Wang et al., 2022) and therefore can be used as biomarkers to inform the source of a diet (Strandberg et al., 2020). DHA is the characteristic fatty acid of zooplankton, accumulating through the food chain so that carnivorous organisms contain more DHA; a high DHA/EPA ratio can indicate a carnivorous diet (El-Sabaawi et al., 2009; Schoo et al., 2018). The osteichthyes and cephalopods in the Zhelin Bay Marine Ranch showed a high DHA/EPA ratio, indicating carnivorous diets. In addition, the PUFA/SFA ratio is also an indicator of a carnivorous diet (Stevens et al., 2004; Rossi et al., 2008; Schoo et al., 2018). In the present study, carnivorous organisms had the highest PUFA/SFA ratio, followed by omnivorous and herbivorous organisms. ARA (20:4ω6) can serve as a fatty acid biomarker of benthic diets (Stowasser et al., 2009). A higher ARA content was found in lamellibranchians, gastropods, and crustaceans (Figure 5A), indicating that these organisms are benthic feeders. In addition, the ratios of ARA/EPA were higher than the DHA/EPA ratios in benthic feeders (Figures 5A, B). Benthic organisms are characterized by high ARA content and low DHA/EPA ratio; this can be used as a basis for determining whether an organism is a benthic organism. The Σω3/Σω6 ratio was used to identify the degree of herbivory, and herbivores usually have a higher Σω3/Σω6 ratio (El-Karim et al., 2016). In the present study, there were some omnivorous organisms (Solenocera crassicornis and Metapenaeus joyneri) with higher Σω3/Σω6 ratios; it seems that diatom diet might be the cause of this phenomenon (Huang, 2004). When using Σω3/Σω6 ratios as the basis for judging whether the organisms are herbivorous, it should be considered whether the organisms are omnivorous.
The construction of functional areas in marine ranches is mainly realized through ecosystem engineering, which will affect the structure of the food web (Sanders et al., 2014). The artificial reef area is rich in living resources compared with other areas because of the large number of artificial reefs placed in this area. As shown in Table 1 and Figure 5E, the DHA/EPA ratio of organisms in the artificial reef area was higher than that in the other two functional areas, indicating that the trophic level of organisms in the artificial reef area was higher than that in the shellfish and macroalgae areas. The number of species and trophic levels promote the complexity of the food web in artificial reef areas (Kortsch et al., 2019). Previous studies have suggested that the more complex the food web is, the less stable and more sensitive it is to the loss of its most connected species (Rodriguez et al., 2022). Consequently, the food web of the artificial reef area presents lower stability to cope with perturbations, and more efforts should be put into maintaining the stability of the ecosystem in this functional area.
The Bayesian mixing model MixSIAR was used to quantitatively estimate the diet composition of consumers in the Zhelin Bay Marine Ranch based on their fatty acids. Previous studies have demonstrated that MixSIAR with fatty acid data can accurately identify the diet composition of consumers (Guerrero and Rogers, 2020; Guerrero et al., 2021). In the present study, the main dietary sources for consumers in Zhelin Bay Marine Ranch were mollusks (3.0%–67.6%) and crustaceans (21.2%–95.2%). The crustacean stock density increased after the establishment of the Zhelin Bay Marine Ranch (Wang et al., 2018), becoming a major food source for all kinds of predators and playing an important role in the energy transfer from primary producers to higher trophic-level predators in the Zhelin Bay Marine Ranch. The food composition of fish and cephalopods changed significantly with the seasons, especially in September, when their composition of crustaceans was 96.9% and 95.2%, respectively. The feeding selectivity of organisms is related to the composition and stock density of their prey organisms. When the diet is abundant, the feeding selectivity of swimming animals such as fish and cephalopods will be low, and the diversity of food sources will be reduced. It can be inferred that crustaceans provide sufficient food resources for fish and cephalopods in November.
5 Conclusion
According to the comparison of fatty acids of organisms with different feeding habits, DHA, EPA, 16:1ω7, and 16:0 are fatty acid biomarkers that can be used to distinguish carnivorous, omnivorous, and herbivorous organisms. Feeding habits are a major contributor to the fatty acid composition of organisms. In addition, there were differences in food web structure among different functional areas. The DHA/EPA ratio (trophic level) of carnivorous organisms was higher in the artificial reef area due to its higher diversity of species. The content of 18:3ω3 in the fatty acid composition of consumers was higher in the shellfish area because the benthic shellfish-ingested seaweed. The contents of 16:1ω7 and EPA in the fatty acid composition of consumers in the macroalgae area were higher because of the abundant algal resources. In the comparison of food sources in each functional area, plankton was the most important food source in the artificial reef and shellfish areas, whereas algae was the most important food source in the macroalgae area. Diet composition analysis showed that crustaceans were an important food source for consumers in the Zhelin Bay Marine Ranch. The present study helps us understand the ecosystem differences among different functional areas of the Zhelin Bay Marine Ranch and provides theoretical support for the future planning and construction of marine ranches.
Data availability statement
The original contributions presented in the study are included in the article/Supplementary Material. Further inquiries can be directed to the corresponding author.
Ethics statement
The animal study was reviewed and approved by Laboratory Animal Welfare and Ethics Committee of South China Sea Fisheries Research Institute (CAFS) (nhdf2020-02).
Author contributions
CQ conceived of the study and participated in its design. CL drafted the manuscript. HL and KP performed the field experiments. GY and ZM provided scientific advice. YG sorted the data. All authors contributed to the article and approved the submitted version.
Funding
This work was supported by the Hainan Provincial Natural Science Foundation of China (No. 321CXTD446) and the National Natural Science Foundation of China (No. 32160863).
Acknowledgments
We thank all colleagues for their generous support of the study. We also thank the editor and reviewers for their constructive comments on our present work.
Conflict of interest
The authors declare that the research was conducted in the absence of any commercial or financial relationships that could be construed as a potential conflict of interest.
Publisher’s note
All claims expressed in this article are solely those of the authors and do not necessarily represent those of their affiliated organizations, or those of the publisher, the editors and the reviewers. Any product that may be evaluated in this article, or claim that may be made by its manufacturer, is not guaranteed or endorsed by the publisher.
Supplementary material
The Supplementary Material for this article can be found online at: https://www.frontiersin.org/articles/10.3389/fmars.2023.1132246/full#supplementary-material
References
Alfaro A. C., Thomas F., Sergent L., Duxbury M. (2006). Identification of trophic interactions within an estuarine food web (northern new Zealand) using fatty acid biomarkers and stable isotopes. Estuar. Coast. Shelf Sci. 70 (1/2), 271–286. doi: 10.1016/j.ecss.2006.06.017
Bascompte J. (2009). Disentangling the web of life. Science 325, 416–419. doi: 10.1126/science.1170749
Bergamino L., Richoux N. B. (2015). Spatial and temporal changes in estuarine food web structure: differential contributions of marsh grass detritus. Estuaries Coasts 38, 367–382. doi: 10.1007/s12237-014-9814-5
Blanco A., Deudero S., Box A. (2009). Muscle and scale isotopic offset of three fish species in the Mediterranean Sea: dentex dentex, argyrosomus regius and xyrichtys novacula. Rapid Commun Mass Spectrometry 23 (15), 2321–2328. doi: 10.1002/rcm.4154
Budge S. M., Parrish C. C. (1998). Lipid biogeochemistry of plankton, settling matter and sediments in trinity bay, newfoundland. II. Fatty Acids 29, 0–1559. doi: 10.1016/S0146-6380(98)00177-6
Cabanellas-Reboredo M., Deudero S., Blanco A. (2009). Stable-isotope signatures (δ13C and δ15N) of different tissues of pinna nobilis Linnaeus 1758 (Bivalvia): isotopic variations among tissues and between seasons. J. Molluscan Stud. 75 (4), 343–349. doi: 10.1093/mollus/eyp021
Connelly T. L., Deibel D., Parrish C. C. (2014). Trophic interactions in the benthic boundary layer of the Beaufort Sea shelf, Arctic ocean: combining bulk stable isotope and fatty acid signatures. Prog. Oceanography 120, 79–92. doi: 10.1016/j.pocean.2013.07.032
Dalsgaard J., John M. S., Kattner G., Müller-Navarra D., Hagen W. (2003). Fatty acid trophic markers in the pelagic marine environment. Adv. Mar. Biol. 46, 225–340. doi: 10.1016/S0065-2881(03)46005-7
Day J. K., Knott N. A., Swadling D., Ayre D., Huggett M., Gaston T. (2023). Non-lethal sampling does not misrepresent trophic level or dietary sources for sagmariasus verreauxi (eastern rock lobster). Rapid Commun. Mass Spectrometry 37 (4), e9435. doi: 10.1002/rcm.9435
Deudero S., Blanco A., Cabanellas-Reboredo M., Tejada S. (2009). Stable isotope fractionation in the digestive gland, muscle and gills tissues of the marine mussel mytilus galloprovincialis. J. Exp. Mar. Biol Ecol. 368 (2), 181–188. doi: 10.1016/j.jembe.2008.10.008
Dunne J.A. (2006). “The network structure of food webs,” In Ecological Networks: Linking Structure to Dynamics in Food Webs. Workshop on Theoretical Ecology and Globle Change. Ed. Dunne M. P.
El-Karim M., Ali M., Mahmoud. A. (2016). Assessing the dietary sources of two cichlid species in river Nile sub-branches: stomach contents, fatty acids and stable isotopes analyses. Egyptian J. Aquat. Res. 42, 205–213. doi: 10.1016/j.ejar.2016.05.001
El-Sabaawi R., Dower J. F., Mazumder K. A. (2009). Characterizing dietary variability and trophic positions of coastal calanoid copepods: insight from stable isotopes and fatty acids. Mar. Biol. 156 (3), 225–237. doi: 10.1007/s00227-008-1073-1
El-Sabaawi R. W., Sastri A. R., Dower J. F., Mazumder A. (2010). Deciphering the seasonal cycle of copepod trophic dynamics in the strait of Georgia, Canada, using stable isotopes and fatty acids. Estuaries Coasts 33, 738–752. doi: 10.1007/s12237-009-9263-8
Folch J., Mark L., Gerald H. S. S. (1957). A simple method for the isolation and purification of total lipids from animal tissues. J. Biol. Chem. 226, 497–509. doi: 10.1016/S0021-9258(18)64849-5
Geijzendorffer I. R., Regan E. C., Pereira H. M., Brotons L., Brummitt N., Gavish Y., et al. (2016). Bridging the gap between biodiversity data and policy reporting needs: an essential biodiversity variables perspective. J. Appl. Ecol. 53, 1341–1350. doi: 10.1111/1365-2664.12417
Guerrero A. I., Pinnock A., Negrete J., Rogers T. L. (2021). Complementary use of stable isotopes and fatty acids for quantitative diet estimation of sympatric predators, the Antarctic pack-ice seals. Oecologia 197, 729–742. doi: 10.1007/s00442-021-05045-z
Guerrero A. I., Rogers T. L. (2020). Evaluating the performance of the Bayesian mixing tool MixSIAR with fatty acid data for quantitative estimation of diet. Sci. Rep. 10, 1–14. doi: 10.1038/s41598-020-77396-1
Guo F., Lee S. Y., Kainz M. J., Brett M. T. (2020). Fatty acids as dietary biomarkers in mangrove ecosystems: current status and future perspective. Sci. Total Environ. 739, 139907. doi: 10.1016/j.scitotenv.2020.139907
Hayes K. R., Dambacher J. M., Hosack G. R., Bax N. J., Dunstan P. K., Fulton E. A., et al. (2015). Identifying indicators and essential variables for marine ecosystems. Ecol. Indic. 57, 409–419. doi: 10.1016/j.ecolind.2015.05.006
Hu C. Y., Shui Y. Y., Tian K., Li L., Qin H. L., Zhang C. X., et al. (2016). Functional group classification and niche identification of major fish species in the qixing islands marine reserve, zhejiang province. Biodiversity Sci. 24 (2), 175–184. doi: 10.17520/biods.2015225
Huang M. Z. (2004). Study on feeding habits and nutrient level of shrimp species from Taiwan strait and its adjacent sea areas. J. Oceanography Taiwan Strait 23 (4), 481–488.
Iverson S. J. (2009). Tracing aquatic food webs using fatty acids: from qualitative indicators to quantitative determination. Lipids in Aquatic Ecosystems, Springer, 281–308.
Iverson S. J., Field C., Bowen W. D., Blanchard W. (2004). Quantitative fatty acid signature analysisi: a new method of estimating dites. Ecol. Monographs. 74(2), 211–235. doi: 10.1890/02-4105
Iverson S. J., Frost K. J., Lowry L. F. (1997). Fatty acid signatures reveal fine scale structure of foraging distribution of harbor seals and their prey in prince William sound, Alaska. Mar. Ecol. Prog. 151, 255–271. doi: 10.3354/meps151255
Ji W. W., Yokoyama H., Reid W. D. K., Fu J., Zhou J. (2019). Trophic ecology of penaeus chinensis (Decapoda: dendrobranchiata: penaeidae) and potential competitive interactions with other species in the haizhou bay determined by carbon and nitrogen stable isotope analysis. Regional Stud. Mar. Sci. 32, 100842. doi: 10.1016/j.rsma.2019.100842
Kelly J. R., Scheibling R. E. (2012). Fatty acids as dietary tracers in benthic food webs. Mar. Ecol. Prog. Series. 446, 1–22. doi: 10.3354/meps09559
Kortsch S., Primicerio R., Aschan M., Lind S., Dolgov A. V., Planque B. (2019). Food-web structure varies along environmental gradients in a high-latitude marine ecosystem. Ecography 42, 295–308. doi: 10.1111/ecog.03443
Lee R. F., Hagen W., Kattner G. (2006). Lipid storage in marine zooplankton. Mar. Ecol. Prog. Series. 307, 273–306. doi: 10.3354/meps307273
Li S. P., Wang R. Y., Jiang Y. M., Li Y. Y., Zhu L., Feng J. F. (2022). Seasonal variation of food web structure and stability of a typical artificial reef ecosystem in bohai Sea, China. Front. Mar. Sci. 9. doi: 10.3389/fmars.2022.830324
Lin H., Qin C., Li X., Chen P., Mo B., Ma H., et al. (2018). Food web analysis in zhelin bay marine ranching. J. Fish China 42, 1026–1039. doi: 10.11964/jfc.20170410814
Litzow M. A., Bailey K. M., Prahl F. G., Heintz R. (2006). Climate regime shifts and reorganization of fish communities: the essential fatty acid limitation hypothesis. Ecol. Prog. Ser. 315, 1–11. doi: 10.3354/meps315001
Ma H., Qin C., Chen P., Lin H., Duan D. (2019). Valuation of ecosystem service of marine ranching in zhelin bay. South China Fish Sci. 15, 10–19. doi: 10.12131/20180041
Meng F., Gao H., Tang X., Wang A., Yao X., Liu C., et al. (2017). Biochemical composition of pond-cultured vs. wild gravid female mud crab Scylla paramamosain in hainan, China: evaluating the nutritional value of cultured mud crab. J. Shellfish Res. 36, 445–452. doi: 10.2983/035.036.0216
National Natural Science Foundation of China (2019). The 230th shuangqing forum “Construction and development of modern ocean ranching” was held in zhoushan.
Pan W., Qin C., Zuo T., Yu G., Xi S. (2021). Is metagenomic analysis an effective way to analyze fish feeding habits? a case of the yellowfin Sea bream acanthopagrus latus (Houttuyn) in daya bay. Front. Mar. Sci. 8. doi: 10.3389/fmars.2021.634651
Parrish C. C. (2013). Lipids in marine ecosystems. ISRN Oceanogr 2013, 604045. doi: 10.5402/2013/604045
Parzanini C., Parrish C. C., Hamel J. F., Mercier A. (2019). Reviews and syntheses: insights into deep-sea food webs and global environmental gradients revealed by stable isotope (delta n-15, delta c-13) and fatty acid trophic biomarkers. Biogeosciences 16, 2837–2856. doi: 10.5194/bg-16-2837-2019
Pethybridge H. R., Butler E., Cossa D., Daley R., Boudou A. (2012). Trophic structure and biomagnification of mercury in an assemblage of deepwater chondrichthyans from southeastern australia. marine. Ecol. Prog. Ser. 451, 163–74. doi: 10.3354/meps09593
Rodriguez I. D., Marina T. I., Schloss I. R., Saravia L. A. (2022). Marine food webs are more complex but less stable in sub-Antarctic (Beagle channel, Argentina) than in Antarctic (Potter cove, Antarctic peninsula) regions. Mar. Environ. Res. 174, 105561. doi: 10.1016/j.marenvres.2022.105561
Rossi S., Youngbluth M. J., Pagès F., Jacoby C. A., Garrofé. X. (2008). Fatty acid trophic markers and trophic links among seston, crustacean zooplankton and the siphonophore nanomia cara in georges basin and oceanographer canyon (NW Atlantic). Sci Marina 72 (2), 403–416. doi: 10.3989/scimar.2008.72n2403
Saito H., Aono H. (2014). Characteristics of lipid and fatty acid of marine gastropod turbo cornutus: high levels of arachidonic and n-3 docosapentaenoic acid. Food Chem. 145, 135–144. doi: 10.1016/j.foodchem.2013.08.011
Samhouri J. F., Levin P. S., Harvey C. J. (2009). Quantitative evaluation of marine ecosystem indicator performance using food web models. Ecosystems 12, 1283–1298. doi: 10.1007/s10021-009-9286-9
Sanders D., Jones C. G., Thebault E., Bouma T. J., van der Heide T., van Belzen J., et al. (2014). Integrating ecosystem engineering and food webs. Oikos 123, 513–524. doi: 10.1111/j.1600-0706.2013.01011.x
Schoo K. L., Boersma M., Malzahn A. M., Loeder M. G. J., Wiltshire K. H., Aberle N. (2018). Dietary and seasonal variability in trophic relations at the base of the north Sea pelagic food web revealed by stable isotope and fatty acid analysis. J. Sea Res. 141, 61–70. doi: 10.1016/j.seares.2018.08.004
Stevens C. J., Deibel D., Parrish C. C. (2004). Incorporation of bacterial fatty acids and changes in a wax ester-based omnivory index during a long-term incubation experiment with calanus glacialis jaschnov. J. Exp. Mar. Biol. Ecol. 303, 135–156. doi: 10.1016/j.jembe.2003.11.008
Stowasser G., Mcallen R., Pierce G. J., Collins M. A., Moffat C. F., Priede I. G., et al. (2009). Trophic position of deep-sea fish–assessment through fatty acid and stable isotope analyses. Deep-Sea Res. Part I 56, 812–826. doi: 10.1016/j.dsr.2008.12.016
Strandberg U., Vesterinen J., Ilo T., Akkanen J., Melanen M., Kankaala P. (2020). Fatty acid metabolism and modifications inChironomus riparius. Philos. Trans. R. Soc. B-Biol Sci. 375 (1804), 20190643. doi: 10.1098/rstb.2019.0643
Tam J. C., Link J. S., Rossberg A. G., Rogers S. I., Levin P. S., Rochet M. J., et al. (2017). Towards ecosystem-based management: identifying operational food-web indicators for marine ecosystems. Ices J. Mar. Sci. 74, 2040–2052. doi: 10.1093/icesjms/fsw230
Thompson R. M., Brose U., Dunne J. A., Hall R. O., Hladyz S., Kitching R. L., et al. (2012). Food webs: reconciling the structure and function of biodiversity. Trends Ecol. Evol. 27(12), 689–697. doi: 10.1016/j.tree.2012.08.005
Traugott M., Kamenova S., Ruess L., Seeber J., Plantegenest M. (2013). Empirically characterising trophic networks: what emerging DNA-based methods, stable isotope and fatty acid analyses can offer. Adv. Ecolog. Res. 49, 177–224.
Troedsson C., Simonelli P., Naegele V., Nejstgaard J. C., Frischer M. E. (2009). Quantification of copepod gut content by differential length amplification quantitative PCR (dla-qPCR). Mar. Biol. 156, 253–259. doi: 10.1007/s00227-008-1079-8
Viana I. G., Bode A., Bartholomew M., Valiela I. (2015). Experimental assessment of the macroalgae ascophyllum nodosum and fucus vesiculosus for monitoring n sources at different time-scales using stable isotope composition. J. Exp. Mar. Biol. Ecol. 466, 24–33. doi: 10.1016/j.jembe.2015.01.014
Wang W., Chen P., Yuan H., Feng X., Zhang L., Long X., et al. (2018). Analysis of seasonal variation of crustaceans community structure in zhelin bay of eastern guangdong. South China Fish Sci. 14, 29–39. doi: 10.3969/j.issn.2095-0780.2018.03.004
Wang Y. F., Hu Q. W., Yu J., Chen P. M., Shu L. M. (2019). Effect assessment of fishery resources proliferation in zhelin bay marineranching in eastern guangdong. South China Fish Sci. 15 (2), 10–19. doi: 10.12131/20180143
Wang X. X., Jin M., Cheng X., Hu X. Y., Zhao M. M., Yuan Y., et al. (2022). Lipidomic profiling reveals molecular modification of lipids in hepatopancreas of juvenile mud crab (Scylla paramamosain) fed with different dietary DHA/EPA ratios. Food Chem. 372, 131289. doi: 10.1016/j.foodchem.2021.131289
Závorka L., Blanco A., Chaguaceda F., Cucherousset J., Killen S. S., Liénart C., et al. (2023). The role of vital dietary biomolecules in eco-evo-devo dynamics. Trends Ecol. Evol. 38 (1), 72–84. doi: 10.1016/j.tree.2022.08.010
Keywords: fatty acid profile, trophic interactions, food web, diet composition, DHA/EPA, marine ranching
Citation: Li C, Lin H, Guo Y, Yu G, Ma Z, Pei K and Qin C (2023) Fatty acid analysis reveals the trophic interactions among organisms in the Zhelin Bay Marine Ranch. Front. Mar. Sci. 10:1132246. doi: 10.3389/fmars.2023.1132246
Received: 27 December 2022; Accepted: 17 April 2023;
Published: 03 May 2023.
Edited by:
Yang Jin, Carnegie Institution for Science, United StatesCopyright © 2023 Li, Lin, Guo, Yu, Ma, Pei and Qin. This is an open-access article distributed under the terms of the Creative Commons Attribution License (CC BY). The use, distribution or reproduction in other forums is permitted, provided the original author(s) and the copyright owner(s) are credited and that the original publication in this journal is cited, in accordance with accepted academic practice. No use, distribution or reproduction is permitted which does not comply with these terms.
*Correspondence: Chuanxin Qin, cWluY3hAc2NzZnJpLmFjLmNu