 Xiaocheng Fu
 Fenglei Du
 Xiang Pu
- Shanghai Nuclear Engineering Research and Design Institute Co., Ltd., Shanghai, China
Invasion or aggregation of marine organisms in cooling water intake systems (CWIS) has gradually become an important problem affecting the safety of nuclear power plants with environmental and climate changes. In this study, a 3-dimensional numerical model (TELEMAC-3D) was used to determine the impingement probability in a typical nuclear power plant with a once-through cooling system, and the effect on CWIS safety. The factors controlling impingement probability were also analyzed. Results show that (1) impingement probability decreased rapidly with an increase in distance from the CWIS. In addition, the distance of the impingement effect of a nuclear power plant with six units was mainly within 1 km of the CWIS. (2) Impingement probability increased with water withdrawal, and as distance to the CWIS increased, the increase in probability increased. (3) Generally, an increase in tide strength led to a decrease impingement probability. (4) Near the CWIS, the impingement probabilities of areas upstream or downstream of the CWIS along the tidal flow direction were much higher than those not in those areas. (5) An increase in water depth significantly reduced impingement probability. When the water depth of the CWIS increased from 5 m to 15 m, impingement probability was reduced up to 30%. Based on the above findings, the following suggestions were made to minimize the impingement effects on CWIS safety: first, the CWIS of coastal nuclear power plants should be set in an area with low aquatic biomass, strong tides, deep water, and few surface species within the range of 1 km, and second, the amount of cooling water withdrawal or velocity should be reduced as much as possible.
1 Introduction
Nuclear power provides about 10% of the world’s electricity from about 440 power reactors (World Nuclear Association, 2023). As the world’s second largest source of low-carbon power, nuclear power plays an important role in confronting climate change. At nuclear power plant (NPPs), cooling water is withdrawn from rivers, lakes, estuaries, and oceans through a Cooling Water Intake System (CWIS), for the purpose of dissipating waste heat. Most power plants use either once-through cooling or a closed-cycle cooling system. A once-through cooling system, which typically withdraws water in the range of tens of millions to billions of gallons per day, could lead to (1) the drawing of fish and shellfish eggs and larvae into and through the condenser cooling systems, and (2) trapping of fish against the screens that prevent debris from being drawn into the cooling water intake. These processes are referred to, respectively, as “entrainment” and “impingement” (Barnthouse, 2013). Impingement and entrainment could lead to loss of fish (eggs, larvae, juvenile, and adult), planktonic organisms, or other aquatic organisms (Merriman and Thorpe, 1976; Helvey, 1985; Boreman and Goodyear, 1988; Karas, 1992; Greenwood, 2008; White et al., 2010), and they also may result in the blockage of CWIS (WANO, 2007), thus threatening the stable operation of NPP. The increasing amount of waste, marine biota, sediment, sea ice, etc. could all aggravate the condition of blockage (Chen, 2009; Arefiev et al., 2015; Yan and Lu, 2016). The safety of cooling water intake has gradually become an important factor affecting the safe operation of nuclear power plants.
In a 2006 study, the World Association of Nuclear Operators found 44 blockages at NPPs since 2004 (WANO, 2007). Aquatic life was the most common material causing blockages, including algae and aquatic grasses, mussels, jellyfish, crustaceans (shrimp and crabs), and fish. Those materials contributed to 37 of the 44 blockage events. The remaining events resulted from accumulations of frazil ice (ice crystals forming in a body of water), depositions of sand and silt, and ingress of crude oil. An Electric Power Research Institute survey found that problems with debris are common (EPRI, 2015). Nearly 50% of facilities have been de-rated because of problems with debris, and slightly more than 10% have been shut down because of debris. In China, according to incomplete statistics, since 2014, there have been many incidents of sea creatures gathering and affecting unit operations (National Nuclear Safety Administration, 2016). For example, in July 2014, accumulations of jellyfish caused a rotating filter blockage at an NPP in northern China. Unit 1 and unit 2 of the circulating pumps jumped and the power plant ultimately shut down. In addition, in August 2015, many A. molpadioide (100–200 mm) invaded an NPP in southeastern China, which caused the circulating pumps to stop working and the emergency shutdown of unit 3. Such incidents not only lead to huge economic losses at NPPs but also affect power plant safety and stable operation. As a result, regulator departments, NPP owners, and related design institutes are focusing attention on the problem.
Studies currently primarily focus on how water intake blockage events develop in NPPs, feedback following blockages, and suggestions to improve early warning systems and prevent intake water blockage events (Ruan, 2015; Li et al., 2017; Meng et al., 2018). However, outbreaks of marine organisms as mechanisms causing blockage events of NPPs have not been fully investigated (Fu et al., 2020; Wang et al., 2022).
Chae et al. (2008) reported a seawater intake blockage event in a nuclear power plant at Uljin and discussed the impacts of warm surface current of the eastern Korean waters and the environmental factors related to the ecobiology of the large quantity of salpa. Prakash et al. (2012) found that the Salem power plant was invaded by seaweed from the intertidal swamp 3 miles away by using hydrological and seaweed migration models. Chen (2018) speculated that the blockage of nuclear power plants may be caused by the effect of ocean currents caused by typhoons, the disturbance of the bottom habitat, and the growth of A. molpadioidea. Yoon et al. (2022) analyzed the mechanisms and cause of the mass appearance and intrusion of S.fusiformis by field surveys and collected observational data.
To optimize water intake design and reduce the effects of water intake blockage, it is essential to determine the probability of biological impingement and its controlling factors. An empirical model has been applied for evaluating entrainment of aquatic organisms in NPPs ever since the 1970s (Eraslan et al., 1975; Swartzman et al., 1977; Boreman et al., 1978). With the development of computational fluid dynamics, numerical models became a useful tool for predicting blockages of water intake structures of NPPs through calculating the probability of biological impingement (Zhang et al., 1992; Prakash et al., 2014). In this paper, a high-resolution, non-structured, three-dimensional numerical model, the TELEMAC-3D, was used to systematically and quantitatively study the factors influencing the probability of biological impingement, including distance to water intake structure, quantity of water intake, tide pattern, tidal current direction, and water depth.
2 Materials and methods
2.1 Numerical model
The TELEMAC-3D system developed by the National Hydraulic and Environmental Laboratory of the Research and Development Directorate of the French Electricity Board (EDF-DRD. Website: http://opentelemac/org/) was used to simulate the hydrodynamic pattern in this study.
The model is based on continuity, momentum, and tracer equations and a turbulence closure scheme and solves each physical quantity of a fluid.
2.1.1 Continuity equation
The continuity equation (mass conservation equation) in the σ coordinate system is as follows:
where η is the free surface height, H = h + η is the total depth, and h is the depth under a flat free surface. Variables u and v are velocity components along x and y axes, respectively, in the Cartesian coordinate system, and is the vertical velocity in the σ coordinate system:
where w is the vertical velocity component in the Cartesian coordinate system.
To account for complex bathymetry of a research area, the σ coordinate system is used for the vertical discretization of hydrodynamic equations:
2.1.2 Momentum equation
After the σ coordinate transformation, the momentum equations along the x and y axes are as follows (Hervouet, 2007):
where f is the Coriolis parameter and ρ is the density of fluid. The subscript (0) denotes a reference value. Variables Nh and Nz are the horizontal and vertical eddy viscosities, respectively.
2.1.3 Tracer equation
The dynamic equation for a tracer is as follows (Hervouet, 2007):
where T is the density of a tracer (kg/m3) and Kh and Kz are the horizontal and vertical eddy diffusivities, respectively.
2.1.4 Turbulence closure scheme
The k-ϵ turbulence closure scheme is used in the TELEMAC-3D model:
where k is the turbulent kinetic energy (TKE):
where is the turbulent fluctuation of velocity.
The variable ϵ is the dissipation rate of TKE:
where is the kinematic viscosity.
The variable P is the shear production of TKE:
where is the squared shear.
The variable B is the buoyancy production of TKE:
where is the squared Brunt–Väisälä frequency.
2.1.5 Initial conditions
A flat free surface and a quiescent velocity field are initialized as follows:
The temperature field is initialized as follows:
The salinity field is initialized as follows:
Turbulent kinetic energy and dissipation rate are initialized as follows:
where kmin and ϵmin are the default minimum values of k and ϵ, respectively.
2.1.6 Boundary condition
The flow velocity at the intake is calculated based on the flow rate as follows:
where Uq is the flow velocity at the intake (m·s-1), Aq is the cross-sectional area of the intake (m2), and Qq is the flow rate at the intake (m3·s-1).
The sea boundary of the model is an open boundary. The eight major tidal constituents of M2, S2, N2, K2, K1, O1, P1, and Q1 are considered at the sea boundary. Harmonic constants of the eight constituents are used to calculate the tidal elevation at each tidal boundary node. The harmonic constants were collected from the global ocean model TPXO7.2. Calculation of tidal elevation at the open boundary was based on the following equation (Doodson, 1928):
where And are the constants for a tidal constituent, and are the amplitude (m) and phase lag (°), respectively, ω is the tidal frequency (°s-1), and is the initial phase (°). The subscript i denotes the number of each tidal constituent.
2.2 Mesh generation
The coastal NPP was in northeastern China (Figure 1). The water intake is shown in Figure 2. Bathymetry of the domain from admiralty charts was superimposed with survey data.
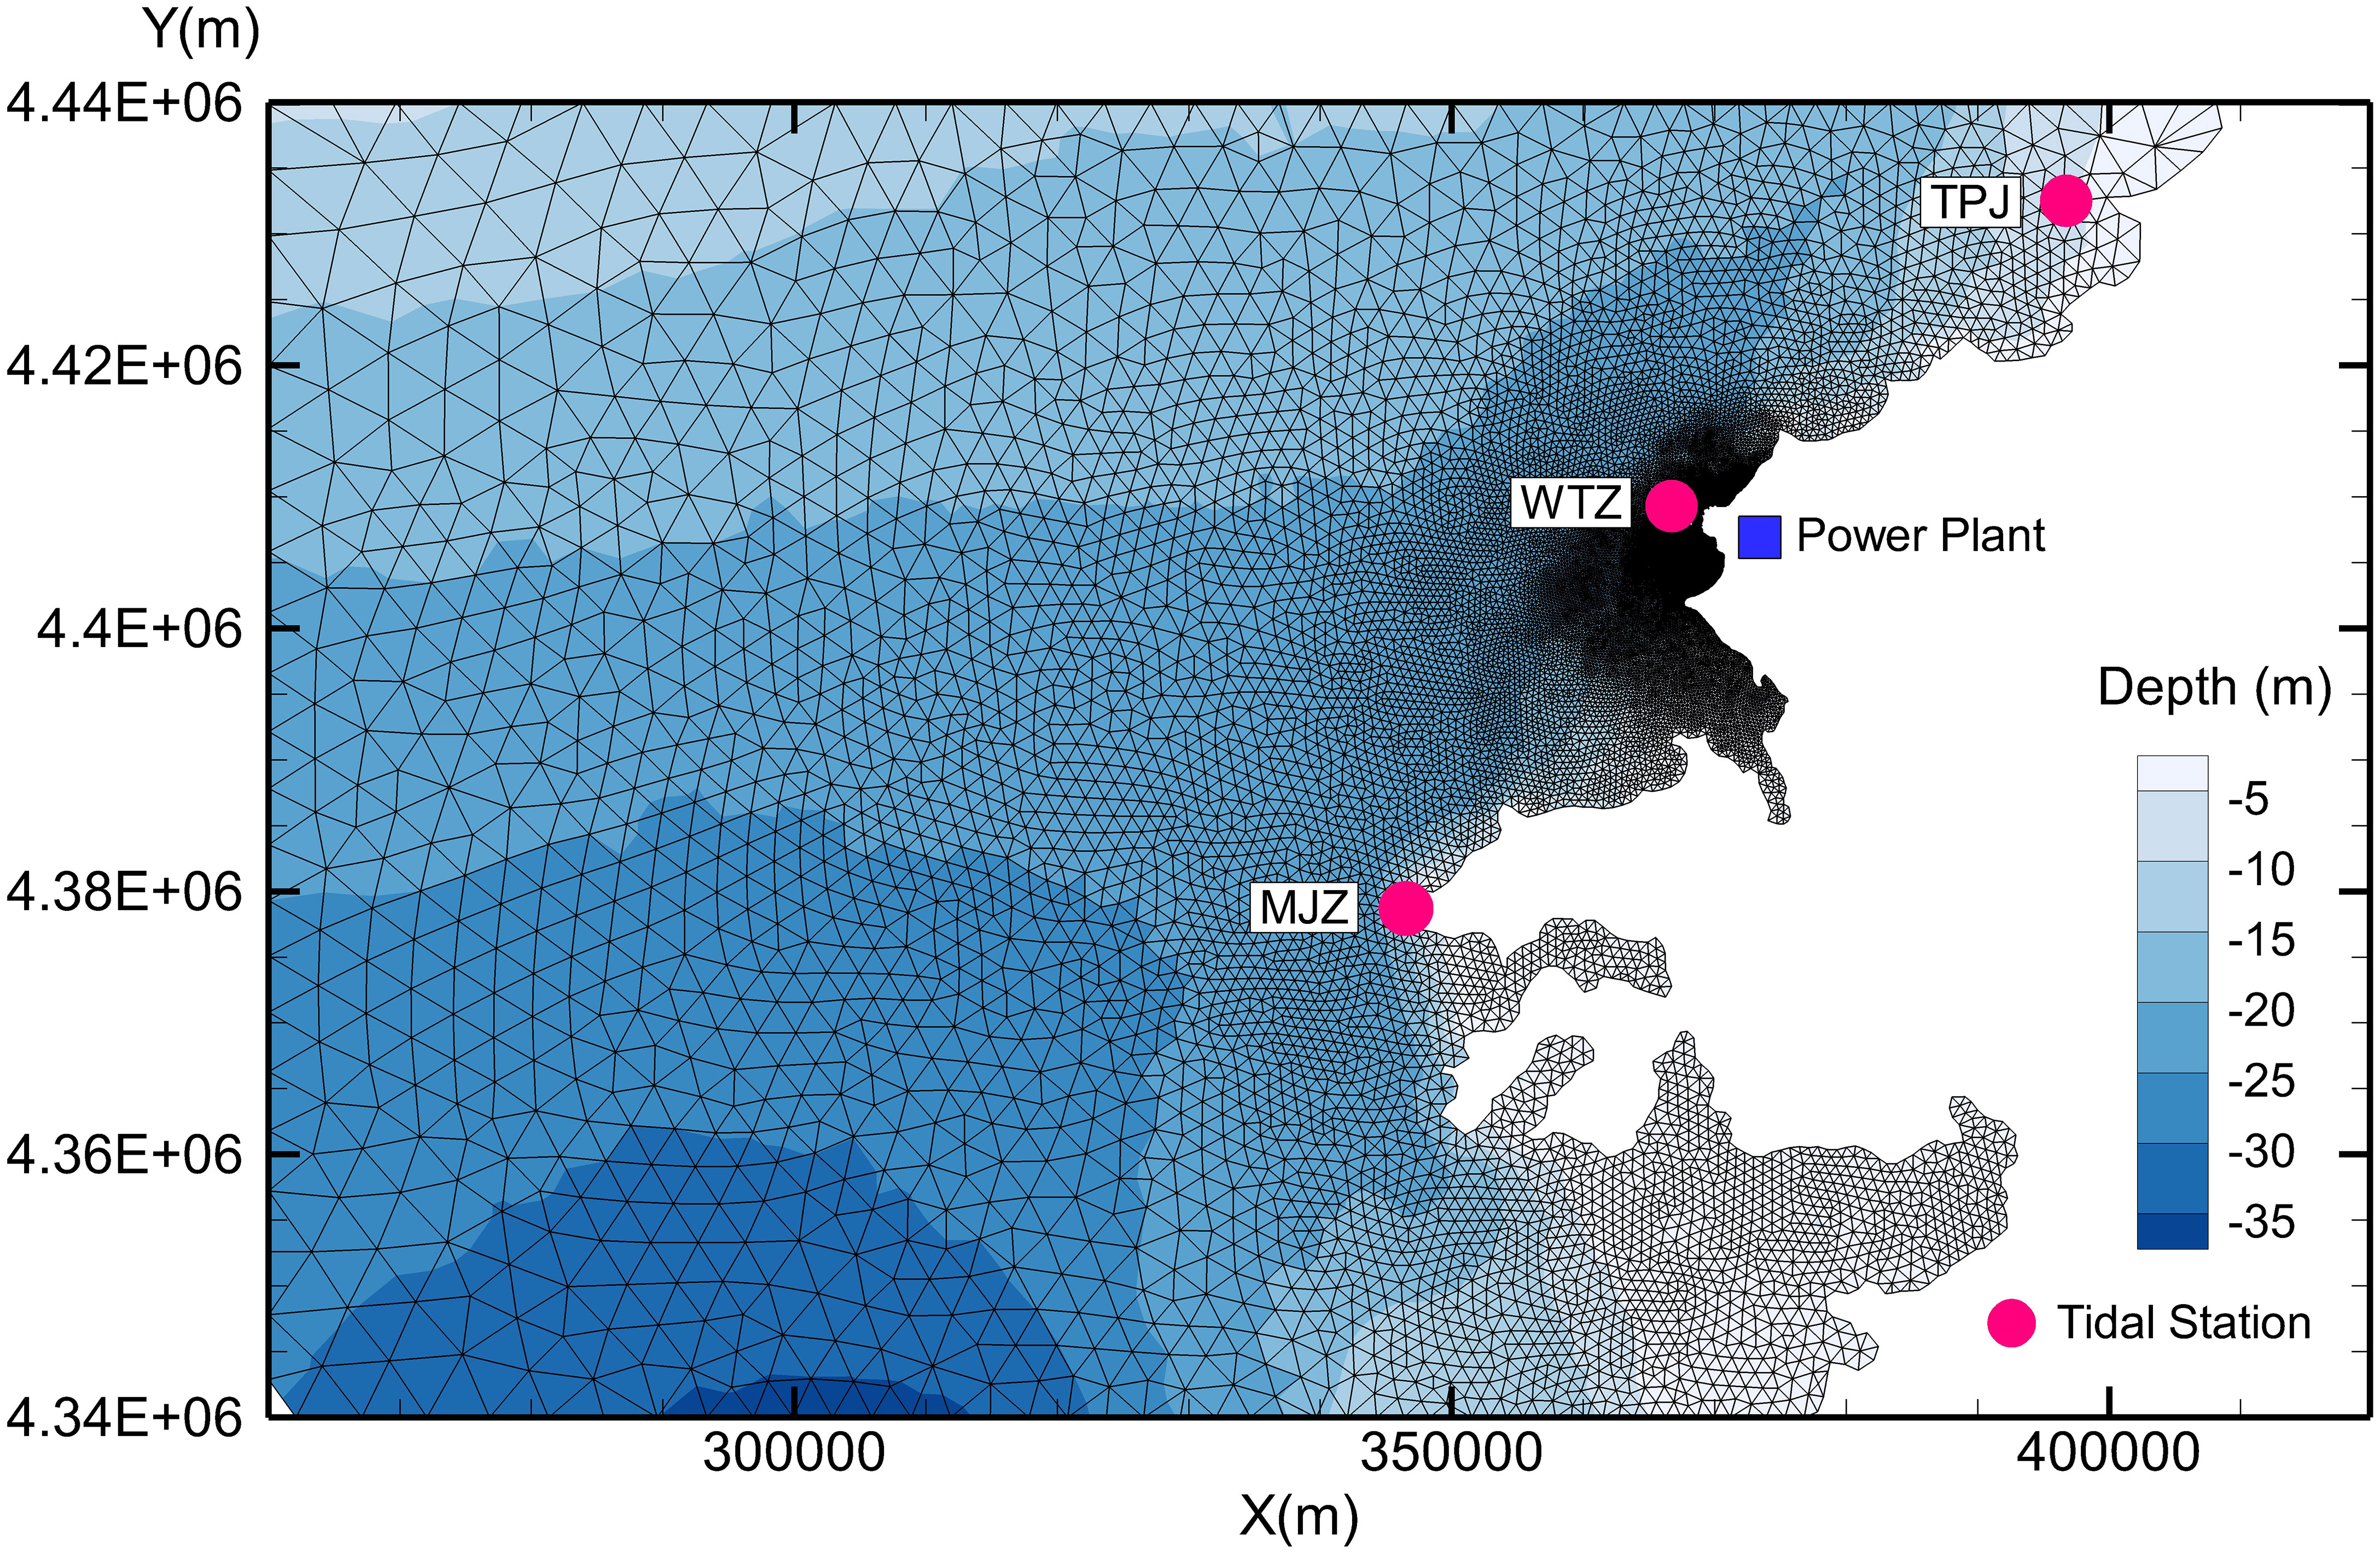
Figure 1 Bathymetry and mesh in the computational domain (red dots denote tidal stations).
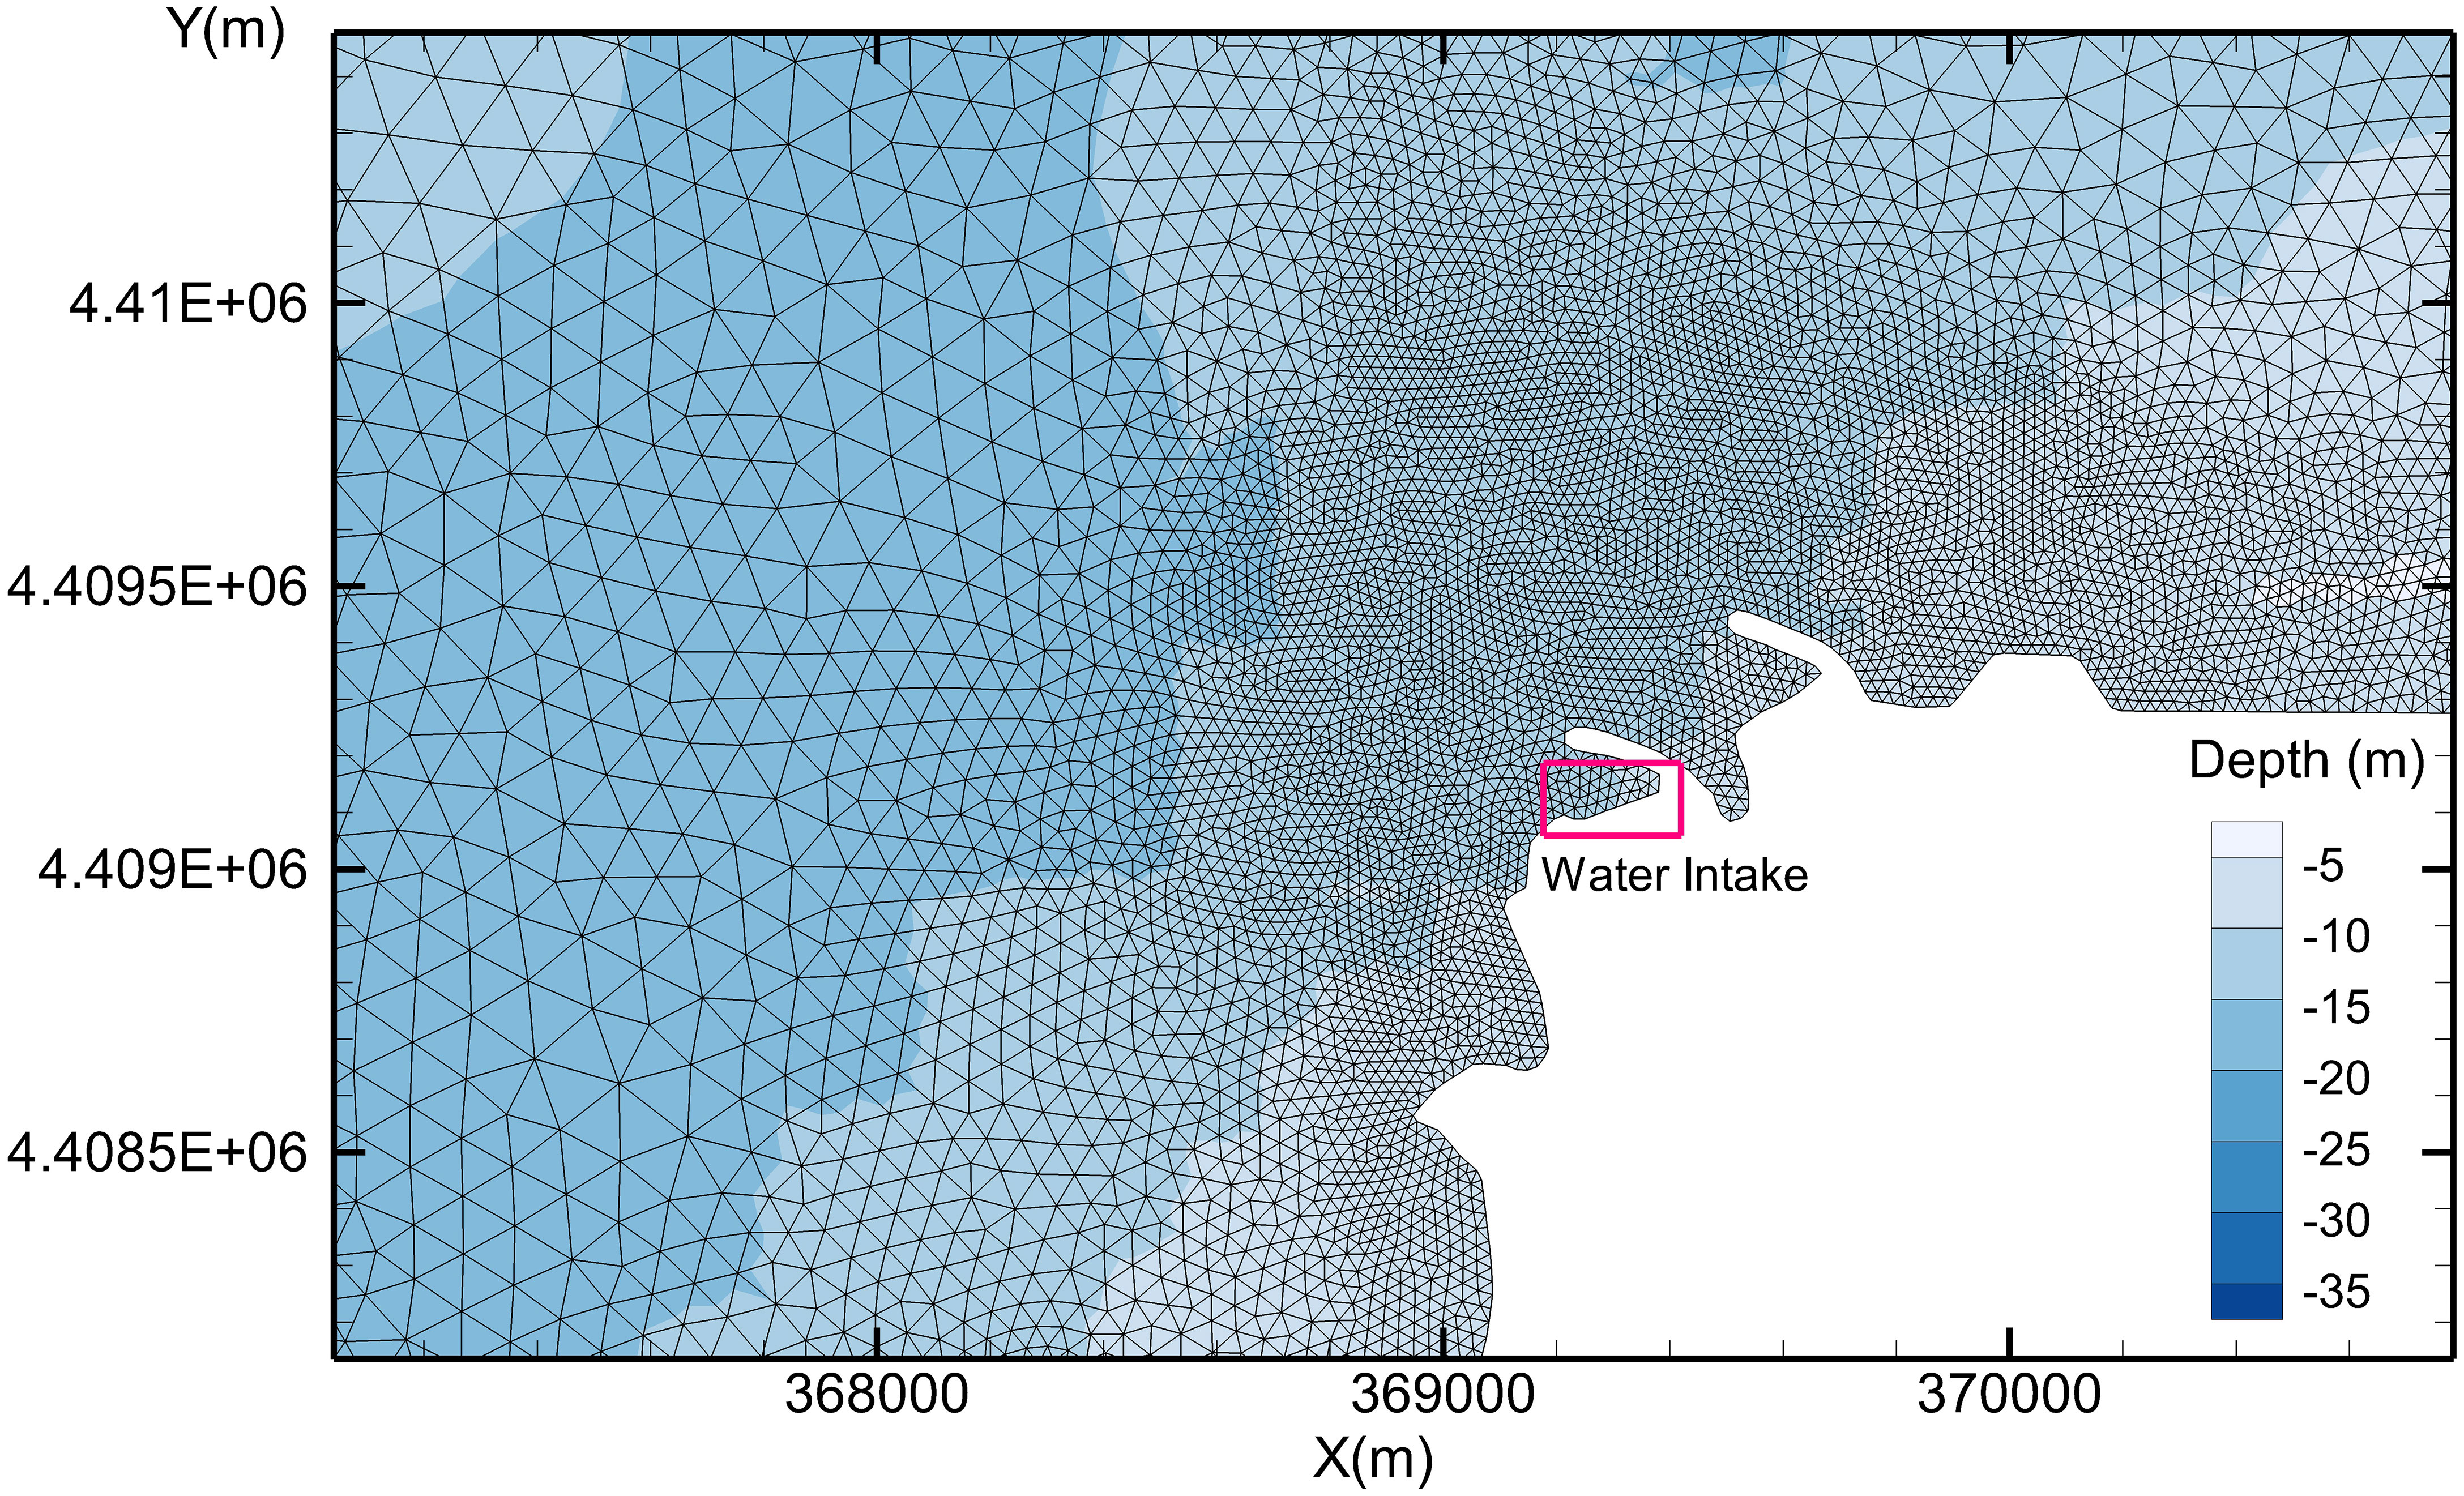
Figure 2 Bathymetry and mesh near the water intake.
The mathematical model used an unstructured triangular grid, with partial nesting at the intake and outfall, a minimum grid scale of approximately 10 m, a maximum grid scale of approximately 2,000 m, and a total number of grids of approximately 40,000. The computational grid of the area around the plant site is shown in Figure 1.
2.3 Validation
The hydrodynamic model was validated by observed data from three tidal stations (WTZ, TPJ, and MJZ; Figure 1) and four gauging stations (Figure 3) with tide height and velocity. Validation results are shown in Figures 4–6.
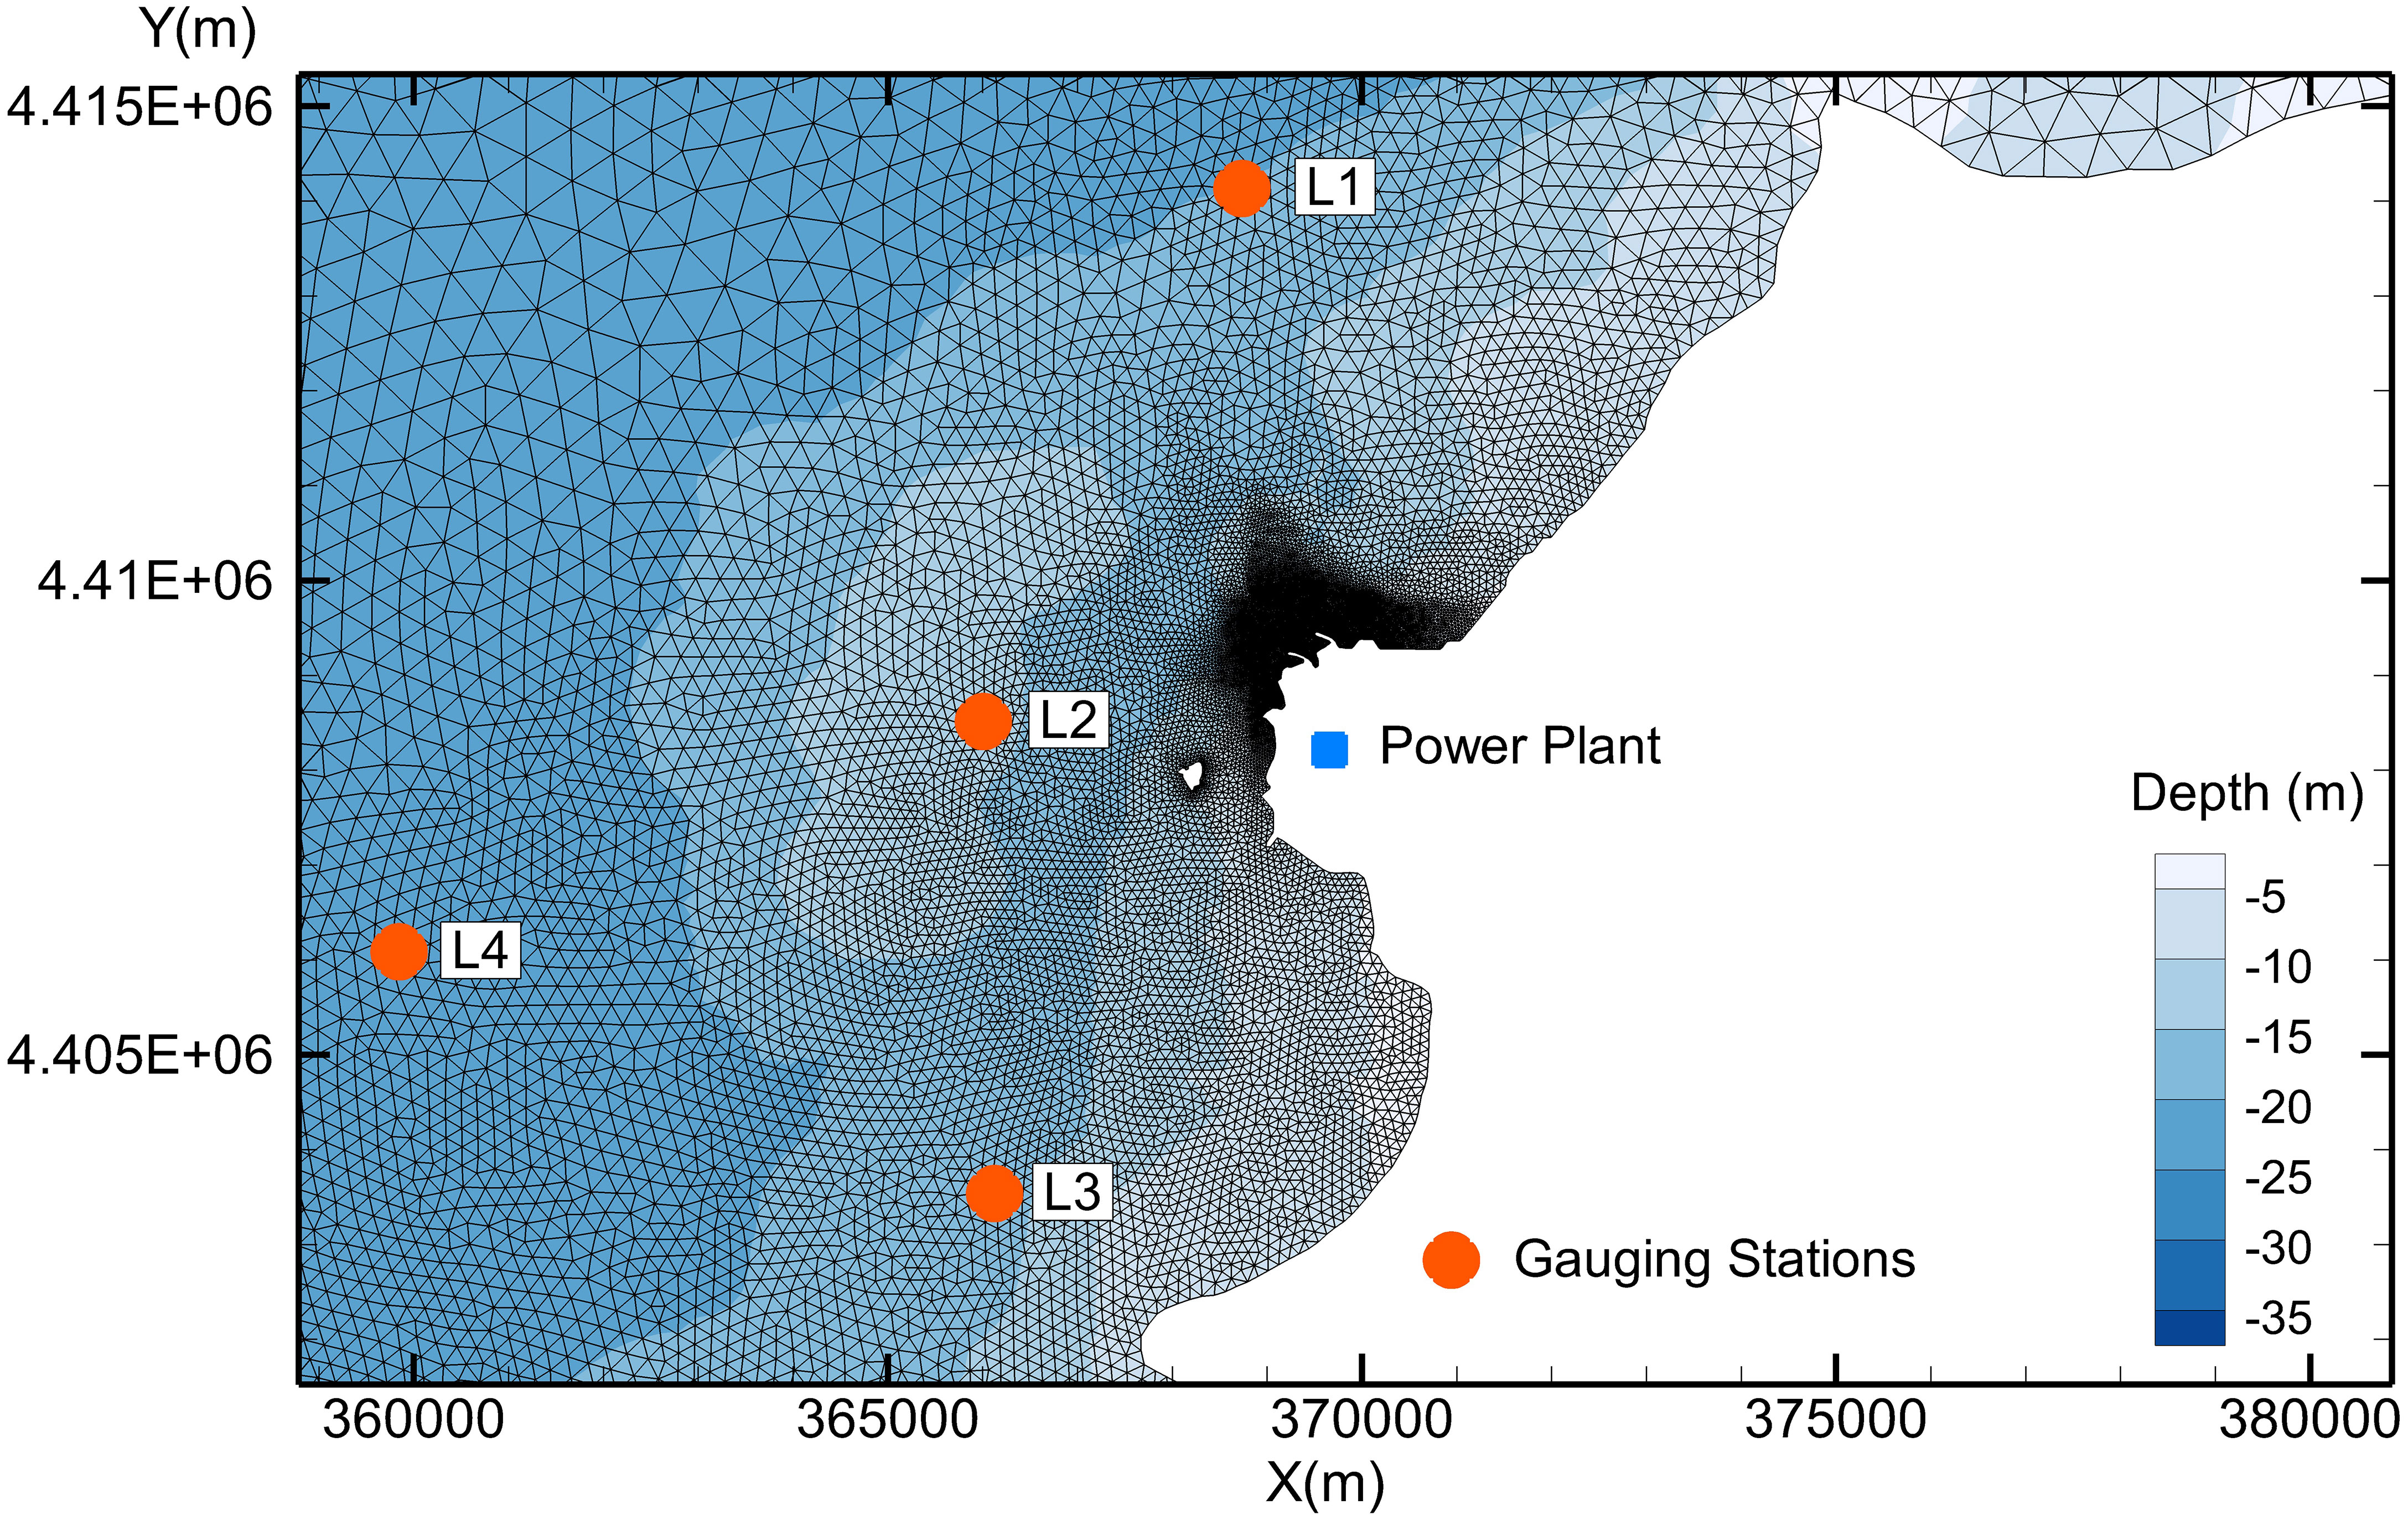
Figure 3 Gauging stations near the nuclear power plant.
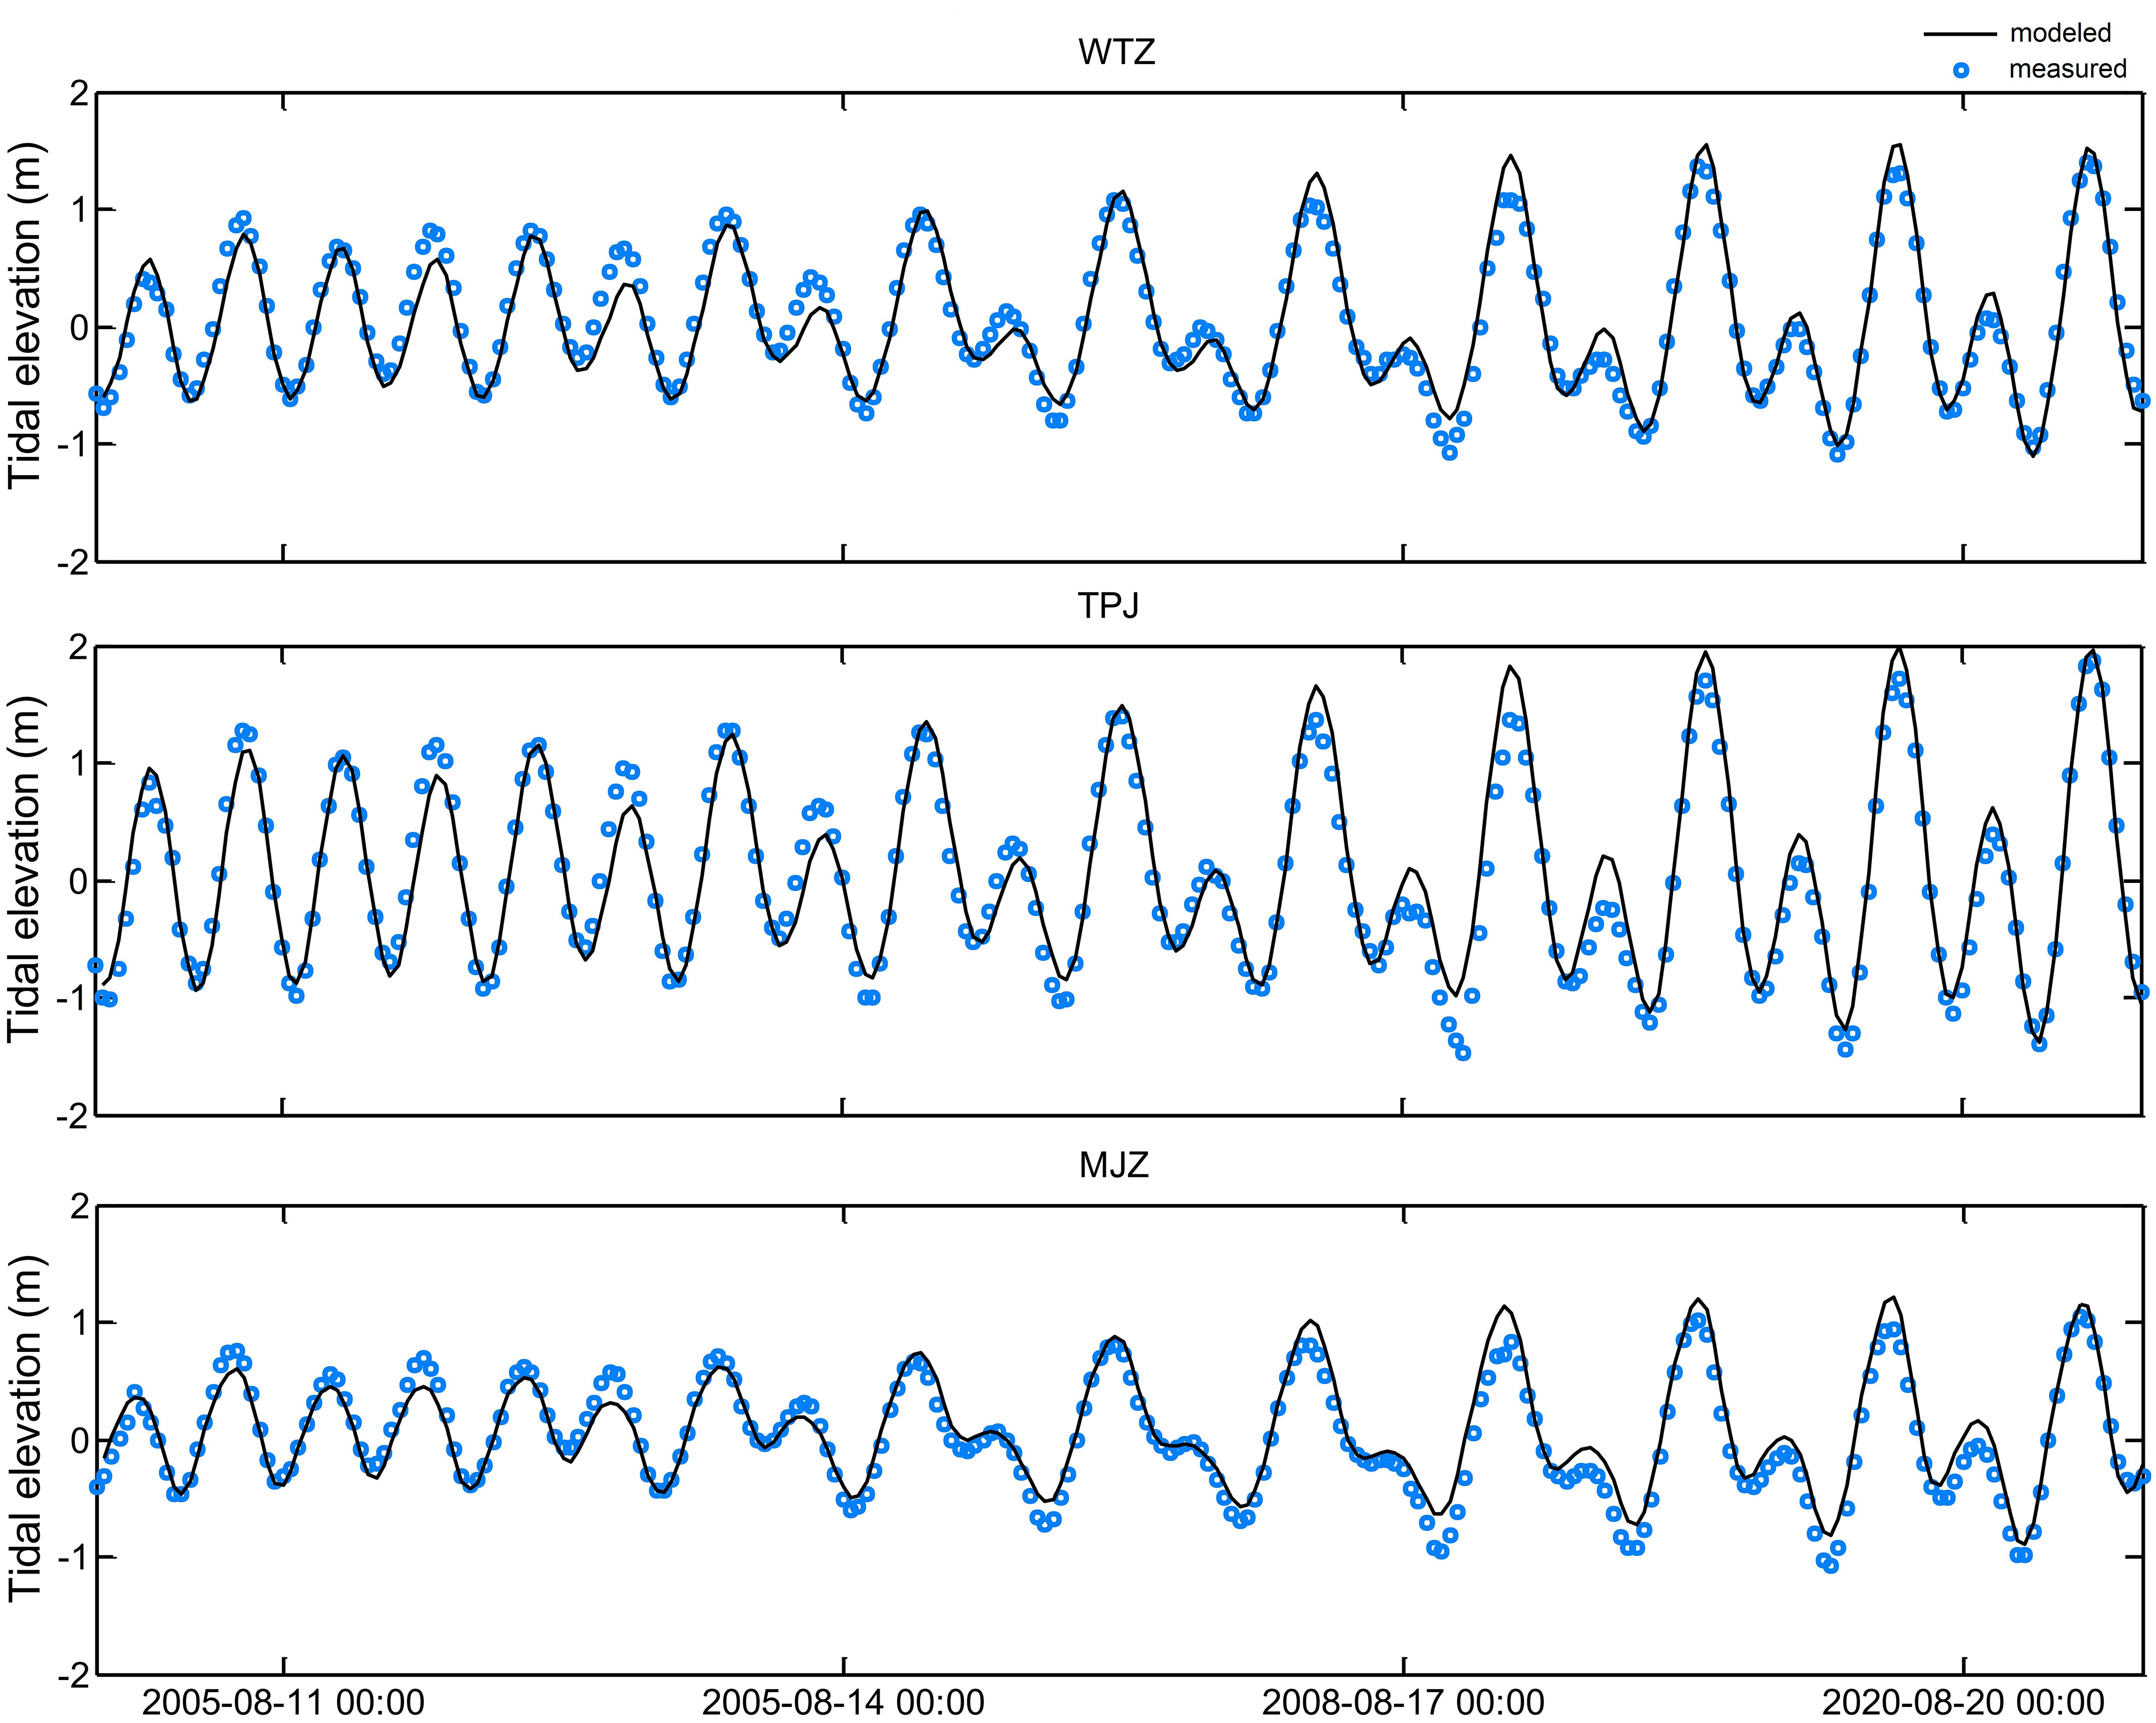
Figure 4 Comparison between modeled and measured tidal elevation at three tidal stations within the computational domain.

Figure 5 Comparisons between measured and simulated current speeds and directions on a spring tide at three gauging stations (L01, L02, and L03).
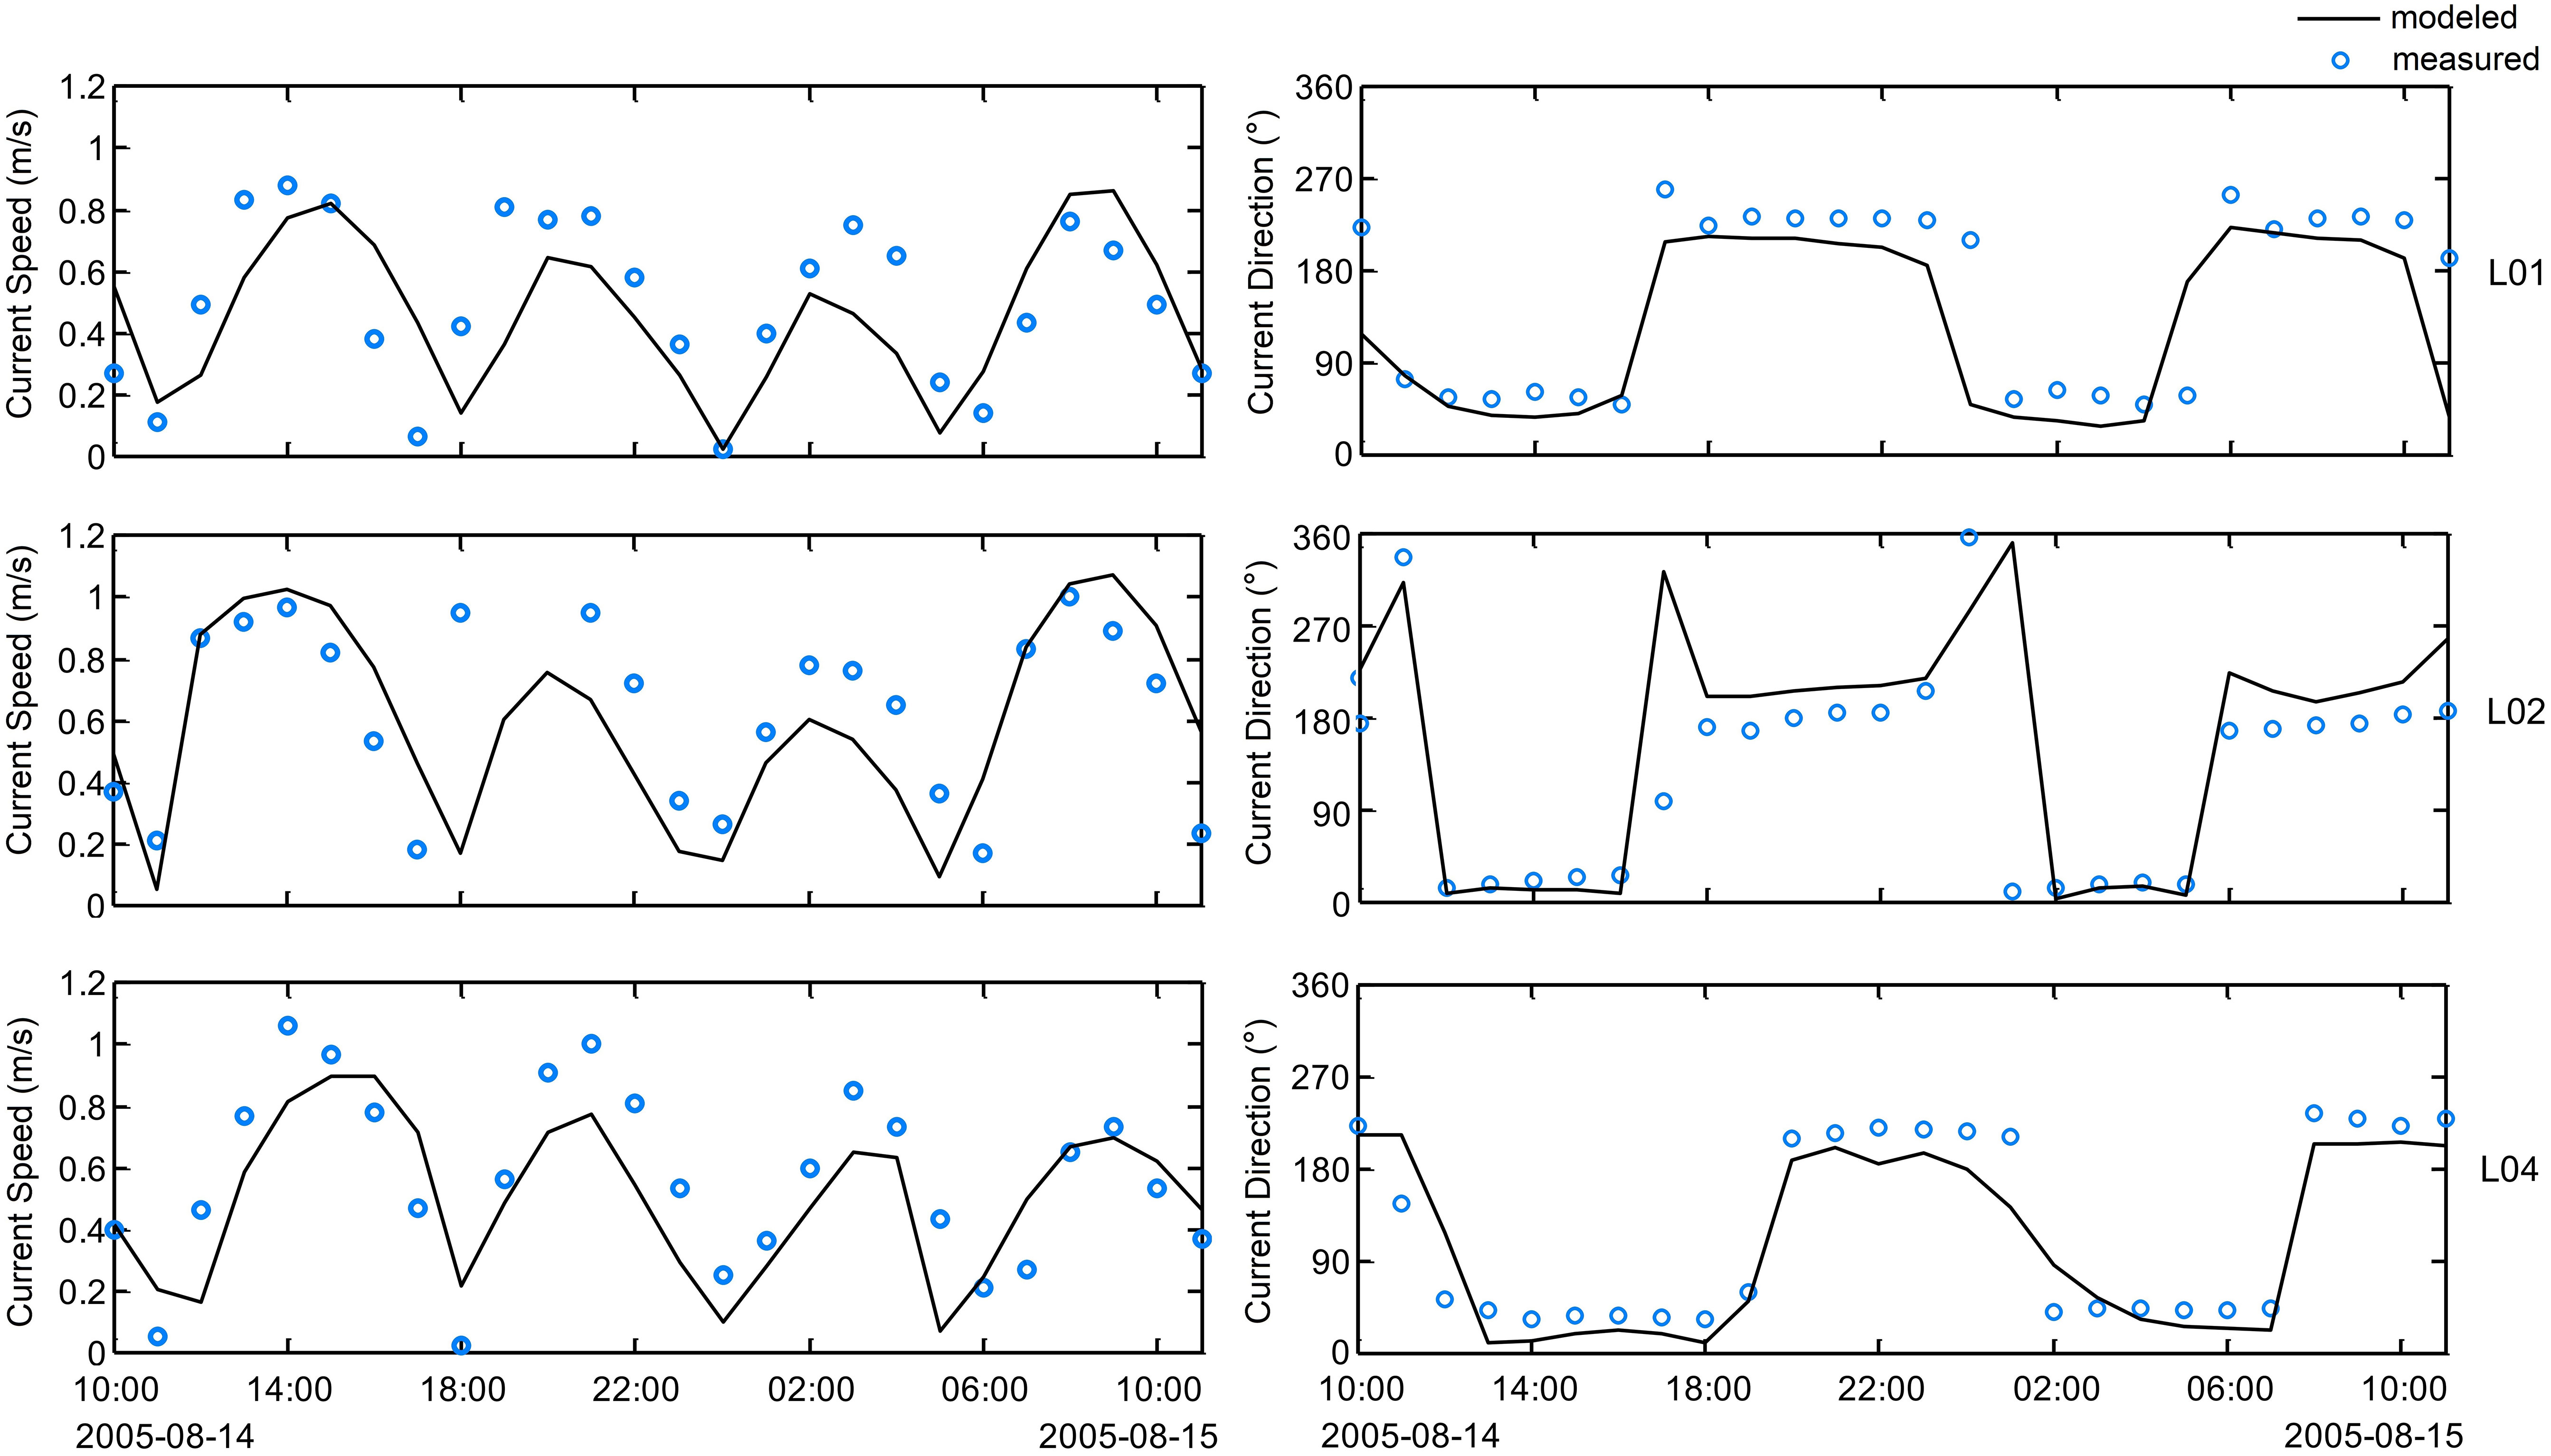
Figure 6 Comparisons between measured and simulated current speeds and directions on a neap tide at three gauging stations (L01, L02, and L04).
2.4 Simulated scenarios
2.4.1 Quantity of water intake
The water intake of the power plant was an open channel near the shore. The quantity of water intake has important effects on impingement. According to the power plant design, it had six units, with a total intake of 330 m3/s cooling water. Every two units used water at 110 m3/s. In this paper, the effects of water withdrawal at 110 m3/s and 330 m3/s were simulated.
2.4.2 Tide
Tide pattern is also a possible factor influencing impingement. Spring, moderate, and neap tides were analyzed, but results for spring and neap tides were used in this article. Bathymetry differences were also considered, and bathymetry was set at –5 m and –15 m in simulations. The general settings of simulated scenarios are listed in Table 1.
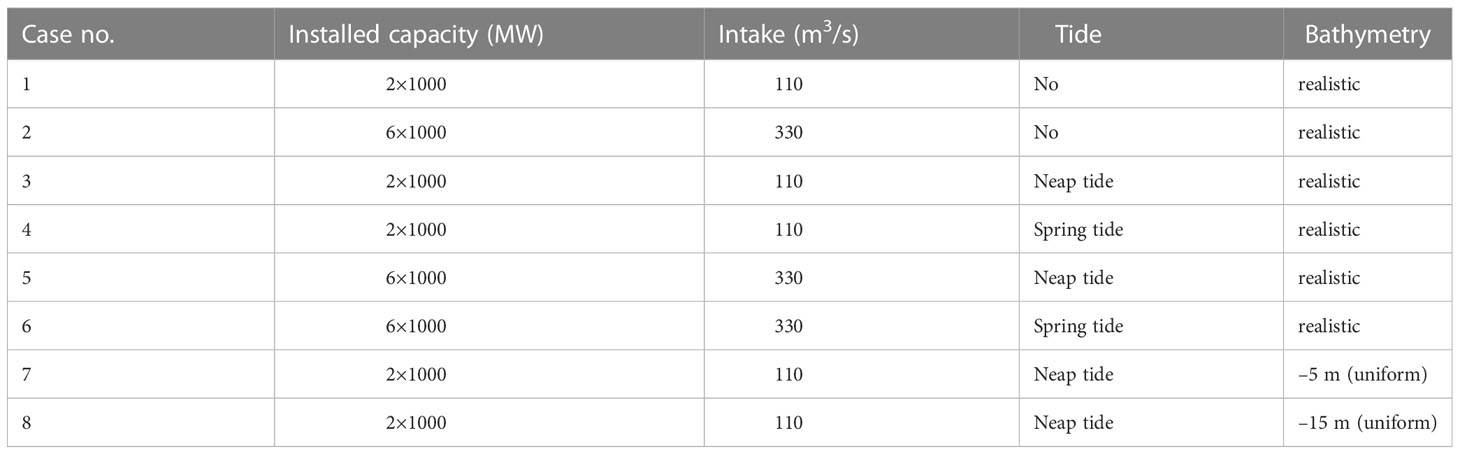
Table 1 General settings of model scenarios.
2.5 Impingement probability calculation
The operation of water intake and discharge facilities can cause significant changes in the flow field of the surrounding sea area, and such changes vary with different locations. Therefore, the impingement probabilities of aquatic organisms at different locations are not the same. To determine the impingement probability at a given location, biological tracers were released into the volume of the water (W0) at such a location with an initial density C0, hence the initial number of biological tracers was C0W0. Over time the biological tracers will spread and reach the intake where its density at the intake, Ci(t), will gradually decrease with time. Let Qp be the withdrawal rate at the intake, then the cumulative number of the biological tracers withdrawn at the intake, M(t), will be
Hence the impingement probability Ip(t) could be calculated by Eq.18.
In this study, the above method used for calculating the impingement probability is termed as “mass transport model”. A similar method has been used in the literature (e.g. Edinger and Kolluru, 2000).
For the simulated scenarios, the intensity of impingement effect at different locations was estimated in two primary steps. Firstly, the impingement influenced area in the vicinity of the water intake was analyzed by using a numerical model without considering the tidal conditions. Secondly, the main influenced area was divided into several subregions, and the impingement probability in each subregion was calculated.
3 Results
3.1 Impingement influenced area
Nuclear power plants with a direct current circulation cooling scheme have large withdrawal and discharge volumes, which can significantly change the flow field in the nearby sea area. To quantitatively analyze the influences of withdrawal and discharge of a typical coastal plant site on the surrounding flow field, simulations were conducted of case 1 and case 2 without considering the tidal effect. This can be achieved by settling the amplitude of each tidal component to 0m at the tidal open boundary in numerical model. In case 1, when only the action of water intake was considered, the maximum flow velocity near the water intake reached 0.12 m/s, the flow velocity of the outermost area of the embankment on the north side of the intake (approximately 200 m from the intake) was approximately 0.05 m/s, and the flow velocity of the area approximately 400 m from the intake was approximately 0.01 m/s (Figure 7). Because the impingement mainly occurred by plankton with weak swimming ability and that drift with the waves, the area with flow velocity greater than 0.01 m/s was considered a conservative estimate of the possible influence range of the impingement.
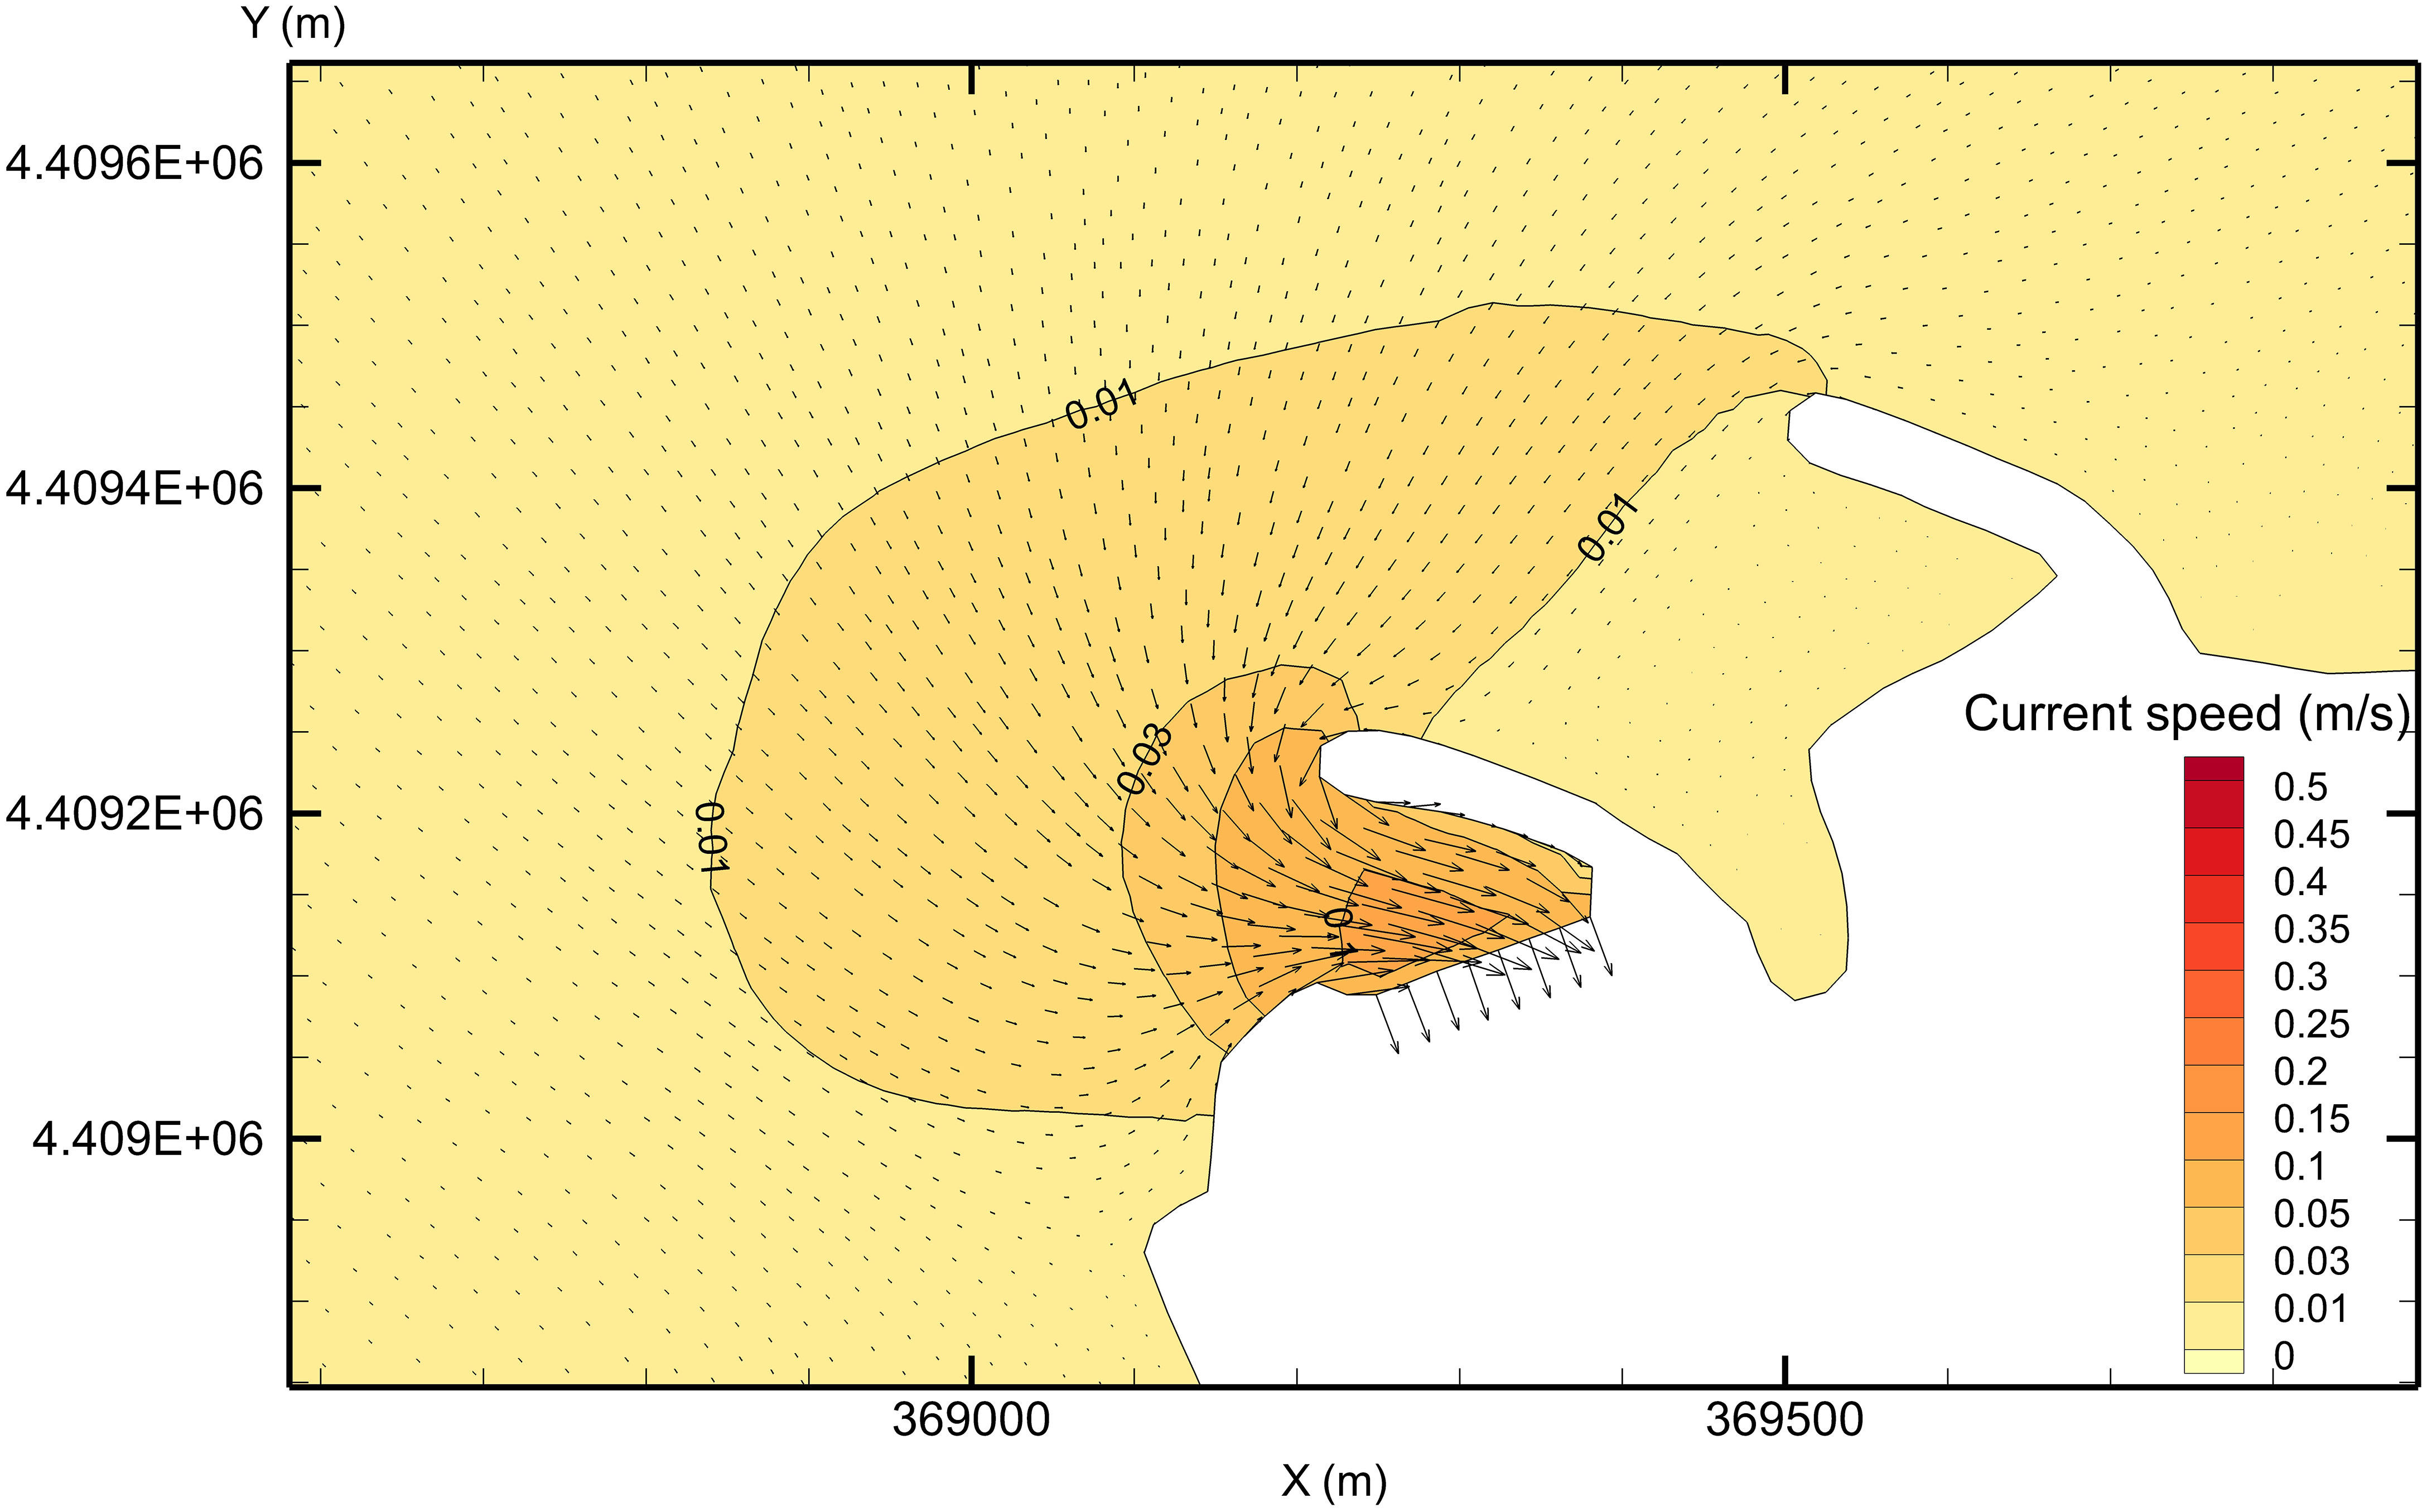
Figure 7 Flow field near the cooling water intake system in case 1 (no tide).
In case 2, the maximum flow velocity near the water intake area reached 0.35 m/s, the flow velocity in the outermost area of the embankment on the north side of the intake (approximately 200 m from the intake) was approximately 0.15 m/s, and the flow velocity in the fan-shaped area approximately 400 m from the intake was approximately 0.05 m/s. Overall, in case 2, the water intake of 330 m3/s influenced the flow field in the surrounding area to approximately 1,000 m (with the extent of 0.01 m/s as the limit; Figure 8).
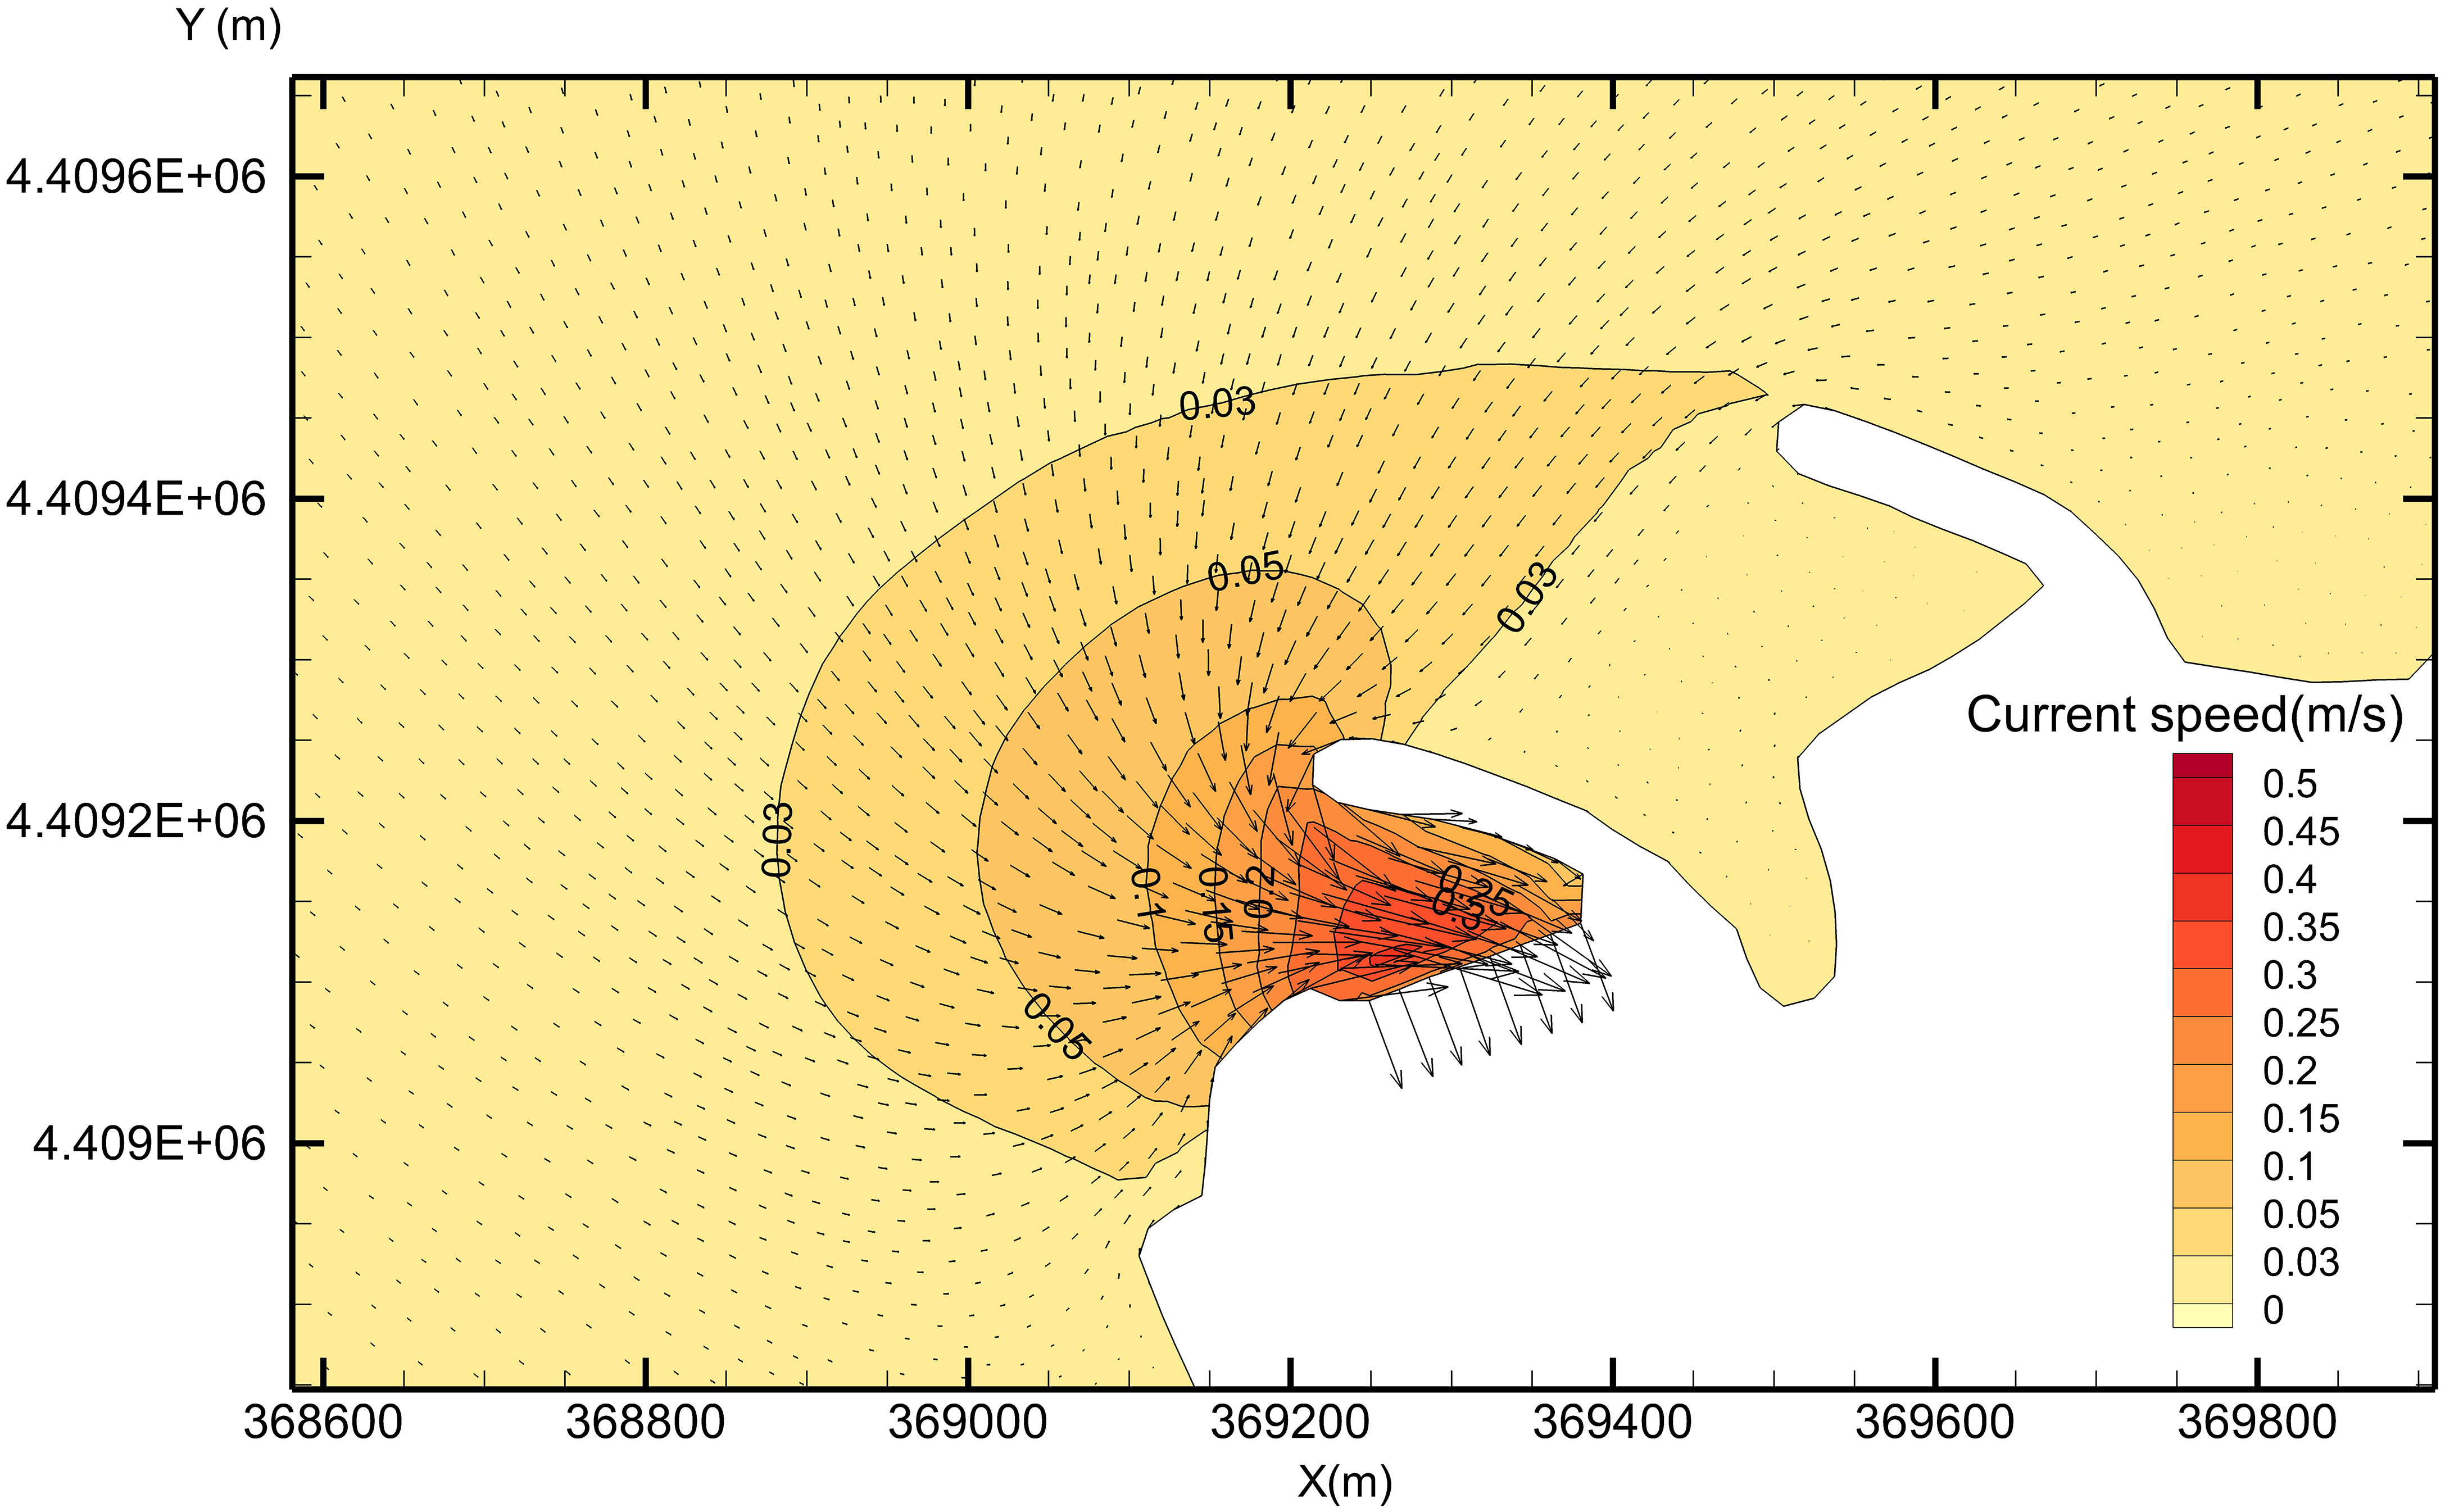
Figure 8 Flow field near the cooling water intake system in case 2 (no tide).
According to the simulations, the possible area where the impingement effect takes place covered approximately 400 m in radius around the water intake when the water withdrawal of the power plant was 110 m3/s. When water withdrawal of the power plant increased to 330 m3/s, the impingement area enlarged to 1 km in radius from the water intake. The results are in general agreement with actual field measurements (Kang et al., 2018).
The distance influenced by impingement will differ at different sites with different water withdrawals, layout characteristics of water intake, and water depth around water intake. However, the results in this study are meaningful for further research. In this study, the focus area for simulation and analysis of impingement probability was set within 1 km from the water intake.
3.2 Distance from the water intake
Based on the determination of the influenced area, the area of the impingement probability analysis was set within an approximate range of 1 km from the water intake and expanded as appropriate.
To further quantify the probability of impingement at different locations near the water intake, the sea area near the water intake was divided into 11 subzones that were 500 m × 500 m (T1–T11; Figure 9). The initial density of biological tracers in 11 water bodies was separately set to 1 (normalized). The density of biological tracers in other areas was set to 0. When the model calculation began, density of biological tracers in a subzone gradually decreased due to water intake. After calculating for a certain time (e.g. several days), the total amount of tracers in the calculation domain remained almost unchanged, indicating that the tracers that remained were far from the water intake. At that time, the difference between the remained and initial number of tracers was the impinged part by water intake.
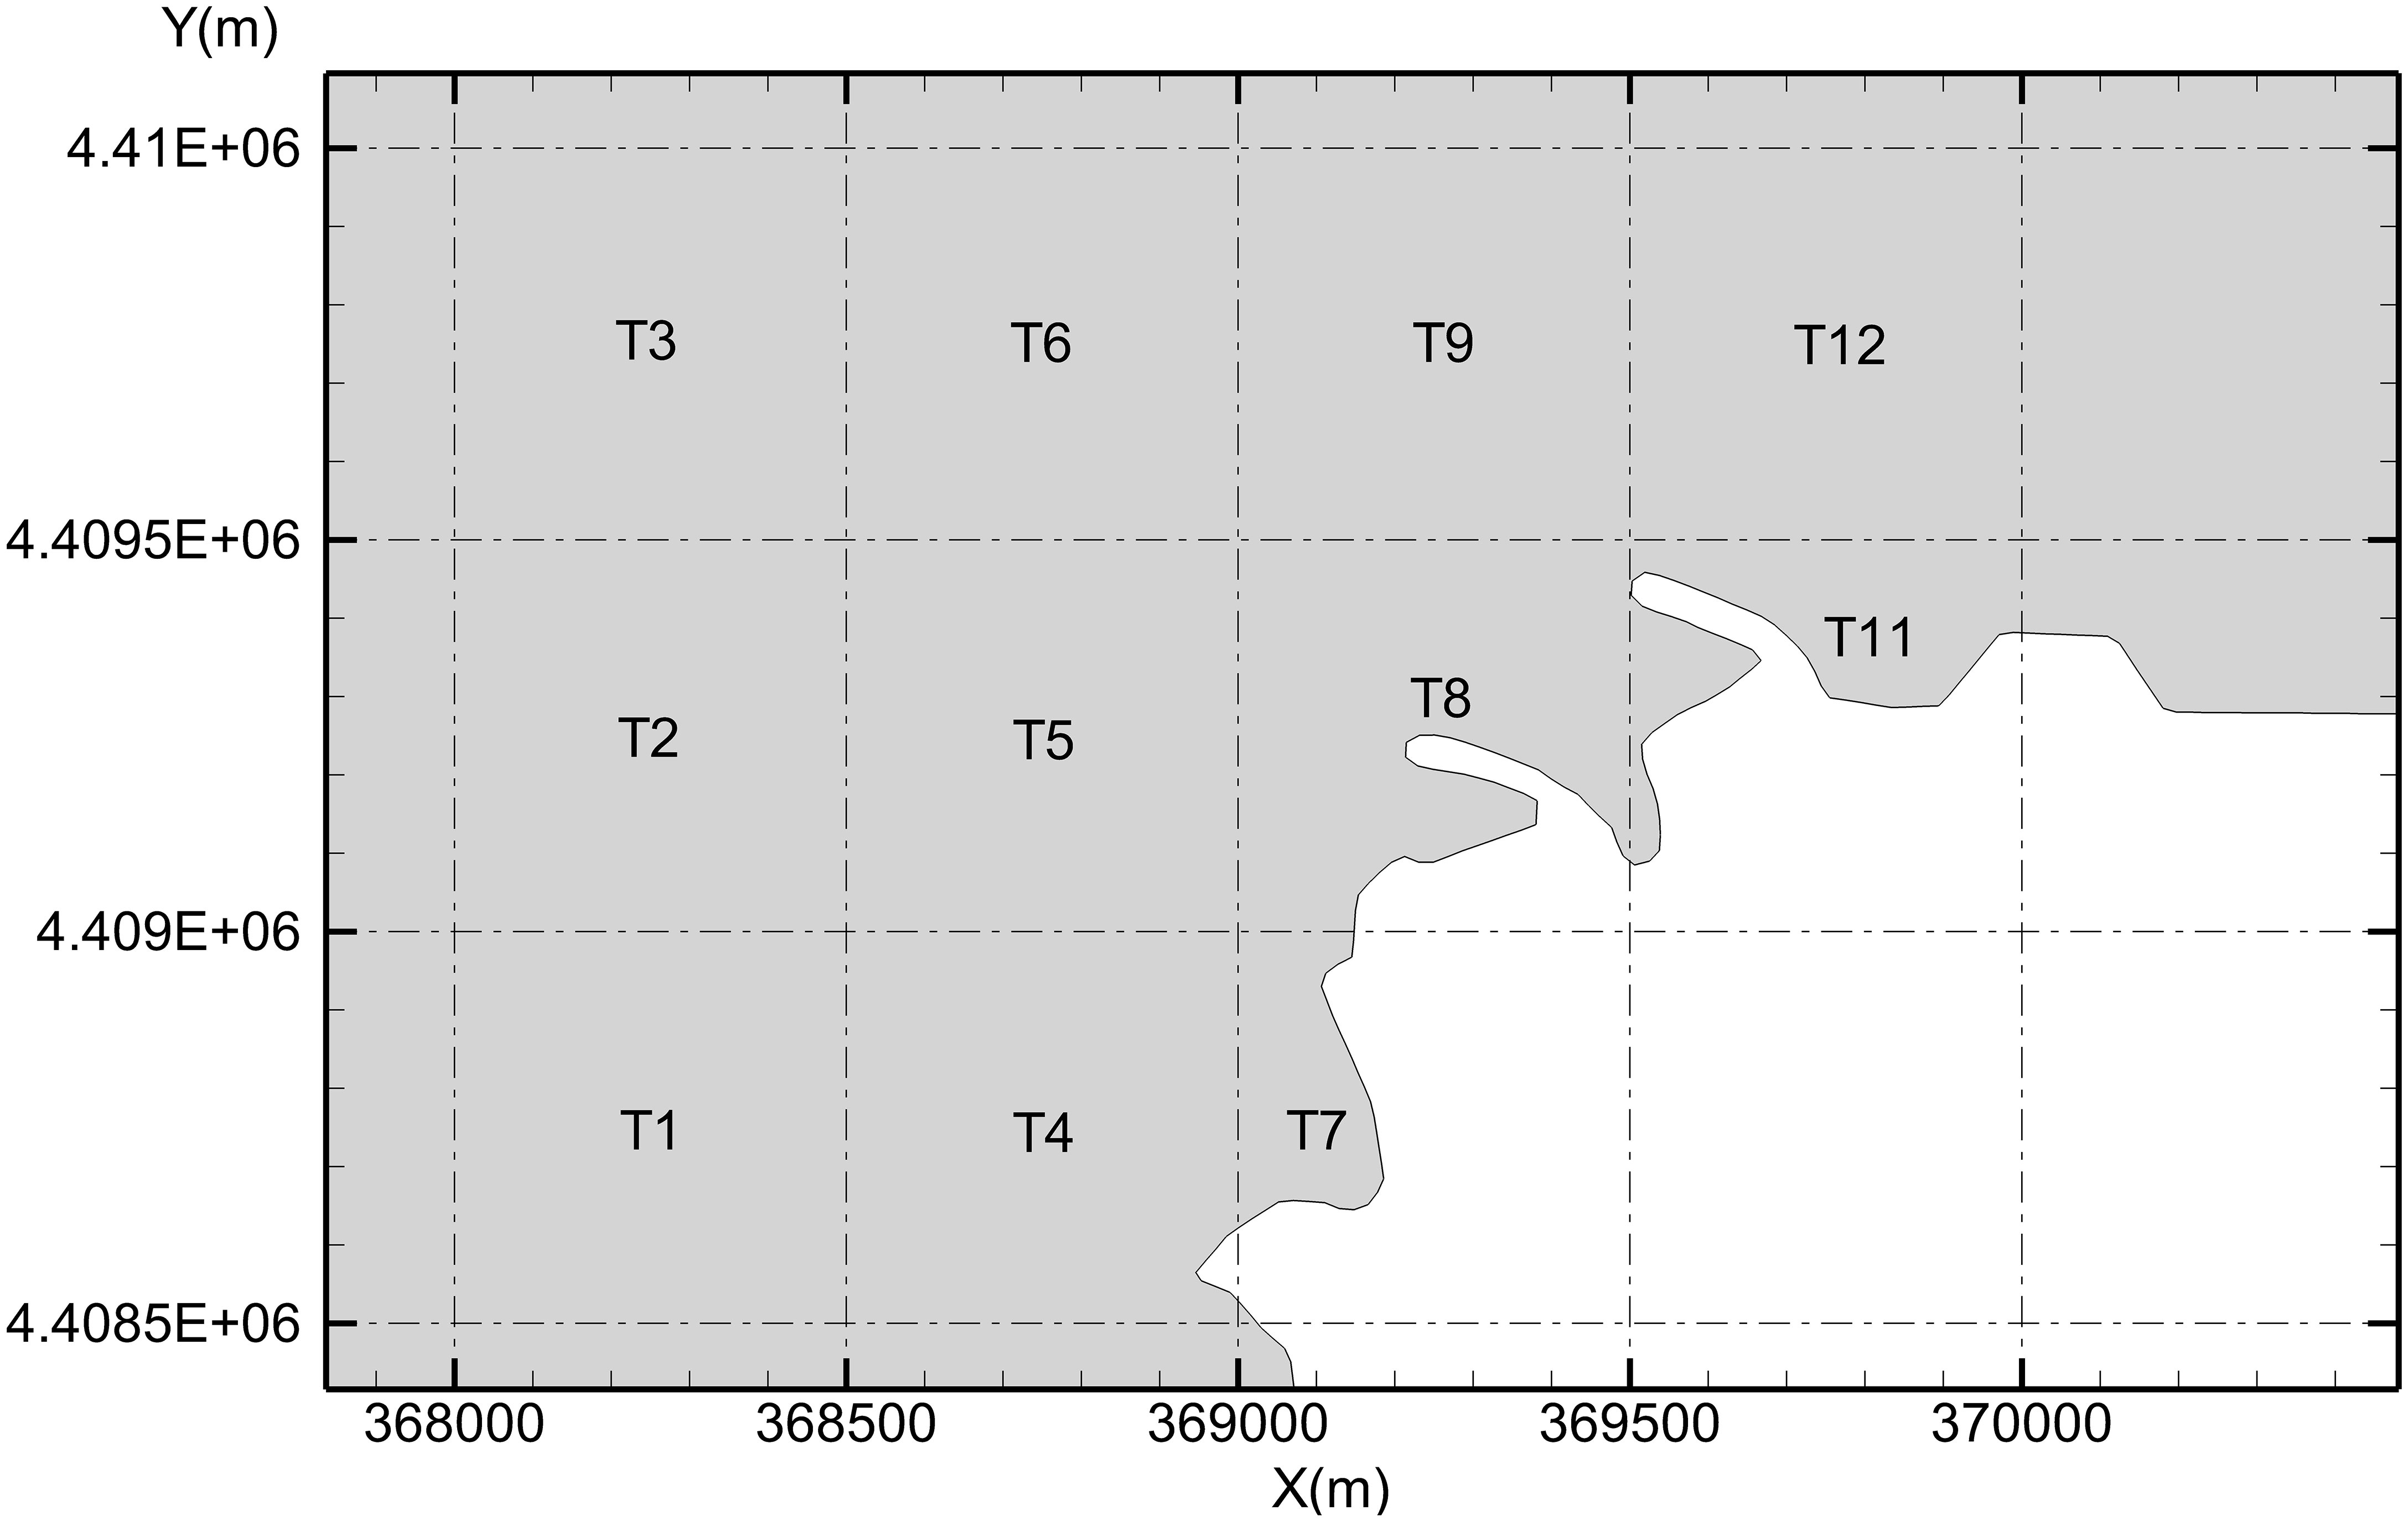
Figure 9 Computation subdomains for the probability of entrainment.
Probabilities of impingement in the subzones near the water intake in case 3 (neap tide, 2 units), case 4 (spring tide, 2 units), case 5 (neap tide, 6 units), and case 6 (spring tide, 6 units) are shown in Figures 10, 11. In case 3, the probability of impingement in the area within approximately 300 m from the water intake (subzone T8) reached 45.78%, and the probability in the adjacent subzones T10 (to the east) and T7 (to the south) also reached 32.97% and 35.84%, respectively. By contrast, the probability of impingement within 1 km from the intake was close to 1%. In case 5, the probability of impingement in the area within approximately 300 m from the water intake (subzone T8) reached 83.49%, and the probability in the adjacent subzones T10 and T7 also reached 72.34% and 60.23%, respectively. Within 1 km from the intake, the probability of impingement was close to 5%.

Figure 10 Probabilities of impingement near the cooling water intake system for the site with two units installed capacity. (A) Neap tide; (B) spring tide.
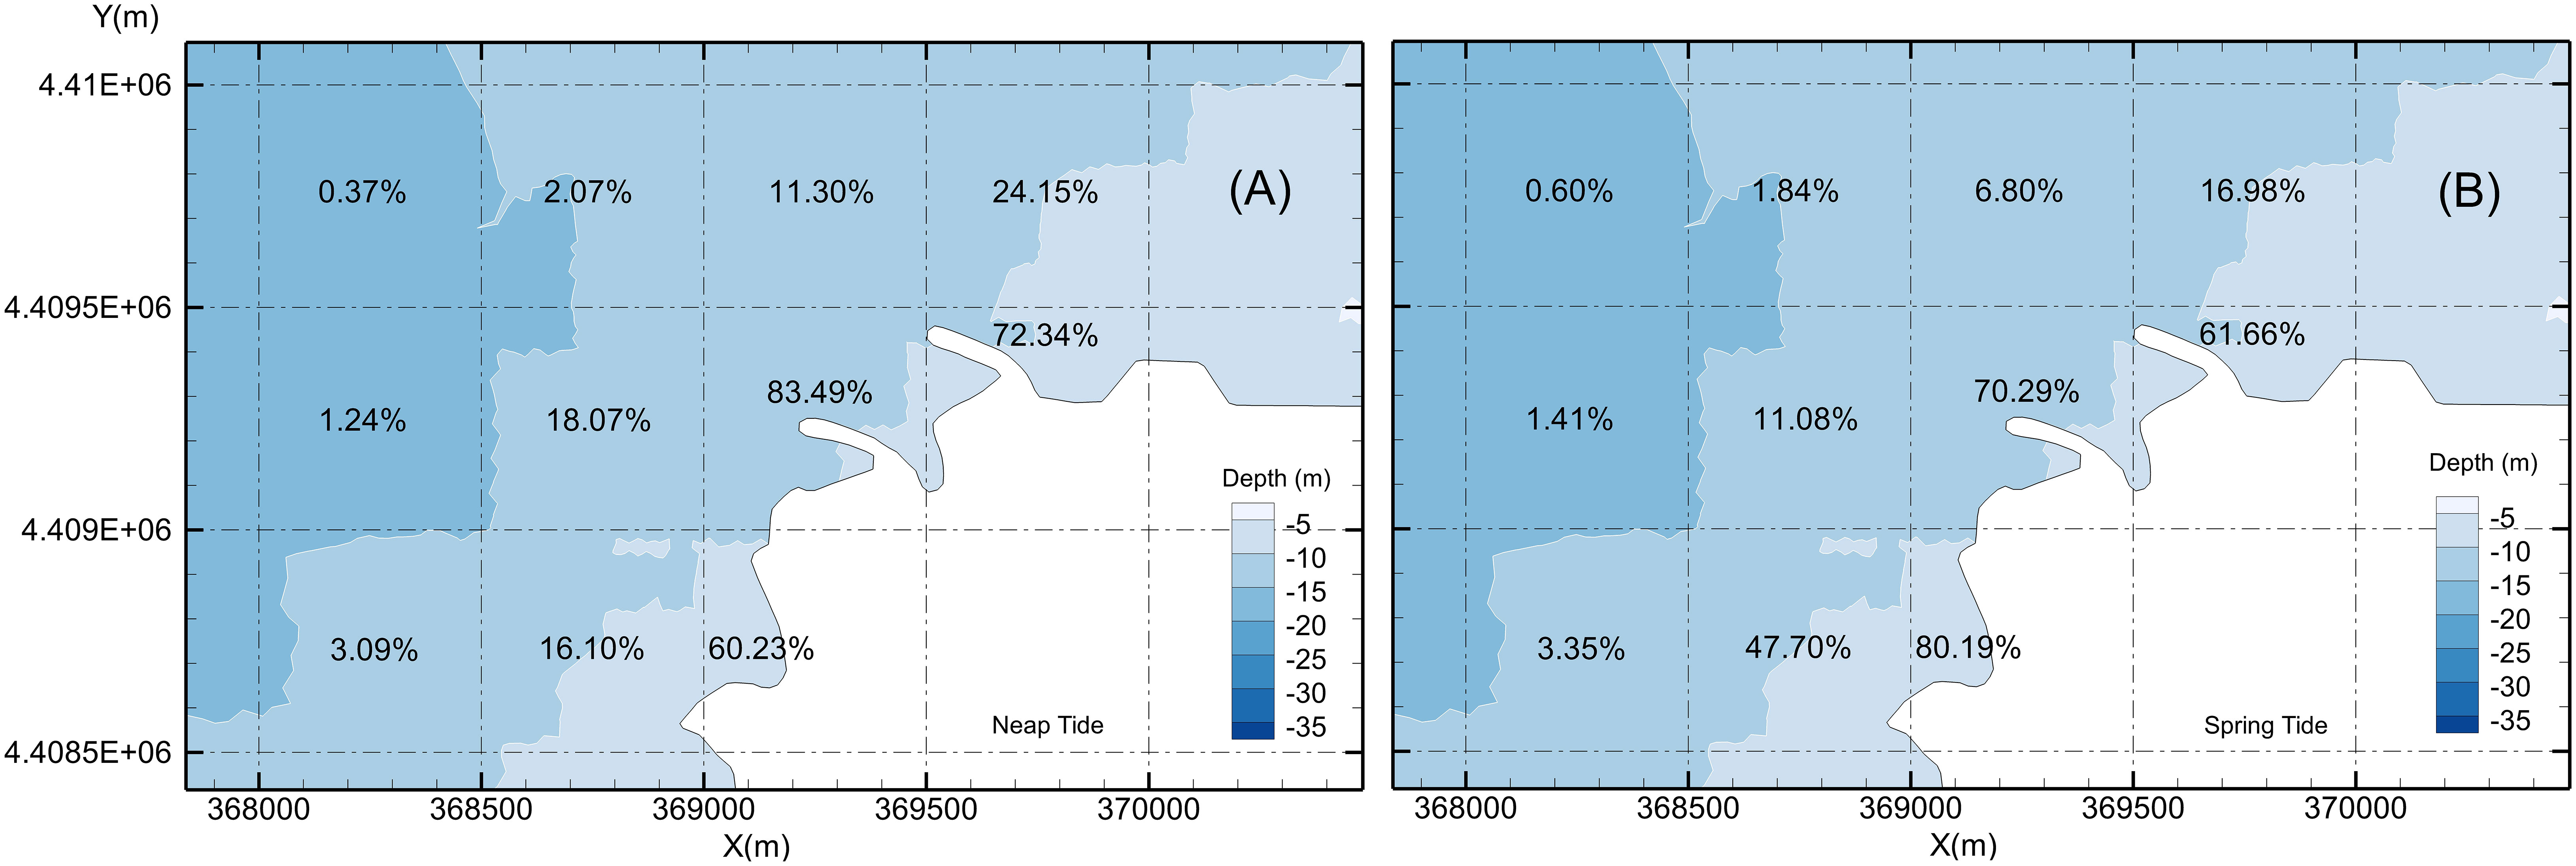
Figure 11 Probabilities of impingement near the cooling water intake system for the site with a capacity of six installed unit. (A) Neap tide; (B) spring tide.
The results indicated that under the combined effect of water withdrawal and tide, the impingement effect of a typical coastal site mainly occurred within a 1-km area from the water intake, and as the distance to the water intake decreased, the probability of impingement increased.
3.3 Quantity of water intake
The difference in the probability of impingement at the same location under the same tidal pattern between different quantities of water intake can explain the effect of water withdrawal on the probability of impingement.
The probability of impingement for six units was significantly higher than that for two units (Figures 10, 11). In case 5, the probability of impingement was 83.49% in T8, 72.34% in T10, and 60.23% in T7. In case 3, the probability of impingement was 45.78% in T8, 32.97% in T10, and 35.84% in T7. The results indicated that the increase in water intake significantly increased the probabilities of impingement. In case 3, the probability of impingement was 2.57% in subzone T5 (to the west) and 2.65% in subzone T9 (to the north). In case 5, the probability was 18.07% in T5 and 11.3% in T9. These indicated that increases in impingement probabilities due to increase in water withdraw were most significant in key impingement subzones, such as T8, T10, and T7.
3.4 Tide
For a coastal site, the tidal range is one of the most important factors affecting the flow velocity. Therefore, tide is also a possible factor in analyzing the probability of impingement.
In case 3, the probability of impingement was high in subzones of T8 (45.78%), T10 (32.97%), and T7 (35.84%). However, in case 4, the probabilities were 34.14% (T8), 27.76% (T10), and 24.28% (T7). The differences in probability were –11.64% (T8), –5.21% (T10), and –11.56% (T7) (Figure 10). In the other subzones in the range of 300 m to 800 m from the water intake, the differences in probability were 10.44% in T4, –0.33% in T5, –0.41% in T9, and –1.19% in T11. The results indicated that when the tide changed from neap tide to spring tide, the probabilities in some subzones increased, whereas in others, they did not.
In case 5, the probability of impingement was high in subzones T8 (83.49%), T10 (72.34%), and T7 (60.23%). However, in case 6, the probabilities were 70.29% (T8), 61.66% (T10), and 80.19% (T7). The differences in probability were –13.2% (T8), –10.68% (T10), and 19.96% (T7) (Figure 11). In the other subzones in the range of 300 m to 800 m from the water intake, the differences in probability were 31.6% in T4, –6.99% in T5, –4.5% in T9, and –7.17% in T11. The results were almost the same as those in case 3 and case 4.
To conclude, an increase in tidal difference can lead to a decrease in the probability of impingement in the area near a water intake but to an increase in some other areas far from a water intake. Therefore, the effect of tide changes not only the total probability of impingement but also the spatial distribution of the probability.
3.5 Tidal flow direction
The probability of impingement in subzones T10 and T7 was significantly higher than that in subzones T9 and T5 (Figures 10, 11). The difference was mainly due to the local tidal field. The direction of the tide in the study area was generally parallel to the shoreline, with northeast the main direction of the rising tide and southwest the main direction of the falling tide. The tide constantly transported tracers in the northeast and southwest of the water intake to the water intake area, which led to higher probabilities of impingement in those subzones. This could also explain why the probability of impingement in subzone T7 (80.19%), an adjacent subzone nearby the water intake, was higher than that in subzone T8 (70.29%), a subzone where the water intake takes place.
Thus, areas up or down the main tidal current direction had a higher probability of impingement than areas not on the tidal current direction. To minimize the effect on probability of water intake blockage, the sites of NPPs need to pay special attention to the main tidal currents in local areas.
3.6 Water depth
Water depth conditions are often different at different sites, and therefore, the effect of water depth on the probability of impingement was analyzed. Two model cases (case 7 and case 8) were set with water depths of –5 m and –15 m.
Probabilities of impingement in case 7 were significantly higher than those in case 8 (Figure 12). In case 7, the probability of impingement was 64.39% in T8, 54.24% in T10, and 72.49% in T7. In case 8, the probabilities of impingement were only 37.96% in T8, 24.39% in T10, and 37.06% in T7. The differences between the two cases were approximately 26.43% (T8), 29.85% (T10), and 35.43% (T7). In the other subzones, probabilities of impingement in case 7 were also higher than those in case 8, with differences of approximately 16.52% (T4), 5.09% (T5), 3.62% (T9), and 13.04% (T11).
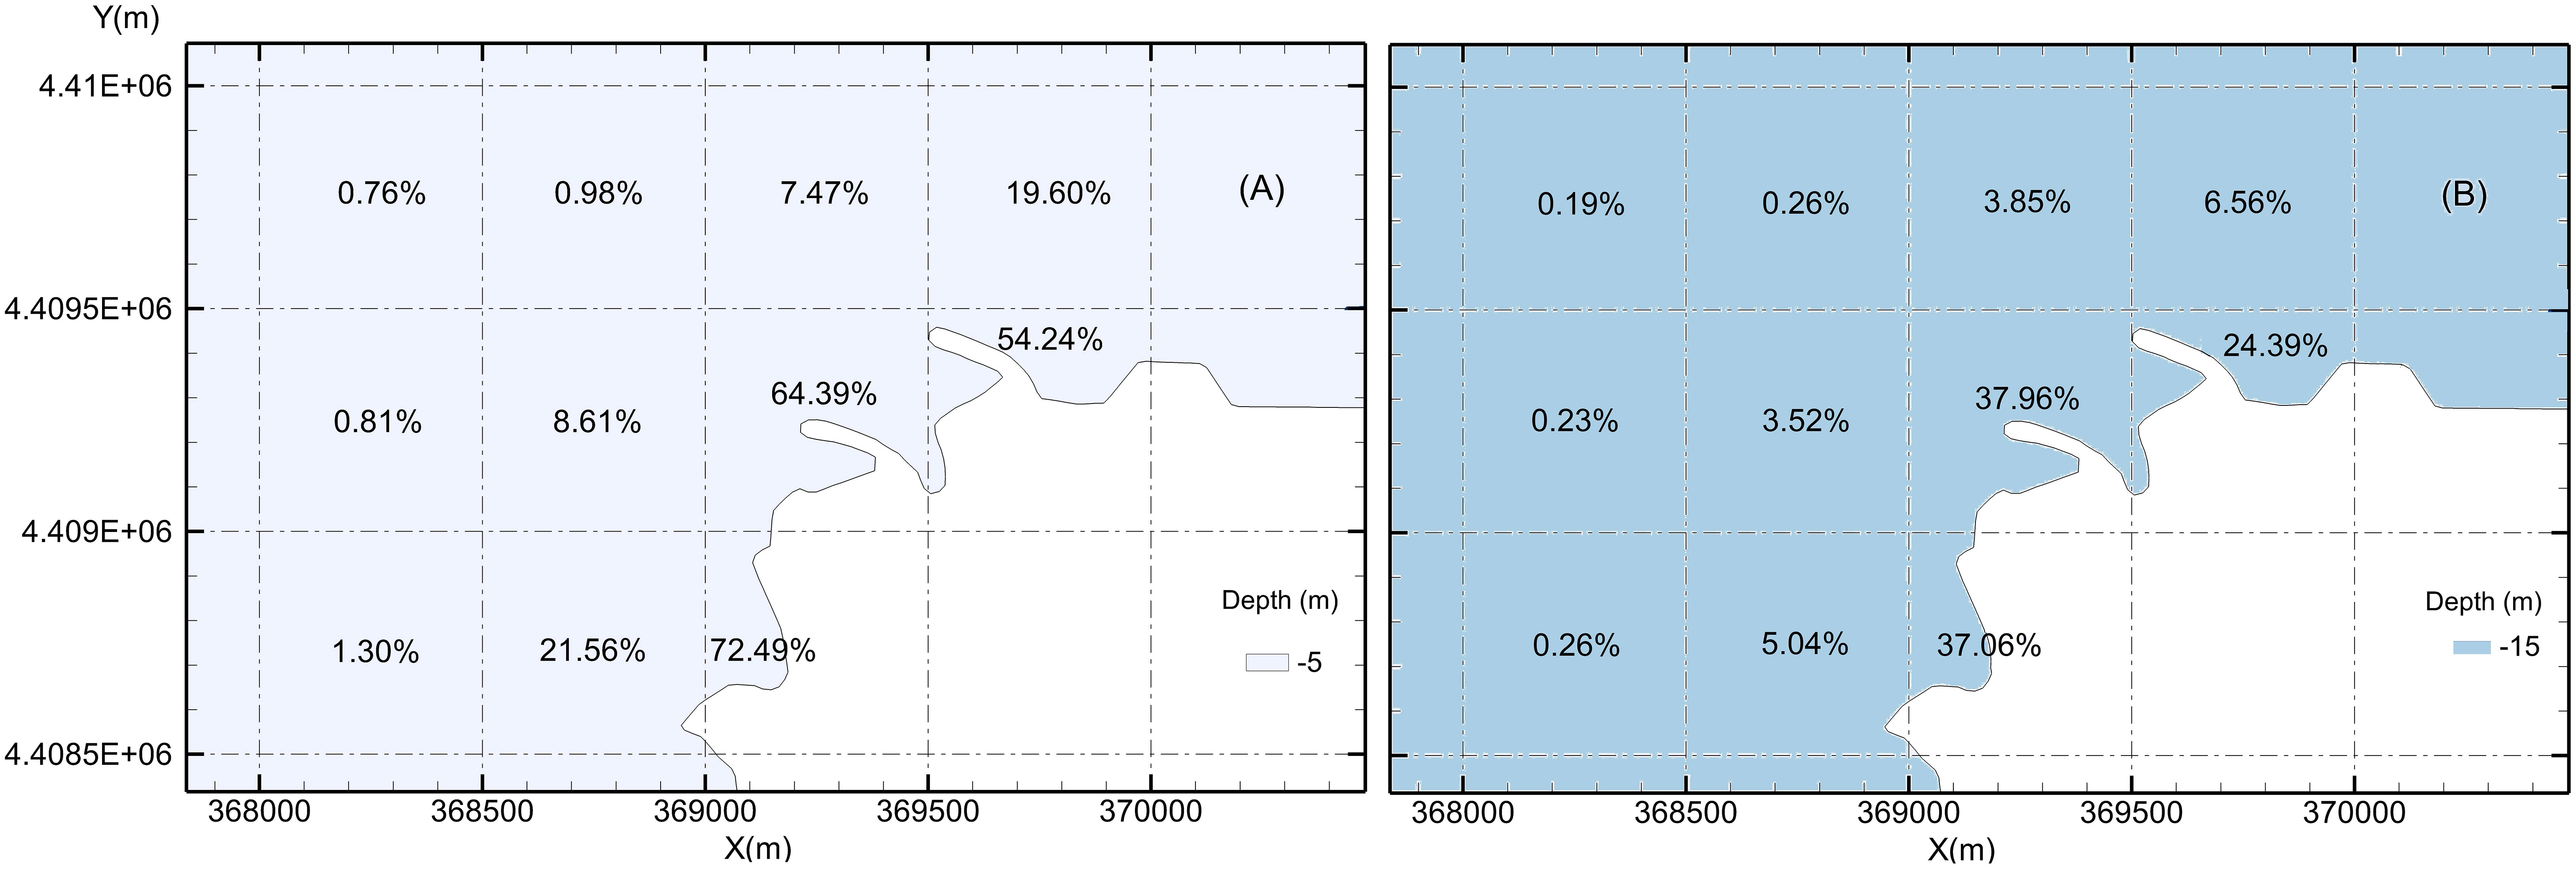
Figure 12 Probabilities of impingement near the cooling water intake system for the site with different water depths. (A) –5 m; (B) –15 m.
The results indicated that water depth was an important factor affecting the probability of impingement. With an increase in depth, the probability of impingement decreased. Thus, when selecting an NPP site, a site with deep water would be best.
4 Discussion
4.1 Influenced area by water intake
It is essential to determine the influenced area by water intake in studying CWIS safety in NPPs. When the area is clear, targeted safety monitoring can be conducted, and the control areas can be divided to reduce the workload. Determining the area is also important in monitoring marine biota and cleaning blockages when under severe weather. However, at present, the influenced area by water intake has not been clearly defined. In a conservative approach, relatively large ranges for monitoring are selected, with a maximum radius up to 66 km (Shi et al., 2020). According to the characteristics of the monitoring object and technology, 10 km has been used as the monitoring range (Song et al., 2021). On the basis of emergency response time, 5 km has been defined as the control range. In this study, the actual effect of the flow field is proposed to set the range. Sea organisms entering that range are influenced by the flow field and have a certain probability of entering the water intake. This conclusion is generally consistent with actual field measurements (Kang et al., 2018). Such a range also does not conflict with the scope of security control proposed by other studies, because for monitoring and early warning, it is indeed necessary to expand the monitoring range to prepare for a response in advance. In addition, the area for safe water withdrawal proposed in this study can also be affected by coastal currents, and thus, for some coastal NPPs, the influenced area may expand in some directions.
4.2 Method to calculate impingement probability
This study was based on the method to calculate impingement probability. Two methods are commonly used in simulating the distribution of material. One method is the particle tracking method (Chu et al., 2010; Moon et al., 2010), and the other is the mass transport method (Zhang et al., 1992). In this study, the mass transport method was used to calculate impingement probability. The method is suitable for simulating marine organisms that are passively transported, such as jellyfish. Zhang et al. (1992) also used this method to analyze the effect of impingement from the Dayawan Nuclear Power Station on nearby water ranges. For marine organisms with strong movement ability (such as fish), the results will be affected to some extent. Currently, there is no reliable method to simulate the movement of marine organisms (Wu et al., 2015). Although jellyfish may also have certain migration abilities, those organisms generally follow the flow (Wu et al., 2016). On a large scale, based on the mass transport method, the overall estimates of impingement probability remain credible.
4.3 Subregion division
Dividing the influenced area by water intake into subregions is an important step in calculating probabilities of impingement. In this study, rectangular subregions were selected, and then impingement probabilities were calculated in those sub-regions. Such subdivision was relatively easy and facilitated subsequent calculations, however, it was also somewhat unreasonable because the probability of impingement was significantly related to the distance from the CWIS. In NPP site surveys and selections, most use subregional division of a population according to distance from the site, with circular subdivisions (International Atomic Energy Agency, 2015). In fact, subregion shape and size both have important effects on impingement probability, and thus, it would be valuable to examine those factors in follow-up studies.
5 Conclusion
In this paper, based on a 3D hydrodynamic numerical model, the probability of impingement under different conditions in a typical coastal plant site was calculated. Water withdrawal volume, tide, tidal flow direction, and water depth were analyzed as important factors affecting the probability of impingement.
Considering water intake only and two units with volume of 110 m3/s, the influenced flow field was approximately 400 m around the water intake (with 0.01 m/s as the limit). For six units with volumes of 330 m3/s, the flow field influenced was approximately 1,000 m around the water intake (with 0.01 m/s as the limit). Thus, an increase in water withdrawal significantly increased the probability of impingement in the area near the water intake. Considering both water intake and tide effect, the impingement mainly occurred in the 1,000 m around the water intake, and as the distance to the water intake decreased, the probability of impingement increased. With an increase in tidal difference, the probability of impingement in the area around the water intake decreased, whereas that in peripheral areas increased. Therefore, the effect of tidal difference on impingement was mainly expressed in changes in the spatial distribution of the probability of impingement, and a decrease in total probability of impingement in the total sea area was limited. For the main tidal flow direction, the probability of impingement was higher than that in other directions. In addition, the probability of impingement decreased when the site had increased water depth. The results of this study can be used in plant site selection and water intake design.
Data availability statement
The original contributions presented in the study are included in the article/Supplementary Materials, further inquiries can be directed to the corresponding author.
Author contributions
All authors listed have made a substantial, direct, and intellectual contribution to the work and approved it for publication.
Funding
The research was supported by the projects “Technology development of keeping cold water intake system safety and security of nuclear power plants” (21FW018), “Research on a new sea organism control technology” (20YW118) and “Development of numerical simulation technology for the transport and diffusion of radioactive wastewater from nuclear accidents at the Global coastal sea scale” (21YW057).
Acknowledgments
We thank the topic organizers for their hard work and kind introductions.
Conflict of interest
All authors were employed by Shanghai Nuclear Engineering Research and Design Institute Co., Ltd.
Publisher’s note
All claims expressed in this article are solely those of the authors and do not necessarily represent those of their affiliated organizations, or those of the publisher, the editors and the reviewers. Any product that may be evaluated in this article, or claim that may be made by its manufacturer, is not guaranteed or endorsed by the publisher.
Supplementary material
The Supplementary Material for this article can be found online at: https://www.frontiersin.org/articles/10.3389/fmars.2023.1133187/full#supplementary-material
References
Arefiev N., Mikhalev M., Zotov D., Zotov K., Vatin N., Nikonova O., et al. (2015). Physical modeling of suspended sediment deposition in marine intakes of nuclear power plants. Proc. Eng. 117, 32–38. doi: 10.1016/j.proeng.2015.08.120
Barnthouse L. W. (2013). Impacts of entrainment and impingement on fish populations: A review of the scientific evidence. Environ. Sci. policy. 31, 149–156. doi: 10.1016/j.envsci.2013.03.001
Boreman J., Goodyear C. P. (1988). Estimates of entrainment mortality for striped bass and other fish species inhabiting the Hudson river estuary. Am. Fisheries Soc. Monograph 4, 152–160.
Boreman J., Goodyear C. P., Christensen S. W. (1978). An empirical transport model for evaluating entrainment of aquatic organisms by power plants (Vol. 78) (Department of the Interior, Fish and Wildlife Service, Office of Biological Services, Power Plant Project).
Chae J., Choi H. W., Lee W. J., Kim D., Lee J. H. (2008). Distribution of a pelagic tunicate, salpa fusiformis in warm surface current of the eastern Korean waters and its impingement on cooling water intakes of uljin nuclear power plant. J. Environ. Biol. 29, 585–590.
Chen F. (2009). The principle of choosing tunnel gate location for nuclear power plants in the coastal sites in China. Nucl. Saf. 2, 25–29. doi: 10.3969/j.issn.1672-5360.2009.02.005
Chen H. (2018). Research on the causes, prevention and control measures of bioblogging on nuclear power cold source by acaudina molpadioidea. master thesis (Shanghai: Shanghai Ocean University).
Chu Q. Q., Li L., Li P. L. (2010). The particle tracking numerical experiment of flow field in the jiaozhou bay Vol. 40 (Periodical of Ocean University of China), 29–34. doi: 10.16441/j.cnki.hdxb.2010.11.004
Doodson A. T. (1928). The analysis of tidal observations. Philos. Trans. R. Soc. London. 227, 223–279. doi: 10.1098/rsta.1928.0006
Edinger J. E., Kolluru V. S. (2000). Power plant intake entrainment analysis. J. Energy Eng. 126, 1–14. doi: 10.1061/(ASCE)0733-9402(2000)126:1(1)
EPRI (2015). Best management practices manual for preventing cooling water intake blockages. report no. 3002006735214 (Palo Alto, CA: EPRI).
Eraslan A. H., Van Winkle W., Sharp R. D., Christensen S. W., Goodyear C. P., Rush R. M., et al. (1975). Computer simulation model for the striped bass young-of-the-year population in the Hudson River. [Effects of entrainment and impingement at power plants on population dynamics]. (United States). doi: 10.2172/7232009
Fu X. C., Du F. L., Pu X., Wang X., Han F. Z. (2020). Analysis on critical factors of marine organism impacts on water intake safety at nuclear power plants. J. Nucl. Eng. Radiat. Sci. 6, 1–6. doi: 10.1115/1.4048112
Greenwood M. F. D. (2008). Fish mortality by impingement on the cooling-water intake screens of england’s largest direct-cooled power plant. Mar. pollut. Bull. 6, 723–739. doi: 10.1016/j.marpolbul.2007.12.008
Helvey M. (1985). Behavioral factors influencing fish entrapment at offshore cooling-water intake structures in southern California. Mar. fisheries review. 47 (1), 18–26.
Hervouet J. M. (2007). Hydrodynamics of free surface flows: Modelling with the finite element method (West Sussex: John Wiley & Sons), 341.
International Atomic Energy Agency (2015). Site survey and site selection for nuclear installations. IAEA safety standards series no. SSG-35 (Vienna: IAEA).
Kang J. F., Fan D. D., Zhou C. L., Lv Y. X. (2018). The characteristic analysis of ocean current for the safety of cold resource of nuclear power station. Mar. Environ. Sci. 37, 70–77. doi: 10.13634/j.cnki.mes.2018.01.012
Karas P. (1992). Zooplankton entrainment at Swedish nuclear power plants. Mar. pollut. Bull. 24 (1), 27–32. doi: 10.1016/0025-326X(92)90313-U
Li J., Liu X., Zhang J., Meng Y. (2017). Research on sea creature detection technology for improving the safety of cold sources in nuclear power plants. Chin. J. Electric Saf. Technol. 19, 32–37. doi: 10.3969/j.issn.1008-6226.2017.10.011
Meng Y., Liu L., Guo X., Liu N., Liu Y. (2018). An early-warning and decision-support system of marine organisms in a water cooling system in a nuclear power plant. J. Dalian Ocean Univ. 33, 108–112. doi: 10.16535/j.cnki.dlhyxb.2018.01.017
Merriman D., Thorpe L. M. (1976). The Connecticut river ecological study: impact of a nuclear power plant (American Fisheries Society Monograph).
Moon J. H., Pang I. C., Yang J. Y., Yoon W. D. (2010). Behavior of the giant jellyfish Nemopilema nomurai in the East China Sea and East/Japan Sea during the summer of 2005: a numerical model approach using a particle-tracking experiment. J. Mar. Syst. 80, 101–114. doi: 10.1016/j.jmarsys.2009.10.015
National Nuclear Safety Administration (2016). Bulletin on the recent incidents of marine organisms or foreign debris affecting the safety of water withdrawals of nuclear power plants. report no. 000014672/2016-00407 (Beijing, China: National Nuclear Safety Administration).
Prakash S., Kolluru V. S., Tutton P. (2012) “Semi-Lagrangian approach to studying grassing issue on a nuclear power plant cooling water intake,” in Proceedings of 10th International Conference on Hydroscience and Engineering. 1–26(Orlando, Florida, USA), ICHE 2012.
Prakash S., Kolluru V., Young C. (2014). Evaluation of the zone of influence and entrainment impacts for an intake using a 3-dimensional hydrodynamic and transport model. J. Mar. Sci. Eng. 2, 306–325. doi: 10.3390/jmse2020306
Ruan G. (2015). Reason analysis and corresponding strategy for cooling water intake blockage at nuclear power plants. Nucl. Power Eng. 36, 151–154. doi: 10.13832/j.jnpe.2015.S1.0151
Shi W. Q., Yuan S., Song L. N., Zhuang Y. J., Xu N., Liu X. Q., et al. (2020). A preliminary study on numerical simulation warning of the risk of ice blocking in water intake of the hongyanhe nuclear power plant. Mar. Sci. Bull. 39, 439–446. doi: 10.11840/j.issn.1001-6392.2020.04.006
Song L. N., Wang Z. Z., Zhao B. Q., Yang Y. J., Wang P., Yuan S. (2021). Design of the radar monitoring system of sea ice for the safety of nuclear power cold source. Chin. J. Mar. Environ. Sci. 40, 619–624. doi: 10.12111/j.mes.20200008
Swartzman G., Deriso R., Cowan C. (1977) Comparison of simulation models used in assessing the effects of power-plant-induced mortality on fish populations. in Proceedings of the Conference on Assessing the Effects of Power-Plant-Induced Mortality on Fish Populations. Pergamon. p.333–p.361.
Wang Y., Chen X., Lin Y., Zhang S., Chang L., Tang X., et al. (2022). Potential risk from and prevention of phytoplankton outbreaks in blocking the cooling water system in a nuclear power plant on the southeast China coast. Front. Mar. Sci. 9. doi: 10.3389/fmars.2022.1034876
WANO (2007). Intake cooling water blockage: Significant operating experience report (SOER). report no. 2007–2 (London: WANO).
White J. M., Nickols K. J., Clarke L., Largier J. L. (2010). Larval entrainment in cooling water intakes: spatially explicit models reveal effects on benthic meta-populations and shortcomings of traditional assessments. Can. J. fisheries Aquat. Sci. 67 (12), 2014–2031. doi: 10.1139/F10-108
World Nuclear Association (2023) Nuclear power in the world today [EB/OL]. Available at: https://world-nuclear.org/information-library/current-and-future-generation/nuclear-power-in-the-world-today.aspx.
Wu L. J., Gao S., Bai T. (2016). Review on the migration mechanisms of large jellyfish and techniques of the monitoring, forecasting, and warning of jellyfish disaster. Acta Ecologica Sin. 36, 3103–3107. doi: 10.5846/stxb201409251898
Wu L. J., Gao S., Liu G. Y., Bai T. (2015). Study on the ensemble forecast of large jellyfish drift in the coastal waters of qingdao. Mar. Forecasts 32, 62–71. doi: 10.11737/j.issn.1003-0239.2015.02.010
Yan G. C., Lu W. T. (2016). Prevention and management of invasions blockage in water intake of power plant. Ind. Technol. 14, 119–119. doi: CNKI:SUN:CXYY.0.2016-14-091
Yoon W., Choi B. J., Yoo H., Kim B., Bok Y., Chae J. (2022). Unusual mass appearance of Salpa fusiformis (Thaliacea: Salpida) in early spring at a nuclear power plant at mid-western boundary of the East Sea. Ocean Sci. J. 57, 269–278. doi: 10.1007/s12601-022-00065-z
Keywords: cooling water intake system, impingement probability, impact factors, numerical modeling, TELEMAC, nuclear power plant
Citation: Fu X, Du F, Huang X, Pei J, Zhang Z, Xing X and Pu X (2023) Cooling water intake system safety analysis based on impingement probability. Front. Mar. Sci. 10:1133187. doi: 10.3389/fmars.2023.1133187
Received: 28 December 2022; Accepted: 28 March 2023;
Published: 14 April 2023.
Edited by:
Huang Honghui, South China Sea Fisheries Research Institute (CAFS), ChinaReviewed by:
Shaowei Wang, Nuclear and Radiation Safety Center, ChinaBaojun Tang, East China Sea Fisheries Research Institute (CAFS), China
Copyright © 2023 Fu, Du, Huang, Pei, Zhang, Xing and Pu. This is an open-access article distributed under the terms of the Creative Commons Attribution License (CC BY). The use, distribution or reproduction in other forums is permitted, provided the original author(s) and the copyright owner(s) are credited and that the original publication in this journal is cited, in accordance with accepted academic practice. No use, distribution or reproduction is permitted which does not comply with these terms.
*Correspondence: Xiang Pu, cHV4aWFuZ0BzbmVyZGkuY29tLmNu