 Aurelia Pereira Gabellini
 Patrizio Mariani
 Asbjørn Christensen
- National Institute for Aquatic Resources (DTU Aqua), Technical University of Denmark, Kgs. Lyngby, Denmark
Introduction: Many hypotheses have been suggested to explain recruitment variability in fish populations. These can generally be divided into three groups, either related to: larval food limitation, predation, or transport. Transport mechanisms are central for reproduction in pelagic species and three physical processes, concentration, enrichment, and retention are commonly referred as the fundamental “ocean triads” sustaining larval survival and thus success of reproductive effort. The aim of this study is to investigate linkages between primary production and transport processes of eggs and larvae for the most important commercial fish species in the Atlantic Ocean.
Methods: We simulated eggs and larvae dispersion using an individualbased model and integrating information on the fish ecology of the major fish stocks. Our work included a review on spawning ground locations, spawning time, eggs and larvae duration. Simulations were performed over a 10-year time period for 113 stocks (17 species) in order to assess variability in dispersion and common trends and factors affecting transport.
Results: The level of primary production from initial to final position, i.e. from spawning to larval settlement, increased for some stocks (n=31), for others it declined (n=64), and for a smaller group (n=18) there was no substantial changes in level of primary production.
Discussion: This result implies that larval transport will not necessarily introduce larvae into areas of enhanced food availability expressed by the primary production at the site. These findings thus suggest marked differences in how physical and biological processes interact in the early life of major fish groups in the Atlantic Ocean. The results provide a further insight into fish larval drift and the potential role of primary production in emergence of spawning strategies.
1 Introduction
The dynamics of fish populations are regulated by the survival of early life stages, which mainly depends on interactions between individuals and their environment. The transition from an early life stage into a juvenile stage is typically considered an important phase in fish recruitment as it reflects the number of surviving adults within each stock. Recruitment is considered to vary widely among fish groups and across years and regions, with food availability, growth, predation, and transport being considered as the most crucial factors regulating those dynamics (Miller, 2007). After spawning, the first feeding larval period is considered a critical phase where larvae are strongly dependent on food conditions, and where limited feeding success could lead to high mortality and subsequent low recruitment success (Hjort, 1914). The link between fish mortality and food availability has further lead to proposal of the match-mismatch hypothesis, according to which the seasonal increase in prey concentration should be synchronized to the period of presence of larvae in the given area to promote their survival (Cushing, 1974; Cushing, 1975; Cushing, 1990). Several studies have investigated the existence of this match-mismatch hypothesis and linkages between recruitment and the synchronized life history between larvae and their major prey (Kristiansen et al., 2011; Sigler et al., 2016; Murphy et al., 2018; Ferreira et al., 2023). Predation has also been considered very important factor in the regulation of recruitment (Leggett and Deblois, 1994; Cushing, 1996). Despite its importance, predation is a difficult process to study (Akimova et al., 2019) due to the challenges related to experimental investigation of interactions between early life stages and their predators at suitable spatial and time scales (Smith and Moser, 2003; Hallfredsson and Pedersen, 2009) and the possible misleading conclusions when using visual examination of stomach contents instead of quantitative molecular genetic detection (Allan et al., 2021).
Further, oceanic transport is of significant importance to fish recruitment, especially for species that have an extended pelagic phase during the early life stages. After being released as eggs in the spawning region, larvae are transported by ocean currents for a wide range of distances, e.g., from less than 500 m as observed for coral reef fishes (Jones et al., 1999; Almany et al., 2007), and up to thousand kilometers, as for European eel (Anguilla anguilla) leptocephalus larvae that drift over 5000 km to European coasts from their spawning area in the Sargasso Sea (Cresci et al., 2019). To maintain fish population size, the larval transport should allow them to end up in areas suitable to their development into juvenile and adult stages. Thus, final recruitment success depends on drift and dispersion processes combined with food availability and predation risks. Larval behavior, such as vertical movements, has a fundamental role for the larval growth, survival and dispersion (Fiksen et al., 2007). Additionally, for some species we do have evidences of synchronizations of diel vertical migration (DVM) with oceanographic characteristics, such as pycnocline (Sakuma et al., 1999) and thermocline depths (Southward and Barret, 1983; Smith and Suthers, 1999), and to biological processes, such as the vertical distribution of their prey and/or predators (Munk et al., 1989; Gray, 1996). Given the large variability of environmental conditions in different ocean regions, the processes might pose strong selective pressures on individual reproductive strategies including their spawning time, location, and length of the dispersal phase.
The relationship between recruitment success, larval transport, enrichment processes and food availability have been described as the “ocean triad hypothesis” by Bakun (1996; 1998). In this hypothesis, three processes: enrichment, concentration and retention are recognized as the key physical processes. Enrichment is mostly considered in combination with upwelling and mixing that can increase primary production and then increase local food availability favoring individual growth. The reproduction of many species, especially for pelagic fish, appears to be positively affected by local enrichment processes (e.g., Rodríguez et al., 1999; Rodríguez et al., 2001; Rodríguez et al., 2004). For example, upwelling intensity can increase recruitment success in Moroccan sardine (Sardina pilchardus) and the northern anchovy (Engraulis mordax), with these relations depending on wind intensity (Roy et al., 1992). Enrichment and retention have also been considered important in connection to the reproductive strategies of two clupeoid species in the in southern Benguela - anchovy (Engraulis encrasicolus) and sardine (Sardinops sagax) - with results suggesting that two regions where those processes are active are favoring recruitment of the species (Lett et al., 2006). Enrichment, concentration and retention processes have been considered in combination to analyze transport of anchovy eggs and larvae in the northern Humboldt upwelling ecosystem, with results demonstrating that regions of enrichment are also the areas where most eggs and larvae were found (Lett et al., 2007). This was especially the case when ocean circulation would favor retention and concentration processes. Similar results have been found using ocean circulation models with particle-tracking algorithms of bluefin tuna (Thunnus thynnus) eggs and larvae at known spawning grounds in the Mediterranean Sea (Mariani et al., 2010). Here larvae were aggregating in retention areas often located next to regions of increased primary productivity.
The Atlantic Ocean is home to more than 1100 species of fish (Merrett, 1995) of which a wide range support important fisheries. Changes in recruitment success together with overfishing can have important implications for the food supply in many regions with potential global impacts (Britten et al., 2015). There is however still a lack of a systematic analysis of the interplay between dispersion and enrichment processes for all fish groups across different biogeographic regions in the Atlantic Ocean. Although the relationships between recruitment success and transport mechanisms have been studied for a range of species, there is a need for a systematic assessment of their relative importance. A review of the ecology of nine important fish species in the Atlantic Ocean suggests significant knowledge gaps in relation to important species, especially with regard to critical environmental conditions in their early life stages and the behavioral mediated interactions regulating spawning time and location (Trenkel et al., 2014). Also, they found that some species could have significant differences in their life history traits, while others where more alike, e.g. sharing spawning areas (Trenkel et al., 2014). The present study aims to investigate the primary production at the early life stages for the most important commercial fish in the Atlantic Ocean in conjunction with transport processes. We modelled dispersal of eggs and larvae of 17 species, represented by 113 stocks in the Atlantic Ocean using a generic Lagrangian modelling framework IBMlib that allows simulating propagules using 3D oceanographic data set ((Christensen et al., 2018). We parameterized the model by reviewing the data of key traits (spawning time, spawning grounds, egg and larval duration, type, and depth of vertical migration) and simulated dispersion from spawning to settlement for 10 consecutive spawning seasons (2000 – 2009) to identify variability of primary production in the early life stages. We aim at testing the hypothesis that after egg and larval drift, the larvae would arrive in areas of enhanced productivity (Figure 1).
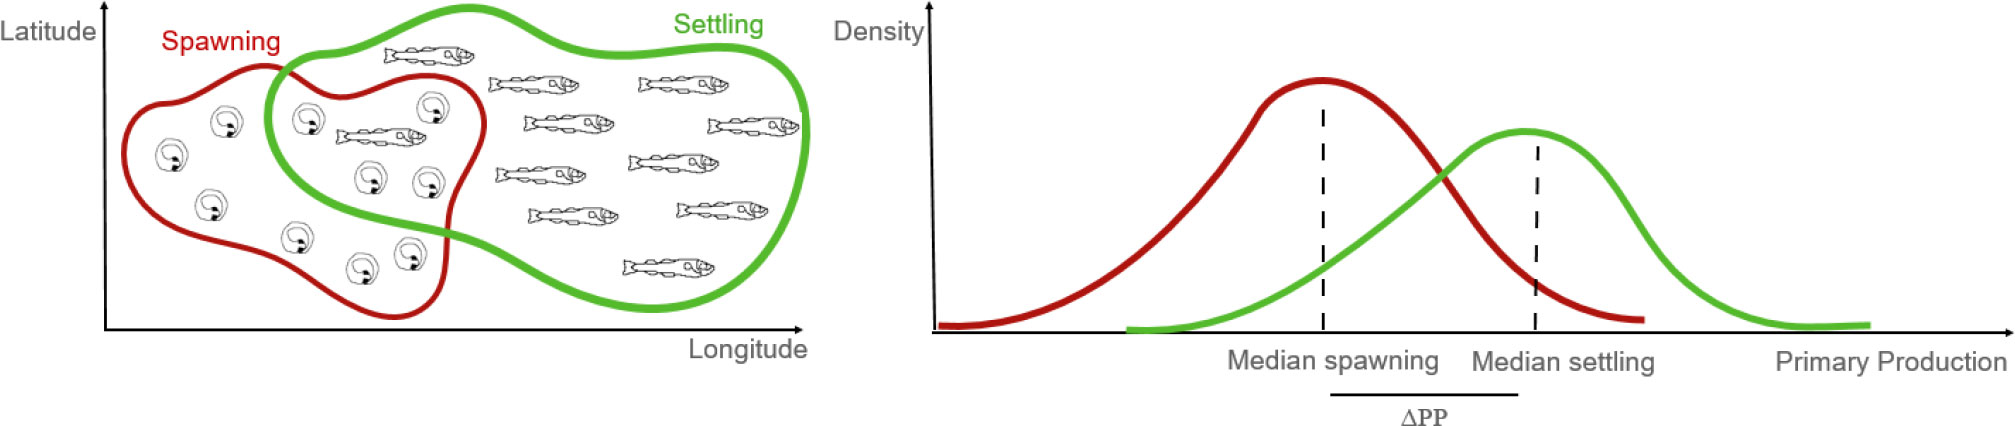
Figure 1 Schematic of the hypothesis investigated in this study. Primary production should be higher for the larvae (end position of simulation – in green) than that at the time of the spawning (start of simulation - in red).
2 Materials and methods
2.1 Dispersal traits identification
We focused the analyses on the most important commercial fish species in the Atlantic Ocean. We selected species with the highest capture production that have their reproductive phase in the Atlantic Ocean (FAO, 2020). From the 70 species with the highest capture production globally (FAO, 2020), 29 species are found in the Atlantic Ocean. Of these, five are not fish species and were excluded. Species that had not enough information in the literature to simulate the eggs and larval dispersion were excluded, with 15 species remaining. Besides these 15 species from FAO (2020), we also included American and European eel as they have a long drift time and occupy the central Atlantic region (i.e., Sargasso Sea). This provide a contrasting case for other more coastal species. For each stock, we identified: spawning time, spawning grounds, egg and larval duration and diel vertical migration depth. The stock in this context is defined as the group of fish of the same species that spawn in the same area and in the same period. We note that in some cases the stock definition here does not coincide with the one used in fisheries management.
The literature review was conducted by searching key words using Google, Google Scholar and FishBase (Froese and Pauly, 2022). The search terms were related to the previously mentioned traits - spawning time, spawning grounds, minimum and maximum egg and larval duration and diel vertical migration depth – together with the species name. In case of conflicting information, the most recent would be used.
2.2 Particle tracking algorithm
This section follows the standard protocol for describing individual-based models (IBM) designed by Grimm et al. (2006; 2010).
Purpose: To investigate the importance of primary production over a range of dispersal conditions. We modelled eggs and larvae dispersion of fish species by coupling general ocean circulation models at high resolution with a particle-tracking algorithm. We used the IBMlib, a framework that combines individual level model of organisms to 3D oceanographic model (Christensen et al., 2018). For a description of IBMlib, see Christensen et al. (2018).
Entities, state variables: Individuals are characterized by the state variables, i.e. identity number, age (in days) and location. There are three stages: eggs, larvae, and settled larvae. Simulations started at the start of the spawning of each specific stock, and included the spawning season plus the eggs and larval duration. Particles were emitted during the whole spawning season, taking the first day of the spawning month as reference.
Process overview and scheduling: Particles are released as eggs on the surface and considered moving passively with ocean currents. Individual processes include aging and change of stage (egg, pelagic larva and settled larva). At the end of the egg stage, particles become larvae and they perform diel vertical migration using a constant swimming speed (w = 5 mm/s) and species-specific target depth during day and night. After the larval period determined by the length of the pelagic phase, the particle is considered “settled larva” and its position is saved. Mortality has not been included explicitly; which corresponds to assuming a spatial and temporal constant mortality for the pelagic stage. For all the simulations, the particle trajectories were integrated forward using Euler method with a time step of 1800 seconds (30 minutes). To account for horizontal sub-grid scale eddy diffusivity we apply the standard shear-driven Smagorinsky scheme (Smagorinsky, 1963) using current fields as inputs, where conventional values for the Smagorinsky constant Cs = 0.15 (Pope, 2000) and Schmidt number Sc=1 were applied, as recommended by Sagaut (2005).
Design concepts: From the literature review, we created maps with the spawning ground area (Figure 2B). From the spawning map, we produced the emission boxes using polygons of approximately 10 km in length and width. The release location for each individual particle was randomly selected within the emission box. Each box consisted of 100, 50 or 10 particles, depending on the total number of boxes for each spawning stock (less than 100, less than 300 or more than 300 respectively). Particles are transported independently and do not interact with each other during the simulation. We did not impose specific settlement areas stock wise, but assessed the feeding conditions at the emergent positions at the end of the pelagic phase.
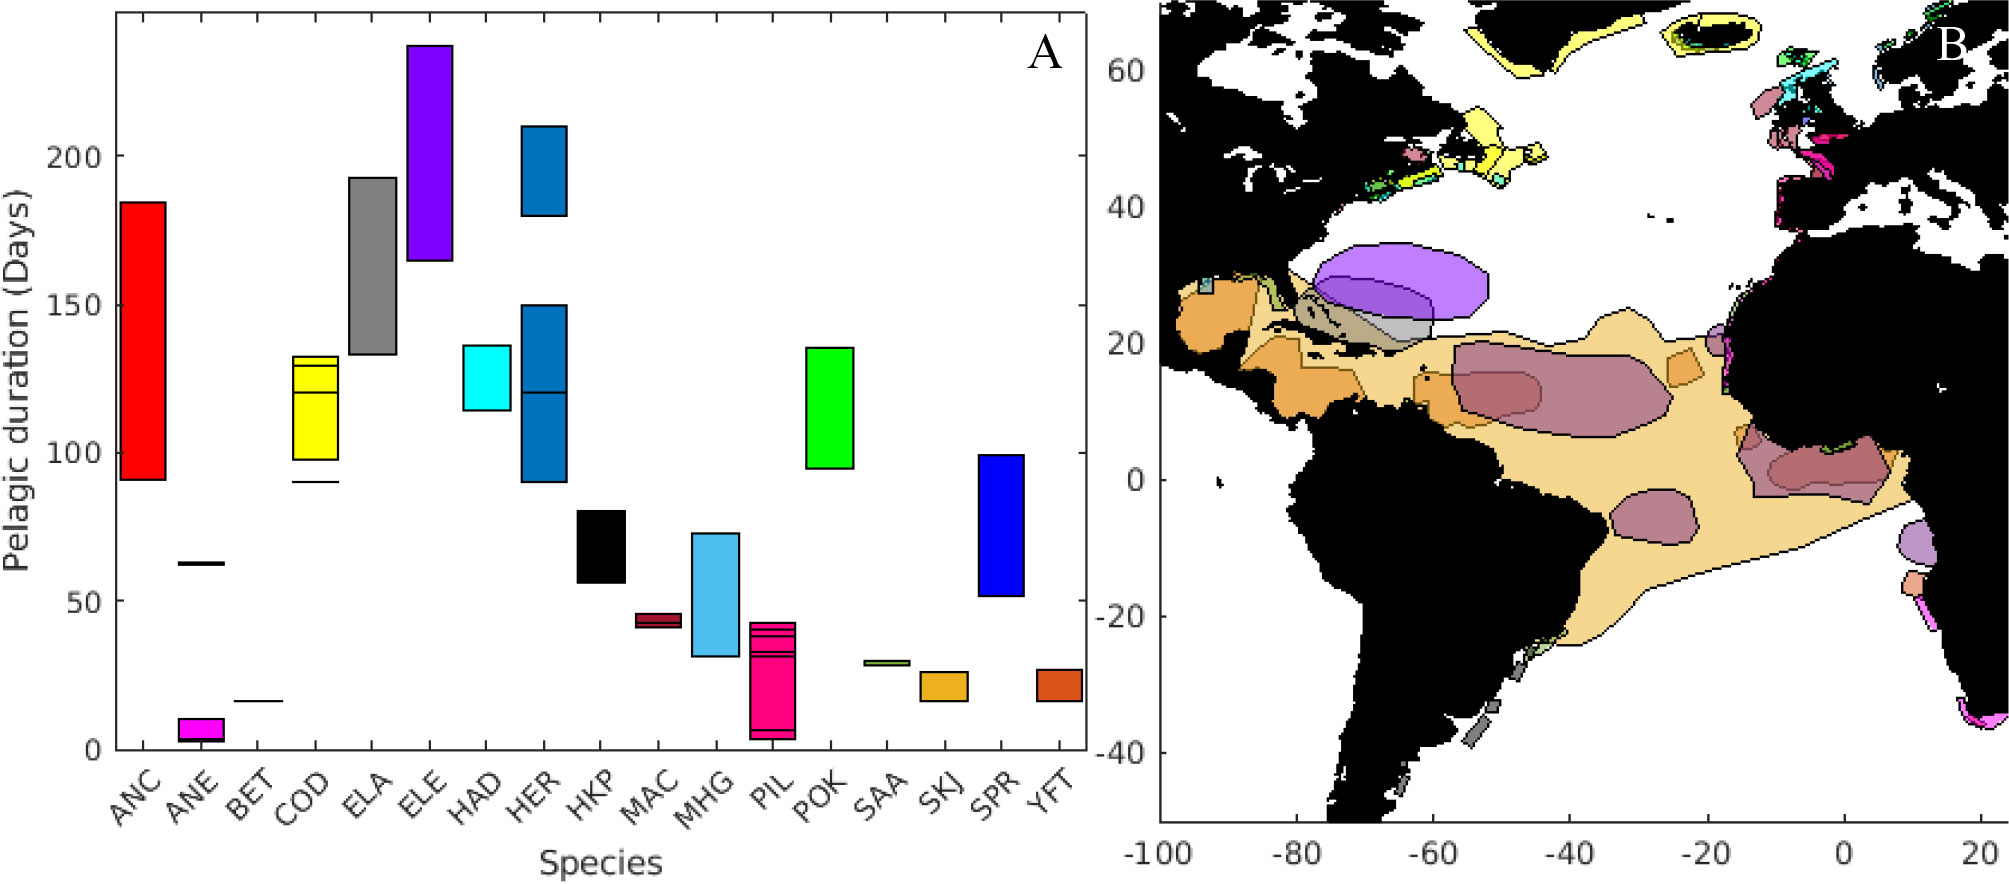
Figure 2 (A) Length of the pelagic duration of eggs and larvae (ordered alphabetically) and (B) spawning areas of the species included in the analyses. Colour coded are the different species: Southern African anchovy (ANC), European anchovy (ANE), bigeye tuna (BET), Atlantic cod (COD), American eel (ELA), European eel (ELE), haddock (HAD), Atlantic herring (HER), Argentinian hake (HKP), Atlantic mackerel (MAC), gulf menhaden (MHG), sardine (PIL), pollock (POK), round sardinella (SAA), skipjack tuna (SKJ), European sprat (SPR), yellowfin tuna (YFT). Same color applies for species as in (A).
Initialization: We released particles in the fish stock spawning season and let them drift through their pelagic egg and larval duration.
Input data: The hydrodynamic data (currents, salinity and temperature) for 2000 to 2010 used in this study were retrieved from the Copernicus Marine Environment Monitoring Services (CMEMS). We applied the product Global Ocean Ensemble Physics Reanalysis (doi:10.48670/moi-00024), where the dynamical circulation equations are solved on a numerical grid with ¼-degree resolution, and data saved as daily means. The model has 75 vertical layers, from 0 to 5500 m depth with global coverage. As the eggs and larvae are distributed in the upper layers, we extracted data only between the surface and 200 m deep (31 layers in total).
Submodels: For each stock, 2 simulations were conducted to be able to understand the dispersion potential with the different conditions: one with the minimum egg and larval duration, and other with the maximum duration. With 113 stocks, 10 years of simulations, and 2 pelagic durations, generated in total 2260 simulations and more than 110 million particles.
2.2.1 Displacement
Based on the Lagrangian model results, the initial and final position were obtained, and a relative displacement was estimated for all particles. Displacement in this context is the distance in kilometers between final and initial position of individual particles.
We also analyzed the relation between displacement and the pelagic duration, where the null hypothesis for the distribution of displacements (D) in relation to the biological pelagic duration (T) is D ~ N (v·T, 2·d·T), corresponding to one dimensional passive advection-diffusion transport, described by parameters (v, d), where v is interpreted as a typical (residual) current velocity and d interpreted as a typical diffusivity.
2.2.2 Net primary production
Net primary production (NPP, mgC m-3day-1) have been retrieved from CMEMS, Global ocean biogeochemistry hindcast (GLOBAL_MULTIYEAR_BGC_001_029, doi: 10.48670/moi-00019). NPP has same resolution as the hydrodynamic dataset, with ¼-degree resolution and daily mean and data were extracted for the initial position of the particles, as well as for the final position after the dispersal phase.
2.2.3 Analysis
After obtaining the values for all particles and all years, the median population value for each year was extracted and the difference between NPP at the end and start of the simulation was also calculated (henceforth defined as ΔPP) to determine changes in primary production between spawning and potential settling areas (Figure 1). We choose to apply NPP as food abundance proxy rather than direct zooplankton abundance obtained from coupled biogeochemical simulations, because besides phytoplankton being part of diet of some fish larvae (e.g. haddock and cod – Kane, 1984, mackerel – Conway et al., 1999), match-mismatch hypotheses are often tested against phytoplankton concentrations (Platt et al., 2003). Nonetheless, we analyzed the relation between NPP and modelled zooplankton concentration in the Appendix (Figure A1) where a linear regression of the type is provided and used in the results.
We estimated larval food requirement based on approximative observed interspecies ingestion rates (I) estimated as function of their weight and environmental temperature as (MacKenzie et al., 1990), where weight (W) is expressed in micrograms and temperature (T) in degrees Celsius. This food requirement was compared to the potential prey encounter rates following the framework of Letcher et al. (1996), considering the length of the larvae (L) in the early and final stage of each species. We applied the interspecies larval weight-length relation (Letcher et al., 1996). Further, for consistency we can assume a carbon content of 40% relative to the dry weight (Garrido et al., 2012).
The values of I should be compared to the amount of prey encountered (E) which then depends on prey concentration (, mgC m-3) the fraction of the day when light is available () and the search volume (, m3 day-1) like which can take units of mgC day-1. We assume light being available some fraction of the day, i.e., =13/24 (Letcher et al., 1996). By matching these two quantities we can obtain the minimum prey density that satisfies the required carbon ingestion (ρmin):
To compute we consider the larval swimming speed (v) and reactive distance (R) and assume hemispherical encounter areas such that . R can be estimated as function of the prey length (PL) and the larval minimal visual angle α, , with (Rose and Cowan, 1993). PL was assumed as a fraction of L (PL = 0.22L), based on typical predator-prey size ratio and the interspecies weight-length relation above (Thygesen et al., 2005). Note the analysis does not include the effects of small-scale turbulence in increasing encounters between predator and prey.
Hence, we can finally compute using literature values for L and T at the spawning and at settling stages, respectively.
3 Results
3.1 Species identification and dispersal traits
The relevant larval traits for dispersion have been aggregated for 113 stocks (see Supplementary Table A1). The pelagic duration varied from less than four days (for the European anchovy - Engraulis encrasicolus) to a maximum of 237 days (for the European eel) (Figure 2A). Significant variability of this parameter was found in several groups, such as Southern African anchovy (Engraulis capensis) and herring (Clupea harengus), while bigeye tuna (Thunnus obesus) and round sardinella (Sardinella aurita) had the lowest variability in pelagic duration. Most of the species (n=12) spawn within 500 km from the coastline, while American (Anguila rostrata) and European eels, yellowfin (Thunnus albacares), skipjack (Katsuwonus pelamis) and bigeye tuna have spawning areas in large regions in the open ocean.
The smallest spawning ground was found for the herring stock at Clyde estuary (Scotland, approximately 700 km2), while the spawning area for skipjack tuna was estimated to cover a large fraction of the Equatorial Atlantic, i.e., ca. 26 x 106 km2. It is important to note the southern Grand Bank stock of Atlantic cod (Gadus morhua), which can spawn up to 900 km away from the coast, mainly includes shallow water areas.
3.2 Displacement and dispersion patterns
The resulting larval distributions compare well with available observations for all groups (see Appendix Figure A2). In particular, for those species where enough data is available (e.g., HAD, ELA, ELE), the final position of the larvae closely reproduce observed distribution patterns (Figures A2 m, p, q). For some species (e.g. yellowfin and skipjack tuna) observations on early life stages are rare. However, model’s outputs are still coherent with the large-scale distribution of the other life stages (e.g. juveniles and adults) (Figures A2 B, C).
By looking at the total transport (from spawning to settling), the species with higher displacement were American and European eels, with simulated values up to 4600 km and 4400 km, respectively. While the species that had the lowest dispersal were PIL and ANE showing both the highest probability of short displacement and the lowest median values when all years and stocks are considered (i.e., less than 40 km median displacement, Figure 3). Most stocks (n=110) have median displacement of less than 1000 km from the spawning location. Interestingly several of the species analyzed (i.e., YFT, SKJ, BET, SAA, SPR, MAC, HKP, ANE, PIL) showed a sharp decrease in displacement probability after ~300 km (Figure 3). While some species (i.e., HER, MHG, COD, HAD, ANC, POK, ELA, ELE) showed higher probabilities at displacement >500 km, with ANC showing the highest displacement probability at around 1000 km (red curve in Figure 3). American and European eel showed different dispersal trajectories, however since only a relatively short larval dispersion is considered (i.e., 133-192 days for American eel and 165-237 days for European eel) their total displacement was quite similar (see Figure 3). Schmidt (1923) estimated the European eel drift of 2-3 years, while other studies estimated 190 to 280 days (Lecomte-Finiger, 1994), and 210 – 270 days but assuming larva performing horizontal active movement (Arai et al., 2000) which in this case was not included.
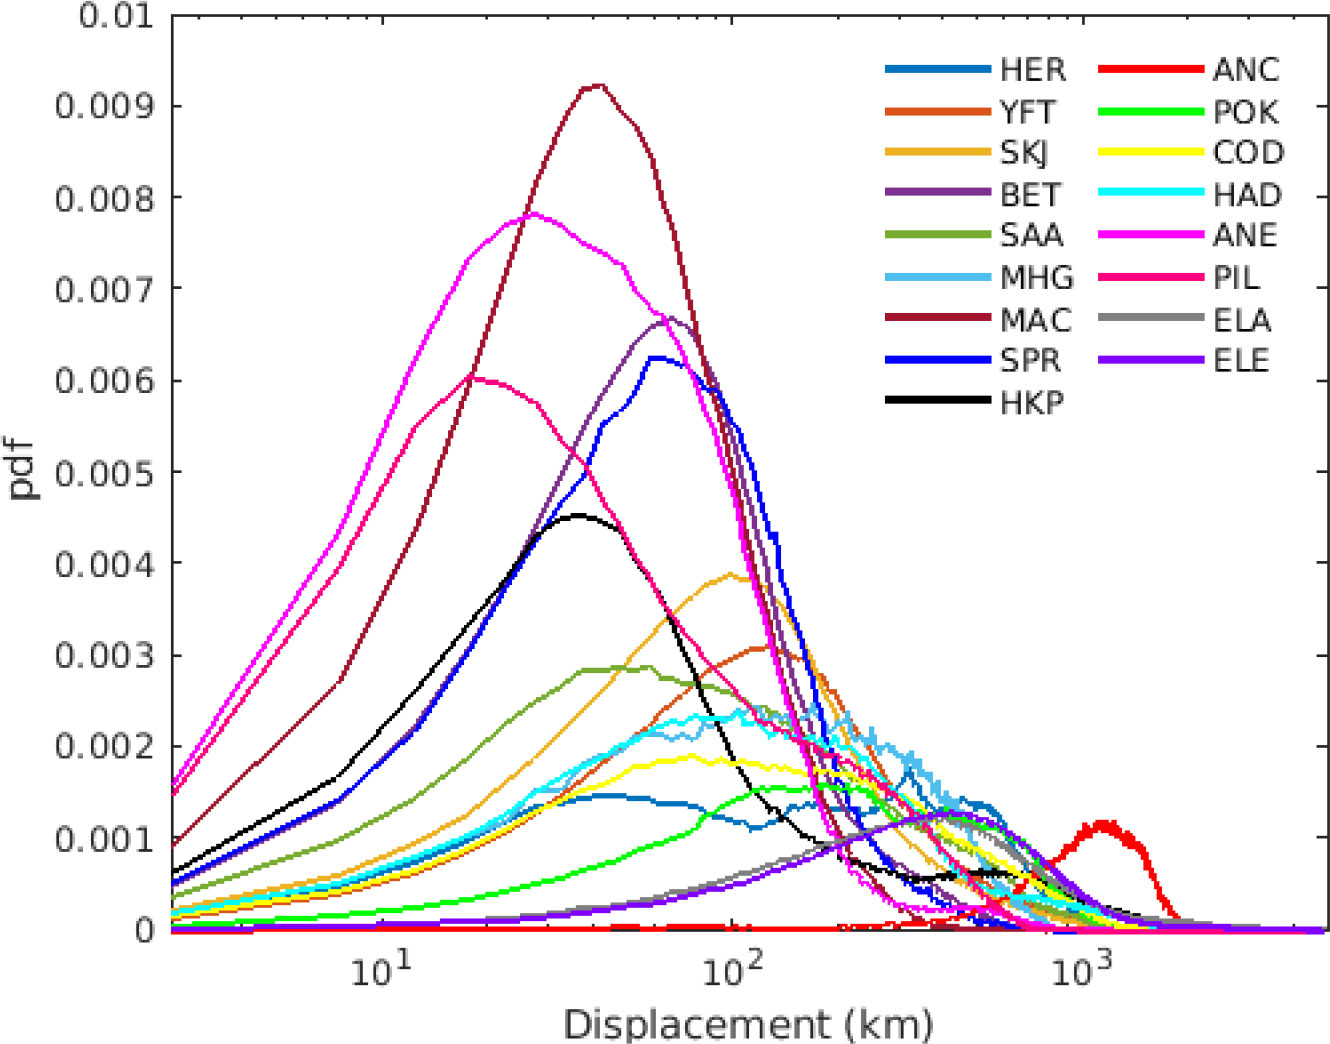
Figure 3 Total displacement (km) per species averaged over all stocks and all years (2000-2009), using simulations with the maximum pelagic duration. Each color represents a species.
Depending on the location, particles can be retained in eddies for most of their dispersal phase or being strongly advected by major ocean currents (Figure 4). Illustrating specific cases, we can identify individuals of European eel, entering the Gulf Stream, which is a current of high velocity (Figure 4A). We also noticed that other individuals within the same population could be retained into mesoscale structures present in the Sargasso Sea. Those results are coherent with previous studies on European and American eel populations (Miller et al., 2015). Some individuals of the African stock of round sardinella can drift south through the North Equatorial current (Figure 4B), and others can drift through the Canary currents eastwards, because of the presence of the Northwest Africa currents in the area (Pelegrí and Peña-Izquierdo, 2015). The round sardinella stock in the southwestern Atlantic can be transported southwards in the region of the Brazilian current (Figure 4C) as previously suggested (Dias et al., 2014). The dispersal of southern African anchovy within the Benguela current system shows that some particles can drift towards the west of the spawning region being included in the Benguela current, while others can be trapped into Agulhas rings or can go through the retroflection of Agulhas current (Figure 4D).
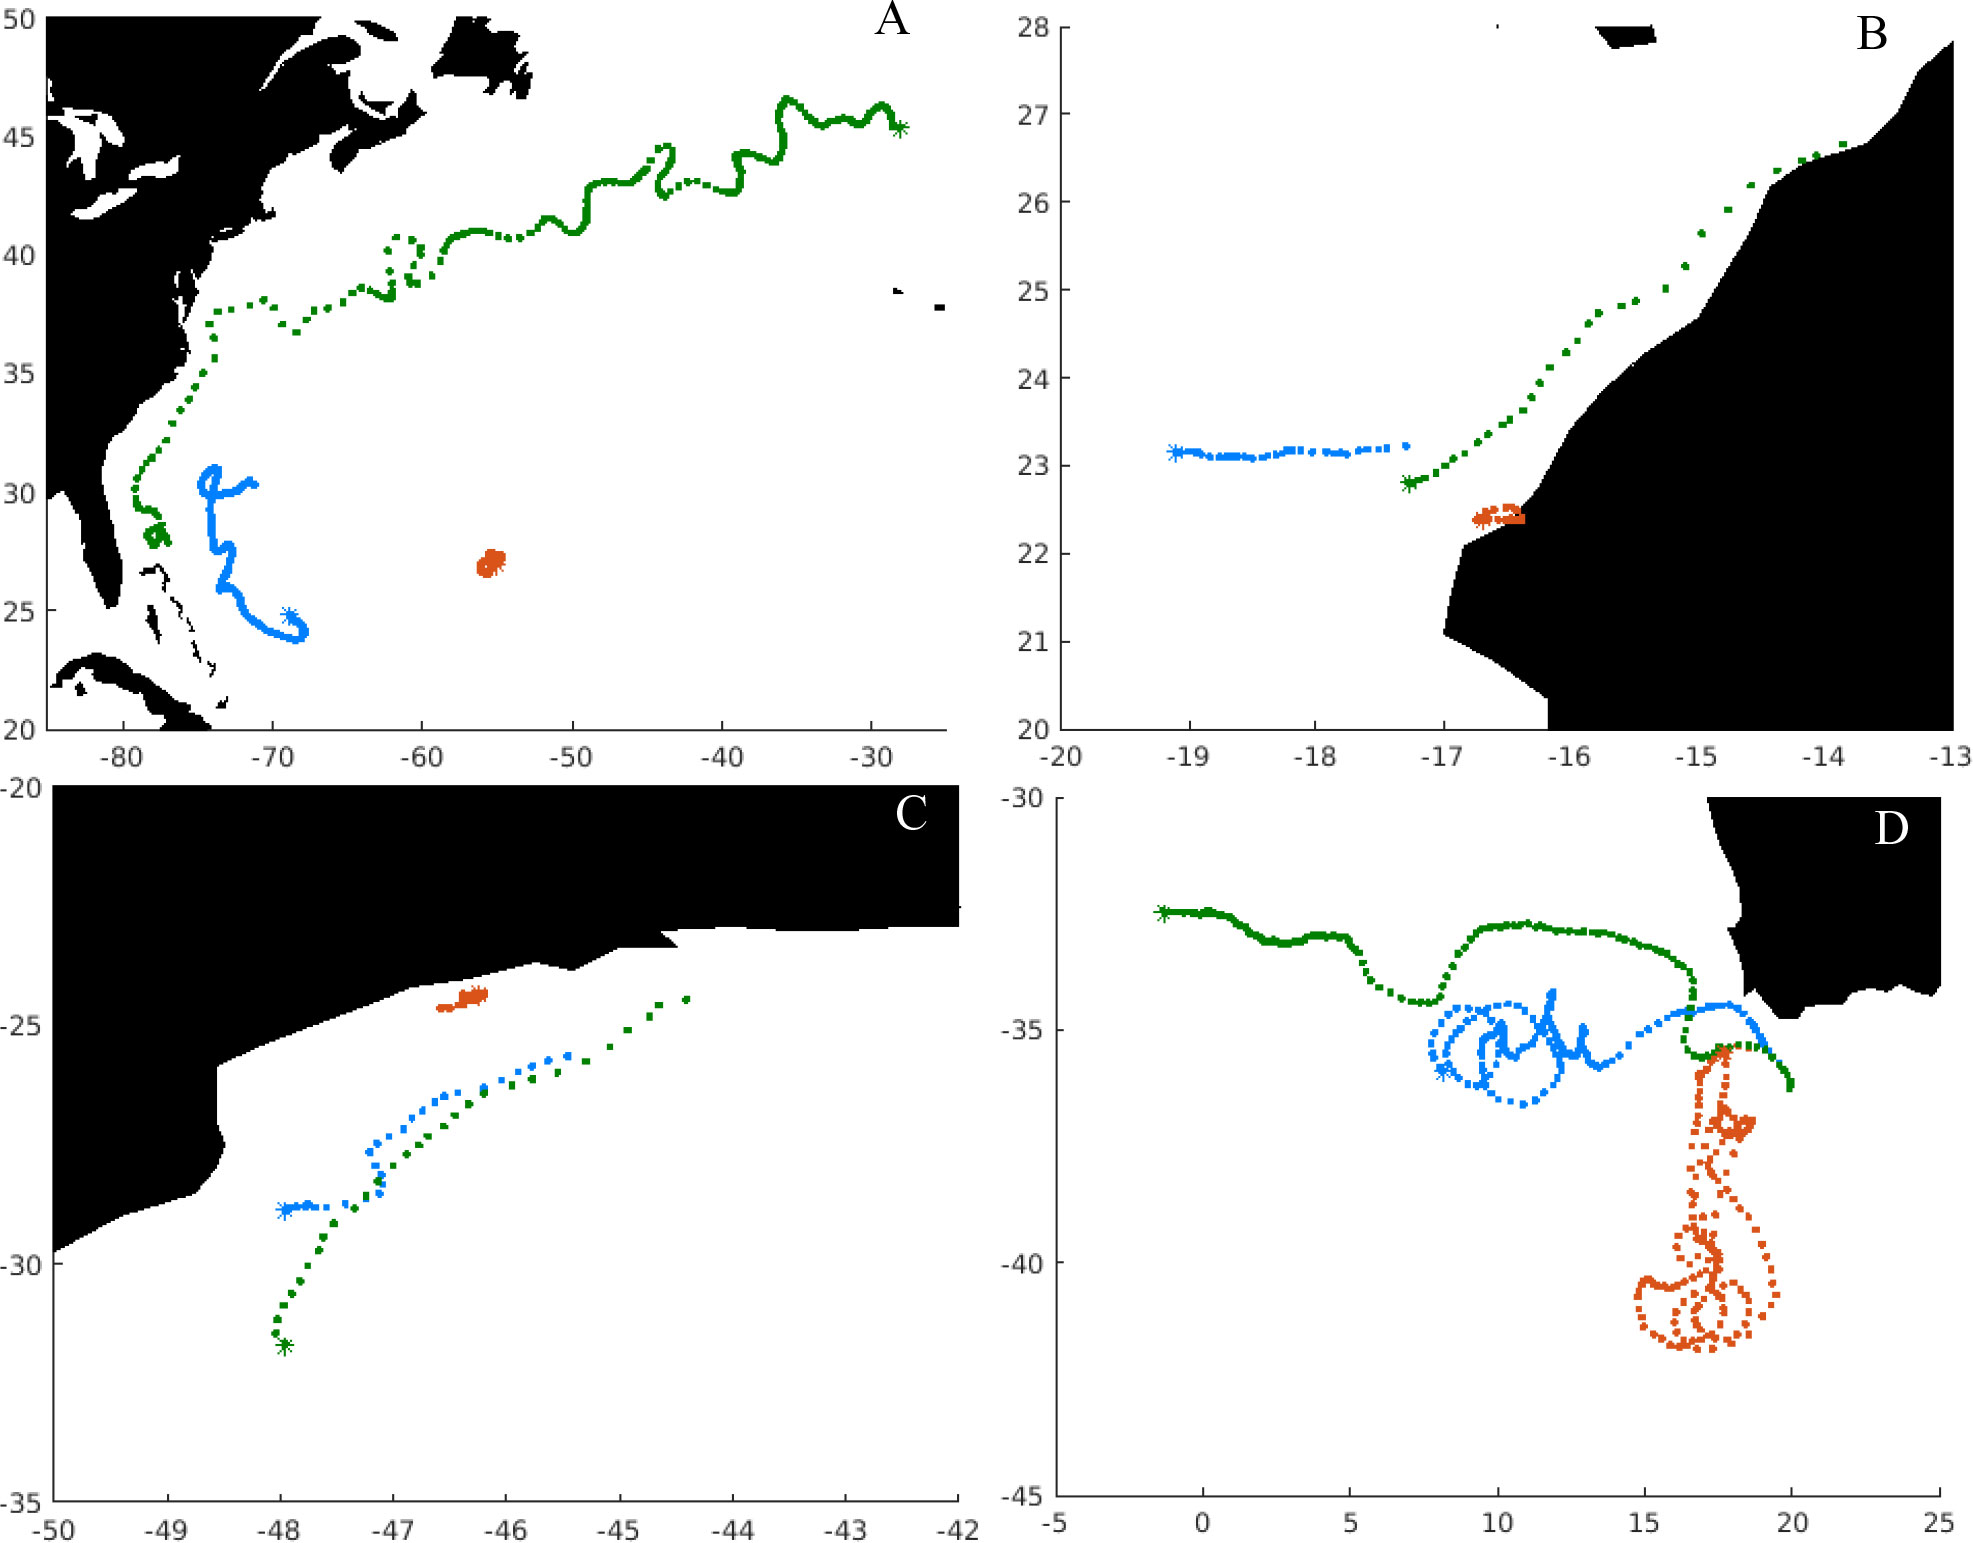
Figure 4 Illustration of modeled trajectories of particles released across different spawning grounds for the year 2000, where each point represents a daily position, while the asterisks show the final position. (A) European eel, (B) round sardinella, (C) round sardinella Brazilian stock, (D) southern African anchovy. Brown points indicate the trajectory with the shortest displacement in that stock that year, green points the longest displacement, and blue points one with the mean displacement.
Displacement vs pelagic duration
We further investigated how the displacement is influenced by the pelagic duration (PD, Figure 5). Although we can see that the longer the pelagic duration the longer the displacement, this relationship within and across stocks is very variable, as stocks do spawn at different times and different locations, hence they are exposed to different ocean current systems.
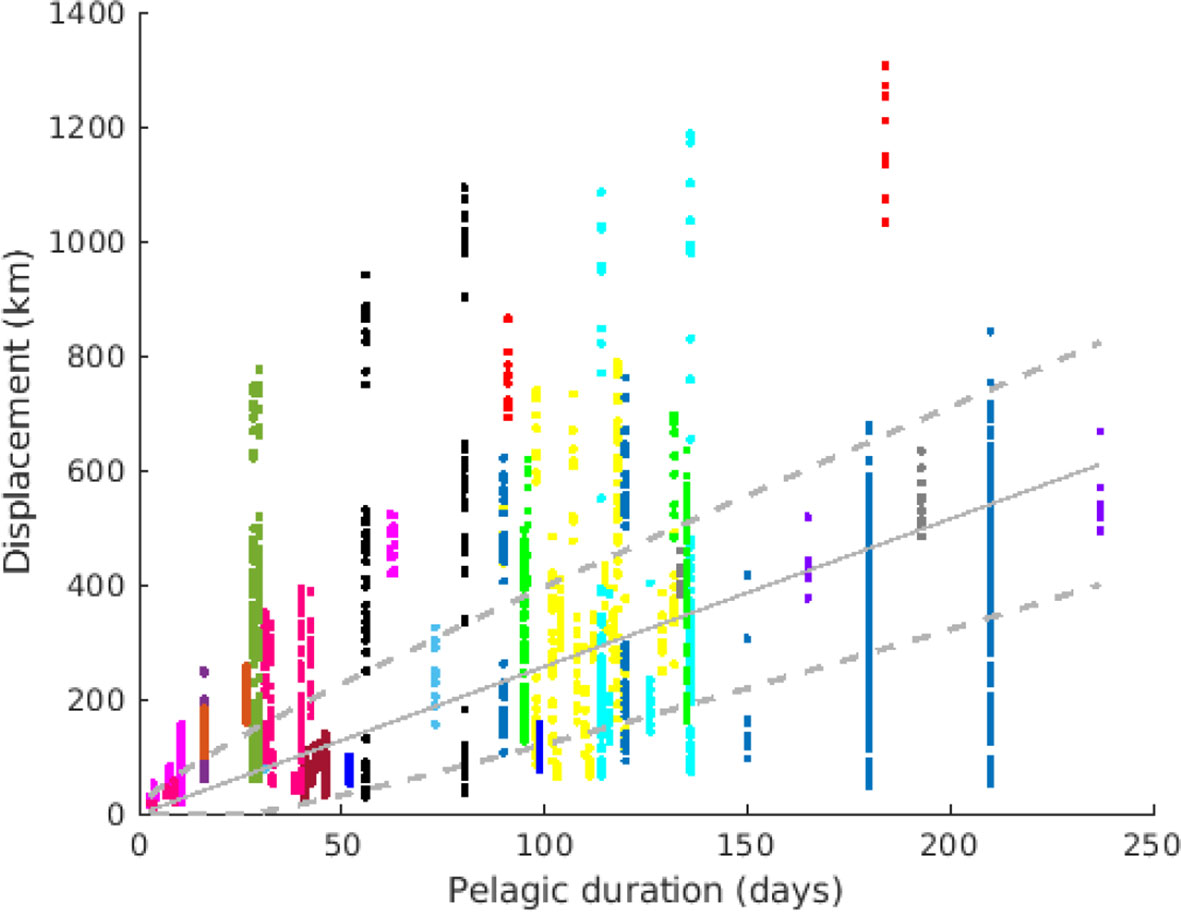
Figure 5 Median displacement (D) for all stocks and years, plotted against the pelagic duration. Each color represents a species (same as Figure 1). Each point represents one stock and one year. The solid line represents the best-fitted linear regression D ~vT, while the dashed lines are the linear regression plus/minus the standard deviation fitted as . Thus, the area between dashed lines is the most likely range of transport displacement D for a given pelagic duration T.
A least-squares error fit gives v = 2.58 km/day and d = 94.4 km2/day, as indicated in Figure 5. The value v is commensurable with weak residual currents, whereas the value of d is larger than typical horizontal subscale (<10 km) diffusivities, however the relatively large value of d also reflect the fact that this parameter absorbs the dispersal effect of oceanographic mesoscale structures.
Sprat and mackerel had the lowest displacement per day compared with the overall distribution (Figure 5), while yellowfin tuna and some stocks of round sardinella, bigeye tuna and Argentinian hake (Merluccius hubbsi) had highest displacement per day.
3.3 Primary production patterns
Net primary productions at the spawning grounds during the spawning seasons ranged from 8.9 to 954.0 mgCm-3day-1 (Figure 6A). Hence covering species spawning in oligotrophic (e.g., open ocean) as well as eutrophic coastal regions. The lowest NPP at the spawning areas was found for the bigeye tuna that reproduces in the Atlantic Ocean off the Brazilian coast, while the highest NPP was for the yellowfin tuna population reproducing in the Gulf of Mexico.
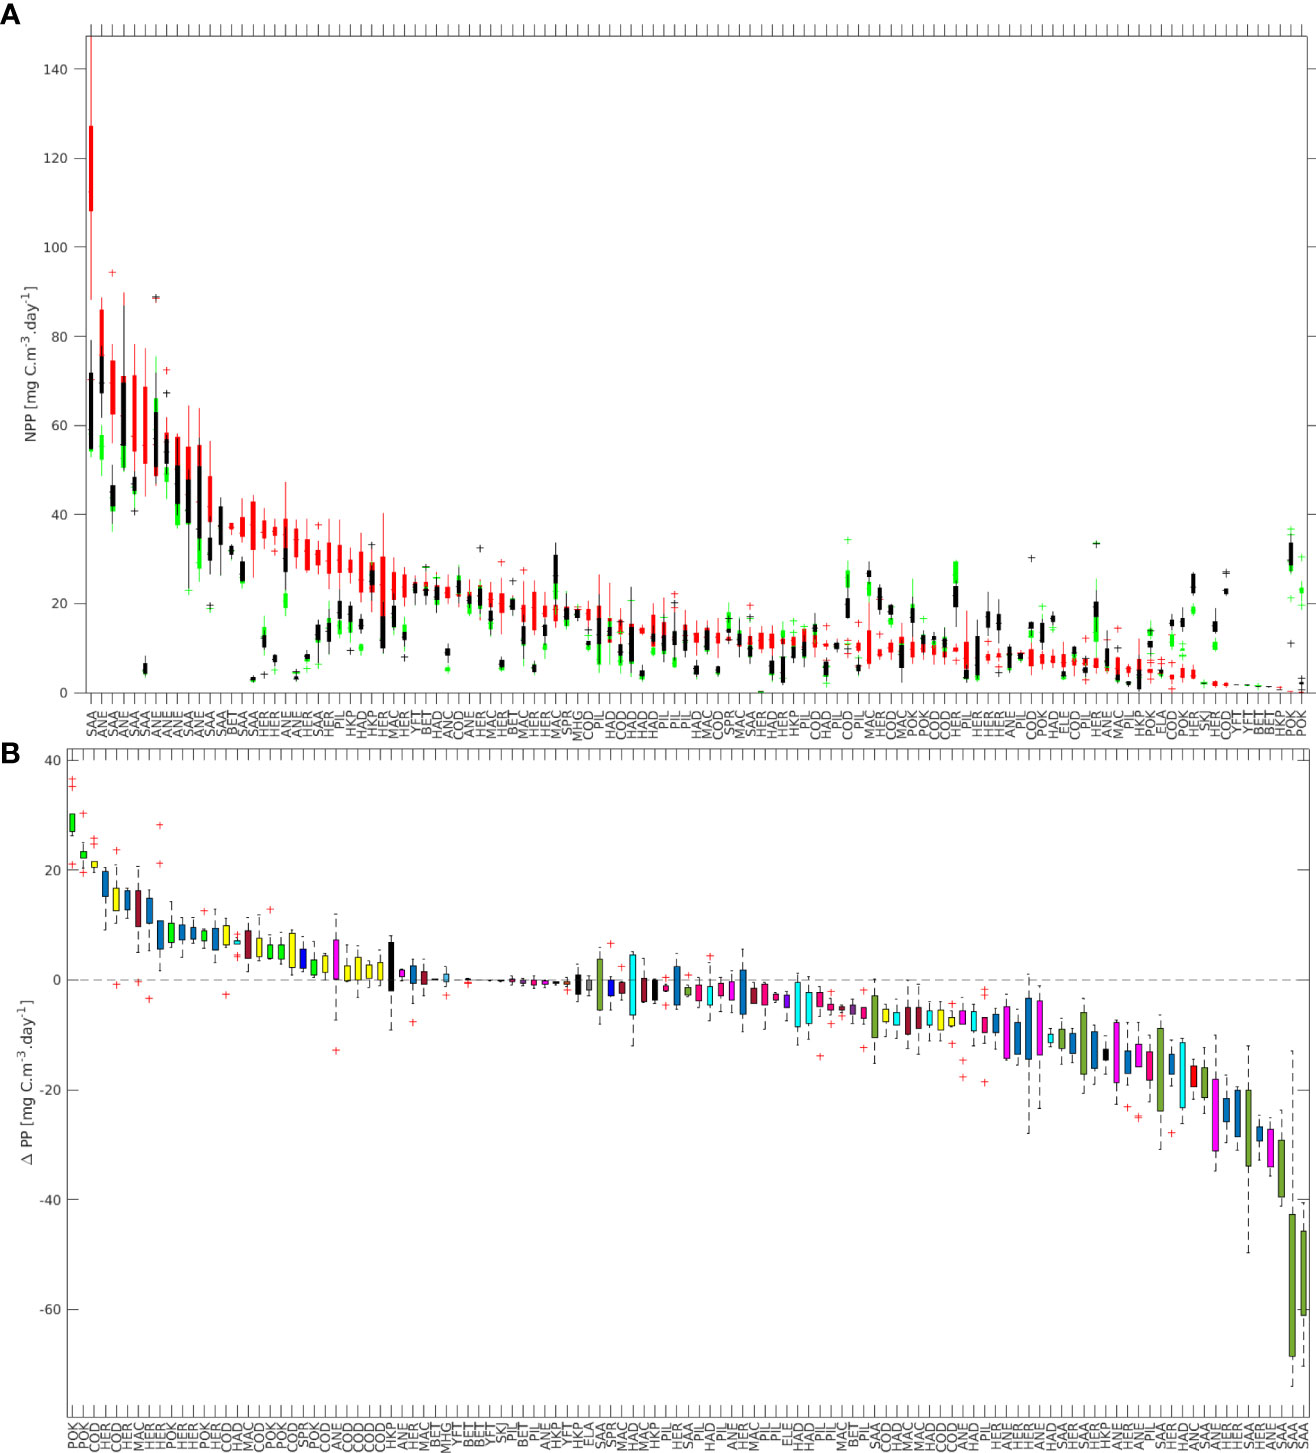
Figure 6 (A) Median net primary production (NPP) at spawning time (red), and at the final position after minimum (black) and maximum (green) length of the pelagic phase. (B) Difference between the median NPP at final position (only for the maximum PD) and spawning time (i.e., ΔPP). Ordered based on the median net production at spawning time (A) and ΔPP (B).
NPP values for the final positions ranged between 0 to 923 mgC m-3day-1 and 0 to 978.7 mgC m-3day-1 for the minimum and maximum PD. According to satellite ocean color models, the annual mean net primary productivity is 407 mgC m-2day-1, with values ranging from 7.2 to 12500 mgC m-2day-1 (Finkel, 2014).
The calculated mean ΔPP varied from –53.04 to 29.37 mgC m-3day-1 (Figure 6B). Several stocks had values close to zero (i.e., 18 stocks with -1 ≤ ΔPP ≥ 1), 31 stocks had positive values with ΔPP > 1 mgC m-3day-1, and the remaining 64 had values of ΔPP< -1 mgC m-3day-1. In total, 36 had positive mean values, while 77 had negative mean values.
All stocks of round sardinella (SAA) had high values of NPP at the spawning site, and relatively low values for the settling regions (Figure 6A), hence resulting in the lowest ΔPP for all the fish groups considered (Figure 6B). On the contrary, pollock (POK - Pollachius virens) had the lowest NPP at the spawning site and resulted in the highest ΔPP in our simulations (Figure 7).
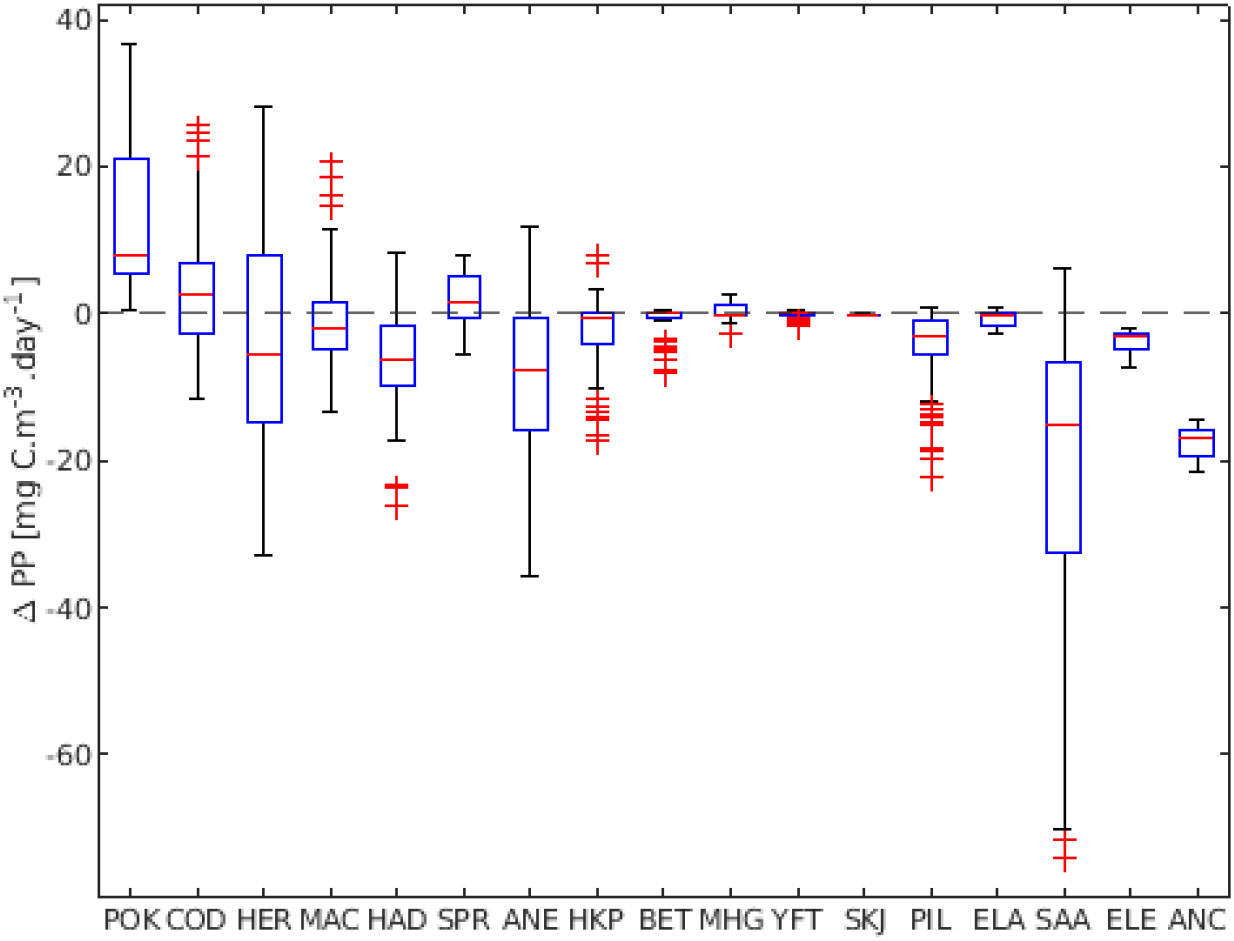
Figure 7 ΔPP presented per species. Results represent averages over stocks for each species. Ordered based on the ΔPP per species.
Overall, the simulations show the emergence of three patterns related to the primary production (Figure 6B): one where the particles reach more productive areas (ΔPP > 0), another where they settle in similar productivity regions (ΔPP ca. 0), and the last one where productivity during spawning is considerable higher than the productivity for settling (ΔPP < 0).
If we aggregate all the stocks in the respective species groups, the above strategies are retained and we find that a majority of the species show values around ΔPP = 0. Pollock, cod, and sprat were the species that had the highest ΔPP if we consider all stocks (Figure 7). Big eye, yellowfin and skipjack tuna had ΔPP values close to zero. Herring, European anchovy and round sardinella had the greatest variation of ΔPP. European eel and southern African anchovy only presented negative ΔPP, while only pollock had exclusively positive values for all its stocks.
3.4 Food requirements
Using the relationship in Eq. 1, we calculated the average critical zooplankton density for all species ρmin =1.60 mgC m-3day-1 for the early larval stages and ρmin= 0.03 mgC m-3day-1 for the final larval stages (Figure 8A). Consequently based on the relationship between NPP and zooplankton concentration (Figure A1) the mean critical NPP was NPPmin = 1270 mgC m-2day-1 for the early larval stages and 16 mgC m-2day-1 for the late larval stages (Figure 8B).
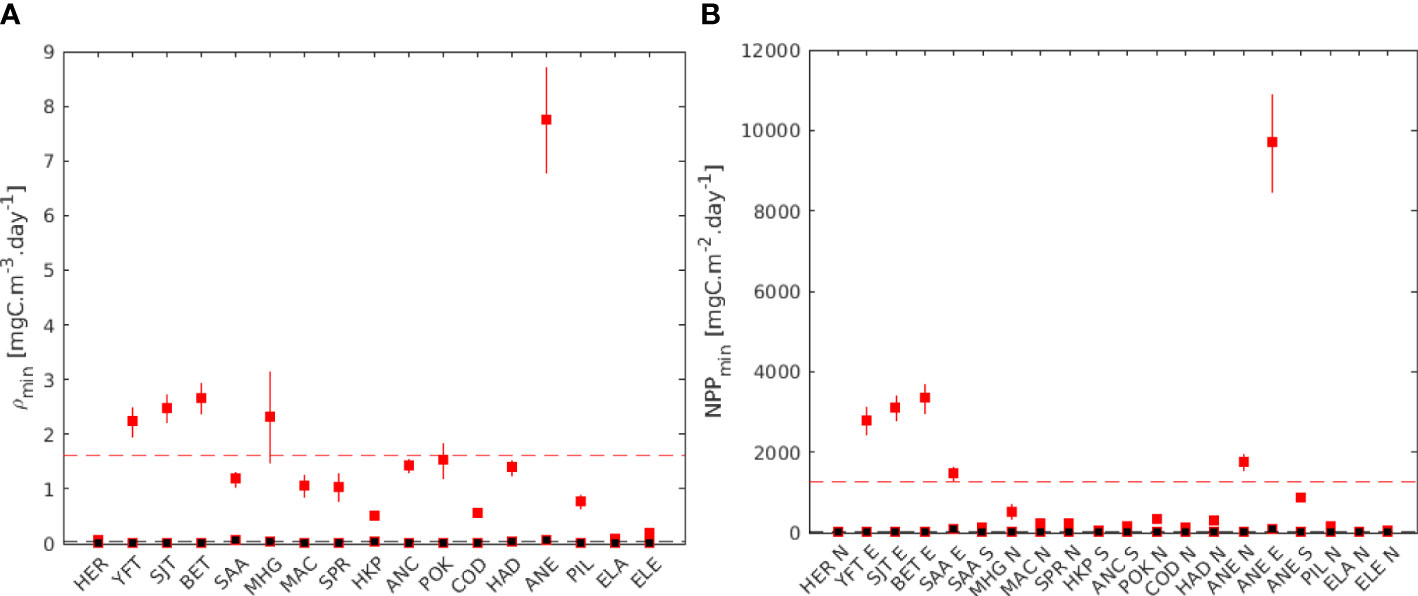
Figure 8 (A) Estimated critical zooplankton density (ρmin and (B) critical primary production (NPP min) for all species, based on the relationships between NPP and zooplankton density. In red, early larval stage, in black final larval stage. The vertical range bars corresponds to the minimum and maximum temperature experienced by the larvae during the spawning season. The dashed, line represents the average for all the species. In (B), Northern stocks (N), equatorial stocks (E), and Southern stocks (S) are aggregated.
4 Discussion
4.1 Model limitations
The quantification of dispersal in particle tracking methods requires some degree of simplification, due to the complexity of many biological and physical factors involved through multiple spatial and temporal scales. Thus, assumptions are required, for example, the use of a spatially uniform spawning ground (Treml et al., 2008). We used a fixed spawning time, spawning ground, and pelagic duration, however, some species can adapt their location and spawning time based on changes in environmental conditions (e.g. Bruge et al., 2016; Langangen et al., 2019). Similarly, eggs and larval duration can show year-to-year variability larger than that used in the present approach.
In the model, diel vertical migration was simulated using constant depths, while for some species those reference depths may change according to oceanographic characteristics (e.g. Sakuma et al., 1999; Smith and Suthers, 1999). It has been suggested that diel vertical migrations could be a behavioral response to the tradeoff between prey distribution and predation risks (Pinti and Visser, 2019). Light is generally considered as the major proxy to elicit DVM in fish larvae, and in some cases primary production was used to adapt residence time of the larvae based on food availability (like for example spending more time in the surface when food is available). For example, Fiksen and Jørgensen (2011) investigated the optimal behavior of cod larvae, and they found that food availability increased survival rate, but not growth rate, because when food was abundant, larvae would select deeper areas, avoiding predation. However, in the present version of our model we assumed species specific DVM with constant reference depths and constant larval swimming speed to migrate between those target depths.
Additionally, active horizontal swimming has been reported for a few species (e.g. Staaterman et al., 2012). For example, tidal migrations have been suggested as a mechanism for predicting settlement of northern sea bass (Beraud et al., 2018), sprat and cod in the North Sea (Daewel et al., 2011), and juvenile eel migration in tidal streams (Benson et al., 2021). Furthermore, there have been suggestions that eel larvae could use active horizontal swimming and the geomagnetic field to orient themselves in migrating from the Sargasso Sea to European waters (Melià et al., 2013). However, we did not included active horizontal behavior in the model because of the lack of a proper mechanistic description of this process for most of the larvae and stocks considered in the paper. Moreover, since active swimming speed is of order body length per second and not sustained, we expect in most cases horizontal swimming to be overshadowed by passive transport driven by ocean currents (e.g. Munk, 2014).
We used primary production in our analysis to obtain an index of the local enrichment and then food availability. However, several larvae groups do not feed (only) on phytoplankton but in their diet might be a high diversity of prey, for example herring’s larvae diet includes copepods, eggs, dinoflagellates and diatoms (Denis et al., 2016). Biomass estimations for the zooplankton community are more difficult to obtain and based on different models and modeling approaches. On the other hand, primary production can be used as a proxy of the amount of energy and material flowing into the local food web and can be assumed that higher values of NPP can result in higher zooplankton biomass.
We observed a positive relation between net primary production and zooplankton concentration (Supplementary Figure A1), which is dependent on the latitudinal gradient. Around 45°S, the relation between zooplankton and primary production is absent, however, as most of the stocks investigated in this study spawn not as south, it is legit to assume that in higher productive areas, zooplankton abundance is higher, and therefore fish larvae will most likely find prey easier. Hence, we considered it acceptable the use of net primary production in this study.
We extracted primary production at the initial and final position. Nevertheless, as previously discussed, the time when the yolk sac is depleted could be more important, or the primary production during the whole period should be considered. Computation limits the latter, nevertheless, the primary production at the end of the yolk sac can be easily obtained.
When we estimated food requirement, we used the same relations for all stocks. However, these can vary depending on many factors. For example, the weight-length relation vary per species. We also made assumptions regarding size of the prey, larvae swimming speed, and larval minimal visual angle. Besides that, not considering small-scale turbulence can result in up to 11-fold underestimation of frequency of contact between fish larvae and prey (MacKenzie and Leggett, 1991).
4.2 Validation
In order to validate the model, we compared the final positions of the larvae with larvae locations according to the Ocean Biodiversity Information System (OBIS, 2023) and International Council for the Exploration of the Sea database (ICES, 2022) (Supplementary Figure A2). As in some of the species there were little or lacking information, we also included in the analysis other life stages. For an ideal validation, it would be good to compare only with the years included in this research and only look at the larvae distribution. Nevertheless, such databases can bridge the gap between model simulations and empirical data, as we can compare predictions with empirical data to identify differences between both, and generate new hypothesis on larval dispersion and connectivity.
Seascape genetics is a framework that can improve predictions for biophysical models, many recent studies were able to find that the predictions from biophysical models are observed with genetic patterns and is a promising tool in understanding the dispersal within the metapopulation (Jahnke and Jonsson, 2022).
4.3 Strategies
We found contrasting primary production at spawning and settlement grounds across Atlantic stocks which we grouped into three patterns based on the enrichment index ΔPP. We interpret this as three not strongly separated strategies (Figure 6) where some stocks showed an increase in this value (n=31), a decrease (n=64) or showed values close to zero (n=18). From an ecological point of view, this implies that larvae can be transported to regions with higher, lower or similar primary productivity as those experienced in the spawning ground. In the first group, we find many gadidae, such as cod and pollock while in the second group, many small pelagic are present, e.g., round sardinella and European anchovy. Finally, tunas are mostly present in the third group with no major changes in NPP between spawning and settling. Big eye and yellowfin tuna are two of the species that consistently show ΔPP ca. 0.
Species belonging to the first group, moving into areas that are more productive are in agreement with the ocean triads hypothesis and after release, retention mechanisms might favor a distribution around regions of enrichment. However, several species show an opposite path moving into regions with lower NPP. We can propose four possible explanations for the unexpected results: the primary production being relevant not only at the end of the larval stage; existence of a threshold of primary production; NPP not as a decisive factor and finally overestimation of the dispersal. It is important to underline that some species (e.g. cod and herring) have a high among-stock variability with ΔPP values being both positive and negative (Figure 7). Hence, the results above cannot be taken as general patterns for the genus or family. Specifically, for the case of cod, it is known that the largest stock that spawns in the Norwegian Sea (which is not included in our simulations) is transported into the Barents Sea, thus in a region with lower values of NPP (Gjøsæter et al., 2020). Indeed, food requirements in the region seem to be satisfied by mesoscale dynamics and small-scale turbulence that can favor predator and prey encounter rates (Ottersen et al., 2014). A mechanism that is not included in our simulation for any stock.
We extracted the NPP at the start and end positions, nevertheless, a crucial time for the larval survival is when the yolk-sac reserve depletes. Thus, it can be that some species might prefer high productive areas for spawning, so at the time larvae need food for the first time, it will be available. It might be that the whole period from the end of the yolk sac to the end of the larval stage matters, so only comparing two times is not enough. However, the critical food requirement concentration in relation to larval size is monotonously decreasing, so the bottleneck would correspond to an extended area along drifts paths with significant prey scarcity.
The existence of a threshold in the primary production would explain why particles would end up at lower NPP areas. If the spawning occurs in productive areas, an increase or decrease might not affect the larvae, i.e., if a threshold is reached changes above the threshold would not make a fundamental difference for larval survival. Our analysis of critical prey concentration showed that the requirement is higher for larvae after the end of sac stage than at the end of larval stage. Indeed even though the required carbon intake is higher for a larger larva, the prey concentration can be lower, because these individuals are able to search a greater volume per time, and the factor of 50 difference in food concentration requirement (Figure 8) is mostly driven by the visual range that strongly scales with size. Therefore, these results support the hypothesis that for most species it is more important to spawn in high productive areas to allow the very early larval stages to satisfy their food demand, while that constraint is reduced at larger larval stages. Hence, a negative ΔPP strategy could be expected to emerge for different fish stocks.
However, primary production might also not be a direct factor in larval survival for a range of reasons. Due to the time gap between primary and secondary production, it might be that at the end of the simulation although primary production was lower, zooplankton abundance can be high enough to satisfy food demands. Cannibalism can be one explanation for why yellowfin tuna (YFT) and bigeye tuna (BET) larvae are found in areas of low productivity in our models. Previous studies with bullet, albacore and bluefin tuna in the Mediterranean Sea suggested that cannibalism is potentially a key factor for tuna recruitment (Reglero et al., 2011), and maybe a mechanism regulating recruitment in other species as well.
Overestimation of dispersal can explain why we found larvae in less productive areas. Cowen et al. (2000) found that larval dispersal might be overestimated as physical processes together with larval behavior (horizontal and vertical swimming) may retain larvae distribution (Wing et al., 1998; Cowen et al., 2000), therefore larval retention might be more important than initially thought. Huret et al. (2012) used an individual based model coupled with zooplankton abundance to investigate the effect of food limitation in the dispersal of anchovy larvae. Their results showed that larvae would not survive offshore when food was limiting and probability of starvation was high. In our study, we addressed starvation issues a posteriori, by comparing estimated food abundances with requirements at spawning grounds and settlement areas, and we found that food concentration can be more crucial at the early life stages of the larvae, i.e. more chances to starve in the early life stage of the larvae. Another important factor for larval survival is heterogeneous predation pressure; this can be quantified by for example overlap of the drift paths with predator abundance. However, predator abundances are very variable in space and time, and difficult to reconstruct especially at the whole Atlantic scale for several years.
Data availability statement
The original contributions presented in the study are included in the article/Supplementary Material. Further inquiries can be directed to the corresponding author.
Ethics statement
Ethical review and approval was not required for the animal study because no live animal was used for experiments.
Author contributions
AP, PM, AC, and PMa contributed to conception and design of the study. AP organized the database, performed the statistical analysis and wrote the first draft of the manuscript. All authors contributed to manuscript revision, read, and approved the submitted version.
Funding
This article is delivered under the MISSION ATLANTIC project funded by the European Union’s Horizon 2020 Research and Innovation Program under grant agreement No. 639 862428.
Acknowledgments
We would like to acknowledge Peter Munk to contributing in shaping the initial idea of the manuscript.
Conflict of interest
The authors declare that the research was conducted in the absence of any commercial or financial relationships that could be construed as a potential conflict of interest.
Publisher’s note
All claims expressed in this article are solely those of the authors and do not necessarily represent those of their affiliated organizations, or those of the publisher, the editors and the reviewers. Any product that may be evaluated in this article, or claim that may be made by its manufacturer, is not guaranteed or endorsed by the publisher.
Supplementary material
The Supplementary Material for this article can be found online at: https://www.frontiersin.org/articles/10.3389/fmars.2023.1141726/full#supplementary-material
References
Akimova A., Hufnagl M., Peck M. A. (2019). Spatiotemporal dynamics of predators and survival of marine fish early life stages: Atlantic cod (Gadus morhua) in the North Sea. Prog. Oceanography 176, 102121. doi: 10.1016/j.pocean.2019.102121
Allan B. J. M., Ray J. L., Tiedemann M., Komyakova V., Vikebø F., Skaar K. S., et al. (2021). Quantitative molecular detection of larval Atlantic herring (Clupea harengus) in stomach contents of Atlantic mackerel (Scomber scombrus) marks regions of predation pressure. Sci. Rep. 11 (1), 5095. doi: 10.1038/s41598-021-84545-7
Almany G., Berumen M. L., Thorrold S. R., Planes S., Jones G. P. (2007). Local replenishment of coral reef fish populations in a marine reserve. Science 316, 742–744. doi: 10.1126/science.1140597
Arai T., Otake T., Tsukamoto K. (2000). Timing of metamorphosis and larval segregation of the Atlantic eels Anguilla rostrata and A. anguilla, as revealed by otolith microstructure and microchemistry. Mar. Biol. 137, 39–45. doi: 10.1007/s002270000326
Bakun A. (1996). Patterns in the Ocean: Ocean Processes and Marine Population Dynamics (San Diego, CA: Univ. California Sea Grant), 323.
Bakun A. (1998). “Ocean triads and radical interdecadal variation: bane and boon to scientific fisheries management,” in Reinventing Fisheries Management. Fish and Fisheries Series. Eds. Pitcher T. J., Pauly D., Hart P. J. B. (Dordrecht: Springer). doi: 10.1007/978-94-011-4433-9_25
Benson T., de Bie J., Gaskell J., Vezza P., Kerr J. R., Lumbroso D., et al. (2021). Agent-based modelling of juvenile eel migration via selective tidal stream transport. Ecol. Model. 443, 109448. doi: 10.1016/j.ecolmodel.2021.109448
Beraud C., van der Molen J., Armstrong M., Hunter E., Fonseca L., Hyder K. (2018). The influence of oceanographic conditions and larval behaviour on settlement success - The European sea bass Dicentrarchus labrax (L.). ICES J. Mar. Sci. 75 (2), 455–470. doi: 10.1093/icesjms/fsx195
Britten G. L., Dowd M., Worm B. (2015). Changing recruitment capacity in global fish stocks. Proc. Natl. Acad. Sci. U. S. A. 113 (1), 134–139. doi: 10.1073/pnas.1504709112
Bruge A., Alvarez P., Fontán A., Cotano U., Chust G. (2016). Thermal niche tracking and future distribution of Atlantic mackerel spawning in response to ocean warming. Front. Mar. Sci. 3, 86. doi: 10.1371/journal.pone.0189956
Christensen A., Mariani P., Payne M. R. (2018). A generic framework for individual-based modelling and physical-biological interaction. PLOS One 13 (1), e0189956. doi: 10.1371/journal.pone.0189956
Conway D. V. P., Coombs S. H., Lindley J. A., Llewellyn C. A. (1999). Diet of mackerel (Scomber scombrus) larvae at the shelf-edge to the south-west of the British Isles and the incidence of piscivory and coprophagy. Vie Et Milieu 49 (4), 218–220.
Cowen R. K., Lwiza K. M. M., Sponaugle S., Paris C. B., Olson D. B. (2000). Connectivity of marine populations: Open or closed? Science 287 (5454), 857–859. doi: 10.1126/science.287.5454.857
Cresci A., Durif C. M., Paris C. B., Shema S. D., Skiftesvik A. B., Browman H. I. (2019). Glass eels (Anguilla anguilla) imprint the magnetic direction of tidal currents from their juvenile estuaries. Commun. Biol. 2 (1), 366. doi: 10.1038/s42003-019-0619-8
Cushing D. H. (1974). “The possible density-dependence of larval mortality and adult mortality in fishes,” in The Early Life History of Fish. Ed. Blaxter J. H. S. (Berlin: Springer-Verlag).
Cushing D. H. (1990). Plankton production and year-class strength in fish populations: an update of the match/mismatch hypothesis. Adv. Mar. Biol. 26, 250–293. doi: 10.1016/S0065-2881(08)60202-3
Cushing D. H. (1996). “Towards a science of recruitment in fish populations,” in Excellence in Ecology. Ed. Kinne O. (Oldendorf/Luhe, Germany: Ecology Institute), 175.
Daewel U., Peck M. A., Schrum C. (2011). Life history strategy and impacts of environmental variability on early life stages of two marine fishes in the North Sea: An individual-based modelling approach. Can. J. Fisheries Aquat. Sci. 68 (3), 426–443. doi: 10.1139/F10-164
Denis J., Vallet C., Courcot L., Lefebvre V., Caboche J., Antajan E., et al. (2016). Feeding strategy of Downs herring larvae (Clupea harengus L.) in the English Channel and North Sea. J. Sea Res. 115, 33–46. doi: 10.1016/j.seares.2016.07.003
Dias D. F., Pezzi L. P., Gherardi D. F. M., Camargo R. (2014). Modeling the spawning strategies and larval survival of the Brazilian sardine (Sardinella brasiliensis). Prog. Oceanography 123, 38–53. doi: 10.1016/j.pocean.2014.03.009
FAO (2020). FAO yearbook. Fishery and Aquaculture Statistics 2018/FAO annuaire. Statistiques des pêches et de l’aquaculture 2018/ FAO anuario. Estadísticas de pesca y acuicultura 2018 (Rome/Roma). doi: 10.4060/cb1213t
Ferreira A. S. A., Neuheimer A. B., Durant J. M. (2023). Impacts of the match-mismatch hypothesis across three trophic levels-a case study in the North Sea. ICES J. Mar. Sci. 80 (2), 308–316. doi: 10.1093/icesjms/fsac237
Fiksen O., Jørgensen C. (2011). Model of optimal behaviour in fish larvae predicts that food availability determines survival, but not growth. Mar. Ecol. Prog. Ser. 432, 207–219. doi: 10.3354/meps09148
Fiksen Ø., Jørgensen C., Kristiansen T., Vikebø F., Huse G. (2007). Linking behavioural ecology and oceanography: Larval behaviour determines growth, mortality and dispersal. Mar. Ecol. Prog. Ser. 347, 195–205. doi: 10.3354/meps06978
Finkel Z. V. (2014). “Marine net primary production,” in Global Environmental Change. Handbook of Global Environmental Pollution, vol. 1 . Ed. Freedman B. (Dordrecht: Springer). doi: 10.1007/978-94-007-5784-4_42
Froese R., Pauly D. (2022). FishBase (World Wide Web electronic publication). Available at: www.fishbase.org (Accessed April 2022).
Garrido S., Saiz E., Peters J., Ré P., Alvarez P., Cotano U., et al. (2012). Effect of food type and concentration on growth and fatty acid composition of early larvae of the anchovy (Engraulis encrasicolus) reared under laboratory conditions. J. Exp. Mar. Biol. Ecol. 434-435, 16–24. doi: 10.1016/j.jembe.2012.07.021
Gjøsæter H., Huserbråten M., Vikebø F., Eriksen E. (2020). Key processes regulating the early life history of Barents Sea polar cod. Polar Biol. 43 (8), 1015–1027. doi: 10.1007/s00300-020-02656-9
Gray C. A. (1996). Do thermoclines explain vertical distribution of larval fishes in the dynamic coastal waters of South-eastern Australia? Mar. Freshw. Res. 47, 183–190. doi: 10.1071/MF9960183
Grimm V., Berger U., Bastiansen F., Eliassen S., Ginot V., Giske J., et al. (2006). A standard protocol for describing individual-based and agent-based models. Ecol. Model. 198 (1-2), 115–126. doi: 10.1016/j.ecolmodel.2006.04.023
Grimm V., Berger U., DeAngelis D. L., Polhill J. G., Giske J., Railsback S. F. (2010). The ODD protocol: A review and first update. Ecol. Model. 221 (23), 2760–2768. doi: 10.1139/F09-105
Hallfredsson E. H., Pedersen T. (2009). Effects of predation from juvenile herring (Clupea harengus) on mortality rates of capelin (Mallotus villosus) larvae. Canadian J. of Fish. Aquatic. Sci. 66 (10), 1693–1706. doi: 10.1139/F09-105
Hjort J. (1914). Fluctuations in the great fisheries of northern Europe viewed in the light of biological research. Rapports Procès-verbaux Des. Réunions Conseil Int. pour l’Exploration la Mer 20, 1–228.
Huret M., Vandromme P., Petitgas P., Pecquerie L. (2012). “Connectivity patterns of anchovy larvae in the Bay of Biscay from a coupled transport-bioenergetic model forced by size-structured zooplankton,” in ICES-CIEM Annual Science Conference, Bergen.
ICES (2022) Eggs and larvae. Available at: https://www.ices.dk/data/data-portals/Pages/Eggs-and-larvae.aspx.
Jahnke M., Jonsson P. R. (2022). Biophysical models of dispersal contribute to seascape genetic analyses. Philos. Trans. R. Soc. B: Biol. Sci. 377 (1846), 20210024. doi: 10.1098/rstb.2021.0024
Jones G. P., Milicich M. J., Emslie M. J., Lunow C. (1999). Self-recruitment in a coral reef fish population. Nature 402, 802–804. doi: 10.1038/45538
Kane J. (1984). The feeding habits of co-occurring cod and haddock larvae from Georges Bank Vol. 16 (Marine Ecology Progress Series), 9–20.
Kristiansen T., Drinkwater K. F., Lough R. G., Sundby S. (2011). Recruitment variability in North Atlantic cod and match-mismatch dynamics. PloS One 6 (3), e17456. doi: 10.1371/journal.pone.0017456
Langangen Ø., Färber L., Stige L. C., Diekert F. K., Barth J. M. I., Matschiner M., et al. (2019). Ticket to spawn: Combining economic and genetic data to evaluate the effect of climate and demographic structure on spawning distribution in Atlantic cod. Global Change Biol. 25 (1), 134–143. doi: 10.1111/gcb.14474
Lecomte-Finiger R. (1994). The early-life of european eel. Nature 370 (6489), 424–424. doi: 10.1038/370424a0
Leggett W. C., Deblois E. (1994). Recruitment in Marine Fishes – Is it regulated by starvation and predation in in the egg and larval stages. Netherlands J. Sea Res. 32 (2), 119–134. doi: 10.1016/0077-7579(94)90036-1
Letcher B. H., Rice J. A., Crowder L. B., Rose K. A. (1996). Variability in survival of larval fish: Disentangling components with a generalized individual-based model. Can. J. Fisheries Aquat. Sci. 53 (4), 787–801. doi: 10.1139/f95-241
Lett C., Penven P., Ayón P., Fréon P. (2007). Enrichment, concentration and retention processes in relation to anchovy (Engraulis ringens) eggs and larvae distributions in the northern Humboldt upwelling ecosystem. J. Mar. Syst. 64 (1-4), 189–200. doi: 10.1016/j.jmarsys.2006.03.012
Lett C., Roy C., Levasseur A., van der Lingen C. D., Mullon C. (2006). Simulation and quantification of enrichment and retention processes in the southern Benguela upwelling ecosystem. Fisheries Oceanography 15 (5), 363–372. doi: 10.1111/j.1365-2419.2005.00392.x
MacKenzie B. R., Leggett W. C. (1991). Quantifying the contribution of small-scale turbulence to the encounter rates between larval fish and their zooplankton prey – effects of wind and tide. Mar. Ecol. Prog. Ser. 73 (2-3), 149–160. doi: 10.3354/meps073149
MacKenzie B. R., Leggett W. C., Peters R. H. (1990). Estimating larval fish ingestion rates - Can laboratory derived values be reliably extrapolated to the wild? Mar. Ecol. Prog. Ser. 67 (3), 209–225. doi: 10.3354/meps067209
Mariani P., MacKenzie B., Iudicone D., Bozec A. (2010). Modelling retention and dispersion mechanisms of bluefin tuna eggs and larvae in the Northwest Mediterranean Sea. Prog. Oceanography 86 (1-2), 45–58. doi: 10.1016/j.pocean.2010.04.027
Melià P., Schiavina M., Gatto M., Bonaventura L., Masina S., Casagrandi R. (2013). Integrating field data into individual-based models of the migration of European eel larvae. Mar. Ecol. Prog. Ser. 487, 135–149. doi: 10.3354/meps10368
Merrett N. R. (1995). Reproduction in the North Atlantic ichthyofauna and the relationship between fecundity and size. Environ. Biol. Fish 41, 207–245.
Miller T. J. (2007). Contribution of individual-based coupled physical–biological models to understanding recruitment in marine fish populations. Mar. Ecol. Prog. Ser. 347, 127–138. doi: 10.3354/meps06973
Miller M. J., Bonhommeau S., Munk P., Castonguay M., Hanel R., McCleave J. D. (2015). A century of research on the larval distributions of the Atlantic eels: a re-examination of the data: Larval distributions of the Atlantic eels. Biol. Rev. 90 (4), 1035–1064. doi: 10.1111/brv.12144
Munk P. (2014). Fish larvae at fronts: Horizontal and vertical distributions of gadoid fish larvae across a frontal zone at the Norwegian Trench. Deep Sea Res. Part Ii: Topical Stud. Oceanography 107, 3–14. doi: 10.1016/j.dsr2.2014.01.016
Munk P., Kioerboe T., Christensen V. (1989). Vertical migrations of herring, Clupea harengus, larvae in relation to light and prey distribution. Environ. Biol. Fishes 26, 87–96. doi: 10.1007/BF00001025
Murphy H. M., Pepin P., Robert D. (2018). Re-visiting the drivers of capelin recruitment in Newfoundland since 1991. Fisheries Res. 200, 1–10. doi: 10.1016/j.fishres.2017.12.005
OBIS (2023) Distribution records of : Southern african anchovy, European anchovy, bigeye tuna, Atlantic cod, American eel, European eel, haddock, Atlantic herring, Argentinian hake, Atlantic mackerel, gulf menhaden, sardine, pollock, round sardinella, skipjack tuna, European sprat, yellowfin tuna (Ocean Biodiversity Information System. Intergovernmental Oceanographic Commission of UNESCO). Available at: www.obis.org (Accessed 2023-04-15).
Ottersen G., Bogstad B., Yaragina N. A., Stige L. F., Vikebø F. B., Dalpadado P. (2014). A review of early life history dynamics of barents sea cod (Gadus morhua). ICES J. Mar. Sci. 71 (8), 2064–2087. doi: 10.1093/icesjms/fsu037
Pelegrí J. L., Peña-Izquierdo J. (2015). “Eastern Boundary Currents off North-west Africa,” in IOC Technical series, vol. 115, 81–92. Available at: http://hdl.handle.net/1834/9179.
Pinti J., Visser A. W. (2019). Predator-prey games in multiple habitats reveal mixed strategies in diel vertical migration. Am. Nat. 193 (3), E65–E77. doi: 10.1086/701041
Platt T., Fuentes-Yaco C., Frank K. T. (2003). Marine ecology: Spring algal bloom and larval fish survival. Nature 423 (6938), 398–399. doi: 10.1038/423398b
Pope S. B. (2000). Turbulent flows (Cambridge: Cambridge University Press). doi: 10.1017/CBO9780511840531
Reglero P., Urtizberea A., Torres A. P., Alemany F., Fiksen O. (2011). Cannibalism among size classes of larvae may be a substantial mortality component in tuna. Mar. Ecol. Prog. Ser. 433, 205–219. doi: 10.3354/meps09187
Rodríguez J. M., Barton E. D., Eve L., Hernández-León S. (2001). Mesozooplankton and ichthyoplankton distribution around Gran Canaria, an oceanic island in the NE Atlantic. Deep-Sea Res. Part 1 Oceanogr. Res. Pap. 48 (10), 2161–2183. doi: 10.1016/S0967-0637(01)00013-9
Rodríguez J. M., Barton E. D., Hernández-León S., Arístegui J. (2004). The influence of mesoscale physical processes on the larval fish community in the Canaries CTZ, in summer. Prog. Oceanogr. 62 (2–4), 171–188. doi: 10.1016/j.pocean.2004.07.006
Rodríguez J. M., Hernández-León S., Barton E. D. (1999). Mesoscale distribution of fish larvae in relation to an upwelling filament off Northwest Africa. Deep-Sea Res. Part 1 Oceanogr. Res. Pap. 46 (11), 1969–1984. doi: 10.1016/S0967-0637(99)00036-9
Rose K. A., Cowan J. J. H. (1993). Individual-based model of young-of-the-year striped bass population dynamics: I. Model description and baseline simulations. Trans. Am. Fisheries Soc. 122 (3), 415–438.
Roy C., Cury P., Kifani S. (1992). Pelagic fish recruitment success and reproductive strategy in upwelling areas – Environmental compromises. South Afr. J. Mar. Science-Suid-Afrikaanse Tydskrif Vir Seewetenskap 12 (1), 135–146. doi: 10.2989/02577619209504697
Sagaut P. (2005). Large Eddy Simulation for Incompressible Flows: An Introduction (Springer Science & Business Media). doi: 10.1007/b137536
Sakuma K. M., Ralston S., Roberts D. A. (1999). Diel vertical distribution of postflexion larval Citharichthys spp. and Sebastes spp. off central California. Fisheries Oceanography 8 (1), 68–76. doi: 10.1046/j.1365-2419.1999.00088.x
Schmidt J. (1923). The breeding places of the eel. Phil. Trans. R. Soc. Lond. B211, 179–208. doi: 10.1098/rstb.1923.0004
Sigler M. F., Napp J. M., Stabeno P. J., Heintz R. A., Lomas M. W., Hunt G. L. (2016). Variation in annual production of copepods, euphausiids, and juvenile walleye pollock in the southeastern Bering Sea. Deep-Sea Res. Part Ii: Topical Stud. Oceanography 134, 223–234. doi: 10.1016/j.dsr2.2016.01.003
Smagorinsky J. (1963). General circulation experiments with the primitive equations. Monthly Weather Rev. 91 (3), 99–164. doi: 10.1175/1520-0493(1963)091<0099:GCEWTP>2.3.CO;2
Smith P. E., Moser H. G. (2003). Long-term trends and variability in the larvae of Pacific sardine and associated fish species of the California Current region. Deep-Sea Res. Part Ii: Topical Stud. Oceanography 50 (14-16), 2519–2536. doi: 10.1016/S0967-0645(03)00133-4
Smith K. A., Suthers I. M. (1999). Displacement of diverse ichthyoplankton assemblages by a coastal upwelling event on the Sydney shelf. Mar. Ecol. Prog. Ser. 176, 49–62. doi: 10.3354/meps176049
Southward A. J., Barret R. L. (1983). Observations on the vertical distribution of zooplankton, including post-larval teleosts, off Plymouth in the presence of a thermocline and a chlorophyll-dense layer. J. Plankton Res. 5 (4), 599–618. doi: 10.1093/plankt/5.4.599
Staaterman E., Paris C. B., Helgers J. (2012). Orientation behavior in fish larvae: A missing piece to Hjort's critical period hypothesis. J. Theor. Biol. 304, 188–196. doi: 10.1016/j.jtbi.2012.03.016
Thygesen U. H., Farnsworth K. D., Andersen K. H., Beyer J. (2005). How optimal life history changes with the community size-spectrum. Proc. R. Soc. B-Biological Sci. 272 (1570), 1323–1331. doi: 10.1098/rspb.2005.3094
Treml E. A., Halpin P. N., Urban D. L., Pratson L. F. (2008). Modeling population connectivity by ocean currents, a graph-theoretic approach for marine conservation. Landscape Ecol. 23 (1), 19–36. doi: 10.1007/s10980-007-9138-y
Trenkel V. M., Huse G., MacKenzie B., Alvarez P., Arrizabalaga H., Castonguay M., et al. (2014). Comparative ecology of widely distributed pelagic fish species in the North Atlantic: Implications for modelling climate and fisheries impacts. Prog. Oceanography 129 (Part B), 219–243. doi: 10.1016/j.pocean.2014.04.030
Keywords: particle tracking, individual-based model, recruitment, fish ecology, ocean transport, retention
Citation: Pereira Gabellini A, Mariani P and Christensen A (2023) Population connectivity and dynamics in early-life stages of Atlantic fish communities. Front. Mar. Sci. 10:1141726. doi: 10.3389/fmars.2023.1141726
Received: 10 January 2023; Accepted: 07 July 2023;
Published: 24 August 2023.
Edited by:
Vladimir Laptikhovsky, Centre for Environment, Fisheries and Aquaculture Science (CEFAS), United KingdomReviewed by:
Olav Sigurd Kjesbu, Institute of the Marine Research, NorwayClaire Beraud, Centre for Environment, Fisheries and Aquaculture Science (CEFAS), United Kingdom
Copyright © 2023 Pereira Gabellini, Mariani and Christensen. This is an open-access article distributed under the terms of the Creative Commons Attribution License (CC BY). The use, distribution or reproduction in other forums is permitted, provided the original author(s) and the copyright owner(s) are credited and that the original publication in this journal is cited, in accordance with accepted academic practice. No use, distribution or reproduction is permitted which does not comply with these terms.
*Correspondence: Aurelia Pereira Gabellini, YXVnYUBhcXVhLmR0dS5kaw==