 Subhadeep Rakshit
 Andrew W. Dale
 Douglas W. Wallace
 Christopher Kenneth Algar
- 1Department of Oceanography, Dalhousie University, Halifax, NS, Canada
- 2GEOMAR Helmholtz Centre for Ocean Research Kiel, Kiel, Germany
Deoxygenation of the ocean has been occurring over the last half century, particularly in poorly ventilated coastal waters. In coastal and estuarine environments, both the water column and sediments play key roles in controlling oxygen variability. In this study, we focus on controls of oxygen concentration in Bedford Basin (BB), a 70 m deep, seasonally hypoxic semi-enclosed fjord on the West Atlantic coast in Nova Scotia. The basin is connected to the Scotian Shelf via a narrow 20 m deep sill that restricts the resupply of bottom water. Hypoxia was recorded seasonally in 2018, 2019 and 2021 with minimum oxygen concentration of 5, 6.7 and 2.7 μM, respectively. Using a 1-D benthic-pelagic coupled model we investigate oxygen consumption and resupply processes during these years. The model was constrained with weekly water column measurements of temperature, salinity, chlorophyll-a fluorescence and dissolved oxygen from a monitoring station in the central basin together with seasonal measurements of benthic diffusive oxygen uptake. Our model suggested that 29-81%, and up to 36% of bottom water re-oxygenation occurred during the winter mixing period and through summer/fall intrusions of Scotian Shelf water, respectively. Occasional shelf water intrusions occurred rapidly, on a timescale of a few hours, and delivered equivalent amounts of oxygen as winter mixing and were sufficient to end bottom water hypoxia. Collectively, these mechanisms supplied the majority of the oxygen delivered to the bottom water. Oxygen supply to bottom waters during periods of water column stratification accounted for 19-36% of the annual flux. The mean benthic uptake was 12 ± 8 mmol m-2 d-1 and contributed ~20% of the total oxygen consumption below the sill depth. In 2021, sea surface temperature (SST) was unusually high and likely resulted in 50% less bottom water oxygenation compared to 2018 and 2019 due to increased stratification; SST in BB was found to be increasing at a rate of 0.11 ± 0.02 °C/year. Climate control on water column stratification are discussed and numerical experiments are used to compare the effects of different water column mixing scenarios on bottom water oxygenation.
1 Introduction
Declining dissolved oxygen in the ocean is of global concern. Several reports have identified an increase in the incidence of hypoxia (dissolved O2 < 63 μM) over the last half century (Diaz and Rosenberg, 2008; Gilbert et al., 2010; Schmidtko et al., 2017; Breitburg et al., 2018). The extent, frequency, duration, and intensity of these events have increased globally (Diaz and Rosenberg, 2008), with a 5.5% per year increase in reported coastal hypoxia in the last few decades (Vaquer-Sunyer and Duarte, 2008). While this may partially be attributed to increased monitoring (Vaquer-Sunyer and Duarte, 2008), the ultimate driving mechanisms are likely to be climate related shifts in ocean circulation, increased nutrient loading, and increased stratification of surface waters (Diaz and Rosenberg, 2008; Stramma et al., 2008; Frölicher et al., 2009; Gilbert et al., 2010; Jutras et al., 2020).
The bottom waters of semi-enclosed, coastal basins, fjords, and estuaries may be particularly susceptible to hypoxia (Fennel and Testa, 2019). Often, the presence of a sill restricts bottom water circulation which, combined with stratification during summer months, limits oxygen resupply. If loss due to respiration exceeds replenishment, hypoxic or even anoxic conditions may develop. In winter months, surface cooling and increased wind-driven mixing often reduces stratification and bottom waters may be reoxygenated. This natural seasonal cycle can be altered or exacerbated by anthropogenetic influences such as eutrophication or long-term trends of increased stratification and decreased oxygen solubility associated with climate warming.
To understand the sensitivity of a particular coastal area to seasonal hypoxia, it is necessary to quantify not only oxygen losses due to respiration in the water column and sediments, but also the various mechanisms of oxygen resupply, e.g., mixing with oxygenated surface waters. In coastal environments with shallow waters, processes within the sediment can be particularly important for oxygen budgets (e.g., Fennel and Testa, 2019). Under hypoxic conditions, bottom sediments can also become a major source of nutrients, in particular phosphorous, creating a positive feedback between eutrophication and oxygen depletion (Conley et al., 2002; Noffke et al., 2016; Song et al., 2021). On the other hand, sediment can remove fixed nitrogen through denitrification (Seitzinger et al., 2006; Fennel et al., 2009). Hypoxia, when it occurs, can also alter nitrogen cycling by promoting dissimilatory nitrate reduction to ammonium (DNRA) which retains bioavailable nitrogen in the environment (Jäntti and Hietanen, 2012; Noffke et al., 2016).
In the present study, we quantify the sources and sinks of oxygen in a restricted coastal basin and demonstrate how long-term monitoring combined with biogeochemical modeling can unravel the mechanisms driving coastal hypoxia. The study is focused on Bedford Basin (BB) (Figure 1), a well-studied site (Petrie and Yeats, 1990; Shan et al., 2011; Haas et al., 2021), which forms the inner portion of Halifax Harbour, an industrialized port surrounded by the city of Halifax (Canada), located on the Scotian Shelf in the northwest Atlantic Ocean. The basin itself is a 70 m deep, 17 km2, fjord-type estuary. The Sackville River delivers freshwater into the head of the basin and at its seaward end the basin is connected to the outer Halifax Harbour and the Scotian Shelf via a 20 m deep sill. The freshwater input (5.3 m3 s-1) is small compared to the mean tidal volume (2.5 × 10⁷ m3) and the total basin volume (5.1 × 10⁸ m3) (Petrie and Yeats, 1990; Haas et al., 2022). The presence of the sill restricts the estuarine circulation to the upper 20 m and the bottom water can become isolated from the surface layer due to stratification, leading to development of seasonal hypoxia. The average flushing time previously estimated for the entire basin is 91 days but for bottom waters it can be upwards of 194 days (Shan and Sheng, 2012; Burt et al., 2013; Haas et al., 2021). The prevailing wind blows from the North-West direction from September to April; the wind direction varies more in summer, but is mostly from the South-West direction. Typically, hypoxia develops in late summer or fall and ends during the late winter when convective mixing oxygenates the bottom waters. Oxygen is also occasionally resupplied by intrusions of dense Scotian Shelf water that can replenish either the bottom or mid-depth waters (Shi and Wallace, 2018; Haas et al., 2021). These intrusions appear to be more common in the fall.
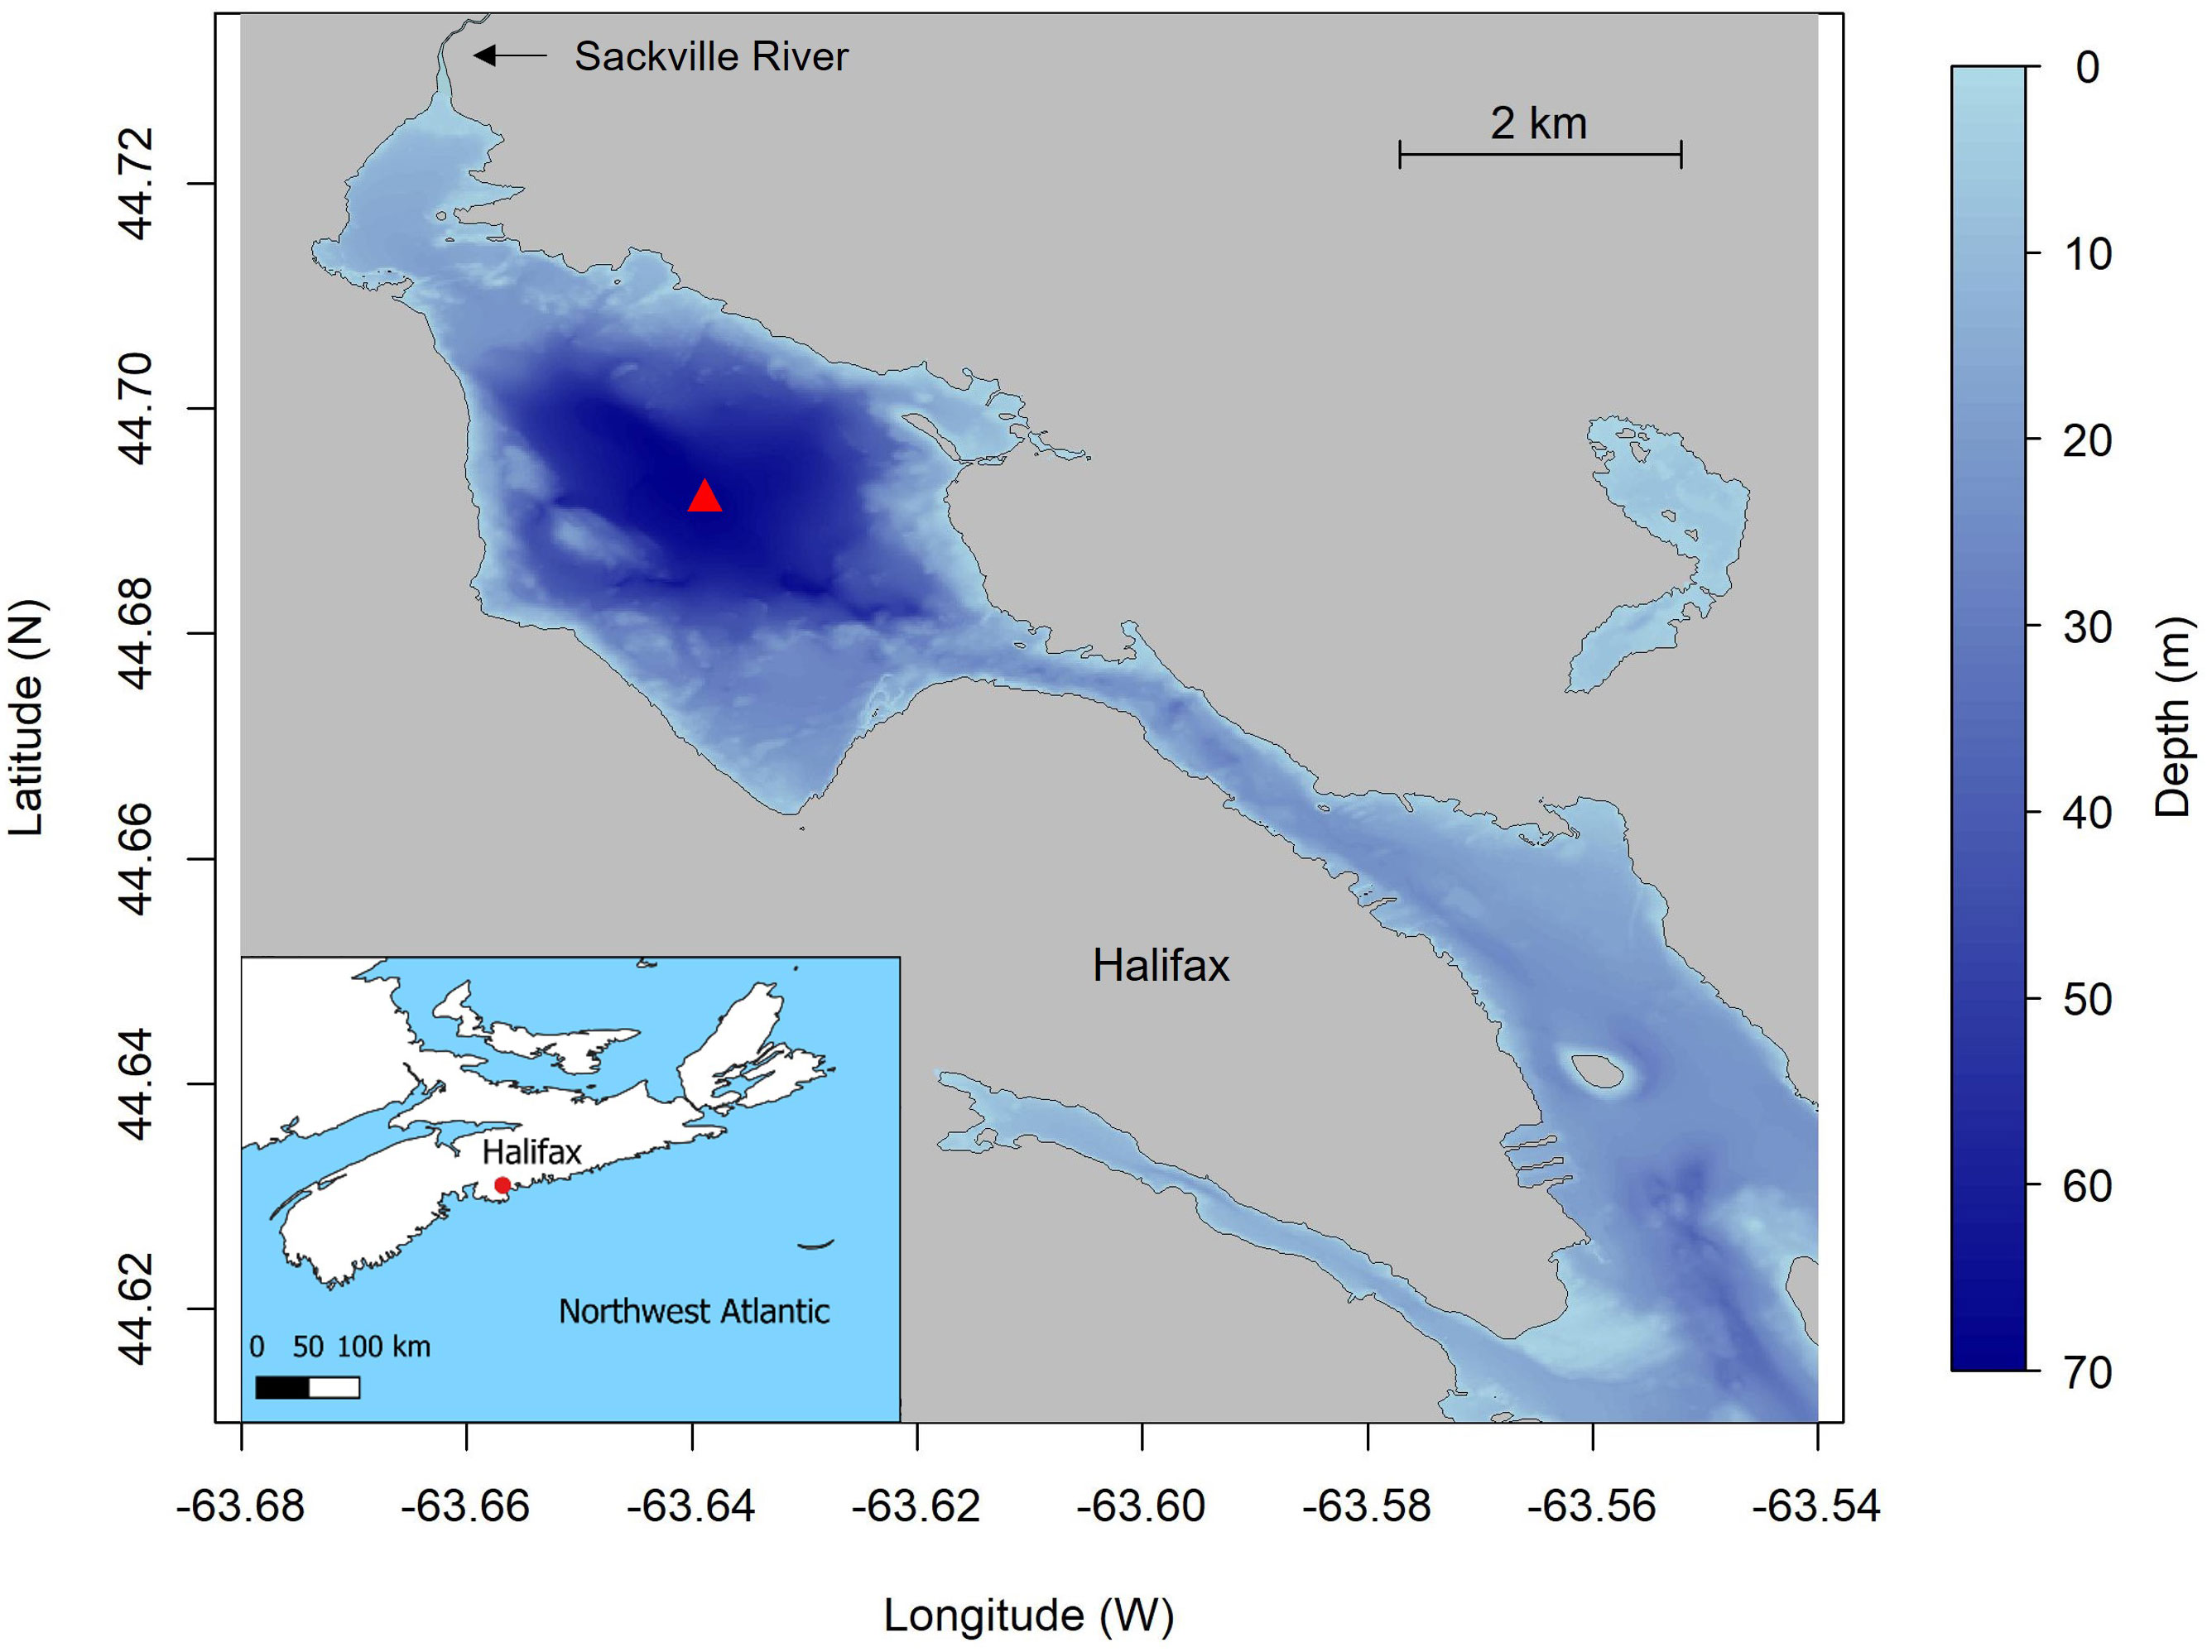
Figure 1 Bathymetric map of Bedford Basin and Halifax Harbour. The Compass Buoy station in Bedford Basin is shown by red triangle.
The regular occurrence of coastal hypoxia makes BB an ideal natural laboratory to study oxygen dynamics. In addition, since 1992 the Bedford Basin Monitoring Program (BBMP), which was initiated by the Bedford Institute of Oceanography (BIO) and expanded in the last decade by Marine Environmental Observation, Prediction and Response Network (MEOPAR) and the Ocean Frontier Institute (OFI), has carried out weekly measurements of hydrographic properties at the deepest point (70 m) in the basin (Compass Buoy Site, Figure 1). This includes weekly CTD casts for hydrographic (T, S) and several chemical properties in both the surface (1, 5, 10m) and bottom (60m) waters. Bedford Basin has been the focus of numerous studies examining geological (Miller et al., 1982; Buckley and Winters, 1992; Fader and Miller, 2008), chemical (Shi and Wallace, 2018), climatological (Li and Harrison, 2008), biogeochemical (Conover, 1975; Hargrave, 1978; Taguchi and Hargrave, 1978; la Roche, 1983; Azetsu-Scott and Johnson, 1994; Punshon and Moore, 2004; Li et al., 2010; Burt et al., 2013; Georges et al., 2014; Haas et al., 2021; Haas et al., 2022; Robicheau et al., 2022) and environmental (Rao et al., 1993; Pan and Subba Rao, 1997; Scott, 2005; AMEC, 2011; Lacasse et al., 2013; Vercaemer and Sephton, 2014) aspects of the basin. Several of these studies have focussed on processes influenced by the transient hypoxic characteristics of the basin. However, to-date there has been no study focussed on the key processes responsible for controlling the oxygen budget of the basin.
To understand the benthic contribution to oxygen dynamics, seasonal changes in benthic oxygen uptake were measured in 2019 using microsensor profiling of collected sediment cores. These were used to develop a coupled benthic-water column reactive-transport model of oxygen dynamics in the basin. We used the model to examine three contrasting years: 2018, 2019 and 2021 that apparently displayed different mechanisms of oxygen supply to subsurface waters. The year 2019 had prolonged winter mixing, while in 2021 winter mixing was the weakest on record. Both 2019 and 2021 were without shelf water intrusions, whereas 2018 experienced two intrusions that replenished the bottom water. We used the model to examine the oxygen budget and mechanisms driving hypoxia including the sensitivity of oxygen levels to potential climate-induced changes, such as increased stratification or decreased winter mixing.
2 Materials and methods
2.1 Study area and sampling
Weekly CTD data of the water column were obtained from Bedford Institute of Oceanography website (BIO, 2022) as part of a long term oceanographic monitoring program at the Compass Buoy site (Lat: 44.6937N, Lon: 63.6403W) (Li, 2014). In addition to temperature and salinity the CTD (Seabird SBE 25) was equipped with an oxygen sensor (SBE 43), and a fluorescence (chlorophyll-a) sensor. The monitoring program was interrupted in 2020 due to the Covid-19 pandemic and only a few weeks of data are available. Therefore, this study excludes the year 2020.
The sediments at the sampling station are described as fine-grained LaHave clay which dominates in BB at water depths >30 m (Fader and Miller, 2008). Shallower depths of the basin have coarser sediment, with some locations containing gravel and boulders (Fader and Miller, 2008). Sediment samples were obtained from the Compass Buoy sampling station during 2019 on 12th February, 7th May, 26th August and 7th November corresponding to distinct seasons, that is, mid winter, post-spring bloom, late summer, and fall, respectively. Sediment cores were collected using a multi-corer device (KC Denmark) that houses 60 cm-long polycarbonate liners with 10 cm internal diameter. Approximately 35 cm of sediment and 25 cm of water were recovered with an intact sediment-water interface (SWI). Cores were transferred to a cool room at Dalhousie University within 2-3 hours. The cores were extruded until ~6 cm of water was left above the SWI. Afterwards, the overlying water was bubbled with an air:N2 gas mixture to maintain the oxygen concentration at in-situ levels and stored overnight in darkness. A single sediment core from each sampling date was used for oxygen microsensor profiling.
Oxygen profiling was conducted with a Clark-type microsensor (Unisense OX-100). The O2 sensor was calibrated using a 2-point calibration of 100% saturation using aerated water, and 0% oxygen saturation using ascorbate-sodium hydroxide solution. Dissolved oxygen solubility was corrected for salinity and temperature using the Unisense software. The sensor was mounted on a Unisense micromanipulator approximately 2-5 mm above the SWI (determined by eye). Duplicate or triplicate profiles were recorded at 100 μm depth resolution until oxygen reached zero concentration. Sediment porosity was later determined from one of the sampling events after sectioning the sediment core at 1 cm intervals.
A benthic instrument pod was moored 5 m off the bottom (recorded data at 60 m water depth) over the period 20th August 2018 to 7th December 2018. The pod was equipped with a CTD sensor (Seabird SBE 37-SI S/N 2975) and an oxygen sensor (RBR coda Optical Dissolve Oxygen sensor S/N 93074). These sensors recorded measurements at ~1 minute intervals.
2.2 Stratification parameter
Density profiles derived from CTD data were used to calculate a water column stratification parameter, (J m-3) that represents the energy required to fully homogenize the water column through vertical mixing (Simpson, 1981):
with
where h is the total depth of water column (m), z is depth (m), g is gravitational acceleration (m s-2), (kg m-3) is density at depth z and (kg m-3) is the depth-averaged water column density.
2.3 Calculation of diffusive oxygen uptake
We largely followed the procedure of Glud (2008) for interpreting microsensor profiles to calculate the diffusive oxygen uptake (DOU). It was determined from each microsensor profile using three different approaches. First, DOU was calculated from the linear oxygen gradient across the diffusive boundary layer (DBL). The DBL thickness was identified from the slight change in slope in linear oxygen profiles at the junction of the DBL and SWI.
where D0 is the diffusion coefficient of O2 adjusted for the temperature and salinity of the overlying water (calculated using R-package “marelac” (Soetaert et al., 2010a)) and dO2/dz is the O2 concentration gradient within the DBL.
Second, since DOU calculated above may be subject to errors due to incorrectly estimating the ex-situ DBL thickness (Bryant et al., 2010), the DOU was also calculated using Fick’s first law of diffusion using the oxygen gradient just below the SWI:
Where is porosity, Ds is the tortuosity-corrected diffusion coefficient for oxygen after Boudreau (1996); Ds=D0/(1-2ln(φ)). The first three points below the SWI were used to calculate the oxygen gradient.
Finally, each profile was modeled using a 1D steady state reaction-transport model, assuming that the transport of oxygen into sediment was controlled by molecular diffusion and that oxygen consumption can be described using Michaelis-Menten kinetics (Soetaert et al., 1996a; Boudreau, 1997),
where kO2.sedi is a maximum rate of oxygen consumption and KsO2 is the half saturation constant. The solution of equation (3) was fit to each measured profile by adjusting kO2.sedi whereas KsO2 was set to a small value (KsO2 = 1 μM) to prevent negative oxygen concentrations. DOU was then determined from the depth integrated rate of oxygen consumption. This approach allows the DOU to be quantified in addition to the O2 consumption rate verses depth in the sediment.
In theory, all three approaches should give the same result. In reality this is not necessarily the case because accurate determination of the sediment water interface and the DBL thickness can be difficult with a microelectrode recording at 100 μm vertical resolution. The use of all three approaches provides a check on the consistency of each DOU calculation method.
2.4 Benthic pelagic coupled oxygen model
A dynamic 1-D (vertical) coupled model of the water column and sediment was used to reproduce the seasonal oxygen dynamics of BB bottom water at the Compass Buoy site. Equations 4 and 5 represent dissolved oxygen mass conservation for the water column and sediment, respectively.
where is the time-variable eddy diffusivity for parameterizing vertical mixing and chla is the depth-integrated chlorophyll-a content (see below). The formulation of equation 4 and 5 are conceptually similar to Burt et al. (2013) and Soetaert et al. (1996b). The model domain consists of a 50 m water column which extends from 20 m to 70 m water depth, and a domain comprising 1 cm of sediment at the bottom of the water column. The latter is justified since the oxygen penetration depth is only 1-2 mm (see Results). The water and sediment domains both consist of 100 equally spaced grid cells. We chose 20 m as the upper boundary to represent the water below the sill. The outflow of the Sackville River, tidal currents, and wind-induced mixing are generally restricted to the upper 20 m, leaving the otherwise stratified BB water below the sill relatively isolated from mixing in the surface layer (Shan et al., 2011; Shan and Sheng, 2012). This allows a 1-D approximation to be applied for the modeled water column below 20 m, where changes in solute concentration due to horizontal advection are usually negligible.
Wintertime eddy diffusion is typically high due to reduced stratification and convective mixing results in oxygenation of the entire water column. This was determined empirically based on the observed oxygen concentration at 60 m. The non-conservative nature of dissolved oxygen makes it a useful indicator of active mixing, while conservative tracers such as temperature or salinity can only indicate that mixing has occurred. Spring mixing was defined as the period between the onset of a sustained increase in bottom water oxygen and the timepoint when bottom water oxygen began to decline.
The eddy diffusivity during winter was adjusted until modelled oxygen concentrations matched the observed rise in bottom water oxygen. During the stratified summer period, Kz was estimated by fitting the weekly BBMP temperature profiles (Figure S1). Shelf water intrusions were parameterized by increasing the to match the observed rise in oxygen concentration in the bottom waters (Figure 2D and Table S1).
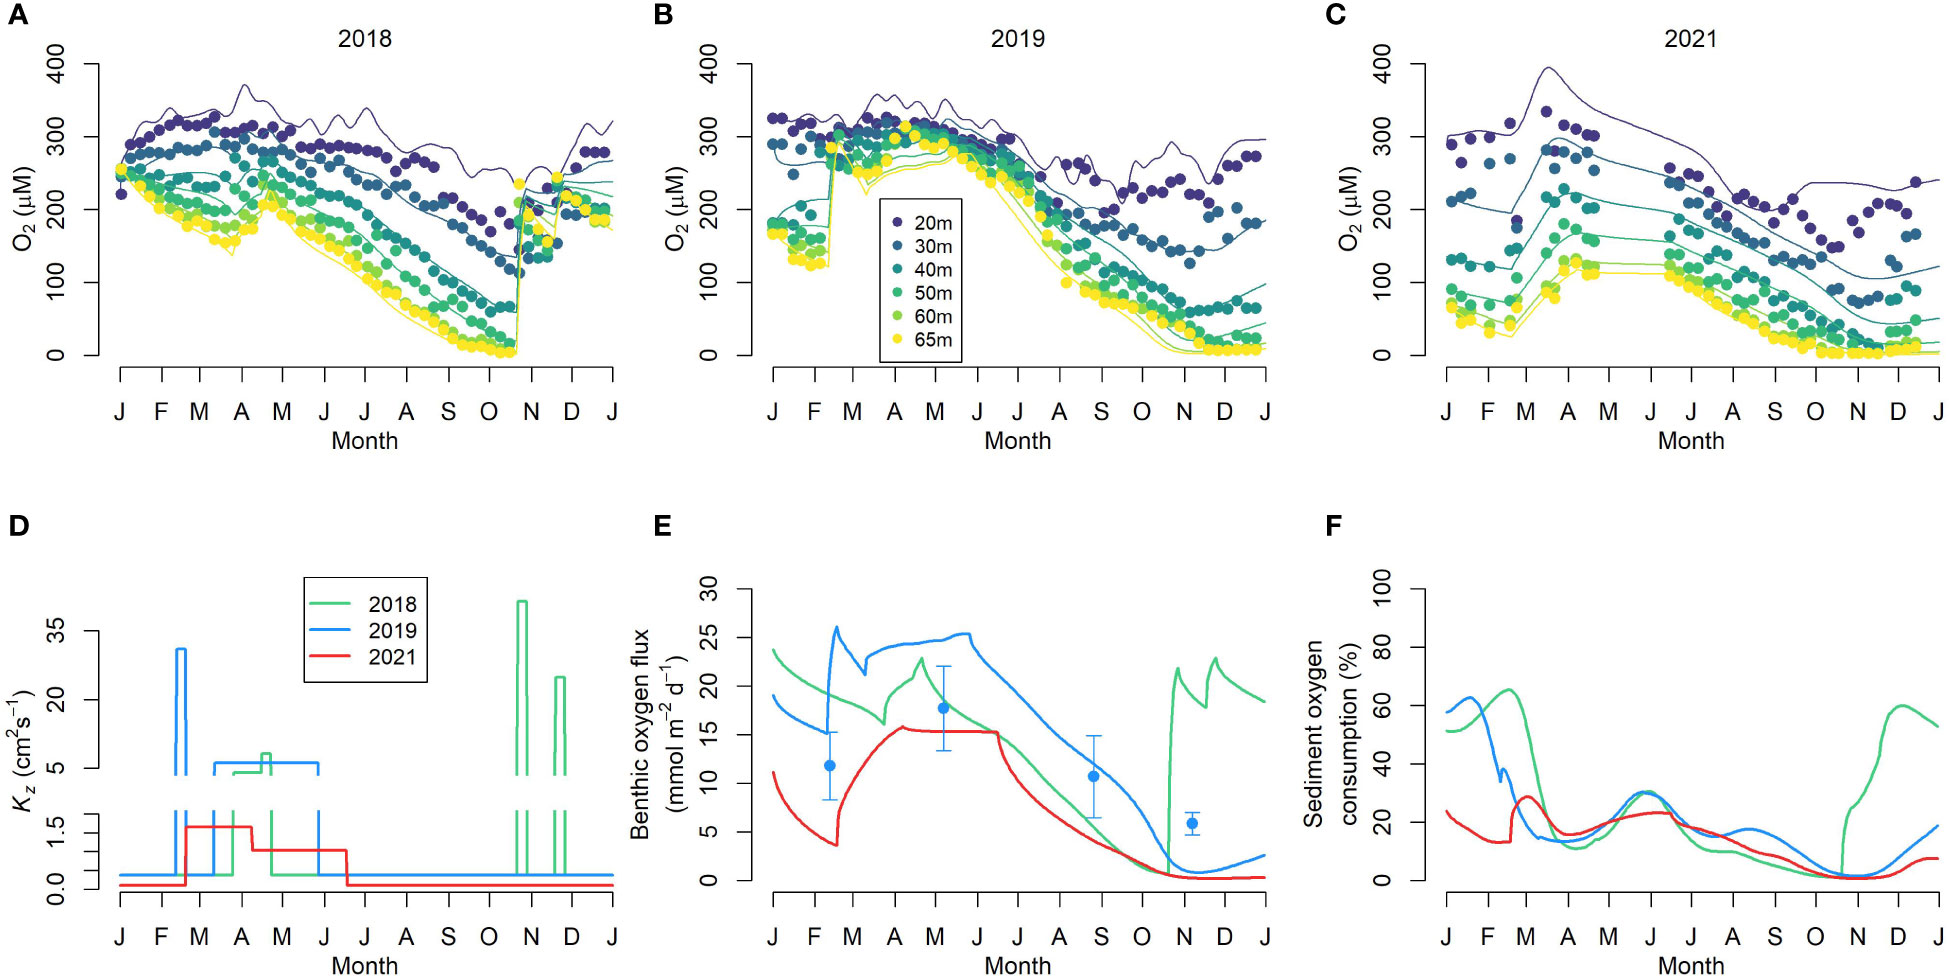
Figure 2 Benthic-pelagic model simulations. (A–C) show the dissolved oxygen concentration at different water depths for 2018, 2019 and 2021 respectively. The filled circles and curves represents the observed and modeled oxygen concentration, respectively. (D) Modeled eddy diffusivity (Kz); note the vertical axis break. (E) Modeled benthic oxygen fluxes. The symbols show the observed mean DOU for 2019. (F) The contribution of sediment to total oxygen consumption as predicted by the model.
The consumption of oxygen in the water column via respiration of organic matter is described by the last term in Eq. 4. The depth-integrated chlorophyll fluorescence from CTD casts (Figure 3F) was used as a proxy for total organic matter load in the water column. The model ignores the additional contribution of fluvial organic matter from the Sackville River due to a lack of data. However, we believe that this contribution would be a second order effect given that the fluvial discharge is small compared to the tidal volume and total volume of the basin. We use a depth-integrated approach rather than using vertically resolved chlorophyll data since depth-integrated chlorophyll better represents the primary production and respiration during particle sinking and, therefore, the organic matter inventory in the water column. It also avoids uncertainties arising from different particle sinking speeds. The aerobic respiration dependency on chlorophyll-a was set as first-order, and a Michaelis-Menten type dependency was chosen for oxygen; here we used KsO2 = 20 μM which gave a good model-data fit. The water column respiration rate constant, , was constrained using the dissolved oxygen concentrations and assumed to be constant. It was obtained by fitting of the model to the observed water column oxygen data for the year 2019. This year was chosen because it was free of intrusions and displayed relatively normal winter mixing. The same value was then used for the simulations for 2018 and 2021. We reiterate that oxygen data was also used to constrain mixing during the winter period. However, this does not compromise the use of oxygen data to concurrently estimate since the rapid increase in oxygen during winter mixing is much larger than the rate of oxygen decline due to respiration. For the stratified period, when the Kz is an order of magnitude lower, temperature was used instead to fit Kz independently.

Figure 3 The boxplots represent the climatology of Bedford Basin (2000-2021) and the colored curves show the values for the indicated years derived from weekly CTD deployment at the Compass Buoy site. (A–C) Dissolved oxygen concentration, temperature, and salinity at 60 m water depth. (D) Sea surface temperature (SST) at 2 m depth. (E) Water column stratification index (see text for details). (F) Depth integrated chlorophyll fluorescence. Note that the climatology excludes 2020 data since the data collection was limited due to covid-19 restrictions.
Transport of oxygen into the sediment was determined solely by molecular diffusion (Eq. 5) and coupled to the oxygen dynamics in the water column (Eq. 4) through the flux across the sediment water interface. The rate of sediment oxygen consumption, kO2.sedi, and the half-saturation constant, KsO2, were assumed to be constant and taken as the mean values of the microsensor measurements performed in 2019.
The oxygen concentration measured weekly at 5 m water depth was assumed to be representative of the oxygen concentration of the surface layer (< 20m) and was imposed as the upper boundary condition for the water column domain. Oxygen continuity between the water column and sediment was achieved by setting the time-variable bottom water oxygen concentration as the upper boundary for the sediment domain. Benthic oxygen uptake represented a loss of oxygen from the lower water column. A zero-flux condition was applied for oxygen at the lower boundary of the sediment domain. Model parameter values are given in Table S1. The model was solved in the R programing environment using the R packages FME (Soetaert and Petzoldt, 2010), ReacTran (Soetaert and Meysman, 2012) and deSolve (Soetaert et al., 2010b).
3 Results
3.1 Water column
The bottom water properties of years 2018, 2019 and 2021 show that the overall trends of these three years were generally consistent with the climatology and other long-term observational studies in the basin (Figure 3) (Li and Harrison, 2008; Haas et al., 2021). Contour plots of temperature, salinity, and oxygen (Figure S2) indicate that surface cooling during winter and spring reduces the stratification allowing a stronger vertical convection and ventilation of bottom waters. The stratification during this period was lowest in all three years, coinciding with lowest sea surface temperature (SST). Stratification was highest during the period July-September when SST was also highest, suggesting stratification was primarily controlled by SST. In 2021, the SST was generally higher than the climatology which led to the noticeably higher stratification throughout the year (Figures 3D, E).
At the start of 2018 bottom waters were oxygenated due to a shelf water intrusion at the end of 2017 (Haas et al., 2021). Winter mixing in 2018 was brief as can be seen in the rapid increase in oxygen concentration that occurred in April together with a decrease in salinity and temperature (Figures 3A–C). In the absence of further winter mixing, bottom water oxygen declined consistently in 2018 to near anoxic conditions until mid-October when an intrusion from the Scotian Shelf re-oxygenated the bottom water. This was followed by a second intrusion in November, marked by the sudden increase in oxygen and salinity primarily affecting the deeper layers of the basin (Figures 3A–C; Figures S2D–J).
The vertical winter mixing regime in 2019 was longer and persisted from mid-February to mid-April. The bottom water temperature was 0.8 °C at this time and the lowest of the three years considered here, whereas the winter oxygen concentration was the highest (314 μM). No intrusion occurred in 2019 and the bottom water oxygen concentration consistently declined to near anoxia.
The winter mixing was particularly weak in 2021. Oxygen increased only slowly from mid-February to May. The maximum bottom water oxygen concentration in winter reached only 132 μM, compared to >200 μM for 2018 and 2019. A steady decline in the bottom water oxygen across all three years was observed once the mixing phase ended and the surface water temperature increased, leading to stratification.
A phytoplankton spring bloom occurred every year following the cessation of water column mixing (Figure 3F; Figures S2M–O). Chlorophyll-a fluorescence maxima were observed between 5 and 10 m (Figures S2M–O). The 2021 spring bloom was the weakest (peak chlorophyll 11.1 mg m-3) whereas 2018 and 2019 showed similar spring bloom intensities (peak chlorophyll concentration 21.5 mg m-3). Primary production persisted throughout the stratified period and a prominent second phytoplankton bloom was observed during the fall months. Particularly, an intense fall bloom in 2019 followed shortly after Hurricane Dorian on 7th September 2019, and this was associated with the highest chlorophyll-a concentration (24.5 mg m-3) measured over the entire study period. The maximum fall bloom intensity in 2018 and 2021 were similar at 15.2 and 15.4 mg m-3, respectively.
Bottom waters experienced hypoxic conditions in all three study years. The onset of hypoxia occurred earliest in 2021 followed by 2018 and 2019. The total duration of hypoxia in the bottom water in 2018, 2019, and 2021 was 11, 12, and 28 weeks, respectively. The lowest oxygen concentrations at 60 m were 5.0, 6.7, and 2.7 μM for 2018, 2019, and 2021, respectively. In 2018 and 2019, hypoxia was restricted to the lower 30 m of the basin whereas in 2021 hypoxia extended over the lower 40 m (Figures S2J–L). The 2018 hypoxic event was, however, interrupted by an intrusion of relatively dense, warmer oxygenated water in mid-October and again in mid-November. The intrusion appeared to displace the low-oxygen water to mid depth, resulting in a mid-depth oxygen minimum (Figure S2J). Finally, assuming <0.2 mg/l O2 (=6.25 μM) as the threshold for anoxia (Testa et al., 2017), the Bedford Basin bottom water experienced anoxia in 2018 and 2021 for periods of 1 and 6 weeks, respectively.
The benthic instrument pod deployed at 60 m depth in 2018 recorded both intrusions at high temporal resolution (Figure 4A). The first intrusion took place on 22 October 2018 and within a few hours bottom water oxygen concentrations increased from ~10 to 200 μM, temperature increased by ~2.2°C and salinity by ~0.4. The second intrusion on 16 November 2018 was more protracted and led to an increase in oxygen concentrations from 140 to 230 μM. Salinity increased marginally, and temperature decreased, presumably because the second intrusion occurred late in the year when air temperature was lower, resulting in an increase in density. The rapid change in bottom water after the intrusions is indicated by the temperature-salinity plots in Figure S3. A steady decline in oxygen concentrations was observed after each intrusion.
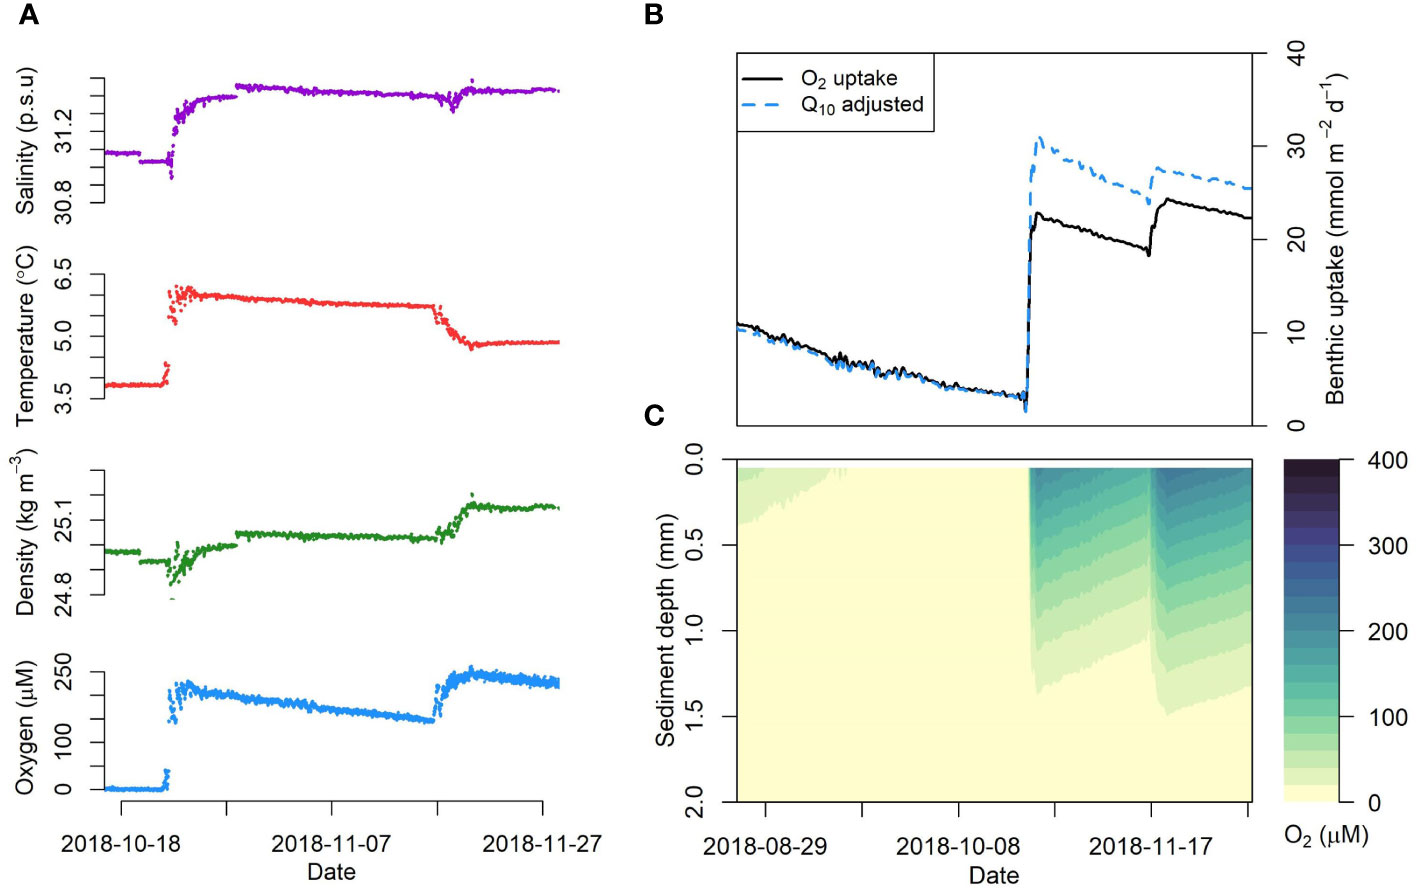
Figure 4 High resolution data recorded by the benthic instrument pod deployed at 60 m water depth in late 2018, showing the intrusions of Scotian Shelf water to Bedford Basin. (A) The panels (top-bottom) show bottom water salinity, temperature, density (-1000 kg/m3) and dissolved oxygen concentration, respectively. (B) Benthic-pelagic model simulation of O2 uptake suggests that the benthic flux increases rapidly following the first intrusion. The dashed curve represents a simulation with a Q10 value of 20, and the solid curve show a simulation without accounting for the temperature increase (Q10 = 1). (C) Change in oxygen penetration depth in the sediment following the intrusions.
The summertime oxygen utilization rate estimated using the local decline rate, i.e. dO2/dt, (Table 1) in 2018 and 2019, determined from the periods of steady oxygen depletion at 60 m water depth, were similar at 1.31 ± 0.03 and 1.39 ± 0.05 mmol m-3 d-1, respectively. The rate was lower in 2021 at 0.99 ± 0.04 mmol m-3 d-1. However, oxygen utilization was significantly higher in 2018 following the first and second intrusions at 2.68 ± 0.04 and 1.91 ± 0.17 mmol m-3 d-1 (Table 1).
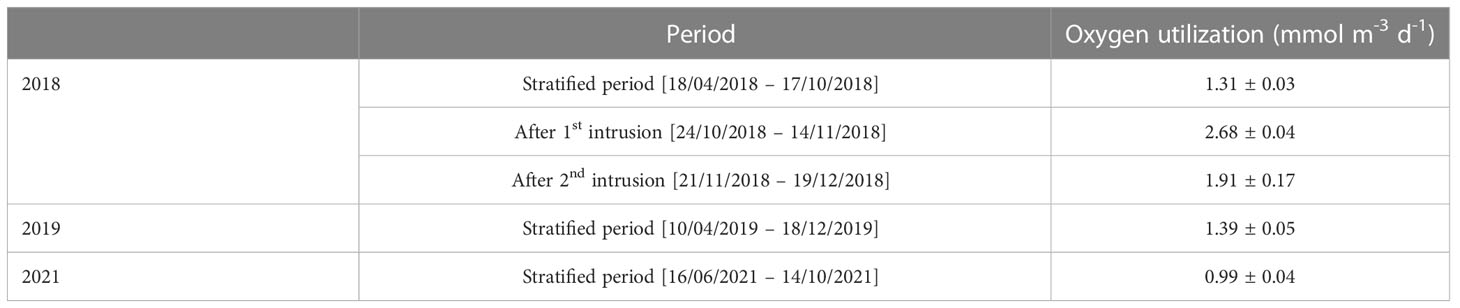
Table 1 Oxygen utilization rate in the water column as determined from the local decline rate in the specified periods at 60 m water.
3.2 Benthic oxygen penetration depth and DOU
The seasonal benthic oxygen flux and oxygen penetration depth (OPD) in the sediment was determined from the oxygen profiles measured in sediment cores using microsensors. OPD was highest in May (1.7 ± 0.1 mm) after the spring bloom when bottom water oxygen was also highest (Figure 5A and Table 2). At other times the OPD was <1 mm with no clear seasonal variation. The different methods of calculating DOU showed consistent patterns (Figure 5B). DOU calculated from the model (RTM) (Eq. 3) gave the highest DOU followed by the application of Fick’s First Law below the SWI (Eq. 2) and in the DBL (Eq. 1). However, in most cases the DOU determined from the SWI and RTM approaches were similar, whereas the DBL approach gave noticeably lower estimates. This could be due to the use of the microsensor recording at 100 μm vertical resolution that might have been too low to determine accurately the DBL thickness. Mean DOU was the highest in May and lowest in fall, coincident with minimum oxygen concentrations in the bottom water. DOU in winter and late summer showed intermediate values. Mean annual DOU based on all three methods ranged from 5.8 to 17.7 mmol m-2 d-1 with an average of 11.5 ± 4.8 mmol m-2 d-1.
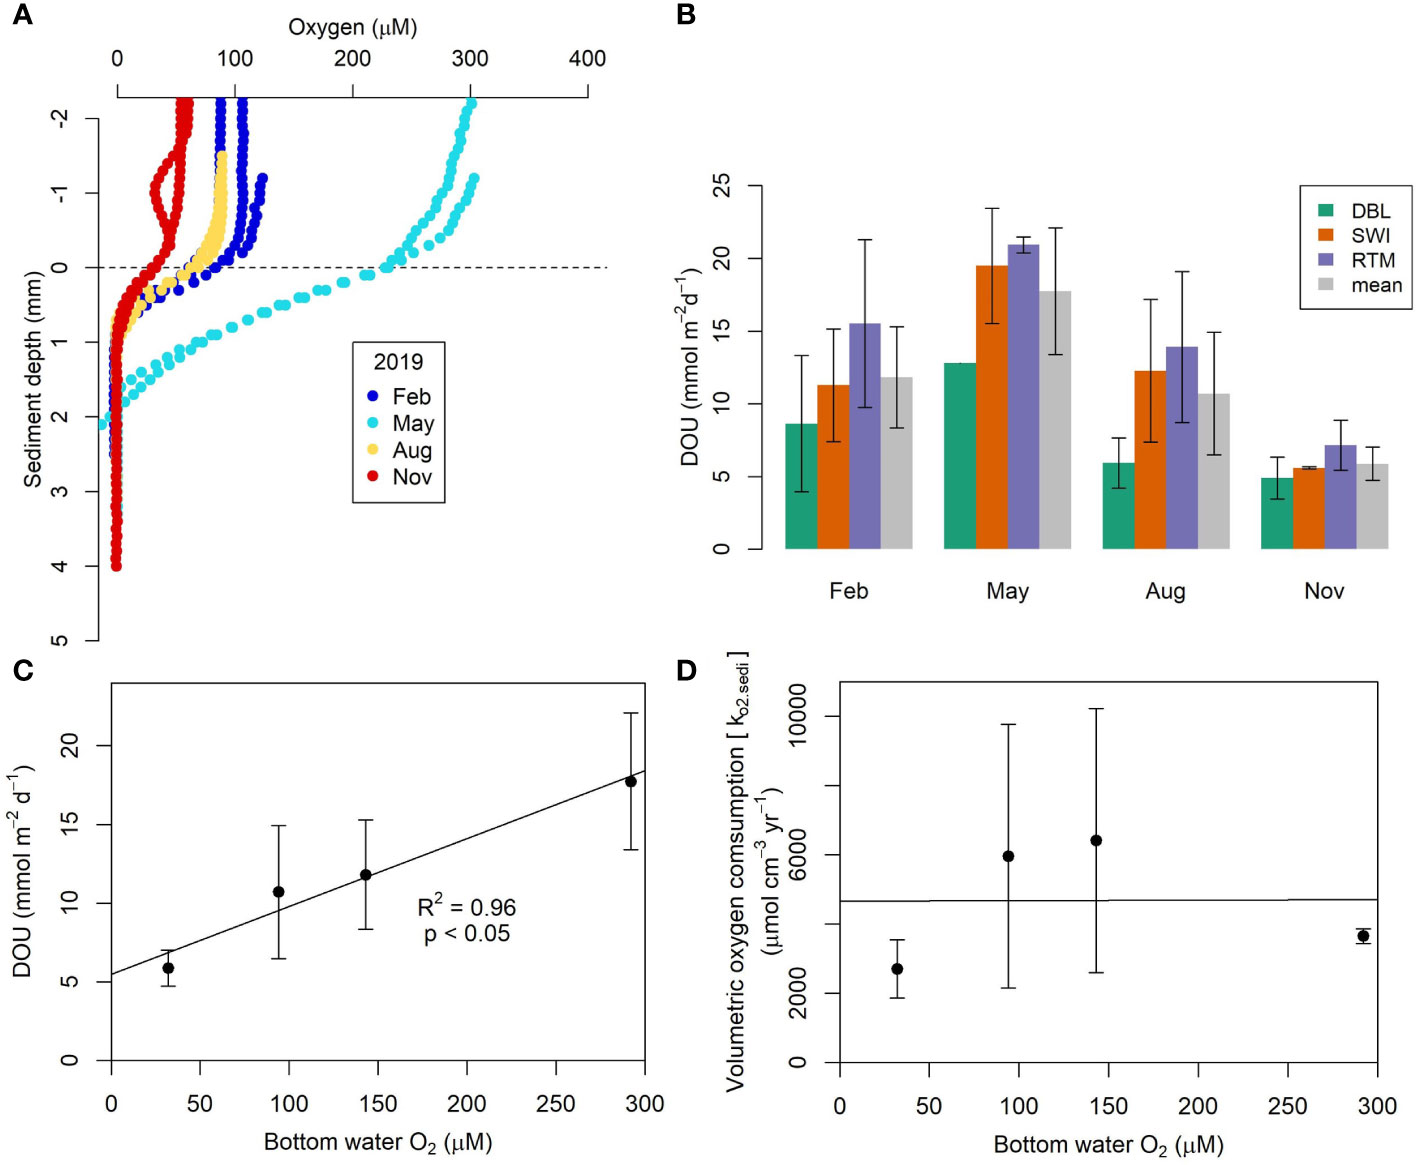
Figure 5 (A) Sediment oxygen microsensor profiles measured in sediment cores from Bedford Basin. The horizontal dashed line denotes the sediment-water interface. (B) Diffusive oxygen uptake determined from the oxygen microsensor profiles derived from three approaches; DBL (oxygen gradient in the diffusive boundary layer (DBL)), SWI (from the linear oxygen gradient just below the sediment water interface), RTM (model fit of oxygen data in (A)). (C) Mean DOU is significantly (p<0.05) correlated with bottom water oxygen concentration. (D) No significant correlation was observed between bottom water oxygen concentration and sediment oxygen consumption rate.
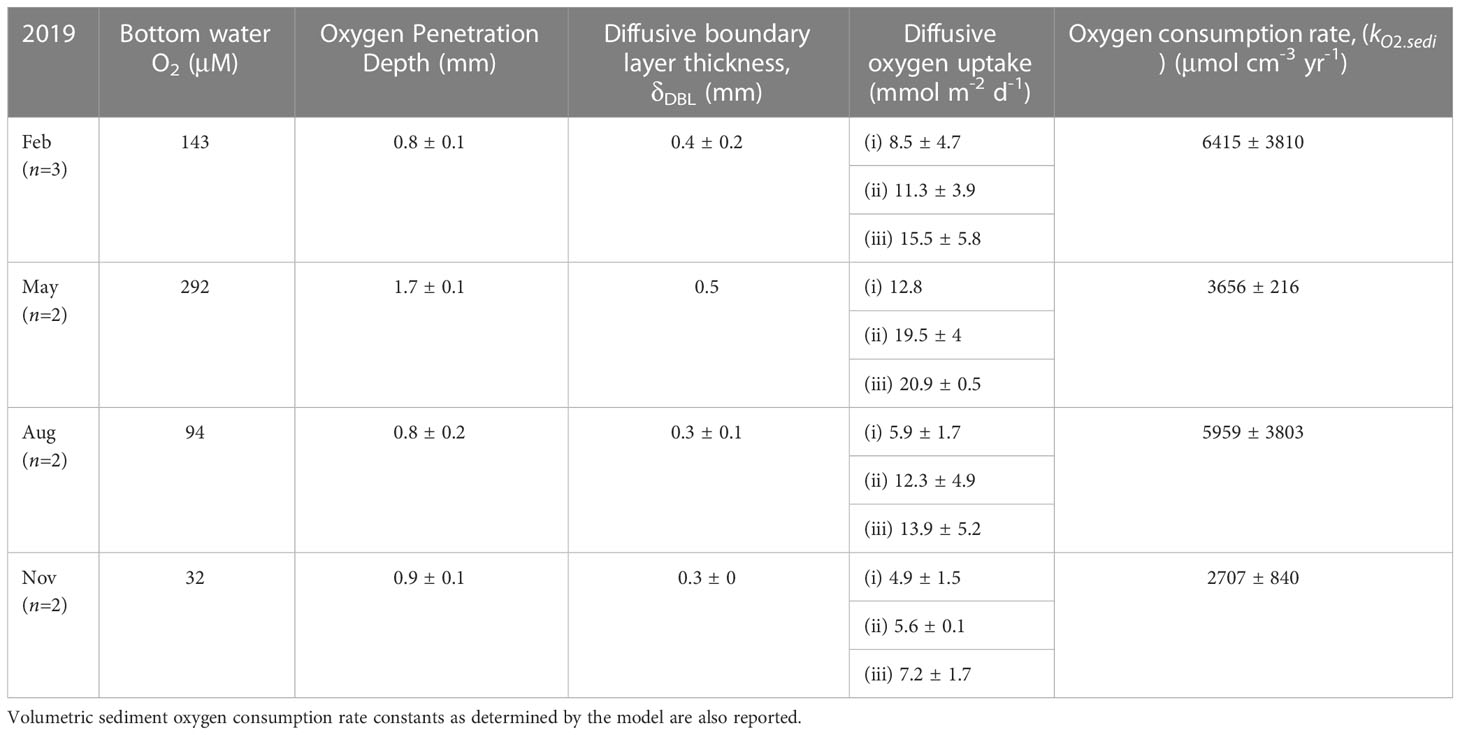
Table 2 Sediment microsensor measurement showing oxygen penetration depth in the sediment, benthic diffusive boundary layer thickness, and diffusive oxygen uptake (DOU) calculated from three different approaches – (i) oxygen concentration gradient at the benthic diffusive boundary layer (DBL), (ii) oxygen concentration gradient just below the sediment water interface (SWI) and (iii) steady-state reactive transport model (RTM), respectively.
A one-way ANOVA test of DOU across the seasons showed significant differences in mean values (p=0.02, F-value= 5.6). However, no significant differences of mean DOU values were found among the three methods used (p=0.2, F-value=1.6), suggesting that DOU exhibited statistically significant intra annual variability.
The seasonal mean DOU correlated significantly with bottom water oxygen concentration (R2 =0.96, p=0.01, Figure 5C). The seasonal maximum sediment oxygen consumption rate (kO2.sedi), determined from microsensor profiles was 4700 ± 1800 μmol (O2) cm-3 yr-1 and did not show any significant pattern with bottom water oxygen concentrations (Figure 5D and Table S1). Therefore, we assumed that the sediment respiration rate constant was seasonally invariable in the coupled benthic-pelagic model.
3.3 Coupled benthic-pelagic model
Our coupled benthic-pelagic model was able to simulate the seasonal oxygen concentrations below the sill depth in the BB (20-70 m) for 2018, 2019 and 2021 (Figure 2). The wintertime Kz values estimated in this study (Table S1 and Figure 2D) fell within the eddy diffusivity values (1-100 cm2 s-1) reported from an extensive study of UK coastal waters (Riddle and Lewis, 2000). However, the stratified period Kz value (Figure 2D and Table S1) was lower than previously estimated for BB by Burt et al. (2013), yet similar to the eddy diffusion coefficient estimated for Saanich Inlet (Hamme et al., 2015), a similarly stratified coastal basin. Along with bottom water oxygen, this result indicates winter mixing in 2018 started slowly, immediately followed by a strong mixing. In 2019, winter mixing was stronger and longer, and occurred in two phases (Figure 2D). In 2021, the winter mixing was the weakest of the three years yet persisted for several months. During the summer stratified period with low Kz (Figure 2D and Table S1), net oxygen consumption occurred and oxygen in the bottom water declined steadily in all three years.
Modelled water column respiration ranged from 0.002 to 3.37 mmol O2 m-3 d-1. Mean water column respiration equalled 1.21 ± 0.84, 1.43 ± 0.87 and 0.84 ± 0.42 mmol m-3 d-1, respectively, for 2018, 2019 and 2021. Depth-integrated water column respiration ranged from 3.73 – 164.19 mmol m-2 d-1, with annual mean values for 2018, 2019 and 2021 of 60.92 ± 40.45, 71.61 ± 42.41 and 42.42 ± 19.36 mmol m-2 d-1, respectively. Simulated benthic oxygen uptake for 2019 compared favorably with the DOU determined from microsensor profiles (Figure 2E). Mean benthic oxygen uptake was 14.9 ± 6.7, 14.8 ± 8.7 and 7.3 ± 5.7 mmol m-2 d-1 for 2018, 2019 and 2021, respectively. Mean sediment uptake over all three years was 12.35 ± 7.94 mmol m-2 d-1. The seasonal variation of the sediment contribution to the total oxygen consumption is shown in Figure 2F. Overall, sediment oxygen uptake contributed approximately one fifth of total oxygen respiration below sill depth (>20 m), with mean benthic contributions of 28%, 20%, 14%, respectively, for 2018, 2019 and 2021.
4 Discussion
4.1 Pelagic and benthic oxygen respiration
Our model-derived mean BB water column respiration rate of 1.16 ± 0.78 mmol O2 m-3 d-1 is higher than previous estimates of 0.3 mmol O2 m-3 d-1 (Burt et al., 2013) and lies at the lower end of the global range of water-column respiration (0.02-75 mmol O2 m-3 d-1) (Robinson et al., 2005). It is, however, similar to the rate of 1.2 mmol m-3 d-1 estimated for the Scotian Shelf (Thomas et al., 2012) and to the rate of 1.3 mmol O2 m-3 d-1 determined in 2002 by Punshon and Moore (2004). The mean rate coincides with the oxygen utilization estimated from the rate of oxygen decline at 60 m during the stratified period (Table 1). The enhanced oxygen utilization following intrusions (Table 1) could be due to warmer water temperature elevating respiration rates (Haas et al., 2021).
In the organic-rich Bedford Basin sediment (Fader and Miller, 2008), DOU is proportional to bottom water oxygen concentration, implying that the benthic O2 flux is diffusion limited. Similar observations have been made in other studies (Rasmussen and Jorgensen, 1992; Rabouille et al., 2021). The annual mean DOU in 2019, based on four seasonal measurements in this study, was 11.5 ± 4.8 mmol m-2 d-1, and model derived mean benthic uptake was 12.6 ± 7.9 mmol m-2 d-1. The mean total benthic oxygen uptake (TOU) determined previously in BB using whole core incubations was 17.6 ± 10 mmol m-2 d-1 (Hargrave, 1978), suggesting that non-diffusive transport processes such as bioirrigation and macrofaunal respiration could contribute ~30% to TOU in BB sediment. This is lower than that reported by Glud (2008) who argued that non-diffusive processes at water depths <100 m could be ~60% of TOU. A lower contribution of faunal-mediated respiration in BB is likely due to the seasonally hypoxic nature of the bottom water where macrofaunal abundances might be lower (Fader and Miller, 2008). Burt et al. (2013) calculated benthic oxygen flux in BB based on radium distributions to be between 29 to 59 mmol O2 m-2 d-1; a factor of 2 to 4 higher than our estimate. However, these measurements were made in 2010 within six weeks following an intrusion event.
To examine the influence of a sudden intrusion of warm oxygenated water on the sediment oxygen flux, we forced the sediment model with the high-resolution oxygen data from the benthic instrument pod as a sediment-water boundary condition. The results show that oxygen flux increased by a factor of seven from 3 to 22 mmol m-2 d-1 over a few hours synchronously with oxygen concentration (Figure 4B). The higher temperature of intruding water could also further increase the sediment oxygen respiration rate and benthic oxygen uptake. We utilized the Q10 formulation to evaluate the impact of increased water temperature following the intrusion. The Q10 formulation is used to describe the temperature dependence on rates of biological processes, where the value of Q10 denotes the ratio of reaction rates for a temperature difference of 10°C (Tjoelker et al., 2001). It is described as
where R1 and R2 are the reaction rates at temperature T1 and T2 (Sasaki et al., 2012). Re-running the model with a Q10 factor 20, previously suggested for BB (Haas et al., 2021), increased the benthic oxygen flux (Figure 4B) to 31 mmol m-2 d-1. These values are in good agreement with the post-intrusion benthic oxygen flux of 43.7 ± 15.1 mmol m-2 d-1 determined by Burt et al. (2013). The intrusion also increased the modelled OPD in the sediment substantially (Figure 4C). Hence, intrusions may impact sediment biogeochemistry by, for instance, enhanced oxidation of reduced substances that accumulate during hypoxic periods, and through removal of bioavailable nitrogen through more efficient coupled nitrification-denitrification that functions only weakly under hypoxic conditions (Fennel et al., 2009; Middelburg and Levin, 2009).
The benthic oxygen dynamics in BB are consistent with other similar and related oceanic settings. In Chesapeake Bay, seasonal sediment oxygen consumption was found to be between 1.5 and 26.8 mmol m-2 d-1 with the water temperature and bottom water oxygen concentrations being the main controlling factors (Cowan and Boynton, 1996). In the nearby lower St. Lawrence Estuary, the TOU was lower at 6.4 mmol m-2 d-1 at >200 m depth (Katsev et al., 2007). However, in fine Scotian Shelf sediment, TOU ranges from 8 to 12.5 mmol m-2 d-1 (Grant et al., 1991), which is close to our estimates of DOU from BB. Nevertheless, a detailed measurement of TOU would be required to verify the proportion of DOU and TOU and determine any changes in oxygen flux which might have occurred due to, for example, changes in organic matter and nutrient loading with continuing urbanization of the surrounding area. For the remainder of the discussion, we assume that DOU is representative of the total benthic oxygen uptake.
4.2 Oxygen budget for Bedford Basin
In the following, our model was used to derive an oxygen budget for BB below the depth of the sill (Figure 6) for each of the three years. In 2018 and 2019, the model estimated that a total of 25.6 and 25.1 mol O2 m-2 y-1 was delivered to subsurface waters, respectively, decreasing to 14.3 mol O2 m-2 y-1 in 2021 (Figure 6A). In 2018 and 2019, winter mixing accounted for 28.5% and 70% of the oxygen supply, respectively. Intrusions in 2018 contributed 35.5% to deep water oxygen, equivalent to 9.1 mol O2 m-2 y-1, which is comparable to the supply during winter mixing. Owing to weak winter mixing in 2021, the absence of intrusions and anomalously high SST (Figure 3D), the oxygen supply to deep waters was the lowest of the three study years, with the winter mixing period accounting for 81% of total oxygen input (Figure 6B) and the remaining 19% supplied during the stratified period. These results show that deep waters receive the majority of the oxygen during winter mixing, and hence the ventilation largely depends on the strength and duration of winter mixing and stratification. Intrusions, when they occur, can supply equivalent amounts of oxygen in discrete episodic events.
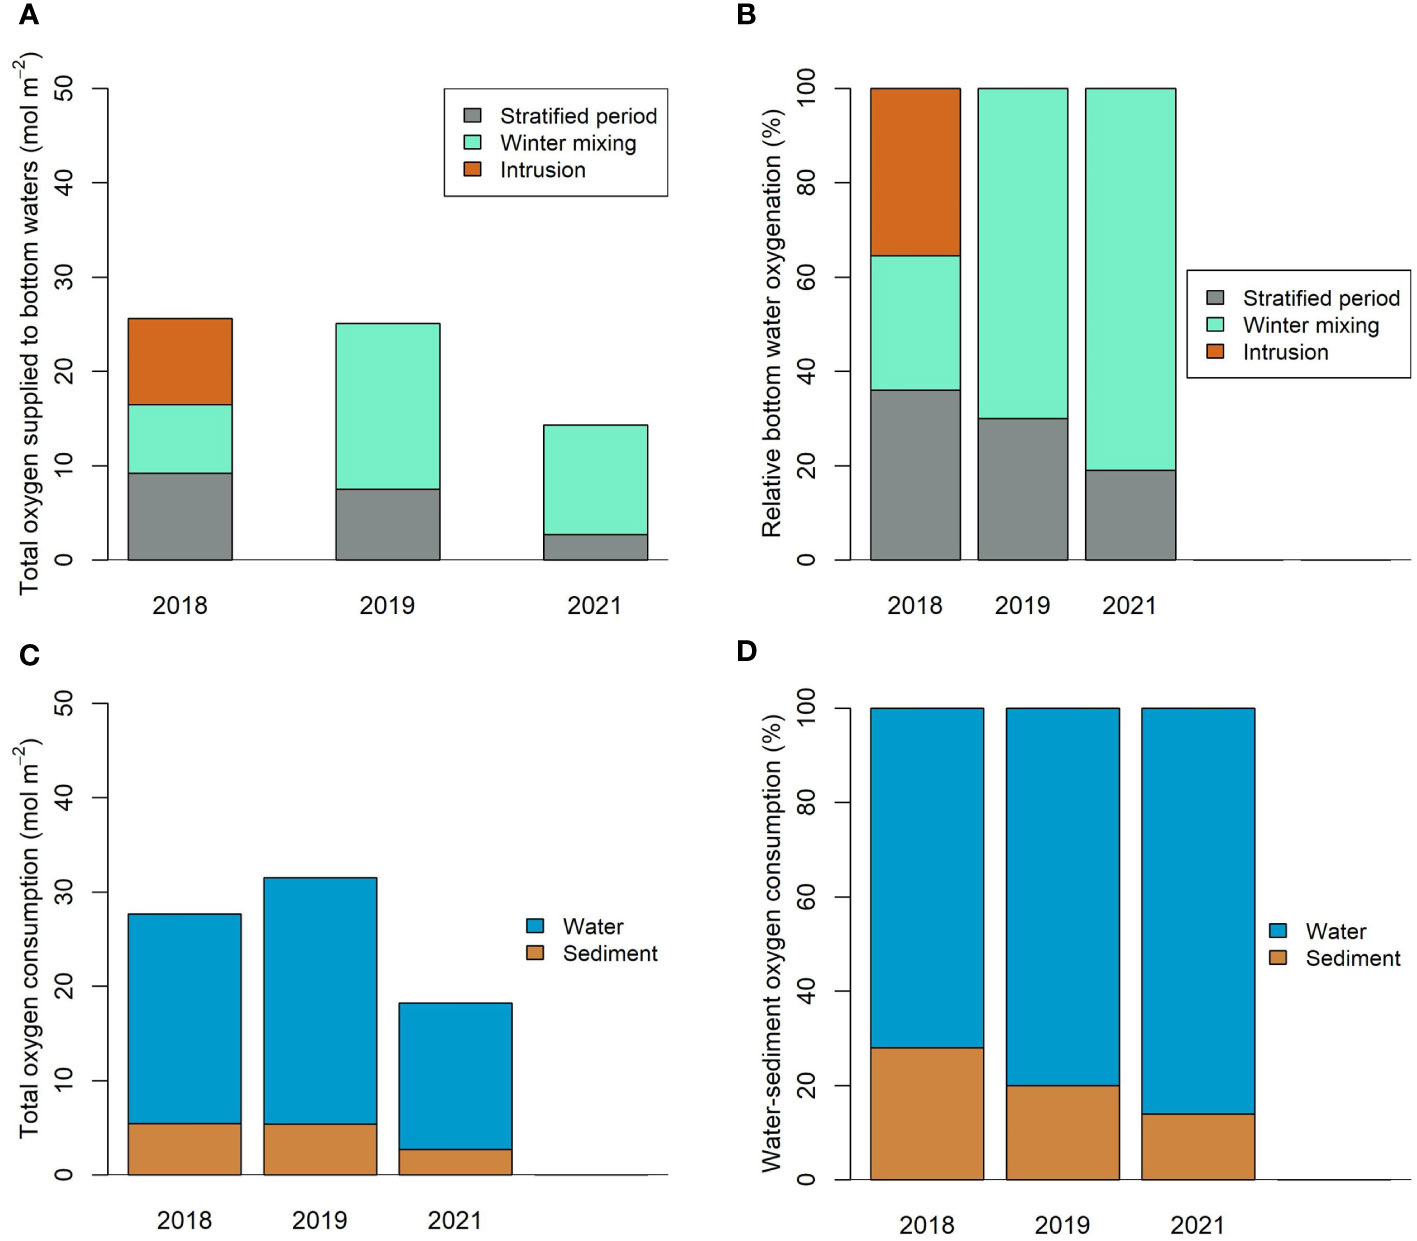
Figure 6 Model derived oxygen budget for Bedford Basin. (A) Annual oxygen supply to Bedford Basin bottom waters (>20 m) and (B) the relative contributions. (C) Annual oxygen consumption in the water column and sediment and (D) the relative contributions.
To further investigate the impact of intrusions, we performed a model experiment where we ran the model for 2018 without intrusions. The oxygen budget was then compared with the model output simulating the real 2018 condition with intrusions (Figure S4). The lack of intrusions resulted in 27% less oxygen supply to the bottom water and a 14% decline in the annual mean water column oxygen concentration (193 μM with intrusions vs 166 μM without intrusions). Integrated over the post intrusion time frame in 2018 (Julian day 295 to 365), total oxygen supply decreased substantially to 63% without the intrusion and mean bottom water oxygen concentration decreased to 80 μM versus 219 μM with intrusions. The absence of intrusions also prolongs hypoxia at 60 m depth for the remainder of the year (mean concentration of 11 ± 5 μM and duration of 21 weeks). The model also predicted that the reduced oxygen supply to the bottom waters could have resulted in 1.3 mol m-2 yr-1 less benthic oxygen uptake (discussed in next paragraph). However, we found little difference (~3%) in the total water column respiration with and without intrusions. This emphasizes that intrusions are important for ventilation of bottom waters, relieving hypoxic conditions, and for the coupling of sediment and water column processes.
Benthic oxygen consumption was similar for 2018 and 2019 at 5.44 mol O2 m-2 y-1, respectively, whereas in 2021 it was 50% lower (2.7 mol m-2 y-1) (Figure 6C). Since the DOU is proportional to bottom water oxygen concentration, it is likely that the weaker benthic respiration rates in 2021 were due to poor ventilation of bottom water during winter months. Our model suggests that total water column respiration was 22.2, 26.1 and 15.5 mol O2 m-2 y-1 for 2018, 2019 and 2021, respectively. On average, water-column respiration accounted for ~80% of the total below sill depth oxygen consumption at the Compass Buoy site, whereas benthic uptake contributed ~20% (Figures 2F, 6D). Consistent with our estimates, an oxygen budget for Chesapeake Bay suggested that water column respiration was the main driver of the oxygen demand with benthic respiration accounting for 26% (Li et al., 2015). However, in the St. Lawrence estuary, benthic oxygen demand was estimated to contribute 16-66% of total bottom water oxygen consumption (Lehmann et al., 2009; Bourgault et al., 2012).
Given that the oxygen respiration rate in sediment is 3-4 orders of magnitude higher than in the water column, the water depth plays a key role in the overall benthic contribution to total oxygen respiration (Fennel and Testa, 2019). The model was used to derive a relationship between the benthic contribution and water depth, which was found to be best approximated by a logarithmic relation (R2 = 0.98): y = -21.46 ln(x) + 103.58, where y is the percent benthic oxygen consumption of total oxygen consumption, and x is the height of water column in meters (Figure 7A), similar to the findings by Kemp et al. (1992). A basin-wide estimate of sediment contribution to total oxygen respiration of ~35% was then obtained by applying the bathymetric data (Figure 7B). However, it should be remembered that sediment carbon content and grain size play a crucial role in determining the benthic oxygen uptake. The sediment is fine silt at our study site (Fader and Miller, 2008), whereas at shallower depths the sediment is coarser (Fader and Miller, 2008). This may significantly alter oxygen uptake (Huettel et al., 2014), as shown in Scotian Shelf sediments (Grant et al., 1991). Therefore, a more focused study on benthic oxygen uptake rates in different sediment types across the basin is required to accurately determine the overall role of sediment in the BB oxygen budget.

Figure 7 (A) Simulated proportion of sediment consumption versus water column depth (solid line). The dashed line shows a logarithmic function that describes the model data (R2 = 0.98). This function was applied to Bedford Basin bathymetry to obtain the spatial contribution of benthic oxygen consumption (B).
While a full three-dimensional model (Shan et al., 2011; Shan and Sheng, 2012) that fully captured the annual evolution of the surface layer due to changes in temperature, salinity, wind and tidal forcing, would be a more accurate representation of circulation and oxygen dynamics in the Basin, coupling it to a diagenetic sediment model would be computationally challenging. The 1-D model used here however is simple enough to be fully coupled to a sediment diagenetic model while still representing the major features of the bottom waters (below 20 m) in the basin.
4.3 Sensitivity of hypoxia to variable mixing
Bottom water ventilation occurred in BB during each of our study years, but with variable intensity and duration. An oxygen increase in the bottom water was observed consistently during winters. Comparison of SST, stratification parameter and bottom water oxygen suggests that water column mixing begins when the SST is low resulting in diminished thermal stratification which facilitates convection, causing concomitant decreases in bottom water salinity and temperature along with an increase in oxygen (Figures 3; S2). Besides winter mixing, the basin was also oxygenated through intrusions of Scotian Shelf water which occur often late in the year when the bottom water is hypoxic. Thus, intrusions effectively end hypoxia as observed in high latitude fjords and marginal seas (Cottier et al., 2005; Hamme et al., 2015; Holtermann et al., 2020). Noticeably, hurricane strength winds during summer-fall have little effects on water column mixing and bottom water oxygenation of BB unlike in some other coastal systems such as Chesapeake Bay (Testa et al., 2017). Temperature-salinity plots following Hurricane Dorian which passed over BB on 7th September 2019 (Scrosati, 2020), showed that deeper layers below the pycnocline were unaffected by the storm (Figure S5). Similar observations were made following the category 2 Hurricane Juan in 2003 (Fogarty, 2004) which also had no noticeable impact on the deeper basin (Figure S5).
The mean bottom water oxygen in 2021 was the lowest recorded in the BB timeseries, along with the highest SST and stratification (Figures 8A–C). We also found that throughout the timeseries, mean bottom water oxygen correlated weakly but significantly with mean stratification (Figure 8A) and that intra-annual stratification correlated strongly with SST (Figure 8B), but not with surface salinity. This indicates that surface water temperature plays key role in controlling seasonal stratification and could suggest warming induced deoxygenation in the future. Furthermore, the annual SST has increased in BB at a rate of 0.11 ± 0.02°C/year, with the strongest increase in the summer-fall months (Figures 8C, D). This is an order of magnitude higher than the global SST trend which ranges from 0.007-0.012 °C/year (Hausfather et al., 2017). However, despite this, we found no significant inter-annual correlation between annual SST and stratification from 2000 to 2021. This suggesting the situation is more complicated and other factors in addition to warming may play a role. These could include freshwater inflow and precipitation, storm intensity during winter months, timing, and intensity of shelf water intrusion in the preceding year which would stabilize bottom water by delivering denser water, and regional scale changes in the ocean-current circulation in the northwest Atlantic (Peterson et al., 2017; Jutras et al., 2020). Disentangling the effects of these different drivers on stratification and future oxygen levels would require further study.
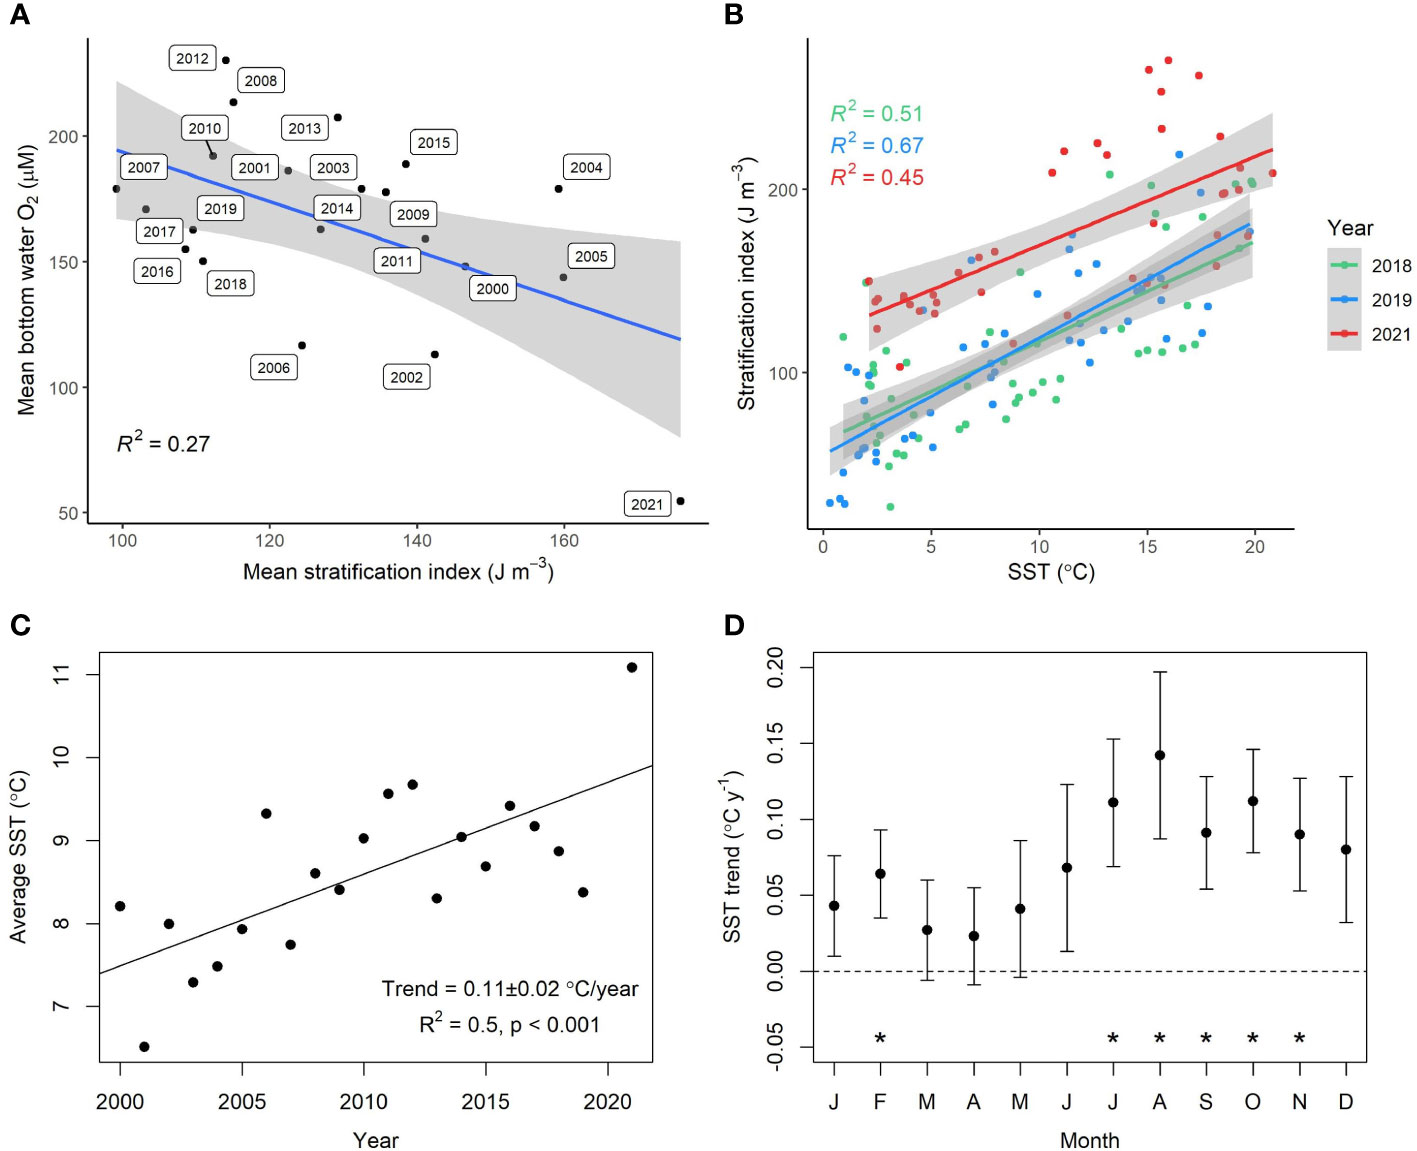
Figure 8 (A) Weak but significant (p<0.05) correlation between bottom water oxygen and water column stratification across the time-series data at Compass Buoy station. (B) Intra-annual stratification versus SST at 2 m depth (p<0.05). (C) Mean annual sea surface temperature (2 m depth) versus time shows a significant positive trend of increasing SST at a rate of 0.11± 0.02°C/year. (D) Monthly trend in increasing SST over the same time period (2000-2021). Asterisks denote the months where the SST increase is significant (p<0.05). Most warming takes place during summer-fall.
Nevertheless, to further explore the sensitivity of future scenarios in terms of winter mixing variability and frequency of intrusions, we performed model experiments to explore how variations of oxygenation during mixing impact the oxygen budget in a system such as BB. Six scenarios were tested, each one over two consecutive years (Figure 9). We chose two consecutive years rather than one year because some of the considered scenarios (discussed later) might lead to a memory effect when transitioning from one scenario to another. Therefore, a minimum of two years simulation is required to fully characterize the oxygen dynamics. We assumed that winter mixing occurs every year between mid February to mid March, when the average SST is at its lowest and the bottom water oxygen increases (Figures 3A, D). The upper boundary of the water column domain was set as long-term climatology of 5 m BB water. The water column conditions on 1 January 2019 were used as initial conditions.
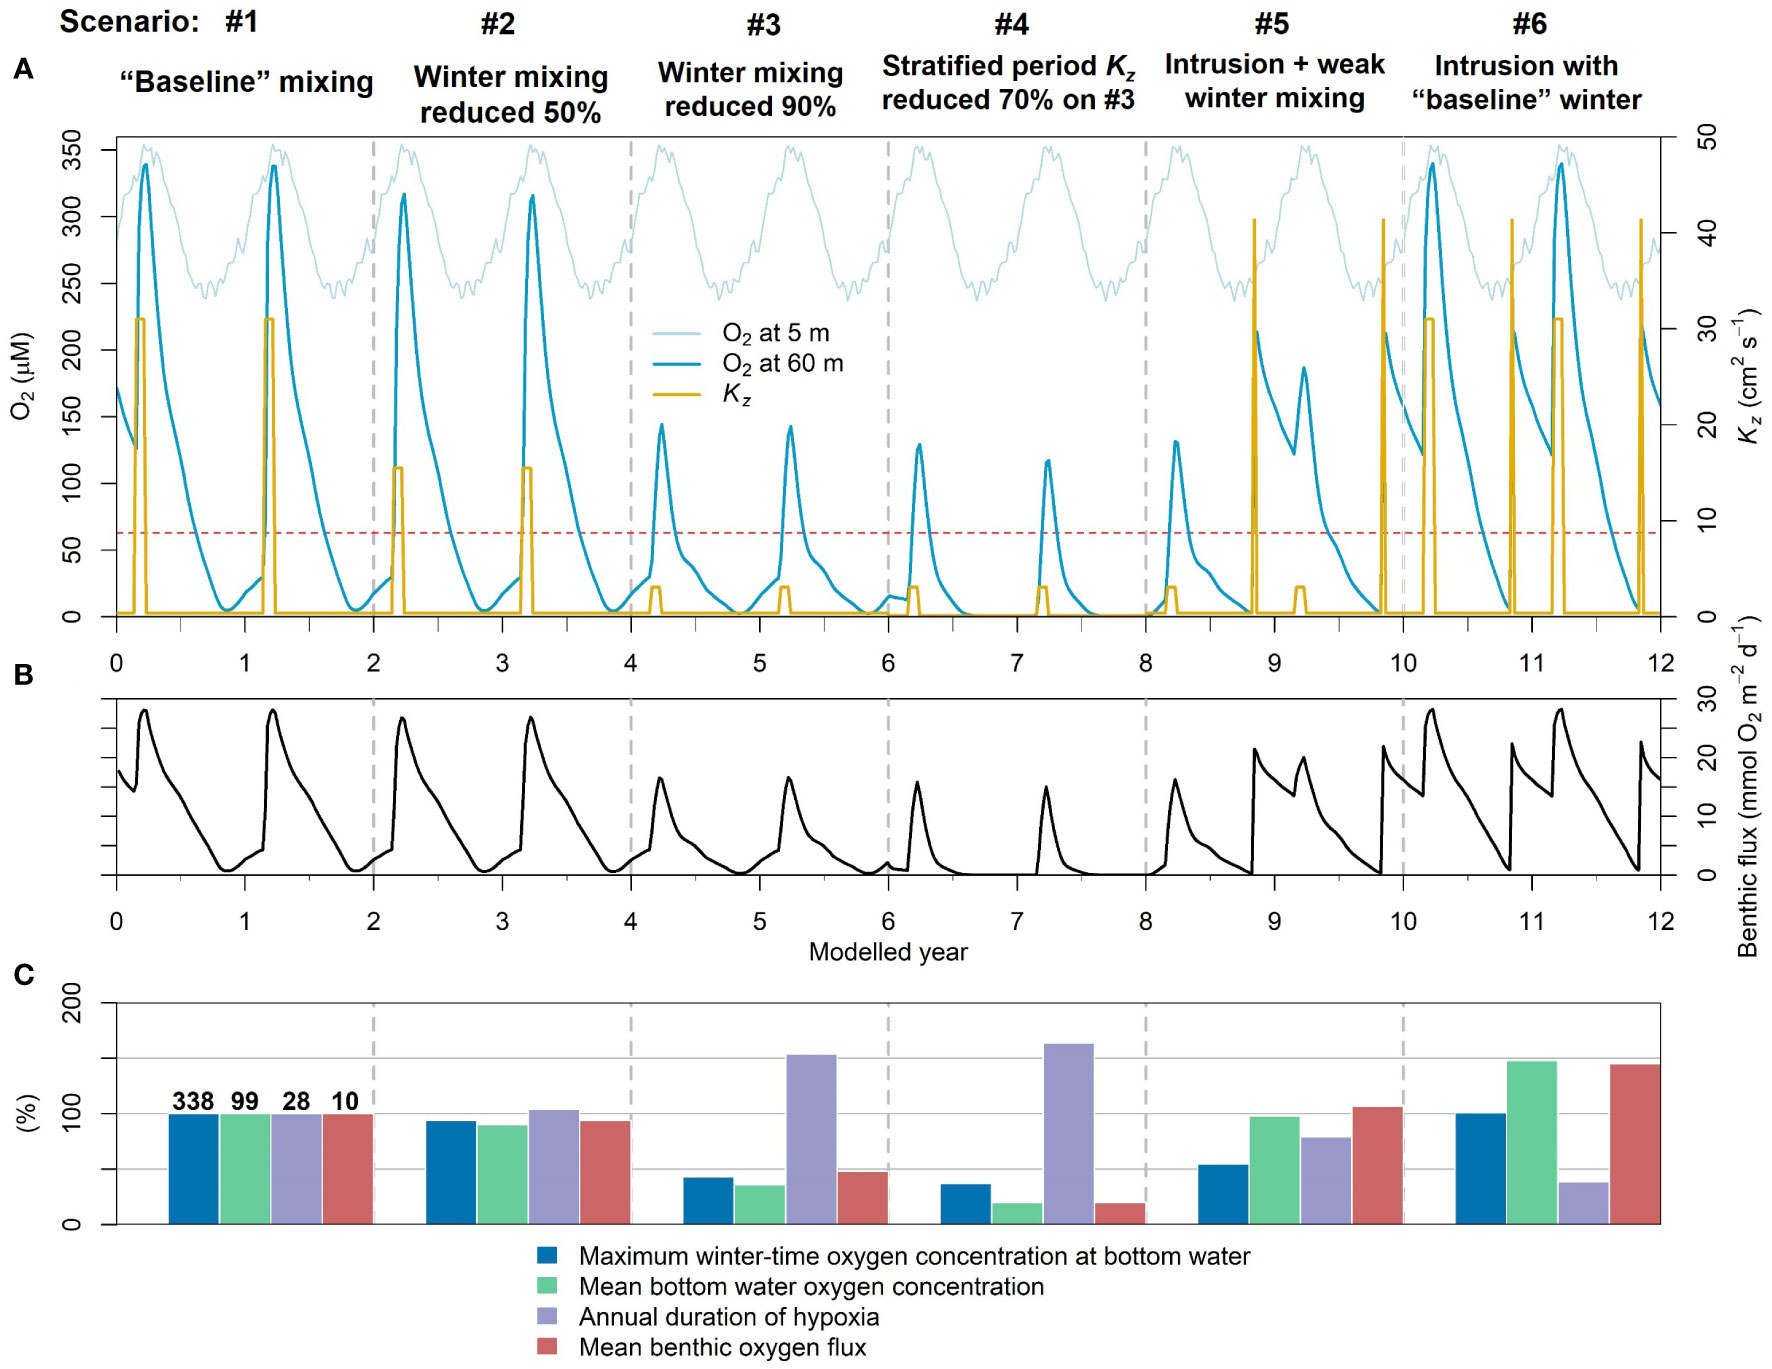
Figure 9 Model experiments simulating various mixing scenarios. Different mixing regimes are indicated at the top of (A) and separated by gray vertical dashed lines. (A) Oxygen concentration at simulated upper boundary (5 m) and in the bottom water (60 m). The red dashed line at 63 μM indicates the threshold for hypoxia. The yellow curve shows eddy diffusivity. (B) Benthic oxygen flux. (C) Comparison of the various mixing scenarios relative to “baseline” mixing (scenario #1). The numbers given on the top of the bars for baseline mixing represent maximum winter-time oxygen concentration (μM), mean annual oxygen concentration in the bottom water (60 m, μM), annual duration of hypoxia in the bottom water (weeks) and the mean annual benthic oxygen flux (mmol m-2 d-1). The other scenarios are given as percentage relative this baseline case.
In the first scenario, the baseline case, the winter mixing coefficient Kz was set to 31 cm2 s-1 and the stratified Kz was set to 0.37 cm2 s-1 based on the 2019 model result. The simulated baseline water column oxygen concentration and benthic flux are shown in Figures 9A, B. The oxygen budget of the other scenarios are compared with the baseline run (Figure 9C and Table S2). In the second scenario, the intensity of winter mixing was reduced by 50% by decreasing the wintertime Kz. Thirdly, we reduced the winter mixing by 90% to reflect even weaker mixing. In fourth case, 90% weaker winter mixing was tested in addition to a decrease in the stratified Kz by 70% (chosen to mimic the modeled 2021 case), reflecting higher-than-usual water column stratification in summer and fall. In the fifth case, based on the previous scenario #3, an intrusion was simulated in October of similar magnitude to the first intrusion of 2018. In sixth and final case, the baseline winter mixing was restored along with intrusions. The different mixing regimes throughout these case studies are summarized in Figure 9A.
In the baseline case, the basin was well-oxygenated and the maximum bottom water (60 m) oxygen concentration during winter mixing period was very close to the oxygen concentration at the surface boundary. The basin became hypoxic on week 24, and the total hypoxic period in the bottom water was 28 weeks/year (calculated from year 2). The mean oxygen at bottom water was 99 μM and the mean benthic oxygen flux was 10 mmol m-2 d-1. In scenario #2, even though the winter mixing was 50% weaker, the highest winter-time oxygen at bottom water decreased only marginally and the oxygen dynamics were similar to the baseline run. This suggests that stronger mixing than the baseline case will have no noticeable impact in terms of bottom water oxygenation. A 50% reduction in winter mixing intensity also did not show any significant change in the oxygen budget. Yet, a drastic change in the oxygen levels and budget was observed with 90% lower mixing in scenario #3 (Figure 9C). Here, the highest winter-time oxygen at bottom water was 145 μM (similar to 2021 level), which represents a 57% decrease from the baseline scenario. Consequently, bottom water hypoxia was more severe and prolonged, and the benthic oxygen flux decreased by almost 50%. In the fourth scenario, stronger water column stratification led to more intense hypoxia, and even anoxia, with a corresponding diminishment of the annual benthic oxygen flux. In the fifth case, the intrusion replenished the basin with oxygen ending the hypoxia. Following the intrusion at the end of year 8, the water column was more oxygenated in year 9. Finally, intrusions with baseline winter mixing significantly reduced hypoxia and substantially increased benthic oxygen flux. Thus, the model sensitivity analysis confirms our previous assertions that winter mixing and intrusions play an important role for oxygen turnover in the stratified BB. It remains an open question how their dynamic interplay will be impacted by ongoing changes in SST and oxygenation in the northwest Atlantic.
5 Conclusions
Three similar yet uniquely featured years were studied in combination with observations and numerical reactive transport modeling to understand the oxygen dynamics in Bedford Basin in the context of a long running water monitoring programme. Here, we report that the seasonally hypoxic Bedford Basin became seasonally anoxic as the bottom water was observed to have <0.2 mg/l O2 for 1 and 6 weeks, respectively, in 2018 and 2021.
We conclude that majority of the bottom water oxygenation occurs during winter convective mixing period as a result of cooling of surface waters, and occasionally in summer-fall via rapid intrusions of oxygenated dense Scotian Shelf water. However, mixing during the stratified period also provides a non-negligible oxygen supply to the deeper layers. Oxygen supply during winter mixing and during the stratified period was found to be SST sensitive. We suggest that the potential exists to exacerbate hypoxia as a result of increasing SST, which has been observed in BB at rates that are an order of magnitude higher than for the global ocean. The majority of the oxygen is consumed through water column respiration at the study site, whereas sediment oxygen uptake accounts for one fifth of the total oxygen consumption.
The 1D numerical model was applied to the basin water column below the sill depth and was able to predict the oxygen dynamics over the three-year time-series, suggesting these types of models could be readily implemented in other coastal inlets and freshwater lakes to aid in monitoring and predicting the occurrence of hypoxia. The study shows the importance of maintaining high temporal resolution monitoring for being able to identify controlling factors of oxygen supply and consumption. The study suggests strong links between climate-sensitive physical forcing and biogeochemical cycling thresholds. The success of the oxygen model in simulating the time-series data motivates the use of such models in predicting complete nutrient cycles for similar systems.
Data availability statement
The original contributions presented in the study are included in the article/Supplementary Material. Further inquiries can be directed to the corresponding authors.
Author contributions
SR and CA conceptualized the study. SR, CA collected samples. SR performed the research with supervision from AD and CA. SR, AD, DW and CA contributed to the detailed discussion of the results. SR wrote the manuscript with input from all authors. All authors contributed to the article and approved the submitted version.
Acknowledgments
This research was supported through an NSERC Discovery Grant, and the Ocean Frontier Institute. The Transatlantic Ocean System Science and Technology (TOSST) Graduate School and the Nova Scotia Graduate Scholarship Program provided PhD stipend support to SR. We thank the Bedford Institute of Oceanography and MEOPAR for maintaining the timeseries station at Bedford Basin and making the data accessible. We thank Richard Davis and the Ocean Frontier Institute Research Implementation Unit for providing the benthic pod data and Maria Armstrong for her help with the benthic oxygen measurements.
Conflict of interest
The authors declare that the research was conducted in the absence of any commercial or financial relationships that could be construed as a potential conflict of interest.
Publisher’s note
All claims expressed in this article are solely those of the authors and do not necessarily represent those of their affiliated organizations, or those of the publisher, the editors and the reviewers. Any product that may be evaluated in this article, or claim that may be made by its manufacturer, is not guaranteed or endorsed by the publisher.
Supplementary material
The Supplementary Material for this article can be found online at: https://www.frontiersin.org/articles/10.3389/fmars.2023.1148091/full#supplementary-material
References
AMEC (2011) Halifax Harbour water quality monitoring program final summary report. Available at: http://legacycontent.halifax.ca/harboursol/documents/HHWQMPFinalSummaryReport.pdf (Accessed 6, 2021).
Azetsu-Scott K., Johnson B. D. (1994). Time series of the vertical distribution of particles during and after a spring phytoplankton bloom in a coastal basin. Cont Shelf Res. 14, 687–705. doi: 10.1016/0278-4343(94)90113-9
BIO (2022) Bedford Basin monitoring program. Available at: https://www.bio.gc.ca/science/monitoring-monitorage/bbmp-pobb/bbmp-pobb-en.php (Accessed 1, 2022).
Boudreau B. P. (1996). The diffusive tortuosity of fine-grained unlithified sediments. Geochim Cosmochim Acta 60, 3139–3142. doi: 10.1016/0016-7037(96)00158-5
Boudreau B. P. (1997). Diagenetic models and their implementation (Berlin, Heidelberg: Springer Berlin Heidelberg). doi: 10.1007/978-3-642-60421-8
Bourgault D., Cyr F., Galbraith P. S., Pelletier E. (2012). Relative importance of pelagic and sediment respiration in causing hypoxia in a deep estuary. J. Geophys Res. Oceans 117, n/a–n/a. doi: 10.1029/2012JC007902
Breitburg D., Levin L. A., Oschlies A., Grégoire M., Chavez F. P., Conley D. J., et al. (2018). Declining oxygen in the global ocean and coastal waters. Science 359, eaam7240. doi: 10.1126/science.aam7240
Bryant L. D., McGinnis D. F., Lorrai C., Brand A., Little J. C., Wüest A. (2010). Evaluating oxygen fluxes using microprofiles from both sides of the sediment-water interface. Limnol Oceanogr Methods 8, 610–627. doi: 10.4319/lom.2010.8.0610
Buckley D. E., Winters G. v. (1992). Geochemical characteristics of contaminated surficial sediments in Halifax harbour: impact of waste discharge. Can. J. Earth Sci. 29, 2617–2639. doi: 10.1139/e92-208
Burt W. J., Thomas H., Fennel K., Horne E. (2013). Sediment-water column fluxes of carbon, oxygen and nutrients in Bedford basin, Nova Scotia, inferred from 224 Ra measurements. Biogeosciences 10, 53–66. doi: 10.5194/bg-10-53-2013
Conley D. J., Humborg C., Rahm L., Savchuk O. P., Wulff F. (2002). Hypoxia in the Baltic Sea and basin-scale changes in phosphorus biogeochemistry. Environ. Sci. Technol. 36, 5315–5320. doi: 10.1021/es025763w
Conover S. A. M. (1975). Nitrogen utilization during spring blooms of marine phytoplankton in Bedford basin, Nova Scotia, Canada. Mar. Biol. 32, 247–261. doi: 10.1007/BF00399204
Cottier F., Tverberg V., Inall M., Svendsen H., Nilsen F., Griffiths C. (2005). Water mass modification in an Arctic fjord through cross-shelf exchange: The seasonal hydrography of kongsfjorden, Svalbard. J. Geophys Res. Oceans 110, 1–18. doi: 10.1029/2004JC002757
Cowan J. L. W., Boynton W. R. (1996). Sediment-water oxygen and nutrient exchanges along the longitudinal axis of Chesapeake bay: Seasonal patterns, controlling factors and ecological significance. Estuaries 19, 562. doi: 10.2307/1352518
Diaz R. J., Rosenberg R. (2008). Spreading dead zones and consequences for marine ecosystems. Science 321, 926–929. doi: 10.1126/science.1156401
Fader G. B. J., Miller R. O. (2008). Surficial geology, Halifax harbour. Nova Scotia. doi: 10.4095/224797
Fennel K., Brady D., DiToro D., Fulweiler R. W., Gardner W. S., Giblin A., et al. (2009). Modeling denitrification in aquatic sediments. Biogeochemistry 93, 159–178. doi: 10.1007/s10533-008-9270-z
Fennel K., Testa J. M. (2019). Biogeochemical controls on coastal hypoxia. Ann. Rev. Mar. Sci. 11, 105–130. doi: 10.1146/annurev-marine-010318-095138
Fogarty C. (2004)Hurricane Juan storm summary. Canadian hurricane centre. Available at: http://www.novaweather.net/Hurricane_Juan.html (Accessed 15, 2022).
Frölicher T. L., Joos F., Plattner G.-K., Steinacher M., Doney S. C. (2009). Natural variability and anthropogenic trends in oceanic oxygen in a coupled carbon cycle–climate model ensemble. Global Biogeochem Cycles 23, n/a–n/a. doi: 10.1029/2008GB003316
Georges A. A., El-Swais H., Craig S. E., Li W. K. W., Walsh D. A. (2014). Metaproteomic analysis of a winter to spring succession in coastal northwest Atlantic ocean microbial plankton. ISME J. 8, 1301–1313. doi: 10.1038/ismej.2013.234
Gilbert D., Rabalais N. N., Díaz R. J., Zhang J. (2010). Evidence for greater oxygen decline rates in the coastal ocean than in the open ocean. Biogeosciences 7, 2283–2296. doi: 10.5194/bg-7-2283-2010
Glud R. N. (2008). Oxygen dynamics of marine sediments. Mar. Biol. Res. 4, 243–289. doi: 10.1080/17451000801888726
Grant J., Emerson C. W., Hargrave B. T., Shortle J. L. (1991). Benthic oxygen consumption on continental shelves off eastern Canada. Cont Shelf Res. 11, 1083–1097. doi: 10.1016/0278-4343(91)90092-K
Haas S., Rakshit S., Kalvelage T., Buchwald C., Algar C. K., Wallace D. W. R. (2022). Characterization of nitrogen isotope fractionation during nitrification based on a coastal time series. Limnology and Oceanography 67(8), 1714–1731. doi: 10.1002/lno.12161
Haas S., Robicheau B. M., Rakshit S., Tolman J., Algar C. K., LaRoche J., et al. (2021). Physical mixing in coastal waters controls and decouples nitrification via biomass dilution. Proc. Natl. Acad. Sci. 118, e2004877118. doi: 10.1073/pnas.2004877118
Hamme R. C., Berry J. E., Klymak J. M., Denman K. L. (2015). In situ O2 and N2 measurements detect deep-water renewal dynamics in seasonally-anoxic saanich inlet. Cont Shelf Res. 106, 107–117. doi: 10.1016/j.csr.2015.06.012
Hargrave B. T. (1978). Seasonal changes in oxygen uptake by settled particulate matter and sediments in a marine bay. J. Fisheries Res. Board Canada 35, 1621–1628. doi: 10.1139/f78-252
Hausfather Z., Cowtan K., Clarke D. C., Jacobs P., Richardson M., Rohde R. (2017). Assessing recent warming using instrumentally homogeneous sea surface temperature records. Sci. Adv. 3. doi: 10.1126/sciadv.1601207
Holtermann P., Prien R., Naumann M., Umlauf L. (2020). Interleaving of oxygenized intrusions into the Baltic Sea redoxcline. Limnol Oceanogr 65, 482–503. doi: 10.1002/lno.11317
Huettel M., Berg P., Kostka J. E. (2014). Benthic exchange and biogeochemical cycling in permeable sediments. Ann. Rev. Mar. Sci. 6, 23–51. doi: 10.1146/annurev-marine-051413-012706
Jäntti H., Hietanen S. (2012). The effects of hypoxia on sediment nitrogen cycling in the Baltic Sea. Ambio 41, 161–169. doi: 10.1007/s13280-011-0233-6
Jutras M., Dufour C. O., Mucci A., Cyr F., Gilbert D. (2020). Temporal changes in the causes of the observed oxygen decline in the st. Lawrence estuary. J. Geophys Res. Oceans 125, e2020JC016577. doi: 10.1029/2020JC016577
Katsev S., Chaillou G., Sundby B., Mucci A. (2007). Effects of progressive oxygen depletion on sediment diagenesis and fluxes: A model for the lower st. Lawrence river estuary. Limnol Oceanogr 52, 2555–2568. doi: 10.4319/lo.2007.52.6.2555
Kemp W., Sampou P., Garber J., Turtle J., Boynton W. (1992). Seasonal depletion of oxygen from bottom waters of Chesapeake bay: roles of benthic and planktonic respiration and physical exchange processes. Mar. Ecol. Prog. Ser. 85, 137–152. doi: 10.3354/meps085137
Lacasse O., Rochon A., Roy S. (2013). High cyst concentrations of the potentially toxic dinoflagellate alexandrium tamarense species complex in Bedford basin, Halifax, Nova Scotia, Canada. Mar. pollut. Bull. 66, 230–233. doi: 10.1016/j.marpolbul.2012.10.016
la Roche J. (1983). Ammonium regeneration: its contribution to phytoplankton nitrogen requirements in a eutrophic environment. Mar. Biol. 75, 231–240. doi: 10.1007/BF00406007
Lehmann M. F., Barnett B., Gélinas Y., Gilbert D., Maranger R. J., Mucci A., et al. (2009). Aerobic respiration and hypoxia in the lower st. Lawrence estuary: Stable isotope ratios of dissolved oxygen constrain oxygen sink partitioning. Limnol Oceanogr 54, 2157–2169. doi: 10.4319/lo.2009.54.6.2157
Li W. K. W. (2014). The state of phytoplankton and bacterioplankton at the compass buoy station: Bedford basin monitoring program 1992-2013. Can. Tech. Rep. Hydrography Ocean Sci. 304, xiv + 122.
Li W. K. W., Harrison W. G. (2008). Propagation of an atmospheric climate signal to phytoplankton in a small marine basin. Limnol Oceanogr 53, 1734–1745. doi: 10.4319/lo.2008.53.5.1734
Li W. K. W., Lewis M. R., Harrison W. G. (2010). Multiscalarity of the nutrient-chlorophyll relationship in coastal phytoplankton. Estuaries Coasts 33, 440–447. doi: 10.1007/s12237-008-9119-7
Li Y., Li M., Kemp W. M. (2015). A budget analysis of bottom-water dissolved oxygen in Chesapeake bay. Estuaries Coasts 38, 2132–2148. doi: 10.1007/s12237-014-9928-9
Middelburg J. J., Levin L. A. (2009). Coastal hypoxia and sediment biogeochemistry. Biogeosciences 6, 1273–1293. doi: 10.5194/bg-6-1273-2009
Miller A. A. L., Mudie P. J., Scott D. B. (1982). Holocene History of Bedford basin, Nova Scotia: foraminifera, dinoflagellate, and pollen records. Can. J. Earth Sci. 19, 2342–2367. doi: 10.1139/e82-205
Noffke A., Sommer S., Dale A. W., Hall P. O. J., Pfannkuche O. (2016). Benthic nutrient fluxes in the Eastern gotland basin (Baltic Sea) with particular focus on microbial mat ecosystems. J. Mar. Syst. 158, 1–12. doi: 10.1016/j.jmarsys.2016.01.007
Pan Y., Subba Rao D. V. (1997). Impacts of domestic sewage effluent on phytoplankton from Bedford basin, eastern Canada. Mar. pollut. Bull. 34, 1001–1005. doi: 10.1016/S0025-326X(97)00115-X
Peterson I., Greenan B., Gilbert D., Hebert D. (2017). Variability and wind forcing of ocean temperature and thermal fronts in the slope water region of the Northwest Atlantic. J. Geophys Res. Oceans 122, 7325–7343. doi: 10.1002/2017JC012788
Petrie B., Yeats P. (1990). Simple models of the circulation, dissolved metals, suspended solids and nutrients in Halifax harbour. Water Qual. Res. J. 25, 325–350. doi: 10.2166/wqrj.1990.017
Punshon S., Moore R. M. (2004). Nitrous oxide production and consumption in a eutrophic coastal embayment. Mar. Chem. 91, 37–51. doi: 10.1016/j.marchem.2004.04.003
Rabouille C., Lansard B., Owings S. M., Rabalais N. N., Bombled B., Metzger E., et al. (2021). Early diagenesis in the hypoxic and acidified zone of the northern gulf of Mexico: Is organic matter recycling in sediments disconnected from the water column? Front. Mar. Sci. 8. doi: 10.3389/fmars.2021.604330
Rao D., Pan Y., Zitko V., Bugden G., Mackeigan K. (1993). Diarrhetic shellfish poisoning (DSP) associated with a subsurface bloom of dinophysis norvegica in Bedford basin, eastern Canada. Mar. Ecol. Prog. Ser. 97, 117–126. doi: 10.3354/meps097117
Rasmussen H., Jorgensen B. B. (1992). Microelectrode studies of seasonal oxygen uptake in a coastal sediment: role of molecular diffusion. Mar. Ecol. Prog. Ser. 81, 289–303. doi: 10.3354/meps081289
Riddle A. M., Lewis R. E. (2000). Dispersion experiments in U.K. coastal waters. Estuar. Coast. Shelf Sci. 51, 243–254. doi: 10.1006/ecss.2000.0661
Robicheau B. M., Tolman J., Bertrand E. M., LaRoche J. (2022). Highly-resolved interannual phytoplankton community dynamics of the coastal Northwest Atlantic. ISME Commun. 2, 38. doi: 10.1038/s43705-022-00119-2
Robinson C., Le P. J., Williams B. (2005). “Respiration and its measurement in surface marine waters,” in Respiration in aquatic ecosystems, (Oxford University Press), 147–180. doi: 10.1093/acprof:oso/9780198527084.003.0009
Sasaki A., Hagimori Y., Yuasa I., Nakatsubo T. (2012). Annual sediment respiration in estuarine sandy intertidal flats in the seto inland Sea, Japan. Landscape Ecol. Eng. 8, 107–114. doi: 10.1007/s11355-011-0157-0
Schmidtko S., Stramma L., Visbeck M. (2017). Decline in global oceanic oxygen content during the past five decades. Nature 542, 335–339. doi: 10.1038/nature21399
Scott D. B. (2005). Pollution monitoring in two north American estuaries: Historical reconstructions using benthic foraminifera. J. Foraminiferal Res. 35, 65–82. doi: 10.2113/35.1.65
Scrosati R. A. (2020). Upwelling spike and marked SST drop after the arrival of cyclone Dorian to the Atlantic Canadian coast. J. Sea Res. 159, 101888. doi: 10.1016/j.seares.2020.101888
Seitzinger S., Harrison J. A., Böhlke J. K., Bouwman A. F., Lowrance R., Peterson B., et al. (2006). Denitrification across landscapes and waterscapes: A synthesis. Ecol. Appl. 16, 2064–2090. doi: 10.1890/1051-0761(2006)016[2064:DALAWA]2.0.CO;2
Shan S., Sheng J. (2012). Examination of circulation, flushing time and dispersion in Halifax harbour of Nova Scotia. Water Qual. Res. J. 47, 353–374. doi: 10.2166/wqrjc.2012.041
Shan S., Sheng J., Thompson K. R., Greenberg D. A. (2011). Simulating the three-dimensional circulation and hydrography of Halifax harbour using a multi-nested coastal ocean circulation model. Ocean Dyn 61, 951–976. doi: 10.1007/s10236-011-0398-3
Shi Q., Wallace D. (2018). A 3-year time series of volatile organic iodocarbons in Bedford basin, Nova Scotia: a northwestern Atlantic fjord. Ocean Sci. 14, 1385–1403. doi: 10.5194/os-14-1385-2018
Simpson J. H. (1981). The shelf-sea fronts: implications of their existence and behaviour. philosophical transactions of the royal society of London. Ser. A Math. Phys. Sci. 302, 531–546. doi: 10.1098/rsta.1981.0181
Soetaert K., Herman P. M. J., Middelburg J. J. (1996a). A model of early diagenetic processes from the shelf to abyssal depths. Geochim Cosmochim Acta 60, 1019–1040. doi: 10.1016/0016-7037(96)00013-0
Soetaert K., Herman P. M. J., Middelburg J. J. (1996b). Dynamic response of deep-sea sediments to seasonal variations: A model. Limnol Oceanogr 41, 1651–1668. doi: 10.4319/lo.1996.41.8.1651
Soetaert K., Meysman F. (2012). Reactive transport in aquatic ecosystems: Rapid model prototyping in the open source software r. Environ. Model. Software 32, 49–60. doi: 10.1016/j.envsoft.2011.08.011
Soetaert K., Petzoldt T. (2010). Inverse modelling, sensitivity and Monte Carlo analysis in r using package FME. J. Stat. Softw 33, 1–28. doi: 10.18637/jss.v033.i03
Soetaert K., Petzoldt T., Meysman F. J. R. (2010a)Marelac: Tools for aquatic sciences v2.1.3. In: R package. Available at: https://cran.r-project.org/package=marelac (Accessed 27, 2022).
Soetaert K., Petzoldt T., Setzer R. W. (2010b). Solving differential equations in R : Package deSolve. J. Stat. Softw 33, 1–25. doi: 10.18637/jss.v033.i09
Song G., Liu S., Zhang J., Zhu Z., Zhang G., Marchant H. K., et al. (2021). Response of benthic nitrogen cycling to estuarine hypoxia. Limnol Oceanogr 66, 652–666. doi: 10.1002/lno.11630
Stramma L., Johnson G. C., Sprintall J., Mohrholz V. (2008). Expanding oxygen-minimum zones in the tropical oceans. Science 320, 655–658. doi: 10.1126/science.1153847
Taguchi S., Hargrave B. T. (1978). Loss rates of suspended material sedimented in a marine bay. J. Fisheries Res. Board Canada 35, 1614–1620. doi: 10.1139/f78-251
Testa J. M., Clark J. B., Dennison W. C., Donovan E. C., Fisher A. W., Ni W., et al. (2017). Ecological forecasting and the science of hypoxia in Chesapeake bay. Bioscience 67, 614–626. doi: 10.1093/biosci/bix048
Thomas H., Craig S. E., Greenan B. J. W., Burt W., Herndl G. J., Higginson S., et al. (2012). Direct observations of diel biological CO<sub<2</sub< fixation on the scotian shelf, northwestern Atlantic ocean. Biogeosciences 9, 2301–2309. doi: 10.5194/bg-9-2301-2012
Tjoelker M. G., Oleksyn J., Reich P. B. (2001). Modelling respiration of vegetation: evidence for a general temperature-dependent q 10. Glob Chang Biol. 7, 223–230. doi: 10.1046/j.1365-2486.2001.00397.x
Vaquer-Sunyer R., Duarte C. M. (2008). Thresholds of hypoxia for marine biodiversity. Proceedings of the National Academy of Sciences 105, 15452–15457. doi: 10.1073/pnas.0803833105
Keywords: coastal hypoxia, fjord, reactive transport model, benthic oxygen flux, stratifcation, intrusion
Citation: Rakshit S, Dale AW, Wallace DW and Algar CK (2023) Sources and sinks of bottom water oxygen in a seasonally hypoxic fjord. Front. Mar. Sci. 10:1148091. doi: 10.3389/fmars.2023.1148091
Received: 19 January 2023; Accepted: 29 March 2023;
Published: 18 April 2023.
Edited by:
Selvaraj Kandasamy, Xiamen University, ChinaReviewed by:
Zhilong Liu, University of South Alabama, United StatesMasahiro Suzumura, National Institute of Advanced Industrial Science and Technology (AIST), Japan
Copyright © 2023 Rakshit, Dale, Wallace and Algar. This is an open-access article distributed under the terms of the Creative Commons Attribution License (CC BY). The use, distribution or reproduction in other forums is permitted, provided the original author(s) and the copyright owner(s) are credited and that the original publication in this journal is cited, in accordance with accepted academic practice. No use, distribution or reproduction is permitted which does not comply with these terms.
*Correspondence: Subhadeep Rakshit, c3ViaGFkZWVwLnJha3NoaXRAZGFsLmNh; Christopher Kenneth Algar, Y2hyaXMuYWxnYXJAZGFsLmNh