 Minami Ishihara
 Kohei Matsuno
 Koki Tokuhiro
 Yasuhiro Ando1
 Atsushi Yamaguchi
- 1Faculty/Graduate School of Fisheries Sciences, Hokkaido University, Hakodate, Hokkaido, Japan
- 2Arctic Research Center, Hokkaido University, Sapporo, Hokkaido, Japan
- 3Demonstration Laboratory, Marine Ecology Research Institute, Kashiwazaki, Niigata, Japan
- 4Arctic Environment Research Center, National Institute of Polar Research, Tachikawa, Tokyo, Japan
Calanus glacialis/marshallae is a dominant zooplankton species in the Pacific Arctic Ocean that is widely distributed in shelf areas, and it plays a vital role in connecting primary production to higher trophic levels. Its phenology is well adapted to hydrography, but there is little available information about regional and diel changes in population structure and grazing features. In this study, we investigated C. glacialis/marshallae during autumn 2019 in the Eastern and Northeastern Chukchi and Canadian basins to reveal geographic and diel variations in population structure, body size, grazing activity, and fatty acid composition. The abundance of C. glacialis/marshallae was found to be high on the slopes and low on the shelves. Body size (prosome length) was well described by the Bělehrádek equation combined with in-situ temperature throughout the sampling region. Cluster analyses based on hydrographic parameters were divided into four regions: southern shelf, northern shelf, slope, and basin. The southern shelf was dominated by copepodite stage five (C5) transported from the Bering Sea by Pacific waters. C4 and C5 were dominant on the northern shelf, suggesting that they grew slower than those on the southern shelf, and the populations also exhibited higher concentrations of fatty acids originating from dinoflagellates than those originating from the pan-Arctic Ocean, indicating low productivity in the region. The population on the slope had the highest abundance, C4 was dominant, and large amounts of diatom-derived eicosapentaenoic acid (EPA). These features are attributed to the upwelling of populations and nutrients that support diatom growth. In the basin, the early copepodite stages of composition were distinctly higher than those recorded in previous studies, because larger amounts of organisms flow into the region, resulting in more extended reproduction periods. In the basin, small and large forms of C5 were simultaneously found, and the small form exhibited a diel grazing activity pattern, but the large forms did not. These findings suggest their well adaptation in changing of the Pacific Arctic Ocean.
1 Introduction
Calanus Leach, 1816 is the dominant copepod genus in the zooplankton biomass within the Pacific Arctic Ocean (Kosobokova and Hirche, 2009). Three Calanus species have been identified in different areas of the Pacific Arctic Ocean: Calanus hyperboreus in the basin (Conover, 1988), Calanus glacialis on the shelf (Kosobokova and Hirche, 2009; Kosobokova and Hopcroft, 2010), and Calanus marshallae in the southeastern Bering Sea (Frost, 1974; Vidal and Smith, 1986). Of these, C. hyperboreus has the largest body size and can be easily distinguished from the other two species. Calanus glacialis and C. marshallae are morphologically similar and difficult to distinguish (Frost, 1974), although they have been distinguished by genetic analysis (haplotype-based on 18S rRNA), and results have indicated that C. marshallae is transported to the shelf by the Pacific waters (Nelson et al., 2009; Ashjian et al., 2021). However, a genetic analysis was not conducted in the current study, and the C. glacialis/marshallae species complex is therefore referred to as C. glacialis in this work. Calanus glacialis has two populations (the Bering Sea and Arctic Basin populations that can also be distinguished using haplotype analyses (Nelson et al., 2009; Ashjian et al., 2017; Pinchuk and Eisner, 2017; Ashjian et al., 2021). Although these populations are believed to be morphologically indistinguishable, haplotype analysis indicates that the Bering Sea population is distributed on the Chukchi Sea shelf, and the Arctic Basin population is distributed north of the Beaufort Sea slope/Basin (Nelson et al., 2009). In addition, these populations appear to differ in their copepodid stage composition during the same season (Ershova et al., 2015; Pinchuk and Eisner, 2017), suggesting that the life cycles differ between populations.
Calanus glacialis is the dominant biomass species on the shelf of the Pacific Arctic Ocean (Kosobokova and Hirche, 2009; Kosobokova and Hopcroft, 2010), and it plays an essential role in connecting primary production to higher trophic levels in fish, birds, and mammals (Dickson and Gilchrist, 2002; Bengtson et al., 2005; Falk-Petersen et al., 2009; Crawford et al., 2012; Choquet et al., 2018). The population peaks near the shelf border (the shelf break) and declines sharply in the basin (Kosobokova and Hirche, 2009; Wassmann et al., 2015; Ershova et al., 2021). Calanus glacialis has a generation length of 1–3 years (Kosobokova, 1999; Ashjian et al., 2003; Falk-Petersen et al., 2009), and it grows from an egg to C3 and C4 within one year (Scott et al., 2000). The species has mixed reproductive strategies depending on food conditions (Plourde et al., 2005; Daase et al., 2013): capital breeding (based on internal energy storage before the onset of the spring bloom) and income breeding (utilizing ice algal or pelagic blooms) (Varpe et al., 2009). Due to this flexibility, their reproduction is initiated under sea ice and continues for one to two months using ice algae and pelagic phytoplankton blooms (Tourangeau and Runge, 1991; Campbell et al., 2009; Daase et al., 2013). However, if individuals reproduce in the late season, they cannot grow to the diapause stage in a short period (Falk-Petersen et al., 2009; Daase et al., 2013). As the developmental time between the stages is negatively related to temperature under sufficient food conditions (Corkett et al., 1986; McLaren et al., 1988), it is acknowledged that the life cycle of this species exhibits plasticity in response to environmental conditions that are reflected in the biological features of the species, such as body size, grazing activity, and the accumulation of fatty acids.
The body size of copepods varies depending on the temperature and prey conditions (Digby, 1954; Viitasalo et al., 1995; Kobari et al., 2003). Low temperatures and high food availability stabilize the growth of copepods (Vidal, 1980), which increases the body size (Viitasalo et al., 1995). Geographic variations in the body size of this species have been reported in the Atlantic sector of the Arctic Ocean when conducting interspecific comparisons with Calanus finmarchicus (Kosobokova, 1999; Choquet et al., 2018), but little information is available for the Pacific Arctic Ocean (Ashjian et al., 2003).
Calanus glacialis is omnivorous, feeds mainly on diatoms and dinoflagellates (Søreide et al., 2008; Yeh et al., 2020), and adapts flexibly to changes in its prey composition (Stevens et al., 2004a; Banas et al., 2016; Freese et al., 2016). With respect to feeding, the fatty acid composition has been well analyzed, mainly in the Atlantic sector of the Arctic Ocean (Stevens et al., 2004a; El-Sabaawi et al., 2009; Falk-Petersen et al., 2009; Trudnowska et al., 2020). The fatty acid composition of zooplankton varies with diet (Stevens et al., 2004b). Zooplankton contains unique fatty acids that are taken up and preserved without chemical changes in the body; fatty acids can be analyzed to obtain an index of their feeding records (El-Sabaawi et al., 2009). For example, diatoms are rich in eicosapentaenoic acid (EPA), and dinoflagellates are rich in docosahexaenoic acid (DHA; Budge and Parrish, 1998). The gut pigment is another index of the feeding activity of copepods, and it is useful for evaluating diel changes in grazing activity (Conover and Huntley, 1991); however, it has also not been well studied in the Pacific Arctic Ocean (Matsuno et al., 2015). Therefore, the regional differences in body size, feeding activity (fatty acid composition), and diel grazing patterns during autumn remain unknown. In this study, therefore, we investigated the population structure and ecological features (body size, feeding activity, and fatty acid composition) of C. glacialis to assess its current state in the changing Arctic Ocean.
2 Materials and methods
2.1 Field survey and onboard analysis
Zooplankton sampling was conducted via the R/V Mirai in the Pacific Arctic Ocean (66.50–78.04˚N, 145.00–168.75˚W) from October 8 to 27, 2019. Zooplankton samples were collected using vertical tows and a ring net (mouth diameter: 80 cm, mesh size: 335 µm) and a quad-NORPAC (North Pacific) net (mouth diameter: 45 cm, mesh sizes: 150 µm and 63 µm; Hama et al., 2019) at 10 m above the bottom or 150 m to the surface at 40 stations (Figure 1; Supplementary Table 1). The volume of the water filtered through the NORPAC net with the 150-µm mesh was estimated using a one-way flow meter (Rigosha CO., Ltd., Bunkyo-ku, Tokyo, Japan) mounted in the mouth of the net for quantitative collection of all copepodite stages in C. glacialis. Temperature, salinity, dissolved oxygen, and turbidity were simultaneously measured using vertical casts from a conductivity temperature depth (CTD) sensor (Sea-Bird Electronics Inc., SBE 911plus).
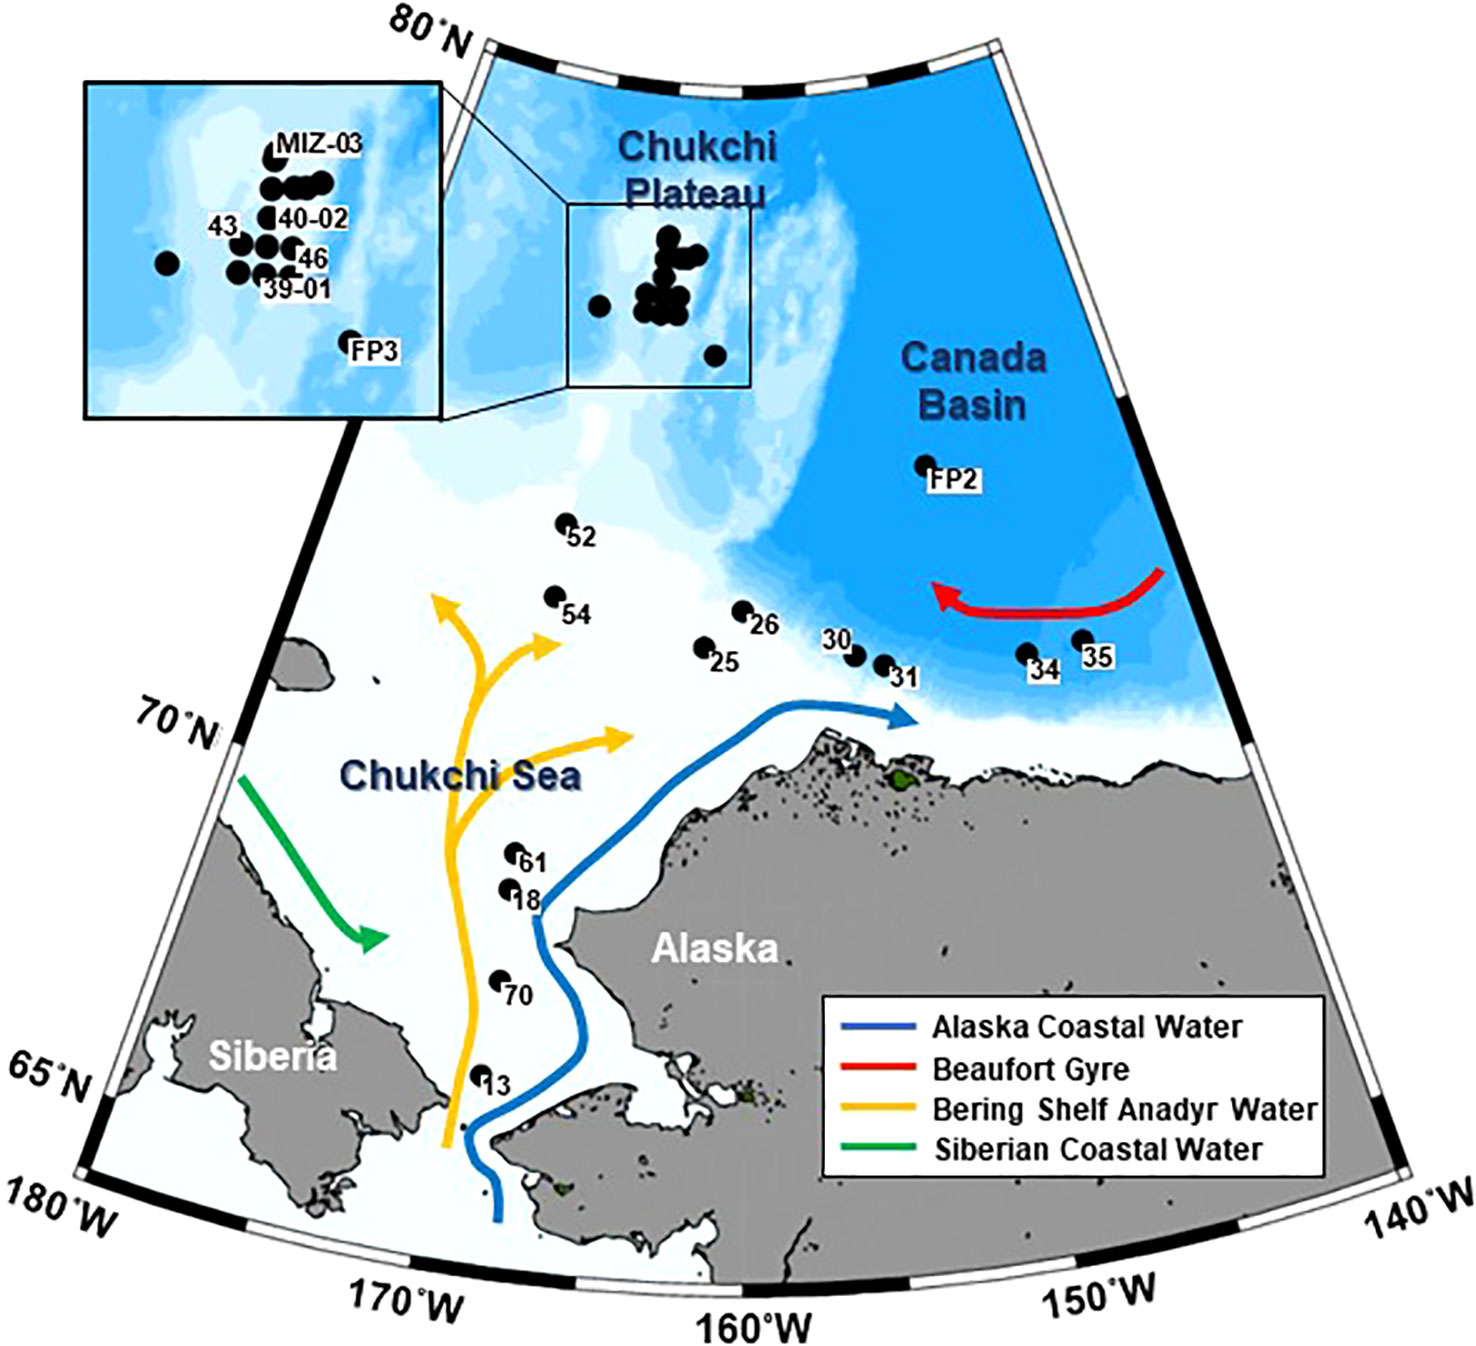
Figure 1 Location of sampling stations in the Pacific sector of the Arctic Ocean. Solid circles indicate where NORPAC net (150-µm mesh) sampling of Calanus glacialis/marshallae occurred in October 2019. The currents were adapted from Grebmeier et al. (2006).
NORPAC net samples (mesh size: 150 µm) were immediately preserved in 5% v/v borax-buffered formalin to analyze the abundance and population structure of C. glacialis. The remaining samples collected by the ring net and the NORPAC net (mesh size: 63 µm) were used to conduct gut pigment and fatty acid composition analyses. Gut pigment analyses were conducted in samples from 11 stations on the Chukchi Plateau (77°N) obtained during October 21–24, and fatty acid analyses were conducted in samples from throughout the study area.
With respect to the gut pigment analysis, 10% v/v soda (saturated with CO2 in water) was immediately added to the fresh samples after sample collection to avoid copepod grazing, gut evacuation, and the decomposition of gut pigments (cf. Matsuno et al., 2015). Fresh specimens of C. glacialis copepodite stage five (C5) were sorted using a stereomicroscope (M165C-Ergo/MCI-HH/1; Leica Inc., Wetzlar, Germany). All specimens were sorted under low-temperature and dim-light conditions within 1 h, and the prosome length (PL) was measured using an eyepiece micrometer attached to a stereomicroscope with an accuracy of 0.001 mm. The sorted specimens (two to five specimens, average: three) were margined in small (2.5–3.3 mm) or large (3.4–3.8 mm) categories and transferred into cuvette tubes filled with 6 mL of N, N-dimethylformamide. One to four duplicates were obtained at each station, resulting in a total of 31 and 28 gut piments samples for the small and large categories, respectively. All samples were kept under cool and dark conditions for at least 24 h to extract chlorophyll and phaeopigments. After extraction, chlorophyll and phaeopigments were analyzed using a fluorometer (10-AU-005; Turner Designs Inc., California, United States), and the results were combined and expressed as the digestive tract pigment content (µg pigment ind.-1; cf. Mackas and Bohrer, 1976).
The remaining sorted fresh samples were desalted using Milli-Q (Millipore Inc.), stored in 3-mL ointment bottles, and frozen at -80°C until the fatty acid composition was analyzed.
2.2 Sample analysis
In the laboratory, 19 zooplankton samples (Supplementary Table 1) collected by the NORPAC net with a 150-µm mesh size were split using a Motoda box splitter (Motoda, 1959). Calanus glacialis was identified at the copepodid stage level based on Brodsky (1967) in the aliquots and counted under a dissecting microscope (SMZ1000, C-BD115, Nikon Corporation, Japan). To calculate the total species abundance (ind. m-3), the count at each stage was summarized and divided by the filtered volume (m3) of the net. Calanus marshallae is potentially distributed in the northern Bering Sea and Chukchi Sea (Frost, 1974), but many zooplankton studies have treated this species as C. glacialis/marshallae owing to difficulties in their identification. Therefore, as mentioned in the Introduction, we refer to specimens from the C. glacialis/marshallae species complex as C. glacialis hereafter.
To determine geographical differences in the body size of C. glacialis, the PL of at least 10 C. glacialis C5 individuals at each station was measured using an eyepiece micrometer attached to a stereomicroscope with an accuracy of 0.001 mm. This measurement was performed for all zooplankton samples (Figure 1).
The length of lipid accumulation relative to the PL (lipid accumulation level) was measured at three levels: low, 0–4% of PL; medium, 4–40% of PL; and high, >40% of PL (Matsuno et al., 2016). To compare C. glacialis data, the abundance (ind. m-2) was calculated by multiplying the population density (ind. m-3) with the sampling depth to eliminate the influence of sampling depth differences at each station. The mean C. glacialis copepodid stage (MCS) was calculated using Eq (1).
where i (1–6 indicates C1–C6) indicates the copepodid stage for C. glacialis, and Ai (ind. m-2) is the abundance of a copepodid stage (cf. Marin, 1987). Similarly, the mean lipid stage (MLS) of C. glacialis C5 was calculated using Eq (2).
where j (1, 2, and 3 indicates low, medium, and high, respectively) indicates the lipid accumulation level, and Bj (ind. m-2) is the ratio of the lipid accumulation level to the abundance.
Gonad maturation in adult females of the dominant copepod species was classified as stage I (immature), stage II (small oocytes in the ovary or oviduct), or stage III (large eggs or distended opacity in the oviduct) (cf. Miller et al., 1984; Niehoff, 1998).
2.3 Fatty acid analysis
Fatty acid analyses were performed using a simplified direct saponification/methylation method (Matsumoto et al., 2018) after necessary modifications were made for wax ester-containing samples. Each C. glacialis sample was transferred to a pre-weighed screw-capped glass vial and dried in vacuo until a constant weight was achieved. Methyl tricosanoate and 1-tricosanol in toluene (2 mg mL-1 and 1 mg mL-1, respectively; 1 µL) and 1 M KOH in 95% ethanol (50 µL) were added to the vial, and after being crushed with a stainless-steel rod, the sample was directly saponified overnight in the dark at 23°C. The reaction was stopped by adding 3 M HCl in methanol (33 µL; Sigma-Aldrich), and the solvents and excess HCl were evaporated under a stream of nitrogen and then in vacuo. The fatty acids released into the vial were methylated in 3 M HCl in methanol (100 µL) at 80°C for 10 min, and the reagent was evaporated under a stream of nitrogen. The fatty acid methyl esters were purified via column chromatography using silica gel 60 (Merck) and hexane/diethyl ether (95:5, v/v), and fatty alcohols were recovered from the same column by elution with hexane/diethyl ether (50:50, v/v) and stored.
The purified fatty acid methyl esters were analyzed via gas chromatography using a GC-4000 gas chromatograph (GL Sciences, Tokyo, Japan) and an InertCap Pure-WAX column (30 m × 0.32 mm i.d., 0.25 µm film thickness; GL Sciences, Tokyo, Japan). The column temperature was programmed to increase from 90°C to 170°C at 20°C min-1, then to 240°C at 4°C min-1, and to be finally maintained at 240°C for 25 min. The injector and detector temperatures were set at 240°C. The carrier gas was helium at a linear velocity of 29.3 cm s-1 at 170°C. Methyl esters dissolved in hexane were injected into the column in the splitless injection mode, which was held for 1 min. A flame ionization detector (Shimadzu Corporation, Japan) and Shimadzu C-R3A integrator (Shimadzu Corporation, Japan) were used for detection and conducting peak area measurements. Peaks were identified by comparing their retention times with those of sardine oil fatty acids. The fatty acid content was calculated from the peak area ratios of methyl tricosanoate added to the initial C. glacialis samples.
2.4 Data analysis
To compare the biological parameters of C. glacialis C5 within the Pacific sector of the Arctic Ocean in 2019, a cluster analysis of environmental data was conducted. In this respect, water column (from the surface to 10 m above the bottom or 150 m above the bottom) averages of hydrographic data (temperature, salinity, dissolved oxygen, and turbidity) were calculated at each station. The water column data were then standardized, and similarities between stations were examined using the Euclidean distance. To group stations, similarity indices were coupled with hierarchical agglomerative clustering and the complete linkage method (unweighted pair group method with arithmetic mean, UPGMA) using the SIMPROF test. Based on the dendrogram, stations were separated to define regions with similar hydrographic conditions. A principal component analysis (PCA) was performed using standardized hydrographic data to evaluate hydrographic condition trends in each group. These analyses were conducted using Primer 7 software (PRIMER-E Ltd.).
Non-metric multi-dimensional scaling (NMDS) ordination was conducted using Primer 7 based on population structure, and Pearson’s regressions of standardized hydrographic data were then conducted to delineate the relationship between population structure and hydrography. The abundance of each copepodid stage (ind. m-2) was transformed into that of the 4th root stage (X-4). Similarities between samples were examined using the Bray-Curtis index according to differences in the stage composition.
To obtain the fatty acid composition, we calculated seven indices (docosahexaenoic acid (DHA)/eicosapentaenoic acid (EPA), 16 polyunsaturated fatty acids (PUFA)/18PUFA, 18:2n-6, 15:0 + 17:0, PUFA/saturated fatty acid [SFA], 18:1n-9/18:1n-7, and diatoms [D]/flagellates [F]) for the prey record of C. glacialis (Kaneda, 1991; Budge and Parrish, 1998; Dalsgaard et al., 2003; Stevens et al., 2004b; Alfaro et al., 2006).
Differences in biological parameters (abundance, MCS,PL, MLS, and fatty acid composition) of C. glacialis C5 among regions (identified by the cluster analysis based on hydrography) were tested using the max-t method with a heteroscedastic consistent covariance estimation (HC3) (Herberich et al., 2010). The tests were conducted using R software with the packages “multcomp” and “sandwich” (version 4.1.2, R Core Development Team, 2021). The relationship between the PL of C5 and temperature was regressed using the Bêlehrádek equation. A PCA based on normalized seven-index data was performed for fatty acids using Primer 7.
3 Results
3.1 Regions and water masses
The cluster analysis of biological parameters using hydrological data identified four regions in the Pacific sector of the Arctic Ocean (Figure 2A). As these regions were clearly divided geographically, they were named (from south to north) the southern shelf, northern shelf, slope, and basin (Figures 2A, C). The PCA results showed that temperature, salinity, and turbidity were higher on the southern shelf and lower in the basin (Figure 2B). Salinity was exceptionally high on the slope, and the dissolved oxygen level was high on the northern shelf and basin (Figure 2B).
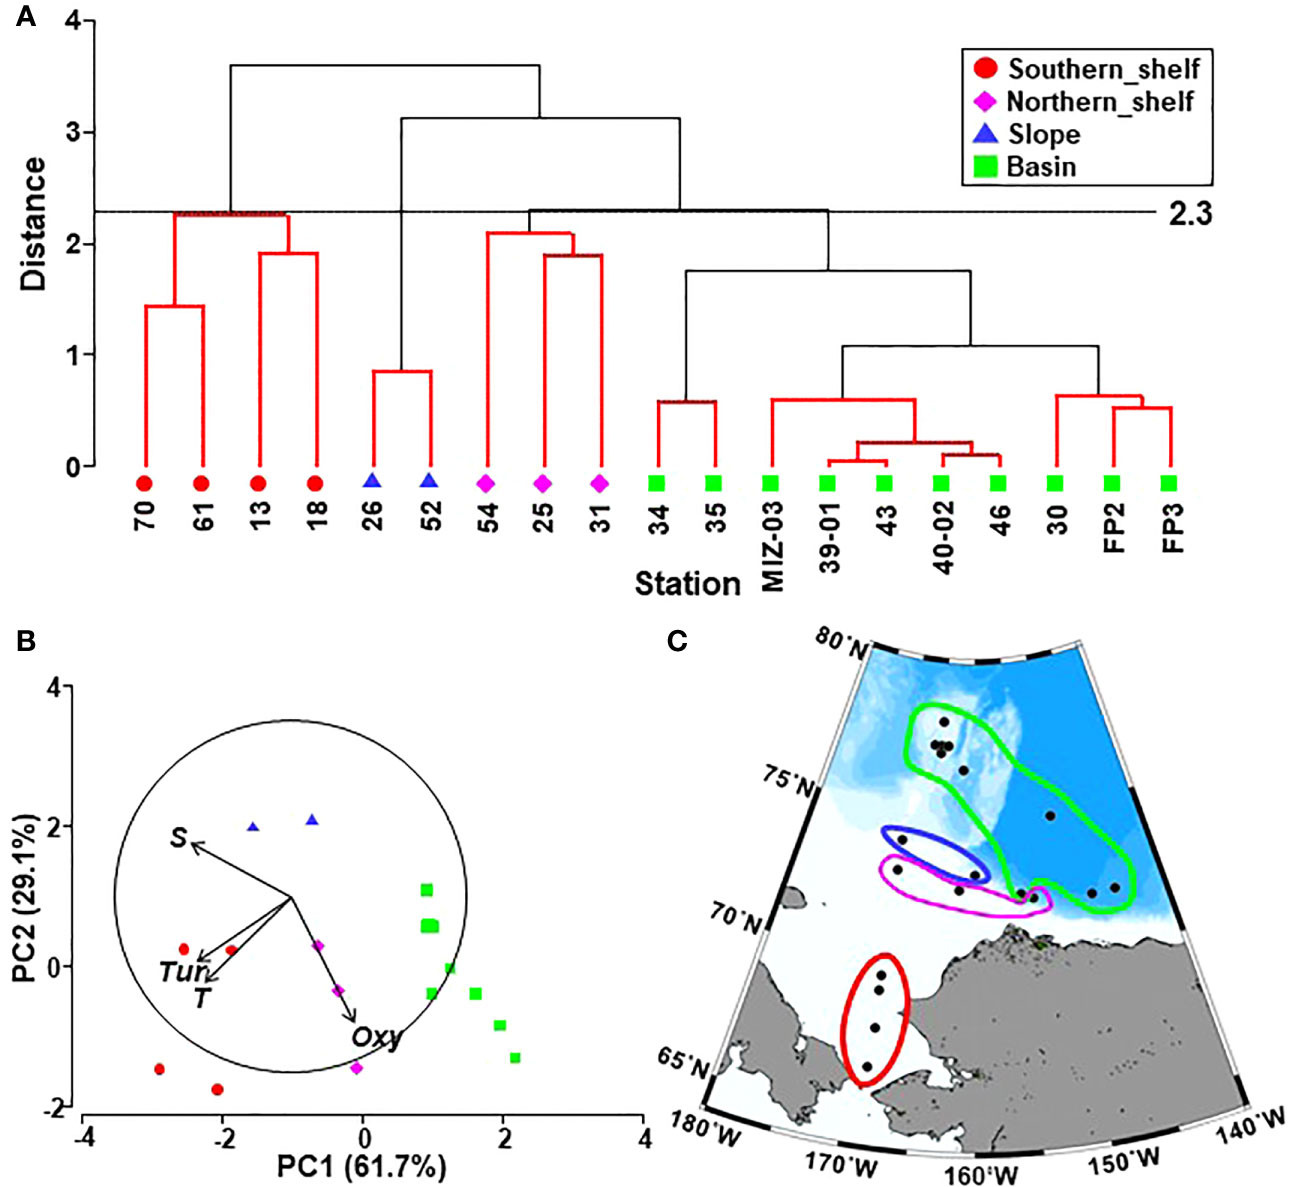
Figure 2 (A) Results of Q-mode clustering based on hydrographic variables by Euclidean distance connected with group average mode in the Pacific sector of the Arctic Ocean in October 2019. Red lines indicate non-significant station groupings, as tested by SIMPROF. Labels show sampling stations. (B) Principal component analysis with base variables showing four groups based on the cluster analysis. (C) Geographical distribution of the groups identified by the cluster analysis in the Pacific sector of the Arctic Ocean during October 2019.
Danielson et al. (2020) defined water masses based on temperature and salinity as follows: warm Coastal Water (wCW), warm Shelf Water (wSW), Ice Melt Water, cool Coastal Water (IMW cCW), cool Shelf Water (cSW), Anadyr Water (AnW), Modified Winter Water (MWW), Winter Water (WW), and Atlantic water and bearing basin water (AtlW and BBW) (Figure 3A). Within the 20 m depth on the southern shelf, wSW was dominant on October 8 but cSW occupied this depth range on October 27 (Figure 3B; Supplementary Table 1). A comparison of the temperature and salinity on these two dates showed that salinity was similar (32–32.49 vs. 31.99–32.36) but temperature was lower on October 27 (decreased from 3.77–5.85°C to 2.36–2.84°C). In the northern shelf region, the water masses differed because the stations and currents were widely distributed. AnW was observed below a depth of 25 m at St. 54, and AtlW and BBW were found below depths of 100 m and 125 m, respectively, on the slope. In the basin, a similar vertical distribution was observed among the stations; the surface layer (0–40 m or 0–60 m) comprised IMW cCW, while cSW, MWW, or WW existed at depths below these water masses.
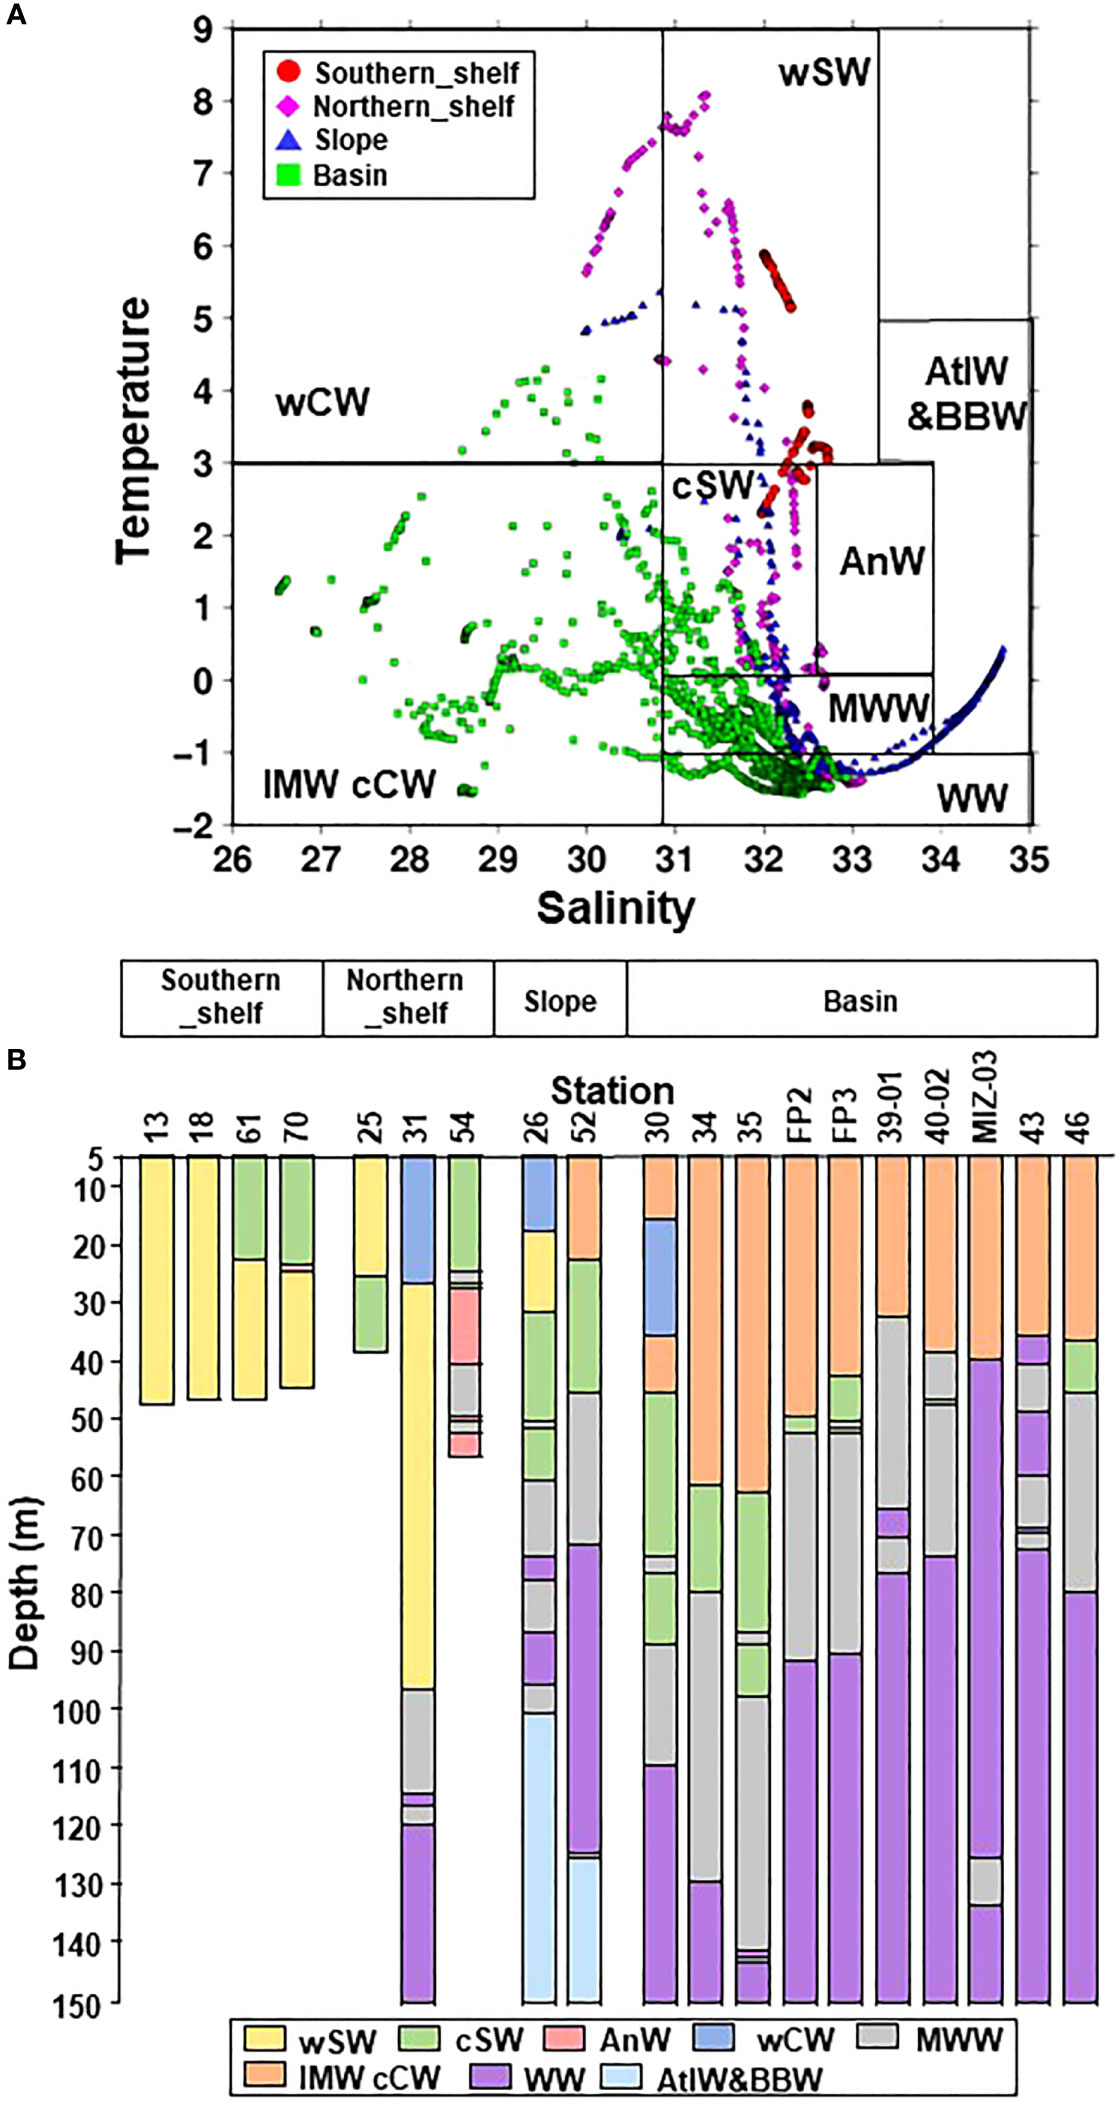
Figure 3 (A) T-S diagram in the Pacific sector of the Arctic Ocean in October 2019. The colored symbols indicate the four groups identified via cluster analysis (cf. Figure 2A): wCW, warm Coastal Water; wSW, warm Shelf Water; IMW cCW, Ice Melt Water and cool Coastal Water; cSW, cool Shelf Water; AnW, Anadyr Water; MWW, Modified Winter Water; WW, Winter Water; AtlW&BBW, Atlantic Water & Bering Basin Water (cf. Danielson et al., 2020). (B) Vertical distribution of water masses at each station in the Pacific sector of the Arctic Ocean in October 2019. The x-axis labels indicate groups identified by cluster analysis (cf. Figure 2A).
3.2 Geographical abundance and body size of C. glacialis
The abundance of C. glacialis ranged from 126 to 2,968 ind. m-2, with higher and lower abundances on the slope and shelf, respectively (Supplementary Figure 1). A comparison of the abundance and stage composition between the regions showed that the southern and northern shelves exhibited low abundance but had a high composition of C4 and C5 (Figure 4A). On the southern shelf, C5 was predominant in early October (St. 13 and 18), whereas adult females and males were predominant in late October (Sts. 61 and 70). The highest abundance of C3–C5 was observed on the slope. In the basin, the early stages (C1 or C2) occurred at 80% of stations (8/10), and the highest proportion of early stages was 44% (St. FP3; Figure 4). A few adult females were observed in each region, and almost all specimens showed stage I gonadal maturation (data not shown). NMDS based on the population structure showed relatively good separation with clustering by hydrography (Figure 4B). Among the hydrographic variables, temperature and turbidity had significant relationships with population structure. Of the basin group, Sts. 30, 34, and 35 were located slightly further from the main distribution of the basin community owing to the inflow of cSW at these stations (cf. Figure 3).
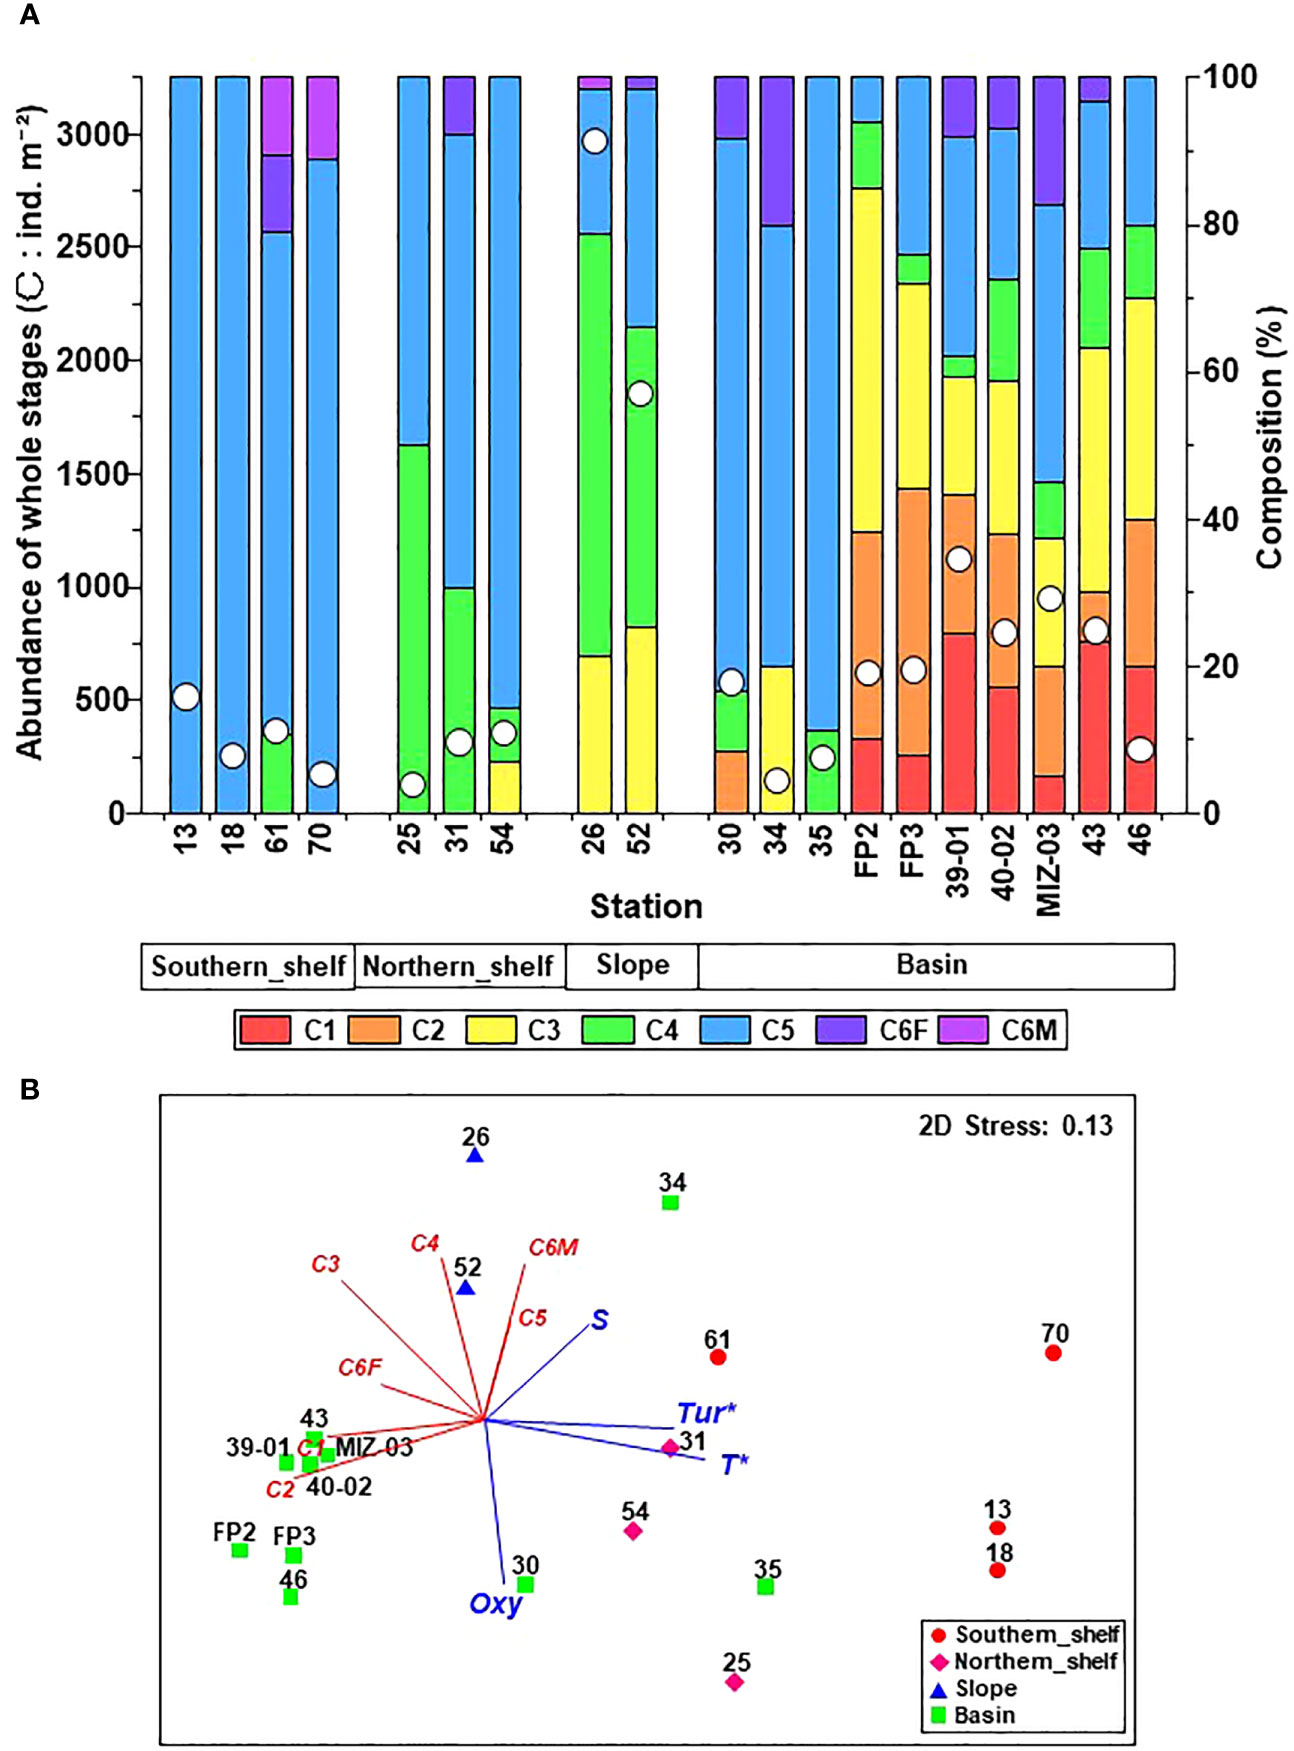
Figure 4 (A) Abundance and stage composition of Calanus glacialis/marshallae in the Pacific sector of the Arctic Ocean in October 2019. The x-axis labels indicate groups identified via cluster analysis (cf. Figure 2). (B) Non-metric multi-dimensional scaling (NMDS) ordination based on population structure with Pearson’s regressions of hydrography. Symbols indicate clustering groups (cf. Figure 2A), and numbers with symbols are station IDs. Red lines indicate correlations between each copepodite stage. T, temperature; S, salinity; Tur, turbidity; Oxy, dissolved oxygen. *: p< 0.05.
The body size (PL) of C. glacialis C5 ranged from 2.4–3.8 mm throughout the sampling region (Figure 5). The median PL value of each region showed an increasing trend from the Chukchi Sea toward the Arctic basin, in the order of the southern shelf, northern shelf, slope, and basin (Figure 5). Body size was well described by the Bêlehrádek equation (PL=23594 (T+76.17)-2.05; Figure 6).
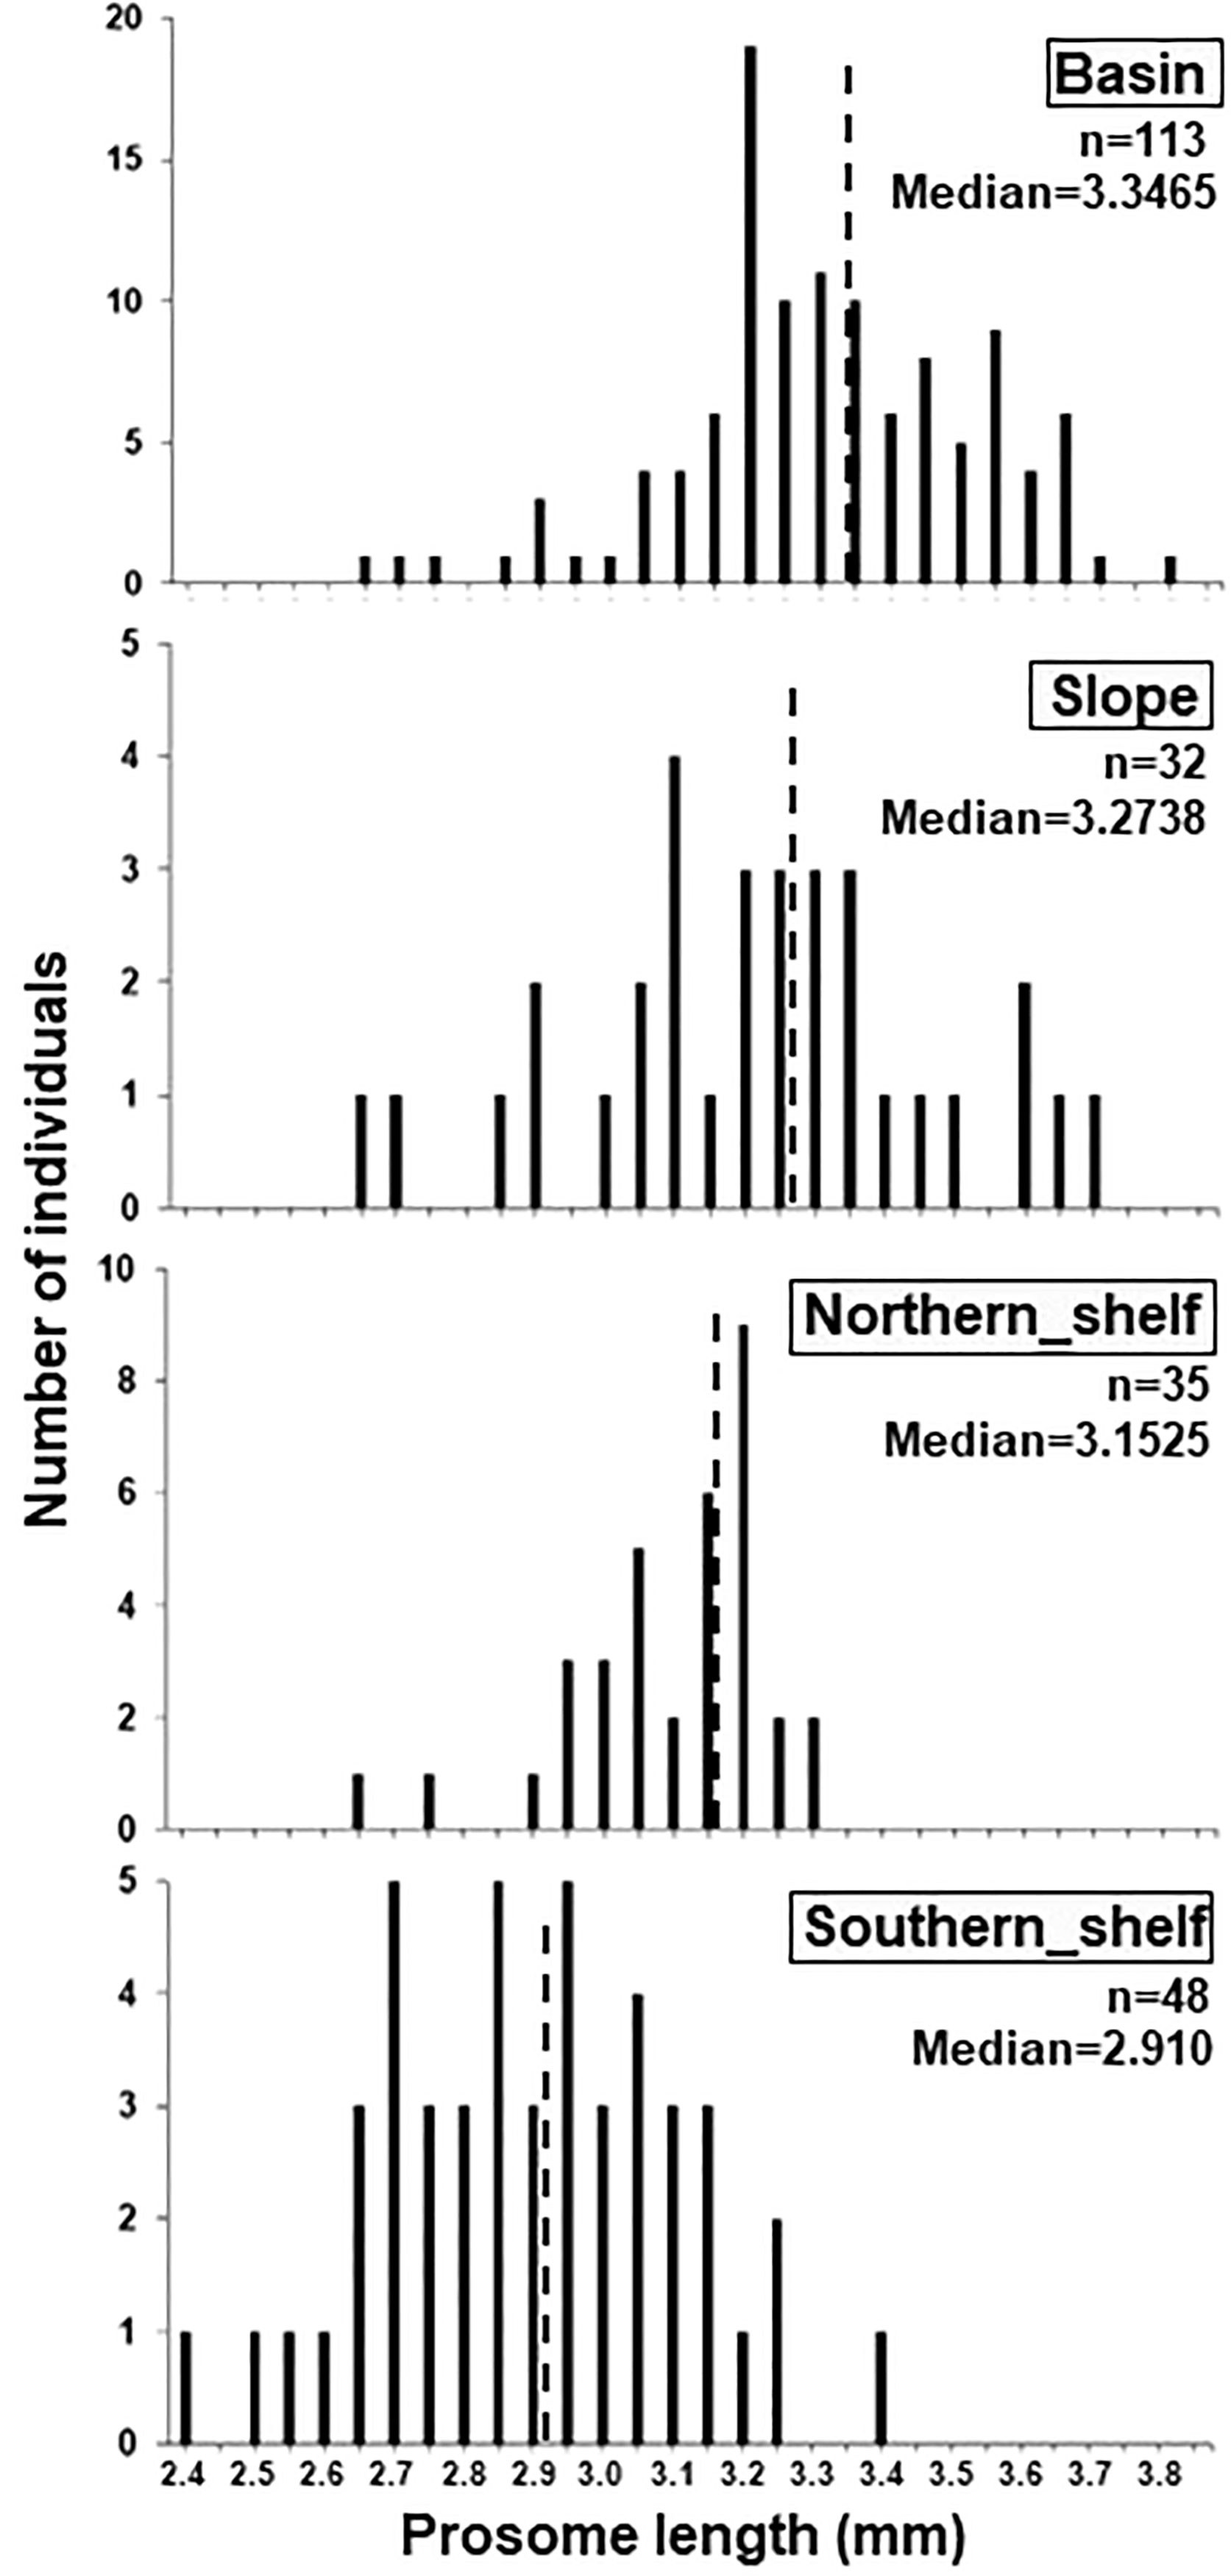
Figure 5 Size distribution of C5 Calanus. glacialis/marshallae in each clustering group (cf. Figure 2A) within the Pacific sector of the Arctic Ocean. Dashed lines indicate the median of the prosome length of the species in each region.
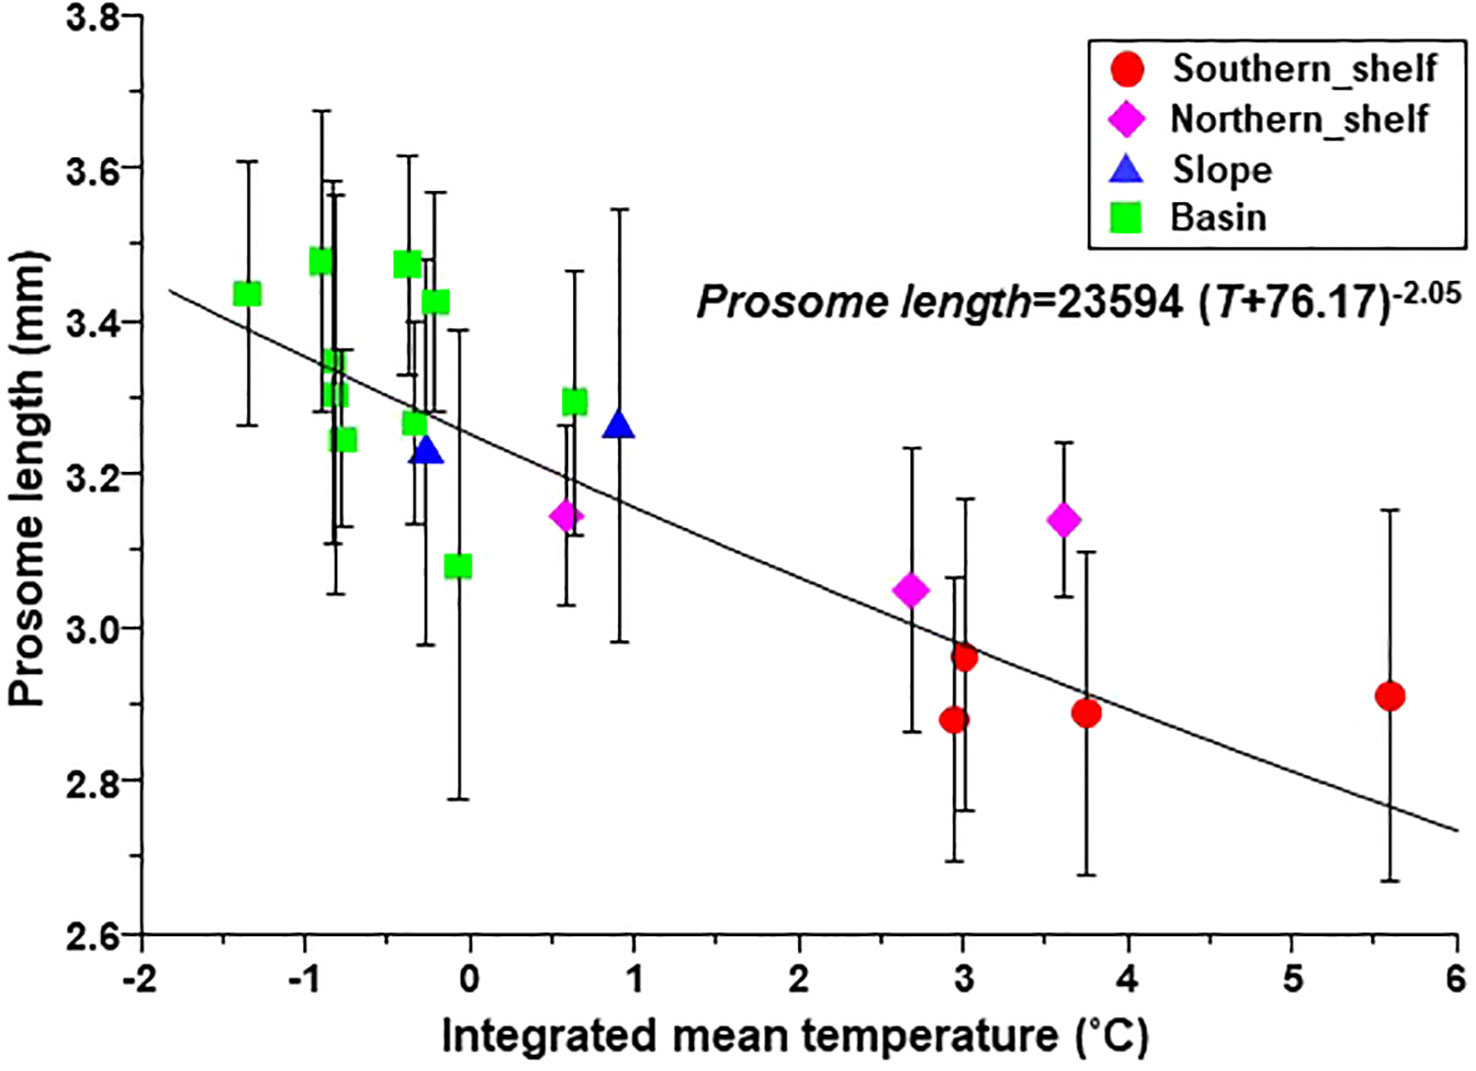
Figure 6 Relationship between prosome length of C5 Calanus glacialis/marshallae and integrated mean temperature in the Pacific sector of the Arctic Ocean. The symbols and error bars indicate the mean and standard deviation, respectively. The relationship was expressed using Bêlehrádek equations. The groups were identified via cluster analysis (cf. Figure 2A).
3.3 Relationship between abundance, fatty acid index, gut pigment and geographical distribution
A comparison of the biological parameters of C. glacialis among regions showed significant differences in the abundance of C5, PL of C5, total fatty acid content per individual, and fatty acid index (16PUFA/18PUFA, PUFA/SFA, and D/F; Table 1). The abundance of C5 was significantly higher on the slope than on the other regions. (Figure 4; Table 1). Significant differences in the MCS were detected, and it decreased from south to north (Figure 4; Table 1). There was no significant difference in MLS among regions; however, a minimum value was observed on the southern shelf (Table 1; Supplementary Figure 2). The total fatty acid content per individual in the basin was significantly higher than that on the southern shelf (Table 1). With respect to the fatty acid index, 16PUFA/18PUFA, PUFA/SFA, and D/F were significantly lower on the northern shelf, but DHA/EPA, 18:2n-6, and 15:0 + 17:0 were higher, although not significantly (Figure 7; Table 1). The results of the PCA based on the fatty acid indices showed that the northern shelf was distant from the distribution of the other groups (Figure 8). As shown in the regional comparison using the max-t test, the northern shelf had high 15:0 + 17:0, DHA/EPA, and 18:2n-6 values (Figure 8), and the other groups had relatively high 16PUFA/18PUFA, D/F, and PUFA/SFA ratios. There was no significant difference between the three groups (excluding the northern shelf), and the variabilities within the southern shelf and slope were within the basin variability.
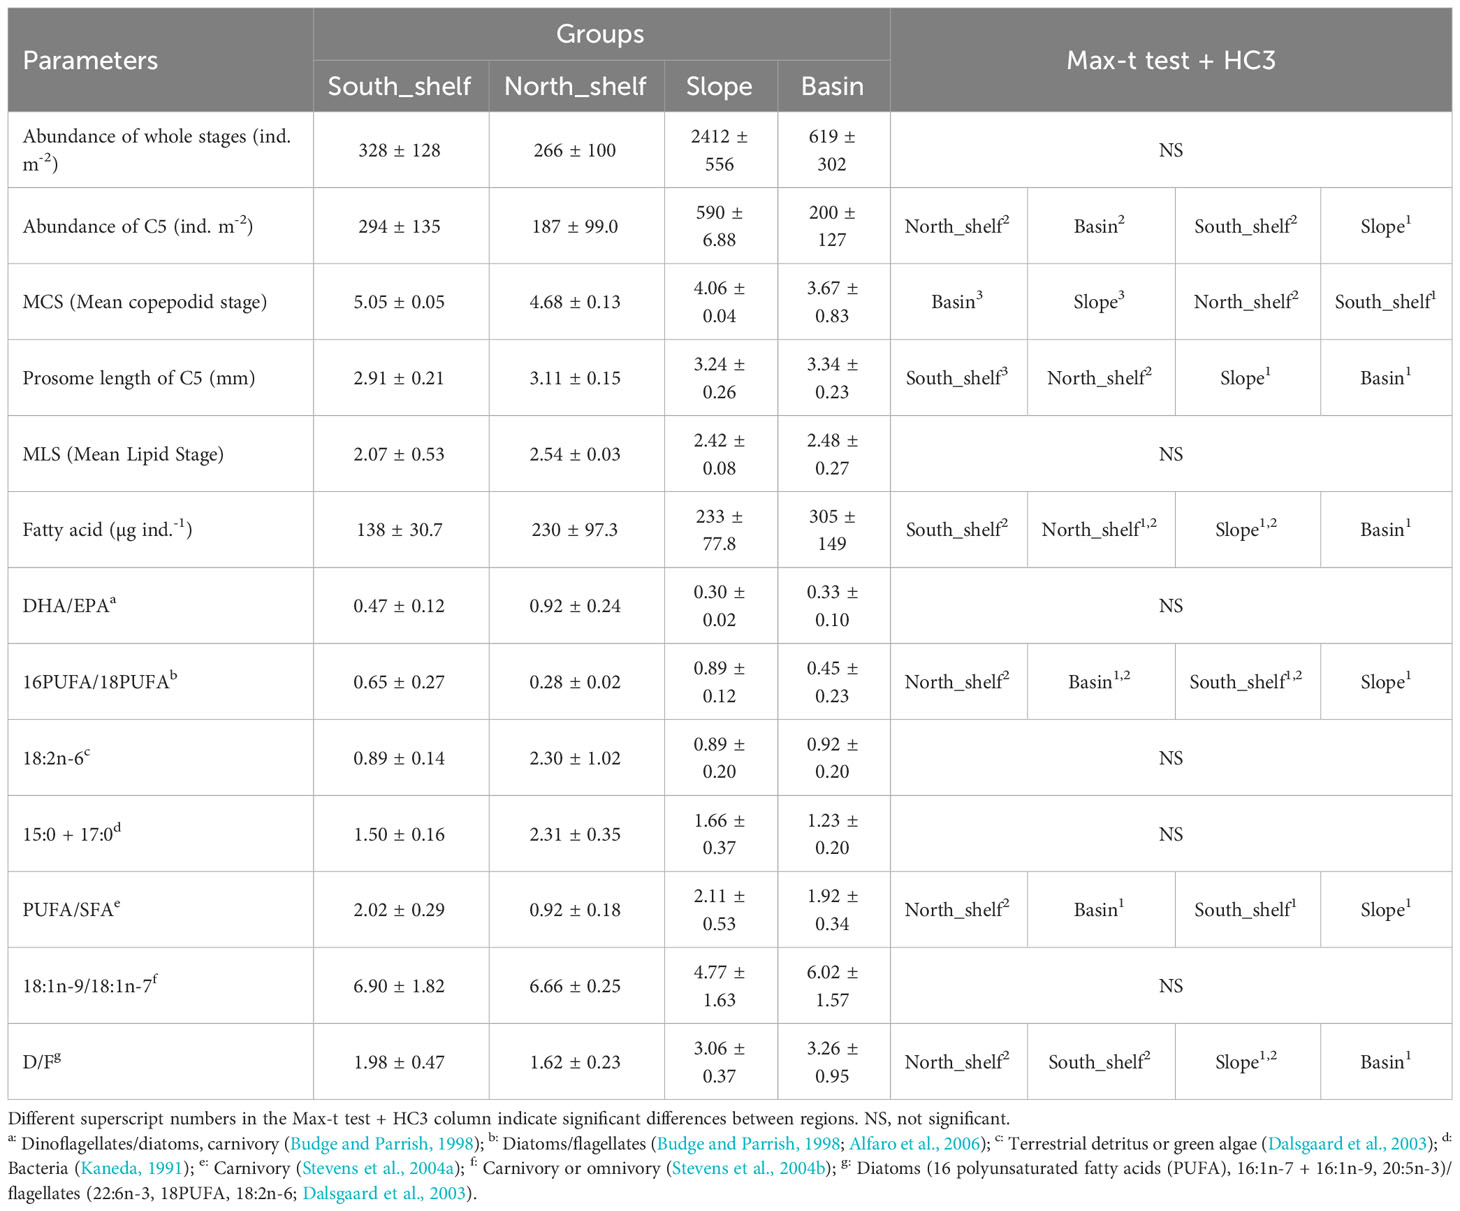
Table 1 Regional comparison of biological parameters of Calanus glacialis/marshallae in different areas of the Pacific sector of the Arctic Ocean during October 2019.
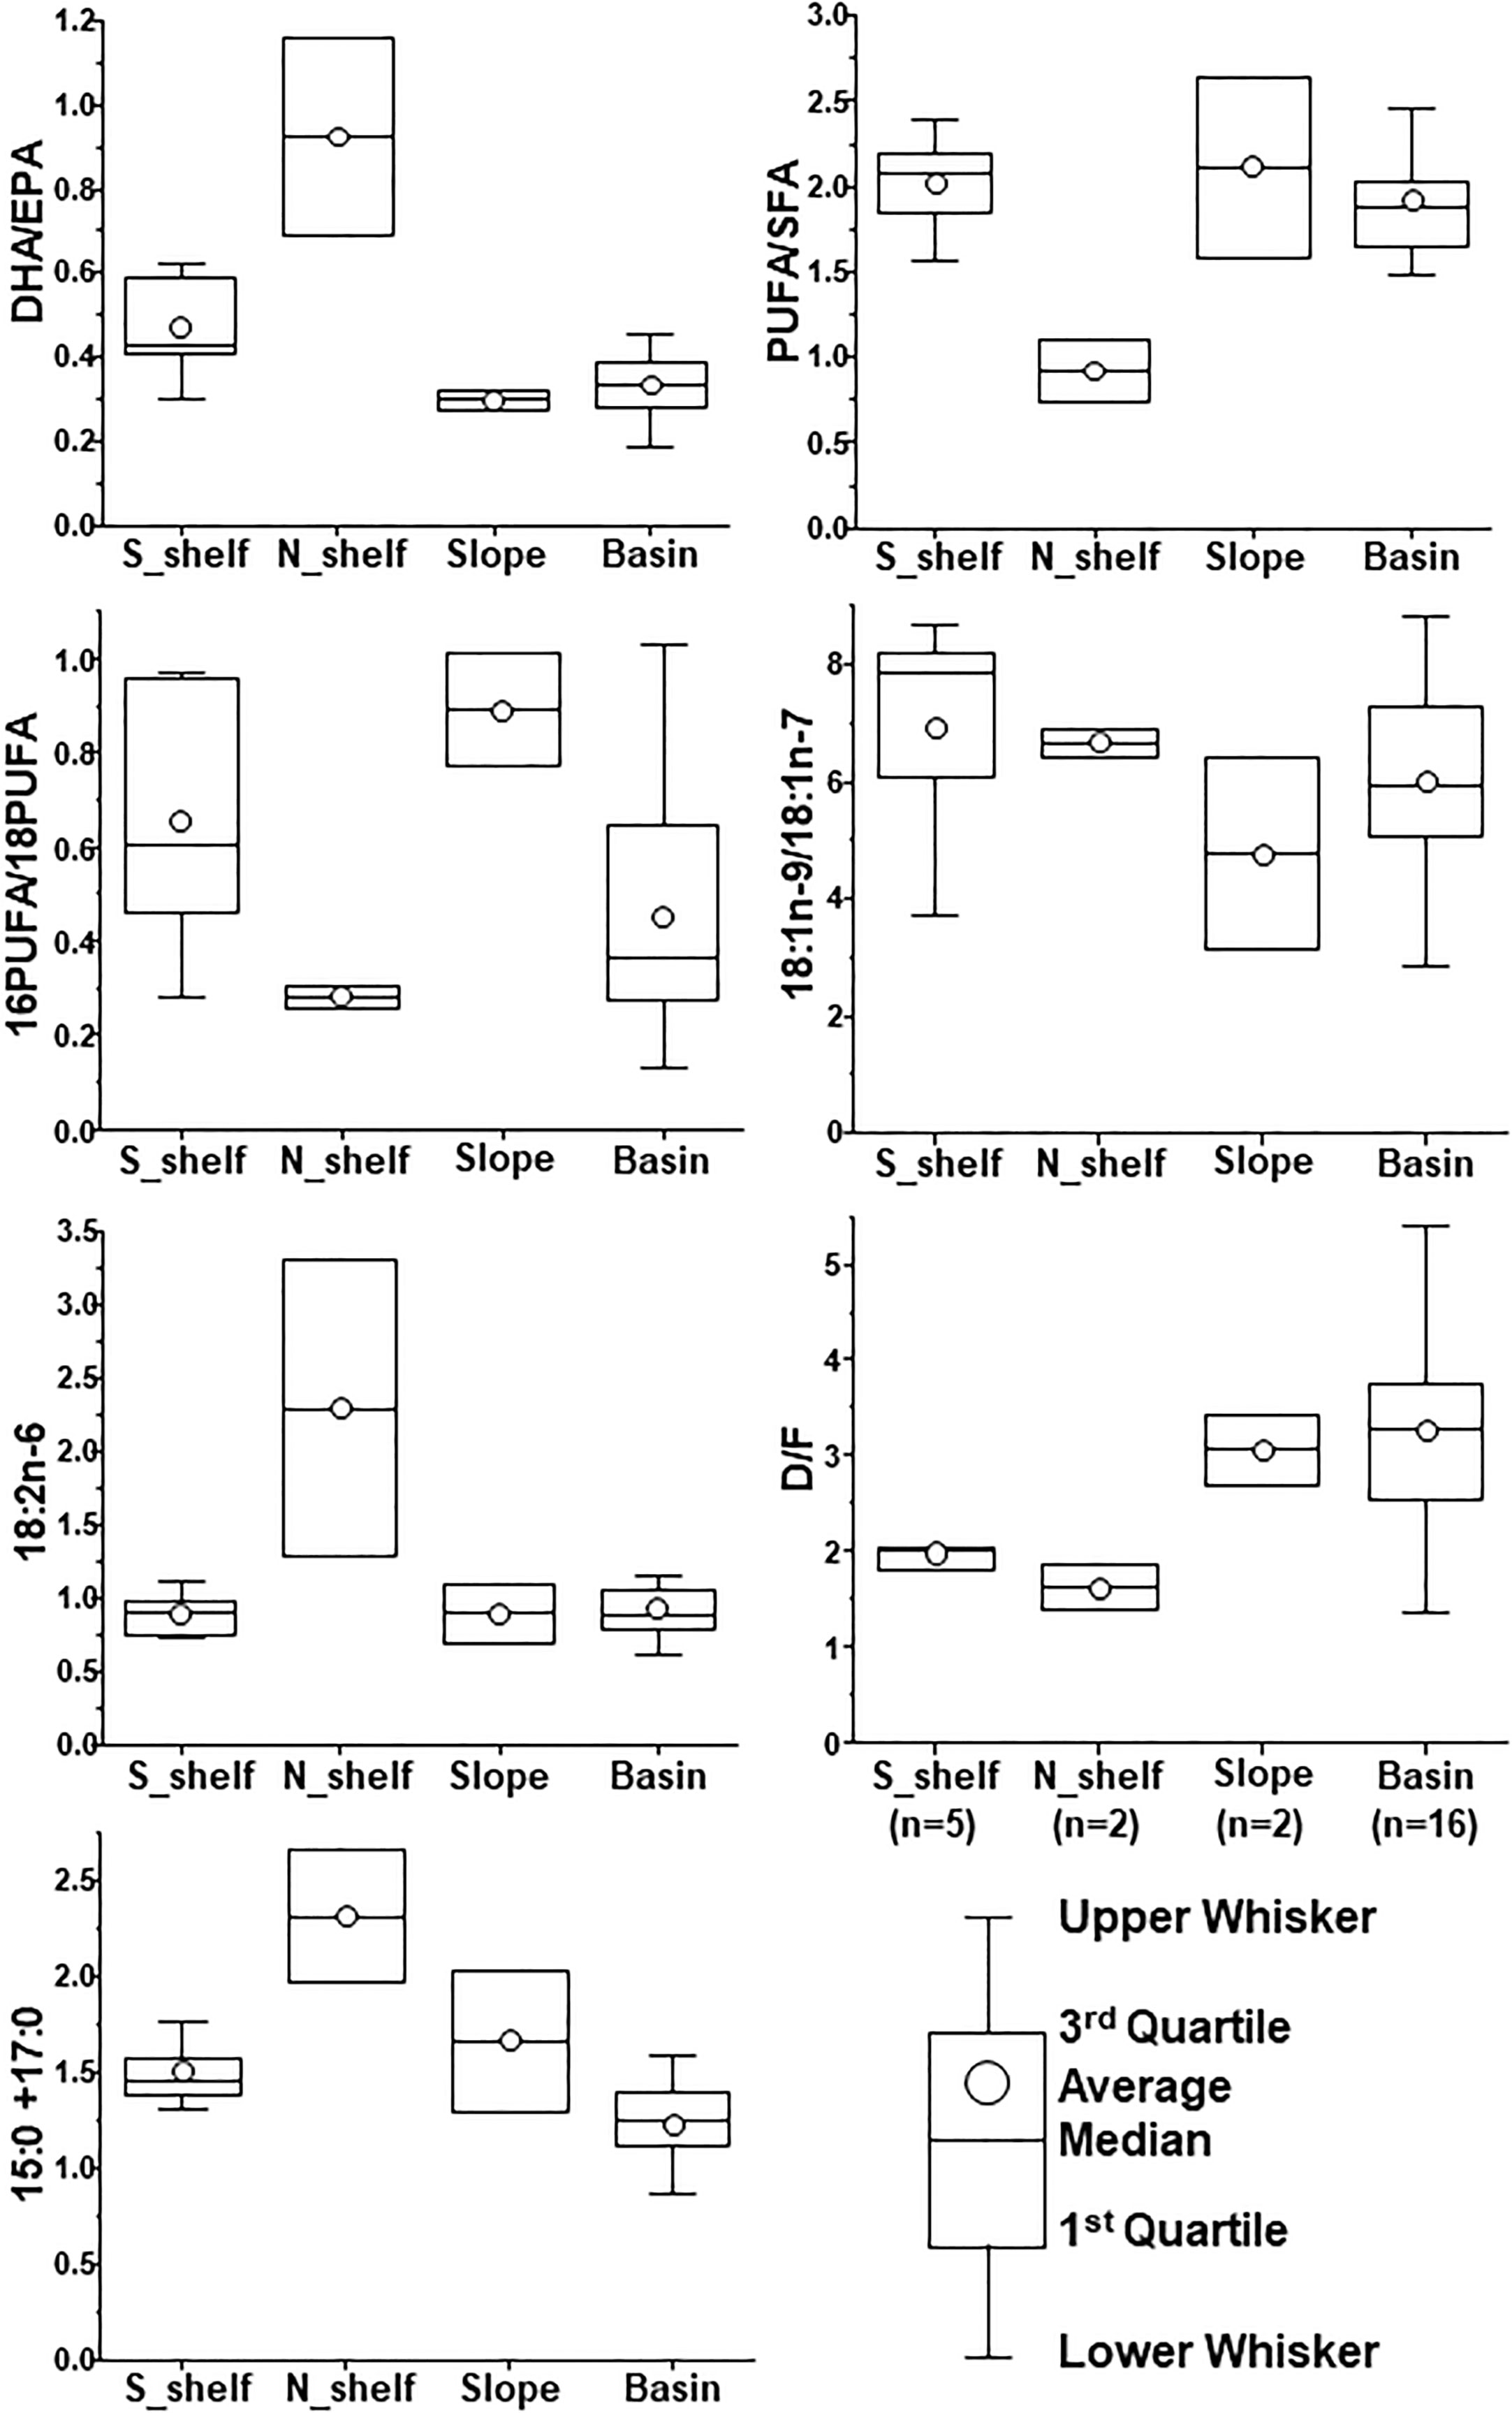
Figure 7 Regional comparison of biomarker indices in fatty acids of C5 Calanus. glacialis/marshallae in the Pacific sector of the Arctic Ocean in October 2019. The x-axis labels indicate groups identified via cluster analysis (cf. Figure 2A).
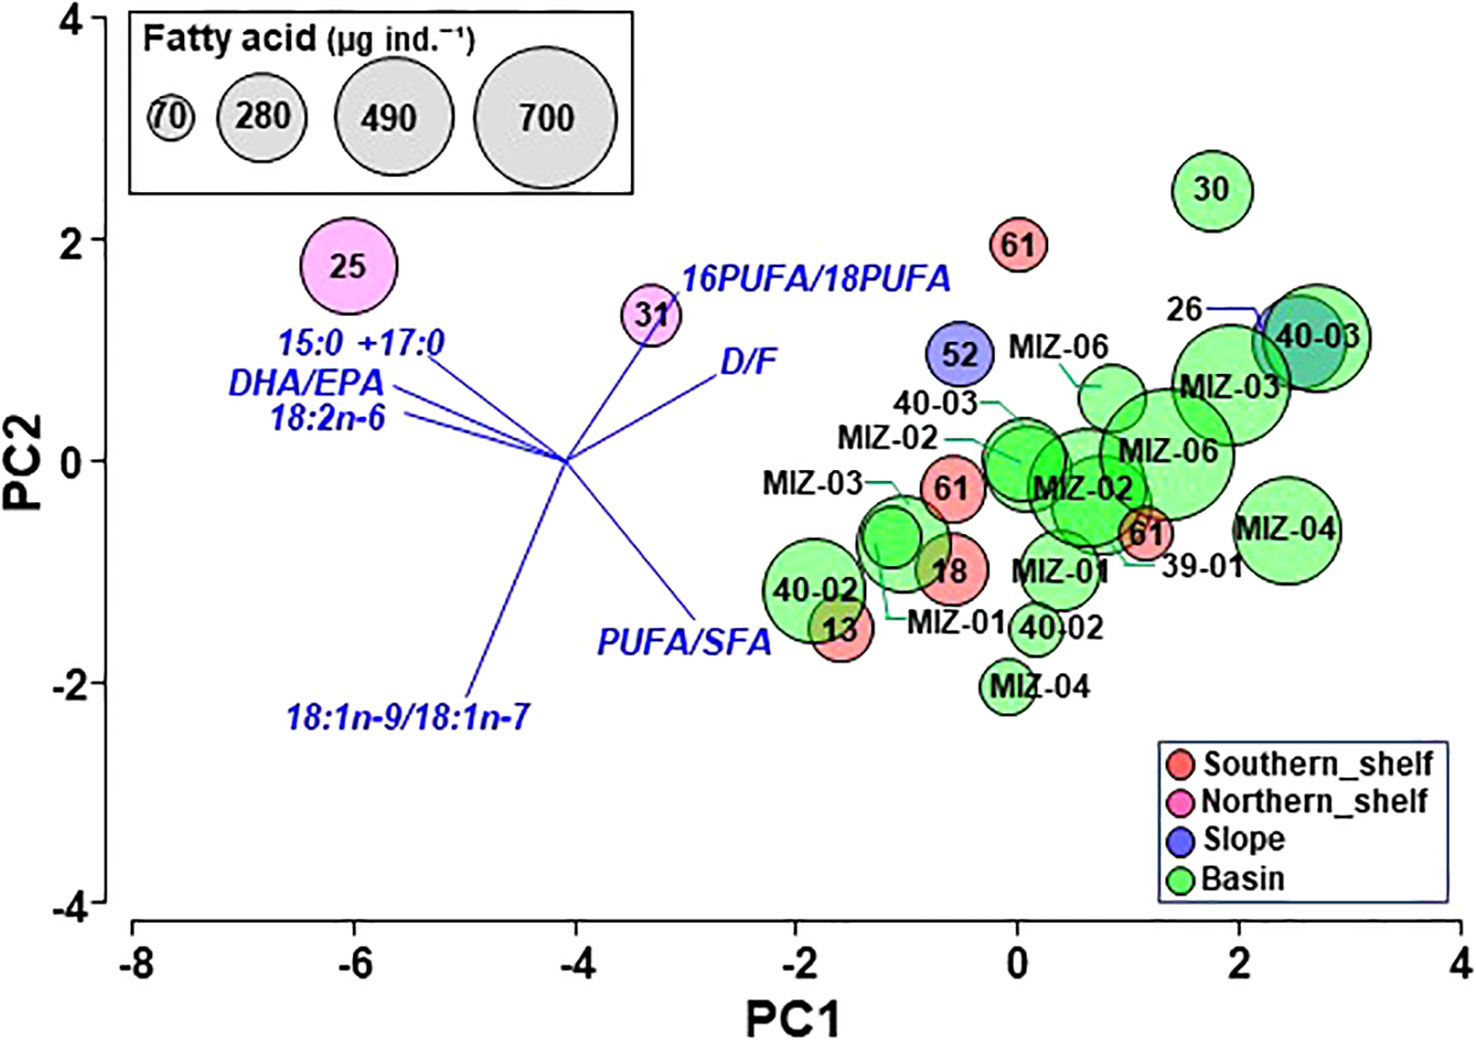
Figure 8 PCA based on biomarker indices in fatty acids of C5 Calanus glacialis/marshallae in the Pacific sector of the Arctic Ocean in October 2019. The size of the circle indicates the fatty acid content per individual.
In the basin, small (2.5–3.3 mm in PL) and large (3.4–3.8 mm in PL) forms occurred simultaneously (Figure 9). The cut off criteria between the forms is a length of 3.3 mm. Both small and large specimens were found in all 11 samples during October 21–24. The gut pigment showed a distinct diel pattern in the small forms, with high values during the night but low values during the daytime. However, the large forms did not exhibit a diel grazing activity pattern. The fatty acid indices were not significantly different between the small and large forms (data not shown).
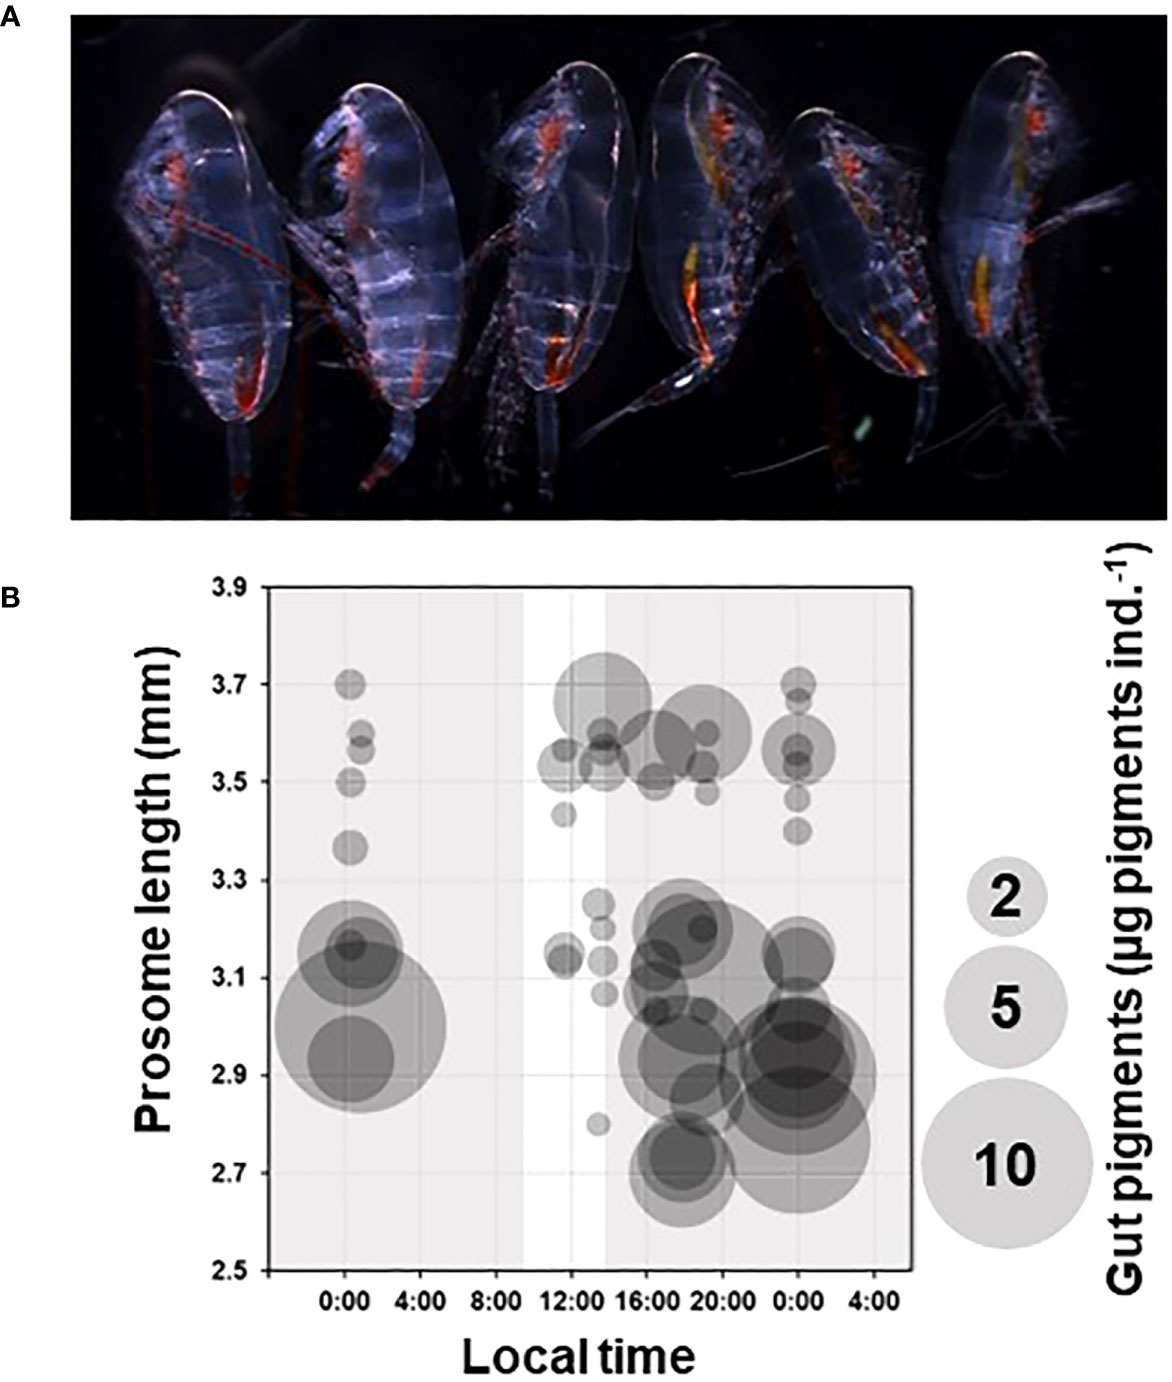
Figure 9 (A) Lateral view of small and large specimens taken at St. MIZ-07 (cf. Supplementary Table 1). The three on the right-hand side were small with rich gut pigments; the three specimens on the left-hand side were large with minimal gut pigment. (B) Comparison between grazing activity of small and large specimens in the basin region (cf. Figures 1, 2A) during October 21–24, 2023 (Supplementary Table 1). The local time is Alaska Standard Time (UTC: 9 h). The area of the circle represents the amount of gut pigment (µg pigments ind.-1). The gray and white backgrounds represent nighttime and daytime, respectively. The prosome length was determined from the mean value of two-five specimens used in the gut pigment analysis (cf. Methods and Materials).
4 Discussion
4.1 Geographical variation in body size
The body size of copepods varies with the environment (temperature and food concentration; Deevey, 1960; Viitasalo et al., 1995; Kobari et al., 2003). In the Chukchi Sea in 2004, 2009, and 2012, the body size of C. glacialis C5 was found to be negatively correlated with temperature (Ershova et al., 2015). Similar results were detected in our study for the Chukchi Sea and Arctic Basin.
In the pan-Arctic Ocean, the size range of the PL of species from each region has been well reported: 2.9–3.8 mm in Kandalaksha Bay and the White Sea (Kosobokova, 1999), 2.55–3.55 mm near the Svalbard Islands (Choquet et al., 2018), 2.8–4.0 mm in Disko Bay (Nielsen et al., 2014), 2.4–3.6 mm in Kongsfjorden (Gabrielsen et al., 2012), and 2.4–3.7 mm in the Canadian Arctic and on the Atlantic coasts (Parent et al., 2011). Compared to those reports from other regions, the PL size range in our study (2.4–3.8 mm) was one of the largest, and this was because the border of the sampling region was situated in the Pacific sector of the Arctic Ocean. The body size of C5 in the Canada Basin in October 1997 was reported as 3.38 ± 0.03 mm (Ashjian et al., 2003), which is similar to our results (basin: 3.34 ± 0.23 mm; slope: 3.24 ± 0.26 mm; Beaufort Sea: 3.46 ± 0.20 mm). However, smaller body sizes were observed on the southern and northern shelves in our study (2.91 ± 0.21 mm, and 3.11 ± 0.15 mm, respectively). It is considered that the co-occurrence of Calanus marshallae, which is slightly smaller than C. glacialis is (Frost, 1974), may decrease the mean body size in both these regions.
Two C. glacialis haplotypes exist in the study area: Bering Sea and Arctic Basin populations (Nelson et al., 2009). The Bering Sea population extends from the Bering Strait to the northern Chukchi Sea owing to the inflow of Pacific Ocean water (Nelson et al., 2009; Ashjian et al., 2021). The inflow of Pacific water usually peaks from August to October (Woodgate, 2018) and is mainly composed of wSW (Danielson et al., 2020). As individuals in the Bering Sea population experience warmer conditions than do those in the Arctic Basin population, it is considered that the Bering Sea population would be smaller than would the Arctic Basin population be. However, a haplotype analysis could not be conducted in this study because ethanol samples were consumed for another scientific work, and the difference in the PL between the Bering Sea and Arctic Basin populations, therefore, remains unclear.
4.2 Reproduction and growth
Calanus glacialis is believed to undergo capital and income breeding depending on the food conditions (Plourde et al., 2005; Daase et al., 2013). Although our sampling was conducted in autumn, and our results do not, therefore, contain evidence of reproduction, the timing of reproduction in spring was back-calculated using the developmental time and embryonic duration (Corkett et al., 1986) (see Supplementary Figure 3, Supplementary Table 3). This type of back-calculation helps to remove the sampling time gap among regions (Kimura et al., 2022). The estimation showed that almost all individuals had been spawned in July and August.
In the Pacific sector of the Arctic Ocean, peaks in phytoplankton blooms have been observed during May in the Chukchi Sea, and in June and July in the Siberian and Beaufort Seas (Arrigo and van Dijken, 2011). In relation to this seasonality, early stages (C1 and C2) dominate within the southern Chukchi Sea (Ashjian et al., 2021). However, there was a timing gap between the phytoplankton blooms (May–July) and our estimated reproduction period (July–August), which could have been caused by the shorter development time for the back-calculation of reproduction timing (Supplementary Table 3). The developmental time was assessed using the temperature from our sampling period (October); however, they survived in colder conditions (Spring and Summer). Since warmer temperature induce shorter development time (Corkett et al., 1986), therefore, the estimated development time was shorter than the in-situ value. Another hypothesis is that northward currents flushed out individuals during May–July, and individuals transported from the Bering Sea could not be established in the Chukchi Sea because of their short flushing time (Ashjian et al., 2021).
Timing of phytoplankton blooms shifts from south to north in the Pacific Arctic Ocean (Arrigo and van Dijken, 2011), subsequent reproduction of C. glacialis is expected to be associated with that. However, interestingly, it was suggested that the earliest reproduction period occurred in June in the basin region. This was potentially caused by the longer residence time of C5 than that of the other stages: the developmental time from nauplius three to copepodite five is almost similar for each molting, but the period from C5 to molt adults is longer (Peterson, 1986). Alternatively, it is possible that another previous generation survived because of the low metabolic rate at cold temperatures and the low grazing pressure by fish (Mundy et al., 2017; Skjoldal, 2022).
4.3 Southern shelf
In early October, the entire water column was occupied by wSW, but the surface layer (0–20 m) changed to cSW in late October, possibly due to cooling by low air temperature, as other shelf water masses (e.g., AnW and wCW) were not observed. Regarding the population structure, C5 was predominant in early October, whereas adults were predominant in late October. Based on these results, the population of C. glacialis appeared to grow, with some adults developing in late October. Incubation experiments revealed that 50% of C. glacialis individuals develop from C5 to adulthood in 20 days at 10°C (Peterson, 1986). In our development time estimation based on Corkett et al. (1986), it would take 10 days to undergo this process at 10°C and 20 days at 3°C (Supplementary Figure 3); therefore, it was not surprising that some adults were observed in October. A high abundance of adult females was observed in the Arctic Basin in February, but only a few such individuals were found throughout the year (Ashjian et al., 2003). During its life cycle, C. glacialis is capable of diapause from C4 and C5 when it descends into the deep sea, and rich lipids are stored in its body during autumn and winter (Lane et al., 2008; Ershova et al., 2015; Pinchuk and Eisner, 2017). Because a sufficient depth (> 200 m) is required for the diapause of this species (Hirche, 1991; Ashjian et al., 2003), the shallow bottom depth (approximately 50 m; Nelson et al., 2009; Ershova et al., 2015) and short residence time within the Chukchi Sea (Ashjian et al., 2021) imply that the population cannot be sustained/established.
The northward transportation of Pacific zooplankton has been reported in the Pacific Arctic Ocean during warm years (Matsuno et al., 2011; Ershova et al., 2015). Calanus marshallae, which was originally distributed in the Northern California Current system to the coastal Gulf of Alaska and the Bering Sea (Frost, 1974), should be included within the Pacific species; however, many studies have not distinguished it from C. glacialis owing to the morphological similarities between the species. Genetic approaches have shown that C. marshallae is present in the Chukchi Sea during the summer (Nelson et al., 2009 and Ashjian et al., 2021). In addition, the northward flow at the Bering Strait is increasing (0.01 Sv per year), and residence time in the Chukchi Sea has decreased by ~1.5 months (from 7.5 months to ~ 5 months) based on mooring results from 1990 to 2019 (Woodgate and Peralta-Ferriz, 2021), which subsequentially extend C. marshallae distribution. Therefore, the inflow of C. marshallae potentially distorts any changes identified in the C. glacialis population, especially in the shelf region during warm years. Genetic analyses are therefore required to avoid this distortion.
4.4 Northern shelf
The population structure of this area mainly comprises C4 and C5 C. glacialis. Assuming that this population on the shelf originates from water masses similar to those on the southern shelf (wSW and cSW) that occupy more than half of the water column, the population on the northern shelf (i.e., C4 and C5) is younger than that on the southern shelf (C5). This may be attributed to the shorter intermolt period at warmer temperatures (Corkett and McLaren, 1978; Supplementary Table 3). The effect of temperature on copepod growth has also been observed during warm and cold years in the Chukchi Sea (Matsuno et al., 2011).
High variability in hydrography and water masses was observed in this study, and the fatty acid composition of the specimens collected on the northern shelf was lower in terms of 16 PUFA/18PUFA, PUFA/SFA, D, and F than that of specimens from other areas. The fatty acid composition is a valuable index for prey records because the composition of predators reflects that of their prey (El-Sabaawi et al., 2009). This result implies that individuals on the northern shelf do not actively utilize diatoms or protozoans (Stevens et al., 2004a; Stevens et al., 2004b). In contrast, higher values of DHA/EPA, 18:2n-6, and 15:0 + 17:0 were observed in specimens on the northern shelf than in those from other areas. Docosahexaenoic acid is abundant in dinoflagellates, and EPA is abundant in diatoms (Budge and Parrish, 1998), and the high DHA/EPA ratio, therefore, suggests that this species grazes mostly on dinoflagellates within this area. However, this feature is considered to be rare in the Arctic Ocean compared with that in the well-studied Atlantic Arctic Ocean. A survey in the southern shelf area west of Spitsbergen in July 2018 showed a DHA/EPA of 0.67 (Trudnowska et al., 2020), which is lower than that observed in our study (0.92). In addition, a DHA/EPA value of 0.21 was observed in Kongsfjord in the Atlantic Arctic Ocean during autumn in 1997 (Falk-Petersen et al., 2009), 0.15 in the Fram Strait during autumn in 2003 (Søreide et al., 2008), and 0.22 in Northwater during the autumn of 1999 (Stevens et al., 2004a). It is evident that this species can change its diet depending on the time and location (Banas et al., 2016), and the results here show that the species on the northern shelf in the study area are highly dependent on dinoflagellates.
Considering the energy flow in lower ecosystems, eutrophic conditions induce the dominance of diatoms because their growth is rapid from ingesting rich nutrients; however, oligotrophic conditions stimulate microbial loop production (Pomeroy, 1974). In the oligotrophic state, bacteria act as primary producers using dissolved organic carbon, and several predator-prey interactions (bacteria vs. heterotrophic nanoflagellates, heterotrophic nanoflagellates vs. small ciliates) occur, reaching their production into heterotrophic dinoflagellates (Jakobsen and Hansen, 1997; Levinsen and Nielsen, 2002). Therefore, the number of transfers between trophic levels is much greater under oligotrophic conditions, resulting in a low transfer efficiency. This suggests that the Calanus glacialis can survive in a low-productivity ecosystem. In addition, although a high 18:2n-6 value indicates that the species grazes on green algae of a terrestrial origin (Dalsgaard et al., 2003), there have been no reports on the feeding on green algae by this species in the ocean; therefore, further research is required.
4.5 Slope
The highest abundance was observed on the slope, and these results are consistent with those obtained during studies conducted in August (Lane et al., 2008; Llinás et al., 2009) and September (Ershova et al., 2021). In this area, easterly winds stimulate upwelling along the shelf-break (Pickart et al., 2013), resulting in the occasional transport of diapause individuals (mainly C4 and C5) from the deep sea to the surface (Lane et al., 2008; Llinás et al., 2009). AtlW and BBW were only observed in this region below depths of 100 m or 125 m, which suggests the presence of upwelling (Carmack and Kulikov, 1998). A higher abundance was therefore observed on the slope because of the presence of individuals derived from the deep sea via upwelling (Pickart et al., 2013; Rutzen and Hopcroft, 2018). Another mechanism that increases abundance is anti-cyclonic, cold-core eddy formation from the boundary current flowing along the Chukchi Shelf (Pickart et al., 2005; Llinás et al., 2009). Although the accumulation of zooplankton by eddies is not very strong (Llinás et al., 2009), the formation rate of eddies is very high, with up to 1–2 eddies per day from early spring to early autumn (Pickart et al., 2005). As previously mentioned, although shelf populations are flushed out into the basin (Ashjian et al., 2021), a high abundance is frequently observed in this region, and this could potentially be related to the increased eddy formation rate.
The population structure derived in our study is considered to reflect population growth, and this has also been determined in other studies. In August, early stages (C1 and C2) are abundant (Lane et al., 2008), C1–C4 are dominant in September (Ershova et al., 2021), and C3–C5 are dominant in October (this study). The abundance alters between months, and it decreases from August (mean 18,910 ind. m-2, Llinás et al., 2009) and September (mean 8,000 ind. m-2, Ershova et al., 2021) to October (1,855-2,968 ind. m-2). It is of note that all the abundance data were based on the samples collected using the 150 µm mesh. Assuming the mortality rate for broadcast spawner based on field measurements (Hirst and Kiørboe, 2002), a value of 0.0335 d-1 was calculated at 0.27°C (Supplementary Table 3). Using this rate, the abundance in October was expected to be 2,448 ind. m-2 (=18,910 ind. m-2×(1-0.035)^(60 days)) from August and 2,878 ind. m-2 (=8,000 ind. m-2×(1-0.035)^(30 days)) from September. Predation mortality is independent of ambient temperature, and the ratio of predation mortality to total mortality increases to 3:4 in colder situations (Hirst and Kiørboe, 2002). This indicates that the decrease in abundance on the slope was mainly caused by predator feeding. A large biomass of polar cod has been observed in Atlantic Water along the slope (Crawford et al., 2012). Therefore, the high biomass of C. glacialis is due to physical processes, and the rich prey is grazed on by organisms in the higher trophic levels, such as fish, birds, and marine mammals (Dickson and Gilchrist, 2002; Bengtson et al., 2005; Crawford et al., 2012).
With respect to the fatty acid composition, this region had the lowest DHA/EPA ratio and the highest 16PUFA/18PUFA ratio among the four regions, which indicates that individuals in this area consume more diatoms than do dinoflagellates and flagellates. This area is prone to upwelling (Pickart et al., 2013), which supplies rich nutrients from deeper layers to the euphotic layer (Pickart et al., 2013; Rutzen and Hopcroft, 2018). Consequently, silicate concentrations in the northern Chukchi Sea increase, providing a suitable environment for diatom growth (Hill and Cota, 2005; Nishino et al., 2015). Therefore, geographical and physical features (i.e., upwelling) affect the C. glacialis population, and lipid accumulation relates to diatom grazing on the slope.
4.6 Basin
Based on the environmental data, Sts. 30, 34, and 35 were located in the basin, and the population structures at these stations differed considerably from those of the other stations on the Chukchi Plateau. This may be due to the transportation of shelf individuals by cSW inflow to depths of 50–100 m (Lane et al., 2008; Llinás et al., 2009). Previous studies found that the C5 stage dominates the basin population in autumn (Ashjian et al., 2003; Hopcroft et al., 2005). However, in our study, C5 was not abundant. The early copepodite stages (C1 or C2) occurred at 80% of the basin stations, and the maximum population percentage composition was 44%. Similar results, such as the occurrence of early stages on the surface of the basin, have been reported in late summer (Hopcroft et al., 2005) and winter (Ashjian et al., 2003). However, the composition of the early stage was lower than 10% because this species is capable of diapause after C4 (Falk-Petersen et al., 2009; Daase et al., 2013), and it is likely that C1 and C2 cannot overwinter in the basin because of their short growth periods (Ji et al., 2012).
With respect to the population origin of the early stages, adult females were observed at some stations in the basin, but all specimens were immature. However, according to the developmental time (Supplementary Table 3), the early stages were spawned in August, and C5 was spawned in late June. This shows that long-term reproduction is supported by mixed reproductive strategies (Plourde et al., 2005; Daase et al., 2013). Primary production on the Chukchi Plateau is very low (Codispoti et al., 2013), but the region is greatly affected by the inflow of Pacific Summer Water (PSW), which transports heat and organisms via eddies (Watanabe et al., 2014; Muramatsu et al., 2021). The composition of PSW in the basin has increased in recent years compared to that during the 1990s and the 2000s (Bourgain and Gascard, 2012; Muramatsu et al., 2021). Therefore, more organisms are transported by PSW with eddies (Watanabe et al., 2014), and this extends the reproduction period of the species. Potentially due to the extended reproduction period, the early stages eventually become more abundant than those in the results of Ashjian et al. (2003) and Hopcroft et al. (2005). Field measurements of longevity have shown that adults are quickly removed 16 days after reproduction (Hirst and Kiørboe, 2002). These assumptions suggest that adult females reproduce over the long term using transported organisms (e.g., phytoplankton), then that are removed after reproduction. Similarly, overwintering individuals reproduce in the Chukchi Sea following sea ice retreat, and the early stages are transported to the basin (Ashjian et al., 2021). However, no genetic evidence is available to support this hypothesis, and a haplotype analysis of the early stages is required to reveal the extended distribution and establishment of the Bering Sea population in the basin (Ershova et al., 2021; Skjoldal, 2022),
Small and large forms co-occur on the Chukchi Plateau. On the Atlantic side of the Arctic Ocean, it is difficult to distinguish between C. glacialis and the smaller Calanus finmarchicus (Grainger, 1961). Choquet et al. (2018) investigated the possibility of identifying species based on PL, morphological characteristics (the 5th pair of swimming legs and mandible), antennules, genital somite pigmentation in live specimens, and genetic analyses. The represented PL helps to approximate the species composition, but no criteria for the species have been established; therefore, their size ranges overlap (Choquet et al., 2018). In our case, the small forms (2.5–3.3 mm) in C5 could be included as C. finmarchicus (Choquet et al., 2018), but this result was impossible to clarify because of a lack of genetic analysis.
An inter-form difference in the diel patterns of grazing activity was observed. Small forms show higher gut pigment levels at night than during the day, which is associated with diel vertical migration (DVM) (Conover and Huntley, 1991). The magnitude of DVM for Calanus spp. varies with season and copepodid stage, and the DVM intensity is greater during spring and autumn, when the diel changes in light penetration are large (Falkenhaug et al., 1997). During spring, C. glacialis responds sensibly to phytoplankton dynamics via DVM, reaching sea ice and exhibiting diel patterns in grazing activity (Runge and Ingram, 1991). In September, in the northern Chukchi Sea, diel changes in gut pigments have been reported during small autumn phytoplankton blooms (Matsuno et al., 2015). In contrast, DVM and active grazing ceases during the night for Calanus spp., as determined by the lipids accumulated in C5 (Falk-Petersen et al., 2008; Matsuno et al., 2015). Based on this knowledge, it is hypothesized that the small forms perform DVM and graze at night, while the large forms cease DVM and active grazing and stay in the deep layer. Although our sampling design could not corroborate this hypothesis, both forms were distributed within depths of 0–150 m due to their co-occurrence during the day and night (Falk-Petersen et al., 2008).
5 Conclusions
This study describes geographic variations in the population structure, body size, fatty acid composition, and diel changes in the grazing activity of C. glacialis/marshallae in the Pacific region of the Arctic Ocean during autumn. The body size of this species was found to be negatively correlated with the water temperature from the Chukchi Sea to the Arctic basin. The population developed from C5 was dominant on the southern shelf, and it was mostly transported from the Bering Sea. C4 and C5 were dominant on the northern shelf, suggesting that their growth was slower than the growth of those on the southern shelf. The fatty acid composition revealed that the rate of prey dependence on dinoflagellates was exceptionally high in the Arctic Ocean, indicating that the species existed in a low-productivity ecosystem. The highest abundance and composition of diatom-derived EPA among the fatty acids were found on the slope. This could be explained by the upwelling accompanying the inflow of this species from the deep sea, and the nutrient supply for the growth of diatoms. In the basin, early-stage individuals were more abundant than those reported in previous studies because a larger number of organisms had flowed into the region, resulting in extended reproduction. Small and large C5 forms were found, showing the different diel patterns of grazing activity. It appears that C. glacialis/marshallae have adapted to the flexibility in their life cycle caused by changes in the physical and chemical environments of the Pacific Arctic Ocean. However, vertically stratified sampling and haplotype analyses are required to monitor their biological features and reveal population origins.
Data availability statement
The original contributions presented in the study are included in the article/Supplementary Material. Further inquiries can be directed to the corresponding author.
Ethics statement
The manuscript presents research on animals that do not require ethical approval for their study.
Author contributions
KM and AY designed the study. KT, KM, and KS performed field sampling. MI, KT, and YA analyzed the samples. MI and KM analyzed the data and MI and KM wrote the paper with contributions from all authors.
Funding
This work was funded by the Arctic Challenge for Sustainability (ArCS; Program Grant Number JPMXD1300000000) and Arctic Challenge for Sustainability II (ArCS II; program grant number JPMXD1420318865) projects. This study was also supported by the Environment Research and Technology Development Fund (JPMEERF20214002) of the Environmental Restoration and Conservation Agency of Japan and partially supported by the Japan Society for the Promotion of Science (JSPS) KAKENHI (grant numbers JP22H00374 (A), JP21H02263 (B), JP20K20573 (Pioneering), JP20H03054 (B), JP20J20410 (B), JP19H03037 (B), JP18K14506 (Early Career Scientists), and JPJSBP120238801 (Bilateral program)).
Acknowledgments
We thank the captain, officers, crew, and researchers onboard the R/V Mirai, the Canadian Coast Guard RV Amundsen, and IB S.W. Laurier for their outstanding efforts during field sampling.
Conflict of interest
The authors declare that the research was conducted in the absence of any commercial or financial relationships that could be construed as a potential conflict of interest.
Publisher’s note
All claims expressed in this article are solely those of the authors and do not necessarily represent those of their affiliated organizations, or those of the publisher, the editors and the reviewers. Any product that may be evaluated in this article, or claim that may be made by its manufacturer, is not guaranteed or endorsed by the publisher.
Supplementary material
The Supplementary Material for this article can be found online at: https://www.frontiersin.org/articles/10.3389/fmars.2023.1168015/full#supplementary-material
References
Alfaro A. C., Thomas F., Sergent L., Duxbury M. (2006). Identification of trophic interactions within an estuarine food web (northern New Zealand) using fatty acid biomarkers and stable isotopes. Estuar. Coast. Shelf. Sci. 70, 271–286. doi: 10.1016/j.ecss.2006.06.017
Arrigo K. R., van Dijken G. L. (2011). Secular trends in Arctic Ocean net primary production. J. Geophys. Res. 116, C09011. doi: 10.1029/2011JC007151
Ashjian C. J., Campbell R. G., Gelfman C., Alatalo P., Elliott S. M. (2017). Mesozooplankton abundance and distribution in association with hydrography in the Hanna Shoal on Hanna Shoal, NE Chukchi Sea, during August 2012 and 2013. Deep. Sea. Res. II. 144, 21–36. doi: 10.1016/j.dsr2.2017.08.012
Ashjian C. J., Campbell R. G., Welch H. E., Butler M., Van Keuren D. (2003). Annual cycle in abundance, distribution, and size in relation to hydrography of important copepod species in the western Arctic Ocean. Deep. Sea. Res. I. 50, 1235–1261. doi: 10.1016/S0967-0637(03)00129-8
Ashjian C. J., Pickart R. S., Campbell R. G., Feng Z., Gelfman C., Alatalo P., et al. (2021). Springtime renewal of zooplankton populations in the Chukchi Sea. Prog. Oceanogr. 197, 102635. doi: 10.1016/j.pocean.2021.102635
Banas N. S., Møller E. F., Nielsen T. G., Eisner L. B. (2016). Copepod life strategy and population viability in response to prey timing and temperature: Testing a new model across latitude, time, and size spectrum. Front. Mar. Sci. 3. doi: 10.3389/fmars.2016.00225
Bengtson J. L., Hiruki-Raring L. M., Simpkins M. A., Boveng P. L. (2005). Ringed and bearded seal densities in the eastern Chukchi Sea (1999–2000. Polar. Biol. 28, 833–845. doi: 10.1007/s00300-005-0009-1
Bourgain P., Gascard J. C. (2012). The Atlantic and summer Pacific waters variability in the Arctic Ocean from 1997 to 2008. Geophys. Res. Lett. 39, L05603. doi: 10.1029/2012GL051045
Brodsky K. A. (1967). Calanoida of the far eastern seas and polar basin of the USSR. Keys. to Fauna. USSR. 35, 1–442.
Budge S. M., Parrish C. C. (1998). Lipid biogeochemistry of plankton, settling matter and sediments in Trinity Bay, Newfoundland. II. Fatty acids. Org. Geochem. 29, 1547–1559. doi: 10.1016/S0146-6380(98)00177-6
Campbell R. G., Sherr E. B., Ashjian C. J., Plourde S., Sherr B. F., Hill V., et al. (2009). Mesozooplankton prey preferences and grazing impact in the western Arctic Ocean. Deep. Sea. Res. II. 56, 1274–1289. doi: 10.1016/j.dsr2.2008.10.027
Carmack E. C., Kulikov E. A. (1998). Wind-forced upwelling and internal Kelvin wave generation in Mackenzie Canyon, Beaufort Sea. J. Geophys. Res. 103, 18447–18458. doi: 10.1029/98JC00113
Choquet M., Kosobokova K. N., Kwaśniewski S., Hatlebakk M., Dhanasiri A. K. S., Melle W., et al. (2018). Can morphology reliably distinguish between the copepods Calanus finmarchicus and C. glacialis, or is DNA the only way? Limnol. Oceanogr. Methods 16, 237–252. doi: 10.1002/lom3.10240
Codispoti L. A., Kelly V., Thessen A., Matrai P., Suttles S., Hill V., et al. (2013). Synthesis of primary production in the Arctic Ocean: III. Nitrate and phosphate based estimates of the net community production. Prog. Oceanogr. 110, 126–150. doi: 10.1016/j.pocean.2012.11.006
Conover R. J. (1988). Comparative life histories in the genera Calanus and Neocalanus in high latitudes of the northern hemisphere. Hydrobiologia 167–168, 127–142. doi: 10.1007/BF00026299
Conover R. J., Huntley M. (1991). Copepods in ice-covered seas—Distribution, adaptations to seasonally limited food, metabolism, growth patterns and life cycle strategies in polar seas. J. Mar. Syst. 2, 1–41. doi: 10.1016/0924-7963(91)90011-I
Corkett C. J., McLaren I. A. (1978). The biology of Pseudocalanus. Adv. Mar. Biol. 15, 1–231. doi: 10.1016/S0065-2881(08)60404-6
Corkett C. J., McLaren I. A., Sevigny J.-M. (1986). Rearing of the marine Calanoid Copepods Calanus finmarchicus (Gunnerus), C. glacialis Jaschnov, and C. hyperboreus Kroyer with comments on the equiproportional rule. Syllogeus 58, 539–546.
Crawford R. E., Vagle S., Carmack E. C. (2012). Water mass and bathymetric characteristics of polar cod habitat along the continental shelf and slope of the Beaufort and Chukchi seas. Polar. Biol. 35, 179–190. doi: 10.1007/s00300-011-1051-9
Daase M., Falk-Petersen S., Varpe Ø., Darnis G., Søreide J. E., Wold A., et al. (2013). Timing of reproductive events in the marine copepod Calanus glacialis: A pan-Arctic perspective. Can. J. Fish. Aquat. Sci. 70, 871–884. doi: 10.1139/cjfas-2012-0401
Dalsgaard J., St John M., Kattner G., Müller-Navarra D., Hagen W. (2003). Fatty acid trophic markers in the pelagic marine environment. Adv. Mar. Biol. 46, 225–340. doi: 10.1016/s0065-2881(03)46005-7
Danielson S. L., Ahkinga O., Ashjian C., Basyuk E., Cooper L. W., Eisner L., et al. (2020). Manifestation and consequences of warming and altered heat fluxes over the Bering and Chukchi Sea continental shelves. Deep. Sea. Res. II. 177, 104781. doi: 10.1016/j.dsr2.2020.104781
Deevey G. B. (1960). Relative effects of temperature and food on seasonal variations in the lengths of marine copepods in eastern American and Western European waters. Bull. Bing. Oceanogr. Coll. 17, 54–86.
Dickson D. L., Gilchrist H. G. (2002). Status of marine birds of the southeastern Beaufort Sea. Arctic 55, 46–58. doi: 10.14430/arctic734
Digby P. S. B. (1954). Biology of marine planktonic copepods of Scores by Sound, east Greenland. J. Anim. Ecol. 23, 298–338. doi: 10.2307/1984
El-Sabaawi R., Dower J. F., Kainz M., Mazumder A. (2009). Characterizing dietary variability and trophic positions of coastal calanoid copepods: Insight from stable isotopes and fatty acids. Mar. Biol. 156, 225–237. doi: 10.1007/s00227-008-1073-1
Ershova E. A., Hopcroft R. R., Kosobokova K. N. (2015). Inter-annual variability of summer mesozooplankton communities of the western Chukchi Sea: 2004–2012. Polar. Biol. 38, 1461–1481. doi: 10.1007/s00300-015-1709-9
Ershova E. A., Kosobokova K. N., Banas N. S., Ellingsen I., Niehoff B., Hildebrandt N., et al. (2021). Sea ice decline drives biogeographical shifts of key Calanus species in the central Arctic Ocean. Glob. Change Biol. 27, 2128–2143. doi: 10.1111/gcb.15562
Falkenhaug T., Tande K. S., Semenova T. (1997). Diel, seasonal and ontogenetic variations in the vertical distribution of four marine copepods. Mar. Ecol. Prog. Ser. 149, 105–119. doi: 10.3354/meps149105
Falk-Petersen S., Leu E., Berge J., Kwasniewski S., Nygård H., Røstad A., et al. (2008). Vertical migration in high Arctic waters during autumn 2004. Deep. Sea. Res. II. 55, 2275–2284. doi: 10.1016/j.dsr2.2008.05.010
Falk-Petersen S., Mayzaud P., Kattner G., Sargent J. R. (2009). Lipids and life strategy of Arctic Calanus. Mar. Biol. Res. 5, 18–39. doi: 10.1080/17451000802512267
Freese D., Søreide J. E., Niehoff B. (2016). A year-round study on digestive enzymes in the Arctic copepod Calanus glacialis: Implications for its capability to adjust to changing environmental conditions. Polar. Biol. 39, 2241–2252. doi: 10.1007/s00300-016-1891-4
Frost B. W. (1974). Calanus marshallae, a new species of calanoid copepod closely aligned to the sibling species C. finmarchicus and C. glacialis. Mar. Biol. 26, 77–99. doi: 10.1007/BF00389089
Gabrielsen T. M., Merkel B., Søreide J. E., Johansson-Karlsson E., Bailey A., Vogedes D., et al. (2012). Potential misidentifications of two climate indicator species of the marine arctic ecosystem: Calanus glacialis and C. finmarchicus. Polar. Biol. 35, 1621–1628. doi: 10.1007/s00300-012-1202-7
Grainger E. H. (1961). The copepods Calanus glacial is Jaschnov and Calanus finmarchicus (Gunnerus) in Canadian Arctic-Subarctic Waters. J. Fish. Res. Board. Can. 18, 663–678. doi: 10.1139/f61-051
Grebmeier J. M., Cooper L. W., Feder H. M., Sirenko B. I. (2006). Ecosystem dynamics of the pacific-influenced northern bering and chukchi seas in the amerasian arctic. Prog. Oceanogr. 71, 331–361. doi: 10.1016/j.pocean.2006.10.001
Hama N., Abe Y., Matsuno K., Yamaguchi A. (2019). Effect of net mesh size on filtering efficiency and zooplankton sampling efficiency using quad-NORPAC net. Bull. Fish. Sci. Hokkaido. Univ. 69, 47–56. doi: 10.14943/bull.fish.69.1.47
Herberich E., Sikorski J., Hothorn T. (2010). A Robust procedure for comparing multiple means under heteroscedasticity in unbalanced designs. PloS One 5, e9788. doi: 10.1371/journal.pone.0009788
Hill V., Cota G. (2005). Spatial patterns of primary production on the shelf, slope and basin of the western Arctic in 2002. Deep. Sea. Res. II. 52, 3344–3354. doi: 10.1016/j.dsr2.2005.10.001
Hirche H.-J. (1991). Distribution of dominant calanoid copepod species in the Greenland Sea during late fall. Polar. Biol. 11, 351–362. doi: 10.1007/BF00239687
Hirst A. G., Kiørboe T. (2002). Mortality of marine planktonic copepods: Global rates and patterns. Mar. Ecol. Prog. Ser. 230, 195–209. doi: 10.3354/meps230195
Hopcroft R. R., Clarke C., Nelson R. J., Raskoff K. A. (2005). Zooplankton communities of the Arctic Canada Basin: The contribution by smaller taxa. Polar. Biol. 28, 198–206. doi: 10.1007/s00300-004-0680-7
Jakobsen H. H., Hansen P. J. (1997). Prey size selection, grazing and growth response of the small heterotrophic dinoflagellate Gymnodinium sp. and ciliate Balanion comatum: A comparative study. Mar. Ecol. Prog. Ser. 158, 75–86. doi: 10.3354/meps158075
Ji R., Ashjian C. J., Campbell R. G., Chen C., Gao G., Davis C. S., et al. (2012). Life history and biogeography of Calanus copepods in the Arctic Ocean: An individual-based modeling study. Prog. Oceanogr. 96, 40–56. doi: 10.1016/j.pocean.2011.10.001
Kaneda T. (1991). Iso- and anteiso-fatty acids in bacteria: Biosynthesis, function, and taxonomic significance. Microbiol. Rev. 55, 288–302. doi: 10.1128/mr.55.2.288-302.1991
Kimura F., Matsuno K., Abe Y., Yamaguchi A. (2022). Effects of early sea-ice reduction on zooplankton and copepod population structures in the Northern Bering Sea during the summers of 2017 and 2018. Front. Mar. Sci. 9. doi: 10.3389/fmars.2022.808910
Kobari T., Tadokoro K., Shiomoto A., Hashimoto S. (2003). Geographical variation in prosome length and body weight of Neocalanus copepods in the North Pacific. J. Oceanogr. 59, 3–10. doi: 10.1023/A:1022895802468
Kosobokova K. N. (1999). The reproductive cycle and life history of the Arctic copepod Calanus glacialis in the White Sea. Polar. Biol. 22, 254–263. doi: 10.1007/s003000050418
Kosobokova K. N., Hirche H.-J. (2009). Biomass of zooplankton in the eastern Arctic Ocean: A baseline study. Prog. Oceanogr. 82, 265–280. doi: 10.1016/j.pocean.2009.07.006
Kosobokova K. N., Hopcroft R. R. (2010). Diversity and vertical distribution of mesozooplankton in the Arctic’s Canada Basin. Deep. Sea. Res. II. 57, 96–110. doi: 10.1016/j.dsr2.2009.08.009
Lane P. V. Z., Llinás L., Smith S. L., Pilz D. (2008). Zooplankton distribution in the western Arctic during summer 2002: Hydrographic habitats and implications for food chain dynamics. J. Mar. Syst. 70, 97–133. doi: 10.1016/j.jmarsys.2007.04.001
Levinsen H., Nielsen T. G. (2002). The trophic role of marine pelagic ciliates and heterotrophic dinoflagellates in arctic and temperate coastal ecosystems: A cross-latitude comparison. Limnol. Oceanogr. 47, 427–439. doi: 10.4319/lo.2002.47.2.0427
Llinás L., Pickart R. S., Mathis J. T., Smith S. L. (2009). Zooplankton inside an Arctic Ocean cold-core eddy: Probable origin and fate. Deep. Sea. Res. II. 56, 1290–1304. doi: 10.1016/j.dsr2.2008.10.020
Mackas D., Bohrer R. (1976). Fluorescence analysis of zooplankton gut contents and an investigation of diel feeding patterns. J. Exp. Mar. Biol. Ecol. 25, 77–85. doi: 10.1016/0022-0981(76)90077-0
Marin V. (1987). The oceanographic structure of the eastern Scotia sea—IV. Distribution of copepod species in relation to hydrography in 1981. Deep. Sea. Res. Part A. Oceanographic. Res. Papers. 34, 105–121. doi: 10.1016/0198-0149(87)90125-7
Matsumoto Y., Ando Y., Hiraoka Y., Tawa A., Ohshimo S. (2018). A simplified gas chromatographic fatty-acid analysis by the direct saponification/methylation procedure and its application on wild tuna larvae. Lipids 53, 919–929. doi: 10.1002/lipd.12098
Matsuno K., Abe Y., Yamaguchi A., Kikuchi T. (2016). Regional patterns and controlling factors on summer population structure of Calanus glacialis in the western Arctic Ocean. Polar. Sci. 10, 503–510. doi: 10.1016/j.polar.2016.09.001
Matsuno K., Yamaguchi A., Hirawake T., Imai I. (2011). Year-to-year changes of the mesozooplankton community in the Chukchi Sea during summers of 1991, 1992 and 2007, 2008. Polar. Biol. 34, 1349–1360. doi: 10.1007/s00300-011-0988-z
Matsuno K., Yamaguchi A., Nishino S., Inoue J., Kikuchi T. (2015). Short-term changes in the mesozooplankton community and copepod gut pigment in the Chukchi Sea in autumn: Reflections of a strong wind event. Biogeosciences 12, 4005–4015. doi: 10.5194/bg-12-4005-2015
McLaren I. A., Sevigny J.-M., Corkett J. (1988). Body size, development rate, and genome size of Calanus species in Dev. Hydrobiol., eds G. A. Boxshall and H. K. Schminke. Biol. Copepods. 47, 275–284. doi: 10.1007/978-94-009-3103-9_27
Miller C. B., Frost B. W., Batchelder H. P., Clemons M. J., Conway R. E. (1984). Life histories of large, grazing copepods in a subarctic ocean gyre Neocalanus plumchrus, Neocalanus cristatus, and Eucalanus bungii in the northeast Pacific. Prog. Oceanogr. 13, 201–243. doi: 10.1016/0079-6611(84)90009-0
Motoda S. (1959). Device for a simple plankton apparatus. Mem. Fac. Fish. (Hokkaido. Univ.) 7, 73–94.
Mundy P. R., Ingvaldsen R., Sunnanå K. (2017) Synthesis of knowledge on fisheries science in the central Arctic Ocean and adjacent waters (ToR1) in Final report of the Fourth Meeting of Scientific Experts on Fish Stocks in the Central Arctic Ocean, FiSCAO, (NOAA). 34–79.
Muramatsu M., Ueno H., Watanabe E., Itoh M., Onodera J. (2021). Transport and heat loss of the Pacific Summer Water in the Arctic Chukchi Sea northern slope: Mooring data analysis. Polar. Sci. 29, 100698. doi: 10.1016/j.polar.2021.100698
Nelson R. J., Carmack E. C., McLaughlin F. A., Cooper G. A. (2009). Penetration of Pacific zooplankton into the western Arctic Ocean tracked with molecular population genetics. Mar. Ecol. Prog. Ser. 381, 129–138. doi: 10.3354/meps07940
Niehoff B. (1998). The gonad morphology and maturation in Arctic Calanus species. J. Mar. Syst. 15, 53–59. doi: 10.1016/S0924-7963(97)00048-1
Nielsen T. G., Kjellerup S., Smolina I., Hoarau G., Lindeque P. (2014). Live discrimination of Calanus glacialis and C. finmarchicus females: Can we trust phenological differences? Mar. Biol. 161, 1299–1306. doi: 10.1007/s00227-014-2419-5
Nishino S., Kawaguchi Y., Inoue J., Hirawake T., Fujiwara A., Futsuki R., et al. (2015). Nutrient supply and biological response to wind-induced mixing, inertial motion, internal waves, and currents in the northern Chukchi Sea. J. Geophys. Res. Oceans. 120, 1975–1992. doi: 10.1002/2014JC010407
Parent G. J., Plourde S., Turgeon J. (2011). Overlapping size ranges of Calanus spp. off the Canadian Arctic and Atlantic Coasts: Impact on species’ abundances. J. Plankton. Res. 33, 1654–1665. doi: 10.1093/plankt/fbr072
Peterson W. (1986). Development, growth, and survivorship of the copepod Calanus marshallae in the laboratory. Mar. Ecol. Prog. Ser. 29, 61–72. doi: 10.3354/meps029061
Pickart R. S., Schulze L. M., Moore G. W. K., Charette M. A., Arrigo K. R., van Dijken G., et al. (2013). Long-term trends of upwelling and their impacts on primary productivity in the Alaskan Beaufort Sea. Deep. Sea. Res. I. 79, 106–121. doi: 10.1016/j.dsr.2013.05.003
Pickart R. S., Weingartner T. J., Pratt L. J., Zimmermann S., Torres D. J. (2005). Flow of winter-transformed Pacific water into the western Arctic. Deep. Sea. Res. II. 52, 3175–3198. doi: 10.1016/j.dsr2.2005.10.009
Pinchuk A. I., Eisner L. B. (2017). Spatial heterogeneity in zooplankton summer distribution in the eastern Chukchi Sea in 2012–2013 as a result of large-scale interactions of water masses. Deep. Sea. Res. II. 135, 27–39. doi: 10.1016/j.dsr2.2016.11.003
Plourde S., Campbell R. G., Ashjian C. J., Stockwell D. A. (2005). Seasonal and regional patterns in egg production of Calanus glacialis/marshallae in the Chukchi and Beaufort Seas during spring and summe. Deep. Sea. Res. II. 52, 3411–3426. doi: 10.1016/j.dsr2.2005.10.013
Pomeroy L. R. (1974). The ocean food web: A changing paradigm. BioScience 24, 499–504. doi: 10.2307/1296885
R Core Team (2021). R: a language and environment for statistical computing. Vienna, Austria: R Foundation for Statistical Computing. Available at: https://www.R-project.org/.
Runge J. A., Ingram R. G. (1991). Under-ice feeding and diel migration by the planktonic copepods Calanus glacialis and Pseudocalanus minutus in relation to the ice algal production cycle in southeastern Hudson Bay, Canada. Mar. Biol. 108, 217–225. doi: 10.1007/BF01344336
Rutzen I., Hopcroft R. R. (2018). Abundance, biomass and community structure of epipelagic zooplankton in the Canada Basin. J. Plankton. Res. 40, 486–499. doi: 10.1093/plankt/fby028
Scott C. L., Kwasniewski S., Falk-Petersen S., Sargent J. R. (2000). Lipids and life strategies of Calanus finmarchicus, Calanus glacialis and Calanus hyperboreus in late autumn, Kongsfjorden, Svalbard. Polar. Biol. 23, 510–516. doi: 10.1007/s003000000114
Skjoldal H. R. (Ed.) (2022). “Ecosystem assessment of the Central Arctic Ocean: Description of the ecosystem,” in ICES cooperative research reports. 355, 341. doi: 10.17895/ices.pub.20191787
Søreide J. E., Falk-Petersen S., Hegseth E. N., Hop H., Carroll M. L., Hobson K. A., et al. (2008). Seasonal feeding strategies of Calanus in the high-Arctic Svalbard region. Deep. Sea. Res. II. 55, 2225–2244. doi: 10.1016/j.dsr2.2008.05.024
Stevens C. J., Deibel D., Parrish C. C. (2004a). Species-specific differences in lipid composition and omnivory indices in Arctic copepods collected in deep water during autumn (North water Polynya). Mar. Biol. 144, 905–915. doi: 10.1007/s00227-003-1259-5
Stevens C. J., Deibel D., Parrish C. C. (2004b). Incorporation of bacterial fatty acids and changes in a wax ester-based omnivory index during a long-term inCubation experiment with Calanus glacialis Jaschnov. J. Exp. Mar. Biol. Ecol. 303, 135–156. doi: 10.1016/j.jembe.2003.11.008
Tourangeau S., Runge J. A. (1991). Reproduction of Calanus glacialis under ice in spring in southeastern Hudson Bay, Canada. Mar. Biol. 108, 227–233. doi: 10.1007/BF01344337
Trudnowska E., Balazy K., Stoń-Egiert J., Smolina I., Brown T., Gluchowska M. (2020). In a comfort zone and beyond—Ecological plasticity of key marine mediators. Ecol. Evol. 10, 14067–14081. doi: 10.1002/ece3.6997
Varpe Ø., Jørgensen C., Tarling G. A., Fiksen Ø. (2009). The adaptive value of energy storage and capital breeding in seasonal environments. Oikos 118, 363–370. doi: 10.1111/j.1600-0706.2008.17036.x
Vidal J. (1980). Physioecology of zooplankton. II. Effects of phytoplankton concentration, temperature, and body size on the development and molting rates of Calanus pacificus and Pseudocalanus sp. Mar. Biol. 56, 135–146. doi: 10.1007/BF00397130
Vidal J., Smith S. L. (1986). Biomass, growth, and development of populations of herbivorous zooplankton in the southeastern Bering Sea during spring. Deep. Sea. Res. Part A. Oceanographic. Res. Papers. 33, 523–556. doi: 10.1016/0198-0149(86)90129-9
Viitasalo M., Koski M., Pellikka K., Johansson S. (1995). Seasonal and long-term variations in the body size of planktonic copepods in the northern Baltic Sea. Mar. Biol. 123, 241–250. doi: 10.1007/BF00353615
Wassmann P., Kosobokova K. N., Slagstad D., Drinkwater K. F., Hopcroft R. R., Moore S. E., et al. (2015). The Contiguous domains of Arctic Ocean advection: Trails of life and death. Prog. Oceanogr. 139, 42–65. doi: 10.1016/j.pocean.2015.06.011
Watanabe E., Onodera J., Harada N., Honda M. C., Kimoto K., Kikuchi T., et al. (2014). Enhanced role of eddies in the Arctic marine biological pump. Nat. Commun. 5, 3950. doi: 10.1038/ncomms4950
Woodgate R. A. (2018). Increases in the Pacific inflow to the Arctic from 1990 to 2015, and insights into seasonal trends and driving mechanisms from year-round Bering Strait mooring data. Prog. Oceanogr. 160, 124–154. doi: 10.1016/j.pocean.2017.12.007
Woodgate R., Peralta-Ferriz C. (2021). Warming and freshening of the Pacific inflow to the Arctic from 1990–2019 implying dramatic shoaling in Pacific winter water ventilation of the Arctic water column. Geophys. Res. Lett. 48, e2021GL092528. doi: 10.1029/2021GL092528
Keywords: Calanus glacialis/marshallae, Pacific Arctic Ocean, population structure, body size, fatty acid, gut pigment
Citation: Ishihara M, Matsuno K, Tokuhiro K, Ando Y, Sato K and Yamaguchi A (2023) Geographic variation in population structure and grazing features of Calanus glacialis/marshallae in the Pacific Arctic Ocean. Front. Mar. Sci. 10:1168015. doi: 10.3389/fmars.2023.1168015
Received: 17 February 2023; Accepted: 23 August 2023;
Published: 20 September 2023.
Edited by:
Guang Yang, Chinese Academy of Sciences (CAS), ChinaReviewed by:
Daria Martynova, Zoological Institute (RAS), RussiaElizaveta Ershova, UiT The Arctic University of Norway, Norway
Vladimir G. Dvoretsky, Murmansk Marine Biological Institute, Russia
Emilia Trudnowska, Polish Academy of Sciences, Poland
Copyright © 2023 Ishihara, Matsuno, Tokuhiro, Ando, Sato and Yamaguchi. This is an open-access article distributed under the terms of the Creative Commons Attribution License (CC BY). The use, distribution or reproduction in other forums is permitted, provided the original author(s) and the copyright owner(s) are credited and that the original publication in this journal is cited, in accordance with accepted academic practice. No use, distribution or reproduction is permitted which does not comply with these terms.
*Correspondence: Minami Ishihara, bWluYW1pMDUyNWtvbmFraWNoaUBlaXMuaG9rdWRhaS5hYy5qcA==