 Lina Xie1,2,8
 Evgeniy Yakushev2,3,4*
 Igor Semiletov3,4,5
 Andrey Grinko4,5Ivan Gangnus6Anfisa Berezina2,7
 Alexander Osadchiev7Igor Zhdanov7
 Alexander Polukhin7
 Julia Moiseeva4,5Darya Purgina4,5
 Irina Pipko3
 Svetlana Pugach3Oleg Dudarev3
 Zhenming Ge8
- 1College of Ecology, Lishui University, Zhejiang, China
- 2Section of Oceanography, Norwegian Institute for Water Research (NIVA), Oslo, Norway
- 3V.I. Il’ichev Pacific Oceanological Institute, Russian Academy of Sciences, Far Eastern Branch (POI), Vladivostok, Russia
- 4Laboratory for Integrated Research of the Arctic System “land-shelf”, National Tomsk State Research University (TSU), Tomsk, Russia
- 5Institute of Natural Resources, National Tomsk Polytechnic Research University (TPU), Tomsk, Russia
- 6Faculty of Geography, M.Lomonosov Moscow State University (MSU), Moscow, Russia
- 7Shirshov Institute of Oceanology, Russian Academy of Sciences (IORAS), Moscow, Russia
- 8State Key Laboratory of Estuarine and Coastal Research, Institute of Eco-Chongming, Center for Blue Carbon Science and Technology, East China Normal University, Shanghai, China
The discharge of rivers and the subsequent dispersion of their plumes play a pivotal role in the biogeochemical cycling of the Arctic Ocean. Based on the data collected during annual transects conducted in the autumn period (September-October) from 2015-2020, this study explores the effect of River Lena plume dispersion on the seasonal and interannual changes in the hydrophysical and biogeochemical structure of the southeastern Laptev Sea. The temperature-salinity relationship (T-S), Redfield ratio and multiparameter cluster analysis were used to investigate variations in the water mass structure along the transect. The results revealed that the plume’s interannual and seasonal spreading patterns play a crucial role in regulating the local physical, biogeochemical, and biological processes in the southern Laptev Sea. During September-October, the hydrochemical water mass structure along the transects shifted from highly stratified to unstratified as the plume’s mixing intensity increased. Anomalous hydrochemical distributions were observed due to coastal upwelling, which was primarily characterized by high total alkalinity and nitrate levels, and low organic phosphorus, nitrite, and ammonia levels in the seawater. Wind and cold weather conditions drive deep vertical mixing of seawater, causing the resuspension of bottom sediment and the subsequent enrichment of bottom water by nutrients. Multi-parameter cluster analysis is used to describe the details of water mass structures in the highly dynamic southern Laptev Sea, with water mass structures typically undergoing significant changes within two weeks between September and October. The migration and transformation of water masses throughout the seasons are influenced by the volume of river discharge, fall-winter cooling, and atmospheric circulation patterns. Furthermore, the general atmospheric circulation is confirmed to be the primary cause of the interannual variation in the spread of the Lena River plume over the southeast Laptev Sea.
1 Introduction
Climate change has led to remarkable environmental changes in the Arctic, including an increase in riverine discharges (Savelieva et al., 2000; Wang et al., 2021). The role of the rivers in the Arctic Ocean is especially large, taking into account the ratio between the annual river discharge and the Arctic Ocean volume (Semiletov et al., 2000; Semiletov et al., 2013; Osadchiev et al., 2021). The Arctic Ocean is surrounded by permafrost, which is being degraded at an increasing rate due to warming conditions that are most severe in Siberia and Alaska (Semiletov et al., 2012). The Arctic region stores approximately 1100-1672 Pg of organic carbon (OC) buried inland and within the Arctic Ocean sedimentary basin, which could become involved in current biogeochemical cycling due to the thawing of on-land and sub-sea permafrost, increasing coastal and bottom erosion, accelerating river discharge and carbon losses from soils (Semiletov et al., 2000; Freeman et al., 2001; Kuhry et al., 2013; Hugelius et al., 2014). Thaw and release of OC from Arctic permafrost are postulated to be one of the most powerful mechanisms causing a net redistribution of carbon from land and ocean to the atmosphere (Semiletov, 1999a; Semiletov, 1999b; Gruber et al., 2004; ACIA, 2005; Canadell and Raupach, 2009; Shakhova et al., 2014; Shakhova et al., 2019). Determining the magnitude of particulate and dissolved fluxes of modern, old OC, and nutrients from vast Great Siberian Rivers watersheds is critical to constraining a range of issues in the Arctic shelf-basin system, including carbon cycling, the health of the ecosystem, and the interpretation of sediment characteristics (Guo et al., 2004; Gustafsson et al., 2011; Semiletov et al., 2011; Semiletov et al., 2016; Bröder et al., 2019; Dudarev et al., 2022; Martens et al., 2022).
East Siberian Arctic seas (ESAS) has the broadest and shallowest shelf of any ocean, making its biogeochemistry and ecosystems especially vulnerable to Climate-driven alterations (Guo et al., 2004; Gustafsson et al., 2011; Semiletov et al., 2011; Reyes and Lougheed, 2015; Semiletov et al., 2016; Polukhin, 2019). For example, the Great Siberian Rivers (Ob, Yenisey, Lena, Kolyma, and Indigirka rivers) are likely to carry and transport a combined signal of terrestrial organic matter (OM) and nutrients released from soil and degrading permafrost within their vast watersheds to the ESAS shelf (Guo et al., 2004; Dudarev et al., 2006; Sánchez-García et al., 2011; Semiletov et al., 2011), altering the flux of OC and nutrients. Due to the ESAS receive and transmit the integrated signal to the Arctic Ocean through shelf water, which acts as the signal carrier (Semiletov et al., 2000; Semiletov et al., 2007; van Dongen et al., 2008; Pipko et al., 2010; Vonk et al., 2010; Charkin et al., 2011; Gustafsson et al., 2011; Karlsson et al., 2011; Pipko et al., 2011; Semiletov et al., 2011). It is essential to study the interaction between river plumes and the water column in the ESAS, including the Laptev Sea, East Siberian Sea, and the Russian part of the Chukchi Sea, to comprehend the interplay between changing riverine runoff and water mass dynamics.
The system Lena River-Laptev Sea is among the key ESAS land-shelf component. The Lena River carries substantial amounts of both dissolved and particulate matter, making it a significant carrier of diverse chemical signals to the sea margin, and playing a crucial role in the biogeochemical system of the Laptev Sea (Semiletov, 1999a; Semiletov, 1999b; Guo et al., 2004; Semiletov et al., 2007; Pipko et al., 2008; van Dongen et al., 2008; Anderson et al., 2009; Pipko et al., 2010; Vonk et al., 2010; Charkin et al., 2011; Karlsson et al., 2011; Pipko et al., 2011; Semiletov et al., 2011; Semiletov et al., 2012). However, during its flow to the sea, the river integrates multiple and complex characteristics of the basin, such as meteorological conditions, soil features, vegetation affecting, groundwater, and basin chemical weathering variables (Pipko et al., 2010; Semiletov et al., 2011; Tesi et al., 2016; Pipko et al., 2021; Vorobyev et al., 2021). The complex and uncertain nature of the Lena River is likely to cause the variability of the biogeochemical structure of the Laptev Sea.
In the nearshore region of the Laptev Sea, the degradation of POM causes the formation of anomalously high partial pressure of CO2 (pCO2) and nutrient concentrations, where the river signal overlaps with the biogeochemical signal from highly eroded coastal ice complexes enriched by old terrestrial organics (Semiletov, 1999a; Semiletov, 1999b; Semiletov et al., 2007; Vonk et al., 2010; Semiletov et al., 2011). Recycling of limiting nutrients from old terrestrial OM could influence the element stoichiometry and new production (Codispoti and Richards, 1968; Cauwet and Sidorov, 1996; Kattner et al., 1999). Recent data show that the decay of POM and OM at the ESAS sediment surface results in low in situ pH values (as low as 7.24, and even less, total scale) and a naturally acidified marine environment. Laptev sea exhibits the lowest values of calcium carbonate saturation ever reported for the open marine environment. In the shallow Laptev Sea strongly impacted by the Lena River, acidification lowers the saturation state of calcite and aragonite in the surface waters to 0.4 and 0.2, and in the bottom water to 0.2 and 0.1, respectively (Semiletov et al., 2012; Semiletov et al., 2016). However, despite these investigation results, detailed investigations into nutrient dynamics under the influence of the river plume are still lacking.
The fresh water discharged into the Laptev Sea shelf by the Lena River can be directly transported to the Arctic Ocean interior at the northward shelf break, or carried to the Canadian part of the basin after being advected eastward (Guay et al., 2001; Dmitrenko et al., 2005; Dmitrenko et al., 2008). The fresh surface water masses on the continental shelf undergo spreading and transformation, affecting numerous local physical, geochemical, and biological processes, ultimately resulting in significant vertical stratification (Kattner et al., 1999; Savelieva et al., 2000; Stepanova et al., 2017). Theoretically, the ratios of the concentrations of the main nutrients in marine biomass can be described by the canonical Redfield ratio C:N:P = 106:16:1 (Richards, 1965), which can be extended by including oxygen and silicate: O:C:Si:N:P = 138:106:15:16:1 (Richards, 1965; Brzezinski, 1985). The Redfield ratio can be effectively used to reveal the origin, migration, and transformation of water masses using non-conservative nutrient elements to analyze the structure of seawater (Broecker, 1974). This method has been widely used in recent decades (Wilson and Wallace, 1990; McLaughlin et al., 1996; Cooper et al., 1999; Nelson et al., 2009; Chen et al., 2011). Isotope techniques are also commonly used to track hydrological processes such as runoff, mixing, oceanic convection, and diffusion, as well as to quantify the distribution of water masses (Benetti et al., 2017; Wu et al., 2021; Lao et al., 2022; Yang et al., 2022). However, the stable isotope of seawater, being relatively conservative and minimally influenced by biochemical processes, is particularly informative about the physical processes involved in the movement of water masses (Fairbanks, 1982; Lian et al., 2016). In seawater, the cycling of N, P, and Si elements (source, distribution, and migration) are affected independently or interactively by various physical, chemical, and biological factors, such as seawater dynamic conditions (Du et al., 2013), continental runoff (Stepanova et al., 2017), coastal erosion (Semiletov, 1999a; Semiletov, 1999b; Semiletov et al., 2011; Semiletov et al., 2013), sediment settlement and degradation (Bröder et al., 2018), marine plankton assimilation, feeding and other biological activities (Carlsson and Graneli, 1999; Sukhanova et al., 2017), human activity (Galloway et al., 2004), climate change (Justić et al., 1996) etc. These biogeochemical elements can provide information about biological and chemical processes that help to better understand the impacts of freshwater inputs on marine ecosystems.
In this study, we mainly investigated the influence of the Lena River runoff on the biogeochemical structure of the Laptev Sea, and used multivariate statistical analysis (cluster analysis) to process biogeochemical data to obtain water mass information. The study will have two objectives: і)to examine the interseasonal and interannual variations in the biogeochemical structure of the Laptev Sea, and ii) to track water mass using major biogeochemical elements. Data collected during cruises in five years (2015, 2017-2020) will be utilized for this purpose. This study will provide valuable insights into the oceanographic processes in the Arctic region.
2 Data and methods
2.1 Study area
The Laptev Sea is a marginal sea located in the center of the Siberian sea system (Pavlov et al., 1996; Dmitrenko et al., 2005). The total area is about 700 000 km2 with an average water depth of 578 m, over half of which (53%, in the area) is located on the continental shelf with an average depth < 50 m (Jakobsson et al., 2020). The sea is characterized by extensive shallow regions, a great effect of the riverine discharge, harsh climate, free water exchange with the Arctic Ocean, and year-round existing ice of a large part of the water area (Pavlov et al., 1996).
To study the biogeochemical structure of the Laptev Sea interannual changes, we summarized hydrophysical and biogeochemical data from 5 cruises of R/V Akademik Mstislav Keldysh performed in the eastern part of the Laptev Sea during the ice-free period (September-October) in 2015, and 2017-2020. The repeated during these five years transect ranged from 120°42′ to 133°36′ E in longitude and from 72° to 78°10′ N in latitude (Figure 1). These repeated 423.9-651 km long studies allowed to show changes from the delta of the Lena River through the Laptev Sea shelf to the continental slope and adjacent deep-water area. Each transect had 12-16 complex hydrophysical-biogeochemical stations. Rosette complex with 12 or 24 Niskin bottles equipped with a CTD probe (Sea Bird-09) was used to collect samples from surface to bottom water (water depths vary from 0 to 350 m).
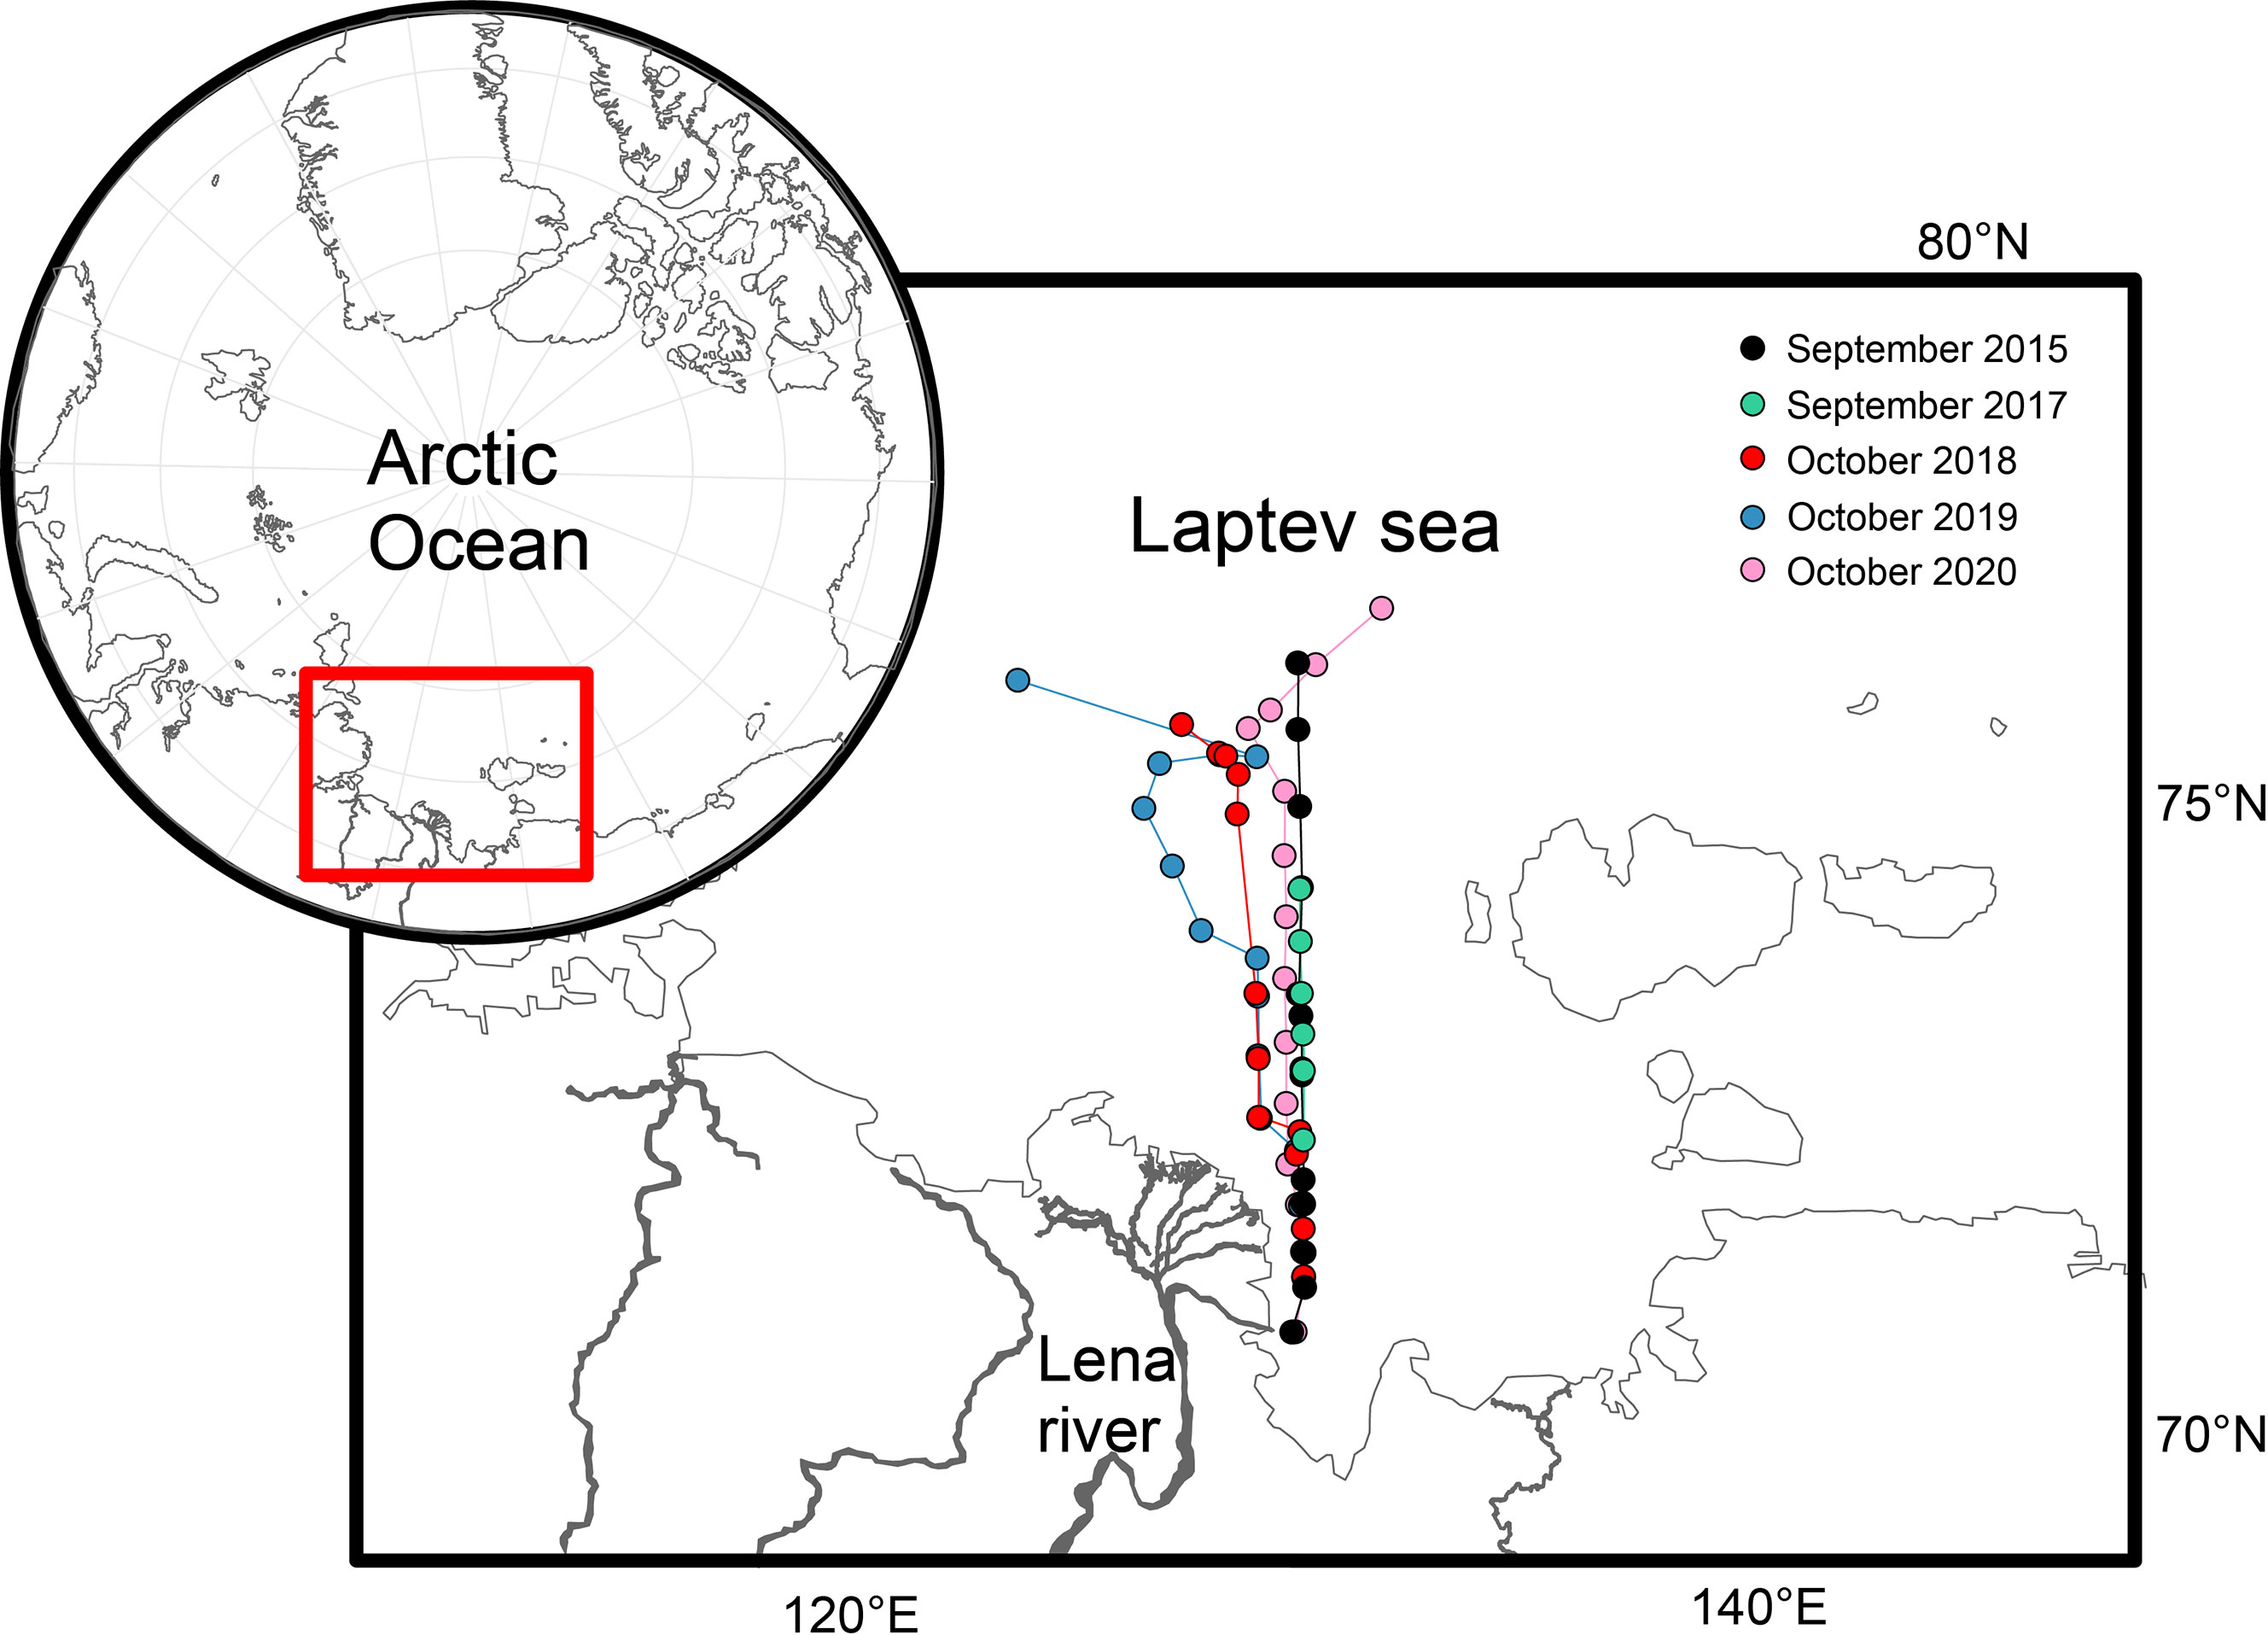
Figure 1 Transects and station locations (2015, 2017-2020)-with red rectangle showing the study area.
2.2 Biogeochemical parameters
The following parameters were measured during the cruises: dissolved oxygen (DO), pH, total alkalinity (AT), phosphate (PO43-), silicon (Si), nitrite nitrogen (NO2-), nitrate nitrogen (NO3-), ammonia nitrogen (NH4+), organic phosphorus (Porg) and organic nitrogen (Norg). The biogeochemical parameters were determined in the onboard laboratory using standard methods. Temperature and salinity were measured directly with CTD-profiler (usually SBE19+ SeaBird Electronics, USA).
Samplings on hydrological stations were carried out with 5- or 10- liter plastic Niskin bottles (General Oceanics), following ISO 51592-2000 “General requirements for water sampling”. Samples for determination of pH, nutrients and AT were collected in a plastic 0.5- liter bottles without preservation. In 2018-2020, saturated mercuric chloride solution was added to poison the AT samples at the time of sampling (Dickson et al., 2007). While sampling in waters with a lot of particulate matter (water of the inlets, in the mixing zone of river and sea water) for nutrient determination samples have been pre-filtered through a 0.45 micron Merc Millipore filters (Millero et al., 1995).
DO determination was conducted with standard Winkler method (Hansen, 1999; Parsons, 2013). pH (NBS) in 2015 and 2017 was analyzed potentiometrically using Hi 2210 HANNA and in 2018-2020 with pH meter Metrohm 914.
In 2015 and 2017 AT was determined using an indicator titration method in which a 25 ml aliquot of seawater was titrated with 0.02M HCl in an open cell according to Bruevich’s method (Pavlova et al., 2008) onboard. In 2018-2020 cruises measurements were performed in the coastal Laboratory with a VINDTA system (Mintrop et al., 2000) at 20°C, with cell temperature controlled to within 0.1°C. AT measurements were performed with a precision of ±2 μmol kg-1 with the accuracy set by calibration against certified reference materials (CRMs) supplied by A. Dickson, Scripps Institution of Oceanography (USA). In 2000, the North Pacific Marine Science Organization (PICES) working group on CO2 in the North Pacific performed an intercalibration of AT in seawater using CRMs. The results of the intercalibration showed that the AT values obtained by Bruevich’s method were in agreement within ±1 μmol kg-1 when the state-of-the-art analytical practice was applied (Pavlova et al., 2008) with the same standard solutions that were used at the VINDTA system. Therefore, we assumed the results obtained by the both techniques as consistent ones.
Specific alkalinity (SA), the ratio of the AT to salinity AT/Salinity was calculated, which is one of the most widely used and reliable chemical markers to classify the water mass (Makkaveev et al., 2018).
Nutrient measurements in 2015-2019 cruises were made by spectrophotometric manual methods during some hours after collecting samples onboard (Grasshoff et al., 2009). Technique of nitrate nitrogen determination is based on reduction of nitrates to nitrites and subsequent colorimetry (Parsons, 2013). Phosphates were measured spectrophotometrically using techniques by Murphy and Riley, while dissolved silica was measured according to the spectrophotometric method by Koroleff (Parsons, 2013). Ammonia nitrogen was analyzed following Solorzano (1969). In the 2020 cruise, the four-channel segmented flow autoanalyzer QuAAtro-39 (SEAL Analytical) was used for continuous measurements of nutrients onboard. Ammonia nitrogen was analyzed in this cruise by two methods, manual and flow. The results were compared and manual method was chosen, as more realistic. Total nitrogen and total phosphorous were measured by method of alkaline persulphate digestion with colorimetric determination of nitrates and phosphates (Valderrama, 1981).
Based on these data we calculated the ratios: Si:P (Si: PO43-), Si:N (Si:(NO3-+NO2-+NH4+)), and N:P ((NO3-+NO2-+NH4+):PO43-).
2.3 Statistics
The multivariate statistical analysis was successfully used to explore the structure in geological and hydrochemical data (Reyment, 1997; Chen et al., 2011; Liu et al., 2019). Cluster analysis is a primary branch of multivariate statistical methods. The method determines the intimacy relationship between each case by applying a certain algorithm for multiple properties of the sample (selected based on experience) to calculate the similarity or difference, and finally divides all cases into multiple similar groups (i.e., clusters). The Hierarchical clustering algorithm is to cluster objects according to the distance between objects. This clustering method is suitable for variables with a small sample size (n < 1000, n=477 in this study), which has been used in water mass analysis in shallow sea (Chen et al., 2011). Generally, the variables participating in the Hierarchical clustering should not have a strong correlation. Variable clustering with overlapping information will make variable contributions repeatedly in the calculation process and affect the clustering results.
The Mahalanobis algorithm, which measures the absolute distance between two objects, is a special algorithm for calculating the distance between objects in Hierarchical clustering calculations. The Mahalanobis distance is the Euclidean distance in the normalized principal component space, that is, it can exclude the interference of variable correlations and variable dimension sizes that are too different. An advantage of employing principal component analysis (PCA) is that it obviates the necessity of excluding highly relevant indicators. The original interrelated variables (standardized variable) are combined into a new mutually uncorrelated co-ordinate system by PCA, and the newly transformed principal components (original factors) explain the same information or variance as the original variables. The standardized variables are projected on these principal components to obtain new data (component matrix). The factor score matrix (multiplying the standardized variable matrix by the component matrix) assigns weights to standardized data according to the interpretation of different variables by the principal components, then calculate a weighted Euclidean distance between these new data using the factor score matrix as the clustering variable. The Ward method is used to measure the distance between clusters. This method can minimize the information loss during each merging. The calculation of Euclidean distance (Otto, 1998) is as follows:
In Eq. (1): i and k represent any two different water samples; j represents the variable type; v represents the variable value.
The selected cluster variables include temperature, salinity, DO, oxygen saturation (O2%), AT, SA, NO3-, NO2-, NH4+, PO43-, and Si. For a few missing values, we use IBM SPSS Statistics 19 to perform linear trend (linear fitting) replacement at points. In addition, when the variable values are scattered, the overall variance will be mainly controlled by the variable with larger variance. To eliminate the possible impact of different dimensions, we use the Z-Score standardization method to standardize the variables.
We conducted KMO (Kaiser-Meyer-Olking) and Bartlett’s Test (Bartlett’s test of sphericity) before PCA analysis. Both the KMO statistic greater than 0.600 (0.619) and Bartlett’s test were significant (p < 0.05) (Table S1), which indicated that all samples are suitable for PCA. Accumulated Variance Contribution Rate represents the sum of the variance explained by each factor for each variable. A cumulative variance contribution rate of 60-70% was regarded as a good explanation for hydrochemical information. In this study, we extracted three initial factors with principal component eigenvalues >1. These three initial factors account for 74.38% of total variance, which can adequately explain the selected variable information. To conduct a deeper analysis of the variables, the factor loadings were rotated using the maximum variance method, with multiple iterations until the results converged. Twiddle factor loadings present a better explanation for variables in particular components because it makes the variance of the variables more significant.
T-S and cluster analysis results were used as qualitative additional variables in PCA analysis with standardized variables. In the principal component map plot, all water samples are grouped by water mass type. The principal component plot contains a lot of information, including sample PCA scatter points (samples), water mass grouping (different colors), and the abundance and correlation of principal components. The ellipse represents the core area added by the default 95% confidence interval, providing a straightforward way to determine whether the groups are separated. The arrows within the plot depict variables, where length indicates the data’s contribution to the principal component and direction represents the correlation between the variable and the principal component.
3 Results
3.1 River discharge and wind
The daily flow of the Lena River from May to November in 2015, and 2017-2020 at Kyusyur gauging station was obtained from the Arctic GRO dataset (https://arcticgreatrivers.org/data/). The annual total discharge (January to December) of Lena River was shown in column diagram (Figure 2), in which the maximum (663.40 km3) and minimum annual total discharge (463.21 km3) occurred in 2018 and 2019, respectively. The other three years kept a medium level ranging from 582.80 to 593.75 km3. The main peak of Lena River discharge occurred around 1st June. In 2015, 2018, and 2020, its value was about 150 000 m3·s-1, followed by 120 000 m3·s-1 in 2017 and 83 000 m3·s-1 in 2019. After the main peak, the discharge dramatically declines, until the second peak occurs in August. In 2018, the Lena River’s discharge from August to October was overwhelmingly higher than that in other years. From the beginning of October to the beginning of November, the river discharge decreases sharply, reducing to the minimum discharge, that is maintained till the next flood period.
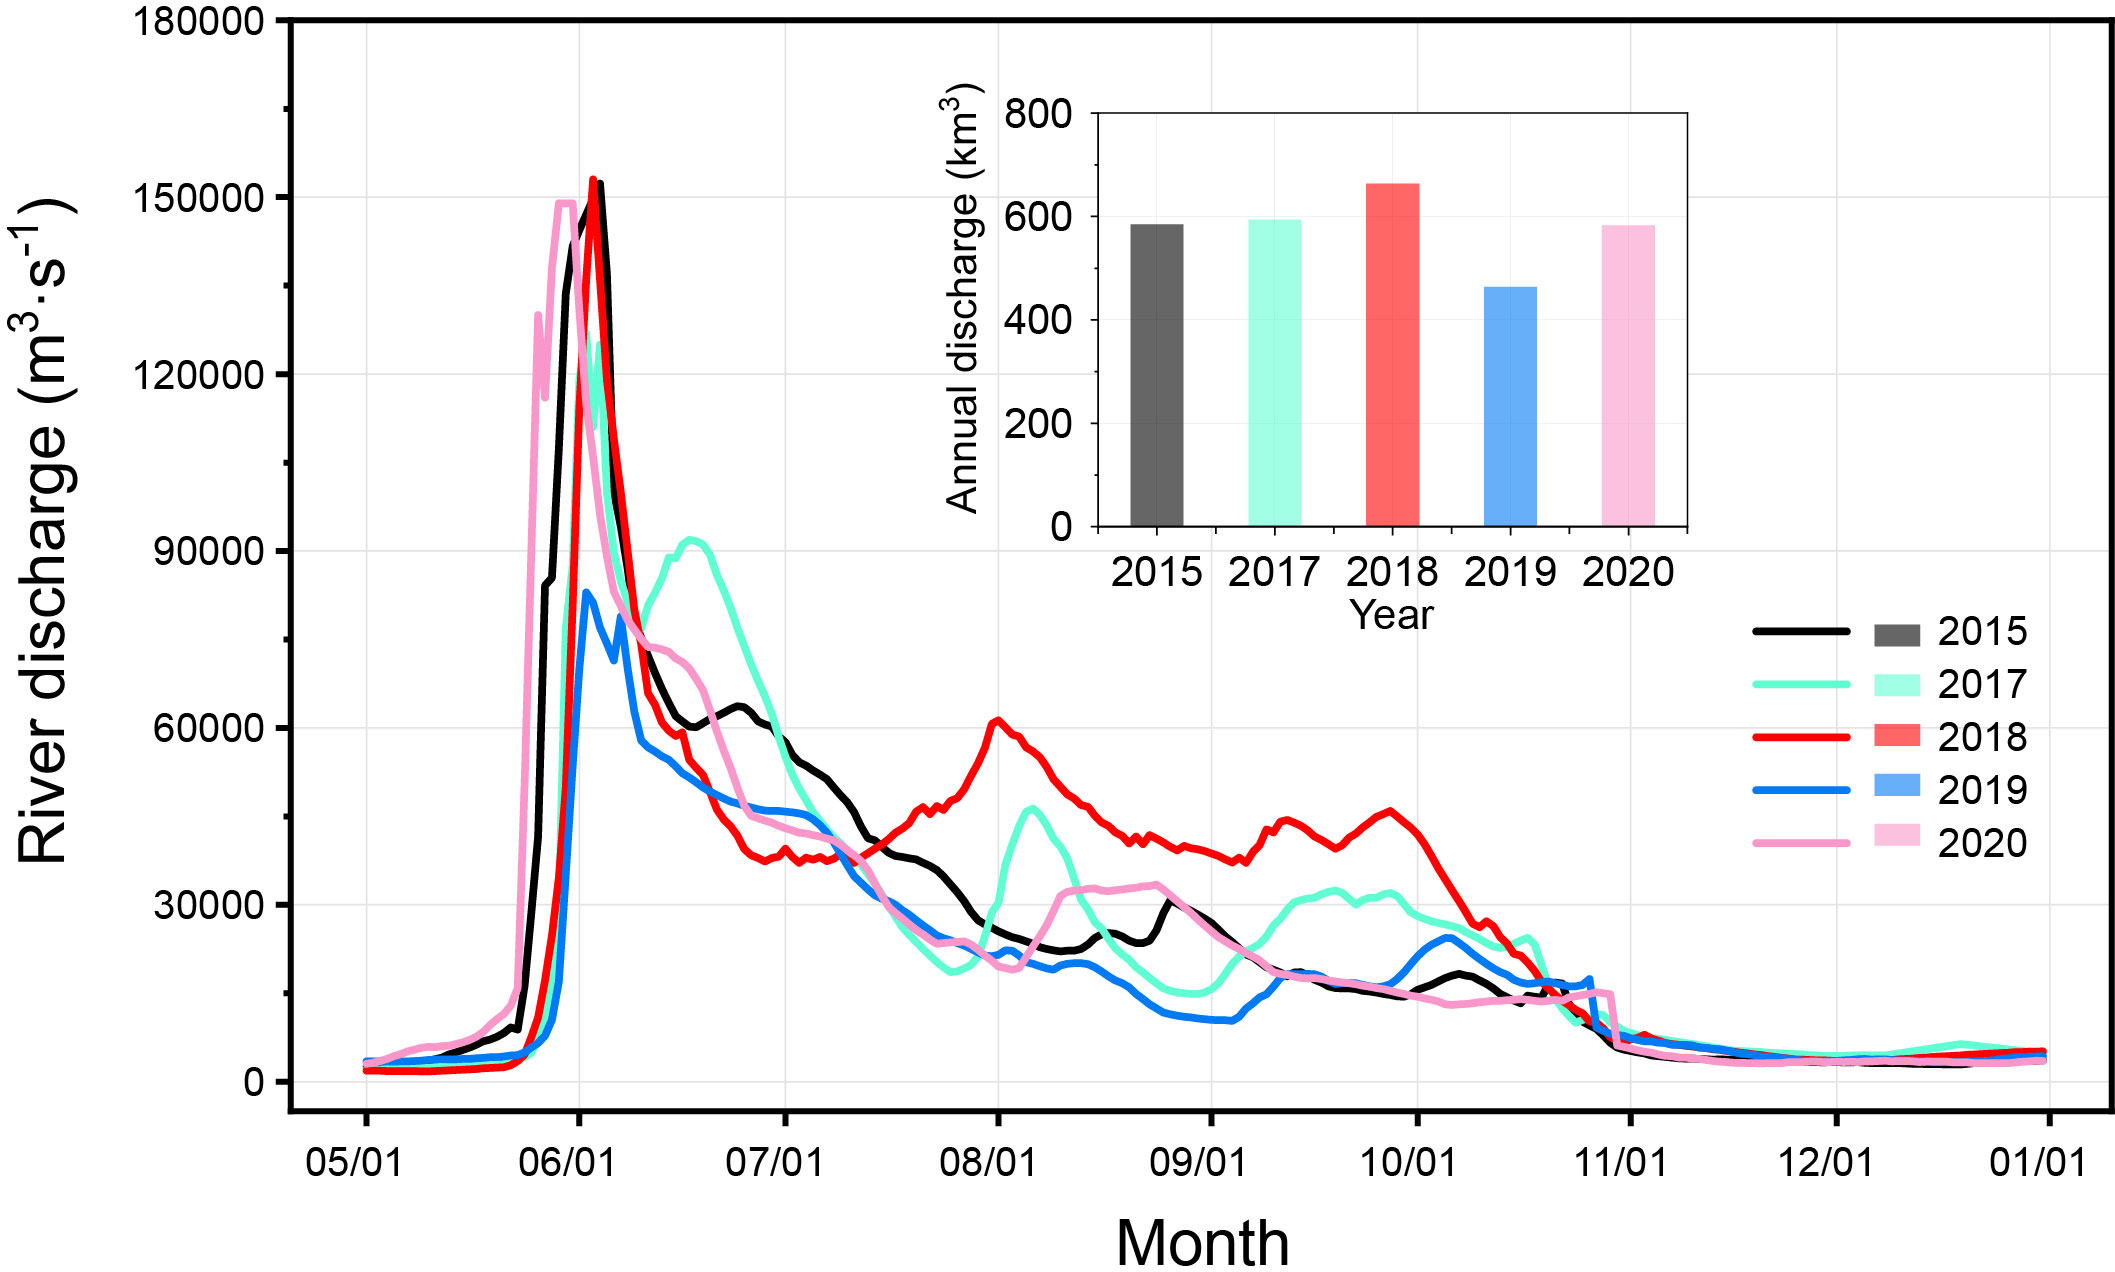
Figure 2 The discharge of Lena River in 2015, 2017-2020. Data were from the Arctic GRO dataset (https://arcticgreatrivers.org/data/).
The weekly wind direction and speed in the eastern part of the Laptev Sea during the ice-free period of 2015, 2017-2020 are shown in Figure 3. In the second half of August 2015, southeasterly winds prevailed in the southeast of the Laptev Sea, with an average wind speed > 8 m·s-1, and the average sea level wind speed in some parts exceeded 10 m·s-1. The average wind direction for the first week of September turned to the northwest. In the first two weeks of September 2017, the sea level was affected by the easterly wind of 8-10 m·s-1. In the final week, it was influenced by west winds with speeds of 9-10 m·s-1. In 2018, the wind direction was mainly west or southwest (except for the average wind direction of east or southeast in the first two weeks of August), and the average wind speed was 7-10 m·s-1. In the second half of September 2019, the strong easterly, southeasterly winds dominated, and in October strong northeasterly winds dominated (average wind speed > 8 m·s-1). In late August and early September 2020, the southeasterly wind prevailed on the sea surface (average wind speed was about 7-10 m·s-1). The winds were also strong (9-11 m·s-1 on average) southeasterly during the last two weeks of October.
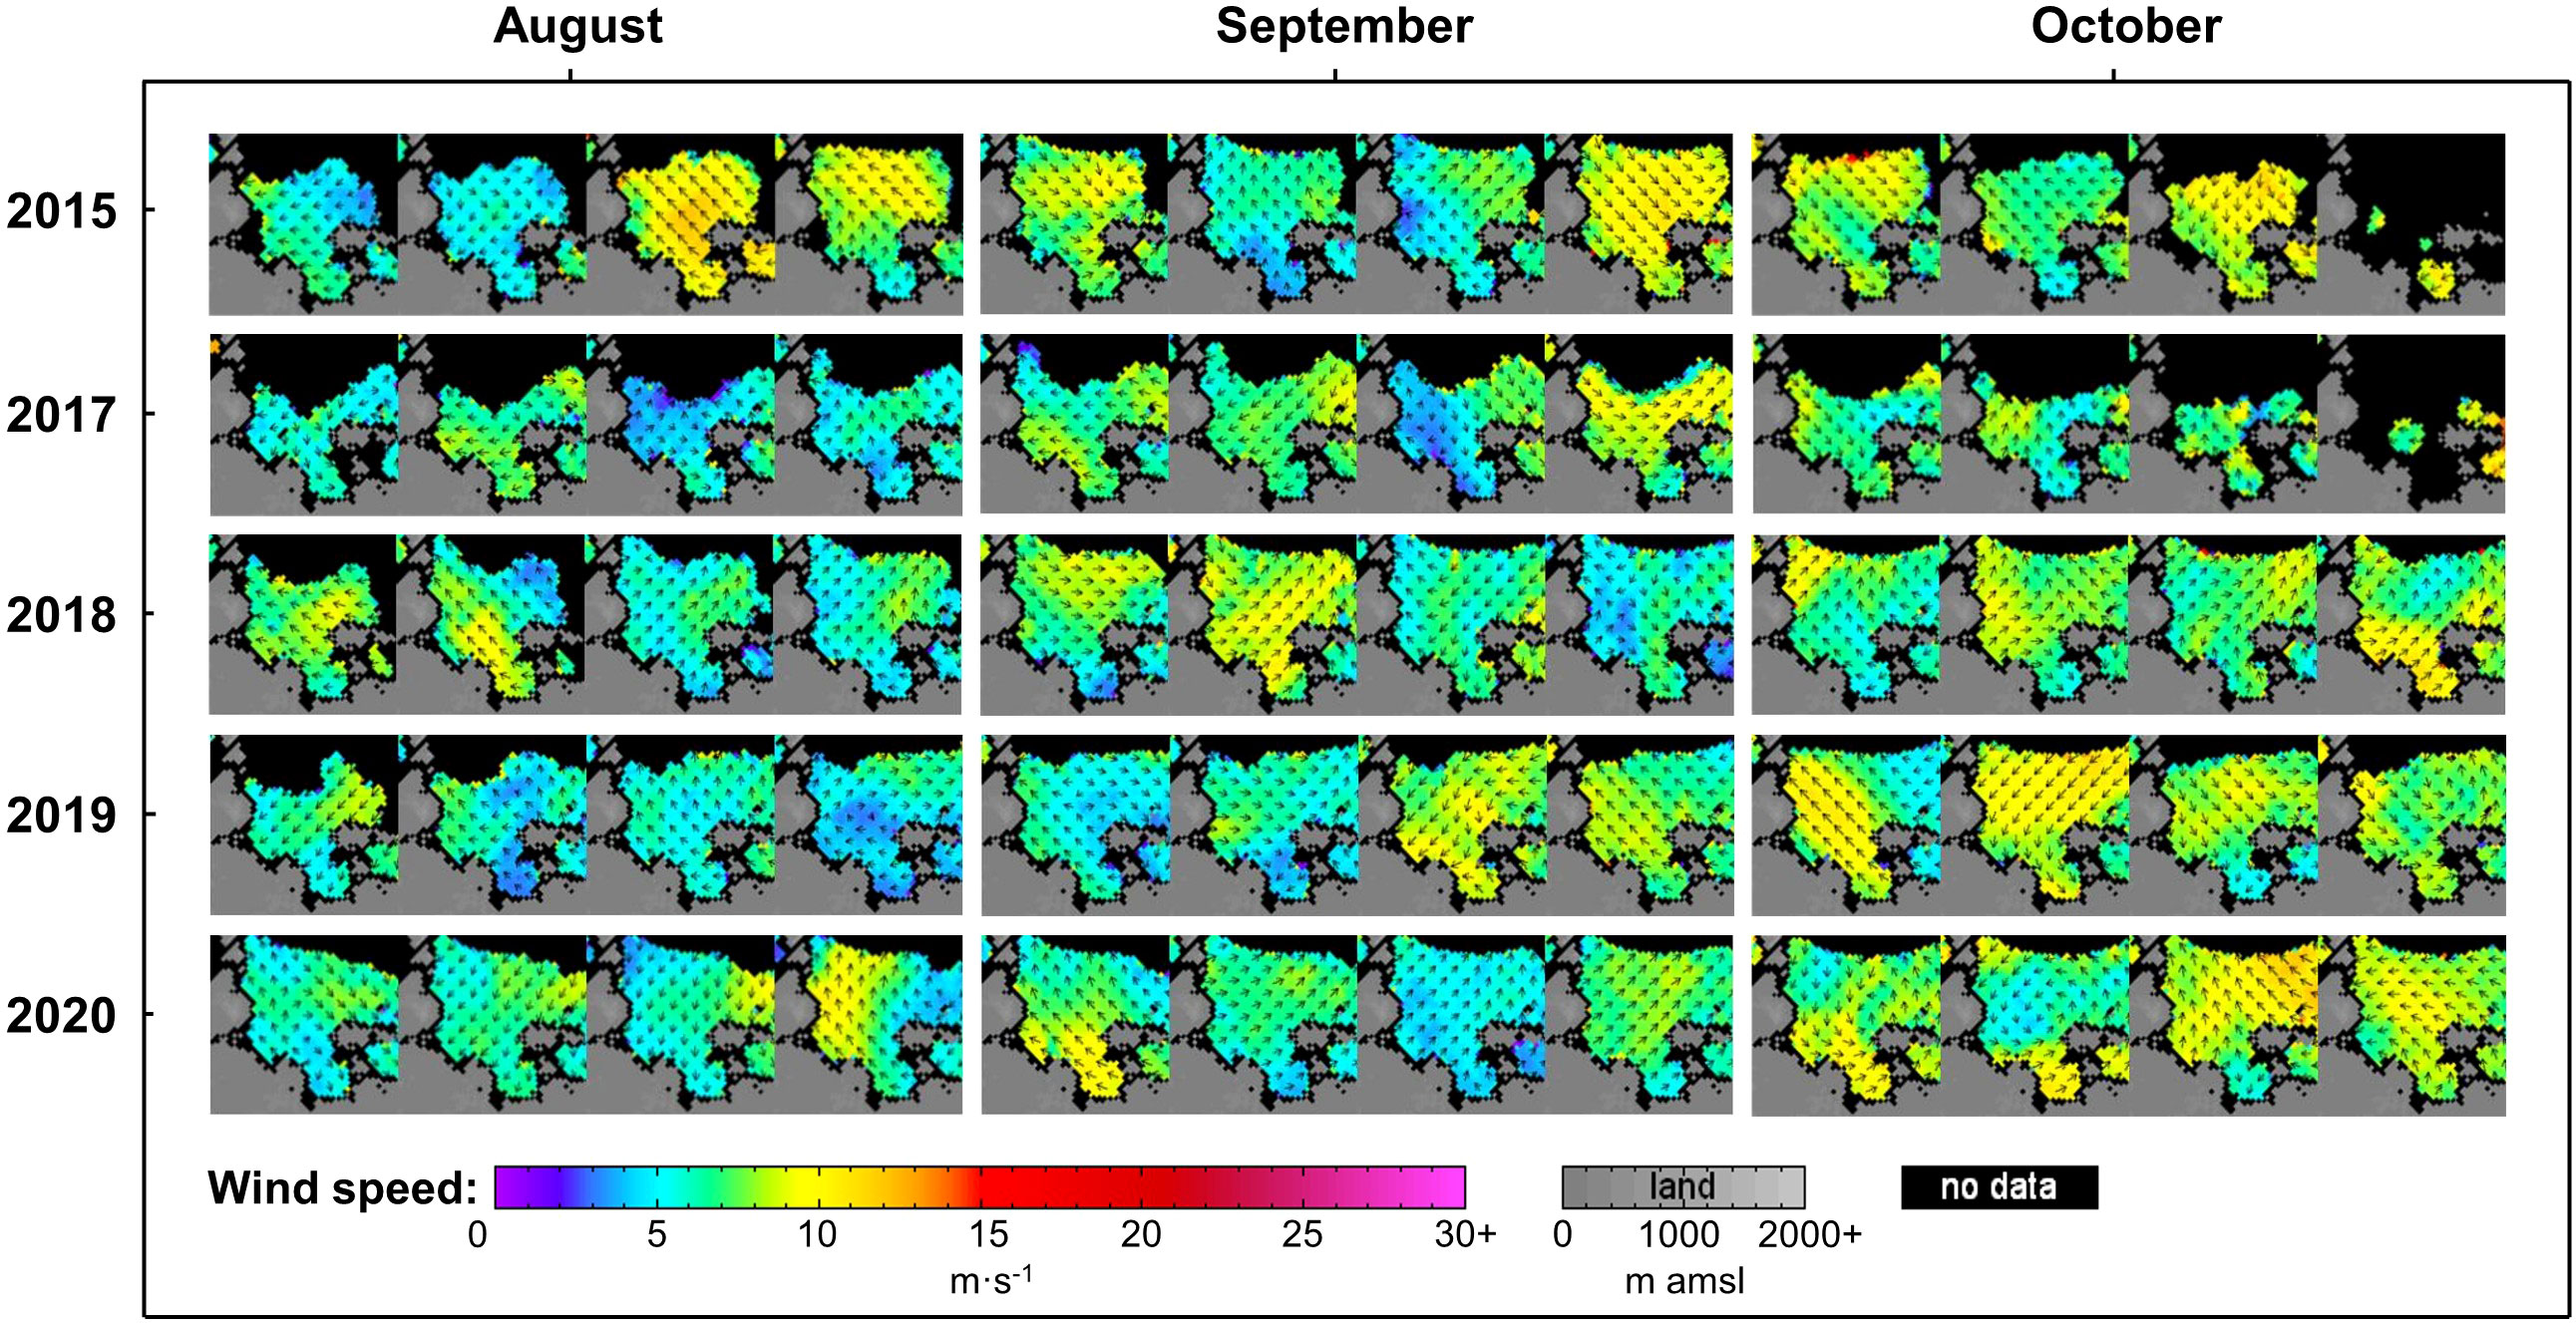
Figure 3 The wind direction and speed in the eastern part (Latitude range: 70°30′-79°40′ N; Longitude range: 95°-150°E) of the Laptev Sea during the ice-free period of 2015, 2017-2020. To investigate the wind speed pattern, we use ASCAT-A scatterometer weekly data produced by Remote Sensing Systems. Data are available at http://www.remss.com.
3.2 Distributions of physical and chemical characteristics
The data were obtained between the beginning of September and the end of October across multiple years, allowing for analysis of interannual and seasonal variations. The observed distributions of physical and chemical characteristics are shown in Figures 4–9.
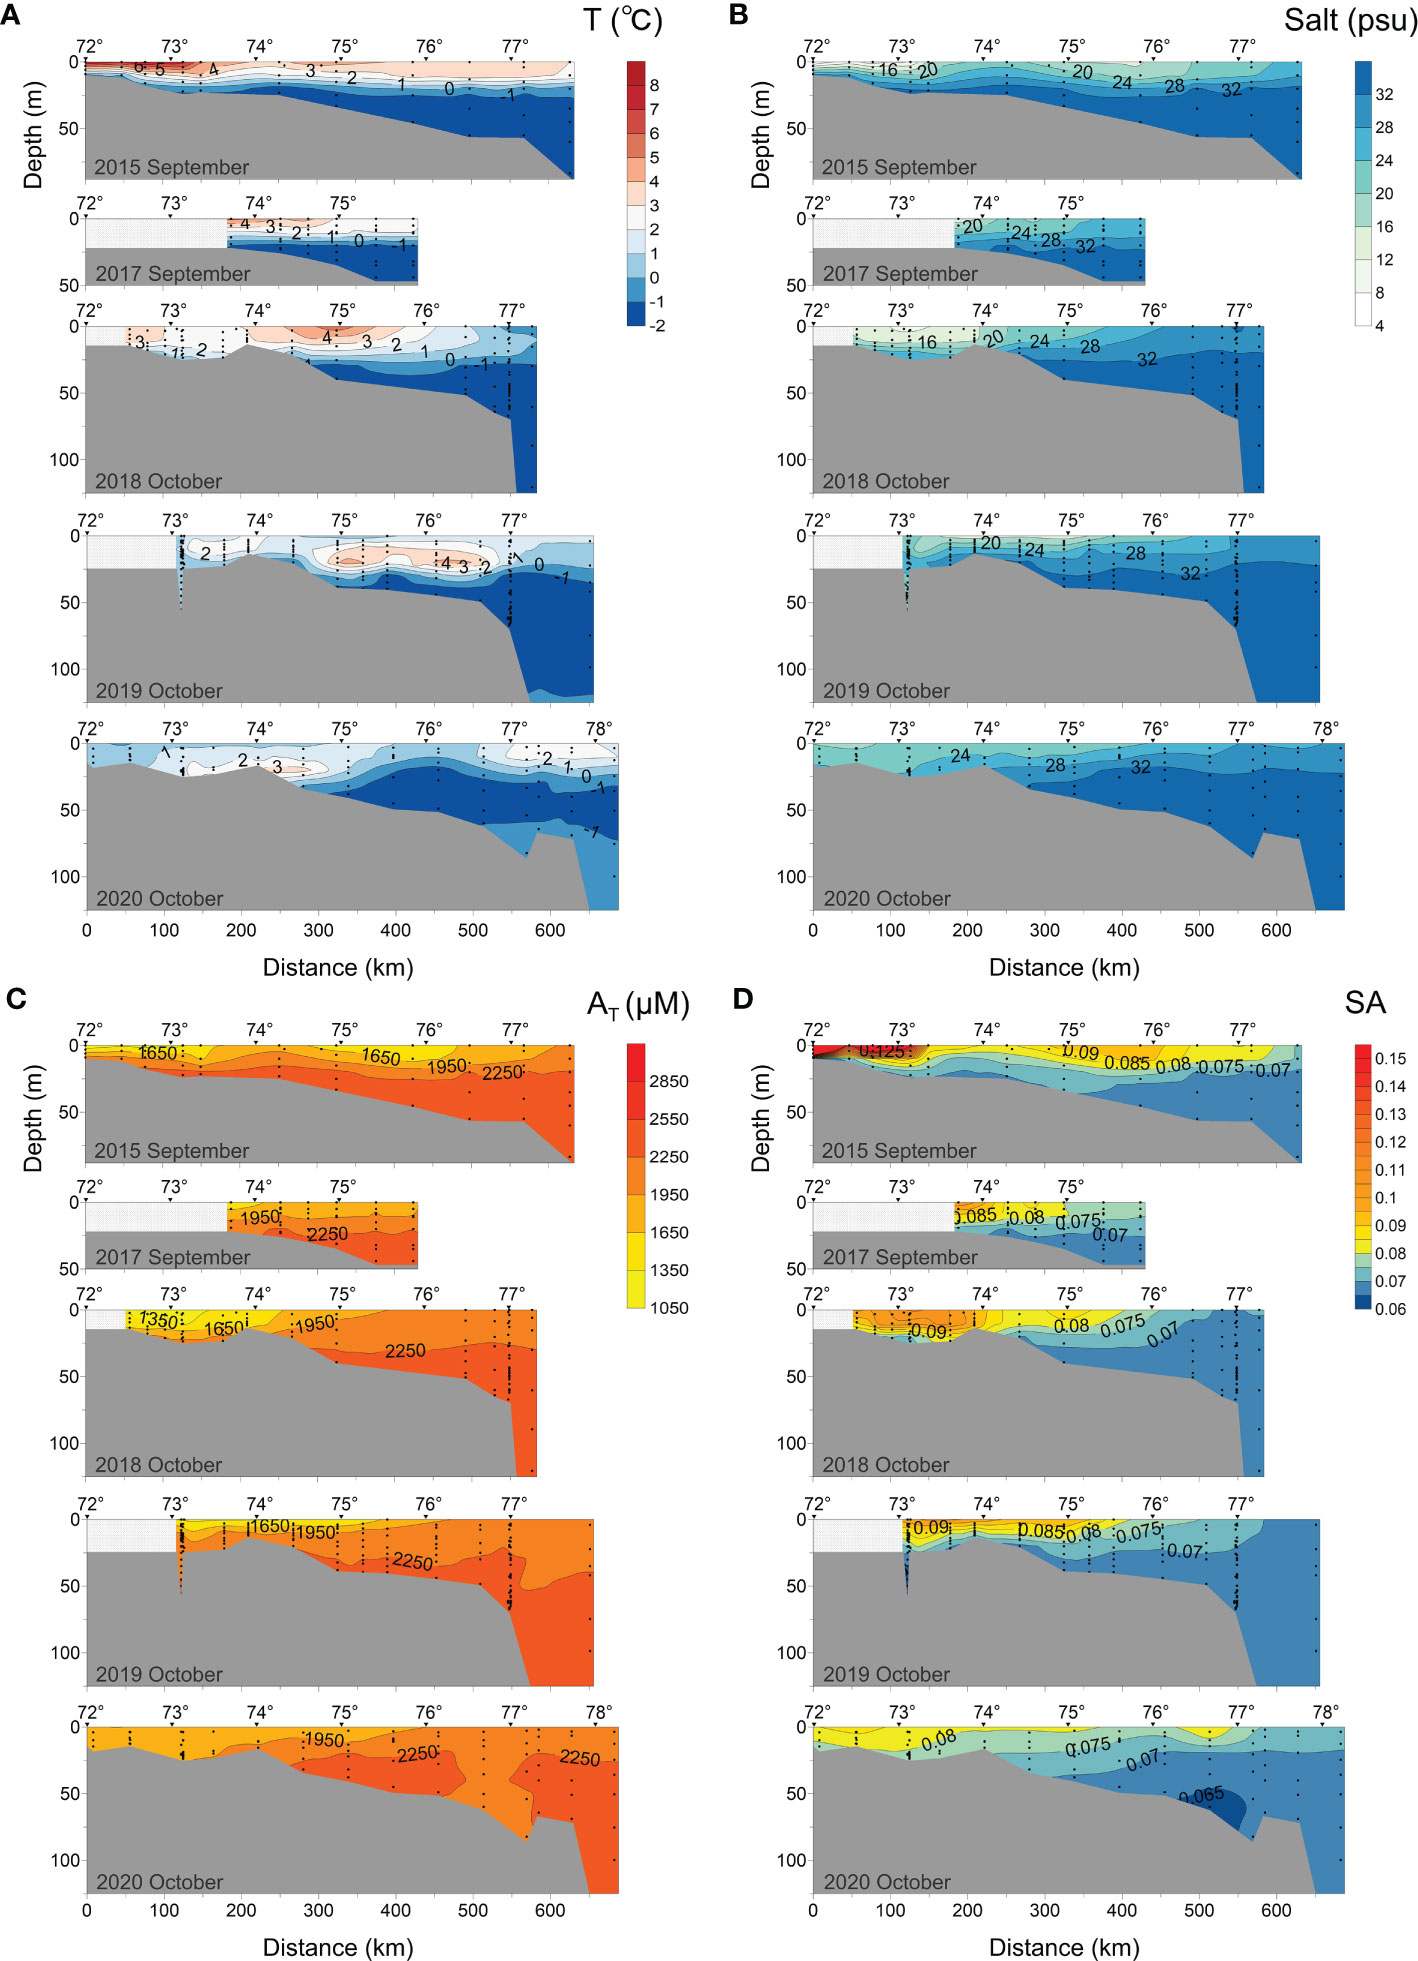
Figure 4 Distributions of (A) temperature, (B) salinity, (C) total alkalinity (AT, μmol·kg-1), and (D) specific alkalinity (SA) along the transect at 120°42′-133°36′ E in 2015, 2017-2020.
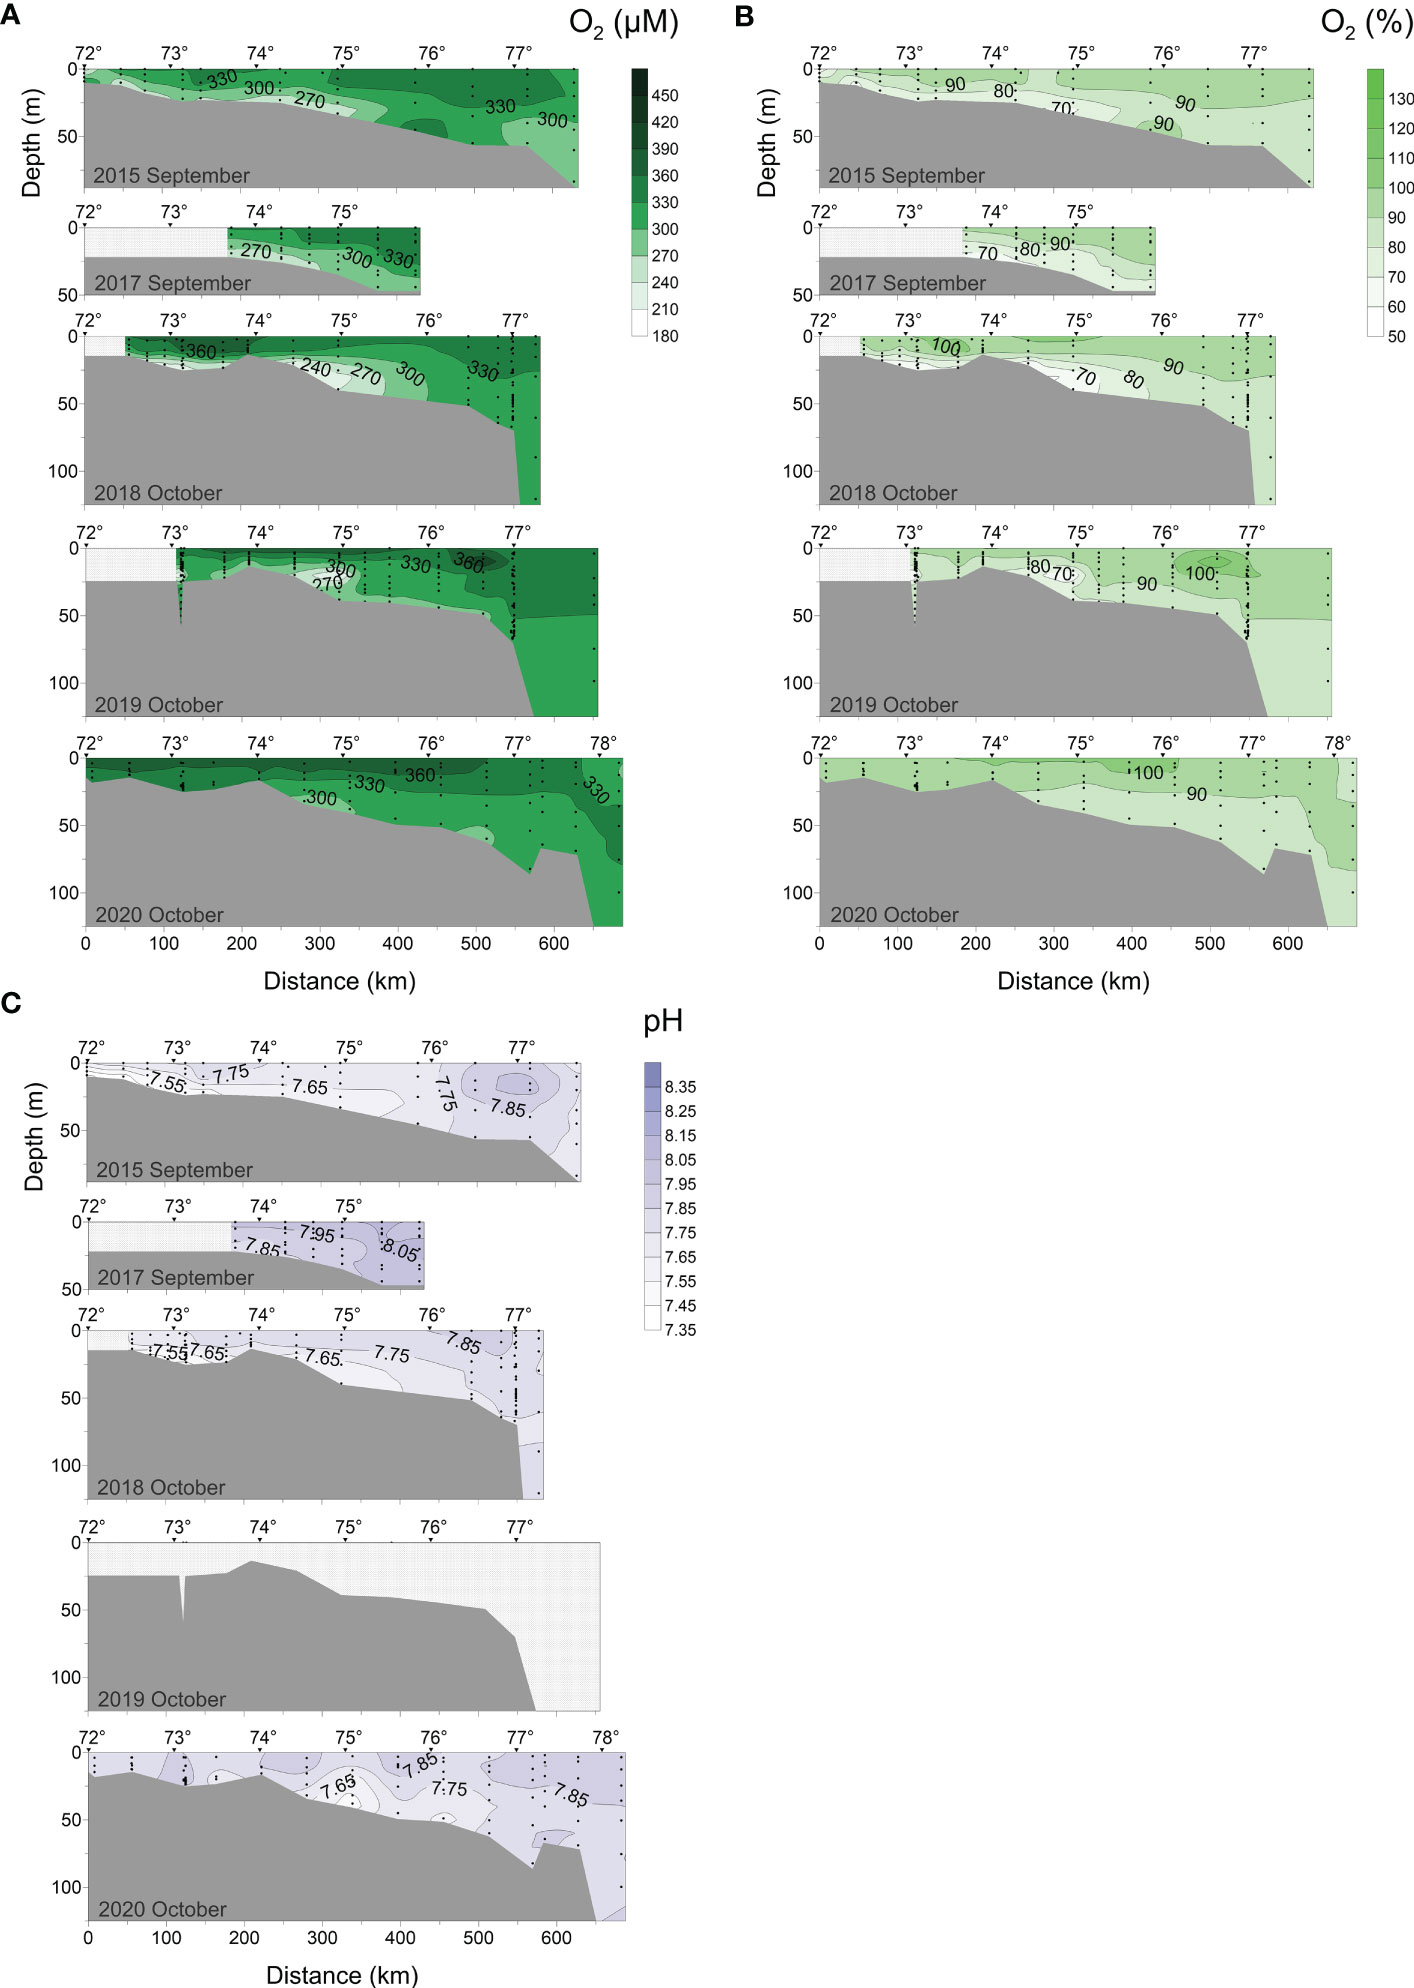
Figure 5 Distributions of (A) DO, (B) O2 saturation, and (C) pH along the transect at 120°42′-133°36′ E in 2015, 2017-2020.
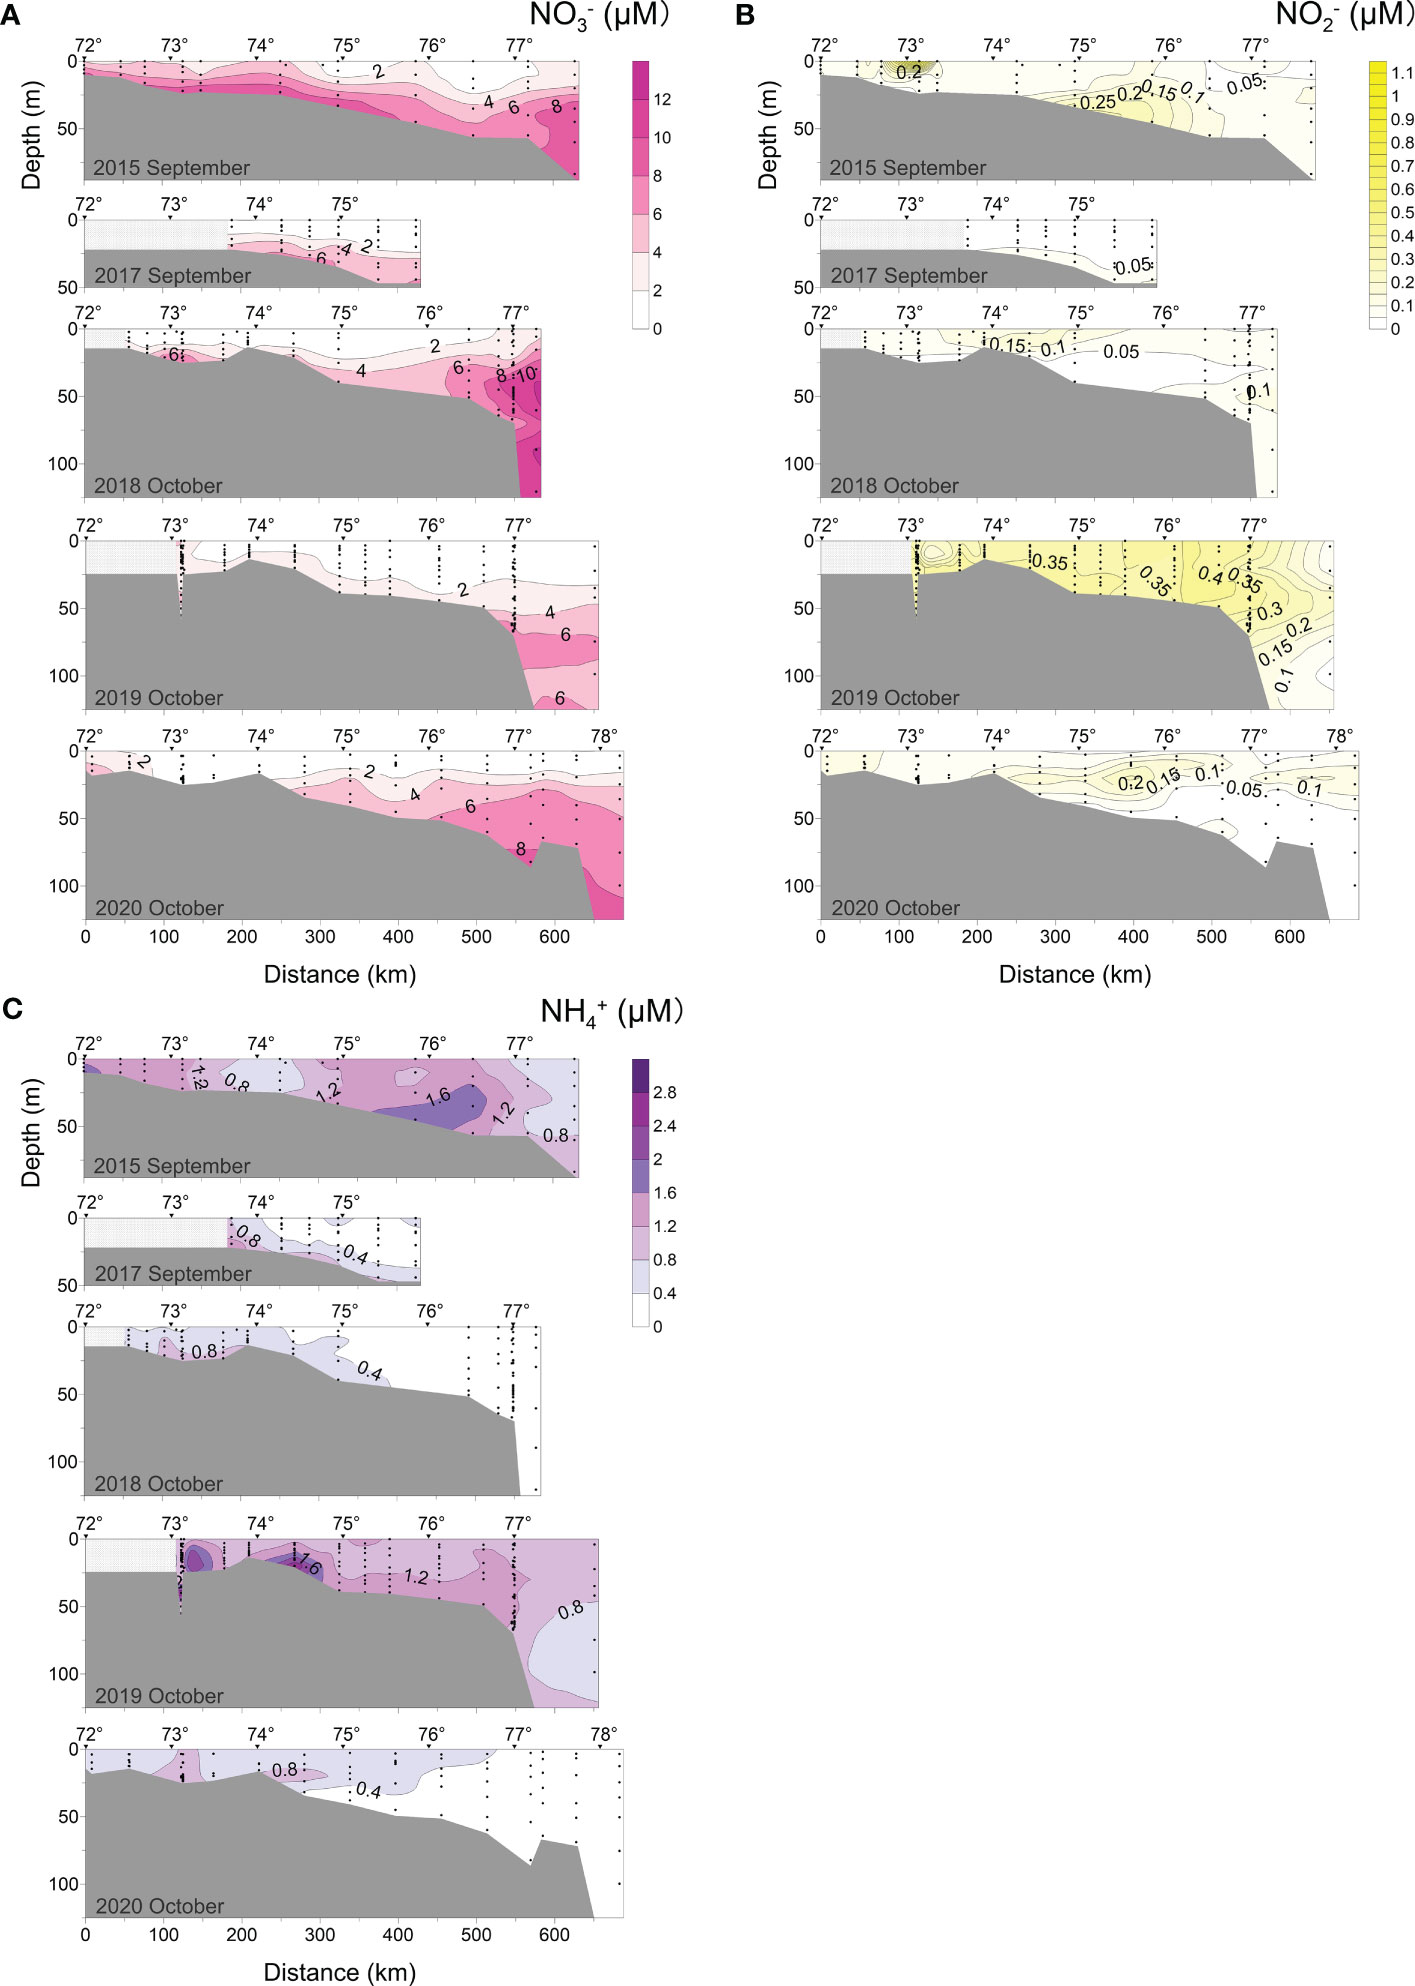
Figure 6 Distributions of (A) nitrate (NO3-), (B) nitrite (NO2-), and (C) ammonium (NH4+) along the transect at 120°42′-133°36′ E in 2015, 2017-2020.
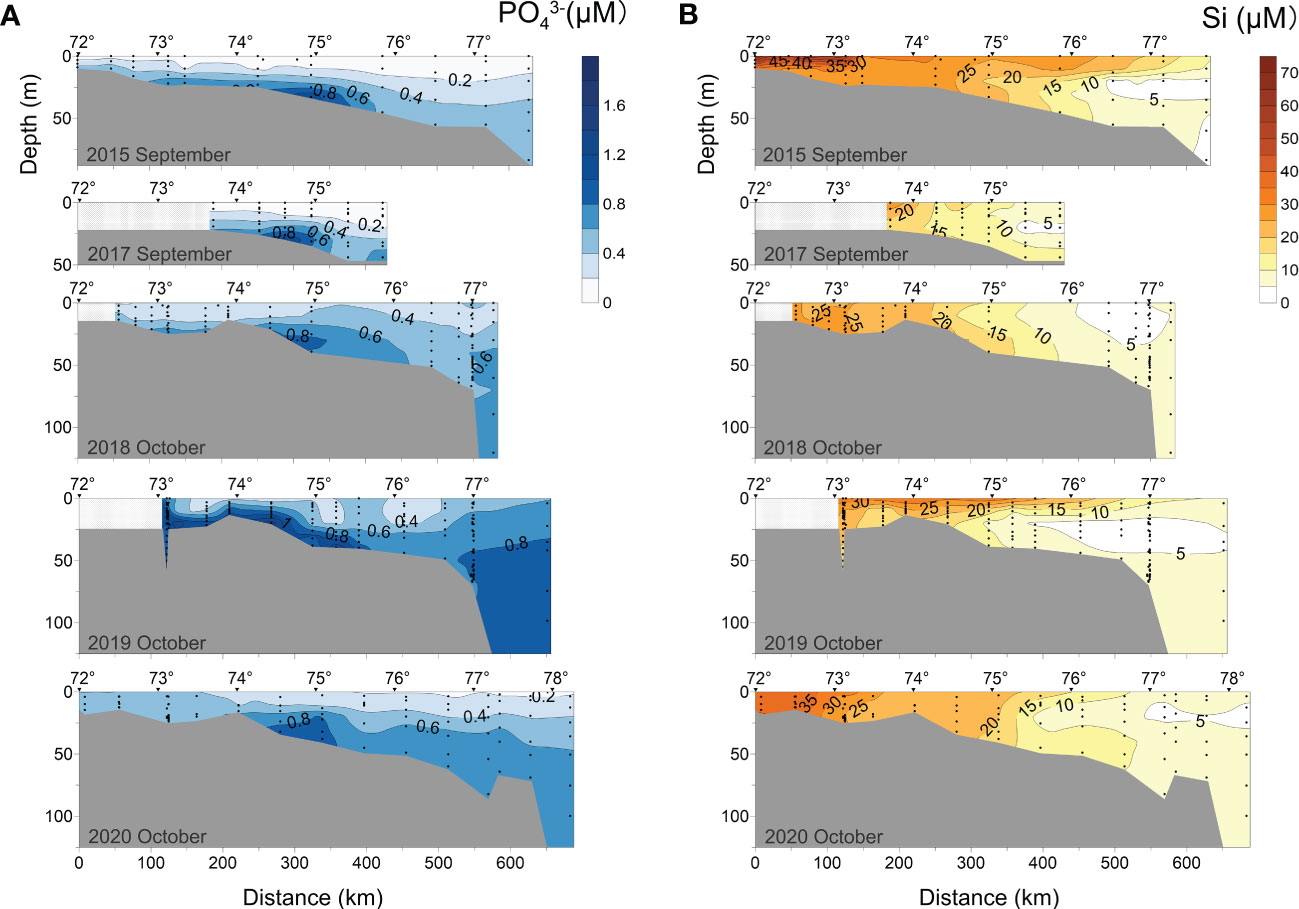
Figure 7 Distributions of (A) phosphate (PO43-) and (B) silicon (Si) along the transect at 120°42′-133°36′ E in 2015, 2017-2020.
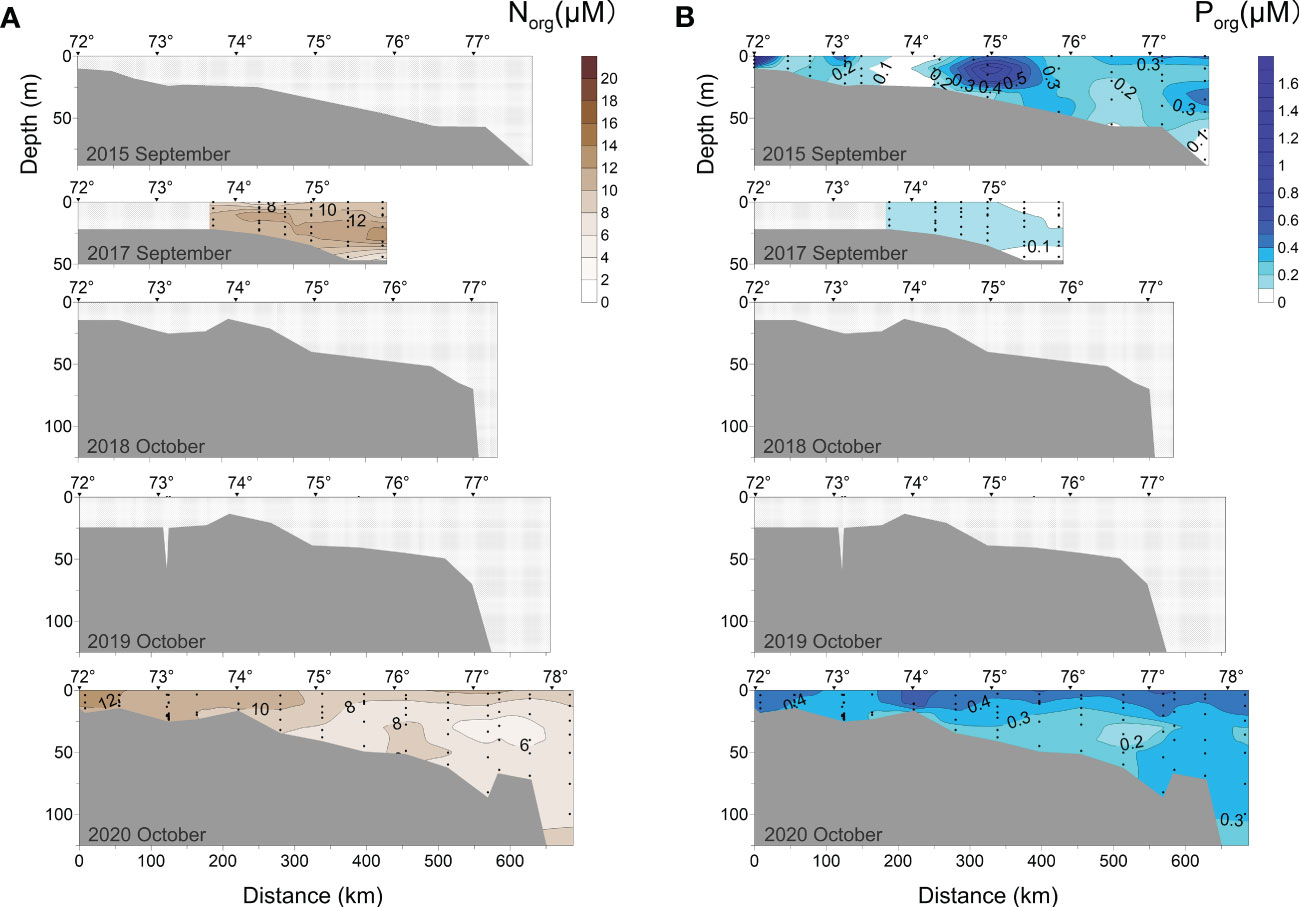
Figure 8 Distributions of (A) organic nitrogen (Norg) and (B) organic phosphorus (Porg) along the transect at 120°42′-133°36′ E in 2015, 2017-2020.
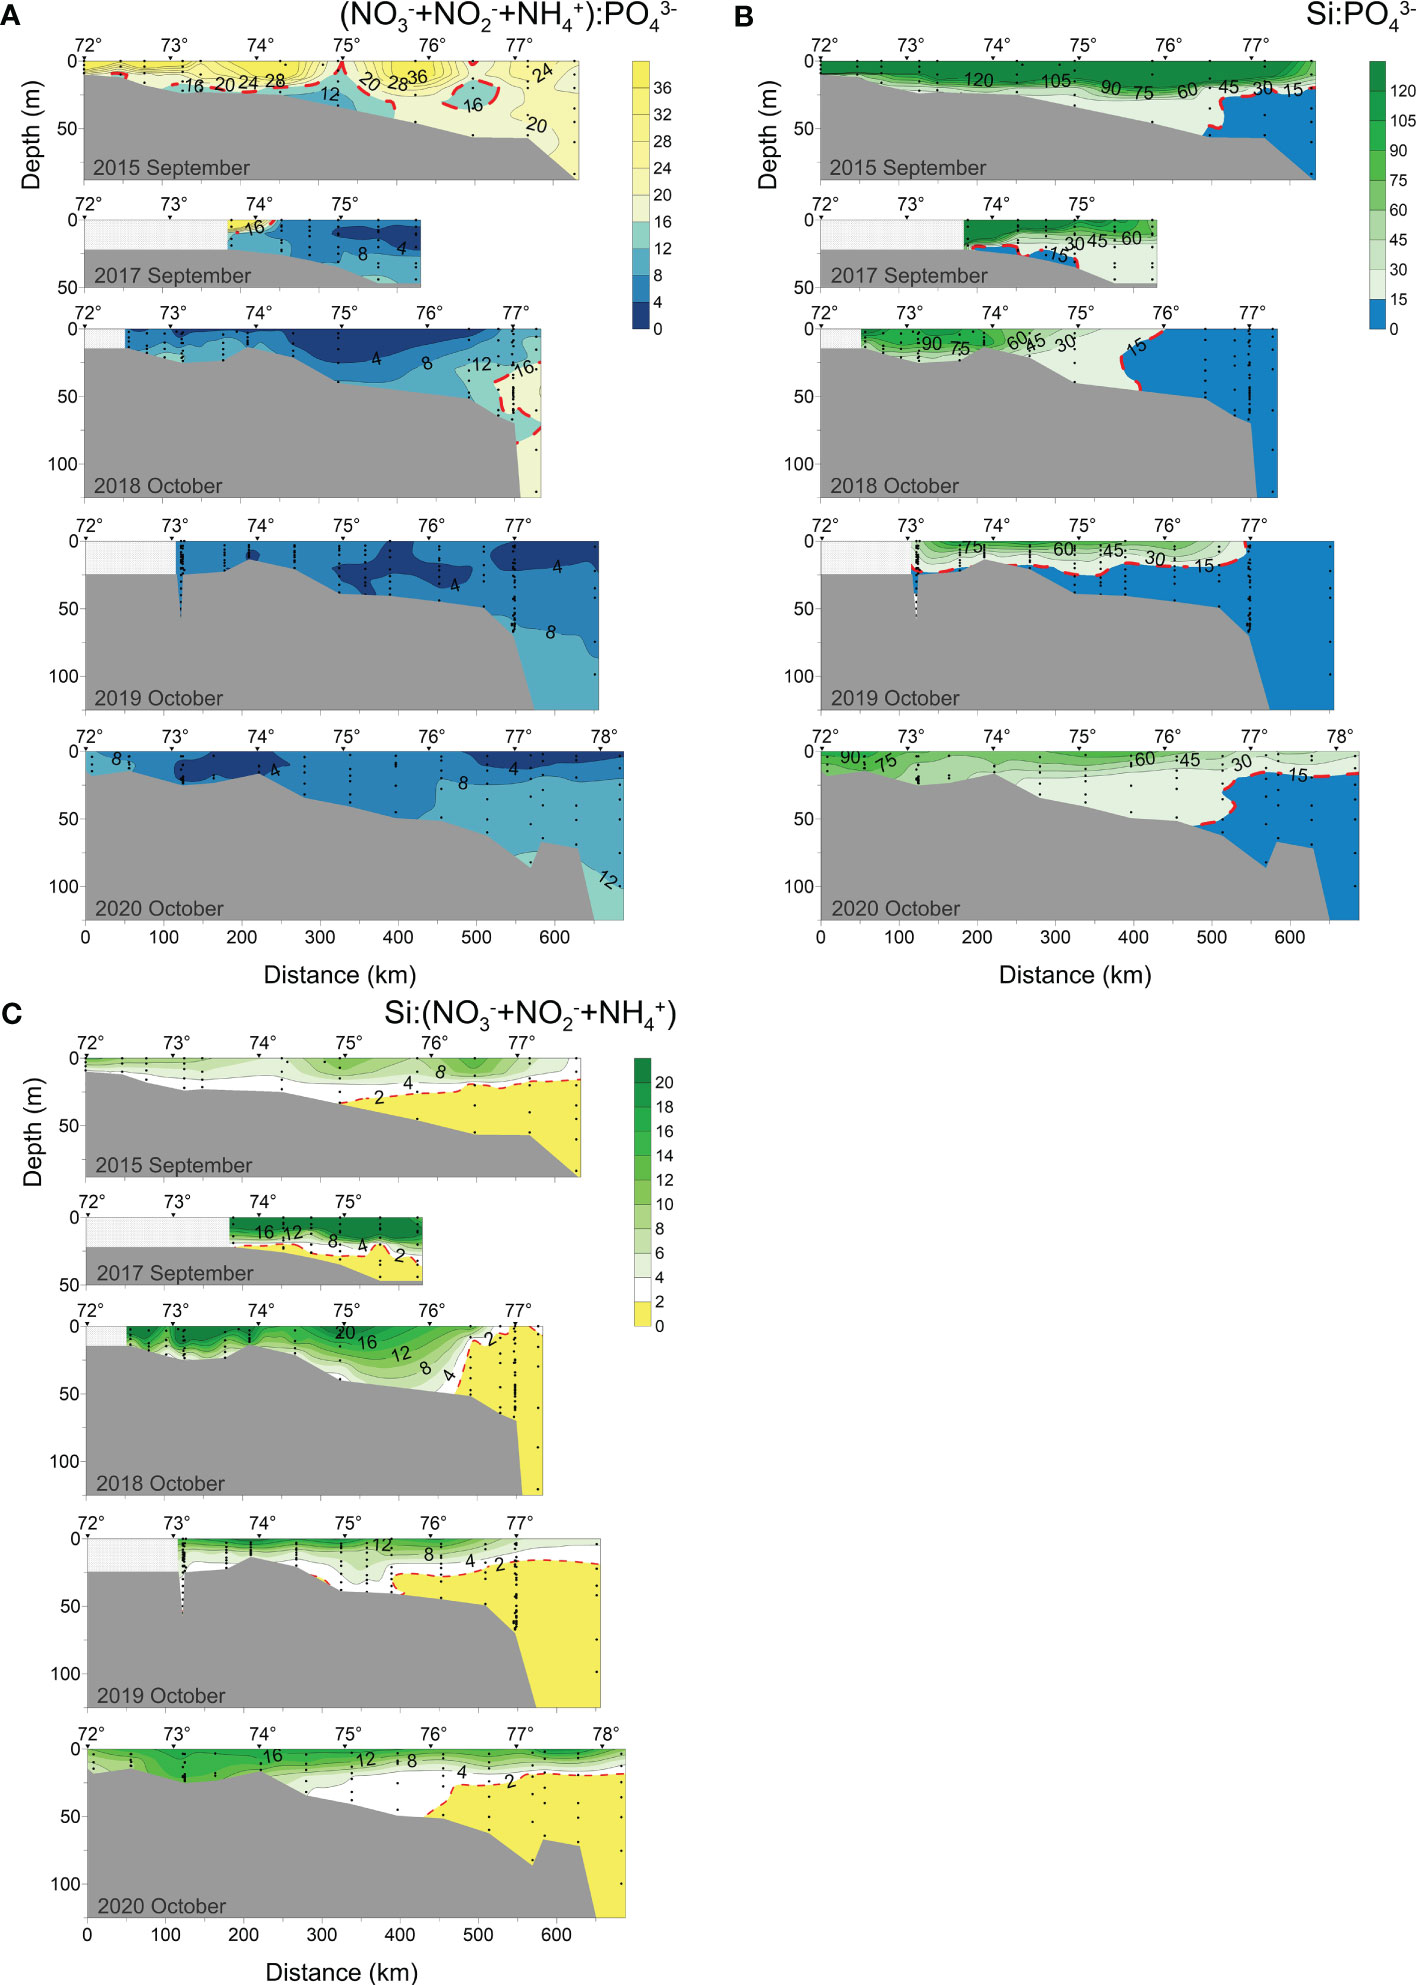
Figure 9 Distributions of (A) inorganic N:P ratio ((NO3-+NO2-+NH4+):PO43-), (B) inorganic Si:P ratio (Si : PO43-) and (C) Si:N ratio (Si:(NO3-+NO2-+NH4+)) along the transect at 120°42′-133°36′ E in 2015, 2017-2020.
According to hydrophysical data (Figures 4A, B), in early September 2015, the differences in temperature and salinity between the Lena River plume water and the surrounding water were largest due to the nearby August flood period, in this period maximum values of temperature (> 8°C) and minimum values of salinity (< 10 psu) were detected. The plume layer (0-15 m, marked out by 2-3°C isotherm, 22-24 psu isohaline) was isolated from the bottom water with a well-pronounced thermocline and halocline. At a distance of 180-300 km from the estuary, the 20 psu isohaline was depleted, salt water penetrated to the surface layer, and the water temperature decreased. In early September 2017, the isohaline of 20 psu and the isotherm of 3°C onsets were observed at a distance of about 320-350 km away from the estuary. In early October 2018, the processes of degradation of the pycnocline, decrease of temperature, and increase in salinity led to the deepening of the thermocline to 35 m depth. The surface salinity decreased from 11 psu near the delta to 20 psu at 250 km distance. In early October 2019, the low-salinity (< 20 psu) water layer became thinner (<10 m). Significantly different from other years, this period formed a local high temperature layer (2-6.4°C) in the subsurface water (10-25 m) within 290-530 km from the estuary. This may be due to the cooling effect of cold air on the surface seawater. In mid-to-late October 2020, the plume was mixed with high-salinity seawater, which made the variation in water temperature and salinity in the vertical direction non-obvious. The surface water temperature dropped to 0-3°C, while the salinity increased to 22-32 psu, even a 20 psu isohaline onset was detected at a distance of only 100 km from the coast.
AT increased from the estuary to the open sea, and also with the depth (Figure 4C). This distribution of AT was similar to that of salinity (Figure 4B). The isolines of 1 950 μmol kg-1 AT and 0.75-0.08 SA roughly correspond to a salinity of 26 psu in all the years. In early September 2015, the minimum AT (1 073 μmol kg-1) and maximum SA (0.36) were recorded in the surface layer near the delta, suggesting the substantial presence of river waters. Further toward the sea AT increased and SA decreased. Around 600 km away from the delta AT was 1 950 μmol kg-1 and SA was 0.08. A significant influence of river flow on surface water was recorded in the southern part of the transect (50-250 km from the delta) in early October 2018. Low AT (< 1 650 μmol kg-1) and high SA (> 0.075-0.08) water was distributed closer to the bottom than in other transects. However, the river’s horizontal influence appears to be limited, as evidenced by the shortest northward extension of the 1950 μmol kg-1 AT isoline boundary over 5 years. The 2250 μmol kg-1 AT isoline in early October (2018, 2019) moved deeper compared to early September (2015, 2017). This suggests that mixing of the plume with seawater occurs at deeper locations over the seasons. In mid-to-late October 2020, the influence of the river weakened, leading to a rise in AT and a decrease in SA across the transect, resulting in a more homogeneous distribution of AT and SA.
In early September 2015 and 2017, the ranges of DO and O2% values were between 223-359 μM and 234-371 μM, 62-99% and 64-97%, respectively (Figures 5A, B). In the bottom water of the mixing zone, where the vertical salinity gradient was the highest, the DO and O2% dropped below 270 μM and 70%, respectively. In addition, we observed that the DO of the surface water within 220-320 km from the estuary in early September 2015 was lower than in the surrounding seawater. The variabilities of the DO (217-412 μM, 182-452 μM) and O2% (60-108%, 50-126%) in early October 2018 and 2019 were larger than those in early September. Compared with early September, a high-oxygen layer appeared in the surface water in early October, while the DO in the low-oxygen region at the bottom decreased further. In 2018, the hyperoxic layer (partial seawater O2% >100%) was detected in the surface layer within 120-370 km from the delta. In 2019, the surface high-oxygen seawater was distributed at 120-550 km (including O2% supersaturation in the 470-550 km region). In mid-to-late October 2020, the distribution of DO (290-388 μM) and O2% (80-105%) in the transect were more uniform. The low-oxygen zone at the bottom disappeared this season.
pH distribution in September 2015, 2017 and early October 2018, was characterized by clear stratification near the delta (Figure 5C). The minimum pH values (7.55, 7.67, 7.35, respectively) were observed in the low oxygen bottom layer, and the highest pH values (7.99, 8.13, 7.88, respectively) were found in the surface layer where DO concentrations were also high.
The distributions of nitrate, nitrite, ammonium nitrogen (N) species, and nitrate phosphorus (P) species are shown in Figures 6 and 7A. In September-October, the distributions of NO3- and PO43-were generally similar (Figures 6A, 7A). They had low values in the surface waters and gradually increased with depth. In early September 2015, the averaged surface (0-10 m) NO3- and PO43-concentrations were 3.34 μM and 0.17 μM, respectively. The highest contents of NO3- (1.37 μM) and PO43- (1.22 μM) were found in the bottom waters of the transect from the delta to 420 km. In early September 2017, the NO3- concentrations were lower compared to 2015, however, PO43- levels did not change significantly.
NO3- and PO43- seem to show different seasonal variations in September-October. In early October (2018, 2019), NO3- remained low (< 2 μM) in the entire surface layer (0-10 m). The highest content of NO3- (10-12.64 μM) was detected near the shelf edge > 25 m deep in 2018 while it was 8-9.98 μM in 2015. On the contrary, the PO43- content of surface water (0-10 m) increased from 0.3 μM in 2018 to 0.57 μM in 2019, respectively. In 2019, the maximum PO43- content (1.74 μM) was recorded at the bottom of the plume-affected region.
The concentrations of NH4+ and NO2- were much lower than of NO3- (Figure 6). There was no evident seasonality (September-October) in the spatial distribution of NH4+ in the 5 transects, but it was synchronized with NO2-. In early September 2015, the maxima of NH4+ (2.15 μM) and NO2- (1.11 μM) were observed near the delta, and another peak value was at the bottom of the plume-salt water mixed transition layer (300-500 km from the estuary). At a distance of 150-300 km from the delta it was a decrease in NH4+ and NO2- values. In early September 2017, early October 2018, and mid-late October 2020 transects, the low contents of NH4+ and NO2- were detected. In early October 2019, high NH4+ (0.8-2.88 μM) and NO2- (0.2-0.5 μM) concentrations were observed in the 120-550 km distance from the coast, in which a peak content of NH4+ (2.88 μM) across all five profiles observed in the bottom layer.
Generally, Si concentrations decreased rapidly with increasing depth and distance from the river mouth (Figure 7B). The water with high Si content was distributed as a thin surface layer. In the subsurface layer, extensive low Si zones (< 5 μM) were formed at 370-610 km distance from the estuary. In early September (2015), concentrations of Si in the shallow water layer near the delta had the highest value of 67 μM. In early September 2017, Si concentrations were in the same location lower compared with September (2015). 2018-2020 data show that later in the autumn Si concentration in the surface layer decreases. It is worth noting that the vertical structure of Si content was more visible in early October 2019 than in 2018 and 2020.
In this study, Norg and Porg were measured in 2015, 2017, and 2020 (Figure 8). In early September (2015), the Porg ranged from 0.01-1.63 μM. There were two Porg-enriched regions (Porg > 0.5 μM) in the surface seawater at 300-380 km from the delta. In the region (170-250 km) between these two zones, fully mixed water body was characterized by low Porg (< 0.1 μM) from bottom to the surface. Compared to 2015, the early September 2017 transect had lower Porg values (0-0.22 μM) and had its uniform distribution. Norg was high in 2017, where most of the seawater had Norg above 8 μM. The highest value (18.47 μM) was recorded in the subsurface layer in the northern part of the transect. In mid-late October (2020), Porg and Norg contents ranged from 0.05-0.68 μM and 4.0-15.3 μM, respectively. In general, both the Porg and Norg contents were enriched in the surface layer and depleted at the bottom layer. Norg content also showed a decreasing trend from the river mouth to the open sea, which supports previous data (Semiletov et al., 2011; Semiletov et al., 2012).
Figure 9 show the distribution of N:P, Si:P and Si:N ratios. N:P and Si:P ratios varied with the seasons. In early September (2015), a strong stratification of the water column caused the surface N:P and Si:P to be significantly higher than near the bottom. The ratios of N:P and Si:P closer to the river mouth tended to be higher. The N:P ratio was lower than Redfield ratio (16:1) at the bottom seawater affected by the plume (i.e., the area with high NO3- and PO43-) and subsurface seawater at 460-530 km from the river mouth. The Si:P ratio in the bottom layer (about 25 m) in the northern part of the transect fell below 15:1. Unlike 2015, in September 2017 water with high N:P and Si:P ratios was observed only in the surface layer close to the river mouth. The Si:P ratio in surface seawater in October (2018-2020) was considerably lowered due to the vertical mixing process, but vertical stratification could still be seen. The Si:P ratio at the plume’s mixed layer’s boundary is around 15:1.
In early September (2015), the Si:N ratio decreased from the surface layer to the bottom layer, and the Si:N ratio was close to 2:1 at a depth of about 20 m. Mixing affected the Si:N ratio distribution in the region 150-280 km from the river where the vertical gradient was smooth compared to the surrounding water body. The Si:N ratio of surface water was significantly higher in early September 2017 than in early September 2015, and the contour distribution was denser. Because of a consumption of inorganic nitrogen in the surface seawater and a dilution of Si with vertical mixing, the seasonal variation in Si:N ratio was not visible in October (2018-2020). The Si:N ratio in the three October transects (2018-2020) showed a decreased trend from the surface layer to the bottom layer, with the highest value distributed near the river. The Si:N ratio in the 0-15 m layer in the southern and middle parts of the transect (50-470 km from the river) was higher in early October 2018 than in early 2019 and mid-late 2020, but it rapidly decreased to 2:1 at about 470 km from the estuary. The Si:N ratio at the profile 0-250 km away from the estuary was generally greater than 6:1 in 2020, as a result of the vertical mixing process.
3.3 Identification of water masses
Figure 10 shows the relationship between temperature and salinity of the profiles studied for all 5 years’ cruise (2015, 2017-2020) (Figure 10A) and in separate year (Figures 10B-F). During the process of mixing warm fresh plume water and cold salty water, the properties gradually changed and did not show a clear boundary between them. Totally, to track a transformation of river plumes during different seasons (from September to October), 6 water masses were identified in the eastern part of the Laptev Sea: (I) warm fresh water with the temperature > 3°C and salinity < 24 psu; (II) cold fresh water with the temperature < 3°C and salinity < 24 psu; (III) warm mesohaline water with the temperature > 3°C and salinity = 24-30 psu; (IV) cold mesohaline water with temperature < 3°C and salinity = 24-30 psu; (V) warm salinity water with the temperature > 3°C and salinity > 30 psu; (VI) cold salinity water with the temperature < 3°C and salinity > 30 psu.
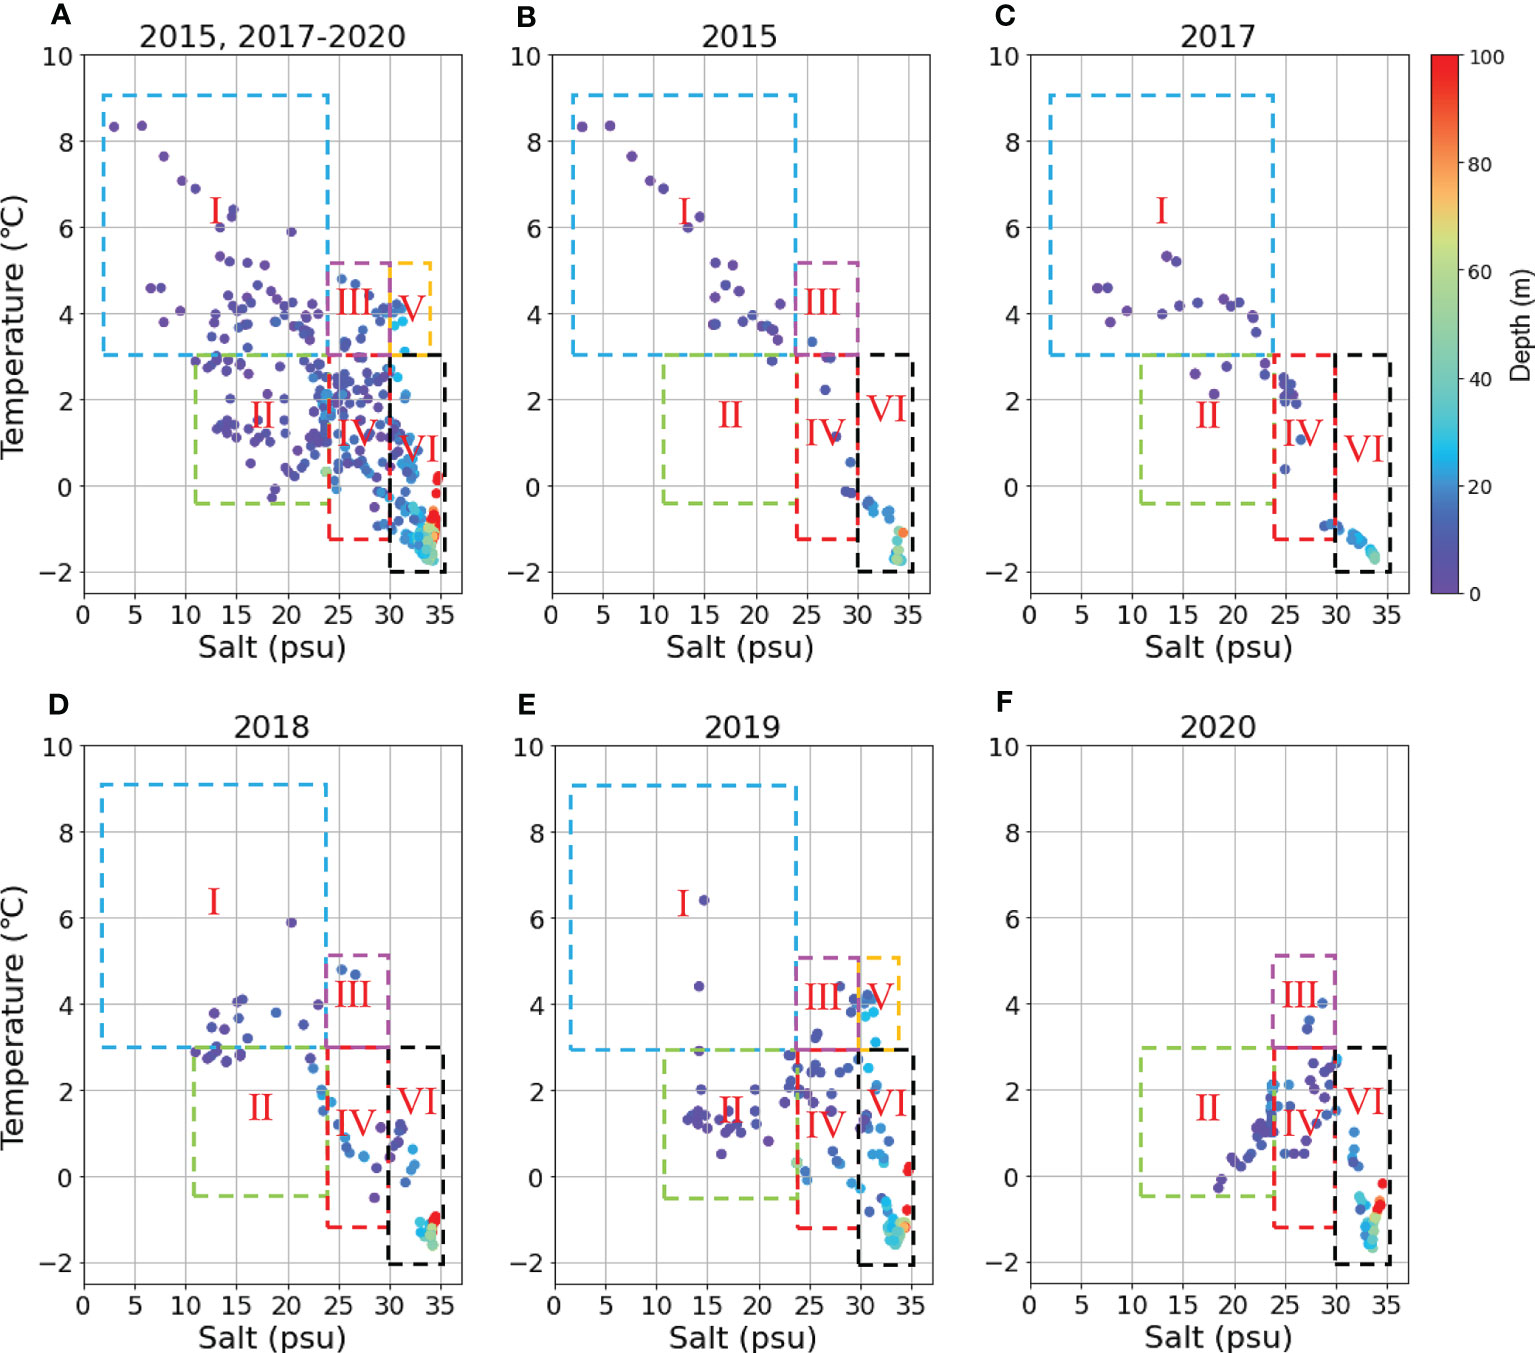
Figure 10 Temperature-Salinity diagram along the transect at 120°42′-133°36′ E in 2015, 2017-2020, color coded by depth. (A) all five years; (B) 2015; (C) 2017; (D) 2018; (E) 2019; (F) 2020.
The transportation, mixing and property transformation of water masses make the hydrological structure very complicated. As a result, there is uncertainty in the interpretation of the temperature-salt relationship for water mass dynamics studies. To obtain more reliable results, we used additionally different biogeochemical characteristics for water categorization and analysis utilizing the hierarchical clustering method.
On the standardized transformed dataset, we did PCA analysis and got PCA principal component interpretations of the variables (Table 1). PC1 had a large factor loading in Temperature, Salt, AT, SA and Si. These indicators are generally considered to be conservative tracers of Arctic Ocean river plumes (Stepanova et al., 2017). PC2 had a large factor loading in DO, O2% and NO3-. PC3 had a large factor loading in NO2-, NH4+, and PO43-. PC2 and PC3 are thought to be involved in biological activities such as photosynthetic production by phytoplankton and OM deposition and decomposition. Cluster analysis will use the information revealed by the major components to roughly identify and classify water samples.
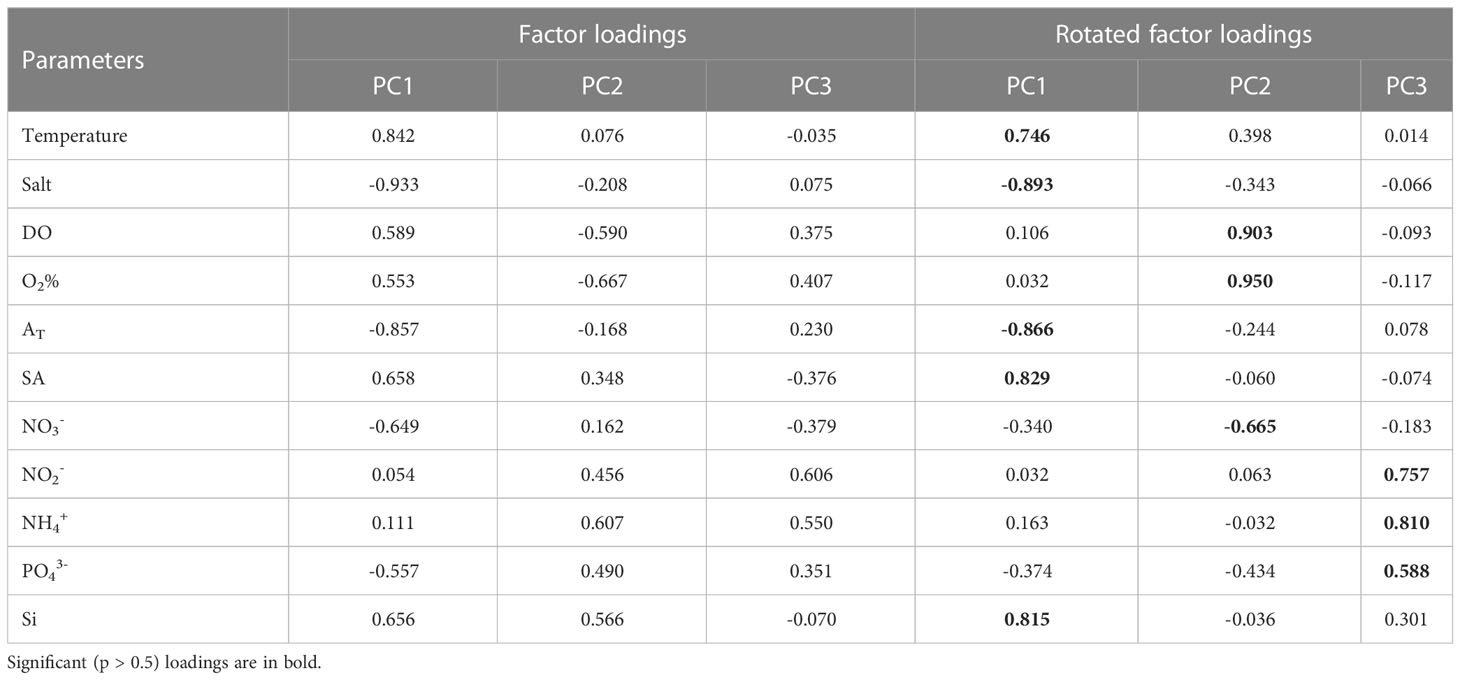
Table 1 Component loadings by PCA for all samples (n=477) along the transect at 120°42′-133°36′ E in 2015, 2017-2020.
Figure 11 depicted the visualization results of T-S analysis and cluster analysis. The water mass type was included as a qualitative additional variable (grouping variable) in the PCA ranking analysis to determine whether the groups were separated (Figure 12). The PCA plot showed that the T-S method’s ellipses were highly overlapped and could not be easily classified. In contrast to the former, the samples in the same group were clustered together in the output results of the clustering method, and the discrimination between groups was higher with more independent ellipses, indicating that the cluster analysis can better distinguish seawater with different properties. Then we quantified the physical and biogeochemical characteristics of the water masses classified by clustering analysis to investigate the interannual and interseasonal hydrological changes in the southeastern Laptev Sea.
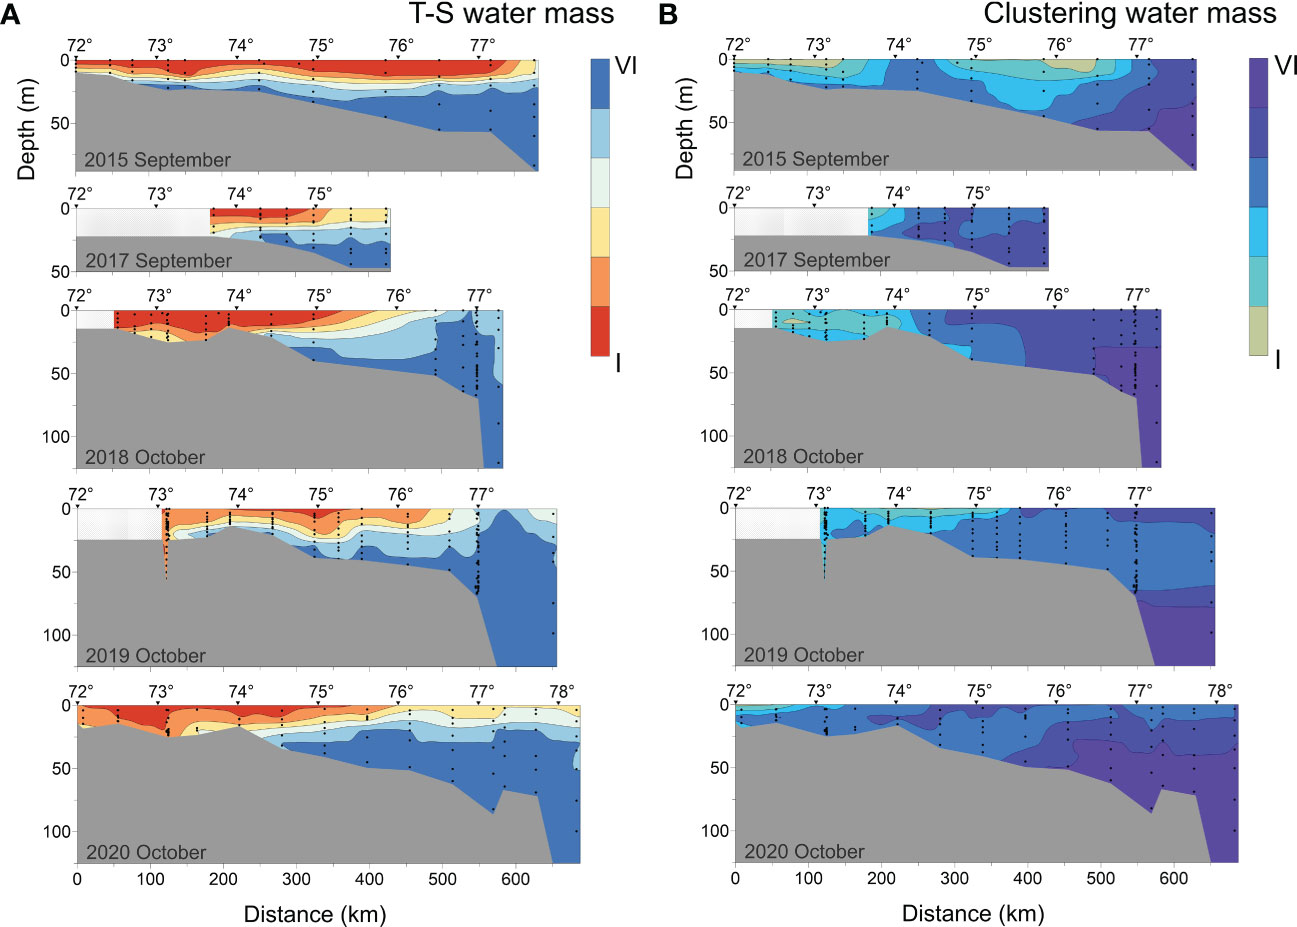
Figure 11 Vertical distribution of (A) T-S water mass and (B) Clustering water mass.
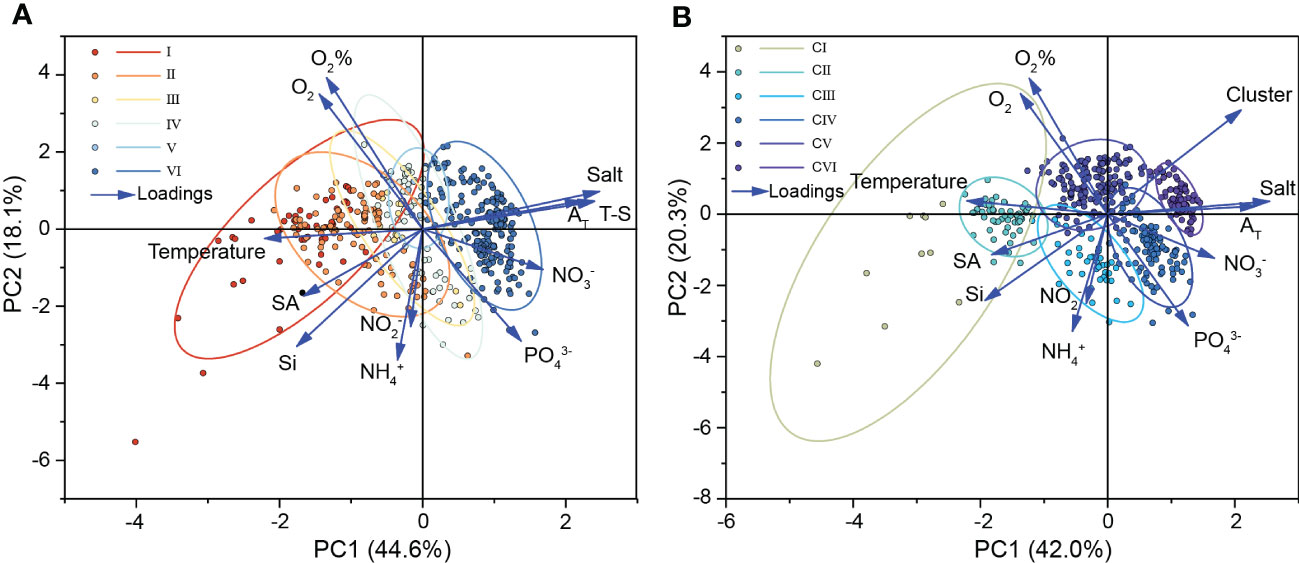
Figure 12 The Principal Component Analysis (PCA) of (A) T-S water mass and (B) Clustering water mass. Color coded by water mass.
In early September, CI (water mass classified by clustering analysis) was distributed in the surface waters of the southeastern Laptev Sea (2015). This warm and low-salinity water mass was most likely a mixture of fresh water from the Lena River and surface seawater. In October, CII was found below CI, or in the delta area, where the river and sea water were further mixed during the seasons. As a result, the salinity of CII increased while the Si content decreased. The concentrations of NO3- and PO43- in CI and CII were close to the lowest of all studied samples due to phytoplankton consumption. CIV distribution appeared to be influenced by atmospheric circulation and varied from year to year. In early September 2015, CIV emerged near the bottom of the plume influence transect. In early September 2017, CIV emerged at the northern boundary of CII and CIII likely due to the weak wind force. CIV, together with CII and CIII, was dispersed closer to the estuary in 2017 than that in 2015. CIV is dispersed in the middle of the profile in October (2018) when onshore wind predominated. CIV was widely spread from the bottom layer near the estuary to the sea region further from the estuary in the years (2019 and 2020) influenced by offshore winds. The DO content of CIII and CIV was low (especially in CIV), but the inorganic nutrient content (NO3-, NH4+, PO43-) was relatively high. The sea area where such water masses appear was most likely a site of widespread organic nutrient deposition and mineralization. CV formed on the surface near the open sea and with a low river water content. With the mixing of seawater, CV occasionally entered the bottom layer of the northern boundary of the CIV water mass. The cold, salty bottom seawater far from the estuary was referred to as CVI. The distinction between CV and CVI was primarily determined by their distribution positions in the transect as well as their DO and inorganic nitrogen concentrations. The CV in surface seawater is high in DO owing to oxygen exchange at the air-water interface, but the concentration of Si and NO3- in this area is low due to a lack of nutrient input sources. The bottom CVI water mass has the highest concentration of NO3- and a somewhat lower DO content than CV, owing to the resuspension of sedimentary nutrients at the bottom or the decomposition (oxidation) of dead organic material.
4 Discussion
4.1 Plume dispersion
The most widely used and reliable indicators of the presence riverine origin water are salinity and SA. One can assume a significant presence of freshwater plume when salinity is less than 24 psu, and SA is greater than 0.08 (Semiletov et al., 2005; Stepanova et al., 2017; Makkaveev et al., 2018; Osadchiev et al., 2021). Temperature, salinity, and SA data show that the plume had the largest size in 2015 (early September) and 2020 (mid-to-late October) (Figure 4). The plume northward spread could reach 600 km from the estuary. In 2018, the plume spread was the smallest, about 250 km. 2017 and 2019 (approximately 420 and 500 km) were intermediate cases. Spatial-time dynamics of the riverine plume are driven by precipitation patterns and wind characteristics caused by the Arctic Oscillation (AO) (Johnson and Polyakov, 2001; Dmitrenko et al., 2005; Semiletov et al., 2005; Dmitrenko et al., 2010; Semiletov et al., 2016; Osadchiev et al., 2020a). This conclusion can be supported by the records of river flow, location of salinity gradient boundaries (24 psu), and seawater SA (> 0.08) (Figures 2, 4). Some studies have linked the Arctic Oscillation (AO) index to freshwater content on the Arctic Ocean or continental shelves (Steele et al., 2004; Morison et al., 2014). When averaging the AO index during the summer months (June to October), we found a strong correspondence between AO and the Lena River discharge (Figures 2, 13). In this study, the river discharge from August to October were the largest in 2018, almost twice that of 2019, corresponding to positive AO values. The river discharges among 2015, 2017 and 2020 were close, and they were all at an intermediate level. The lowest discharge occurred in 2019 when the AO was negative. However, from August through October 2018 the Laptev Sea was dominated by northerly and westerly (onshore) winds. As a result, the surface water was pushed towards the coast. Years (2015, 2020) with predominantly southerly to south-easterly (offshore) winds were characterized by an offshore transport of the river plume, which led to the most development of plumes. Biogeochemical processes associated with the river plume.
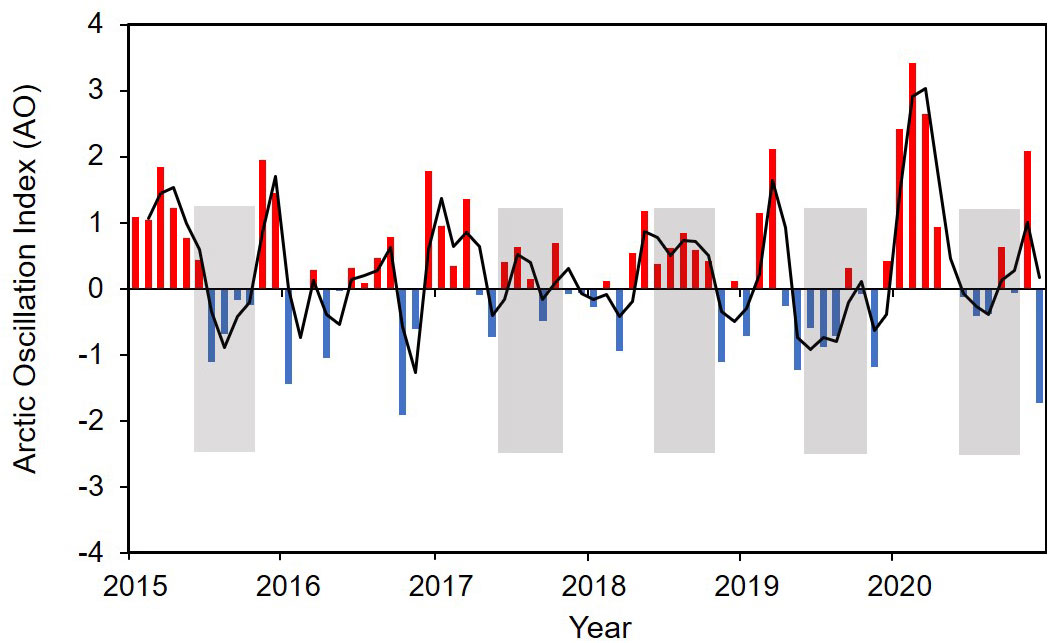
Figure 13 Time series of the Artic Oscillation (AO) index from 2015 to 2020. Data were provided by the Climate Prediction Center of the National Oceanic and Atmospheric Administration (NOAA) (http://www.cpc.ncep.noaa.gov).
In early September (2015-2017), the concentrations of NO3- and PO43- in the surface seawater (0-10 m) were exceptionally low, at 3.34 μM and 0.17 μM, respectively. This could be connected with their consumption for photosynthesis, or with the Lena River’s water properties in this period (Lara et al., 1998). Although the data indicated that photosynthesis was weaker than the oxidation process throughout this period (O2% was undersaturated, O2% < 99%, Figure 5B), nutrients values were still significantly less than that of the Lena River delta (6.00 μM and 0.80 μM; Cauwet and Sidorov, 1996; Kattner et al., 1999; Kostyleva et al., 2020). NO3- and PO43- data indicated that this Arctic river with the lowest inorganic nutrient concentration in the world (Dittmar and Kattner, 2003) continued to support primary production in the southern Laptev Sea. The high N:P ratio in the surface layer, on the other hand, indicated that phytoplankton productivity may be P-limited (Figure 9A) which contradicts with the other Arctic regions with a known N limitation (Pogojeva et al., 2022). Arctic rivers are rich in OM (Dittmar and Kattner, 2003) and in the autumn, the fluvial-derived SPM (detritus) and other organic components can abundantly be deposited in the bottom of the light-rich layer and participated in aerobic and anaerobic oxidation (Cauwet and Sidorov, 1996; Kostyleva et al., 2020), resulting in detected low oxygen (DO < 270 μM, O% < 70%, Figure 5A), low pH (7.32), and high NO3- and PO43- (Figures 5C, 6A, 7A) there.
The presence of estuarine OM and heterotrophs might promote NO3- regeneration in the surface layer (early September 2015), as indicated by the buildup of specific quantities of NH4+ and NO2- (Carlucci et al., 1970; Stepanova et al., 2017) and (Figures 6B, C). In the bottom of the transition layer, where the plume and sea water mixed (2015, 300-500 km from the estuary), it was very likely that there was a short-term increase in dissolved organic nitrogen content and organic nitrogen decomposition and conversion processes (ammonification and nitrification processes) (Lomas and Lipschultz, 2006), as the NH4+ and NO2- concentrations were higher than in the surrounding water. Sukhanova et al. (2017) confirmed on the same voyage that moderate desalination of the Lena River resulted in the reproduction of Thalassiosira nordenskioldii and Chaetoceros in local areas on the continental shelf edge, providing evidence for the production of large amounts of OM in the short term.
In early September (2015, 2017), the surface layer Si concentration was significantly higher (> 30 μM, Figure 7B) than inorganic nitrogen and phosphorus, greatly exceeding biological needs (Cauwet and Sidorov, 1996; Kattner et al., 1999), especially in shallow waters near estuaries. Si:P ratios in surface seawater that were significantly greater than the Redfield ratio did not influence primary production restriction (Figure 9B). This was most likely because diatoms and dissolved silicon entered the southern Laptev Sea via plumes in late summer and early autumn and accumulated in the estuarine mixing zone (Levasseur et al., 1984; Heiskanen and Keck, 1996; Kattner et al., 1999). Additionally, the strong pycnocline under the plume limited vertical mixing of oxygen and nutrients in seawater. During this period, possible nutrient deficits and reduced turbulence resulted in the death, disintegration, and fast deposition of diatoms (Moon and Dunstan, 1990; Heiskanen and Keck, 1996).
In early September 2015, an uprize of cold and salt bottom water (150-300 km) was observed, testifying to a local upwelling there. Here, the depth of the plume increased abruptly, salinity stratification reduced suddenly, and sea surface temperature decreased. Osadchiev et al. (2020b) also provided a detailed description of this coastal upwelling event near the Lena River delta. At the upwelling zone, bottom turbulence resuspended and injected sediments upward, bringing seawater with high AT, high NO3- and low Porg content to the surface (Figures 4C, 6A, 8B). However, an increase in NO3- concentrations could be due to organic nitrogen in the sediments participating in the nitrification process under relatively favorable DO conditions at the surface (Osadchiev et al., 2020b).
Despite a decline in phytoplankton photosynthesis in September, it still reached approximately half of the August levels. (Demidov et al., 2020). In early October (2018-2019), with the increase of phytoplankton uptake and an increase of the depth of vertical mixing (as indicated by the downward shift of the AT 2250 μM contour in Figure 4C), the thickness of the surface layer with low NO3- concentration gradually increased (Figure 6A). By 2019, the NO3- depleted layer reached its deepest point. In early October of 2018, there occurred a localized oxygen saturation zone (O2% > 100%) in the estuary. On the one hand, the large river flow increased the solubility of oxygen. On the other hand, this section of the river plume is strongly stratified, resulting in the abundance of phytoplankton such as motile nanoflagellates (Pyramimonas spp., Cryptomonadales), blue-green algae and chlorophytes (Heiskanen and Keck, 1996), which promote oxygen saturation of seawater.
In 2018, a small peak in NO3- near the bottom of the delta (approximately 100 km) was detected. This could be due to (1) the abundant input of total particulate matter (PM) to the Laptev Sea from summer rainfall (Juhls et al., 2020), which led to the deposition and degradation of OM from river and coastal erosion near the bottom, and (2) the high river flows throughout the year (Figure 2), which strengthened the upper water layers and minimized vertical mixing, resulting in the accumulation of inorganic nitrogen nutrients there.
The strong onshore wind (8-10 m·s-1, Figure 3) promotes an advective mixing process in the bottom water in the northern part of the transect, then might cause compensatory countercurrents caused by water subsidence to bring high-nutrient seawater from the open shelf part (Savelieva et al., 2010). The above-mentioned compensatory countercurrents is also the main reason for the significantly higher NO3- concentration centers (>10 μM) at the outer edge of the continental shelf at depths >25 m in the 2018 transect than that in the 2019 transect.
Unlike NO3-, the concentration of PO43- in early October (2018, 2019) showed a clear upward trend from surface to bottom. This demonstrated that vertical mixing was insufficient to homogenize the water column during this period. Except for the near-bottom layer along the 2018 transect, the total concentration of PO43- in early October 2019 was generally higher than in 2018, particularly in the bottom layer, where the maximum phosphate concentration across the 5-year journey was recorded (1.74 μM, Figure 7A). The disagreement in vertical distribution between these characteristics was likely caused by the fact that NO3- was often consumed at a faster rate than PO43- (Tyrrell, 1999). We also suggest that an increase in PO43- concentration in 2019 was related to vertical mixing of seawater and resuspension of sediments-simple extraction of nutrients. It could decrease surface seawater temperature and enhance DO solubility (Weiss, 1970; Figure 5). Both factors accelerated the mineralization of phosphorus-containing suspended particulate matter, thus increasing the PO43- concentration. The 2019 distributions show larger concentrations of NO2- and NH4+ than in 2018 (Figures 6B, C), indicating the inorganic nitrogen regeneration process.
We observed destratification of the water column in mid-to-late October (2020) when the Lena River’s flow declined (Figure 2), indicating further dilution of river water by seawater. The chemical characteristics of water tended to be evenly distributed throughout the transect with less concentration difference (Figures 5–7). High Si concentration near the delta suggested a scenario to a decay of residual biodetritus from autumn and subsequent sedimentation losses (Heiskanen and Keck, 1996). Due to an increase of NO3- concentration in river water in this period compared to the summer (Cauwet and Sidorov, 1996; Holmes et al., 2000), a small NO3- maximum could be detected near the delta. Low concentrations of NH4+ and NO2- in October 2020 (Figures 6) showed that the nitrification process in the water was proceeding slowly prior to freezing over (Cauwet and Sidorov, 1996).
4.2 Water masses transport and transformation
Classical T-S analysis and multiparameter cluster analysis based on hydrochemical indicators were used to examine the seasonal and interannual distribution of shallow marine water masses under the influence of plumes. On different time scales, these two approaches have been verified to be appropriate to water sample type identification (Chen et al., 2011; Tarasenko et al., 2021). New technical tools, such as satellite measurements, can make obtaining data on ocean surface temperature and salinity easier, which would also enable T-S analysis relatively simple to perform for researchers to monitor the temporal and spatial variations of ocean surface water in great detail just using temperature and salinity data (Tarasenko et al., 2021). Chemical and biological processes, on the other hand, had a big influence on the migration and transformation of water masses in shallow sea shelves like the Laptev Sea (Chen et al., 2011), therefore the traditional T-S analysis approach would have certain limitations. It was vital to include water chemistry indicators such as nutrients to clarify the driving variables that determined the change in water mass. Multi-parameter cluster analysis, compared to T-S analysis, performed better to discern between different types of water masses, such as surface and bottom seawater, and to be more explanatory for water masses (Figure 12, Table 2). Even though interannual fluctuations caused a wide variety of physical and chemical features in water masses (such as huge standard deviations, Table 2), cluster analysis approaches can still identify statistically significant water mass groups.
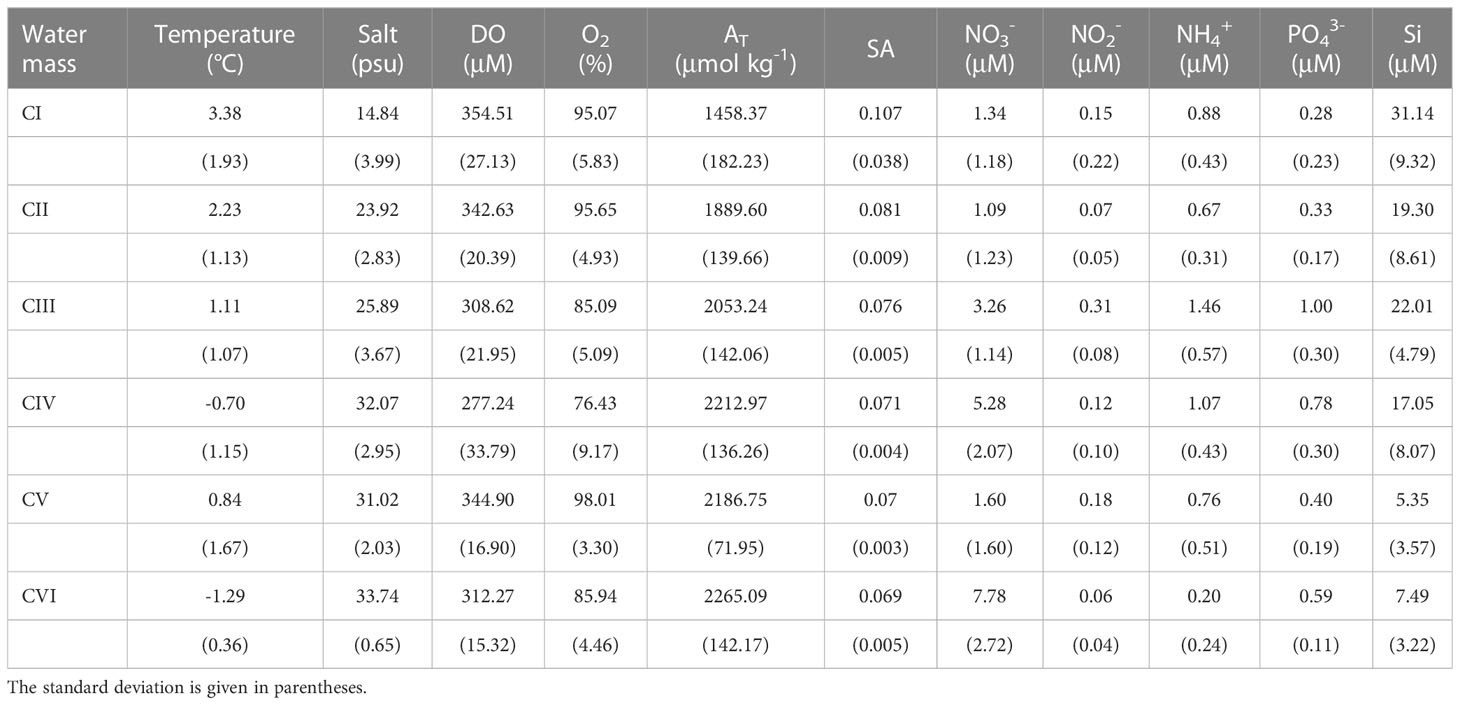
Table 2 The average properties for different cluster water masses along the transect at 120°42′-133°36′ E in 2015, 2017-2020. .
In this study, during the summer and autumn the freshwater plume spread and changed significantly. The vertical mixing caused by atmospheric circulation, the weakening of the Lena River flow, the seasonal cooling and reduction of radiative income, the mineralization of OM, the recycling of inorganic nutrients, and other biogeochemical processes all have an impact on the distribution of water mass with different properties, according to the cluster analysis results (Figure 11B). The water mass usually changes a lot in roughly two weeks, as evidenced by the water mass variations in early October and mid-to-late October, which coincided with Tarasenko et al. (2021).
The seawater properties of the continental shelf regions affected by rivers are related to the amount of organic and inorganic nutrients supplied by river and the photosynthetic production/respiration (Dittmar and Kattner, 2003). Water mass CIII, characterized by organic mineralization, was distributed to 550 km north of the estuary. It suggested that in early September (2015) the upper waters provided a considerable amount of OM with the freshwater discharge and partly from the photosynthetic production. According to previous studies, both terrigenous replenishment and primary production in the Laptev Sea would provide a certain amount of OM and inorganic nutrients in the summer and autumn periods (Kattner et al., 1999). Transport and fate of eroded carbon play a crucial role in shallow water biogeochemistry and sedimentation, because the Lena River PM/POC is mostly settled down in the nearshore mixing zone (Semiletov et al., 2011; Bröder et al., 2016; Tesi et al., 2017). The eroded carbon resuspension and dissolved gases ventilation can be clearly seen from the nearshore zone to water depth up to 40-50 m (Shakhova et al., 2014; Bauch and Cherniavskaia, 2018). Seasonal cooling and increased salinity caused by vertical mixing resulted in a considerable deepening in the volume of the water masses (CI, CII) where the fresh, warm plume in the surface mixed with the surface sea water by October (Figure 11B). The photosynthetic production reached its lowest level of the year due to decreased irradiance (Vetrov et al., 2008; Demidov et al., 2020). In the late summer-fall season, river origin dissolved OM discharge was reduced due to decline of the water discharge (Cauwet and Sidorov, 1996; Dittmar and Kattner, 2003), but rates of coastal erosion are still high providing export of eroded carbon which is oxidized quickly to CO2, decreasing pH and water acidification as well (Semiletov, 1999a; Anderson et al., 2009; Vonk et al., 2010; Semiletov et al., 2016), that is not observed in the Arctic regions not affected by the rivers (Yakushev and Sørensen, 2013). Note that the decay of eroding OM might contribute to increasing nutrient content in shallow areas (Semiletov et al., 2013). As a result, the distribution range of the organic mineralized water mass (CIII) was narrowed to the delta area. We might deduce from this that the OM input and its transformation could give a basis for analyzing the water mass characterization. However, the major determinant of water mass migration and transformation is wind-regime (Proshutinsky and Johnson, 1997; Semiletov et al., 2005).
Our findings demonstrate that variations in wind conditions, OM input, and river discharge can all affect the characteristics of water masses formed on the shallow Arctic shelf. Fortunately, we obtained several transects over a number of years, allowing us to understand the contribution of various influencing factors by comparison. We achieved two important conclusions: (1) During the same season, wind conditions control the migration and transformation of plume-influenced water masses (such as water mass CI, CII and CIII) and push them to the further open sea (Figure 11). For example, strong anticyclonic conditions (2015) brought water masses strongly influenced by the plume (e.g., water masses CI, CII, CIII) to the open sea when river flows were not significantly different (2015 vs. 2017). When the difference in the river discharge is very large (the river flow in 2018 is roughly twice that in 2019), the “onshore” wind reduces the northern boundary of the distribution of water masses CII and CIII to within 250 km of the transect. When the flow is large, whereas “offshore” winds pushed water masses CII, CIII further away in comparison to 2018. (2) During different seasons and under the same wind conditions, a decrease in OM concentration caused by reduced river flow and photosynthesis would affect the distribution of water mass characteristics. In early September 2015, early October 2019, and mid-late October 2020, the circulation was characterized by an anticyclonic regime. In 2019 and 2020, the fresh water mass (CI) disappeared in October due to a weakening of river flow and reduced photosynthetic, and the distribution area of CII and CIII water masses in the entire transect was significantly reduced (2019) or almost disappeared (2020). Note, that re-routing of the Lena River plume from the northward direction to the eastward is driven by atmospheric circulation conditions: usually by the switch between Zn and Az conditions (Semiletov et al., 2000; Semiletov et al., 2005).
Furthermore, the upwelling and downwelling currents caused by specific regimes of atmospheric circulation have the potential to significantly alter the properties of seawater. In 2015, an upwelling caused the CIII and CIV water masses to rise to the surface. Furthermore, the sinking current in 2019 transported surface layer seawater with a high relative oxygen content and high temperature into the subsurface layer. Intense vertical mixing promoted bottom sediment resuspension, and OM mineralization occurred abundantly under these conditions. This was consistent with previous studies (Lentz, 2004; Osadchiev et al., 2020b; Dudarev et al., 2022; Martens et al., 2022).
5 Conclusions
September and October are critical periods for the dispersion of Lena River plume in the Laptev Sea, influenced by atmospheric circulation. The interannual and seasonal diffusion patterns of the plume shape the hydrochemical characteristics of the Laptev Sea.
In early September, anticyclonic weather conditions result in water column stratification, limiting vertical mixing of oxygen and nutrients. The surface waters are richer in oxygen and silica compared to the bottom layer (DO > 360 μM; Si > 30 μM), but deficient in nitrogen and phosphorus (DO < 270 μM; Si < 5 μM). Various processes, including plant photosynthesis, OM oxidation, and inorganic nutrient regeneration, influence the distribution of biogeochemical features in the seawater. By early October, vertical mixing of the plume increases, but the water column remains insufficiently homogenized, with significant variations in phosphate concentration between the surface and bottom layers (0.57 μM vs 1.74 μM). In mid to late October, the destratification of the water column tends to evenly distribute hydrochemical characteristics along the transect. The dilution process of river water has the greatest impact on the silicon concentration, which exhibits a strong negative correlation with temperature and salinity from September to October. Additionally, a coastal upwelling event in early September brings up bottom waters with high nitrate and low organic phosphorus levels to the surface. However, the concentrations of ammonium and nitrite may decrease due to preferential utilization by organisms. In early October (2019), wind-driven deep vertical mixing resuspended nutrient regeneration in bottom sediments, accelerating the mineralization of suspended particulate matter and the regeneration of nitrate in the fracture surface (PO43-: 0.57 μM; NH4+: 0.8-2.88 μM; NO2-: 0.2-0.5 μM).
Multivariate cluster analysis reveals the water mass typically undergo significant changes within two weeks between September and October, with alterations in OM input, Lena River flow, coastal erosion, seasonal cooling, and biophotosynthetic income affecting the migration and transformation of water masses throughout the seasons. In addition, wind conditions play a significant role in shaping water mass characteristics.
Data availability statement
The original contributions presented in the study are included in the article/Supplementary Material. Further inquiries can be directed to the corresponding author.
Author contributions
LX and EY wrote the draft manuscript. LX, EY and AB contributed significantly to the statistical analyses. EY, IS, AG, IG, AB, AO, IZ, AP, JM, DP, IP, SP, and OD participated the field sampling. ZG contributed significantly to the revision and editing. IS, AP and OD organized the expeditions. All authors contributed to the article and approved the submitted version.
Funding
This work was supported by the Russian Science Foundation grant No. 21-77-30001, the Ministry of Science and Higher Education of the Russian Federation, themes FMWE-2021-0001 and FMWE-2021-0007, and the China Scholarship Council (CSC 201906140314). Field campaigns were supported by the assignment of the Research Council of Norway (BEST-Siberian, grant 315317), of the Russian Ministry of Science and Higher Education in frame of the theme 0211-2021-0010 (to the POI), and project “Priority-2030” (to the TSU) as well by the and grant No. 21-17-00027 to IP).
Conflict of interest
The authors declare that the research was conducted in the absence of any commercial or financial relationships that could be construed as a potential conflict of interest.
Publisher’s note
All claims expressed in this article are solely those of the authors and do not necessarily represent those of their affiliated organizations, or those of the publisher, the editors and the reviewers. Any product that may be evaluated in this article, or claim that may be made by its manufacturer, is not guaranteed or endorsed by the publisher.
Supplementary material
The Supplementary Material for this article can be found online at: https://www.frontiersin.org/articles/10.3389/fmars.2023.1180054/full#supplementary-material
References
Anderson L. G., Jutterström S., Hjalmarsson S., Wåhlström I., Semiletov I. P. (2009). Out-gassing of CO2 from Siberian shelf seas by terrestrial organic matter decomposition. Geophys. Res. Lett. 36 (20), 1–6. doi: 10.1029/2009GL040046
Bauch D., Cherniavskaia E. (2018). Water mass classification on a highly variable arctic shelf region: origin of laptev sea water masses and implications for the nutrient budget. J. Geophys. Res-Oceans 123 (3), 1896–1906. doi: 10.1002/2017JC013524
Benetti M., Reverdin G., Aloisi G., Sveinbjrnsdóttir A. E. (2017). Stable isotopes in surface waters of the Atlantic ocean: indicators of ocean-atmosphere water fluxes and oceanic mixing processes. J. Geophys. Res-oceans 122 (6), 4723–4742. doi: 10.1002/2017JC012712
Bröder L., Andersson A., Tesi T., Semiletov I., Gustafsson Ö. (2019). Quantifying degradative loss of terrigenous organic carbon in surface sediments across the laptev and East Siberian Sea. Global Biogeochem. Cy. 33 (1), 85–99. doi: 10.1029/2018GB005967
Bröder L., Tesi T., Salvadó J. A., Semiletov I. P., Dudarev O. V., Gustafsson Ö. (2016). Fate of terrigenous organic matter across the laptev Sea from the mouth of the Lena river to the deep sea of the Arctic interior. Biogeosciences 13 (17), 5003–5019. doi: 10.5194/bg-13-5003-2016
Bröder L., Tesi T., Andersson A., Semiletov I., Gustafsson Ö. (2018). Bounding cross-shelf transport time and degradation in Siberian-Arctic land-ocean carbon transfer. Nat. Commun. 9 (1), 8–1. doi: 10.1038/s41467-018-03192-1
Broecker W. S. (1974). “NO”, a conservative water-mass tracer. Earth Planet. Sc. Lett. 23 (1), 100–107. doi: 10.1016/0012-821X(74)90036-3
Brzezinski M. A. (1985). The Si: c: n ratio of marine diatoms: interspecific variability and the effect of some environmental variables. J. Phycol. 21 (3), 347–357. doi: 10.1111/j.0022-3646.1985.00347.x
Canadell J. G., Raupach M. R. (2009). “Land carbon cycle feedbacks,” in Arctic Climate feedbacks: global implications. Eds. Sommerkorn M., Hassol S. J. (Oslo: WWF International Arctic Programme), 69–80.
Carlsson P., Graneli E. (1999). Effects of n: p: Si ratios and zooplankton grazing on phytoplankton communities in the northern Adriatic sea. II. phytoplankton species composition. Aquat. Microb. Ecol. 18 (1), 55–65. doi: 10.3354/ame018055
Carlucci A. F., Hartwig E. O., Bowes P. M. (1970). Biological production of nitrite in seawater. Mar. Biol. 7, 161–166. doi: 10.1007/BF00354921
Cauwet G., Sidorov I. (1996). The biogeochemistry of Lena river: organic carbon and nutrients distribution. Mar. Chem. 53 (3-4), 211–227. doi: 10.1016/0304-4203(95)00090-9
Charkin A. N., Dudarev O. V., Semiletov I. P., Kruhmalev A. V., Vonk J. E., Sánchez-García L., et al. (2011). Seasonal and interannual variability of sedimentation and organic matter distribution in the buor-khaya gulf: the primary recipient of input from Lena river and coastal erosion in the southeast laptev Sea. Biogeosciences 8 (9), 2581–2594. doi: 10.5194/bg-8-2581-2011
Chen S., Li Y., Hu J., Zheng A., Huang L., Lin Y. (2011). Multiparameter cluster analysis of seasonal variation of water masses in the eastern beibu gulf. J. Oceanogr. 67, 709–718. doi: 10.1007/s10872-011-0071-y
Codispoti L. A., Richards F. A. (1968). Micronutrient distributions in the East Siberian and laptev seas during summer 1963. Arctic 21, 67–83. doi: 10.14430/arctic3251
Cooper L. W., Cota G. F., Pomeroy L. R., Grebmeier J. M., Whitledge T. E. (1999). Modification of NO, PO, and NO/PO during flow across the Bering and chukchi shelves: implications for use as Arctic water mass tracers. J. Geophys. Res-Oceans 104 (C4), 7827–7836. doi: 10.1029/1999JC900010
Demidov A. B., Sheberstov S. V., Gagarin V. I. (2020). Seasonal variability and annual primary production of phytoplankton in the laptev Sea assessed by MODIS-aqua data. Izv. Atmos. Ocean. Phys. 56, 950–962. doi: 10.1134/S000143382009008X
Dickson A. G., Sabine C. L., Christian J. R. (2007). Guide to best practices for ocean CO2 measurements, PICES special publication 3 Vol. 8 (IOCCP).
Dittmar T., Kattner G. (2003). The biogeochemistry of the river and shelf ecosystem of the Arctic ocean: a review. Mar. Chem. 83 (3-4), 103–120. doi: 10.1016/S0304-4203(03)00105-1
Dmitrenko I., Kirillov S., Eicken H., Markova N. (2005). Wind-driven summer surface hydrography of the eastern Siberian shelf. Geophys. Res. Lett. 32 (14), 1–5. doi: 10.1029/2005GL023022
Dmitrenko I. A., Kirillov S. A., Krumpen T., Makhotin M., Abrahamsen E. P., Willmes S., et al. (2010). Wind-driven diversion of summer river runoff preconditions the laptev Sea coastal polynya hydrography: evidence from summer-to-winter hydrographic records of 2007–2009. Cont. Shelf Res. 30 (15), 1656–1664. doi: 10.1016/j.csr.2010.06.012
Dmitrenko I. A., Kirillov S. A., Tremblay L. B. (2008). The long-term and interannual variability of summer fresh water storage over the eastern Siberian shelf: implication for climatic change. J. Geophys. Res-oceans 113 (C3), 1–14. doi: 10.1029/2007JC004304
Du C., Liu Z., Dai M., Kao S. J., Cao Z., Zhang Y., et al. (2013). Impact of the kuroshio intrusion on the nutrient inventory in the upper northern south China Sea: insights from an isopycnal mixing model. Biogeosciences 10 (10), 6419–6432. doi: 10.5194/bg-10-6419-2013
Dudarev O., Charkin A., Shakhova N., Ruban A., Chernykh D., Vonk J., et al. (2022). East Siberian Sea: Interannual heterogeneity of the suspended particulate matter and its biogeochemical signature. Prog. Oceanogr 208, 102903. doi: 10.1016/j.pocean.2022.102903
Dudarev O. V., Semiletov I. P., Charkin A. N., Botsul A. I. (2006). Deposition settings on the continental shelf of the East Siberian Sea. Dokl. Earth Sci. 409 (2), 1000–1005. doi: 10.1134/S1028334X06060389
Fairbanks R. G. (1982). The origin of continental shelf and slope water in the new York bight and gulf of Maine: evidence from H2 18O/H2 16O ratio measurements. J. Geophys. Res-oceans 87 (C8), 5796–5808. doi: 10.1029/JC087iC08p05796
Freeman C., Evans C. D., Monteith D. T., Reynolds B., Fenner N. (2001). Export of organic carbon from peat soils. Nature 412 (6849), 785–785. doi: 10.1038/35090628
Galloway J. N., Dentener F. J., Capone D. G., Boyer E. W., Howarth R. W., Seitzinger S. P., et al. (2004). Nitrogen cycles: past, present, and future. Biogeochemistry 70 (2), 153–226. doi: 10.1007/s10533-004-0370-0
Grasshoff K., Ehrhardt M., Kremling K. (2009). Methods in Seawater Analysis, 3nd Edn, (Weinheim: Verlag Chemic).
Gruber N., Friedlingstein P., Field C. B., Valentini R., Heimann M., Richey J. E., et al. (2004). The vulnerability of the carbon cycle in the 21st century: an assessment of carbon-climate-human interactions. Scope-Scientific committee problems Environ. Int. council Sci. unions 62, 45–76.
Guay C. K., Falkner K. K., Muench R. D., Mensch M., Frank M., Bayer R. (2001). Wind-driven transport pathways for Eurasian Arctic river discharge. J. Geophys. Res-oceans 106 (C6), 11469–11480. doi: 10.1029/2000JC000261
Guo L., Semiletov I., Gustafsson Ö., Ingri J., Andersson P., Dudarev O., et al. (2004). Characterization of Siberian Arctic coastal sediments: implications for terrestrial organic carbon export. Global Biogeochem. Cy. 18 (1), 1–10. doi: 10.1029/2003GBO02087
Gustafsson Ö., Van Dongen B. E., Vonk J. E., Dudarev O. V., Semiletov I. P. (2011). Widespread release of old carbon across the Siberian Arctic echoed by its large rivers. Biogeosciences 8 (6), 1737–1743. doi: 10.5194/bg-8-1737-2011
Hansen H. P. (1999). Determination of oxygen, Chapter 4, in Methods of Seawater Analysis, 3rd Edn, eds K. Grasshoff, K. Kremling, and M. Ehrhardt (Weinheim: Wiley Verlag), 75–89. doi: 10.1002/9783527613984.ch4
Heiskanen A. S., Keck A. (1996). Distribution and sinking rates of phytoplankton, detritus, and particulate biogenic silica in the laptev Sea and Lena river (Arctic Siberia). Mar. Chem. 53 (3-4), 229–245. doi: 10.1016/0304-4203(95)00091-7
Holmes R. M., Peterson B. J., Gordeev V. V., Zhulidov A. V., Meybeck M., Lammers R. B., et al. (2000). Flux of nutrients from Russian rivers to the Arctic ocean: can we establish a baseline against which to judge future changes? Water Resour. Res. 36 (8), 2309–2320. doi: 10.1029/2000WR900099
Hugelius G., Strauss J., Zubrzycki S., Harden J. W., Schuur E. A., Ping C. L., et al. (2014). Estimated stocks of circumpolar permafrost carbon with quantified uncertainty ranges and identified data gaps. Biogeosciences 11 (23), 6573–6593. doi: 10.5194/bg-11-6573-2014
Jakobsson M., Mayer L. A., Bringensparr C., Castro C. F., Mohammad R., Johnson P., et al. (2020). The international bathymetric chart of the Arctic ocean version 4.0. Sci. Data 7 (1), 176. doi: 10.1038/s41597-020-0520-9
Johnson M. A., Polyakov I. (2001). The laptev Sea as a source for recent Arctic ocean salinity change. Geophys. Res. Lett. 28 (10), 2017–2020. doi: 10.1029/2000GL012740
Juhls B., Stedmon C. A., Morgenstern A., Meyer H., Hölemann J., Heim B., et al. (2020). Identifying drivers of seasonality in Lena river biogeochemistry and dissolved organic matter fluxes. Front. Env. Sci. 8. doi: 10.3389/fenvs.2020.00053
Justić D., Rabalais N. N., Turner R. E. (1996). Effects of climate change on hypoxia in coastal waters: a doubled CO2 scenario for the northern gulf of Mexico. Limnol. Oceanogr. 41 (5), 992–1003. doi: 10.4319/lo.1996.41.5.0992
Karlsson E. S., Charkin A., Dudarev O., Semiletov I., Vonk J. E., Sánchez-García L., et al. (2011). Carbon isotopes and lipid biomarker investigation of sources, transport and degradation of terrestrial organic matter in the buor-khaya bay, SE laptev Sea. Biogeosciences 8 (7), 1865–1879. doi: 10.5194/bg-8-1865-2011
Kattner G., Lobbes J. M., Fitznar H. P., Engbrodt R., Nöthig E. M., Lara R. J. (1999). Tracing dissolved organic substances and nutrients from the Lena river through laptev Sea (Arctic). Mar. Chem. 65 (1-2), 25–39. doi: 10.1016/S0304-4203(99)00008-0
Kostyleva A. V., Polukhin A. A., Stepanova S. V. (2020). Hydrochemical structural patterns of the Lena river–laptev Sea mixing zone in the autumn period. Oceanology 60, 735–741. doi: 10.1134/S0001437020060053
Kuhry P., Grosse G., Harden J. W., Hugelius G., Koven C. D., Ping C. L., et al. (2013). Characterisation of the permafrost carbon pool. Permafrost. Periglac. Process. 24 (2), 146–155. doi: 10.1002/ppp.1782
Lao Q., Zhang S., Li Z., Chen F., Zhou X., Jin G., et al. (2022). Quantification of the seasonal intrusion of water masses and their impact on nutrients in the beibu gulf using dual water isotopes. J. Geophys. Res-oceans 127 (7), e2021JC018065. doi: 10.1029/2021JC018065
Lara R. J., Rachold V., Kattner G., Hubberten H. W., Guggenberger G., Skoog A., et al. (1998). Dissolved organic matter and nutrients in the Lena river, Siberian Arctic: characteristics and distribution. Mar. Chem. 59 (3-4), 301–309. doi: 10.1016/S0304-4203(97)00076-5
Lentz S. (2004). The response of buoyant coastal plumes to upwelling-favorable winds. J. Phys. Oceanogr. 34 (11), 2458–2469. doi: 10.1175/JPO2647.1
Levasseur M., Therriault J.-C., Legendre L. (1984). Hierarchical control of phytopIankton succession by physical factors. Mar. Ecol. Prog. Ser. 19, 211–222. doi: 10.3354/meps019211
Lian E., Yang S., Wu H., Yang C., Li C., Liu J. T. (2016). Kuroshio subsurface water feeds the wintertime Taiwan warm current on the inner East China Sea shelf. J. Geophys. Res-oceans 121 (7), 4790–4803. doi: 10.1002/2016JC011869
Liu G., Ma F., Liu G., Zhao H., Guo J., Cao J. (2019). Application of multivariate statistical analysis to identify water sources in a coastal gold mine, Shandong, China. Sustainability 11 (12), 3345. doi: 10.3390/su11123345
Lomas M. W., Lipschultz F. (2006). Forming the primary nitrite maximum: nitrifiers or phytoplankton? Limnol. Oceanogr. 51 (5), 2453–2467. doi: 10.4319/lo.2006.51.5.2453
Makkaveev P. N., Polukhin A. A., Seliverstova A. M., Stepanova S. V., Chultsova A. L., Artemiev V. A. (2018). Dissolved inorganic carbon in the estuarine area of the Lena river: results of expeditions in 2015 and 2017. Oceanology 58, 525–536. doi: 10.1134/S0001437018040057
Martens J., Wild B., Semiletov I., Dudarev O. V., Gustafsson Ö. (2022). Circum-Arctic release of terrestrial carbon varies between regions and sources. Nat. Commun. 13 (1), 5858. doi: 10.1038/s41467-022-33541-0
McLaughlin F. A., Carmack E. C., Macdonald R. W., Bishop J. K. (1996). Physical and geochemical properties across the Atlantic/Pacific water mass front in the southern Canadian basin. J. Geophys. Res-Oceans 101 (C1), 1183–1197. doi: 10.1029/95JC02634
Millero F. J., Yao W., Aicher J. (1995). The speciation of fe (II) and fe (III) in natural waters. Mar. Chem. 50 (1-4), 21–39. doi: 10.1016/0304-4203(95)00024-L
Mintrop L., Pérez F. F., González-Dávila M., Santana-Casiano J. M., Körtzinger A. (2000). Alkalinity determination by potentiometry: intercalibration using three different methods. Cienc. Mar. 26, 23–37. doi: 10.7773/cm.v26i1.573
Moon C., Dunstan W. M. (1990). Hydrodynamic trapping in the formation of the chlorophyll a peak in turbid, very low salinity waters of estuaries. J. Plankton. Res. 12 (2), 323–336. doi: 10.1093/plankt/12.2.323
Morison J., Andersen R., Kwok R., Smethie W. M. Jr, Rigor I. G., Alkire M. B., et al. (2014). The Transpolar Drift in the Central Arctic Ocean as measured by AON observations. In AGU Fall Meeting Abstracts Vol. 2014, pp. OS51C–0996.
Nelson S., Rojas N., Fedele A. (2009). Water masses in the Humboldt current system: properties, distribution, and the nitrate deficit as a chemical water mass tracer for equatorial subsurface water off Chile. Deep-Sea Res. II 56, 1004–1020. doi: 10.1016/j.dsr2.2008.12.013
Osadchiev A. A., Frey D. I., Shchuka S. A., Tilinina N. D., Morozov E. G., Zavialov P. O. (2021). Structure of the freshened surface layer in the kara Sea during ice-free periods. J. Geophys. Res-Oceans. 126 (1), e2020JC016486. doi: 10.1029/2020JC016486
Osadchiev A. A., Pisareva M. N., Spivak E. A., Shchuka S. A., Semiletov I. P. (2020a). Freshwater transport between the kara, laptev, and East-Siberian seas. Sci. Rep. 10 (1), 1–14. doi: 10.1038/s41598-020-70096-w
Osadchiev A., Silvestrova K., Myslenkov S. (2020b). Wind-driven coastal upwelling near large river deltas in the laptev and East-Siberian seas. Remote Sens. 12 (5), 844. doi: 10.3390/rs12050844
Otto M. (1998). “Multivariate methods,” in Analytical chemistry. Eds. Kellner R., Mermet J. M., Otto M., Widmer H. M. (Weinheim, Germany: Wiley-VCH).
Parsons T. R. (2013). A manual of chemical & biological methods for seawater analysis (Elsevier). (New York: Pergamon Press).
Pavlov V. K., Timokhov L. A., Baskakov G. A., Kulakov M. Y., Kurazhov V. K., Pavlov P. V., et al (1996). Hydrometeorological regime of the Kara, Laptev, and East-Siberian seas. Technical Memorandum, APL-UW TM 1-96, Applied Physics Laboratory. Washington: University of Washington.
Pavlova G. Y., Tishchenko P. Y., Volkova T. I., Dickson A., Wallmann K. (2008). Intercalibration of bruevich's method to determine the total alkalinity in seawater. Oceanology 48 (3), 438. doi: 10.1134/S0001437008030168
Pipko I. I., Pugach S. P., Dudarev O. V., Charkin A. N., Semiletov I. P. (2010). Carbonate parameters of the Lena river: characteristics and distribution. Geochem. Int. 48 (11), 1131–1137. doi: 10.1134/S0016702910110078
Pipko I. I., Pugach S. P., Moiseeva Y. A., Dudarev O. V., Repina I. A., Sergienko V. I., et al. (2021). Dynamics of dissolved carbon in the mainstem of the Lena river in July 2017. Dokl. Earth Sci. 500 (2), 882–889. doi: 10.1134/S1028334X21100135
Pipko I. I., Pugach S. P., Semiletov I. P., Salyuk A. N. (2011). Carbonate characteristics of waters of the Arctic ocean continental slope. Dokl. Earth Sci. 438, 858–863. doi: 10.1134/S1028334X11060237
Pipko I. I., Semiletov I. P., Tishchenko P. Y., Pugach S. P., Savel’eva N. I. (2008). Variability of the carbonate system parameters in the coast-shelf zone of the East Siberian Sea during the autumn season. Oceanology 48, 54–67. doi: 10.1134/S0001437008010074
Pogojeva M., Polukhin A., Makkaveev P., Staalstrøm A., Berezina A., Yakushev E. (2022). Arctic Inshore biogeochemical regime influenced by coastal runoff and glacial melting (Case study for the templefjord, spitsbergen). Geosciences 12 (1), 44. doi: 10.3390/geosciences12010044
Polukhin A. (2019). The role of river runoff in the kara Sea surface layer acidification and carbonate system changes. Environ. Res. Lett. 14 (10), 105007. doi: 10.1088/1748-9326/ab421e
Proshutinsky A. Y., Johnson M. A. (1997). Two circulation regimes of the wind-driven Arctic ocean. J. Geophys. Res-Oceans. 102 (C6), 12493–12514. doi: 10.1029/97JC00738
Reyes F. R., Lougheed V. L. (2015). Rapid nutrient release from permafrost thaw in Arctic aquatic ecosystems. Arctic Antarctic Alpine Res. 47 (1), 35–48. doi: 10.1657/AAAR0013-099
Reyment R. A. (1997). Multiple group principal component analysis. Math. Geol. 29, 1–16. doi: 10.1007/BF02769617
Richards F. (1965). “Anoxic basins and fjords,” in Chemical oceanography. Eds. Riley J., Skirrow G. (London: Academic Press), 611–645.
Sánchez-García L., Alling V., Pugach S., Vonk J., Van Dongen B., Humborg C., et al. (2011). Inventories and behavior of particulate organic carbon in the laptev and East Siberian seas. Global Biogeochem. Cy. 25 (2), 1–13. doi: 10.1029/2010GB003862
Savelieva N. I., Salyuk A. N., Propp L. N. (2010). Peculiar features of the thermohaline and hydrochemical water structure in the southeastern laptev Sea. Oceanology 50, 869–876. doi: 10.1134/S0001437010060068
Savelieva N. I., Semiletov I. P., Vasilevskaya L. N., Pugach S. P. (2000). A climate shift in seasonal values of meteorological and hydrological parameters for northeastern Asia. Prog. Oceanogr. 47 (2-4), 279–297. doi: 10.1016/S0079-6611(00)00039-2
Semiletov I. P. (1999a). Destruction of the coastal permafrost ground as an important factor in biogeochemistry of the Arctic shelf waters, trans. Russian Acad. Sci. 368, 679–682.
Semiletov I. P. (1999b). On aquatic sources and sinks of CO2 and CH4 in the polar regions. J. Atmos. Sci. 56, 286–306. doi: 10.1175/1520-0469(1999)056
Semiletov I., Dudarev O., Luchin V., Charkin A., Shin K. H., Tanaka N. (2005). The East Siberian Sea as a transition zone between pacific-derived waters and Arctic shelf waters. Geophys. Res. Lett. 32 (10), 1–5. doi: 10.1029/2005GL022490
Semiletov I., Pipko I., Gustafsson Ö., Anderson L. G., Sergienko V., Pugach S., et al. (2016). Acidification of East Siberian Arctic shelf waters through addition of freshwater and terrestrial carbon. Nat. Geosci. 9 (5), 361–365. doi: 10.1038/NGEO2695
Semiletov I. P., Pipko I. I., Repina I., Shakhova N. E. (2007). Carbonate chemistry dynamics and carbon dioxide fluxes across the atmosphere–ice–water interfaces in the Arctic ocean: pacific sector of the Arctic. J. Marine. Syst. 66 (1-4), 204–226. doi: 10.1016/j.jmarsys.2006.05.012
Semiletov I. P., Pipko I. I., Shakhova N. E., Dudarev O. V., Pugach S. P., Charkin A. N., et al. (2011). Carbon transport by the Lena river from its headwaters to the Arctic ocean, with emphasis on fluvial input of terrestrial particulate organic carbon vs. carbon transport by coastal erosion. Biogeosciences 8 (9), 2407–2426. doi: 10.5194/bg-8-2407-2011
Semiletov I. P., Savelieva N. I., Weller G. E., Pipko I. I., Pugach S. P., Gukov A. Y., et al. (2000). “The dispersion of Siberian river flows into coastal waters: meteorological, hydrological and hydrochemical aspects,” in The freshwater budget of the Arctic ocean, vol. 70 . Eds. Lewis E. L., Jones E. P., Lemke P., Prowse T. D., Wadhams P. (Dordrecht: Springer), 323–366. doi: 10.1007/978-94-011-4132-1_15
Semiletov I. P., Shakhova N. E., Pipko I. I., Pugach S. P., Charkin A. N., Dudarev O. V., et al. (2013). Space–time dynamics of carbon and environmental parameters related to carbon dioxide emissions in the buor-khaya bay and adjacent part of the laptev Sea. Biogeosciences 10 (9), 5977–5996. doi: 10.5194/bg-10-5977-2013
Semiletov I. P., Shakhova N. E., Sergienko V. I., Pipko I. I., Dudarev O. V. (2012). On carbon transport and fate in the East Siberian Arctic land–shelf–atmosphere system. Environ. Res. Lett. 7 (1), 15201. doi: 10.1088/1748-9326/7/1/015201
Shakhova N., Semiletov I., Chuvilin E. (2019). Understanding the permafrost–hydrate system and associated methane releases in the East Siberian Arctic shelf. Geosciences 9 (6), 251. doi: 10.3390/geosciences9060251
Shakhova N., Semiletov I., Leifer I., Sergienko V., Salyuk A., Kosmach D., et al. (2014). Ebullition and storm-induced methane release from the East Siberian Arctic shelf. Nat. Geosci. 7 (1), 64–70. doi: 10.1038/ngeo2007
Solorzano L. (1969). Determination of ammonia in natural waters by the phenolhypochlorite method. this research was fully supported by US atomic energy commission contract no. ATS (11-1) GEN 10, PA 20. Limnol. Oceanogr. 14 (5), 799–801. doi: 10.4319/lo.1969.14.5.0799
Steele M., Morison J., Ermold W., Rigor I., Ortmeyer M., Shimada K. (2004). Circulation of summer pacific halocline water in the Arctic ocean. J. Geophys. Res-oceans. 109 (C2), 1–18. doi: 10.1029/2003JC002009
Stepanova S. V., Polukhin A. A., Kostyleva A. V. (2017). Hydrochemical structure of the waters in the eastern part of the laptev Sea in autumn 2015. Oceanology 57, 58–64. doi: 10.1134/S0001437017010180
Sukhanova I. N., Flint M. V., Georgieva E. J., Lange E. K., Kravchishina M. D., Demidov A. B., et al. (2017). The structure of phytoplankton communities in the eastern part of the laptev Sea. Oceanology 57 (1), 75–90. doi: 10.1134/S0001437017010209
Tarasenko A., Supply A., Kusse-Tiuz N., Ivanov V., Makhotin M., Tournadre J., et al. (2021). Properties of surface water masses in the laptev and the East Siberian seas in summer 2018 from in situ and satellite data. Ocean Sci. 17 (1), 221–247. doi: 10.5194/os-17-221-2021
Tesi T., Geibel M. C., Pearce C., Panova E., Vonk J. E., Karlsson E., et al. (2017). Carbon geochemistry of plankton-dominated samples in the laptev and East Siberian shelves: contrasts in suspended particle composition. Ocean Sci. 13 (5), 735–748. doi: 10.5194/os-13-735-2017
Tesi T., Muschitiello F., Smittenberg R. H., Jakobsson M., Vonk J. E., Hill P., et al. (2016). Massive remobilization of permafrost carbon during post-glacial warming. Nat. Commun. 7 (1), 13653. doi: 10.1038/ncomms13653
Tyrrell T. (1999). The relative influences of nitrogen and phosphorus on oceanic primary production. Nature 400 (6744), 525–531. doi: 10.1038/22941
Valderrama J. C. (1981). The simultaneous analysis of total nitrogen and total phosphorus in natural waters. Mar. Chem. 10 (2), 109–122. doi: 10.1016/0304-4203(81)90027-X
van Dongen B. E., Semiletov I., Weijers J. W., Gustafsson Ö. (2008). Contrasting lipid biomarker composition of terrestrial organic matter exported from across the Eurasian Arctic by the five great Russian Arctic rivers. Global Biogeochem. Cy. 22 (1), 1–14. doi: 10.1029/2007GB002974
Vetrov A. A., Romankevich E. A., Belyaev N. A. (2008). Chlorophyll, primary production, fluxes, and balance of organic carbon in the laptev Sea. Geochem. Int. 46 (10), 1055–1063. doi: 10.1134/S0016702908100091
Vonk J. E., Sánchez-García L., Semiletov I., Dudarev O., Eglinton T., Andersson A., et al. (2010). Molecular and radiocarbon constraints on sources and degradation of terrestrial organic carbon along the kolyma paleoriver transect, East Siberian Sea. Biogeosciences 7 (10), 3153–3166. doi: 10.5194/bg-7-3153-2010
Vorobyev S. N., Karlsson J., Kolesnichenko Y. Y., Korets M. A., Pokrovsky O. S. (2021). Fluvial carbon dioxide emission from the Lena river basin during the spring flood. Biogeosciences 18 (17), 4919–4936. doi: 10.5194/bg-18-4919-2021
Wang P., Huang Q., Pozdniakov S. P., Liu S., Ma N., Wang T., et al. (2021). Potential role of permafrost thaw on increasing Siberian river discharge. Environ. Res. Lett. 16 (3), 034046. doi: 10.1088/1748-9326/abe326
Weiss R. F. (1970). The solubility of nitrogen, oxygen and argon in water and seawater. Deep-Sea Res. 17 (4), 721–735. doi: 10.1016/0011-7471(70)90037-9
Wilson C., Wallace D. W. (1990). Using the nutrient ratio NO/PO as a tracer of continental shelf waters in the central Arctic ocean. J. Geophys. Res-Oceans 95 (C12), 22193–22208. doi: 10.1029/JC095iC12p22193
Wu J., Lao Q., Chen F., Huang C., Zhang S., Wang C., et al. (2021). Water mass processes between the south China Sea and the Western pacific through the Luzon strait: insights from hydrogen and oxygen isotopes. J. Geophys. Res-oceans 126 (8), e2021JC017484. doi: 10.1029/2021JC017484
Yakushev E., Sørensen K. (2013). On seasonal changes of the carbonate system in the barents Sea: observations and modeling. Mar. Biol. Res. 9 (9), 822–830. doi: 10.1080/17451000.2013.775454
Keywords: Laptev Sea, Lena River, hydrophysical structure, biogeochemical structure, water mass
Citation: Xie L, Yakushev E, Semiletov I, Grinko A, Gangnus I, Berezina A, Osadchiev A, Zhdanov I, Polukhin A, Moiseeva J, Purgina D, Pipko I, Pugach S, Dudarev O and Ge Z (2023) Biogeochemical structure of the Laptev Sea in 2015-2020 associated with the River Lena plume. Front. Mar. Sci. 10:1180054. doi: 10.3389/fmars.2023.1180054
Received: 05 March 2023; Accepted: 04 May 2023;
Published: 30 May 2023.
Edited by:
Yi Liu, The Hong Kong University of Science Technology (Guangzhou), ChinaReviewed by:
Fajin Chen, Guangdong Ocean University, ChinaKeyhong Park, Korea Polar Research Institute, Republic of Korea
Copyright © 2023 Xie, Yakushev, Semiletov, Grinko, Gangnus, Berezina, Osadchiev, Zhdanov, Polukhin, Moiseeva, Purgina, Pipko, Pugach, Dudarev and Ge. This is an open-access article distributed under the terms of the Creative Commons Attribution License (CC BY). The use, distribution or reproduction in other forums is permitted, provided the original author(s) and the copyright owner(s) are credited and that the original publication in this journal is cited, in accordance with accepted academic practice. No use, distribution or reproduction is permitted which does not comply with these terms.
*Correspondence: Evgeniy Yakushev, ZXZnZW5peS55YWt1c2hldkBuaXZhLm5v