 Adelaide V. Dedden1,22*†
 Catherine M. Kemper3†
 Gary Truong1,2†
 Matthew R. McCurry4,5,6†
 Paul D. van Ruth7†
 Tracey L. Rogers1,2†
- 1Evolution and Ecology Research Centre, School of Biological Earth and Environmental Sciences, University of New South Wales, Sydney, NSW, Australia
- 2Centre for Marine Science and Innovation, School of Biological Earth and Environmental Sciences, University of New South Wales, Sydney, NSW, Australia
- 3South Australian Museum, Adelaide, SA, Australia
- 4Australian Museum Research Institute, Sydney, NSW, Australia
- 5Earth and Sustainability Science Research Centre, School of Biological Earth and Environmental Sciences, University of New South Wales, Sydney, NSW, Australia
- 6Paleobiology, National Museum of Natural History, Smithsonian Institution, Washington, DC, United States
- 7Integrated Marine Observing System, University of Tasmania, Hobart, TAS, Australia
In the Southern Hemisphere, baleen whales generally undertake migrations between productive feeding grounds at high latitudes and breeding grounds at lower latitudes. Pygmy right whales (Caperea marginata) (PRW) are the smallest and most enigmatic baleen whale, that likely forgo long-distance migrations, and instead inhabit temperate and subantarctic waters year-round. Previous research has relied on limited data from sighting and stranding records to infer the habitat use and diet of PRWs, however the absence of long-term and consistent data has left uncertainty surrounding these parameters. We utilized bulk stable isotopes of carbon (δ13C) and nitrogen (δ15N) in baleen from Australian PRWs (n = 14) to infer their diet and habitat use. Stable isotope values from 1980–2019 were then matched to remote sensed data from known upwelling regions (where they likely feed) to examine if their dietary patterns are related to changes in food web dynamics. We found that PRWs remained in mid-latitude waters year-round and showed no evidence of feeding in Antarctic waters. Rather, their isotopic record suggests they remain between coastal waters off southern Australia and the Subtropical Convergence, feeding on krill and copepods. Additionally, there was a weak positive relationship between PRW nitrogen stable isotope values and sea surface temperature (SST) from the eastern Great Australian Bight (GAB) and Bonney Upwelling. This suggests seasonal changes in their diet is possibly correlated to oceanographic changes which drive food-web dynamics in these regions. Unlike larger species of baleen whales that migrate further to highly productive waters in the Southern Ocean to meet their energetic demands, the small PRW, who only reach 6.5m, may sustain both feeding and breeding requirements at mid-latitudes. This is the first study to analyze long-term dietary and movement patterns of the PRW, providing an important contribution to our understanding of the species.
Introduction
Large, long-lived and wide-ranging mysticetes (baleen whales) are often conspicuous and can be used as ecosystem sentinels, providing insight into ecosystem changes and processes due to their low-trophic feeding habits and migrations that span broad spatial scales (Hazen et al., 2019). Many species of baleen whales in the Southern Hemisphere migrate from productive, high-latitude feeding grounds, where they rely on dense aggregations of Antarctic krill (Euphausia superba) and copepod species in the Southern Ocean, to warm breeding grounds at low latitudes in austral winter, where they rely on accumulated energy reserves and opportunistic feeding along their migration path (Corkeron & Connor, 1999; Stamation et al., 2007; Gales et al., 2009). Their disparate breeding and feeding grounds allow them to exploit high-density resources during the austral summer at high latitudes, while warmer, low-latitude waters during winter may provide thermal benefits for calf survival and development for some species, or be advantageous to reduce predation risk of killer whales (Norris, 1967; Clapham, 2001; Sumich, 2021). However, not all species of baleen whales in the Southern Hemisphere exhibit long-range movements between Southern Ocean feeding and northern breeding grounds. For example, some species undertake short-range migrations (e.g., pygmy blue whales (Balaenoptera musculus brevicauda) (Double et al., 2014)), partial migration strategies (e.g., Southern Hemisphere humpback whales (Megaptera novaeangliae) (Findlay & Best, 1995; Chapman et al., 2011; Acevedo et al., 2013; Eisenmann et al., 2016), or remain resident in temperate waters forgoing north-south migrations completely (e.g., New Zealand Bryde’s whales (Balaenoptera brydei) (Izadi et al., 2022). Migration strategies are likely driven by the energetic demands of a species (to meet both feeding and breeding requirements) and availability of resources (Clapham, 2001; Olsson et al., 2006; Dingle & Drake, 2007; Hein et al., 2012).
Pygmy right whales (Caperea marginata) (PRW) are the smallest and most enigmatic living baleen whale (Marx et al., 2016) reaching 6.5 m and 3.5 tonnes (Figure 1A) (Budylenko et al., 1973; Kemper & Leppard, 1999; Kemper, 2009; Kemper, 2014). They remain under-studied relative to other species of baleen whales, in part, because they are inconspicuous and often mistaken for minke whales (Kemper, 2009). As a result, the annual movements of PRWs are unknown, however opportunistic sighting and stranding records in the Australasian region reveal their likely habitat use between southern Australia and the Subtropical Convergence, with PRW hotspots adjacent to zooplankton-rich regions (Kemper et al., 2013). PRWs appear to feed on a range of prey such as copepods, euphausiids, and small plankton (Sekiguchi et al., 1992; Kemper, 2002; Kemper, 2009) identified through limited stomach content analysis, and facilitated via long baleen plates with delicate fringing (Figures 1B, C). However, the longer-term diet choices of PRWs remain unknown. Additionally, while there is no sighting data of PRWs within Antarctic waters, and it is unlikely PRWs undertake migrations between high and mid-latitude regions, there is currently no data to rule this out. If they remain in mid-latitude waters year-round as suspected, they join one of the few baleen whale species in Australian waters that forgo the typical longer range, north-south migrations.
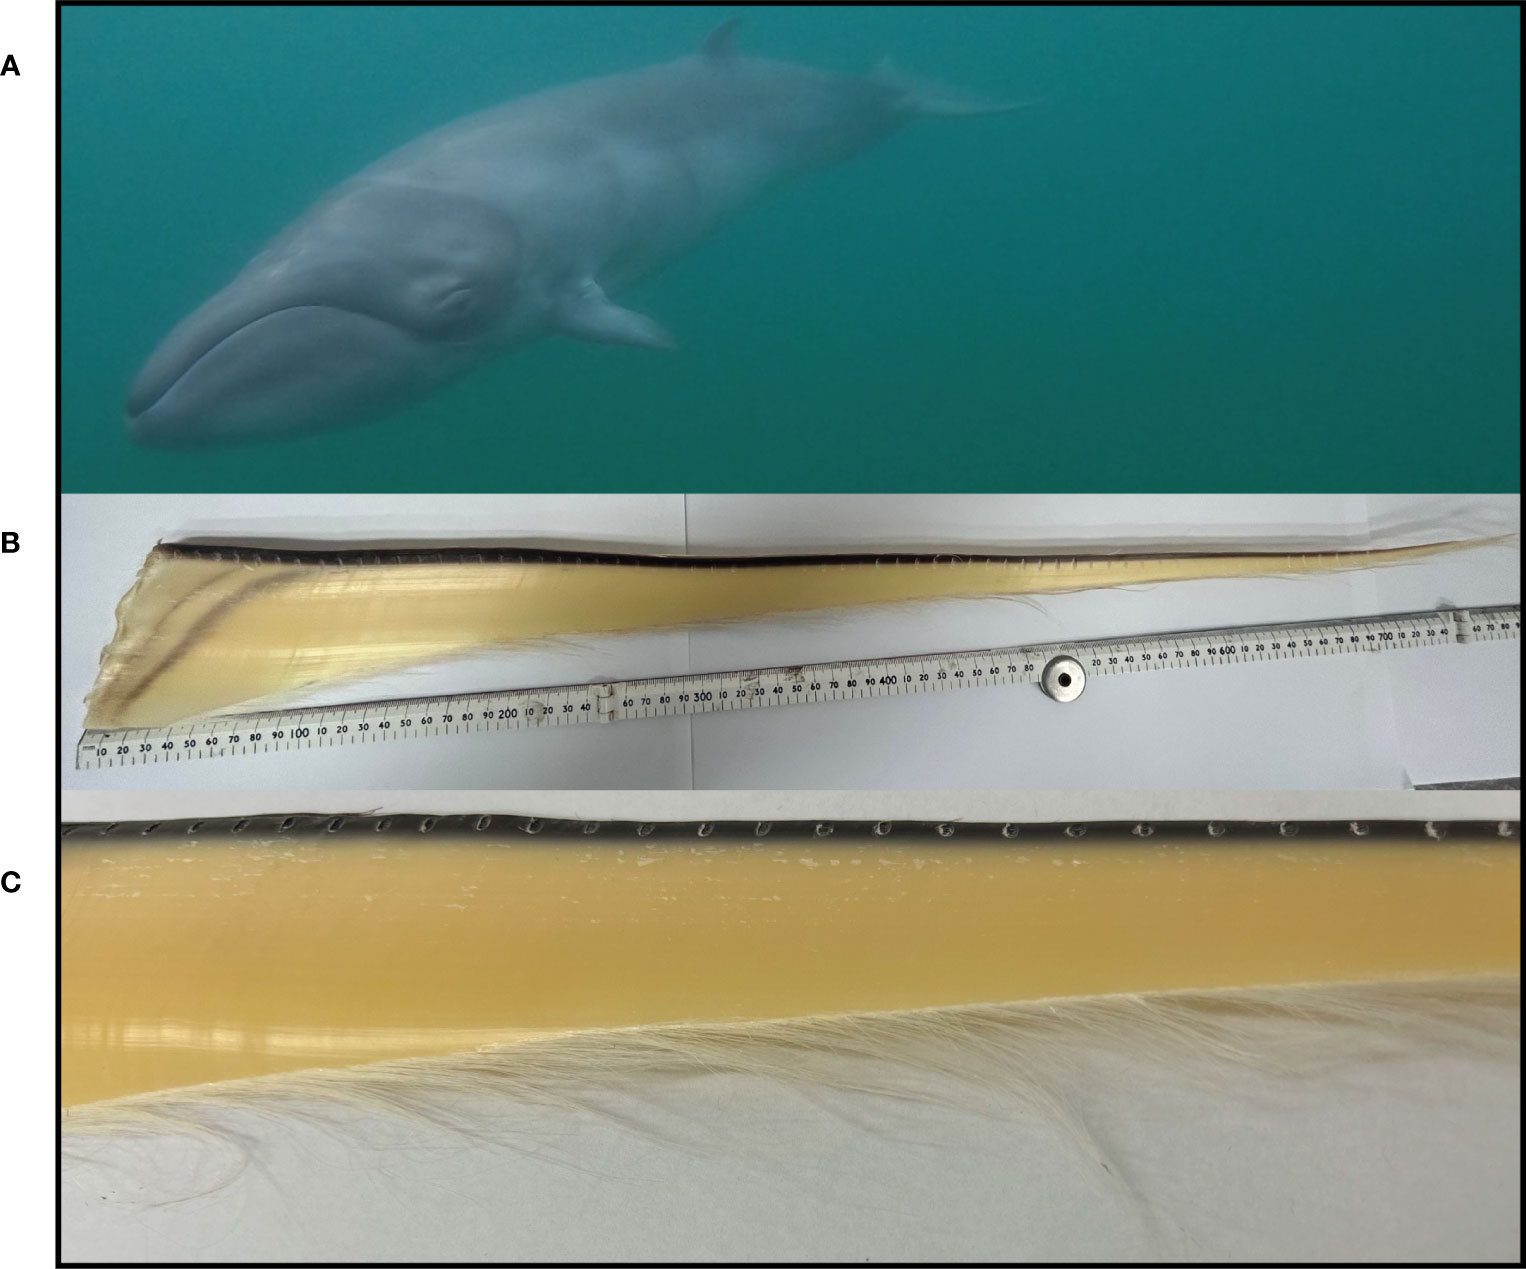
Figure 1 Pygmy right whale off southern Australia (A) and the long, narrow, and cream-yellow baleen plate (B) with fine and delicate bristles (C). (B, C) show sampling intervals along the labial edge. Swimming pygmy right whale image credit: Henry Cordell.
In coastal waters off southern Australia, where PRWs are known to occupy, reliable enrichment and upwelling events occur during the summer months, particularly in the eastern Great Australian Bight (GAB) (van Ruth et al., 2010a; van Ruth et al., 2010b; van Ruth et al., 2018) and the Bonney Upwelling (Schahinger, 1987), with the eastern GAB supporting Australia’s highest densities of seabirds and marine mammals (Goldsworthy et al., 2013; Rogers et al., 2013; Goldsworthy et al., 2017). Whilst more is known about upwelling dynamics of the eastern GAB, both regions are typically nutrient-poor outside summer periods due to the absence of upwelling and the influx of low-nutrient, warm water from the Leeuwin Current (Herzfeld, 1997). During winter, these low-nutrient waters underpin a long microbial food web where primary production is channelled via more trophic levels to reach higher consumers, as opposed to the addition of a shorter, diatom-rich, classical food web during summer upwelling events (Azam et al., 1983; Sommer et al., 2002; van Ruth et al., 2018). The oceanographic changes that drive differences in food web dynamics within the region alter the number of trophic links between phytoplankton and consumers, and are likely to influence prey availability and accessibility for baleen whales that utilise these regions, including the PRW. Remote-sensed sea surface temperate (SST) and chlorophyll-a concentrations can be used as indicators of the likely food web present at a given time, and surface oceanography to identify times of upwelling and surface productivity (Kämpf et al., 2004; Ward et al., 2006; van Ruth et al., 2010a). These measures have then been used alongside movement and presence data of consumers to identify relationships between oceanography and their behaviour, as seen for blue whales in upwelling systems off southern Australia (Gill et al., 2011; Möller et al., 2020).
Bulk stable isotope compositions of nitrogen (δ15N) and carbon (δ13C) assimilate within tissues of consumers and are commonly-used for inferring dietary and spatial movements over large temporal and spatial scales (DeNiro & Epstein, 1981; Hobson, 1999). These biochemical signals reflect the isotopic composition of their diet as well as the time and place of ingestion, integrating into consumer tissues while the tissue grows (DeNiro & Epstein, 1981; West et al., 2006). Baleen plates are metabolically inert and grow continuously throughout the life of a whale, assimilating isotopic signatures along the growth axis of the plate (Best & Schell, 1996; Hobson & Schell, 1998). Depending on the species, this may reflect anywhere between the most recent 1.5 to 16 years prior to death (i.e., last known baleen growth) (Schell et al., 1989b; Best & Schell, 1996; Schell, 2000; Lee et al., 2005; Mitani et al., 2006; Bentaleb et al., 2011; Aguilar et al., 2014; Matthews & Ferguson, 2015; Eisenmann et al., 2016; Busquets-Vass et al., 2017; Lysiak et al., 2018; Trueman et al., 2019; Reiss et al., 2020). Baleen specimens therefore provide an ideal tissue to investigate the long-term diet and habitat use of PRWs, and how their resource use may be related to food web dynamics within their range.
We used the stable isotopes in baleen from PRWs in Australian waters to infer diet and habitat use. To do this, PRW stable isotope values were compared to literature derived isotope values of suspected temperate prey species, as well as Antarctic prey samples to (a) identify the potential prey consumed in temperate waters and, (b) rule out feeding in, and migration to, high latitudes. PRW stable isotopes were then compared to remote sensed SST and chlorophyll-a concentrations from two possible feeding areas to provide an indication of the food web operating at the time, and how that relates to their dietary patterns. This study is the first to investigate the long-term diet and movement patterns of PRWs, establishing foundational knowledge for future research. Not only may the results highlight a reliance on mid-latitude waters, but also identify potential links between diet and food web dynamics.
Materials and methods
Data collection
Single baleen plates from 13 adult and 1 subadult PRWs were sampled for stable isotope analysis, including: 6 males; 6 females; and 2 individuals of unknown sex (Table 1), all registered into the South Australian Museum collection and loaned to us for stable isotope analysis. Baleen plates were originally obtained from beach-washed or stranded PRWs along the South Australian and Tasmanian coasts (Figure 2). If a complete set was collected, the longest plate was chosen for analysis, taken from ¾ back from the front of the mouth (Williamson, 1973; Pivorunas, 1979), and where possible, baleen plates included the unerupted portion within the gum, i.e., to include the most recent growth. Juveniles were excluded from the study to ensure younger whales, that may still be suckling and thus return elevated isotopic values, were not included (Borrell et al., 2016). Additionally, this was done to avoid ontogenetic changes in baleen growth rate found in juveniles (Schell et al., 1989a; Best & Schell, 1996; Kemper & Leppard, 1999; Eisenmann et al., 2016; Lysiak et al., 2018).
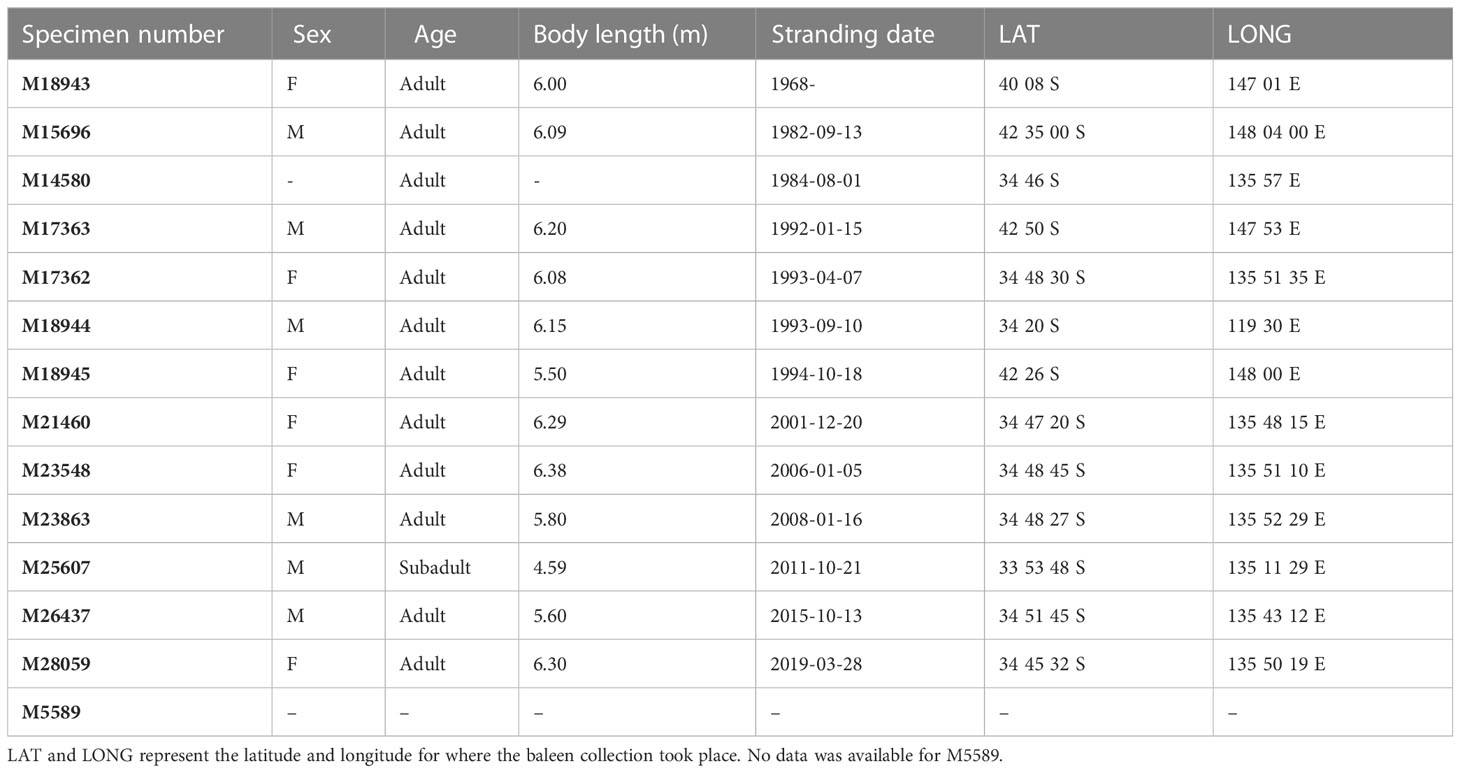
Table 1 Biological information associated with each baleen specimen from the South Australian Museum (SAMA).
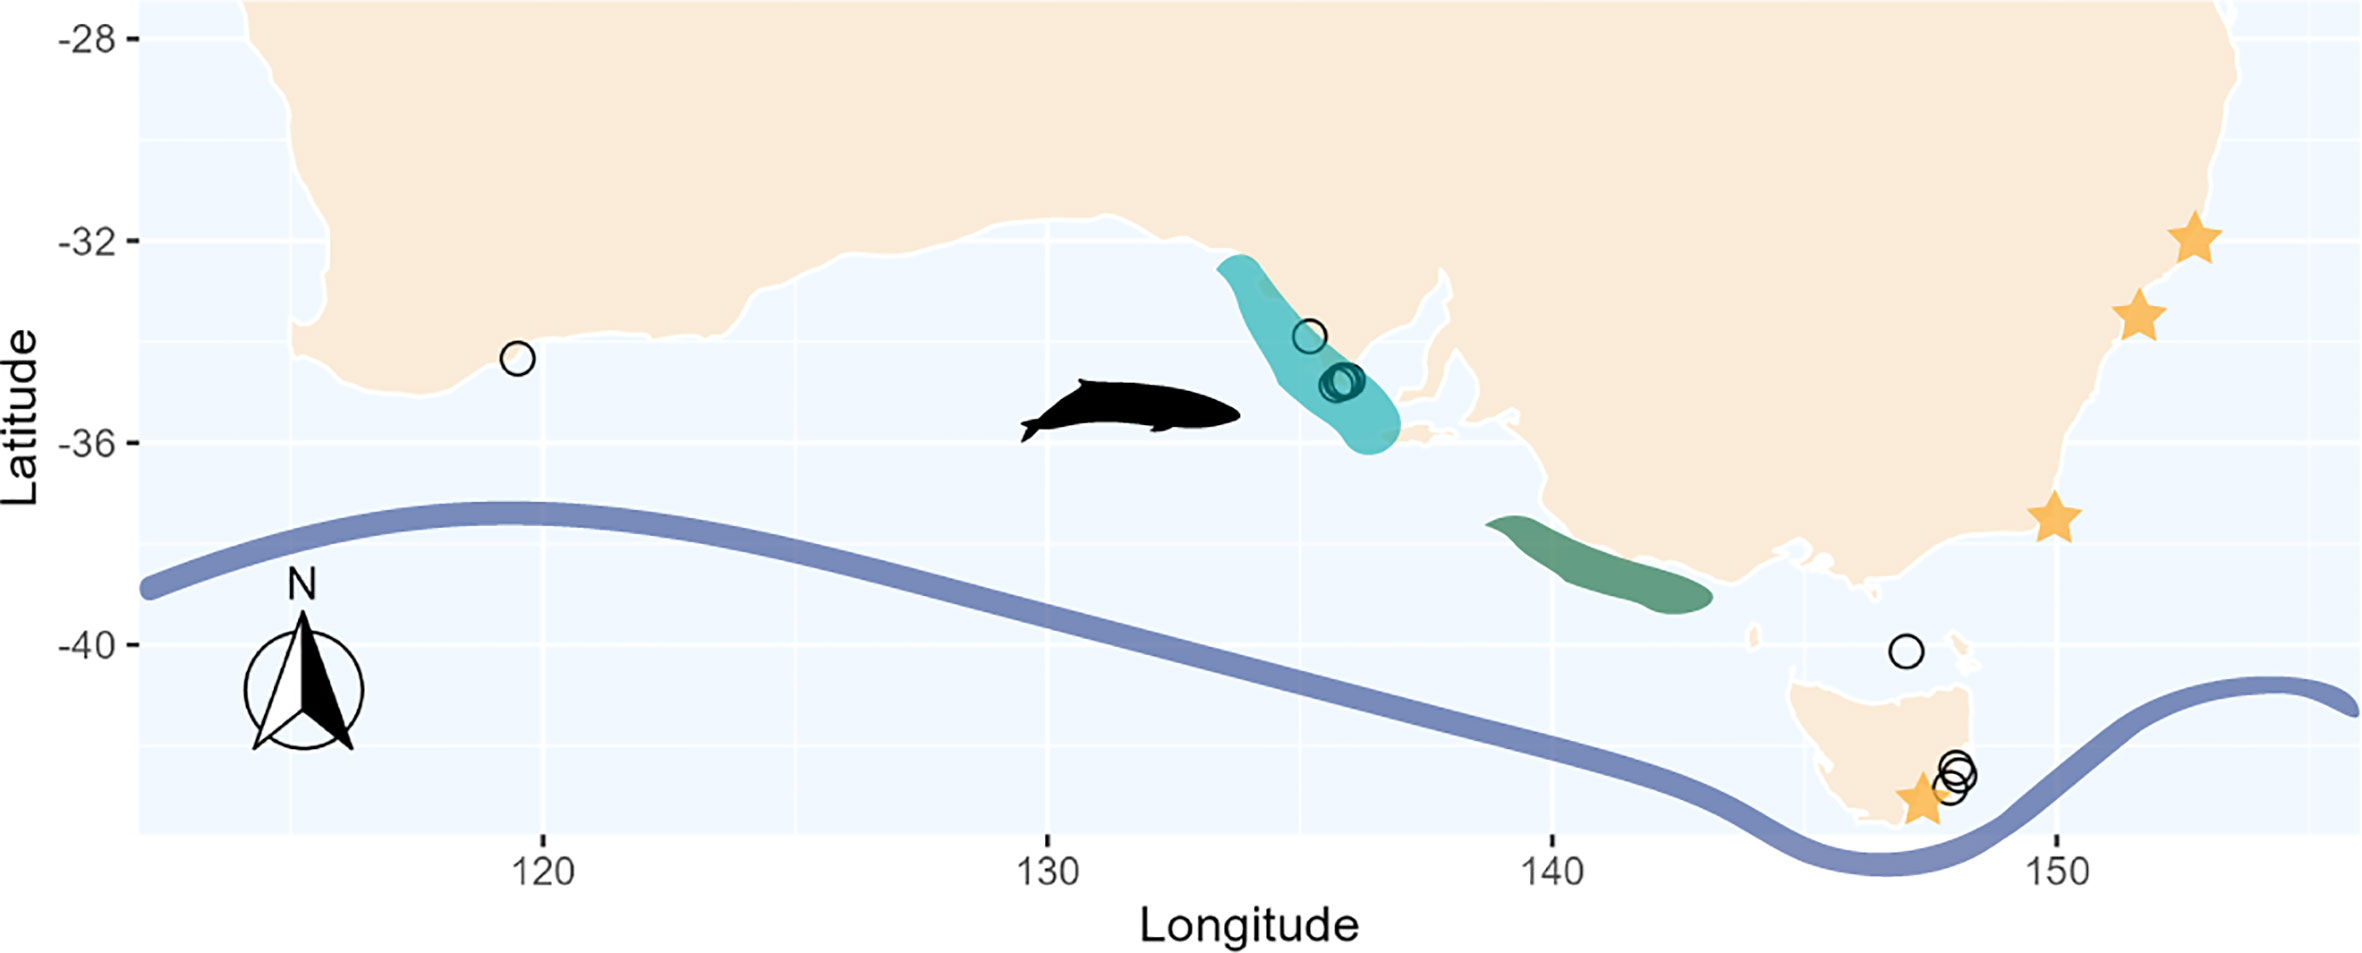
Figure 2 Locations of stranded pygmy right whales (n = 13) off southern Australia and Tasmania (open circles). Orange stars represent approximate locations of literature-derived prey estimates, excluding Antarctic samples as they spanned 2 different areas within Antarctica. Shaded areas show the location of upwelling at both the eastern Great Australian Bight (light blue) and the Bonney Upwelling (dark green). The blue line represents the approximate location of the Subtropical Convergence. M5589 did not have available coordinates, thus was excluded from the figure. Pygmy right whale silhouette was sourced from PhyloPic, credit: Chris huh (https://creativecommons.org/licenses/by-sa/3.0/).
Stable isotope analysis
Baleen plates were first scrubbed with Milli-Q water using steel wool, then cleaned with a 2:1 chloroform to methanol solution twice to remove surface lipids and contaminants prior to sampling. Starting at the proximal end (most recent growth beneath the gum), approximately 0.5 mg of baleen powder was extracted every 1 cm along the longitudinal growth axis 0.5 cm from the labial edge using a Dremel engraving tool. Powdered samples were transferred to tin capsules and compressed airtight for processing and analysis. Samples were processed using the Flash 2,000 organic elemental analyser, interfaced with a Delta V Advantage Isotope Ratio Mass Spectrometer via a ConFlo IV interface (Bioanalytical Mass Spectrometry Facility, Mark Wainwright Analytical Centre, UNSW Sydney). Nitrogen and carbon reference standards USGS40 and USGS41A were used to correct potential instrumental drift prior to isotope abundance calculation. Ratios of C:N ranged from 3.4 ± 0.1 and were within the established range of pure keratin (3.4 ± 0.5) (Hobson & Schell, 1998; Trueman et al., 2019).
PRW baleen isotope values were compared to literature-derived bulk δ15N and δ13C isotope values of their potential prey species (Table 2). Voucher prey samples were selected from Australian waters at temperate latitudes as well as euphausiid species from Antarctica (to rule out feeding within the Southern Ocean). Due to no available bulk stable isotope values of prey species within the two upwelling regions (eastern GAB and Bonney Upwelling), we selected the only and closest available prey samples to these two regions, including off southeast Australia, southeast Tasmania, and eastern Australia (northern NSW) (Figure 2). For comparison with PRW stable isotope values, prey estimates were adjusted for trophic fractionation. These estimates were calculated as per Eisenmann et al. (2016):
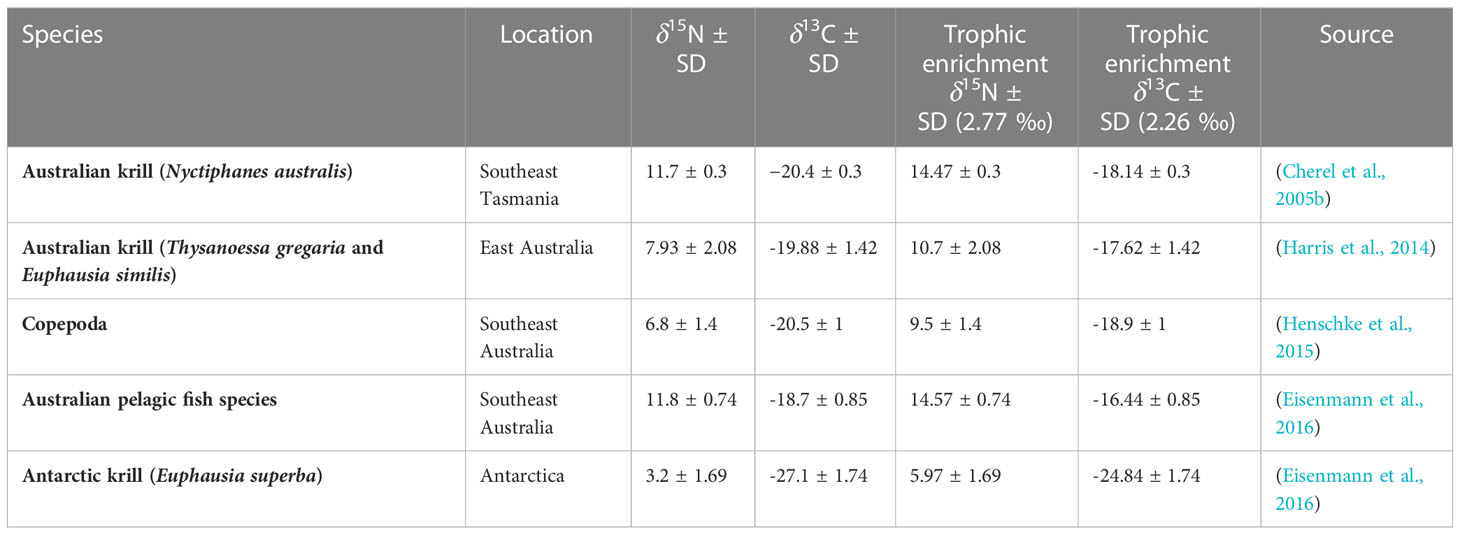
Table 2 Trophic adjusted δ15N and δ13C values of potential prey species sourced from published literature.
Where, δX = stable isotope values of either δ13C or δ15N, B = baleen, p = prey, TF = trophic enrichment factor, SD = standard deviation, x = 13C or 15N. Here, we used the TF of krill-feeding fin whales (Balaenoptera physalus) from the Northern Hemisphere, known to be +2.77 ‰ for δ15N and +2.26 ‰ for δ13C (Borrell et al., 2012). This TF was also more accurate for Southern Hemisphere humpback whales (Eisenmann et al., 2016) compared to that of generic estimates (DeNiro & Epstein, 1981; Minagawa & Wada, 1984; Peterson & Fry, 1987), however blue whale TF aligned more closely with the established TF of bottlenose dolphins (Busquets-Vass et al., 2017). As we could not directly measure the amount of isotopic enrichment of PRWs, relative to known, local prey sources (due to the lack of data), we assumed they align with the majority of baleen whale species with estimated TFs. We also assume that the prey isotope values (mean and standard deviation) capture the natural variation within the prey species’ isotopic range that may vary over time and space (Rodríguez-Malagón et al., 2021). We used previously averaged values for Antarctic krill (E. superba) and Australian fish by (Eisenmann et al., 2016) to best account for temporal variability where available. Copepod δ15N and δ13C values were averaged as they did not significantly vary across different water types off southeast Australia (Henschke et al., 2015). Literature-derived prey samples from southeast Tasmania (N. australis) and Antarctica (E. superba) were lipid extracted/corrected, while non-lipid extracted/corrected prey samples included those from eastern Australia (T. gregaria, E. similis) and southeast Australia (copepods and Australian pelagic fish species) (Table 2). Given that lipid-corrected prey samples of euphausiids show a slight increase in δ15N values (Logan et al., 2008), it is possible N. australis and E. superba true range is slightly lower. We believe the impact of this on our conclusions is minimal, given E. superba is beyond the range of PRW δ15N values and N. australis is enriched, relative to most PRW values, by a whole trophic level.
Baleen growth rate
The rate of baleen growth for PRWs has not yet been estimated, and due to the uncertainty in their migration and feeding patterns we were unable to use predictable annual shifts in movements (and associated physiological changes triggered by fasting) to calculate their baleen growth rate. Therefore, we assume the cyclical nature of δ15N values in PRW baleen reflects the fluctuations in seasonal prey availability and annual changes in food web dynamics (driven by predictable upwelling) within waters off southern Australia; a likely feeding ground.
Based on the assumption that stable isotope oscillations are formed due to seasonal food web changes, we estimated individual-specific baleen growth rates by measuring the distance between two adjacent δ15N minimums. Depending on the length of the baleen plate and the number of clear, measurable oscillations, this resulted in between one and three growth rate measures per individual. When there were two or more oscillations measured within the baleen of one individual, the average of these became their individual-specific average. The species average was calculated by taking the overall mean of all baleen growth measures, resulting in 18.5 ± 4.8 cm/year (see Supplementary Table 1). Using species average baleen growth rates is a more robust calculation as it: (a) partially accounts for the high variability seen within and across individuals, likely representing changes in behaviour across years rather than an explicit change in tissue growth rate; and (b) not all individuals have clear, measurable oscillations.
Baleen time attribution
Dates were assigned to baleen segments for analysis with oceanographic variables following the protocol outlined by Dedden and Rogers (2022). Briefly, we used the species-specific baleen growth rate, stranding date (i.e., closest date available to when the whale died), and sampling interval to calculate the number of days between each data point. A date was then assigned to each data point based on the cumulative days since death (i.e., last known baleen growth). PRW individuals M5589 and M18943 were excluded as they did not have an available stranding date, a necessity for attributing time to baleen segments. Like most studies involving bulk stable isotopes, time attribution assumes that stable isotope assimilation is constant in all individuals despite potential differences in physiology (e.g., reproductive state).
To account for the ~1 cm of fragile keratin at the proximal end (within the gum), which was too thin to be sampled, the date of each data point was shifted forward (towards the proximal end) by 1 cm (~19 days) so that the stranding date would match the point of most recent growth at the proximal edge.
Environmental data
Two regions were selected that reflect possible PRW feeding locations off mainland southern Australia. These were two of the seven hotspots previously identified by Kemper et al. (2013) and reflect: (a) where the majority of samples were sourced, and (b) two important upwelling areas that many other species of marine wildlife within the region rely on (Gill, 2002; Rogers et al., 2013). These included two upwelling regions, one within the eastern GAB (-37.167 S 132.94 E to -34.167 S 136.917 E) and the other further southeast known as the Bonney Upwelling (-38.376 S 137.521 E to -36.223 S 141.378 E). While both upwelling regions are within proximity of each other off southern Australia, combining regions would result in an area so large it would underestimate localised upwelling events due to averaging across surrounding regions. By selecting smaller areas of known productivity, we avoid underestimating these events.
Chlorophyll-a concentration
Chlorophyll-a concentrations were extracted from the Integrated Marine Observing System’s (IMOS) Australian Ocean Data Network (https://portal.aodn.org.au/). Daily chlorophyll-a concentrations from 1 Jan 2003 to 8 March 2019 were extracted from the MODIS sensor (onboard the Aqua satellite), which records multi-spectral measurements used to infer chlorophyll-a concentrations. The OCI retrieval algorithm was used by IMOS for estimating near-surface chlorophyll-a concentration (mg m-3). This algorithm is based on a colour index (CI), returning near-surface concentrations of chlorophyll a by using an empirical relationship derived between in-situ measurements of chlorophyll a and remote sensing reflectance of blue-green regions. These blue-green regions typically reflect phytoplankton present in the water, an inference for chlorophyll a (Hu et al., 2012). Daily chlorophyll-a concentrations were averaged to form monthly values for analysis by taking the average of all daily values for each given month. The OCI algorithm was chosen for analysis as it more accurately reports low chlorophyll-a concentrations, which are likely for the area of interest where PRWs feed. Individuals who stranded prior to 2003 (earliest chlorophyll a data) were excluded from the analysis with chlorophyll a, leaving 5 individuals that stranded from 2003 onwards (Table 1).
Sea surface temperature (SST)
SST observations were also extracted from IMOS’s Australian Ocean Data Network (https://portal.aodn.org.au/). Observations prior to 2012 were taken from IMOS-SRS-SST-L3S-Single Sensor consisting of day and night-time monthly values from a single-sensor, multi-satellite product. These SST observations were obtained from the Advanced Very High Resolution Radiometer (AVHRR) instruments from all available National Oceanic and Atmospheric Administration (NOAA) polar-orbiting satellite. Here, each grid cell of interest is the monthly average of all available high-quality SST measurements that overlap with that cell and weighted according to the area of overlap. Observations from 2012 onwards were taken from the newer IMOS-SRS-SST-L3S-Multi-Sensor product as it provides improved coverage and accuracy. By switching from the single sensor to multi sensor in 2012 we used the best quality data available at the time.
Statistical analysis
Linear mixed-effects models were selected as the most appropriate for analysis as they allow for nested random effects and correlation structures. Using the ‘lme’ function from the ‘nlme’ package (Pinheiro et al., 2007) in R version 4.1.2 (R Core Team, 2021), we investigated whether δ15N values from PRWs were associated with SST and chlorophyll-a concentrations at the eastern GAB and Bonney Upwelling. SST and chlorophyl-a concentrations at both locations were included as fixed effects. All δ15N values for each individual were included as the response. Individual was incorporated as a nested random effect due to the replicate samples along the baleen for each whale. Autocorrelation in PRW data was accounted for via the inclusion of an order 1 autocorrelation structure ‘corAR1’ in the lme models, assuming the repeated measurements are equally spaced. Here, the addition of the ‘corAR1’ term was included after a comparison against the same model without this correlation structure, assessed via Akaike Information Criterion (AIC). Both chlorophyll-a concentrations and SST were analysed at a zero-lag period, however we also tested lag periods of 1–3 months to account for any delay between the upwelling event and prey abundance that PRWs rely on (resulting in 16 models – 8 for each fixed effect). As the different lag periods were directly correlated, all linear mixed-effect models were reported based on their statistical significance rather than compared. Both marginal and conditional R2 values were reported to show the influence of fixed effects alone (R2m) and combined with the random effects (R2c). To access whether relationships were consistent between male and female PRWs, sex was added to significant models as a fixed effect. We tested the homogeneity of variance in δ15N and δ13C values across months via the Bartlett’s test to determine whether the isotopic range for each month was equal. Due to the lack of intra-annual variation observed in δ13C values, we did not analyse the relationship between PRW δ13C values and chlorophyll-a concentrations or SST. We did not adjust δ13C values for changes due to the Suess effect (Young et al., 2013), instead the original δ13C values were used. This is because our focus was to assess whether changes in intra-annual variability in stable isotope values were associated with the timing of intra-annual changes in oceanographic features. The shifts in δ13C values due to the Suess effect will be slight within any year, which is not true across years, but here we do not examine long-term (inter-annual) temporal changes in δ13C values. The original δ13C values were also used to infer potential prey types. This is because the shift in δ13C values, due to the Suess effect, over the time of our study would be relatively low compared to the difference in δ13C values that identify whether the PRWs remain relatively sedentary and feed within temperate waters or whether they annually migrate south to feed on Antarctic krill. In addition, the difference in δ13C values due to the Suess effect would be relatively small compared to the likely difference in the prey stable isotope values used here and the ‘true’ prey values. The stable isotope prey values available were not closely tied to the PRWs in this study. Our prey stable isotope values were not from prey collected from the region the whales were feeding, nor the year they stranded. With the data available we infer the broad region and prey types the PRW’s feed on rather than identify their foraging to particular prey species.
Results
PRW δ15N values ranged from 2.69 to 13.72 (‰), averaging at 8.82 ± 1.7, while δ13C ranged from -20.32 to -13.15 (‰) and averaged at -18.05 ± 0.86. There was large overlap between trophic-adjusted stable isotope values of Australian krill species (T. gregaria and E. similis) and values of the PRWs (Figure 3). Additionally, there was overlap between stable isotope values of PRWs and those of copepod species from the southeast Australian coast. There was no overlap between the stable isotope values of PRW with the values of Antarctic krill (E. superba), the Australian krill species N. australis, or Australian pelagic fish species. All individuals appeared to have a similar spread across their stable isotope range (Supplementary Figure 1).
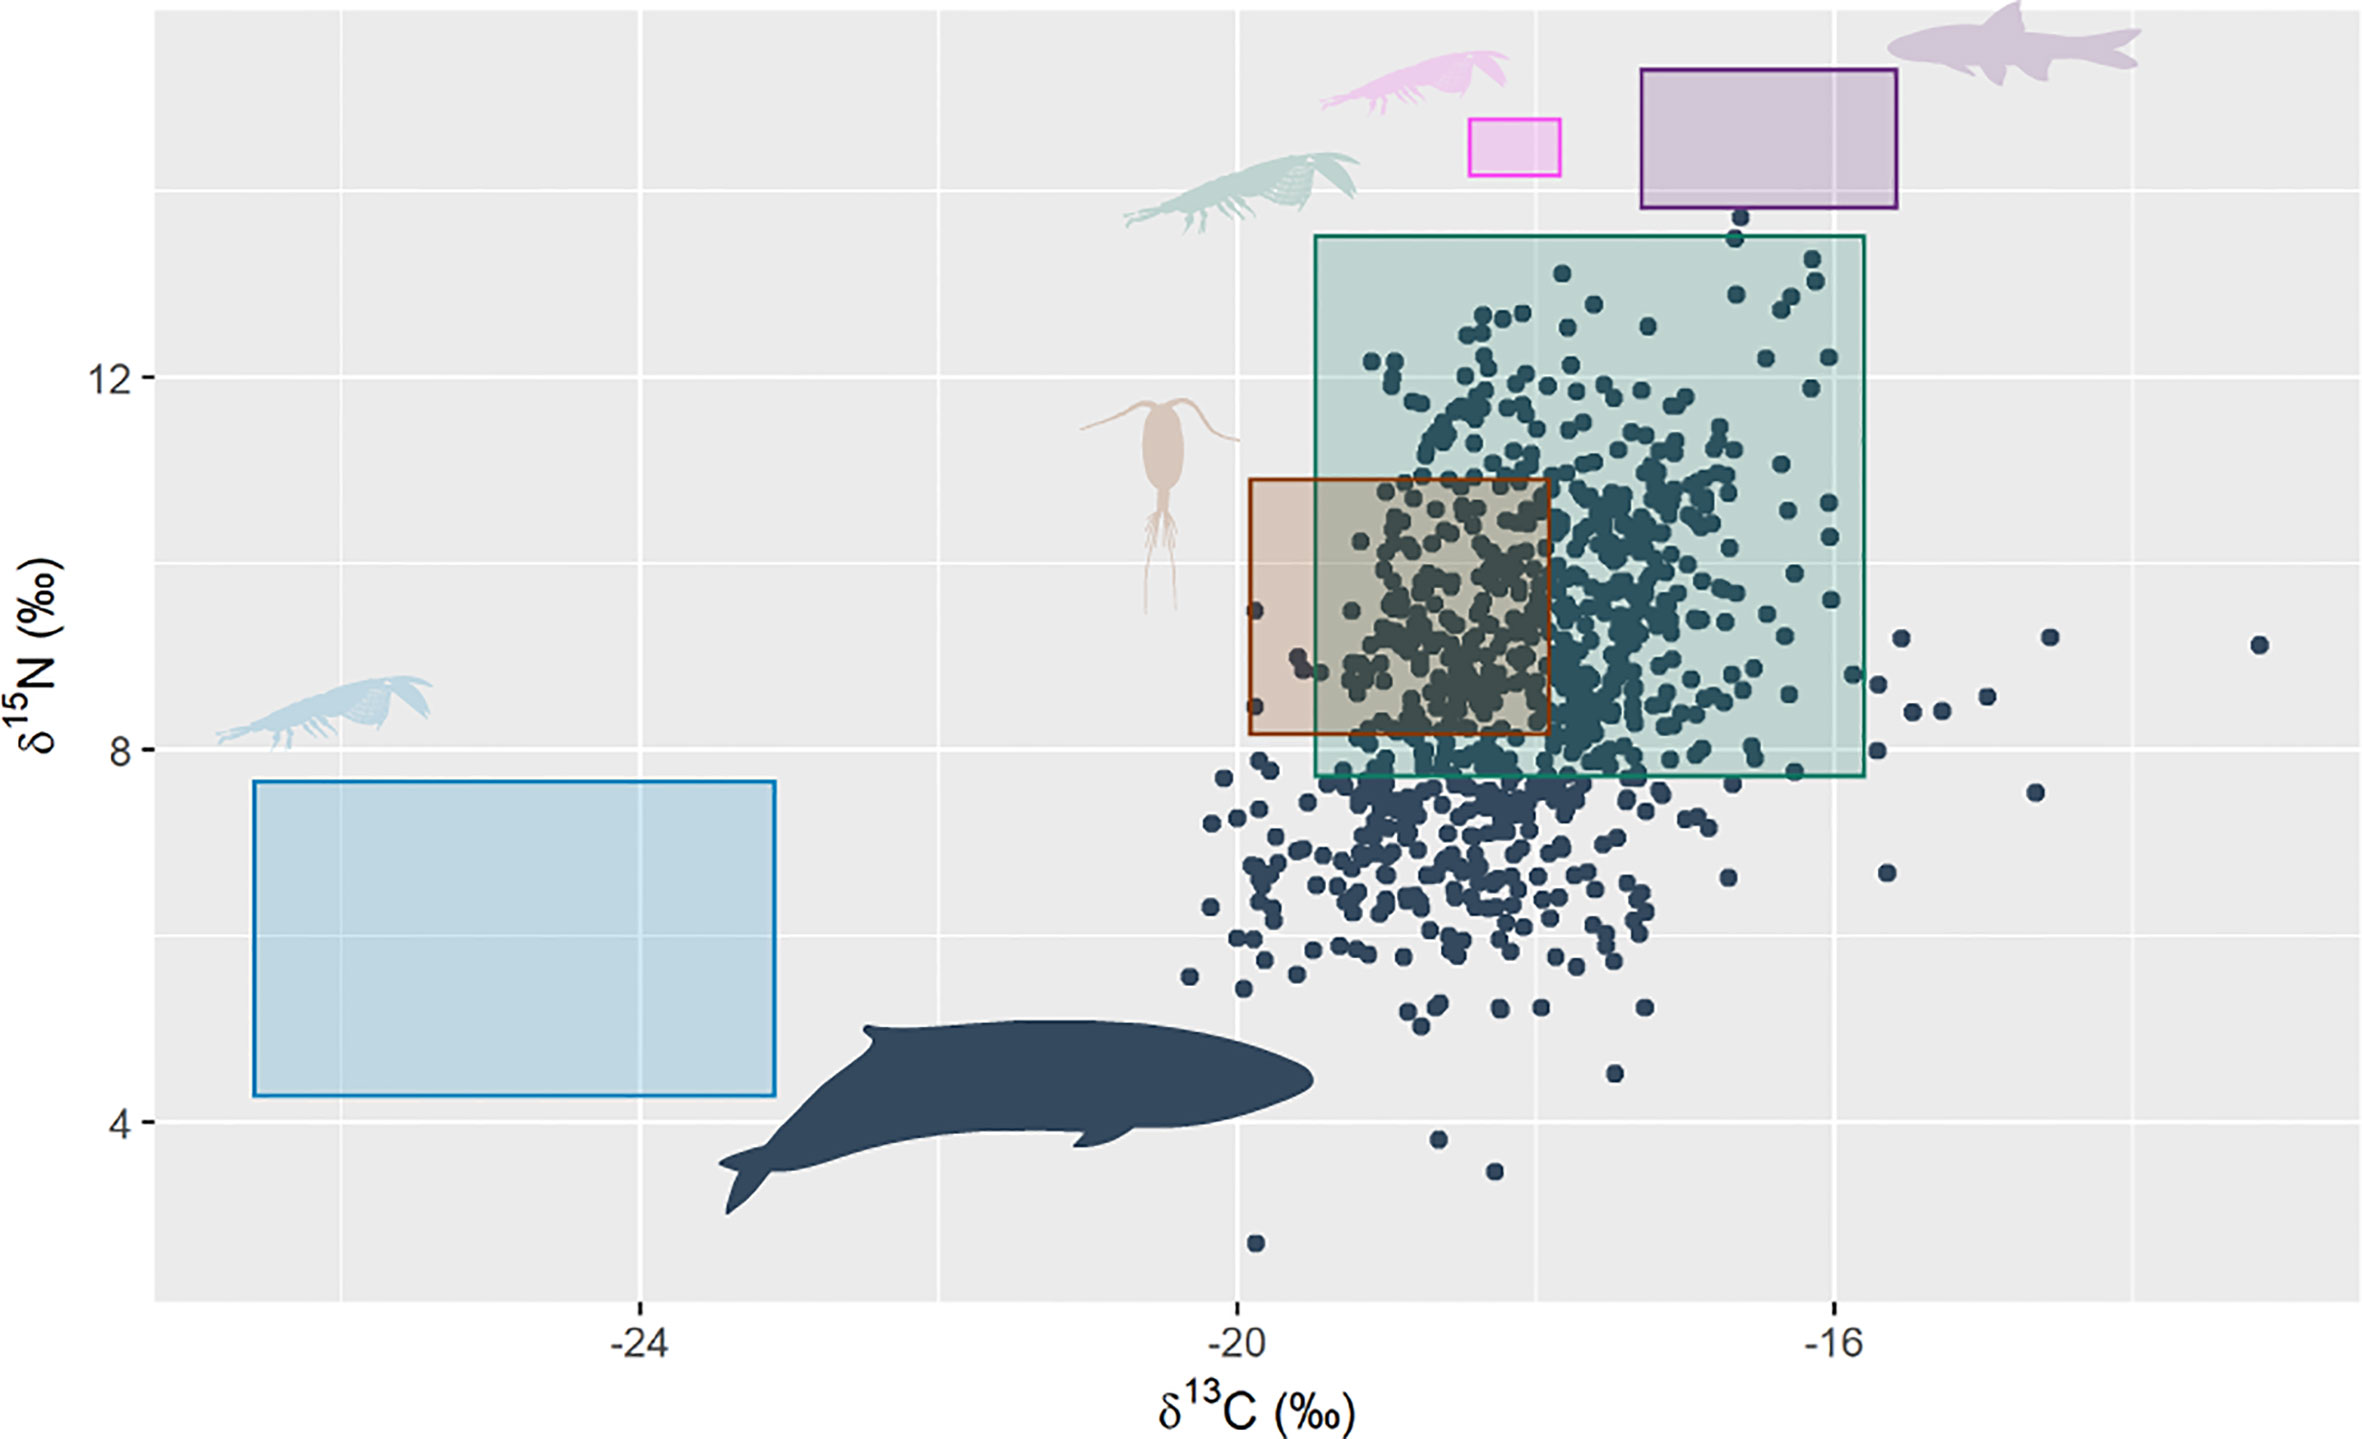
Figure 3 Pygmy right whale bulk stable isotope values of δ15N and δ13C (black circles, n = 14 whales, 806 sequentially sampled points along baleen). The coloured rectangles show the trophic adjusted (δ15N = 2.77 ‰, δ13C = 2.26 ‰) mean ± sd of potential prey stable isotope values: green = Australian krill species (T. gregaria and E. similis) sourced from east Australian waters (Harris et al., 2014); pink = the Australian krill species, N. australis, sourced from southeast Tasmania (Cherel et al., 2005b); brown = averaged copepod species from southeast Australia (Henschke et al., 2015); blue = Antarctic krill (E. superba), sourced from multiple locations in the Southern Ocean and averaged by Eisenmann et al. (2016); and purple = Australian pelagic fish species from southeast Australia, also averaged by Eisenmann et al. (2016). Pygmy right whale silhouette colour was changed and sourced from PhyloPic. Credit: Chris huh (https://creativecommons.org/licenses/by-sa/3.0/).
Individuals have ~2 to 3.5 oscillations per baleen plate (Figure 4), which suggests (under the assumption that each oscillation represents one year) that PRW baleen reflects up to the most recent 3.5 years of growth. The species-specific baleen growth rate of PRWs averaged at 18.5 ± 4.8 cm/year. The enrichment and depletion of stable isotope values along oscillations are generally consistent between δ15N and δ13C, however the difference in δ15N from peaks to troughs is greater than that of δ13C values.
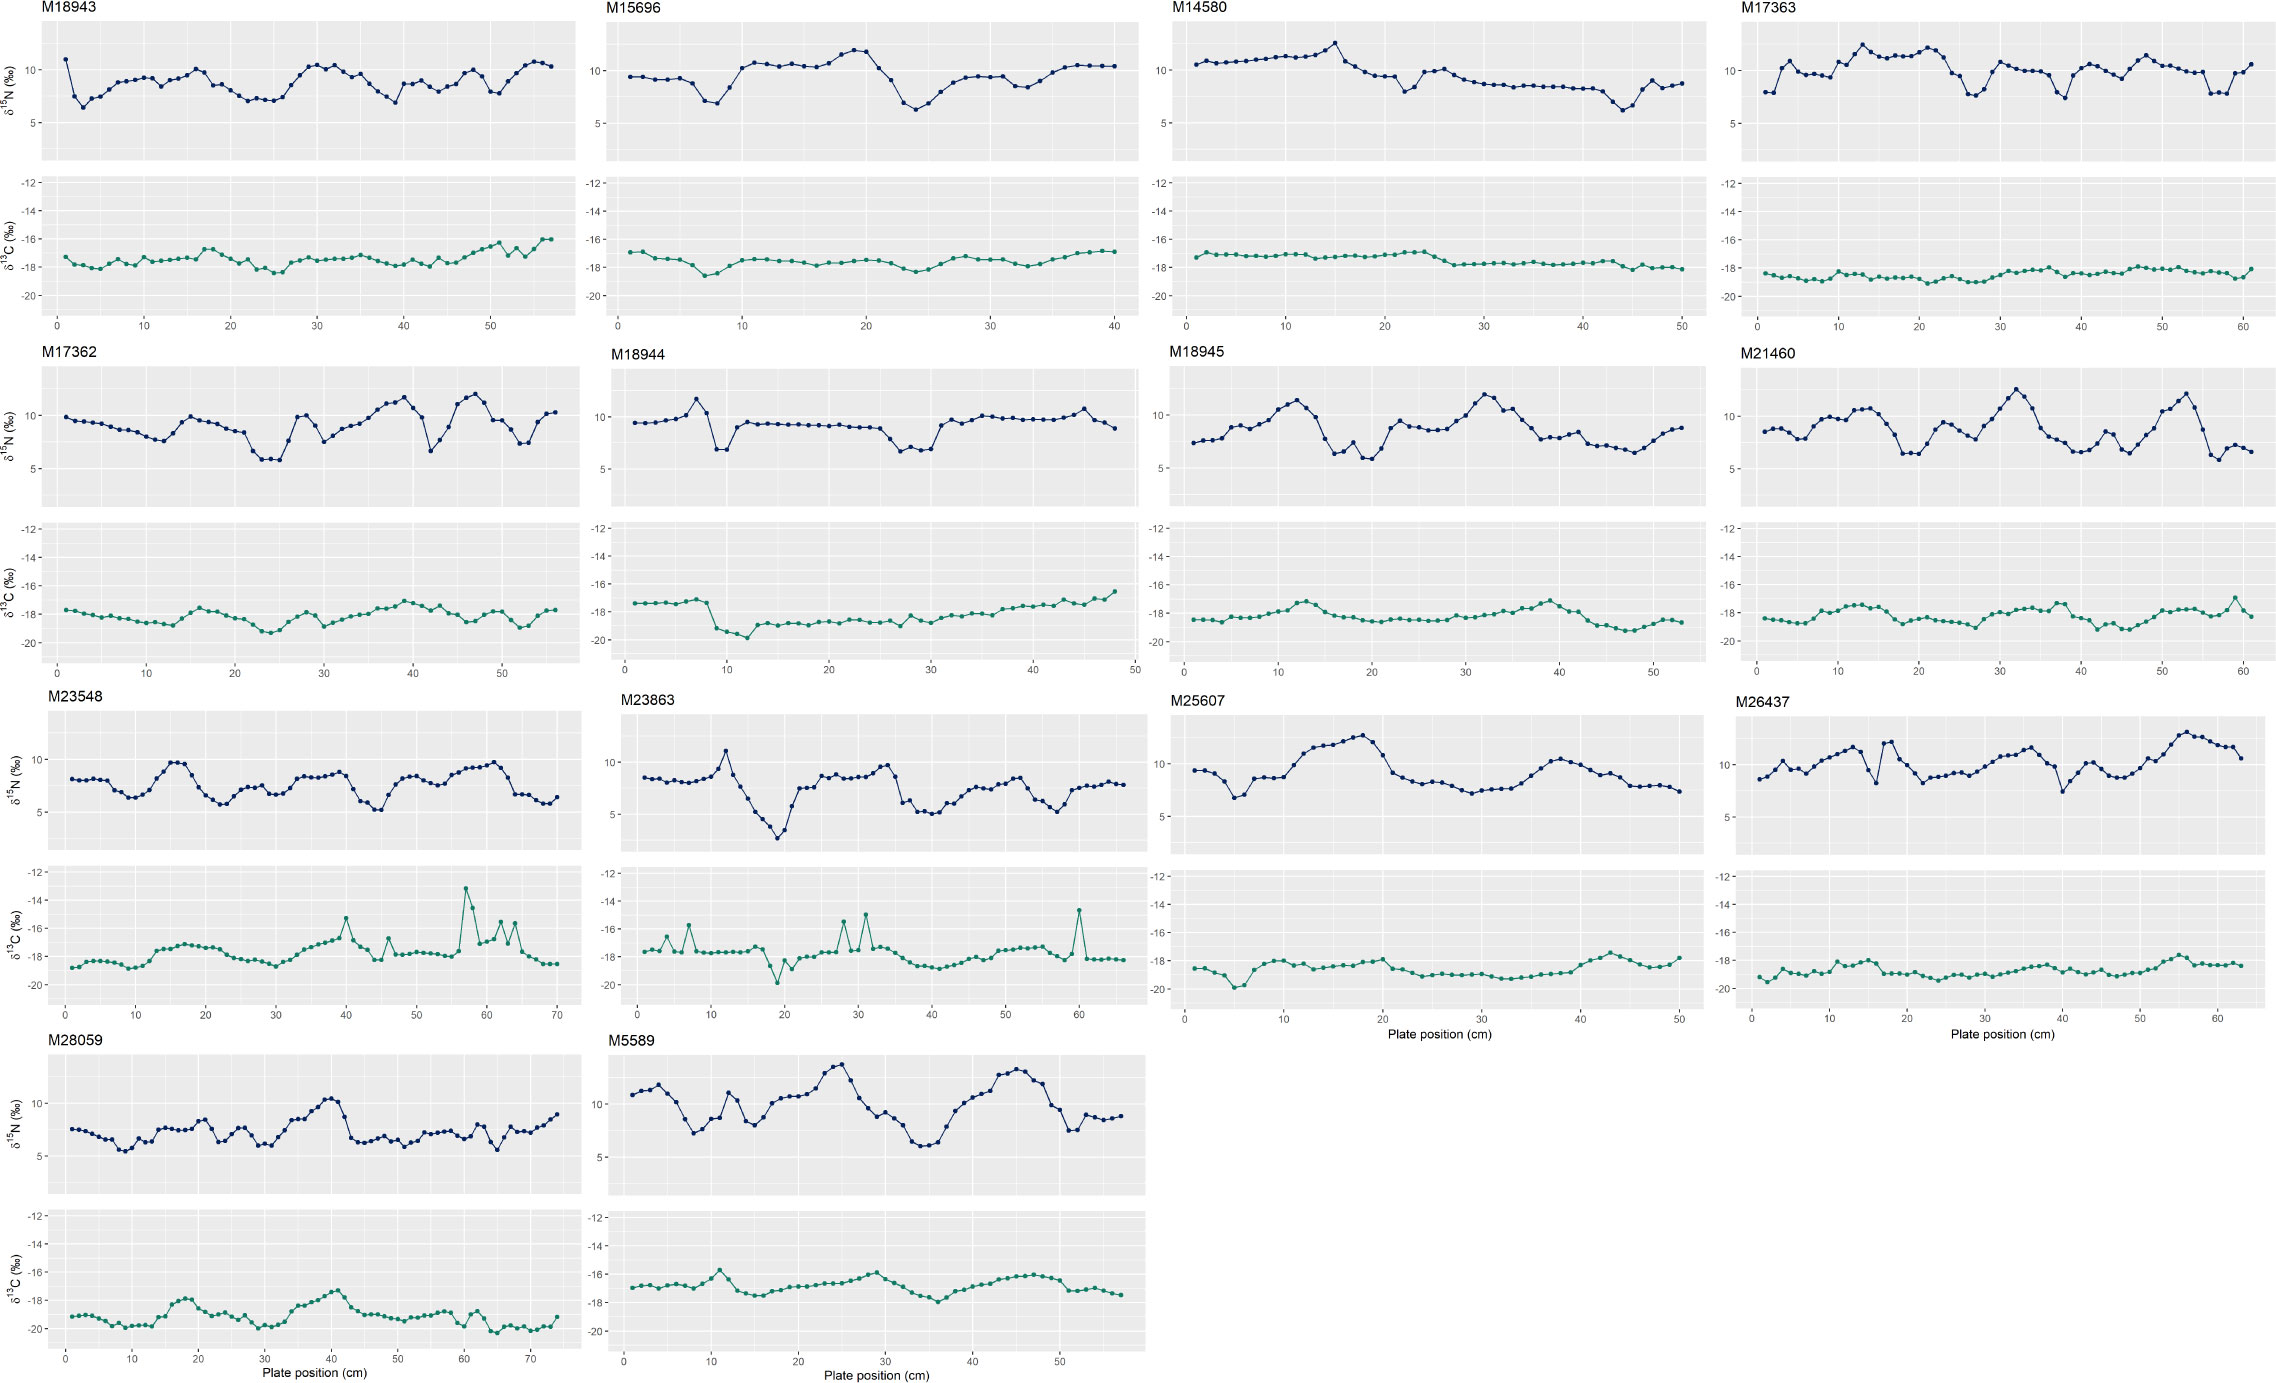
Figure 4 Oscillation patterns in nitrogen (δ15N) (blue) and carbon (δ13C) (green) stable isotope values along the baleen plates of pygmy right whales (n = 14 individuals) ordered by approximate stranding date. Plate position at 0 cm reflects the collection point at the proximal end of the baleen plate (i.e., the most recent growth). Individual number is the South Australian Museum specimen number (as seen in Table 1). Refer to Supplementary Table 1 for the oscillations used to estimate baleen growth rate.
There was unequal variance in δ15N values across months (Bartlett test: p = 0.001). During winter (June to August), there appeared to be less variation in δ15N values, compared to summer months (December to February) that generally have a larger range of δ15N values (Figure 5). On the other hand, δ13C values had equal variance between months (Bartlett test: p = 0.06) (Supplementary Figure 2).
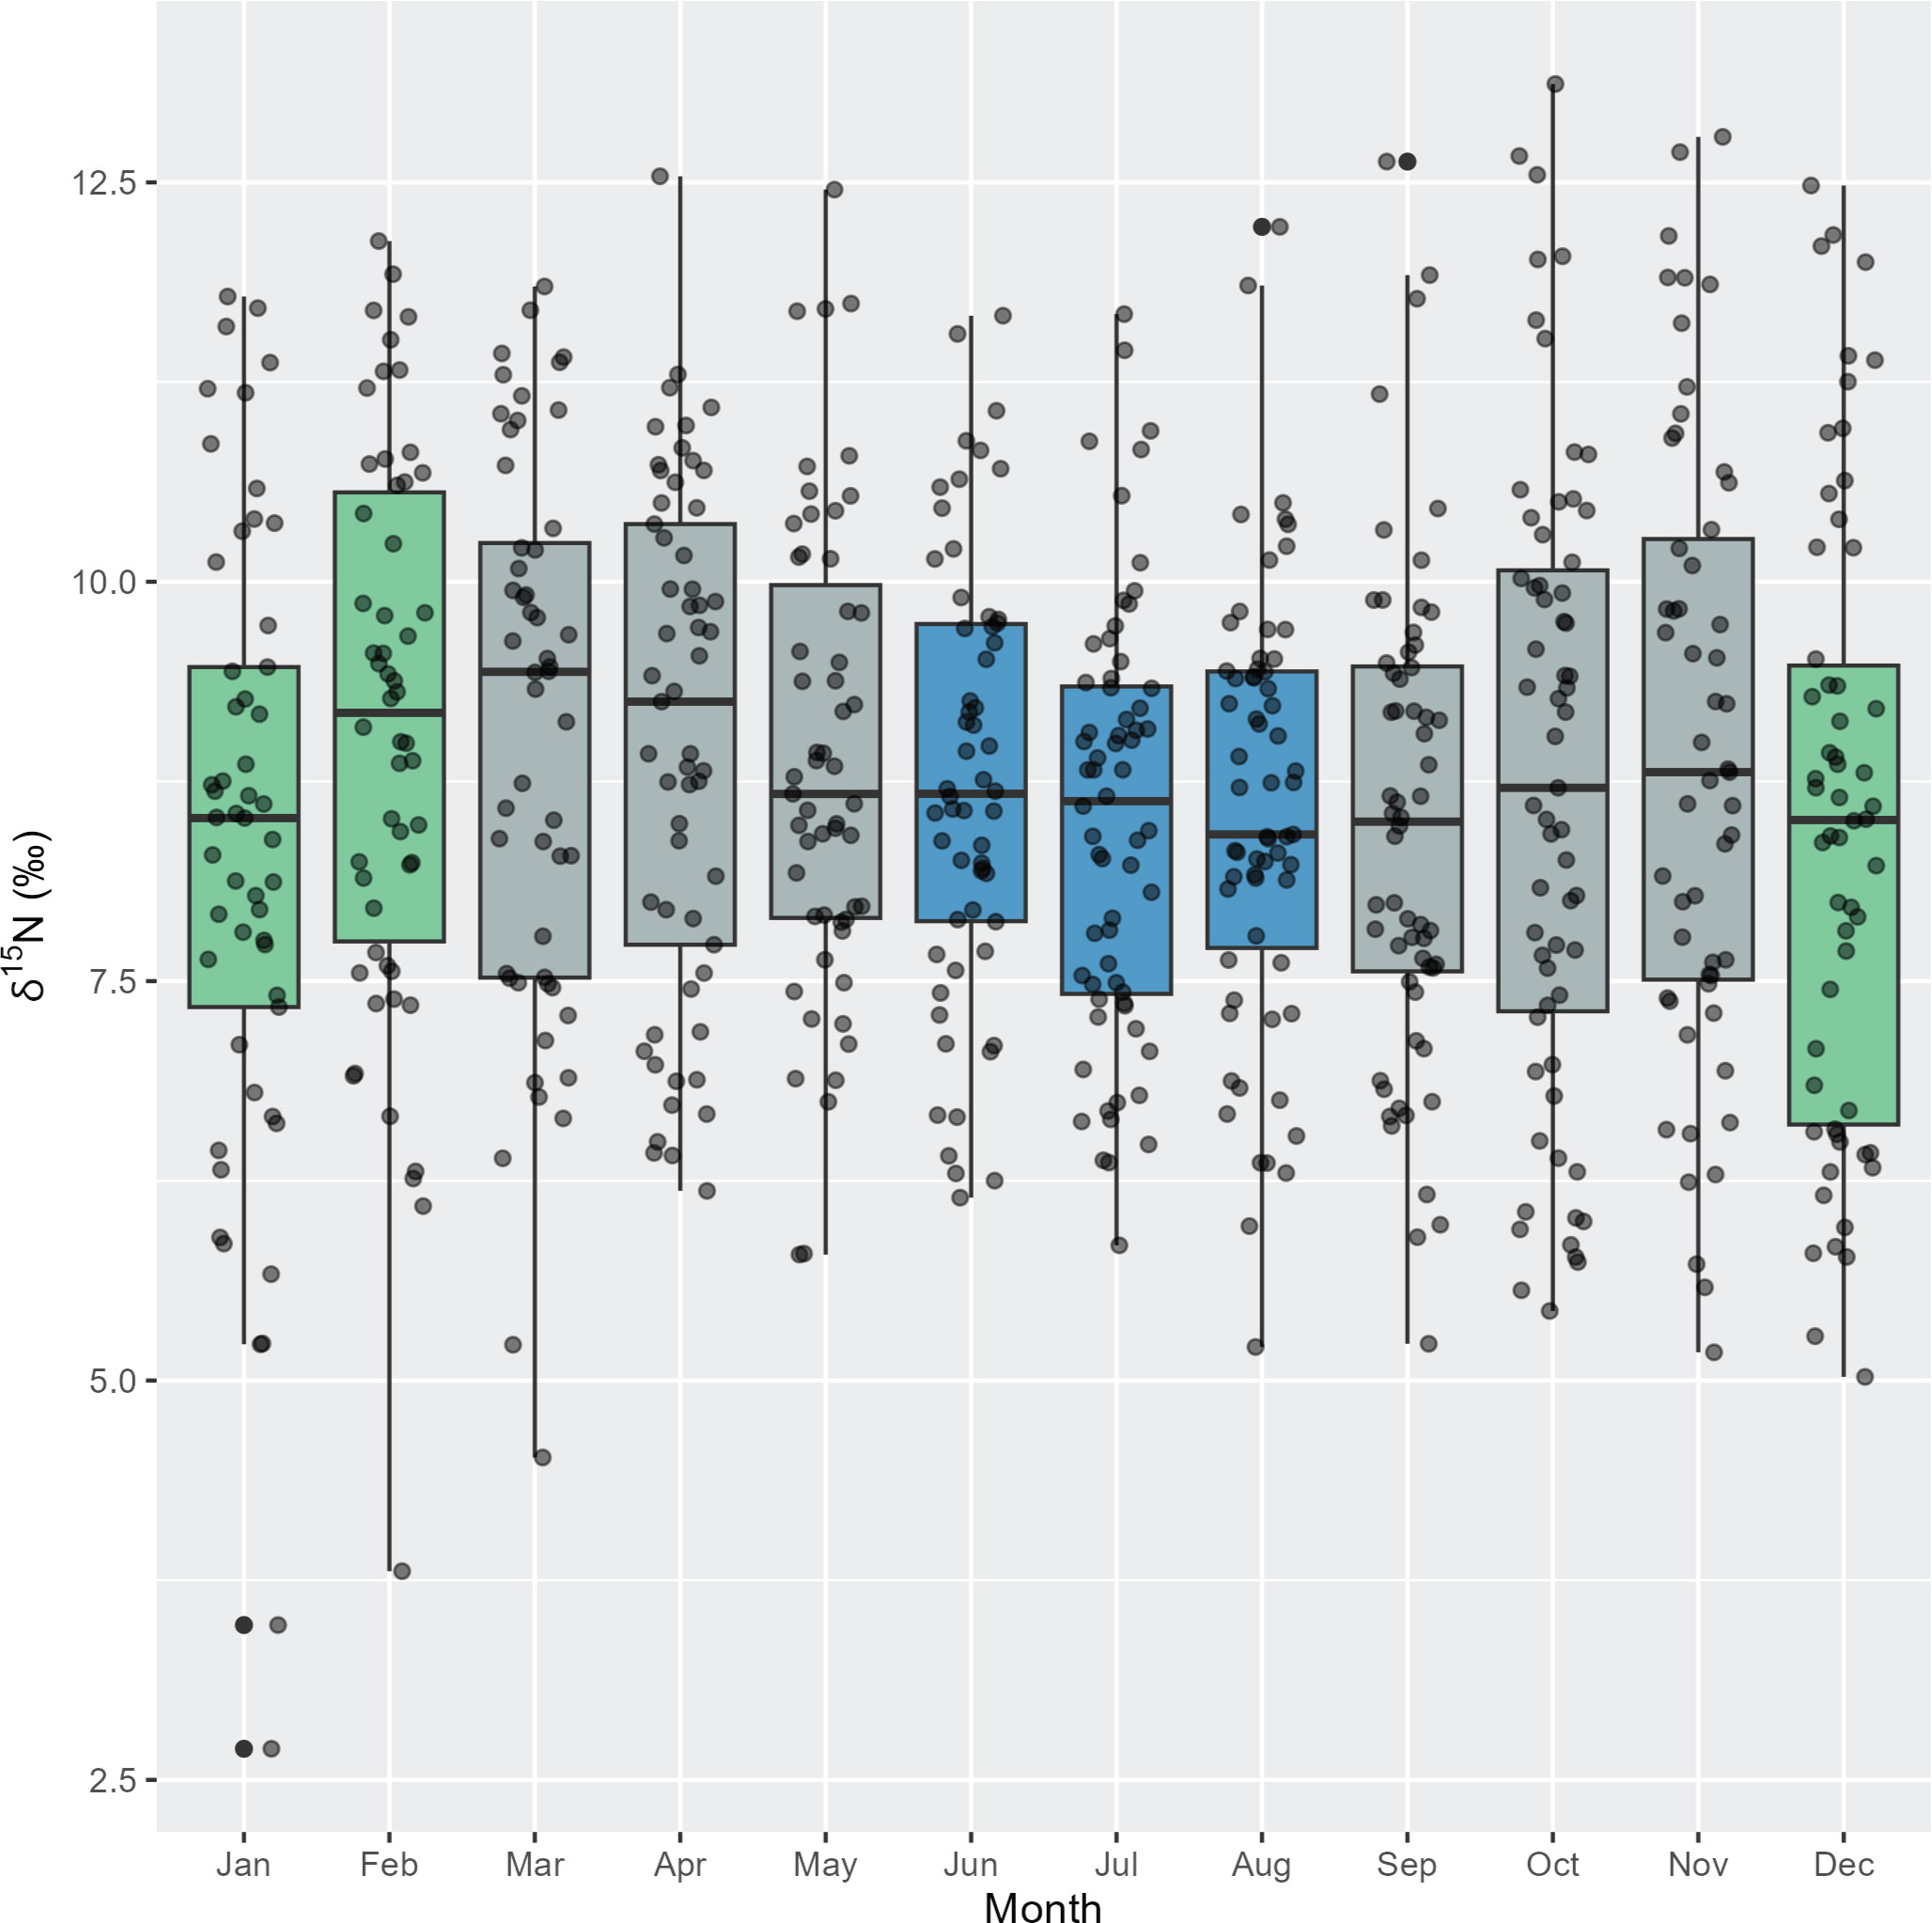
Figure 5 Intra-annual variation in δ15N stable isotope values for adult pygmy right whales (n = 12 whales, 692 sequentially sampled points along baleen) grouped by month (black circles). Box plots show median and 95% confidence intervals. Green = summer, blue = winter, grey = autumn and spring.
At both the eastern GAB and Bonney Upwelling regions, there was a weak positive relationship between PRW δ15N values and SST with no lag (p = 0.01, R2m = 0.02 & 0.01, R2m = 0.02 respectively). Generally, this showed lower δ15N values corresponding to cooler SST, while higher δ15N values generally corresponding to warmer SST (Figure 6). At the eastern GAB, there was a weak correlation between chlorophyll-a concentrations when lagged 2 months and PRW δ15N values, however, this statistical significance was minimal (p = 0.05, R2m = 0.01) (Table 3).
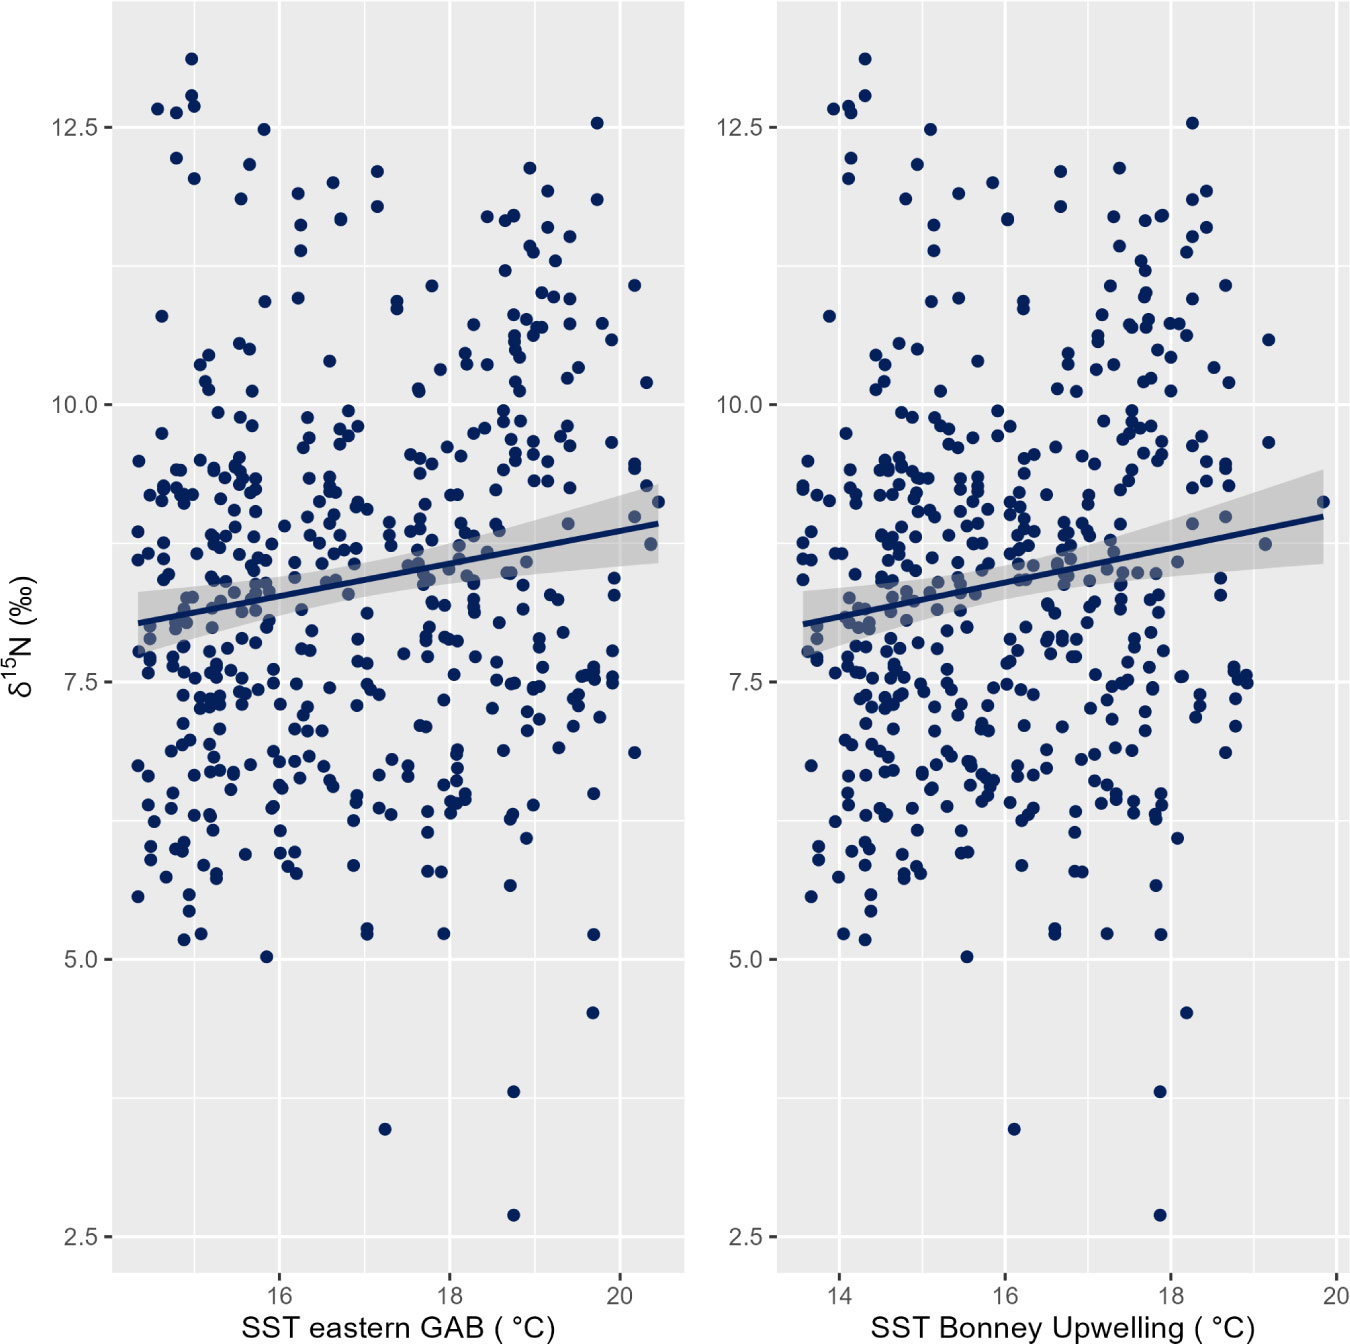
Figure 6 Linear relationship between the δ15N stable isotope values in baleen of pygmy right whales (n = 12 individuals) and SST (zero lag) for the eastern GAB (Great Australian Bight; left) (p = 0.01, R2m = 0.02) and the Bonney Upwelling (right) (p = 0. 01, R2m = 0. 02).
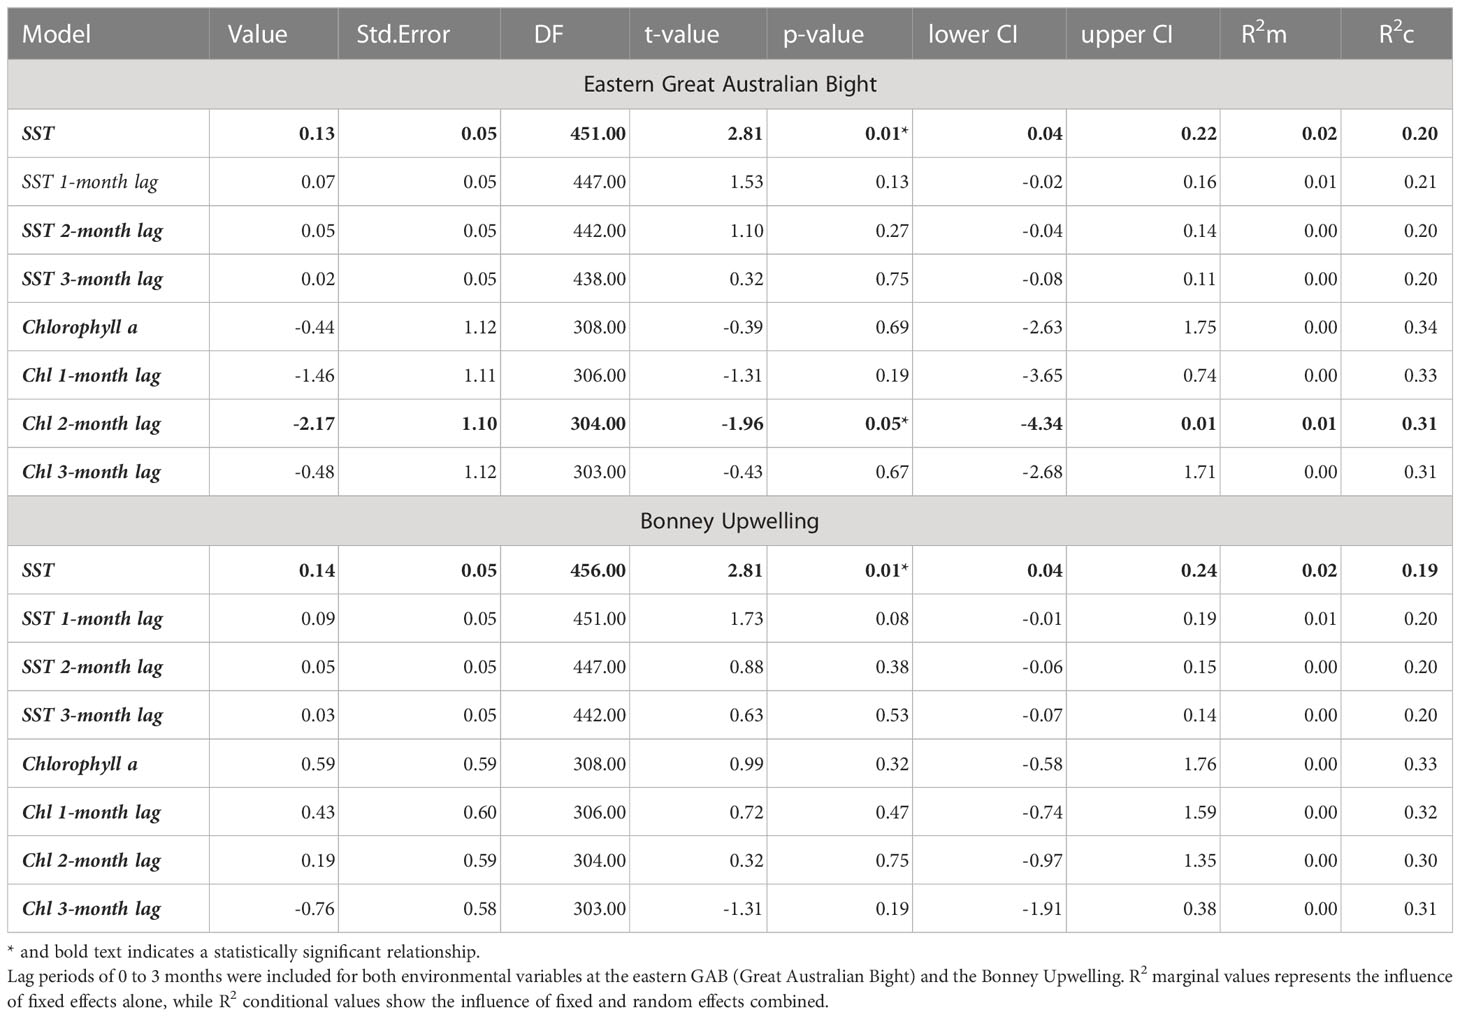
Table 3 Model outputs for the relationship between SST and chlorophyll-a concentrations and PRW δ15N values.
When sex was included in the model with PRW δ15N values and SST for both the eastern GAB and Bonney Upwelling, the influence of sex was not statistically significant (p = 0.23, p = 0.23 respectively). However, it appears female PRWs may drive the positive relationship between δ15N values and SST, while males appear to exhibit greater variability and a slight negative relationship between δ15N values and SST (Supplementary Figure 3).
Discussion
The assimilation of stable isotopes (δ15N and δ13C) in PRW baleen spanned up to 3.5 years based on annual oscillations detected in their plates, reflecting the most recent ~3.5 years of the whale’s life. We found evidence to suggest that PRWs remain year-round in mid-latitude waters, where they likely feed in upwelling regions between coastal waters off southern Australia and the subtropical convergence. In these mid-latitude regions they appear to primarily consume Australian krill and copepod species, however more prey voucher samples from coastal regions are required to distinguish specific species. There was no isotopic evidence that PRWs feed on Antarctic euphausiid species, supporting they are unlikely to occur in Antarctic waters. Additionally, there was a weak positive relationship between the time-stamped nitrogen stable isotope values in baleen and the SST from two likely feeding areas (eastern GAB and Bonney Upwelling). This suggests that variation in the baleen nitrogen stable isotope values (i.e., dietary patterns) are possibly linked to oceanographic changes that influence food web dynamics within both regions. We suggest the higher, more varied nitrogen stable isotope values during summer months may reflect the sporadic nature of upwelling and the occurrence of both classical and microbial food webs. In addition, these higher nitrogen values correspond to Australian krill and copepod species which are more abundant during these times. On the other hand, lower, less varied nitrogen stable isotope values may be associated with the dominance of a microbial food web during winter, in the absence of upwelling, and the change in resource use during these times.
Diet and habitat use
The data presented suggests that PRWs remain at mid latitudes year-round and lack north-south movements across distinct stable isotope gradients into Antarctic waters, supporting previous speculations (Kemper, 2002). Their carbon stable isotope record ranges between -20.32 and -13.15 ‰, which coincides with values well outside the Antarctic range (St John Glew et al., 2021). Modelled carbon values of particulate organic matter (POM) gradually decrease at approximately -40°S from -20 to -24 ‰ to around -28 to -31 ‰ towards high latitudes in the Southern Ocean (St John Glew et al., 2021). The absence of PRW carbon values below approximately -20 ‰ (i.e., values within the Antarctic range) suggest these whales are likely absent from the region entirely. There is a lack of baseline stable isotope data for mid-latitude waters between the Subtropical Convergence and coastal regions off southern Australia, making movement patterns of PRWs hard to distinguish. However, the gradual increase in carbon values from Antarctica to temperate waters and the comparable values off New Zealand (-22 to -19 ‰) (St John Glew et al., 2021), suggest the range of PRW carbon values may sit between the Subtropical Convergence and coastal waters off southern Australia, which support the limited sighting records of the whales within these regions (Kemper et al., 2013). Individual whales M23548 and M23863 show spikes in their carbon stable isotope values, as seen along their carbon oscillation patterns. However, as those few enriched carbon values are not associated with potential prey items it is difficult to ascertain to cause of such changes.
Compared to the clustered carbon stable isotope values (suggesting a primarily mid-latitudinal distribution), PRW nitrogen stable isotope values exhibit a large range, where the overlap between them and Australian krill and copepod species suggest a likely food source. Generally, higher nitrogen values (i.e., oscillation peaks) were associated with Australian krill species, where most of the overlap occurred with Australian krill species T. gregaria and E. similis. Copepods from the southeast Australian coast also appear to be included in PRW diet. It is possible the overlap between PRW stable isotope values and these prey species is not a true representation of their primary diet, and that other euphausiid species such as N. australis may be important as previously suggested (Kemper, 2002). This is because the samples for T. gregaria and E. similis were collected from eastern Australia (northern NSW), likely outside the PRW distribution (most northerly occurrence of PRWs is off southern NSW (Pavey, 1992)), and that the trophic enrichment factor of PRWs can not be accurately tested here. However, in the absence of prey stable isotope values from waters off southern Australia and the Subtropical Convergence, we utilised the best available prey data for similar mid-latitude regions and assumed PRW trophic enrichment factor based on other baleen whale species to infer their diet and habitat use. Furthermore, the similarity in available nitrogen and carbon stable isotope values of krill and copepod species between Australia, Tasmania, and New Zealand make it difficult to distinguish exact feeding patterns and movements between these areas, highlighting the need for additional prey samples. Australian pelagic fish species appear to be absent from the diet of Australian PRWs, as expected due to the small diameter of baleen fringes that indicate a diet of small euphausiids, copepods, and other small plankton, as identified through stomach content analysis (Budylenko et al., 1973; Sekiguchi et al., 1992; Kemper, 2002). Thus, the baleen structure and previous stomach content analysis support the isotopic overlap between PRWs and copepod and euphausiid species found in this study.
Stable isotope oscillations and oceanographic variability
We found that nitrogen and carbon stable isotope oscillations were synchronous within individual whales, however, the interpretation of these results is challenging. This is because changes in stable isotope values, particularly for nitrogen, may be due to various factors including direct changes in diet or changes in the animal’s physiology (DeNiro & Epstein, 1981; Fry, 1988). As a result, we suggest the changes in stable isotope values between nitrogen and carbon may represent either: (a) active changes in feeding due to oceanographic changes and shifts in food web dynamics; (b) metabolic changes due to seasonal variation in prey abundance; or (c) inshore/offshore movements between waters off southern Australia and the Subtropical Convergence.
Firstly, synchronous cycles in nitrogen and carbon stable isotopes may reflect changes in active feeding due to seasonal fluctuations in food web dynamics. In marine environments, the abundance of nutrients in surrounding waters can trigger fluctuations in food web dynamics that affect the efficiency of energy transfer from the bottom to the top of the food web (van Ruth et al., 2018). For example, high-nutrient water during summer upwelling is dominated by diatoms, facilitating a short classical food web that provides enhanced productivity (Sommer et al., 2002). In contrast, nutrient-poor water in winter typically supports a longer, less efficient microbial food web that is generally unproductive and dominated by picophytoplankton (Azam et al., 1983; Stockner, 1988). Food web dynamics of the eastern GAB are likely underpinned by variations in nutrient availability and changes in the number of trophic links from the bottom to the top of the food web (van Ruth et al., 2018). In the present study, we found that higher nitrogen values of PRWs (i.e., the enriched portion of the synchronous cycles) overlap with the nitrogen values of temperate prey species, being Australian krill and copepods. We also found that these higher values displayed more variation and generally occurred during the summer months when both the eastern GAB and Bonney Upwelling regions are underpinned by a classical food web during the productive upwelling season. The high variability likely reflects moderate bursts of productivity during this time, with a microbial food web persisting in the background (van Ruth et al., 2018). In contrast, we found that lower nitrogen values of PRWs (i.e., the depleted portion of the synchronous cycles) did not overlap with any available prey data. These slightly lower, less-varied nitrogen values correspond to the presence of a microbial food web during winter. During these times, when larger zooplankton is patchy and/or not available, it may be possible PRWs are consuming other small plankton available to them, a potential food item suggested by Kemper (2009). While this positive relationship between PRW nitrogen values and SST (to indicate the food web present) is weak, it provides support for the overlap seen between the nitrogen values of PRWs and Australian krill and copepod species. Typically, periods of upwelling in summer are associated with cooler temperatures (van Ruth et al., 2010a; van Ruth et al., 2018), however, here, summer corresponds to slightly warmer SST. Generally, this region has a small SST difference between seasons, however, by taking the monthly SST average, to match with PRW isotope values, upwelling events may be underestimated.
Alternatively, it is possible the low (and less variable) nitrogen stable isotope values observed in PRW baleen, that fall below the range of Australian krill and copepod species, reflects periods of fasting during winter when resources are sparce, however, we believe this explanation is unlikely. As found in fin and bowhead whales, fasting may drive a decrease in nitrogen without subsequent enrichment triggered by starvation (Aguilar et al., 2014; Matthews & Ferguson, 2015). If PRWs were to experience metabolic changes due to fasting, it could be expected that changes in nitrogen would not match those in carbon. For example, when an animal switches from diet-derived food sources to stored body reserves, while nitrogen generally changes due to fractionation associated with fasting (Cherel et al., 2005a; Lübcker et al., 2020), carbon does not. This is due to the carbon stable isotope values of the prey’s geographical location and the whales’ stored energy remaining the same (Eisenmann et al., 2016). In this study, we observed synchronous cycles in PRW nitrogen and carbon stable isotope values, suggesting that metabolic changes associated with fasting is unlikely. Rather, a decrease in nitrogen for PRWs more likely reflects a change in seasonal prey (i.e., feeding on smaller plankton) or a shift in movement to another feeding area.
Lastly, it is possible that the synchronicity in nitrogen and carbon stable isotope oscillations reflect movements of PRWs between coastal waters off southern Australia (higher nitrogen and carbon values) and the Subtropical Convergence (lower nitrogen and carbon values). Whilst the stranding and sighting records of PRWs suggest they can occur in coastal waters year-round, sightings at the Subtropical Convergence (Kemper et al., 2013) suggest some may move between these two regions. Once summer upwelling around the eastern GAB and Bonney Coast weakens, and waters become nutrient poor, some PRWs may move south to exploit resources at the Subtropical Convergence during austral winter. Oceanic fronts at the Subtropical Convergence have been linked with the foraging behaviour for many species of marine mammals (Beauplet et al., 2004; Baylis et al., 2008) and seabirds (Charrassin & Bost, 2001; Spear et al., 2001), and while the Subtropical Front is relatively weak to the south of Australia, the region is characterised by high levels of productivity (James et al., 2002). Baylis et al. (2008) found a seasonal shift in foraging behaviour for New Zealand fur seals, where females moved between the Bonney Upwelling in autumn to regions associated with the Subtropical Front during winter in response to the decline in coastal productivity. They further suggested the strength and duration of upwelling and productivity in coastal areas, associated with the Bonney Upwelling during summer and autumn, may influence the time females can sustain themselves in this habitat before southward movements to alternate foraging grounds (Baylis et al., 2008). This has also been observed for other otariid seal species (Goldsworthy, 1995; McCafferty et al., 1998; Thompson et al., 2003; Beauplet et al., 2004; Goldsworthy, 2006), where females increased foraging-trip duration and/or distance towards the Subtropical Front during pup-rearing period, likely reflecting increased demands and/or changes in prey availability. While we found no influence of sex on the correlation between nitrogen stable isotopes and SST, it appears that females may primarily drive the weak positive relationship between nitrogen stable isotope values and SST, whereas males exhibit a more negative/variable trend. This may also contribute to the weak R2 values associated with the correlation. The lack of statistical significance for the influence of sex may be due to the limited amount of data (9 individuals); thus, we are unable to draw conclusions. However, we speculate there is possible disparities in feeding strategies in mid-latitude regions, or differences in movement patterns between coastal waters off southern Australia and the Subtropical Convergence during winter.
Alternatively, since wind-driven upwelling brings cool, nutrient-rich waters in from other regions (e.g., the subantarctic (Lewis, 1981; Richardson et al., 2020)), the lower nitrogen and carbon values that do not overlap with potential prey items and represent the depleted section on baleen oscillations may reflect baseline stable isotope values further south. However, if this were the case, we would expect to observe lower stable isotope values during summer, due to the influx of higher-latitude waters (St John Glew et al., 2021), which was not the case. Further research is required to elucidate possible intersexual differences and understand potential drivers behind PRW movements between coastal waters off southern Australia and the Subtropical Convergence.
There was little statistical significance between PRW nitrogen stable isotope values and remote sensed chlorophyll-a concentrations. This may be due to the restrictions of remote sensed data, which rely on surface measurements of primary productivity for the eastern GAB region (van Ruth et al., 2010a; van Ruth et al., 2018). In the eastern GAB during summer upwelling periods, previous studies have found a relationship between the upwelled water mass and subsurface peaks in chlorophyll-a concentrations (Kämpf et al., 2004; van Ruth et al., 2010b; van Dongen-Vogels et al., 2011; van Dongen-Vogels et al., 2012; Kloser et al., 2017; Patten et al., 2018). Thus, remote sensed data that relies on surface measurements likely underestimate phytoplankton biomass by not accounting for productivity in sub-surface enriched waters (van Ruth et al., 2010a; van Ruth et al., 2018). Secondly, there was a shorter temporal coverage of chlorophyll a, which was only available from 2003 onwards, thus reducing our sample size for these models. Additional data, and a greater understanding of PRW movements will assist in interpreting the potential relationship between PRW nitrogen values and chlorophyll-a when lagged 2 months.
Baleen growth rate
Based on the assumption that the distance between two consecutive nitrogen minimums represents an annual cycle, the average growth rate of PRW baleen was estimated to be 18.5 ± 4.8 cm/year. This was within the range of other species of baleen whales (see Supplementary Table 2). We also found PRWs exhibited a high degree of intraspecific variability in baleen growth rates (11 - 28 cm/year) alike other baleen whale species (Supplementary Table 2). However, whilst there is clear variability in the length of each cycle (i.e., growth rate), it is unlikely baleen growth can almost triple in magnitude between years of adult PRWs, thus changes more likely reflects interannual variability in feeding behaviour that either elongates or reduces the yearly cycle. The assumption that baleen growth is linear may impact the attribution of time to baleen segments, as doing so relies on the baleen growing at a constant rate. However, using the species average baleen growth rate can assist to minimise the impact of such variability on temporal conclusions, although more research is necessary to assess the growth patterns of baleen.
Other factors besides diet and metabolism may impact the stable isotope ratios in PRW baleen. These include changes in reproduction (e.g., breeding/lactation, etc) as observed in other baleen whales (Clark et al., 2016; Trueman et al., 2019; Uchida et al., 2021), and changes in the isotopic baseline (McMahon et al., 2015). However, data limitations prevented us from analysing the impact of both these factors here. Additionally, as this study spans ~ 40 years and likely across periods of ecosystem-level changes, stable isotope ratios may be impacted by large-scale ecosystem shifts as observed by Mansouri et al. (2021). Given that PRWs rely on mid-latitude regions and Australian krill and copepod species, future work could investigate large-scale environmental shifts and how this impacts the diet and habitat use of PRWs, as well as their ecosystem sentinel potential for these regions.
Conclusion
We found that PRWs remained in mid-latitude regions year-round and refrained from long-distance migrations to Antarctic waters. Rather, they likely move between productive upwelled regions off southern Australia and the Subtropical Convergence. Their diet appears to be Australian krill and copepod species, however, more bulk stable isotope values of prey from waters off southern Australia, the Subtropical Convergence, and surrounding areas is necessary to determine species-specific prey choices and movements within mid-latitude regions. Lastly, we show that variation in PRW nitrogen stable isotope patterns is partly associated with oceanographic signals that drive food web dynamics. The isotope-derived data in this study is the first to highlight long-term feeding and movement patterns of PRWs, providing a valuable contribution in understanding more about this enigmatic species.
Data availability statement
The raw data supporting the conclusions of this article will be made available by the authors, without undue reservation.
Author contributions
AD and TR conceived initial ideas and designed the project, which was then consulted with CK and PR and further developed. AD conducted lab work and stable isotope analysis. AD completed statistical analysis with support from GT, PV, TR, and MM. All authors assisted in the interpretation of results and significance. AD wrote the first complete draft and TR, MM, PR, GT, and CK reviewed and contributed to editing therein. CK was responsible for baleen plate collection and their associated data. All authors contributed to the article and approved the submitted version.
Acknowledgments
We thank David Stemmer, the Collection Manager from the South Australian Museum for loaning baleen for stable isotope analysis and preparing the baleen and specimens for further study. We thank the many volunteers and State agency personnel who helped to collect the baleen. We are grateful to the mammal lab at UNSW for providing comments and feedback on draft manuscripts. We also thank Leanne and Lewis at the Bioanalytical Mass Spectrometry Facility at UNSW for their assistance in processing samples for stable isotope analysis. SST and chlorophyll a data was sourced from Australia’s Integrated Marine Observing System (IMOS) – IMOS is enabled by the National Collaborative Research Infrastructure Strategy (NCRIS). Stable isotope analysis was funded by the Winifred Scott Foundation.
Conflict of interest
The authors declare that the research was conducted in the absence of any commercial or financial relationships that could be construed as a potential conflict of interest.
Publisher’s note
All claims expressed in this article are solely those of the authors and do not necessarily represent those of their affiliated organizations, or those of the publisher, the editors and the reviewers. Any product that may be evaluated in this article, or claim that may be made by its manufacturer, is not guaranteed or endorsed by the publisher.
Supplementary material
The Supplementary Material for this article can be found online at: https://www.frontiersin.org/articles/10.3389/fmars.2023.1190623/full#supplementary-material
References
Acevedo J., Haro D., Dalla Rosa L., Aguayo-Lobo A., Hucke-Gaete R., Secchi E., et al. (2013). Evidence of spatial structuring of eastern south pacific humpback whale feeding grounds. Endangered. Species. Res. 22 (1), 33–38. doi: 10.3354/esr00536
Aguilar A., Gimenez J., Gomez-Campos E., Cardona L., Borrell A. (2014). delta15N value does not reflect fasting in mysticetes. PloS One 9 (3), e92288. doi: 10.1371/journal.pone.0092288
Azam F., Fenchel T., Field J. G., Gray J. S., Meyer-Reil L.-A., Thingstad F. (1983). The ecological role of water-column microbes in the sea. Mar. Ecol. Prog. Ser. 10, 257–263. doi: 10.3354/meps010257
Baylis A., Page B., Goldsworthy S. (2008). Effect of seasonal changes in upwelling activity on the foraging locations of a wide-ranging central-place forager, the new Zealand fur seal. Can. J. Zool. 86 (8), 774–789. doi: 10.1139/Z08-055
Beauplet G., Dubroca L., Guinet C., Cherel Y., Dabin W., Gagne C., et al. (2004). Foraging ecology of subantarctic fur seals Arctocephalus tropicalis breeding on Amsterdam island: seasonal changes in relation to maternal characteristics and pup growth. Mar. Ecol. Prog. Ser. 273, 211–225. doi: 10.3354/meps273211
Bentaleb I., Martin C., Vrac M., Mate B., Mayzaud P., Siret D., et al. (2011). Foraging ecology of Mediterranean fin whales in a changing environment elucidated by satellite tracking and baleen plate stable isotopes. Mar. Ecol. Prog. Ser. 438, 285–302. doi: 10.3354/meps09269
Best P. B., Schell D. M. (1996). Stable isotopes in southern right whale (Eubalaena australis) baleen as indicators of seasonal movements, feeding and growth. Mar. Biol. 124 (4), 483–494. doi: 10.1007/BF00351030
Borrell A., Abad-Oliva N., Gómez-Campos E., Giménez J., Aguilar A. (2012). Discrimination of stable isotopes in fin whale tissues and application to diet assessment in cetaceans. Rapid Commun. Mass. Spectromet. 26 (14), 1596–1602. doi: 10.1002/rcm.6267
Borrell A., Gómez-Campos E., Aguilar A. (2016). Influence of reproduction on stable-isotope ratios: nitrogen and carbon isotope discrimination between mothers, fetuses, and milk in the fin whale, a capital breeder. Physiol. Biochem. Zool. 89 (1), 41–50. doi: 10.1086/684632
Budylenko G., Panfilov B., Pakhomova A., Sazhinov E. (1973). New data on pygmy right whales Neobalaena marginata (Gray 1848). Trudy. Atlanticheskii. Nauchno-Issledovatel’skii. Institut. Rybnogo. Khozyaistva. I. Okeanografii. 51, 122–132.
Busquets-Vass G., Newsome S., Calambokidis J., Serra-Valente G., Jacobsen J., Aguíñiga-García S., et al. (2017). Estimating blue whale skin isotopic incorporation rates and baleen growth rates: implications for assessing diet and movement patterns in mysticetes. PloS One 12 (5). doi: 10.1371/journal.pone.0177880
Chapman B. B., Brönmark C., Nilsson J. Å., Hansson L. A. (2011). The ecology and evolution of partial migration. Oikos 120 (12), 1764–1775. doi: 10.1111/j.1600-0706.2011.20131.x
Charrassin J.-B., Bost C.-A. (2001). Utilisation of the oceanic habitat by king penguins over the annual cycle. Mar. Ecol. Prog. Ser. 221, 285–298. doi: 10.3354/meps221285
Cherel Y., Hobson K. A., Bailleul F., Groscolas R. (2005a). Nutrition, physiology, and stable isotopes: new information from fasting and molting penguins. Ecology 86 (11), 2881–2888. doi: 10.1890/05-0562
Cherel Y., Hobson K. A., Weimerskirch H. (2005b). Using stable isotopes to study resource acquisition and allocation in procellariiform seabirds. Oecologia 145 (4), 533–540. doi: 10.1007/s00442-005-0156-7
Clapham P. (2001). Why do baleen whales migrate? a response to corkeron and connor. Mar. Mammal. Sci. 17 (2), 432–436. doi: 10.1111/j.1748-7692.2001.tb01289.x
Clark C. T., Fleming A. H., Calambokidis J., Kellar N. M., Allen C. D., Catelani K. N., et al (2016). Heavy with child? Pregnancy status and stable isotope ratios as determined from biopsies of humpback whales. Conserv. Physiol. 4 (1). doi: 10.1093/conphys/cow050
Corkeron P. J., Connor R. C. (1999). Why do baleen whales migrate? 1. Mar. Mammal. Sci. 15 (4), 1228–1245. doi: 10.1111/j.1748-7692.1999.tb00887.x
Dedden A. V., Rogers T. L. (2022). Stable isotope oscillations in whale baleen are linked to climate cycles, which may reflect changes in feeding for humpback and southern right whales in the southern hemisphere [Original research]. Front. Mar. Sci. 9. doi: 10.3389/fmars.2022.832075
DeNiro M. J., Epstein S. (1981). Influence of diet on the distribution of nitrogen isotopes in animals. Geochim. Cosmochim. Acta 45 (3), 341–351. doi: 10.1016/0016-7037(81)90244-1
Double M. C., Andrews-Goff V., Jenner K. C. S., Jenner M.-N., Laverick S. M., Branch T. A., et al. (2014). Migratory movements of pygmy blue whales (Balaenoptera musculus brevicauda) between Australia and Indonesia as revealed by satellite telemetry. PloS One 9 (4). doi: 10.1371/journal.pone.0093578
Eisenmann P., Fry B., Holyoake C., Coughran D., Nicol S., Bengtson Nash S. (2016). Isotopic evidence of a wide spectrum of feeding strategies in southern hemisphere humpback whale baleen records. PloS One 11 (5). doi: 10.1371/journal.pone.0156698
Findlay K., Best P. (1995). Summer incidence of humpback whales on the west coast of south Africa. South Afr. J. Mar. Sci. 15 (1), 279–282. doi: 10.2989/02577619509504851
Fry B. (1988). Food web structure on georges bank from stable c, n, and s isotopic compositions. Limnol. Oceanogr. 33 (5), 1182–1190. doi: 10.4319/lo.1988.33.5.1182
Gales N., Double M. C., Robinson S., Jenner C., Jenner M., King E., et al. (2009). Satellite tracking of southbound East Australian humpback whales (Megaptera novaeangliae): challenging the feast or famine model for migrating whales. Int. Whal. Comm.: SC61/SH17.
Gill P. C. (2002). A blue whale (Balaenoptera musculus) feeding ground in a southern Australian coastal upwelling zone. J. Cetacean. Res. Manage. 4 (2), 179–184.
Gill P. C., Morrice M. G., Page B., Pirzl R., Levings A. H., Coyne M. (2011). Blue whale habitat selection and within-season distribution in a regional upwelling system off southern Australia. Mar. Ecol. Prog. Ser. 421, 243–263. doi: 10.3354/meps08914
Goldsworthy S. D. (1995). Differential expenditure of maternal resources in Antarctic fur seals, Arctocephalus gazella, at heard island, southern Indian ocean. Behav. Ecol. 6 (2), 218–228. doi: 10.1093/beheco/6.2.218
Goldsworthy S. D. (2006). Maternal strategies of the new Zealand fur seal: evidence for interannual variability in provisioning and pup growth strategies. Aust. J. Zool. 54 (1), 31–44. doi: 10.1071/ZO05041
Goldsworthy S., Mackay A., Bilgmann K., Möller L., Parra G., Gill P., et al. (2017). Status, distribution and abundance of iconic species and apex predators in the great Australian bight. Final. Rep. GABRP. Project. 4, 227.
Goldsworthy S. D., Page B., Rogers P. J., Bulman C., Wiebkin A., McLeay L. J., et al. (2013). Trophodynamics of the eastern great Australian bight ecosystem: ecological change associated with the growth of australia's largest fishery. Ecol. Model. 255, 38–57. doi: 10.1016/j.ecolmodel.2013.01.006
Harris B. P., Young J. W., Revill A. T., Taylor M. D. (2014). Understanding diel-vertical feeding migrations in zooplankton using bulk carbon and nitrogen stable isotopes. J. Plankton. Res. 36 (4), 1159–1163. doi: 10.1093/plankt/fbu026
Hazen E. L., Abrahms B., Brodie S., Carroll G., Jacox M. G., Savoca M. S., et al. (2019). Marine top predators as climate and ecosystem sentinels. Front. Ecol. Environ. 17 (10), 565–574. doi: 10.1002/fee.2125
Hein A. M., Hou C., Gillooly J. F. (2012). Energetic and biomechanical constraints on animal migration distance. Ecol. Lett. 15 (2), 104–110. doi: 10.1111/j.1461-0248.2011.01714.x
Henschke N., Everett J. D., Suthers I. M., Smith J. A., Hunt B. P., Doblin M. A., et al. (2015). Zooplankton trophic niches respond to different water types of the western Tasman Sea: a stable isotope analysis. Deep. Sea. Res. Part I.: Oceanogr. Res. Papers. 104, 1–8. doi: 10.1016/j.dsr.2015.06.010
Herzfeld M. (1997). The annual cycle of sea surface temperature in the great Australian bight. Prog. Oceanogr. 39 (1), 1–27. doi: 10.1016/S0079-6611(97)00010-4
Hobson K. A. (1999). Tracing origins and migration of wildlife using stable isotopes: a review. Oecologia 120 (3), 314–326. doi: 10.1007/s004420050865
Hobson K. A., Schell D. M. (1998). Stable carbon and nitrogen isotope patterns in baleen from eastern Arctic bowhead whales (Balaena mysticetus). Can. J. Fisheries. Aquat. Sci. 55 (12), 2601–2607. doi: 10.1139/f98-142
Hu C., Lee Z., Franz B. (2012). Chlorophyll aalgorithms for oligotrophic oceans: a novel approach based on three-band reflectance difference. J. Geophys. Res.: Oceans. 117 (C1). doi: 10.1029/2011JC007395
Izadi S., Aguilar de Soto N., Constantine R., Johnson M. (2022). Feeding tactics of resident bryde's whales in new Zealand. Mar. Mammal. Sci. 38, 1104–1117. doi: 10.1111/mms.12918
James C., Tomczak M., Helmond I., Pender L. (2002). Summer and winter surveys of the subtropical front of the southeastern Indian ocean 1997–1998. J. Mar. Syst. 37 (1-3), 129–149. doi: 10.1016/S0924-7963(02)00199-9
Kämpf J., Doubell M., Griffin D., Matthews R. L., Ward T. M. (2004). Evidence of a large seasonal coastal upwelling system along the southern shelf of Australia. Geophys. Res. Lett. 31 (9). doi: 10.1029/2003GL019221
Kemper C. M. (2002). Distribution of the pygmy right whale, Caperea marginata, in the Australasian region. Mar. Mammal. Sci. 18 (1), 99–111. doi: 10.1111/j.1748-7692.2002.tb01021.x
Kemper C. M. (2009). Pygmy right whale: Caperea marginata. Encyclopedia Mar. Mamm. 2009, 939–941. doi: 10.1016/B978-0-12-373553-9.00214-5
Kemper C. (2014). “Family neobalaenidae (pygmy right whale),” in Handbook of the mammals of the world (Barcelona: Lynx Edicions), 214–220.
Kemper C. M., Leppard P. (1999). Estimating body length of pygmy right whales (Caperea marginata) from measurements of the skeleton and baleen. Mar. Mammal. Sci. 15 (3), 683–700. doi: 10.1111/j.1748-7692.1999.tb00836.x
Kemper C., Middleton J., van Ruth P. (2013). Association between pygmy right whales (Caperea marginata) and areas of high marine productivity off Australia and new Zealand. New Z. J. Zool. 40 (2), 102–128. doi: 10.1080/03014223.2012.707662
Kloser R. J., van Ruth P. D., Doubell M., Downie R., Flynn A., Gershwin L., et al. (2017). p. 305. Report No.: No. 22. Characterisation of spatial variability of offshore/slope plankton and micronekton communities. Project 2.2, Pelagic ecosystem and environmental drivers in the Great Australian Bight. GABRP Research Report.
Lee S. H., Schell D. M., McDonald T. L., Richardson W. J. (2005). Regional and seasonal feeding by bowhead whales Balaena mysticetus as indicated by stable isotope ratios. Mar. Ecol. Prog. Ser. 285, 271–287. doi: 10.3354/meps285271
Lewis R. (1981). Seasonal upwelling along the south-eastern coastline of south Australia. Mar. Freshw. Res. 32 (6), 843–854. doi: 10.1071/MF9810843
Logan J. M., Jardine T. D., Miller T. J., Bunn S. E., Cunjak R. A., Lutcavage M. E. (2008). Lipid corrections in carbon and nitrogen stable isotope analyses: comparison of chemical extraction and modelling methods. J. Anim. Ecol. 77, 838–846. doi: 10.1111/J.1365-2656.2008.01394.X
Lübcker N., Whiteman J. P., Millar R. P., Nico de Bruyn P. J., Newsome. S. D. (2020). Fasting affects amino acid nitrogen isotope values: a new tool for identifying nitrogen balance of free-ranging mammals. Oecologia 193, 53–65. doi: 10.1007/s00442-020-04645-5
Lysiak N. S., Trumble S. J., Knowlton A. R., Moore M. J. (2018). Characterizing the duration and severity of fishing gear entanglement on a north Atlantic right whale (Eubalaena glacialis) using stable isotopes, steroid and thyroid hormones in baleen. Front. Mar. Sci. 5, 168. doi: 10.3389/fmars.2018.00168
Möller L. M., Attard C. R., Bilgmann K., Andrews-Goff V., Jonsen I., Paton D., et al. (2020). Movements and behaviour of blue whales satellite tagged in an Australian upwelling system. Sci. Rep. 10 (1), 1–19. doi: 10.1038/s41598-020-78143-2
Mansouri F., Winfield Z. C., Crain D. D., Morris B., Charapata P., Sabin R., et al. (2021). Evidence of multi-decadal behavior and ecosystem-level changes revealed by reconstructed lifetime stable isotope profiles of baleen whale earplugs. Sci. Total. Environ. 757, 143985. doi: 10.1016/j.scitotenv.2020.143985
Matthews C. J., Ferguson S. H. (2015). Seasonal foraging behaviour of Eastern Canada-West Greenland bowhead whales: an assessment of isotopic cycles along baleen. Mar. Ecol. Prog. Ser. 522, 269–286. doi: 10.3354/meps11145
McCafferty D. J., Boyd I. L., Walker T. R., Taylor R. I. (1998). Foraging responses of Antarctic fur seals to changes in the marine environment. Mar. Ecol. Prog. Ser. 166, 285–299. doi: 10.3354/meps166285
McMahon K. W., McCarthy M. D., Sherwood O. A., Larsen T., Guilderson T. P. (2015). Millennial-scale plankton regime shifts in the subtropical north pacific ocean. Science 350 (6267), 1530–1533. doi: 10.1126/science.aaa9942
Minagawa M., Wada E. (1984). Stepwise enrichment of 15N along food chains: further evidence and the relation between δ15N and animal age. Geochim. Cosmochim. Acta 48 (5), 1135–1140. doi: 10.1016/0016-7037(84)90204-7
Mitani Y., Bando T., Takai N., Sakamoto W. (2006). Patterns of stable carbon and nitrogen isotopes in the baleen of common minke whale Balaenoptera acutorostrata from the western north pacific. Fisheries. Sci. 72 (1), 69–76. doi: 10.1111/j.1444-2906.2006.01118.x
Norris K. (1967). Some observations on the migration and orientation of marine mammals. Anim. Orientat. Migr. 101, 125.
Olsson I. C., Greenberg L. A., Bergman E., Wysujack K. (2006). Environmentally induced migration: the importance of food. Ecol. Lett. 9 (6), 645–651. doi: 10.1111/j.1461-0248.2006.00909.x
Patten N. L., van Ruth P. D., Rodriguez A. R. (2018). Spatial variability in picophytoplankton, bacteria and viruses in waters of the great Australian bight (southern Australia). Deep. Sea. Res. Part II.: Topical. Stud. Oceanogr. 157, 46–57. doi: 10.1016/j.dsr2.2018.04.009
Pavey C. (1992). The occurrence of the pygmy right whale Caperea marginata (Cetacea: neobalaenidae), along the Australian coast. Aust. Mammal. 15 (1), 1–6. doi: 10.1071/AM92001
Peterson B. J., Fry B. (1987). Stable isotopes in ecosystem studies. Annu. Rev. Ecol. Syst. 18, 293–320. doi: 10.1146/annurev.es.18.110187.001453
Pinheiro J., Bates D., DebRoy S., Sarkar D., Team R. C. (2007). Linear and nonlinear mixed effects models. R. Package Version. 3 (57), 1–89.
Pivorunas A. (1979). The feeding mechanisms of baleen whales: since Robert sibbald first described baleen whales in 1692, we have come to distinguish three types–the right whales, grazers on copepods; the finner whales, engulfers of krill and fish; and the gray whale, a forager of the sea bottom. Am. Sci. 67 (4), 432–440.
R Core Team (2021). R: a language and environment for statistical computing (Vienna, Austria: R Foundation for Statistical Computing). Available at: https://www.R-project.org/.
Reiss L., Häussermann V., Mayr C. (2020). Stable isotope records of sei whale baleens from Chilean Patagonia as archives for feeding and migration behavior. Ecol. Evol. 10 (2), 808–818. doi: 10.1002/ece3.5939
Richardson L., Middleton J., James N., Kyser T. K., Opdyke B. (2020). Upwelling characteristics and nutrient enrichment of the kangaroo island upwelling region, south Australia. Continental. Shelf. Res. 200, 104111. doi: 10.1016/j.csr.2020.104111
Rodríguez-Malagón M. A., Speakman C. N., Sutton G. J., Angel L. P., Arnould J. P. (2021). Temporal and spatial isotopic variability of marine prey species in south-eastern Australia: potential implications for predator diet studies. PloS One 16 (11). doi: 10.1371/journal.pone.0259961
Rogers P. J., Ward T. M., Van Ruth P. D., Williams A., Bruce B. D., Connell S. D., et al. (2013). Physical processes, biodiversity and ecology of the great Australian bight region: a literature review (CSIRO).
Schahinger R. B. (1987). Structure of coastal upwelling events observed off the south-east coast of south Australia during February 1983–April 1984. Mar. Freshw. Res. 38 (4), 439–459. doi: 10.1071/MF9870439
Schell D. M. (2000). Declining carrying capacity in the Bering Sea: isotopic evidence from whale baleen. Limnol. Oceanogr. 45 (2), 459–462. doi: 10.4319/lo.2000.45.2.0459
Schell D., Saupe S., Haubenstock N. (1989a). Bowhead whale (Balaena mysticetus) growth and feeding as estimated by δ13C techniques. Mar. Biol. 103 (4), 433–443. doi: 10.1007/BF00399575
Schell D., Saupe S., Haubenstock N. (1989b). “Natural isotope abundances in bowhead whale (Balaena mysticetus) baleen: markers of aging and habitat usage,” in Stable isotopes in ecological research (Springer), 260–269. doi: 10.1007/978-1-4612-3498-2_15
Sekiguchi K., Best P. B., Kaczmaruk B. Z. (1992). New information on the feeding habits and baleen morphology of the pygmy right whale Caperea marginata. Mar. Mammal. Sci. 8 (3), 288–293. doi: 10.1111/j.1748-7692.1992.tb00411.x
Sommer U., Stibor H., Katechakis A., Sommer F., Hansen T. (2002). “Pelagic food web configurations at different levels of nutrient richness and their implications for the ratio fish production: primary production,” in Sustainable increase of marine harvesting: fundamental mechanisms and new concepts (Springer), 11–20.
Spear L. B., Ballance L. T., Ainley D. G. (2001). Response of seabirds to thermal boundaries in the tropical pacific: the thermocline versus the equatorial front. Mar. Ecol. Prog. Ser. 219, 275–289. doi: 10.3354/meps219275
Stamation K. A., Croft D. B., Shaughnessy P. D., Waples K. A. (2007). Observations of humpback whales (Megaptera novaeangliae) feeding during their southward migration along the coast of southeastern new south Wales, Australia: identification of a possible supplemental feeding ground. Aquat. Mammals. 33 (2), 165. doi: 10.1578/AM.33.2.2007.165
St John Glew K., Espinasse B., Hunt B. P., Pakhomov E. A., Bury S. J., Pinkerton M., et al. (2021). Isoscape models of the southern ocean: predicting spatial and temporal variability in carbon and nitrogen isotope compositions of particulate organic matter. Global Biogeochem. Cycles. 35 (9), e2020GB006901. doi: 10.1029/2020GB006901
Stockner J. G. (1988). Phototrophic picoplankton: an overview from marine and freshwater ecosystems. Limnol. Oceanogr. 33 (4part2), 765–775. doi: 10.4319/lo.1988.33.4part2.0765
Sumich J. L. (2021). Why Baja? a bioenergetic model for comparing metabolic rates and thermoregulatory costs of gray whale calves (Eschrichtius robustus). Mar. Mammal. Sci. 37 (3), 870–887. doi: 10.1111/mms.12778
Thompson D., Moss S. E., Lovell P. (2003). Foraging behaviour of south American fur seals Arctocephalus australis: extracting fine scale foraging behaviour from satellite tracks. Mar. Ecol. Prog. Ser. 260, 285–296. doi: 10.3354/meps260285
Trueman C. N., Jackson A. L., Chadwick K. S., Coombs E. J., Feyrer L. J., Magozzi S., et al. (2019). Combining simulation modeling and stable isotope analyses to reconstruct the last known movements of one of nature’s giants. PeerJ 7, e7912. doi: 10.7717/peerj.7912
Uchida M., Suzuki I., Ito K., Ishizuka M., Ikenaka Y., Nakayama S. M., et al (2021). Estimation of the feeding record of pregnant Antarctic minke whales (Balaenoptera bonaerensis) using carbon and nitrogen stable isotope analysis of baleen plates. Polar Biol. 44 (1), 621–629. doi: 10.1007/s00300-021-02816-5
van Dongen-Vogels V., Seymour J. R., Middleton J. F., Mitchell J. G., Seuront L. (2011). Influence of local physical events on picophytoplankton spatial and temporal dynamics in south Australian continental shelf waters. J. Plankton. Res. 33 (12), 1825–1841. doi: 10.1093/plankt/fbr077
van Dongen-Vogels V., Seymour J. R., Middleton J. F., Mitchell J. G., Seuront L. (2012). Shifts in picophytoplankton community structure influenced by changing upwelling conditions. Estuarine. Coast. Shelf. Sci. 109, 81–90. doi: 10.1016/j.ecss.2012.05.026
van Ruth P. D., Ganf G. G., Ward T. M. (2010a). Hot-spots of primary productivity: an alternative interpretation to conventional upwelling models. Estuarine. Coast. Shelf. Sci. 90 (3), 142–158. doi: 10.1016/j.ecss.2010.08.009
van Ruth P. D., Ganf G. G., Ward T. M. (2010b). The influence of mixing on primary productivity: a unique application of classical critical depth theory. Prog. Oceanogr. 85 (3-4), 224–235. doi: 10.1016/j.pocean.2010.03.002
van Ruth P. D., Patten N. L., Doubell M. J., Chapman P., Rodriguez A. R., Middleton J. F. (2018). Seasonal-and event-scale variations in upwelling, enrichment and primary productivity in the eastern great Australian bight. Deep. Sea. Res. Part II.: Topical. Stud. Oceanogr. 157, 36–45. doi: 10.1016/j.dsr2.2018.09.008
Ward T. M., Mcleay L. J., Dimmlich W. F., Rogers P. J., McClatchie S., Matthews R., et al. (2006). Pelagic ecology of a northern boundary current system: effects of upwelling on the production and distribution of sardine (Sardinops sagax), anchovy (Engraulis australis) and southern bluefin tuna (Thunnus maccoyii) in the great Australian bight. Fisheries. Oceanogr. 15 (3), 191–207. doi: 10.1111/j.1365-2419.2006.00353.x
West J. B., Bowen G. J., Cerling T. E., Ehleringer J. R. (2006). Stable isotopes as one of nature's ecological recorders. Trends Ecol. Evol. 21 (7), 408–414. doi: 10.1016/j.tree.2006.04.002
Williamson G. R. (1973). Counting and measuring baleen and ventral grooves of whales. Sci. Rep. Whales. Res. Inst. 25, 279–292.
Keywords: δ15N, δ13C, baleen, Bonney upwelling, Great Australian Bight, feeding, migration
Citation: Dedden AV, Kemper CM, Truong G, McCurry MR, van Ruth PD and Rogers TL (2023) Stable isotopes infer the diet and habitat of the enigmatic pygmy right whale (Caperea marginata) off southern Australia. Front. Mar. Sci. 10:1190623. doi: 10.3389/fmars.2023.1190623
Received: 21 March 2023; Accepted: 16 June 2023;
Published: 31 July 2023.
Edited by:
David Yurkowski, Fisheries and Oceans Canada (DFO), CanadaReviewed by:
Elizabeth McHuron, University of Washington, United StatesStephen J. Trumble, Baylor University, United States
Copyright © 2023 Dedden, Kemper, Truong, McCurry, van Ruth and Rogers. This is an open-access article distributed under the terms of the Creative Commons Attribution License (CC BY). The use, distribution or reproduction in other forums is permitted, provided the original author(s) and the copyright owner(s) are credited and that the original publication in this journal is cited, in accordance with accepted academic practice. No use, distribution or reproduction is permitted which does not comply with these terms.
*Correspondence: Adelaide V. Dedden, YS5kZWRkZW5AdW5zdy5lZHUuYXU=
†ORCID: Adelaide V. Dedden, orcid.org/0000-0002-7471-7376
Catherine M. Kemper, orcid.org/0000-0002-4452-8259
Gary Truong, orcid.org/0000-0001-5308-8745
Matthew R. McCurry, orcid.org/0000-0002-2452-1404
Paul D. van Ruth, orcid.org/0000-0002-8436-579X
Tracey L. Rogers, orcid.org/0000-0002-7141-4177