 Nayeon Park
 Hyuntae Choi
 Kyung-Hoon Shin
 Wonchoel Lee
- 1Department of Life Science, College of Natural Sciences, Hanyang University, Seoul, Republic of Korea
- 2Research Institute for Natural Sciences, Hanyang University, Seoul, Republic of Korea
- 3Department of Marine Science and Convergent Technology, Hanyang University, Ansan, Republic of Korea
Despite their abundance in marine ecosystems, studies on siphonophores are limited. In this study, 26 species of siphonophores in the Northwest Pacific Ocean were identified during multiple cruises of the R/V ISABU from 2018–2020, and various factors that may affect the occurrence of siphonophores, including water temperature, salinity, zooplankton biomass, and trophic niche were investigated. Statistical analysis revealed that the distribution of siphonophores and their biomass could be divided into two water mass groups, affected by the Kuroshio and Oyashio Currents. The species with high contributions to distinguishing the water mass groups (including Chelophyes contorta, Dimophyes arctica, Bassia bassensis, and Eudoxoides spiralis—mainly belonging to the Diphyidae) showed species-specific correlations with water temperature and salinity. This suggests that diphyids can be used as indicator species for currents and hydrological factors that influence water mass. The biomass of siphonophores exhibited a trend opposite to that of non-gelatinous zooplankton and showed no association with other gelatinous zooplankton. These results can be interpreted from an ecological niche perspective. Through nitrogen and carbon stable isotope analyses, the dietary sources of siphonophores could potentially overlap with those of chaetognaths or non-gelatinous zooplankton. Because the trophic position of siphonophores (2.4–3.2) also falls in the range of those of chaetognaths (2.8–3.4) and non-gelatinous zooplankton including copepods, euphausiids, and amphipods (2.4–3.5), diet competition with carnivorous mesozooplankton could be predicted. Considering that the diversity and biomass of most siphonophores are strongly positively correlated with water temperature and salinity, expansion of the Kuroshio Current is expected to lead to an increase in siphonophores in the Northwest Pacific in the future. The findings of this study are anticipated to provide novel insights into climate change prediction and response and enhance our understanding of siphonophore communities.
1 Introduction
Most studies on plankton ecology worldwide are biased towards copepods and have used them as indicators (Richard and Jamet, 2001; Hwang and Wong, 2005; Hwang et al., 2006; Campos et al., 2017; Seo et al., 2018; Choi et al., 2020; de Oliveira Dias et al., 2023) although it is difficult to explain the entire system using only a few taxa because of the presence of diverse organisms. One major limitation of this approach is the evaluation of gelatinous zooplankton. Gelatinous zooplankton is a generic term for transparent planktonic organisms with gelatinous tissue containing a high percentage of water, including medusae, siphonophores, ctenophores, chaetognaths, tunicates, and pteropods (Hammer, 1975; Madin and Harbison, 2001; Raskoff et al., 2003). Gelatinous zooplankton can be a food source connecting primary producers and high trophic level consumers, and they play a vital role in marine ecosystems (Hays et al., 2018). A previous study showed that gelatinous zooplankton can contribute up to approximately 25% of the total pelagic biomass (Robison, 2004). Purcell (2005) and Holst (2012) reported a correlation between the community structure of jellyfish and climate change, and suggested that it is essential to clarify this relationship. However, despite their important role in marine ecosystems, it is difficult to study gelatinous zooplankton using traditional methods because of their fragile bodies and patchy distributions (Fleming et al., 2011; Henschke et al., 2016). A limited number of studies have been conducted on the giant and well-known scyphozoan jellyfish (Zhang et al., 2012; Morita et al., 2017). However, despite the high diversity and biomass of non-scyphozoan gelatinous zooplankton, such as siphonophores and pyrosomatids, research on these groups remains insufficient (Weikert and Godeaux, 2008; Palma et al., 2014). Although some studies have shown that salp blooms are associated with phytoplankton (Kang et al., 2019), few ecological studies have been conducted on siphonophores.
Siphonophores are successful oceanic predators which employ unique mechanisms to obtain food sources in oligotrophic environments using a modular zooid chain (Damian-Serrano et al., 2022). Siphonophores are broadly distributed and are often cosmopolitan. Unlike scyphozoan jellyfish, siphonophores can be more sensitive to environmental changes because they do not produce polyps and live a holoplanktonic life. Despite their high ecological research value, little information is available on their distribution and biomass in the Northwest Pacific. Additionally, their relationships with other zooplankton and environmental factors have been understudied, therefore, evaluating the ecological roles of these animal groups is difficult.
Previous studies have elucidated the predatory feeding of siphonophores based on morphological and phylogenetic analyses (Damian-Serrano et al., 2021). Such feeding ecology can be recorded as variations in stable isotope ratios in consumer tissue, allowing the illustration of the food web structure, i.e., diet source and trophic position (TP), using carbon (δ13C) and nitrogen (δ15N) isotope ratios, respectively (Minagawa and Wada, 1984; Post, 2002). δ13C and δ15N analysis has suggested that some gelatinous zooplankton can potentially compete with non-gelatinous zooplankton for diet resources in the same space, owing to their similar stable isotope compositions (Chi et al., 2021). Meanwhile, δ15N analysis of individual amino acids (AAs) has been increasingly used to understand the TP of consumers based on the separation between trophic enrichment and basal nitrogen sources (trophic and source AAs, respectively) (Chikaraishi et al., 2009; McMahon and McCarthy, 2016; Choi et al., 2017). The TPs of zooplankton provide informative signals of dietary composition and variation based on environmental changes (Décima et al., 2013; Loick-Wilde et al., 2019; Choi et al., 2021). The δ15N of AAs could provide a better understanding of trophic ecology, including both gelatinous and non-gelatinous zooplankton.
In the Northwest Pacific, various currents such as the Kuroshio Current (KC), Oyashio Current (OC), North Equatorial Current (NEC), Southern Subtropical Countercurrent (sSTCC), and Northern Subtropical Countercurrent (nSTCC), significantly influence ocean circulation (Hu et al., 2015; Yang et al., 2017). The Northwest Pacific includes numerous active eddies formed by water mass exchange, resulting in high zooplankton productivity (Taguchi et al., 2007; Qiu and Chen, 2010; Lin et al., 2020). Gelatinous and non-gelatinous zooplankton coexist and play important roles as mid-trophic links in the planktonic food web in the Kuroshio Extension (KE), which is the mixing zone between the KC and OC (Kobari et al., 2008). Therefore, it is important to study the ecological relationships between environmental characteristics and zooplankton in the Northwest Pacific to understand changes in the marine ecosystem (Komatsu et al., 2002; Tian et al., 2003; Chiba et al., 2008; Qiu et al., 2017).
The aim of this study was to clarify the spatial correlation between siphonophore distribution and environmental conditions in the Northwest Pacific. In addition, we attempted to identify species among the siphonophores that could serve as environmental indicators, and clarified their association with other gelatinous and non-gelatinous zooplankton using stable isotope analysis. We hypothesized that the distribution of siphonophores in the Northwest Pacific can be characterized according to hydrological parameters. Some siphonophores would be an indicator species, based on their occurrence. Additionally, the δ15N values of AAs can provide powerful evidence to clarify feeding ecology and the niche partitioning between siphonophores and other gelatinous and non-gelatinous zooplankton. These results will help us to understand the siphonophore communities in the Northwest Pacific and to characterize this water mass. Considering the importance of siphonophores in gelatinous zooplankton, this study is expected to enable the investigation of the causes and future sustainability of blooms, and generate a useful basis for climate change prediction.
2 Materials and methods
2.1 Collection of specimens and hydrological data
Samples were collected during multiple R/V ISABU cruises (August 2018, October 2019, and May 2020) in the Northwest Pacific (Figure 1, Supplementary table S1). We used a multiple opening/closing net and environmental sensing system (MOCNESS, 1 × 1 m2, mesh aperture: 200 μm), which was towed obliquely from a depth of 200 m to the surface at each station. Hydrological data (temperature, salinity, and density) for the water column were recorded using a CTD (SBE 91plus, Sea-Bird Scientific Co., Washington, USA) at each station. After towing, the samples were immediately split into three aliquots using a Folsom plankton splitter: 1) fixed in 5% neutralized formalin solution and stored at 25 ± 2 °C; 2) fixed in 99% ethanol and stored at 4 °C; 3) live sample with no chemical addition.
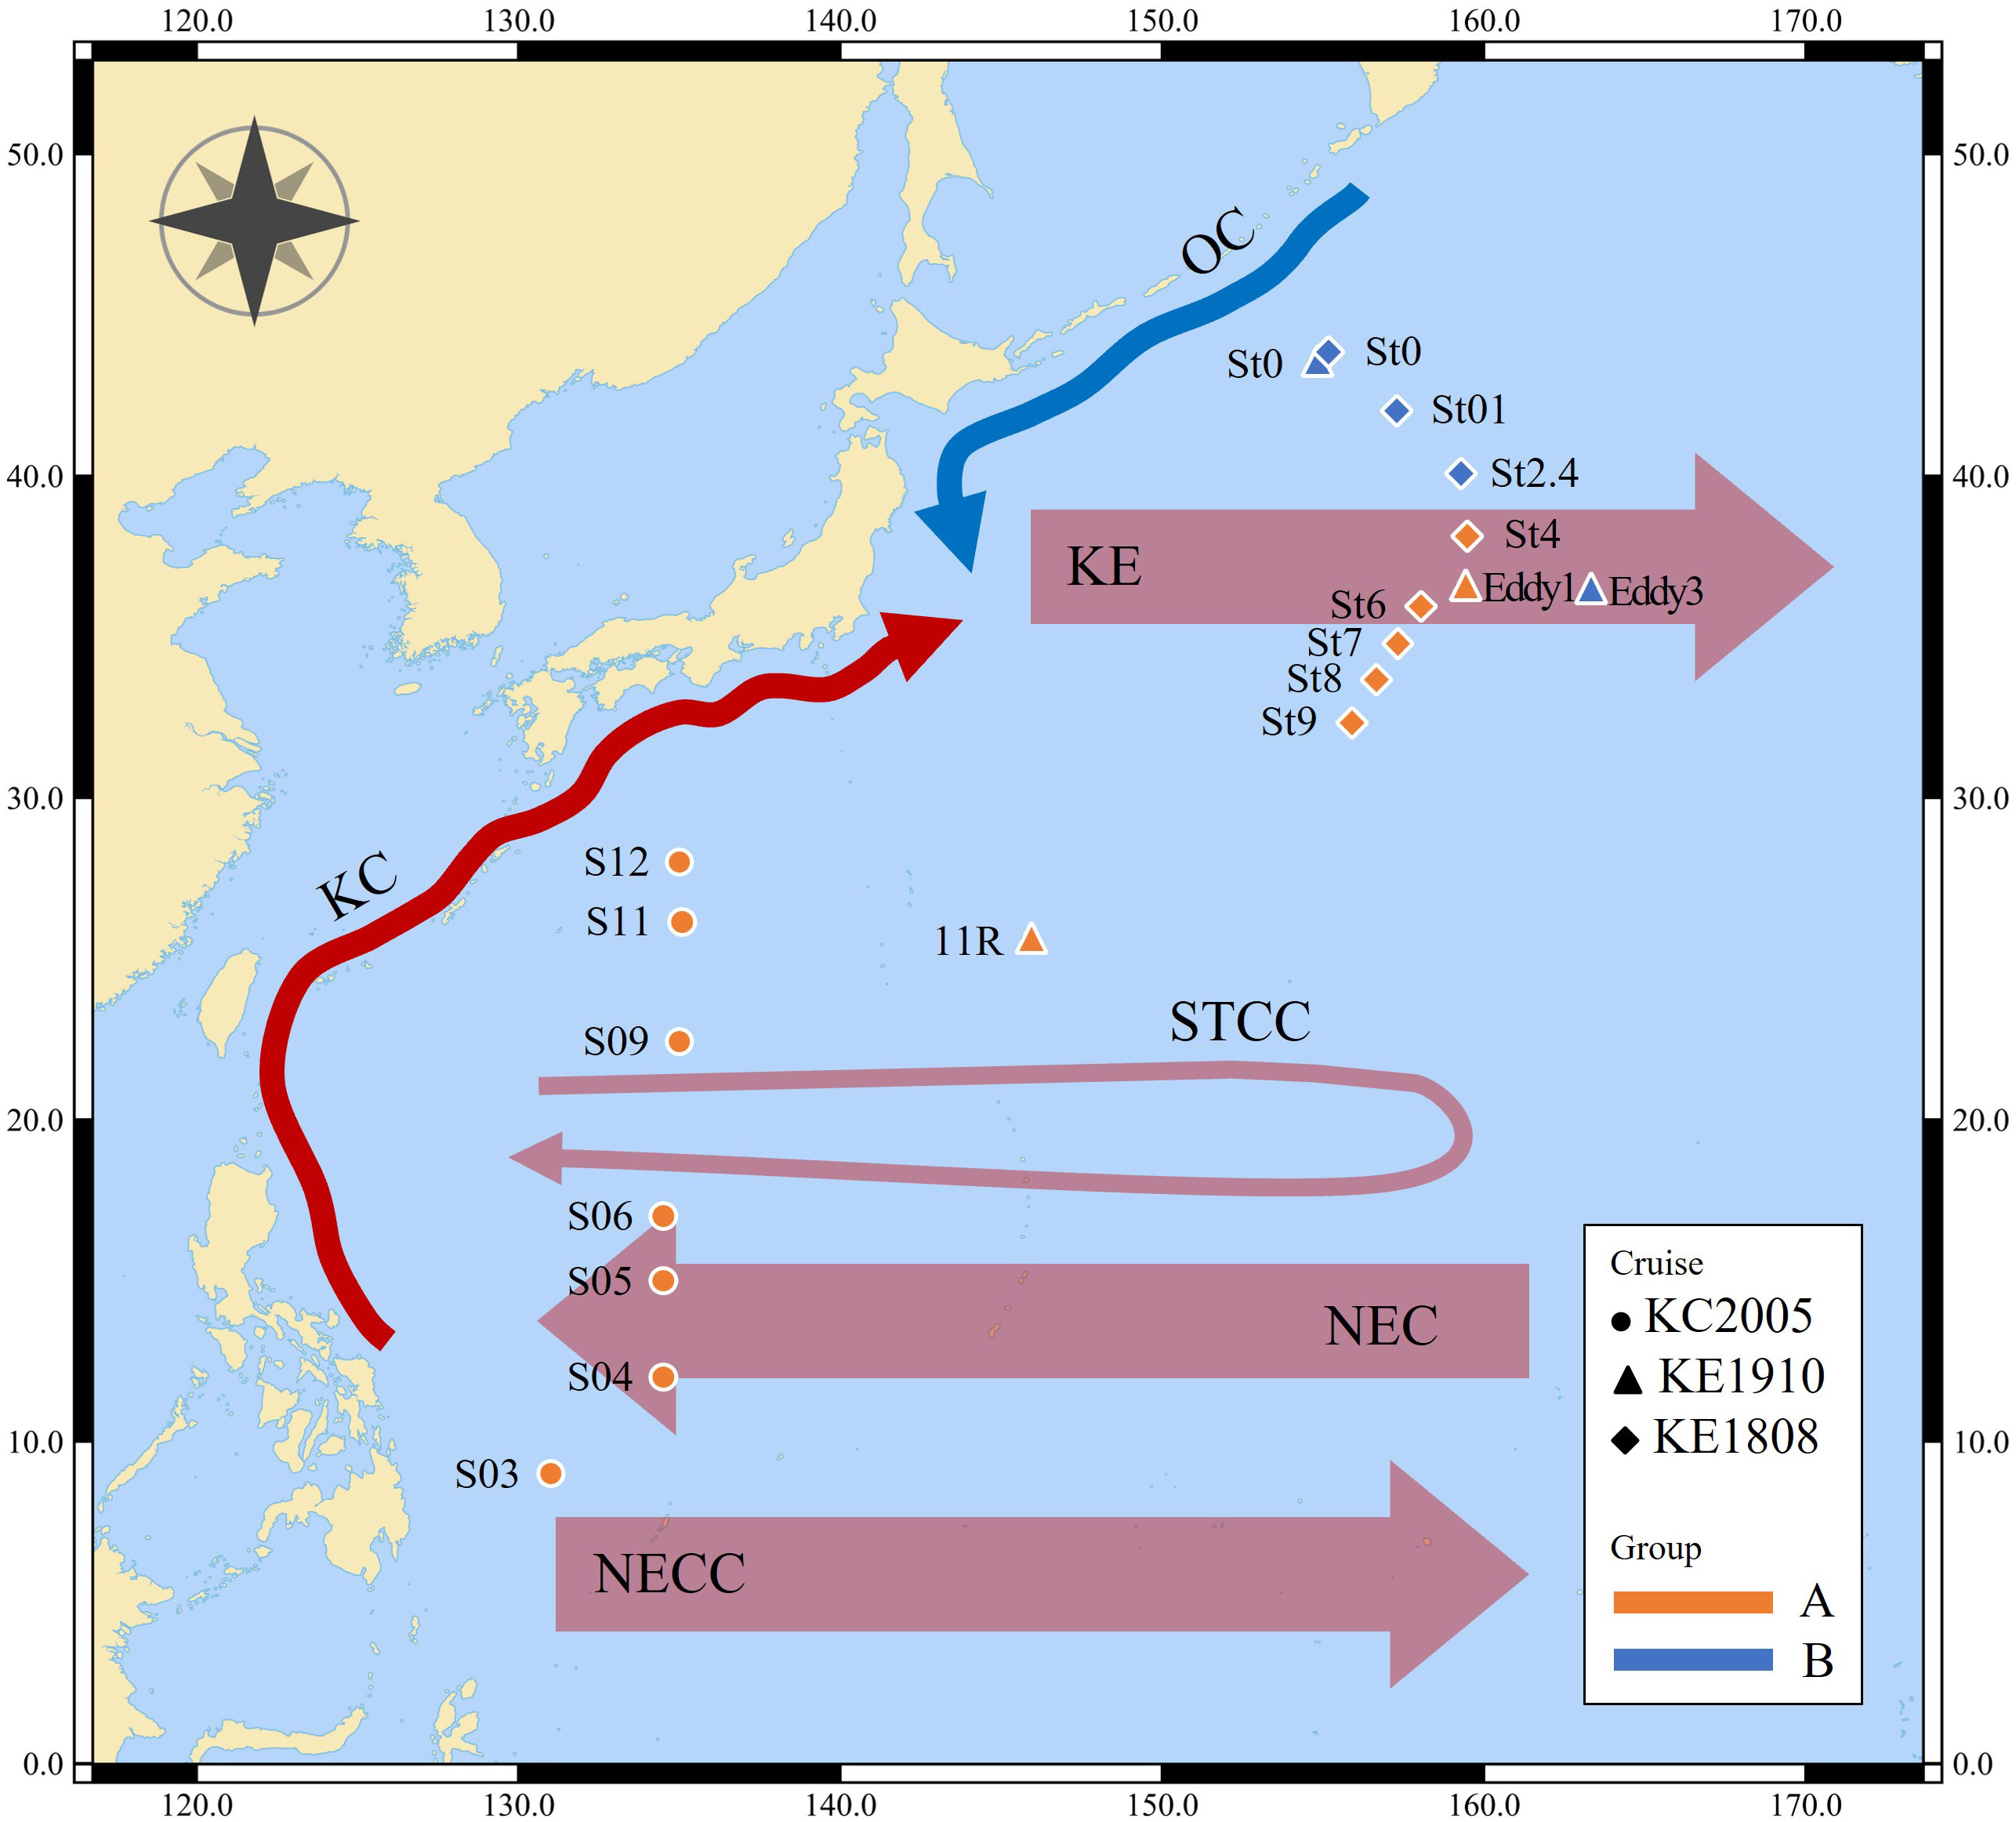
Figure 1 Map of sampling stations. OC, Oyashio Current; KC, Kuroshio Current; KE, Kuroshio Extension; STCC, Subtropical Countercurrent; NEC, North Equatorial Current; NECC, North Equatorial Countercurrent.
2.2 Biomass
After drying the filter paper (GF/C Whatman, 47 mm, pore size 0.45 μm) in a dry oven at 60 °C for 24 h, the weight was measured to 0.001 mg with a precision electronic balance. The formalin-fixed samples were transferred to a petri dish (Ø: 5 cm) using a pipette and separated into 1) siphonophores; 2) other gelatinous zooplankton (scyphozoans, cubozoans, ctenophores, salps, chaetognaths, and others) except for siphonophores; 3) non-gelatinous zooplankton, under a stereomicroscope (Olympus SZX7, Tokyo, Japan) using Live Insect Forceps (26029-10, Fine Science Tools Inc., Foster City, CA, USA). The sorted samples were divided into 1/2–1/16 portions, poured into filter paper in a funnel, and slowly stirred with a pipette to remove the surface moisture of the sample using a vacuum pump (the pressure was usually kept below 250 mmHg). The operation was stopped before the samples were drained. The remaining moisture on the filter paper was removed using Kimwipes, and the weight was measured (up to 0.001 mg) using a precision electronic balance. Finally, the wet weight was converted into units of biomass (mg/m3) per unit volume of filtered water.
2.3 Identification of siphonophores
The siphonophore specimens from the formalin, ethanol, and live samples were sorted using Live Insect Forceps under a stereomicroscope. Observation and identification were conducted using descriptions, illustrations, and terminology from the literature (Totton, 1954; Totton and Bargmann, 1965; Kirkpatrick and Pugh, 1984; Mapstone, 2009; Pugh and Baxter, 2014; Nishiyama et al., 2016). Species occurrence per station is summarized in Table 1.
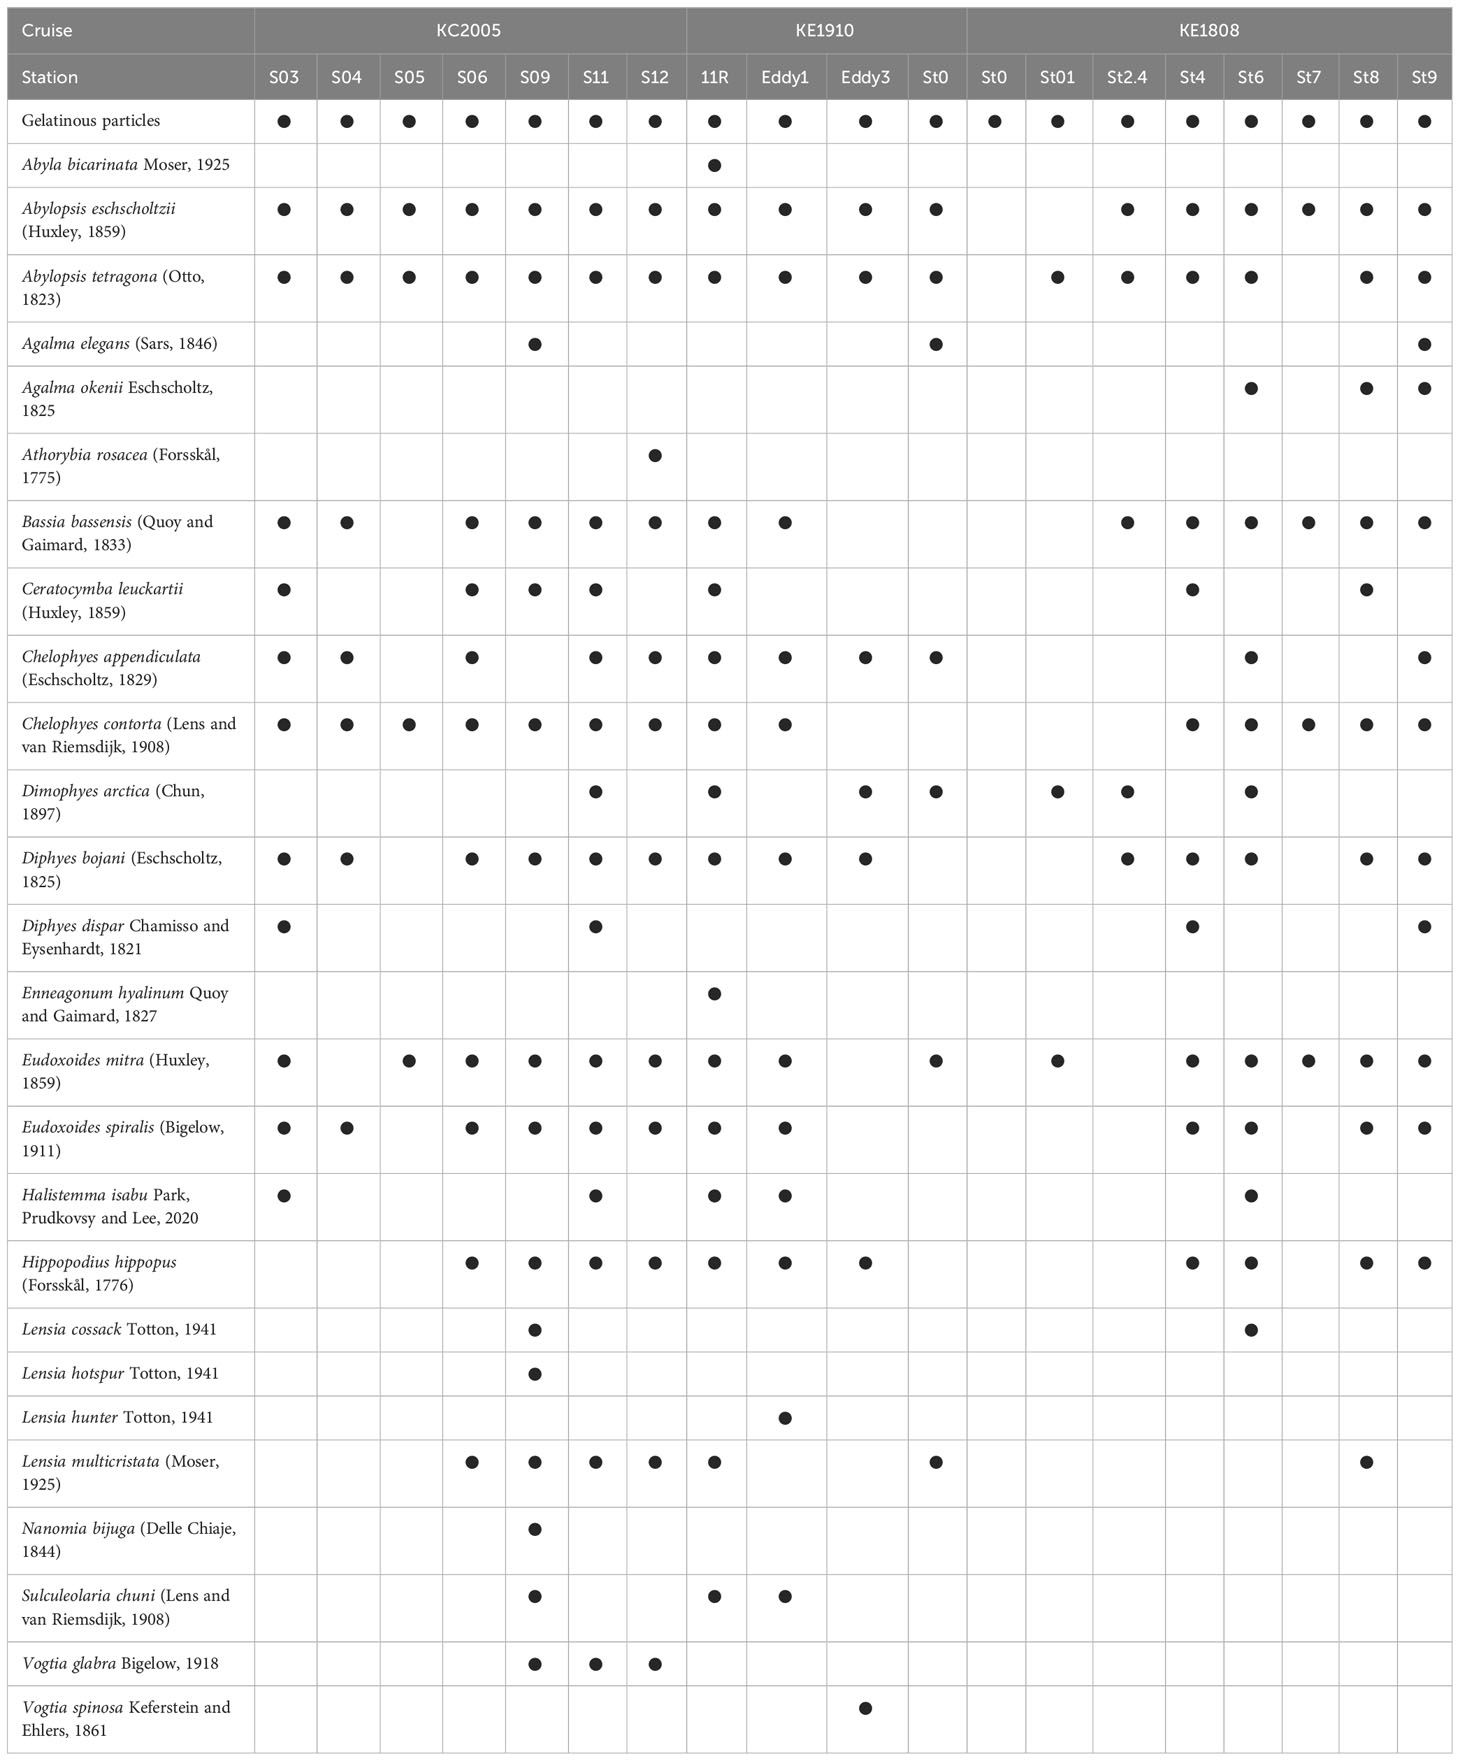
Table 1 List of siphonophores that occurred in the study area.
2.4 Data processing and statistical analysis
The CTD data were visualized using Ocean Data View 4 software (version 4.5.7) (Figures 2, 3). The depth of the surface mixed layer was determined as the depth at which the density difference from that at 5 m was over 0.05 kg/m3 (Lee et al., 2019), and the surface water temperature and salinity were calculated as the average values of the mixed layer. Statistical analysis of species composition was performed using PAST software (version 4.09) (Hammer et al., 2001). Hierarchical clustering and non-metric multidimensional scaling (NMDS) analyses of the clusters using the unweighted pair group method with arithmetic mean (UPGMA), based on the Bray-Curtis similarity index (Shannon and Wiener, 1963), were performed to measure the similarity between the stations in terms of the distribution of siphonophores (Clarke and Gorley, 2006). A similarity percentage (SIMPER) test was performed to identify the species with high contributions to each cluster (Bray and Curtis, 1957; Clarke, 1993; Clarke and Warwick, 2001), and a canonical correspondence analysis (CCA) was conducted to determine the correlation between siphonophores and environmental conditions (Ter Braak and Verdonschot, 1995). The CCA dataset consisted of species contributing up to a cumulative 80% of the average Bray-Curtis similarity with reference to previous studies, and five environmental factors (temperature, salinity, and biomass (siphonophores, other gelatinous, and non-gelatinous zooplankton)) were used as explanatory variables (Jaffré et al., 2008; Terlizzi et al., 2010; Saitoh et al., 2011). The wet weight was visualized as bar graphs and boxplots using Excel (Microsoft Office 16) and PAST software (version 4.09) (Hammer et al., 2001).
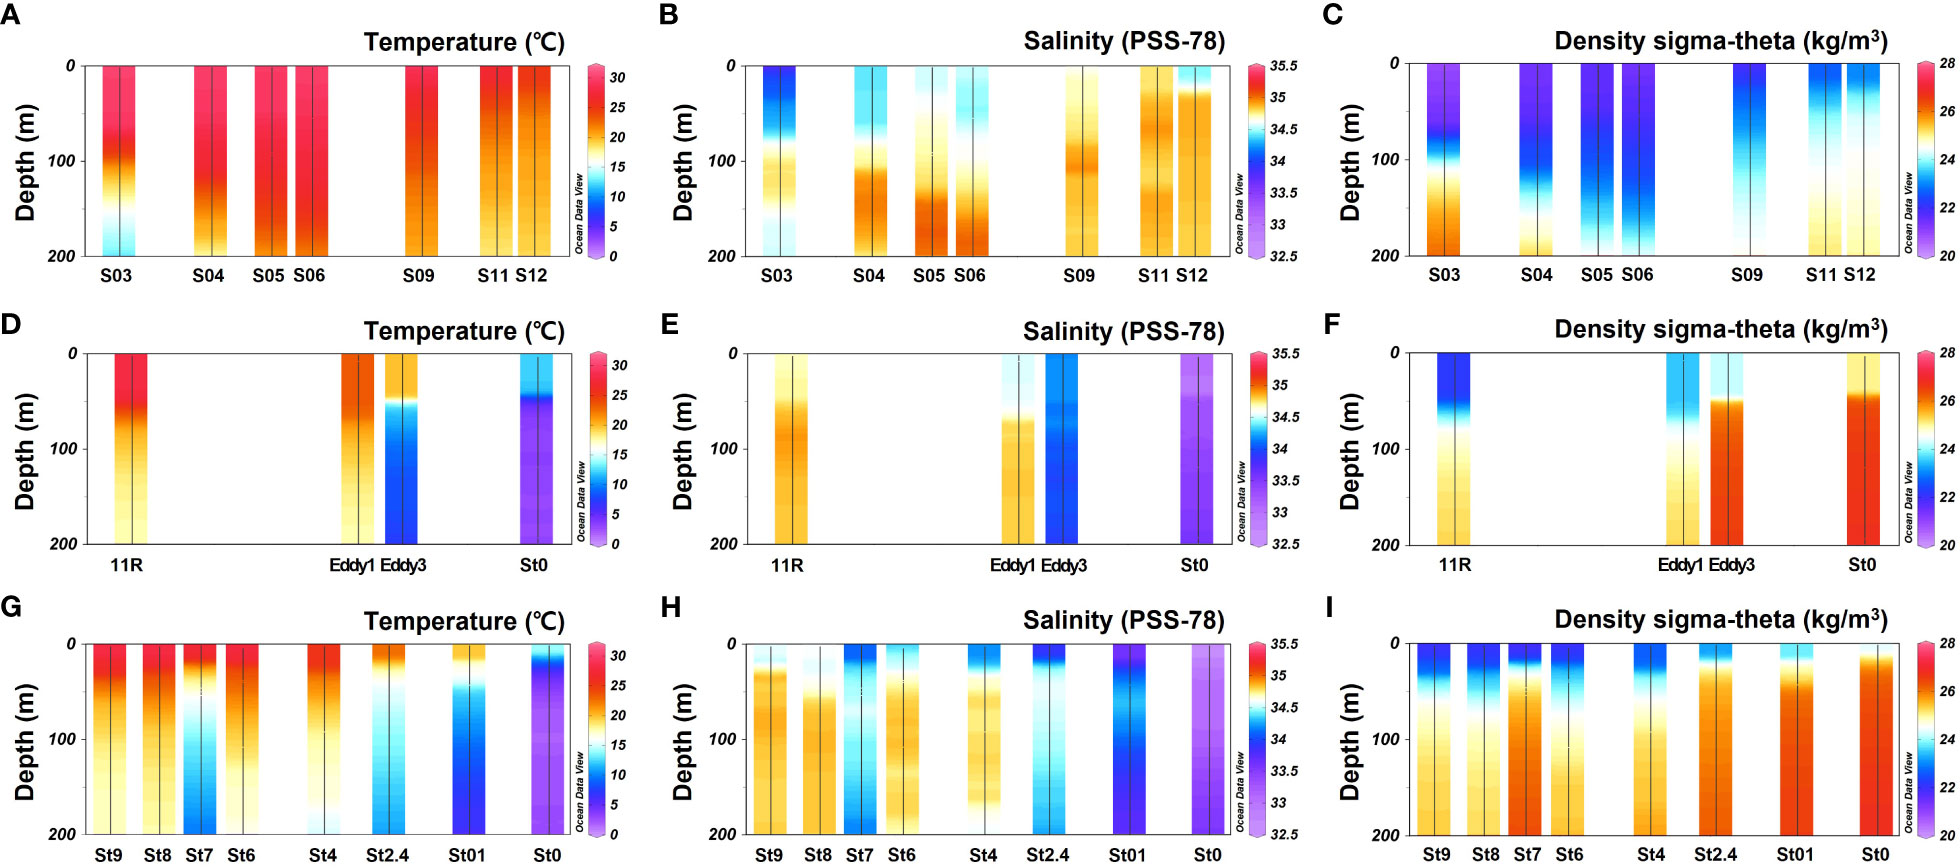
Figure 2 Vertical profile of temperature, salinity, and density in the study area. (A–C) KC2005; (D–F) KE1910; (G–I) KE1808 cruises.
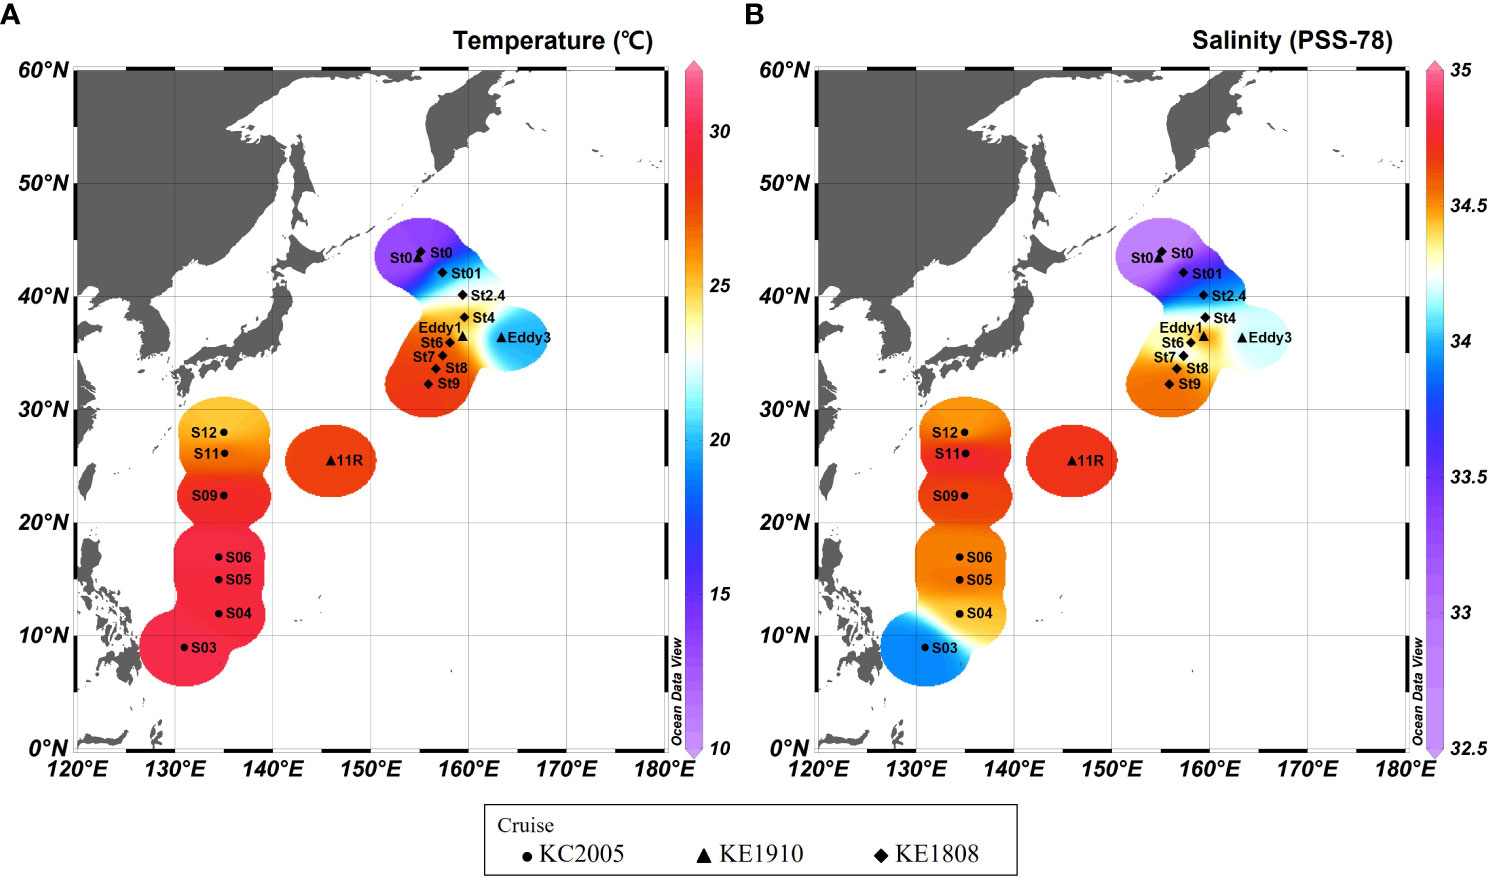
Figure 3 Temperature (A) and salinity (B) in the surface mixed layer in the study area.
2.5 Stable isotope analysis
Live samples collected during the KC2005 and KC1910 cruises were used for stable isotope analysis. Both gelatinous and non-gelatinous zooplankton were freeze-dried for 24 h and homogenized. To analyze the carbon stable isotope ratio (δ13CBulk), the samples were acidified with 1M HCl overnight to remove inorganic carbon. After the removal of residual HCl, the lipid content in the samples was extracted by sonication with 2:1 methanol/chloroform (v/v). For the nitrogen stable isotope ratio (δ15NBulk), the samples were used without decalcification or defatting. Samples of approximately 0.1–0.3 and 0.3–1.5 mg dry weight for the δ13CBulk and δ15NBulk analysis, respectively, were packed into tin capsules and analyzed using an isotope ratio mass spectrometer (Isoprime, Elementar, Germany) equipped with an elemental analyzer (Vario Select, Elementar, Germany). The analytical precision of the δ13CBulk and δ15NBulk values was checked using international standards (IAEA CH-3 and N-1) for every 10 sample runs. The analytical errors in both CH-3 and N-1 were less than 0.3‰ during analysis.
For the analysis of the nitrogen isotopes of individual AAs (δ15NAA), we used two to three individuals of the non-gelatinous zooplankton (copepods, euphausiids, and amphipods) and one individual of the gelatinous zooplankton. The experimental protocol has been described in a previous study (Choi et al., 2021). AA nitrogen isotopes were analyzed using a gas chromatograph (HP 6890N, Agilent, USA) connected to a combustor (GC5 Interface, Elementar, Germany) and an isotope ratio mass spectrometer (Isoprime 100, Elementar, Germany). δ15N-certified AA standards (alanine, glycine, valine, leucine, norleucine, aspartic acid, methionine, glutamic acid, and phenylalanine) were purchased from SHOKO-Science and Indiana University. The AA standards were derivatized using the same method mentioned above and used for the calibration and verification of analytical precision. The δ15N values of the AA standards displayed a standard deviation smaller than 1‰.
The TP was calculated using the following equation (Chikaraishi et al., 2009).
Where δ15NGlu and δ15NPhe are the nitrogen isotope ratios of glutamic acid (Glu) and phenylalanine (Phe), respectively. The constant 3.4 is the empirical value of the δ15N difference between Glu and Phe in primary producers (β value). The constant 7.6 is the δ15N difference in Glu relative to Phe for each trophic transfer.
3 Results
3.1 Hydrology
This study covers the area from the origin of the KC to OC and includes the KE (Figure 1). Most stations exhibited a pycnocline at water depths of approximately 50 m (Figure 2). Water temperature, salinity, and density differed according to station and associated currents (Figure 2). In the KC sphere of influence (S03–S12), the water temperature in the surface mixed layer decreased from low to high latitudes (9.0–28°N; 24.8–30.0 °C; Figure 3A). In the case of S03, the salinity in the surface mixed layer was relatively low (33.9 psu; Figure 3B), and a rapid change in the density gradient appeared at water depths of approximately 100 m (Figure 2C), which can be considered to reflect effect of the relatively low salinity NEC (Yang et al., 2017). Relatively high surface mixed layer salinity (34.4–34.6 psu) was recorded at S04–S06 and showed characteristics of the Subtropical Countercurrent (STCC) (Figure 3B; Yang et al., 2017). S09–S12 had lower water temperatures in the surface mixed layer than S03–S06 (24.8–28.8 °C; Figure 3A), and a previously detected KC pattern was confirmed (Horikawa et al., 2015; Ye et al., 2016).
The KC and OC encounter to form the KE in the Northwest Pacific, and the high latitude stations of the KE (36.3–43.9°N; St0 (KE1910), Eddy3, St0 (KE1808)–St2.4) demonstrate low temperatures in the surface mixed layer (12.0–22.6 °C; 32.6–34.2 psu; Figure 3A) and a strong pycnocline within a 50 m water depth (Figure 2C), affected by the OC (Qiu, 2001; Sakurai, 2007). The low latitude stations of the KE (25.5–36.4°N; 11R, Eddy1; St8–St9), affected by the KC (Qiu, 2001), demonstrated relatively warm water temperatures, high salinity in the surface mixed layer (23.3–28.1 °C; 34.5–34.7 psu; Figure 3), and a relatively weak pycnocline within 50 m (Figure 2C) compared with the conditions at high latitude stations. St4 (38.2°N), St6 (36.0°N), and St7 (34.8°N) were close to the latitudes of the KE1910_Eddy stations (36.3–36.4°N). Therefore, it is difficult to distinguish them based solely on latitude. However, considering the temperature, salinity, and density in the surface mixed layer (25.3–27.7 °C; 34.1–34.4 psu; Figures 2, 3), a pattern similar to that in the low latitude stations of the KE was observed.
The sampling stations were divided into two groups based on the hydrological data and ocean currents. 1) group A, with high temperatures and salinity in the surface mixed layer was strongly affected by the KC (27.6 (23.3–30.0) °C; 34.5 (33.9–34.8) psu; S03–S12; 11R, Eddy1; St4–St9); 2) group B, with low temperatures and salinity in the surface mixed layer was strongly affected by the OC (17.6 (12.0–22.6) °C; 33.4 (32.6–34.2) psu; St0 (KE1910), Eddy3, St0 (KE1808)–St2.4).
3.2 Correlation between the distribution of siphonophores and environmental factors
A total of 26 species of siphonophores were recorded from 19 stations, and the highest diversity, with 16 species, was confirmed in S09 and 11R, whereas no siphonophores were recorded in St0 (KE1808) (Table 1). Abylopsis eschscholtzii (Huxley, 1859) and Abylopsis tetragona (Otto, 1823) were recorded at 17 stations, indicating that they were the most extensively distributed among the recorded siphonophores. Hierarchical clustering analysis based on species composition was performed to investigate the correlation between the occurrence of siphonophores and the hydrological features at different stations. Except for St0 (KE1808) (where no siphonophores were recorded), the data were classified into water mass group A (high temperature and high salinity strongly affected by the KC) and group B (low temperature and low salinity strongly affected by the OC) at a 50% similarity level (Figure 4; cophenetic correlation: 0.9292). The NMDS analysis results were also clearly divided into groups A, B, and St0 (KE1808) (Figure 5; stress value: 0.171), which is consistent with previous results based on hydrological conditions.
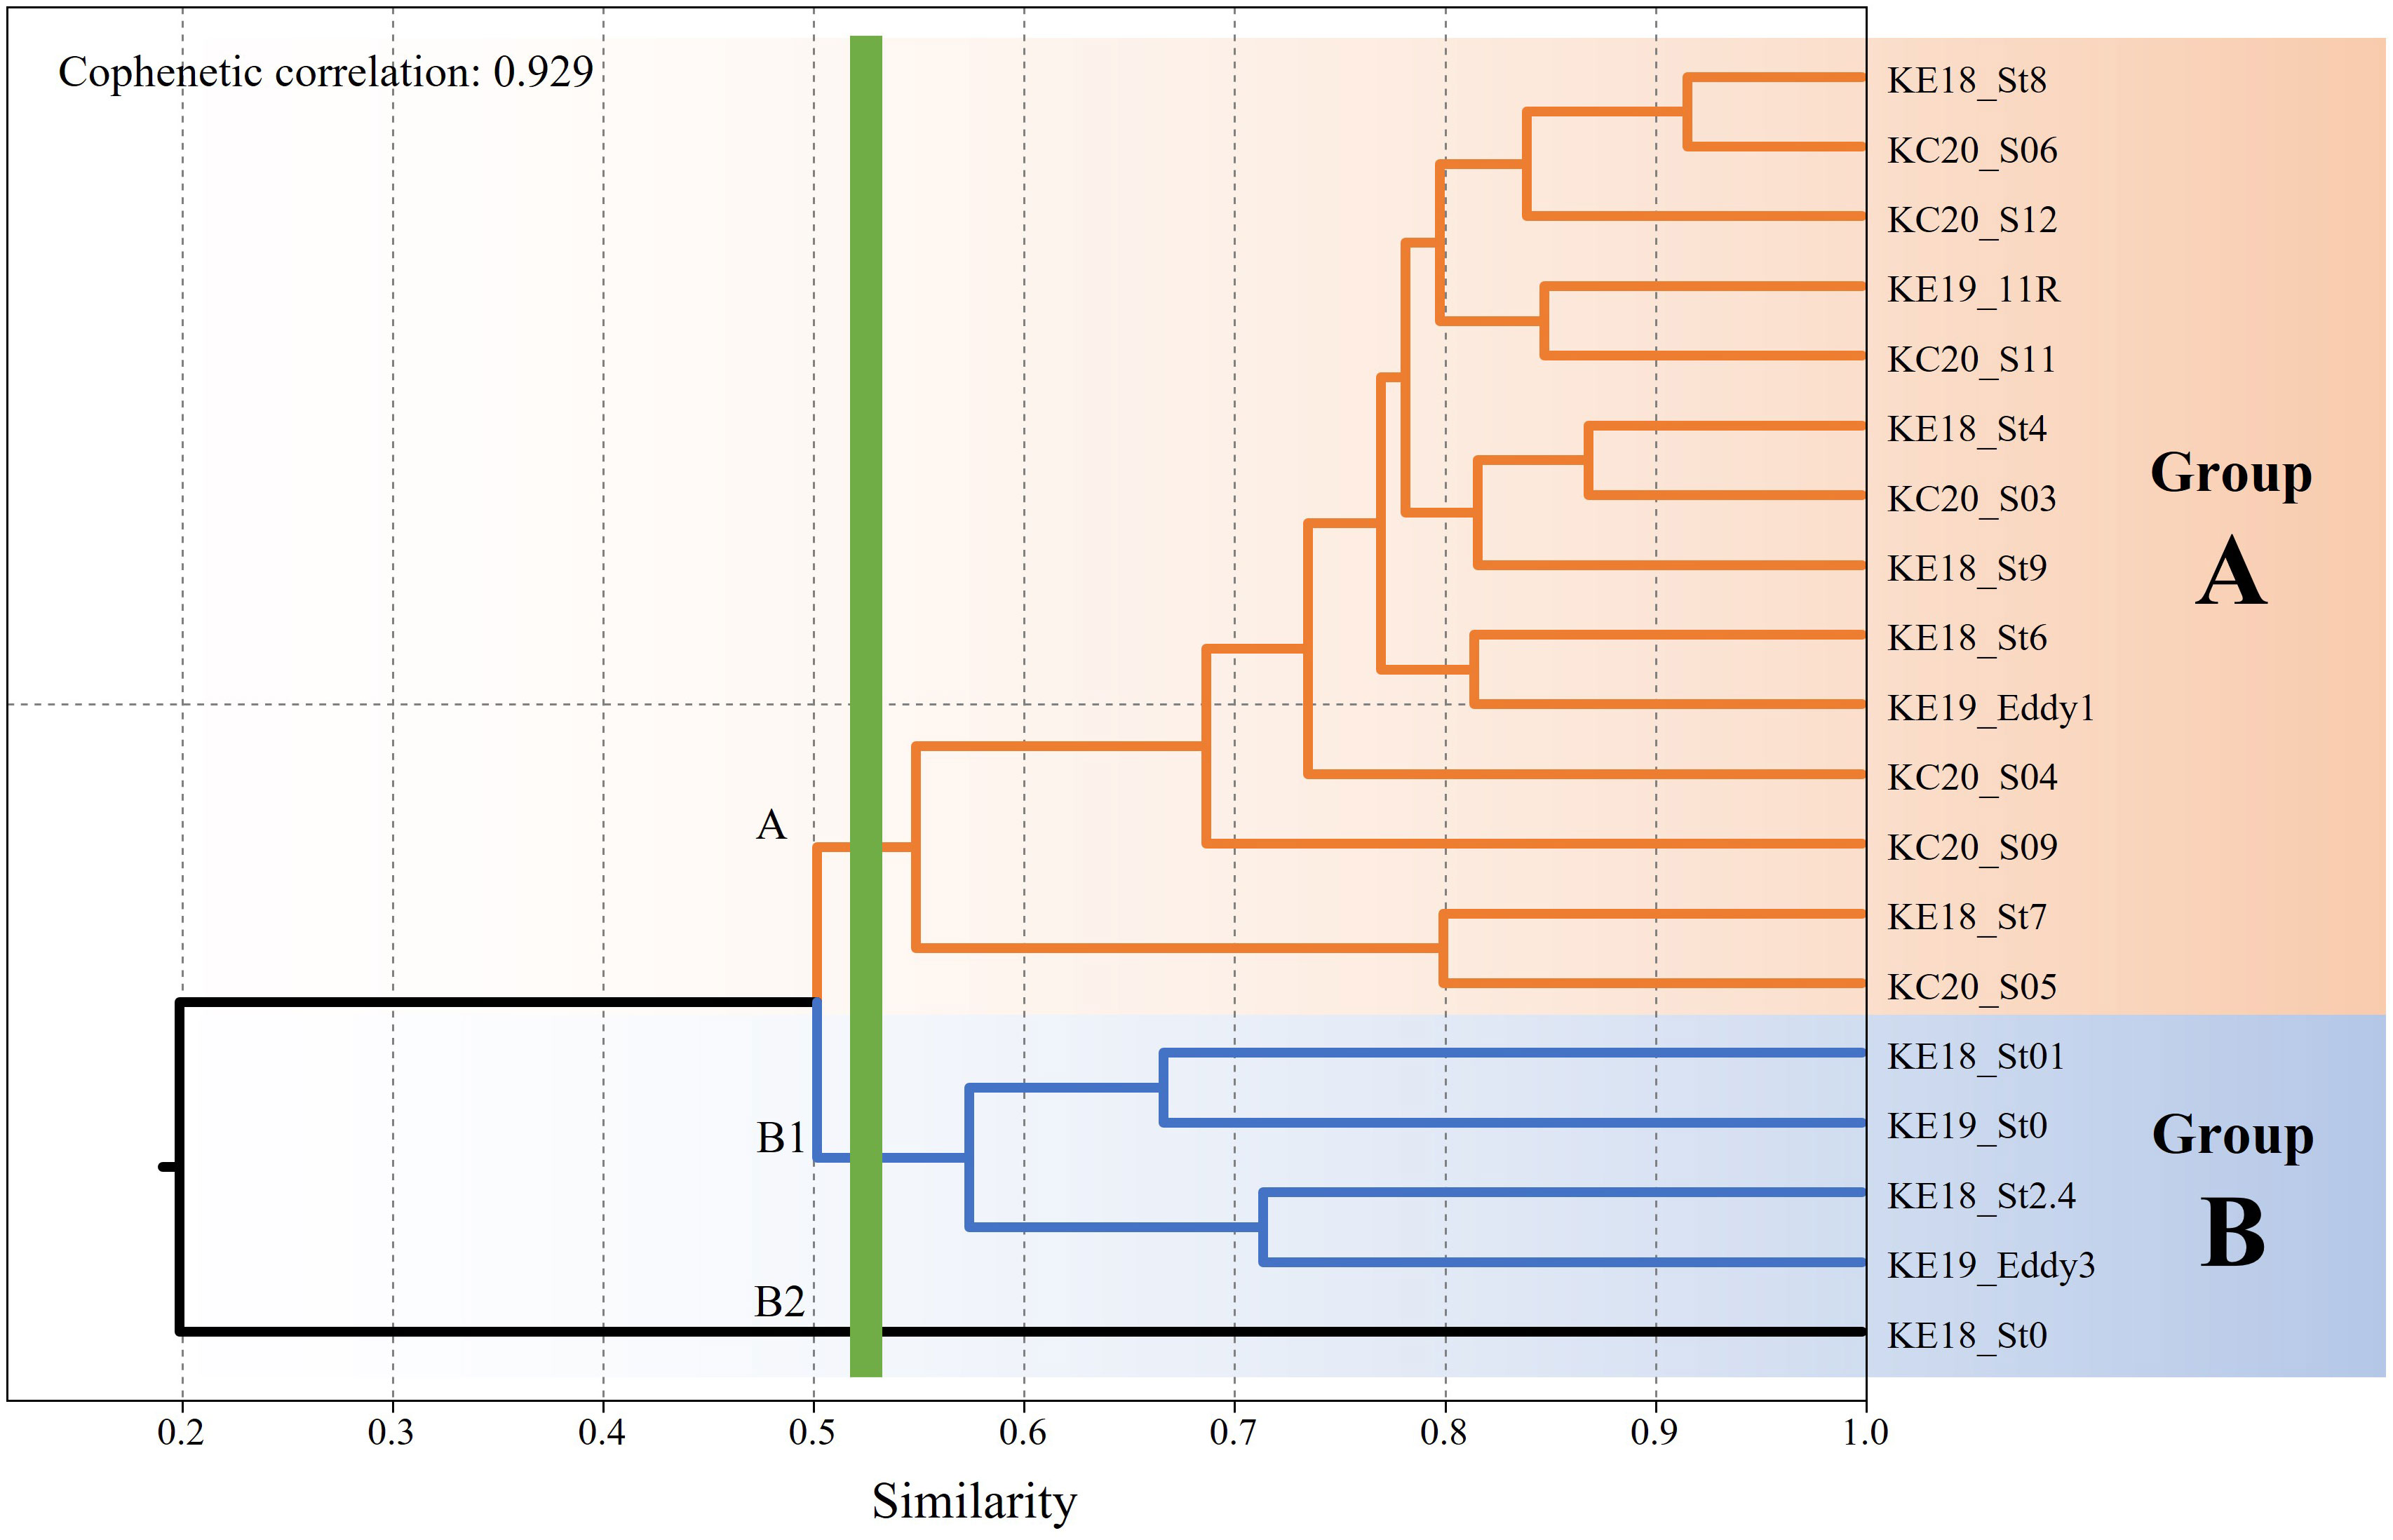
Figure 4 Dendrogram of station associations derived from a hierarchical clustering analysis based on the composition of siphonophores.
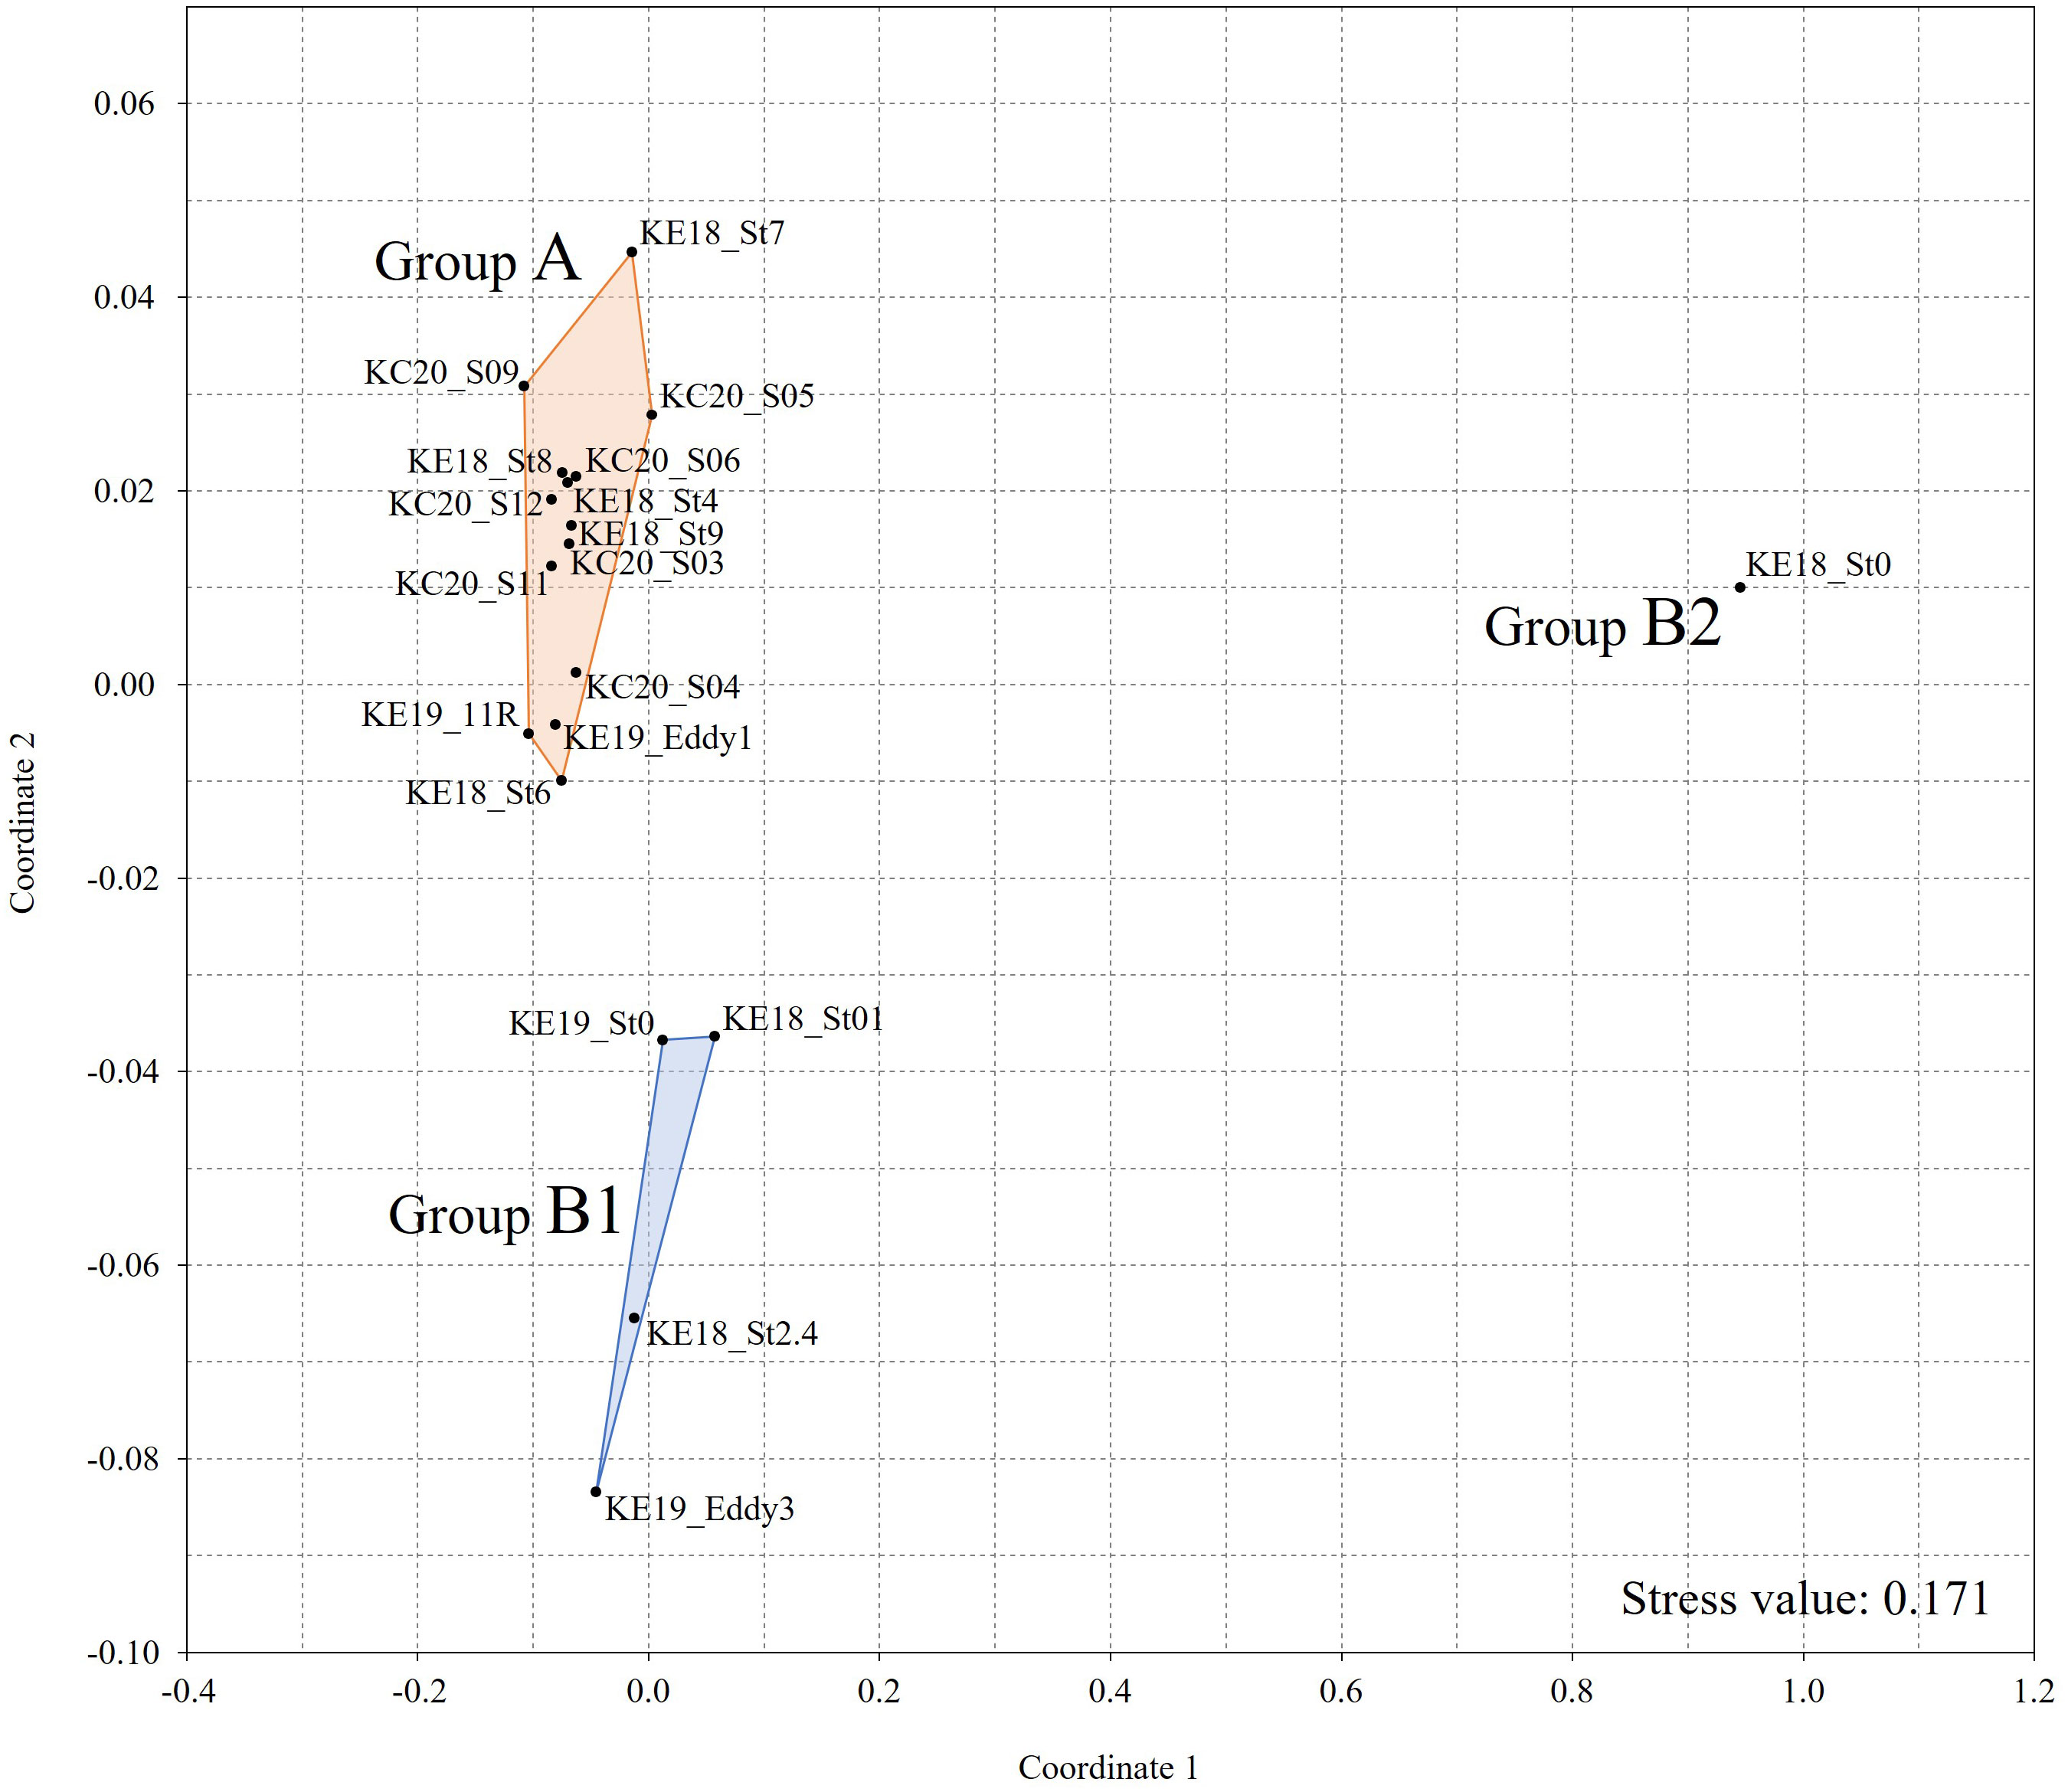
Figure 5 The non-metric multidimensional scaling ordination plot of sampling stations based on the composition of siphonophores.
The SIMPER analysis revealed the species that distinguished each cluster. Chelophyes contorta (Lens and van Riemsdijk, 1908), found only at group A stations, had the highest contribution rate at 10.44% (Table 2). Dimophyes arctica (Chun, 1897), mainly occurred at group B stations, with a contribution rate of 8.06%. Bassia bassensis (Quoy and Gaimard, 1833) and Eudoxoides spiralis (Bigelow, 1911) were also unequally distributed in group A stations, with comparatively high contributions of 8.04% and 7.97%, respectively. Based on the SIMPER analysis, 13 species accounted for 82.54% of the total contribution, and each contribution rate was greater than 3%. Correlations between these 13 major species and water temperature, salinity, and biomass (siphonophores, other gelatinous, and non-gelatinous zooplankton) were derived from the CCA results (Figure 6). The eigenvalues of Axis-1 and Axis-2 were 0.098 and 0.032, respectively, and these two axes explained 84.25% (Axis-1: 63.54%; Axis-2: 20.71%) of the total variance. Regarding environmental factors, the siphonophore biomass exhibited a vector similar to that of temperature and salinity. In contrast, the biomass of non-gelatinous zooplankton showed a vector opposite to those of temperature, salinity, and siphonophore biomass. The biomass of the other gelatinous zooplankton exhibited a short vector that was not coupled with other environmental factors. E. spiralis, C. contorta, Ceratocymba leuckartii (Huxley, 1859), B. bassensis, Hippopodius hippopus (Forsskal, 1776), and Diphyes bojani (Eschscholtz, 1825) showed a positive correlation with water temperature and salinity based on Axis-1. However, Chelophyes appendiculata (Eschscholtz, 1829), A. tetragona, A. eschscholtzii, D. arctica, and Eudoxoides mitra (Huxley, 1859) were negatively correlated with water temperature and salinity. Halistemma isabu Park and Lee, 2020, and Lensia multicristata (Moser, 1925) were not significantly correlated with any environmental factors.
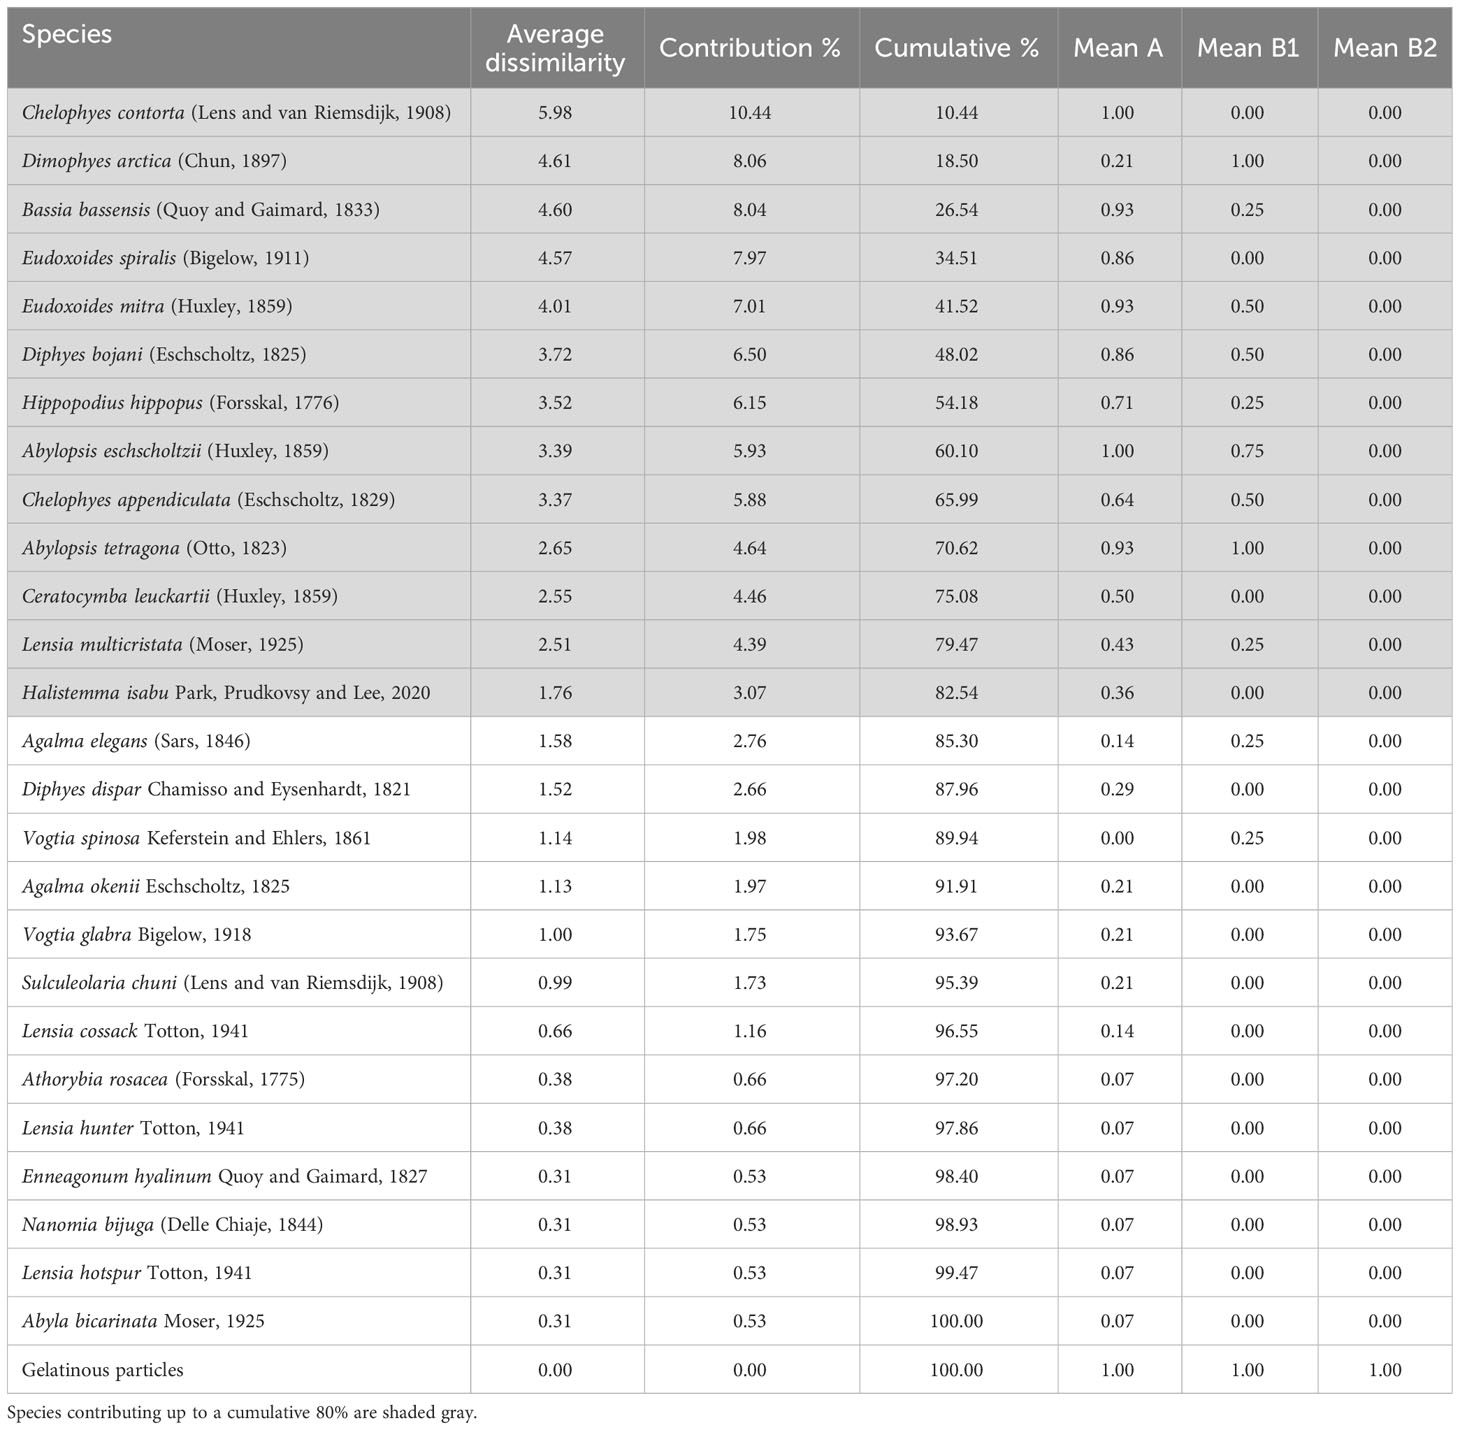
Table 2 Similarity percentage analysis of siphonophores that occurred in the study area.
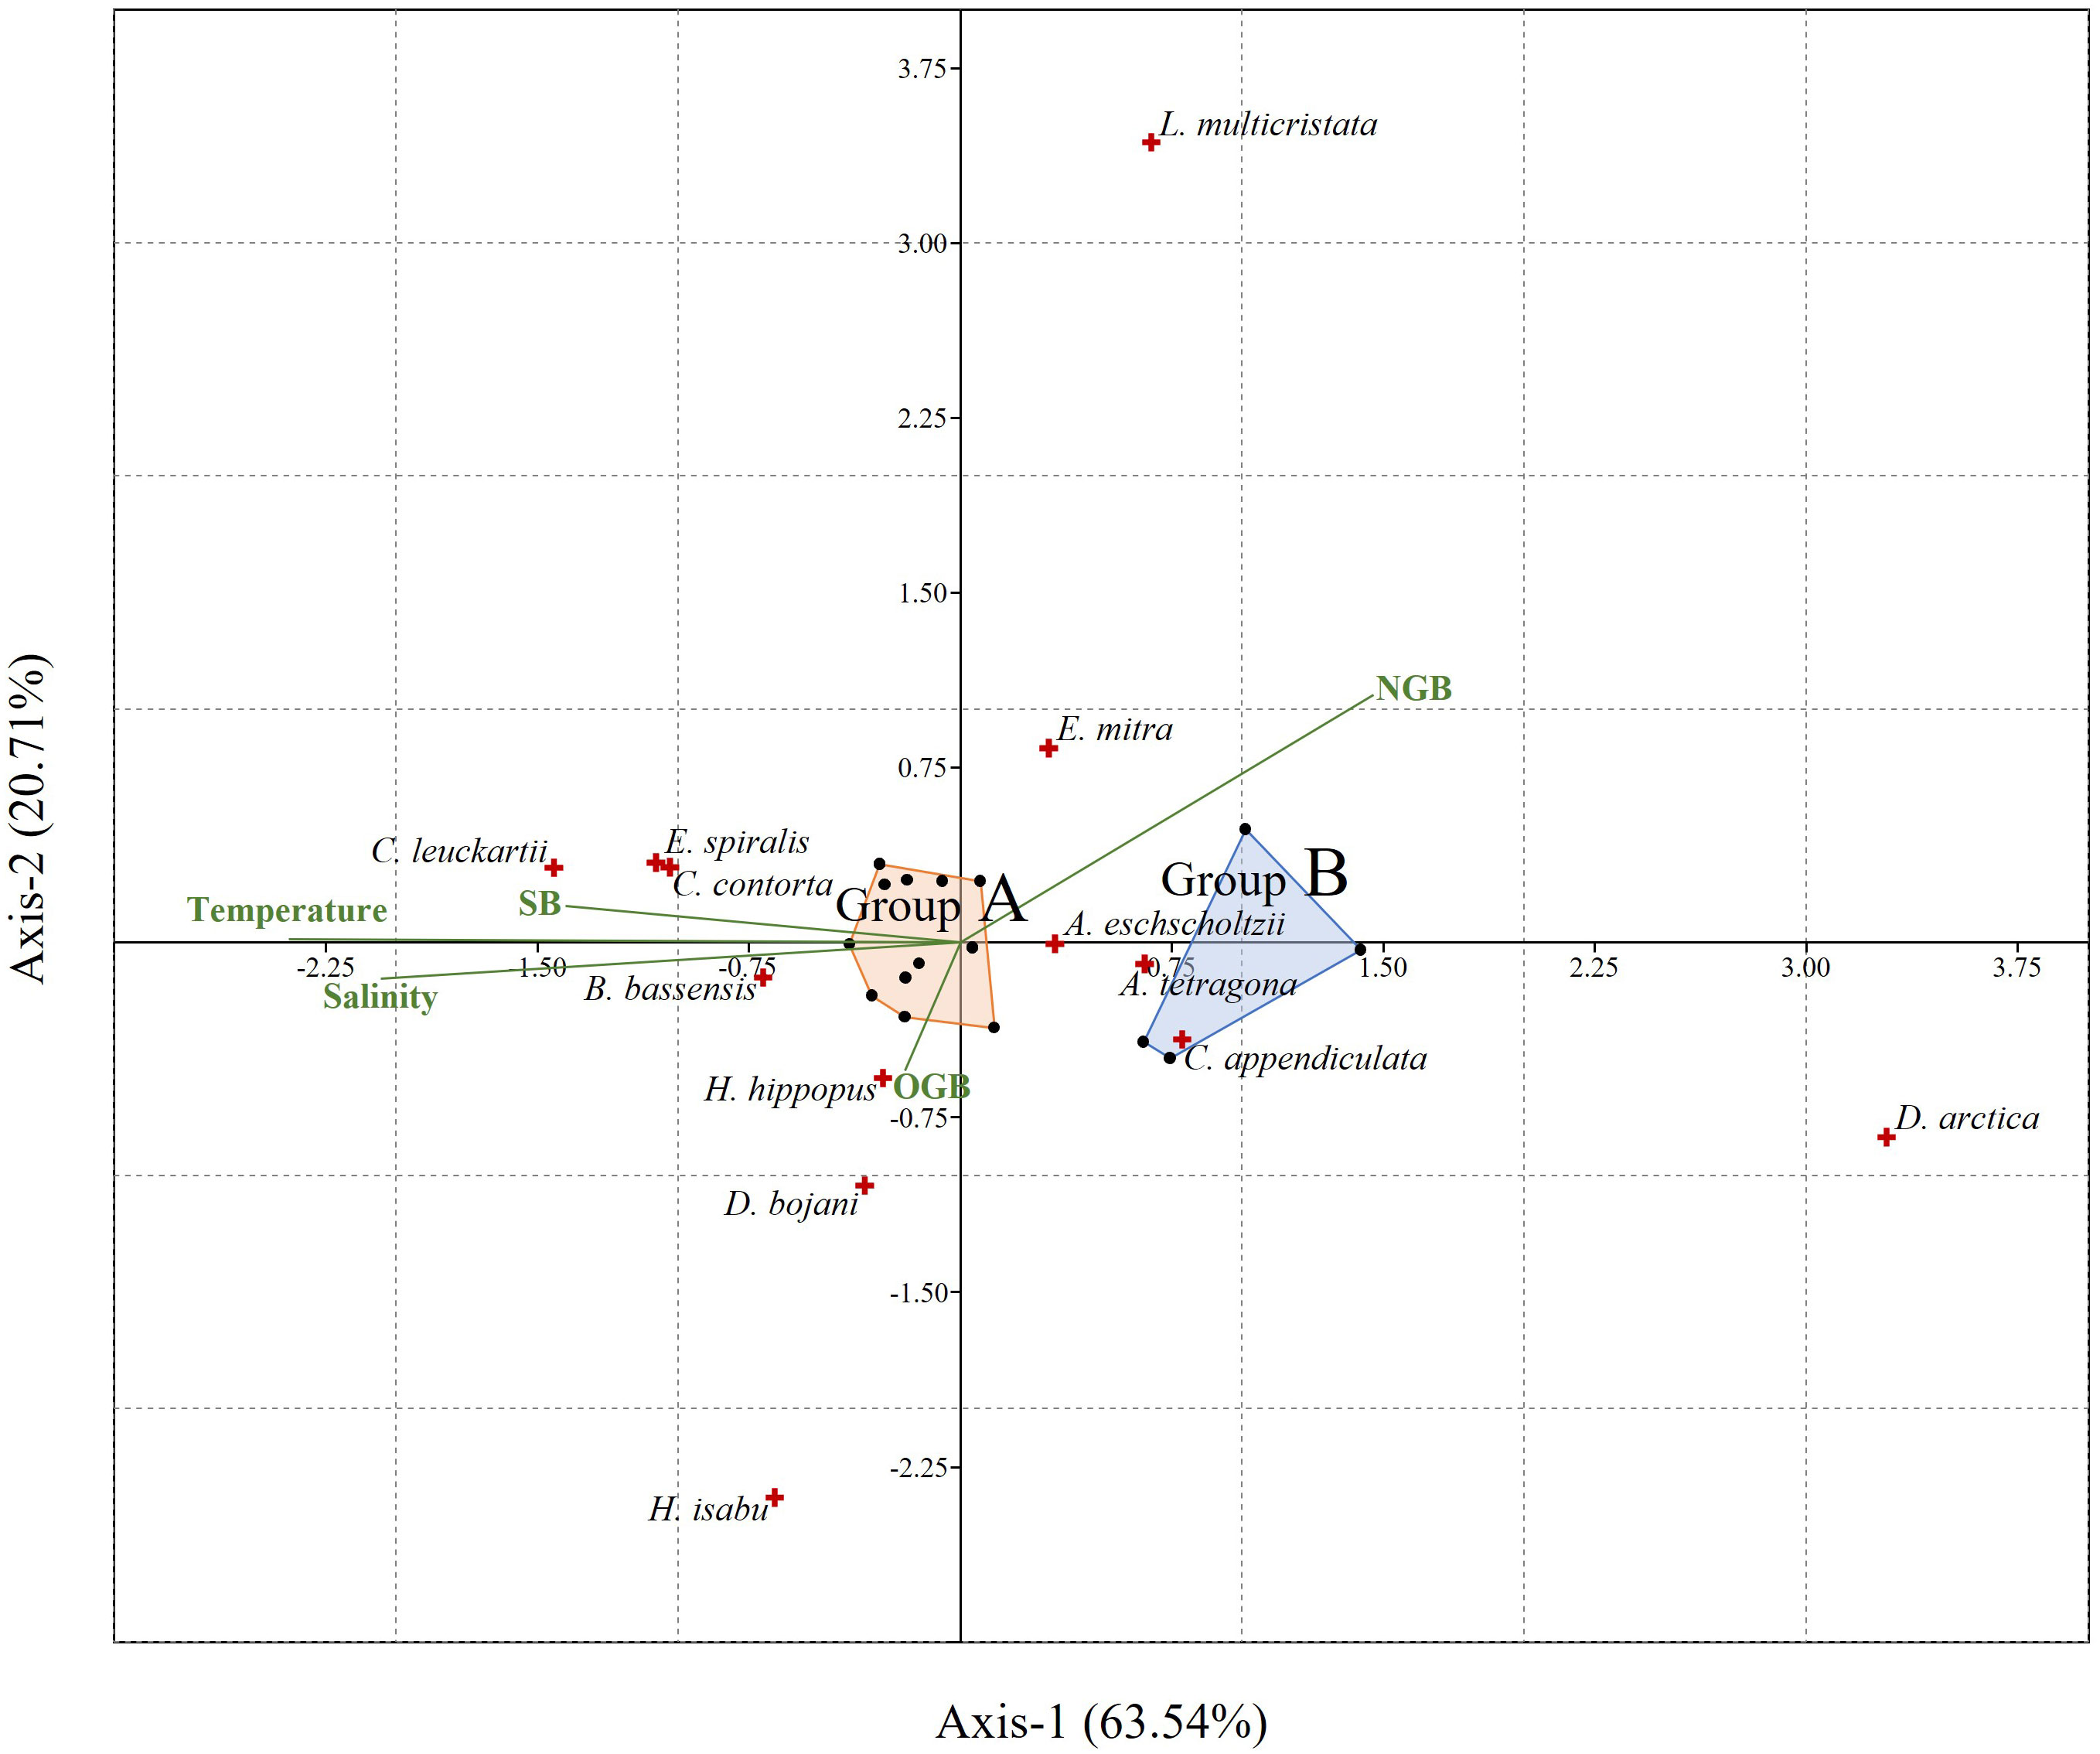
Figure 6 The canonical correspondence analysis ordination plot of major siphonophores in relation to the environmental factors in the study area. Green lines: Environmental factors, red crosses: Siphonophores, black dots: Stations, SB, Siphonophore biomass; OGB, Other gelatinous zooplankton biomass; NGB, Non-gelatinous zooplankton biomass.
3.3 Correlation between siphonophore biomass and water mass
The total zooplankton biomass was the highest (516.4 mg/m3) at St0 (KE1910) and the lowest (24.0 mg/m3) at S06. There was no direct correlation between the latitude of the stations and the total zooplankton biomass, however, it was confirmed that a higher biomass value was generally recorded at stations located at higher latitudes during each cruise (S09, S12, St0 (KE1910), St0 (KE1808)–St01), except for S03 (Table 3). The total gelatinous zooplankton biomass values were 103.6 mg/m3 at S03, 92.1 mg/m3 at St0 (KE1808), and the lowest at S06 (3.3 mg/m3). These were similar to the total zooplankton biomass values (Table 3). The biomass of siphonophores was the highest at S03, with a value of 34.3 mg/m3, and the lowest at St01, with a value of 2.1 mg/m3, except for St0 (KE1808), where no siphonophores were found.
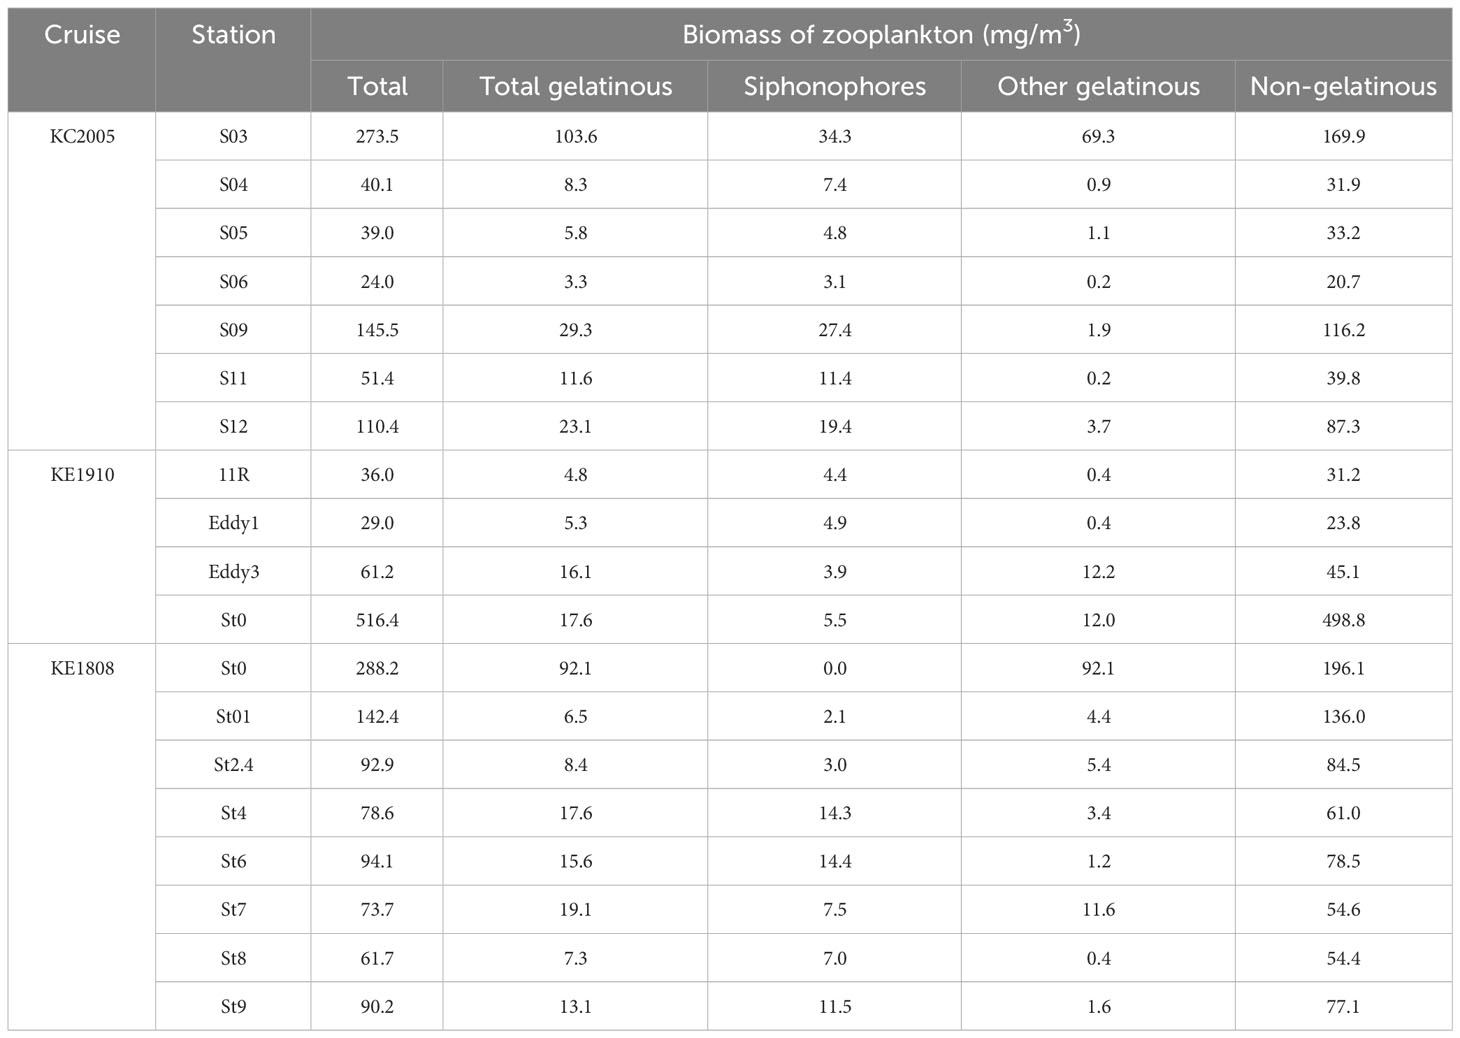
Table 3 Biomass of zooplankton based on wet weight at each sampling station.
The proportion of the biomass comprised by gelatinous zooplankton among the total zooplankton was 18.4% (3.4–37.9%) on average, it varied by station and among them, the value was particularly low at St0 (KE1910) and St01–St2.4 (3.4–9.1%) (Figure 7). The proportion of the biomass comprised by siphonophores among total zooplankton was 11.8% (0–22.2%) on average, it also varied by station and showed particularly low values at group B stations (St0 (KE1910), Eddy3, St0 (KE1808)–St2.4) (Figure 7). Among the total gelatinous zooplankton biomass, the proportion comprised by siphonophores was less than 40% (0.0–39.3%) in group B (St0 (KE1910), Eddy3, St0 (KE1808)–St2.4) and at some particular stations (S03, St7), but more than 80% at other stations (80.8–98.5%) (Figure 8). Boxplots comparing the biomasses of groups A and B showed that the total and gelatinous zooplankton values were higher in group B (Figures 9A, B). In contrast, the biomass of siphonophores was higher in group A than in group B (Figure 9C).
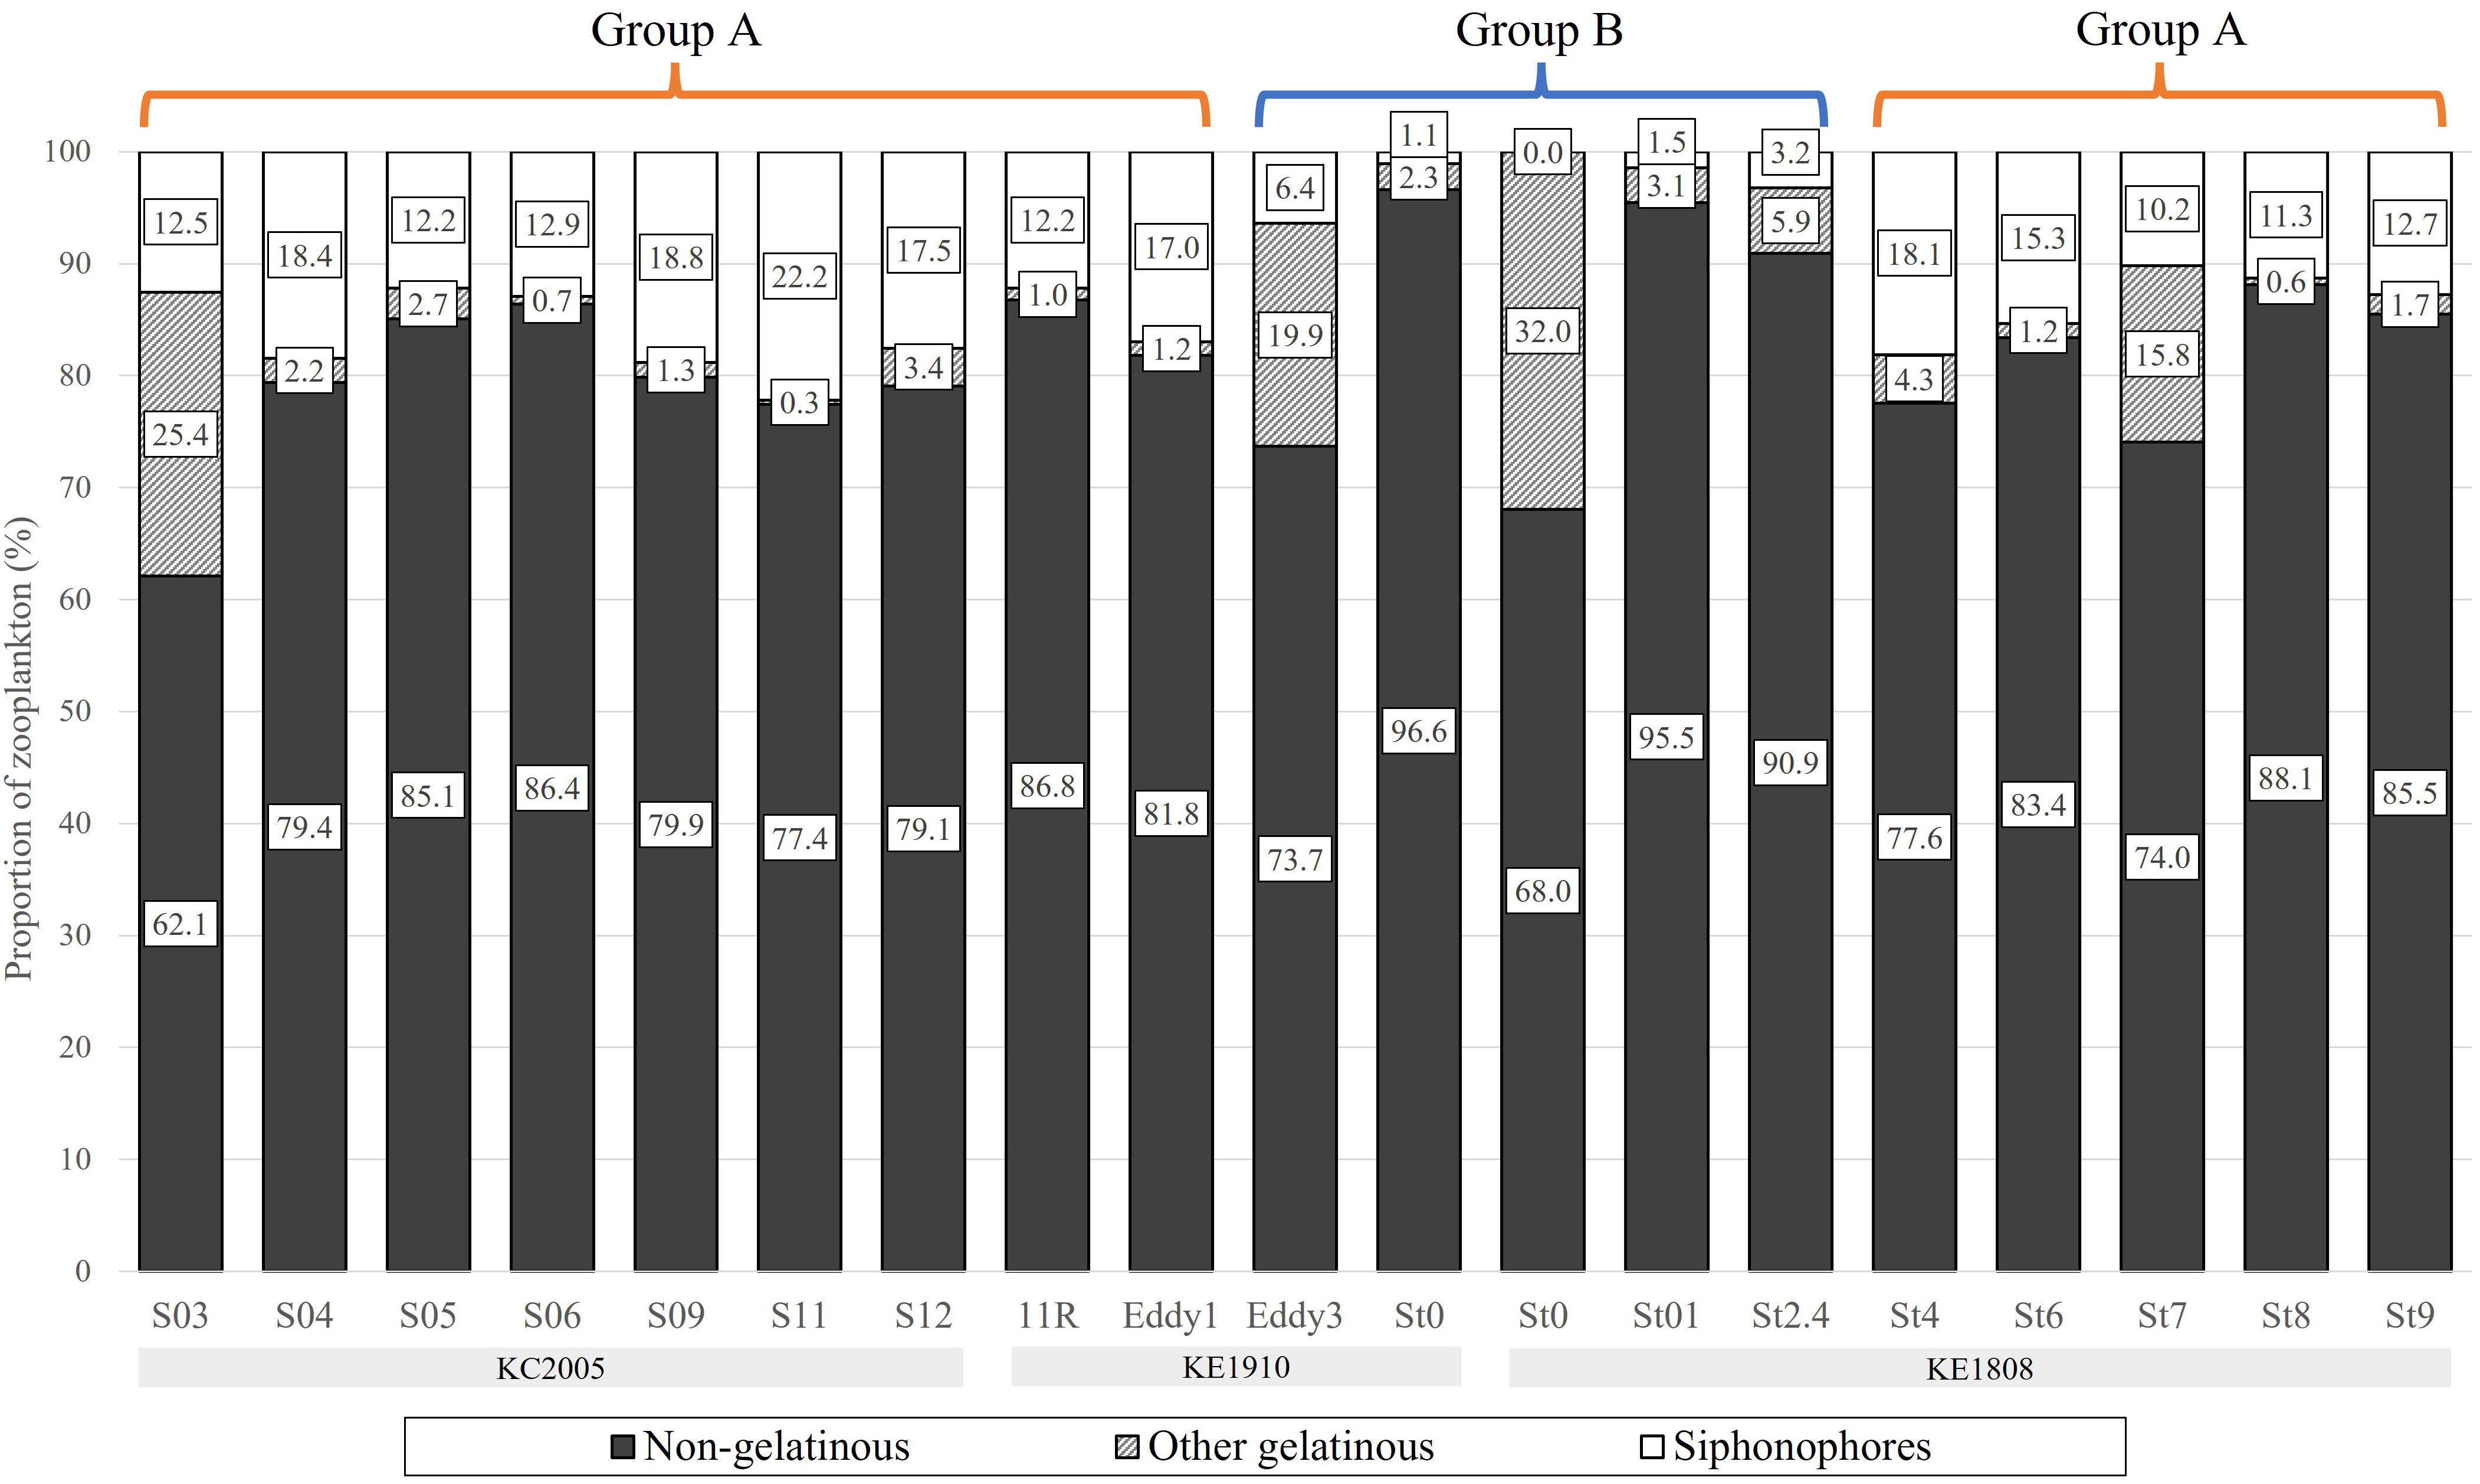
Figure 7 The proportion of zooplankton biomass at each sampling station.
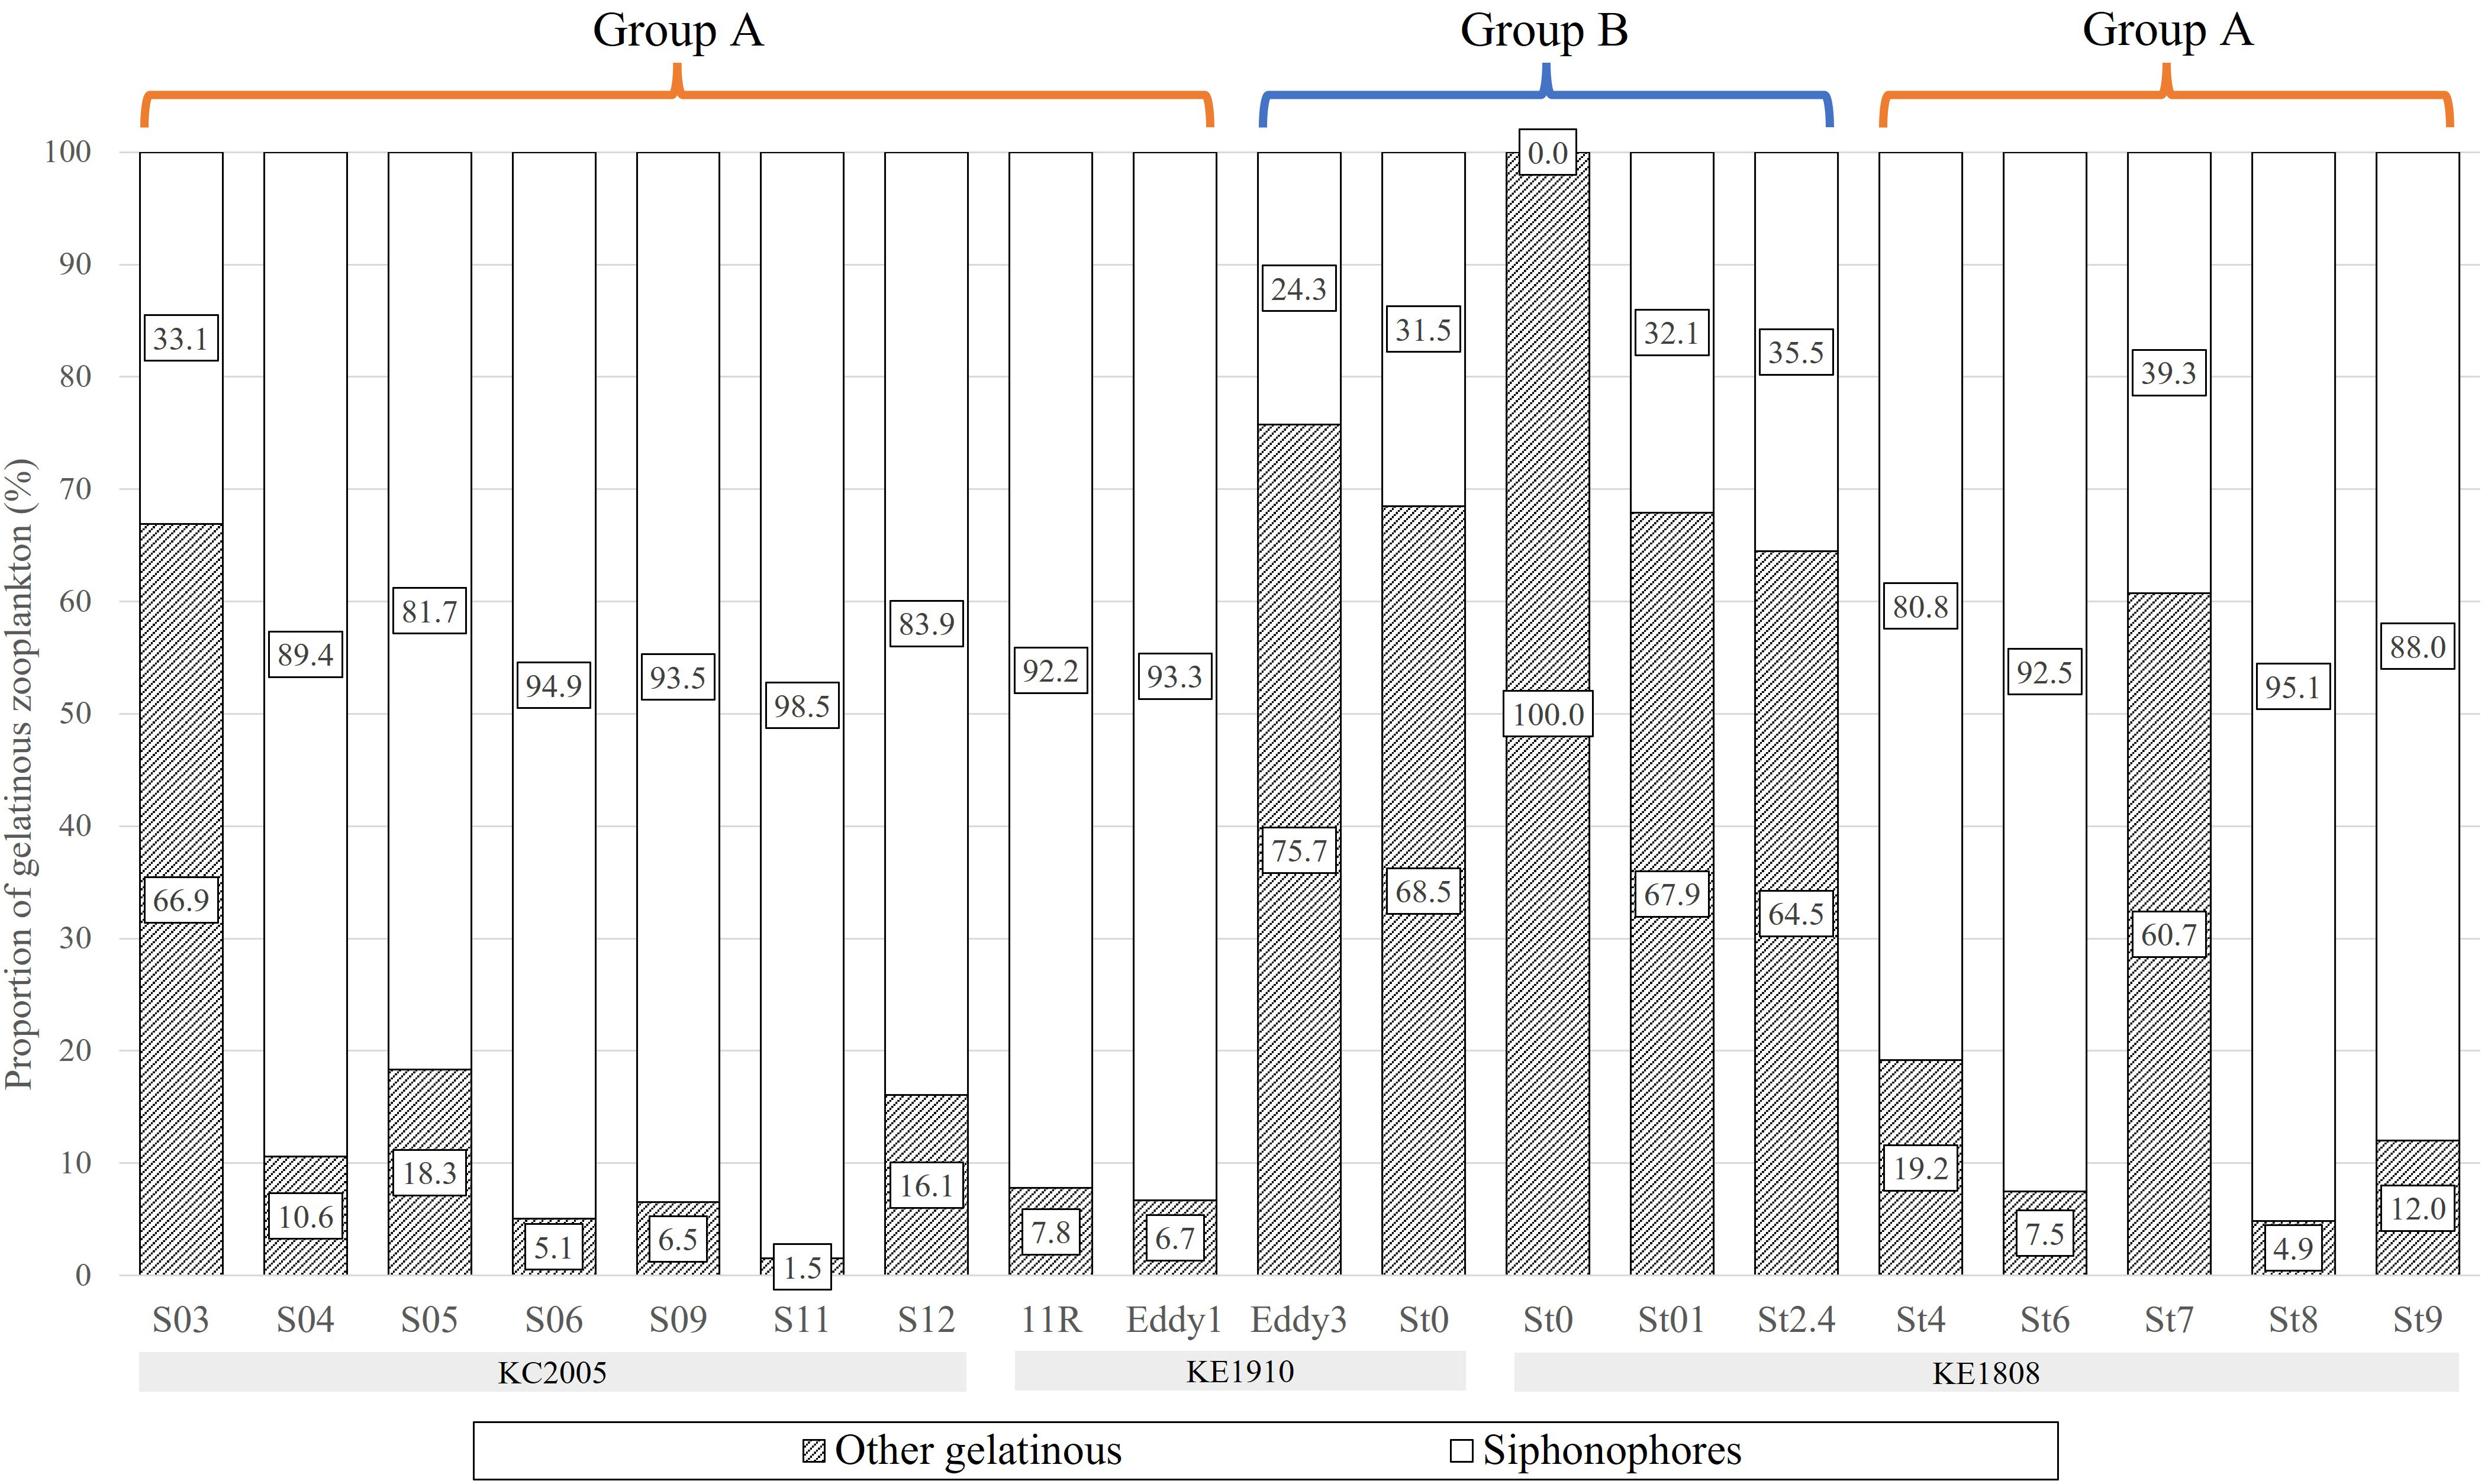
Figure 8 The proportion of gelatinous zooplankton biomass at each sampling station.
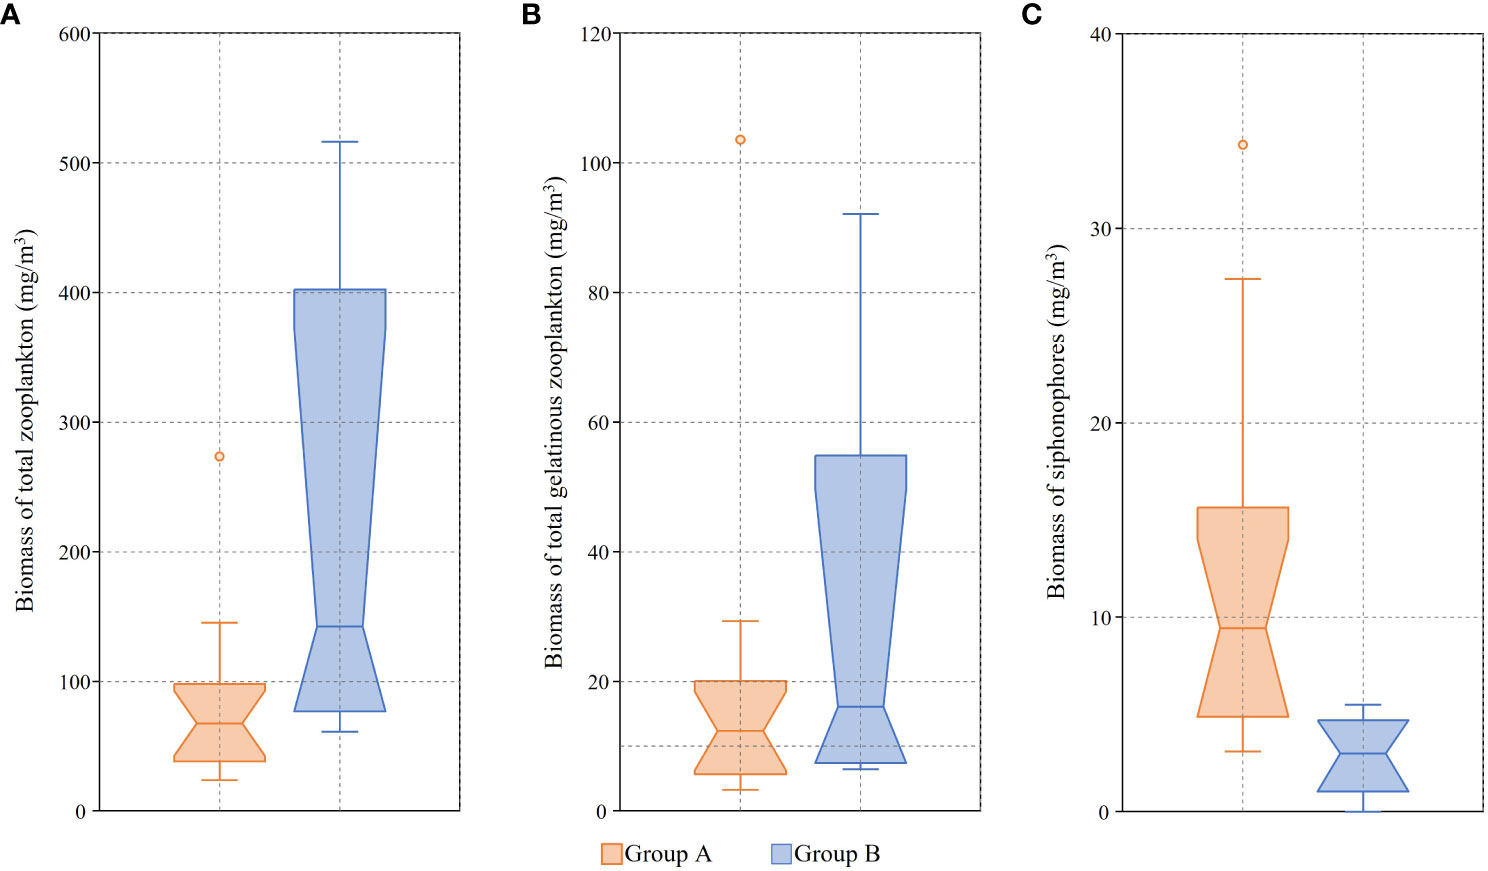
Figure 9 Boxplots of biomass based on water mass group. Notches indicate 95% confidence interval of the median. (A) Total zooplankton; (B) Total gelatinous zooplankton; (C) Siphonophores.
3.4 Stable isotope ratios of siphonophores, other gelatinous, and non-gelatinous zooplankton
Siphonophores showed a wide range of δ13CBulk (-24.1–-16.6‰) and δ15NBulk values (-0.9–8.8‰) (Figure 10, Supplementary table S2). Tunicates, including salps, doliolids, and pyrosomatids showed δ13CBulk and δ15NBulk distributions of -24.3–-20.2‰ and -0.9–8.2‰, respectively (Figure 10, Supplementary table S3). Chaetognaths also displayed a wide range of δ13CBulk (-20.9–-16.5‰) and δ15NBulk (3.7–10.8‰) values (Figure 10, Supplementary table S3). The δ13CBulk and δ15NBulk values of the non-gelatinous zooplankton largely overlapped with those of the gelatinous zooplankton, suggesting that their carbon and nitrogen sources were shared at each sampling station (Figure 10, Supplementary table S4). Such stable isotope trends were not closely related to the relative proportions of gelatinous to non-gelatinous zooplankton biomass (p > 0.05). The ranges of the δ13CBulk values at group B stations (-22.5–-19.0‰) were narrower than those at group A stations (-24.3–-16.5‰) (Figure 10A). The δ15NBulk values of both gelatinous and non-gelatinous zooplankton showed large spatial variation in this study (Figure 10B). These results are similar to those of previous isoscape studies conducted in the KC and KE areas (Ohshimo et al., 2019).
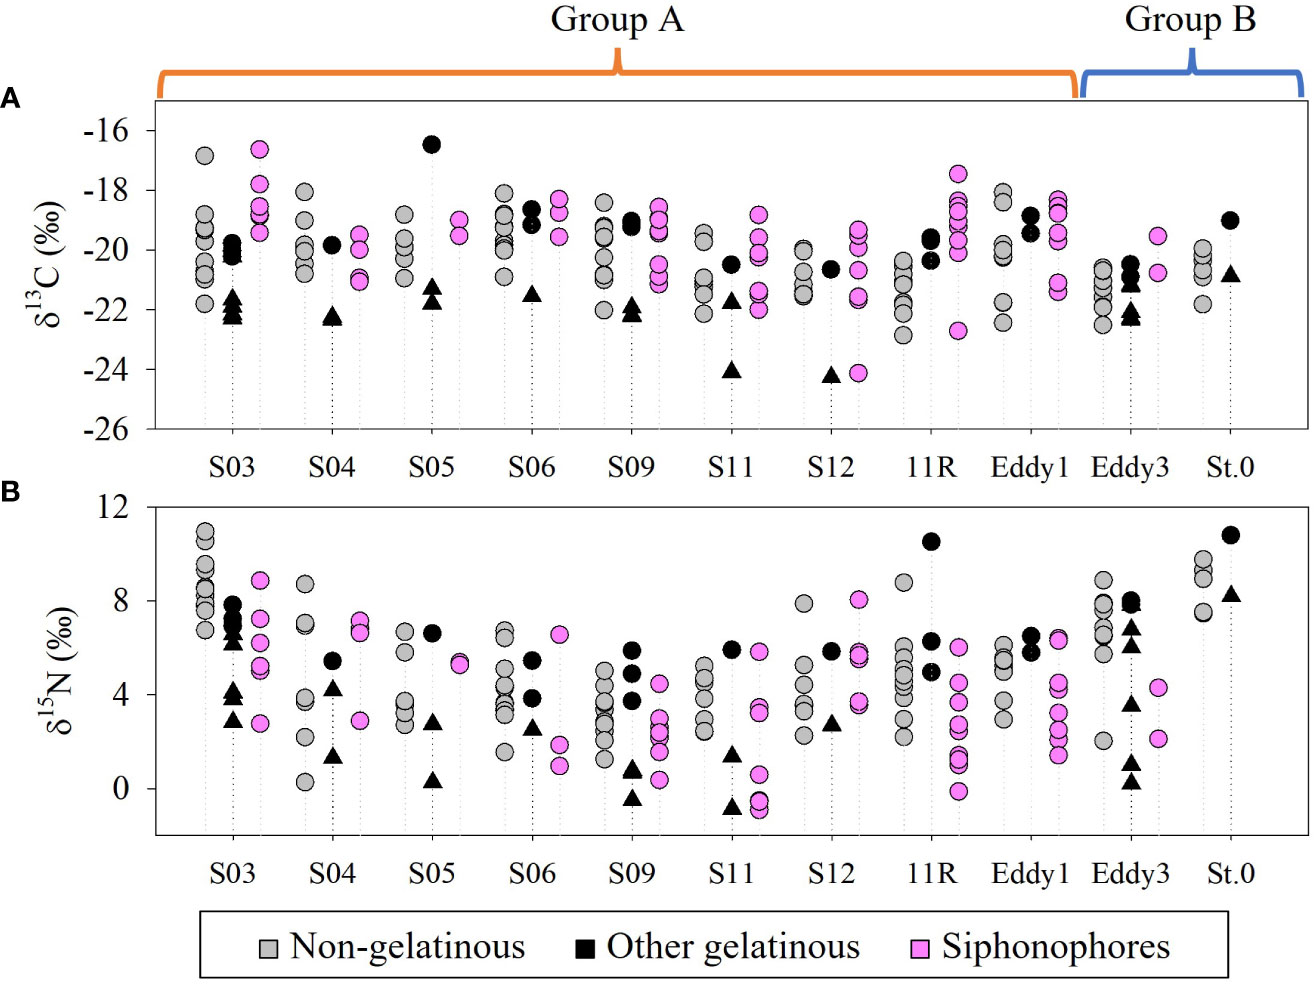
Figure 10 The δ13C (A) and δ15N values (B) of gelatinous and non-gelatinous zooplankton collected on the KC1910 and KC2005 cruises. Black circle: Chaetognaths, black triangle: Tunicates.
The nitrogen isotope ratios of phenylalanine (δ15NPhe) between gelatinous and non-gelatinous zooplankton (copepods, euphausiids, and amphipods) largely overlapped at S03, but partially or not for other stations (Figure 11A, Supplementary tables S5-7). In the region from 10°N to 30°N, the δ15NPhe values of zooplankton were close to 0‰, likely owing to the elevated N2 fixation rates and diazotroph abundances (Kitajima et al., 2009). In contrast, the δ15NPhe values likely increased (Figure 11A, Supplementary tables S5-7) based on the high nitrate availability in the KE (Lin et al., 2020). The TP values of siphonophores ranged from 2.4–3.2, lower than those in chaetognaths (2.8–3.4) (Figure 11B, Supplementary tables S5-6). These distributions of the TP values of siphonophores and chaetognaths (Supplementary tables S5-6) overlapped with those of the non-gelatinous zooplankton (2.4–3.5) (Supplementary table S7). Exceptionally, the tunicates showed the widest TP values according to taxa (Supplementary table S6). The TP values of the salps at S03 (1.8) were largely differentiated from those at Eddy3 (2.6–2.8). In contrast, the pyrosomatids (1.9–2.2) and doliolids (2.2–2.6) had unclear variation between the sampling stations.
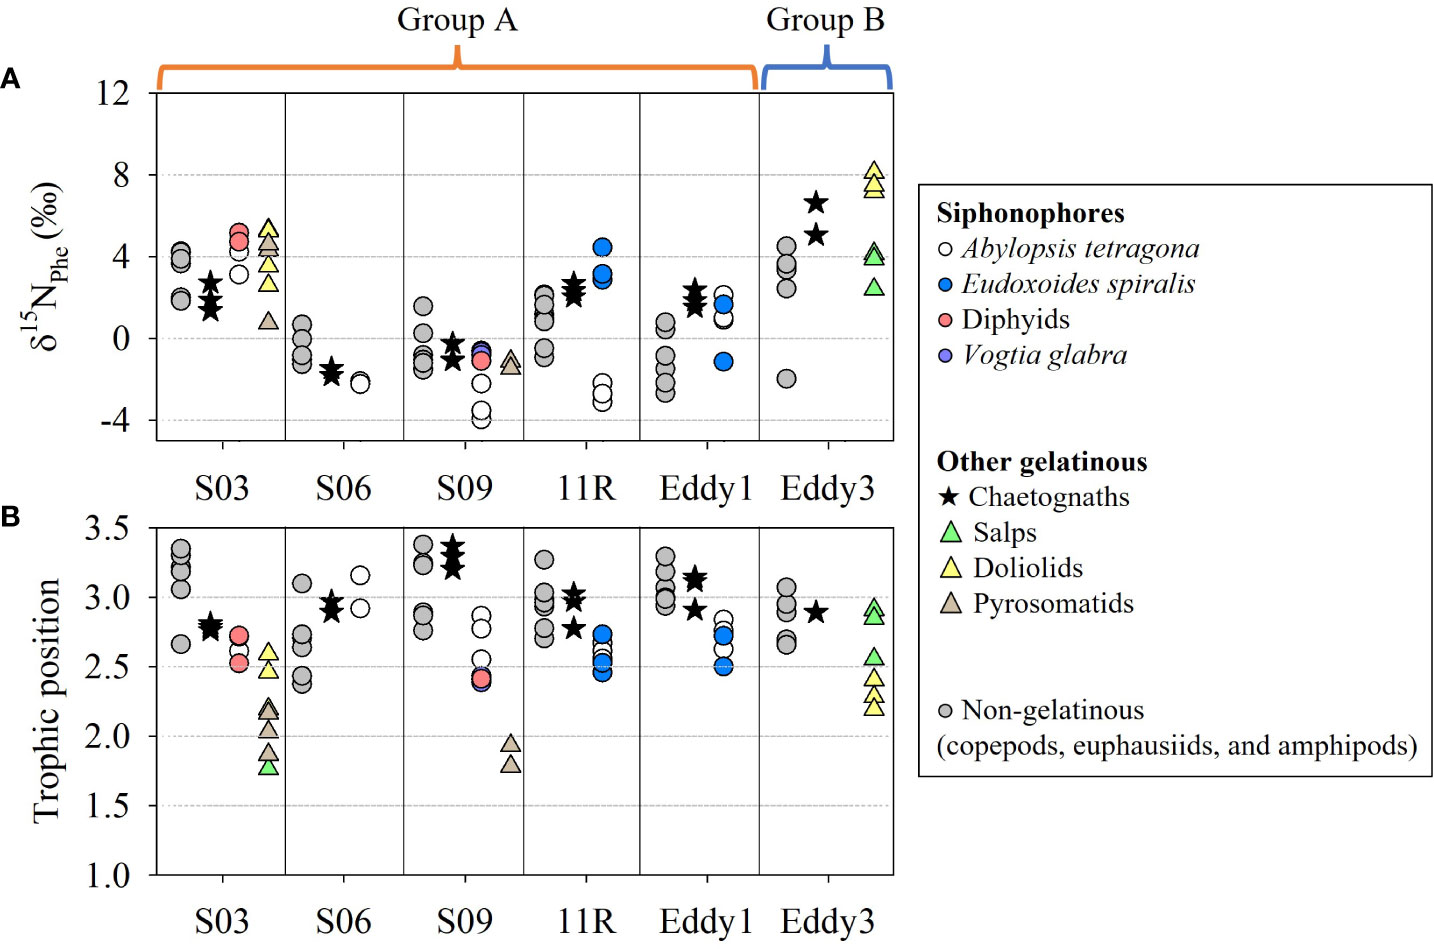
Figure 11 The δ15NPhe values (A) and trophic position (B) of gelatinous zooplankton collected on the KC1910 and KC2005 cruises. Non-gelatinous zooplankton includes copepods, euphausiids, and amphipods.
4 Discussion
4.1 Hydrology and siphonophore distribution
Various ocean currents, such as the KC, OC, STCC, and NEC, are mixed in the Northwest Pacific (Hu et al., 2015; Figure 1), and the sampling stations were divided into two groups based on the characteristics of the hydrological features. It is noteworthy that stations Eddy1 and Eddy3 comprised completely different water masses, even though they were located in the KE. In the case of cruise KE1808, the water mass was distinguished at St4 (38.2°N), which is located at relatively high latitudes, suggesting that there is annual and monthly variability in the expansion and relative strengths of the KC and OC (Yasuda, 2003). At St7, there was a rapid change to low temperature and salinity below 50 m water depth, which was also caused by eddies occurring at the KE (Ji et al., 2018).
The distribution of siphonophores differed significantly depending on the water mass group, and the results of hierarchical clustering (cophenetic correlation: 0.9292) and NMDS (stress value: 0.171) confirmed that they were divided into two groups, with the exception of St0 (KE1808), for which siphonophores were not recorded (Figures 4, 5). C. contorta, the species that made the highest contribution to distinguishing the cluster (10.44%), had a wide range of habitat temperatures and salinities and is known to be abundant mainly in tropical high temperature waters (Park and Lee, 2020; Table 2). In this study, this species was found only at group A stations at high temperatures. In contrast, D. arctica, which made the second highest contribution (8.06%), was mainly found at group B stations at low temperatures. D. arctica lives mainly in low temperature waters, such as those in the Antarctic and Arctic regions. Recently, it was found in Korean waters, the Atlantic Ocean, and other sites with relatively high temperatures, but it has been confirmed that the abundance and size of the specimens are larger in the Antarctic and Arctic (Park and Lee, 2022). Therefore, the habitat suitability of D. arctica was higher at low temperatures, suggesting that it was introduced to the low latitudes of the Northwest Pacific by the OC. Small-sized species, such as B. bassensis (8.04%), E. spiralis (7.97%), and others, are mainly found in warm waters (Park and Lee, 2020; Park and Lee, 2022), and had high occurrence rates at group A stations.
The CCA results revealed correlations between water temperature and salinity, zooplankton biomass, and major siphonophore species (Figure 6). Most of the species that had a high occurrence in group A stations, such as C. contorta, B. bassensis, and E. spiralis, showed a strong or weak positive correlation with water temperature and salinity, and D. arctica showed a strong negative correlation, which supports the previous suggestions. In addition, strong coupling was confirmed between the vectors of siphonophore biomass, temperature, and salinity. This suggests that the distribution and biomass of each siphonophore species are significantly affected by water temperature and salinity. In a previous study, Grossmann and Lindsay (2013) revealed a water mass-specific community structure within siphonophores in Sagami Bay, it is noteworthy that these findings in this study can suggest specific influencing factors (temperature and salinity) for a wider range of the Northwest Pacific. Among these 13 species, H. isabu was the only long-stemmed agalmatid. The exact number of nectophores constituting a colony of H. isabu is unknown. However, considering that colonies in other agalmatids and Halistemma Huxley, 1859 are composed of 20–30 or more nectophores, the colony size is expected to be larger than that of other major siphonophores consisting of only one or two nectophores (Totton and Bargmann, 1965). Large siphonophores have a wider radius of movement in the water mass than smaller siphonophores and are more affected by the water mass structure than by water temperature and salinity. This may explain the lack of significant correlation between H. isabu and environmental factors.
The species (other than H. isabu) with high contributions in the SIMPER test that also showed strong correlations with water temperature, salinity, and biomass (siphonophores or non-gelatinous zooplankton) belonged to the Calycophorae Leuckart, 1854. Among these, seven species belonged to the Diphyidae Quoy and Gaimard, 1827. This suggests that diphyids can be used as indicator species for currents and hydrological factors that influence water masses. However, this study focused on limited samples collected up to a depth of 200 m. As the vertical distribution range of siphonophores is wide, and their occurrence and abundance vary with depth (Grossmann and Lindsay, 2013), it is not possible to definitively conclude that these indicator species represent the entire water column. Therefore, further studies in the deep sea are necessary. Other gelatinous zooplankton vectors showed patterns different from those of the siphonophores, and there was no correlation between temperature and salinity. This suggests that other gelatinous zooplankton are less suitable as those indicator species. Considering that the vectors of other gelatinous zooplankton were shorter, it was deduced that they did not significantly affect the CCA loading of the species. Large species such as H. isabu (estimated to have more than 20 nectophores; Totton and Bargmann, 1965) and H. hippopus (12 or more nectophores; Totton and Bargmann, 1965) were loaded in the vector direction of the biomass of other gelatinous zooplankton. Although it is difficult to determine a strong correlation owing to the short vector length, this suggests the possibility that the large size of these species is advantageous for spatial competition with other gelatinous zooplankton species.
4.2 Biomass of siphonophores within zooplankton communities
Gelatinous zooplankton are mainly composed of water, therefore, so their importance can be devalued if their biomass is measured using their dry weight. Therefore, wet weight values were used in this study. The biomass values of total zooplankton, shown in Table 3, increased from low to high latitudes, which is consistent with the results of previous studies (Lee et al., 2011; Choi et al., 2012; Kitamura et al., 2013). The biomasses of total and gelatinous zooplankton were higher in group B than in group A (Figure 9A, B), but the biomass of siphonophores was higher in group A than in group B (Figure 9C). This is also supported by the fact that temperature and salinity were strongly coupled with the biomass of siphonophores, whereas the biomass of non-gelatinous zooplankton showed the opposite pattern (Figure 6). The lower siphonophore biomass at the group B stations may be attributed to the prevalence of small-sized siphonophores. In contrast, group A stations showed high siphonophore biomass, which could be ascribed to the frequent occurrence of large-colony species (H. isabu and H. hippopus). This result is consistent with the proportion of biomass comprised by siphonophores in the total zooplankton and gelatinous zooplankton (Figures 7, 8). As shown in Figure 6, the diversity and abundance of siphonophores increased at stations with high water temperature and salinity values. The fact that the siphonophore biomass had a high absolute value and proportion at group A stations, where the total zooplankton biomass was low, suggests that the role of siphonophores in group A can be significant, especially in terms of predatory pressure on non-gelatinous plankton. As an exception, among the gelatinous zooplankton, the proportion of biomass comprised by siphonophores at S03 and St7 was as low as that at the group B stations, and several tunicates were found at these two stations. Although the proportion was lower, there was no significant change in the absolute value of the biomass of the siphonophores, the situation was similar at Eddy3, where many tunicates occurred. This contrasts with the findings of previous studies showing that salp blooms reduce the biomass of other zooplankton (Kang et al., 2000; Kang et al., 2019). Therefore, consistent with the results shown in Figure 6, no significant correlation was observed between siphonophores and other gelatinous zooplankton. However, it is noteworthy that siphonophores did not occur at St0 (KE1808), where Nemopilema nomurai Kishinouye, 1922 was found, and it is also valuable to study the correlation between other gelatinous zooplankton and siphonophores. In particular, tunicates were the second largest contributing group to the biomass of total gelatinous zooplankton and occurred at most stations (except for St0 (KE1910), St0 (KE1808)–St01). In addition, the holoplanktonic colonial life history of siphonophores is more similar to that of pelagic tunicates, such as salps, than to that of other medusozoan jellyfish, such as scyphozoans. Nevertheless, siphonophores and tunicates can coexist in the same water mass without affecting each other. A likely reason for this is that the two taxa have different trophic levels and do not compete for the same food sources.
4.3 Feeding ecology of gelatinous zooplankton
The δ13CBulk and δ15NBulk values of siphonophore species were mostly distinct from those of tunicate species, but overlapped with those of chaetognaths and non-gelatinous zooplankton (Figure 10A, Supplementary tables S2-4). Given the similarities in the carnivorous feeding habits of siphonophores and other non-tunicate zooplankton (Chi et al., 2021), we hypothesized that similarities in their diets drive the observed overlap in their isotopic values. In this study, the TP values of siphonophores (2.4–3.2), chaetognaths (2.8–3.4), and non-gelatinous zooplankton (2.4–3.5) also overlapped, indicating that some of their diet could be partially shared in the same space (Figure 11B, Supplementary tables S5-7). These TP values can be used to track the diverse feeding guilds of gelatinous zooplankton in planktonic food webs. For example, siphonophores generally capture small zooplankton using their tentacles, and some species attract prey using nematocyst batteries that mimic copepods and fish larvae (Purcell, 1980). Meanwhile, our dataset showed that interspecies differences in the TP values were unclear. The size of the colony depends on the species. A. tetragona, E. spiralis, and diphyids form small colonies (one or two nectophores) (Totton and Bargmann, 1965) whereas Vogtia glabra Bigelow, 1918 forms large colonies (12 or more nectophores) (Totton and Bargmann, 1965). Siphonophore species, characterized by small colonies, actively capture small arthropods or large copepods using their tentacles (Purcell, 1981). In contrast, siphonophores characterized by large colonies generally employ a more passive strategy to extend a web of tentacles to ensnare their prey (Mackie et al., 1987; Robison, 2004). Certain siphonophores exhibit selective feeding behavior, with hippopodiids preferring to consume ostracods, whereas calycophoran siphonophores mainly prefer copepods (Purcell, 1981; Pugh, 1991). Nevertheless, their TP ranges were not characterized according to colony size in our results and could mainly reflect their species-specific feeding ecology, as discussed in a previous study (Damian-Serrano et al., 2021). In contrast, tunicates consume phytoplankton-based particles via filter-feeding (Henschke et al., 2016; Stukel et al., 2020). Thus, the δ15NBulk values of tunicates were lower than those of other predators such as chaetognaths. Tunicate taxa have been characterized according to body size, filterable diet size, and geographic distribution (Henschke et al., 2016). The TP values of pyrosomatids (1.9–2.2) and doliolids (2.2–2.6) suggested that their diet composition was apparently different within the tunicates (Figure 11B, Supplementary table S6). In particular, salps had spatially variable TP values, ranging from 1.8 in S03 to 2.9 in Eddy3 (Figure 11B, Supplementary table S6). The former value (1.8) was similar to that reported in a previous study (Doherty et al., 2021) but the latter value (2.6–2.9) was similar to the TP value of omnivores or carnivores. The likely reason for this is that large salp individuals are less capable of feeding on small particles (Stukel et al., 2021). Additionally, the wide range of TP values in this study could be attributed to the wide range of filterable diet sizes (<1 μm–1 mm) for salps. Because not all specimens could be identified to the species level, the species-specific resolution of the filter feeding of the salp species is unknown. Nevertheless, the trophic flexibility of salps compared to that of the other two taxa (doliolids and pyrosomatids) suggests that interspecies differences in filter feeding exist within tunicates. These findings confirm that siphonophores and tunicates have different trophic levels and may not compete for the same food source. This suggests that the two taxa could coexist in the same water mass without affecting each other, despite having similar life histories (non-polyp and colonial life). In contrast, siphonophores potentially compete for food sources with chaetognaths or non-gelatinous zooplankton in their habitats and likely affect their occurrence. This is inferred as an additional reason that the biomass of siphonophores shown in Figure 6 had no significant correlation with that of the other gelatinous zooplankton (the biomass consisted mostly of tunicates, and chaetognaths made little contribution) and contrasted with that of the non-gelatinous zooplankton.
4.4 Implications
Currently, the KC is expanding owing to global warming (Zhang et al., 2020), therefore, the diversity and abundance of siphonophores in the Northwest Pacific will change in the future. Based on the results of this study, such changes in the geographical distribution of siphonophores should collide with the feeding activity of non-gelatinous zooplankton. The size and ecological characteristics of siphonophores vary significantly according to species, therefore, systematic responses and the monitoring of siphonophore blooms are required. In addition, a multilateral approach, including studies that reveal spatiotemporal variations in the distribution of siphonophores or determine food web structures with higher resolution, is also required. If long-term data are accumulated, it would help understand how siphonophore communities respond to changes in water masses and affect the ecosystem, which can provide insight into the global marine environment and climate change.
5 Conclusion
In this study, hydrological, zooplankton biomass, trophic niche, and siphonophore composition data were obtained from 2018–2020 to understand the correlation between the distribution of siphonophores and environmental conditions in the Northwest Pacific. As a result, the distribution and biomass of siphonophores were clearly distinguished according to the KC- and OC-dominant water masses. We suggest that some siphonophores that make high contributions to each water mass group and show strong positive or negative correlations with environmental factors could serve as indicator species for water masses. The occurrence of siphonophores was negatively correlated with that of other zooplankton, which could be interpreted based on their ecological niche. The stable isotope signature of siphonophores showed similar diet contents to non-gelatinous zooplankton in the same space. The predatory activity of the siphonophores was also confirmed through the TP estimated by the nitrogen isotope ratio of individual AAs, which overlapped with the ranges of TPs in chaetognaths and non-gelatinous zooplankton (copepods, euphausiids, and amphipods). In contrast, the TPs of the tunicates were separate from those of the siphonophores, and there was no correlation between the biomasses of the siphonophores and that of other gelatinous zooplankton.
Considering that the occurrence and biomass of most siphonophores are positively correlated with water temperature and salinity, we anticipate a continued increase in the abundance and biodiversity of siphonophores in the Northwest Pacific owing to the predicted rise in temperature and salinity attributed to the strengthening of the KC (Zhang et al., 2020). This study will help in understanding the Northwest Pacific and siphonophores. These findings facilitate the evaluation of the currents and hydrological factors that influence water masses using siphonophores, and to forecast how the distribution of siphonophores will respond depending on changes in their environment.
Data availability statement
The original contributions presented in the study are included in the article/Supplementary Material. Further inquiries can be directed to the corresponding author.
Ethics statement
The manuscript presents research on animals that do not require ethical approval for their study.
Author contributions
All authors contributed to the conception and design of this study. NP collected the samples and performed most of the experiments. HC analyzed the stable isotopes and calculated the trophic positions. NP wrote the original draft with support from HC. K-HS and WL contributed to interpretation of the results. All authors contributed to the article and approved the submitted version.
Funding
This research was supported by the Research Program for the carbon cycle between oceans, land, and atmosphere of the National Research Foundation (NRF) funded by the Ministry of Science and ICT (2022M3I6A1085990); Basic Science Research Program through the NRF funded by the Ministry of Education (2021R1I1A2043807); Korea Institute of Marine Science & Technology (KIMST) funded by the Ministry of Oceans and Fisheries (RS-2023-00238486, Monitoring environmental and ecological changes in dynamic coasts and estuaries of the Korean four major rivers; RS-2023-00256330, Development of risk managing technology tackling ocean and fisheries crisis around Korean Peninsula by Kuroshio Current).
Acknowledgments
We would like to express our sincere gratitude to the crew of the R/V ISABU and members of the Marine Ecosystem and Biological Research Center, Korea Institute of Ocean Science and Technology (KIOST) for their help during the sampling process. We are also grateful to the reviewers and the editor for their detailed and constructive comments on this manuscript.
Conflict of interest
The authors declare that the research was conducted in the absence of any commercial or financial relationships that could be construed as a potential conflict of interest.
Publisher’s note
All claims expressed in this article are solely those of the authors and do not necessarily represent those of their affiliated organizations, or those of the publisher, the editors and the reviewers. Any product that may be evaluated in this article, or claim that may be made by its manufacturer, is not guaranteed or endorsed by the publisher.
Supplementary material
The Supplementary Material for this article can be found online at: https://www.frontiersin.org/articles/10.3389/fmars.2023.1223477/full#supplementary-material
References
Bray J. R., Curtis J. T. (1957). An ordination of the upland forest communities of southern Wisconsin. Ecol. Monogr. 27 (4), 326–349. doi: 10.2307/1942268
Campos C., Garcia T., Neumann-Leitão S., Soares M. (2017). Ecological indicators and functional groups of copepod assemblages. Ecol. Indic. 83, 416–426. doi: 10.1016/j.ecolind.2017.08.018
Chi X., Dierking J., Hoving H. J., Lüskow F., Denda A., Christiansen B., et al. (2021). Tackling the jelly web: Trophic ecology of gelatinous zooplankton in oceanic food webs of the eastern tropical Atlantic assessed by stable isotope analysis. Limnol. Oceanography 66 (2), 289–305. doi: 10.1002/lno.11605
Chiba S., Aita M. N., Tadokoro K., Saino T., Sugisaki H., Nakata K. (2008). From climate regime shifts to lower-trophic level phenology: synthesis of recent progress in retrospective studies of the western North Pacific. Prog. Oceanography 77 (2-3), 112–126. doi: 10.1016/j.pocean.2008.03.004
Chikaraishi Y., Ogawa N. O., Kashiyama Y., Takano Y., Suga H., Tomitani A., et al. (2009). Determination of aquatic food-web structure based on compound-specific nitrogen isotopic composition of amino acids. Limnol. Oceanography: Methods 7 (11), 740–750. doi: 10.4319/lom.2009.7.740
Choi B., Ha S. Y., Lee J. S., Chikaraishi Y., Ohkouchi N., Shin K. H. (2017). Trophic interaction among organisms in a seagrass meadow ecosystem as revealed by bulk δ13C and amino acid δ15N analyses. Limnol. Oceanography 62 (4), 1426–1435. doi: 10.1002/lno.10508
Choi J. H., Kim D.-J., Soh H. Y. (2020). Environmental factors affecting neustonic zooplankton in the southwestern area of Korea in summer. Korean J. Environ. Biol. 38 (3), 461–475. doi: 10.11626/KJEB.2020.38.3.461
Choi K. H., Lee C.-R., Noh J. H., Choi D. H., Yang E. J., Kang H.-K. (2012). Biomass and trophic structure of the plankton community in subtropical and temperate waters of the northwestern Pacific Ocean. J. Oceanography 68, 473–482. doi: 10.1007/s10872-012-0111-2
Choi H., Won H., Kim J. H., Yang E. J., Cho K. H., Lee Y., et al. (2021). Trophic dynamics of Calanus hyperboreus in the Pacific Arctic Ocean. J. Geophysical Res.: Oceans 126 (3), e2020JC017063. doi: 10.1029/2020JC017063
Clarke K. (1993). Non-parametric multivariate analyses of changes in community structure. Aust. J. Ecol. 18 (1), 117–143. doi: 10.1111/j.1442-9993.1993.tb00438.x
Clarke K., Gorley R. (2006). PRIMER v. 6: User Manual/Tutorial (England: PRIMER-E Ltd: Plymouth Marine Laboratory).
Clarke K., Warwick R. (2001). Change in marine communities: an approach to statistical analysis and interpretation (UK: PRIMER-E Ltd: Plymouth Marine Laboratory).
Damian-Serrano A., Haddock S. H., Dunn C. W. (2021). The evolution of siphonophore tentilla for specialized prey capture in the open ocean. Proc. Natl. Acad. Sci. 118 (8), e2005063118. doi: 10.1073/pnas.2005063118
Damian-Serrano A., Hetherington E. D., Choy C. A., Haddock S. H., Lapides A., Dunn C. W. (2022). Characterizing the secret diets of siphonophores (Cnidaria: Hydrozoa) using DNA metabarcoding. PloS One 17 (5), e0267761. doi: 10.1371/journal.pone.0267761
Décima M., Landry M. R., Popp B. N. (2013). Environmental perturbation effects on baseline δ15N values and zooplankton trophic flexibility in the southern California Current Ecosystem. Limnol. Oceanography 58 (2), 624–634. doi: 10.4319/lo.2013.58.2.0624
de Oliveira Dias C., Menezes B. S., Araujo A. V., Bonecker S. L. C. (2023). Copepod assemblage structure in a tropical eutrophic estuarine system in the Southwestern Atlantic Ocean: Ecological indicators and functional groups. Regional Stud. Mar. Sci. 63, 103014. doi: 10.1016/j.rsma.2023.103014
Doherty S. C., Maas A. E., Steinberg D. K., Popp B. N., Close H. G. (2021). Distinguishing zooplankton fecal pellets as a component of the biological pump using compound-specific isotope analysis of amino acids. Limnol. Oceanography 66 (7), 2827–2841. doi: 10.1002/lno.11793
Fleming N. E., Houghton J. D., Magill C. L., Harrod C. (2011). Preservation methods alter stable isotope values in gelatinous zooplankton: implications for interpreting trophic ecology. Mar. Biol. 158, 2141–2146. doi: 10.1007/s00227-011-1714-7
Grossmann M. M., Lindsay D. J. (2013). Diversity and distribution of the Siphonophora (Cnidaria) in Sagami Bay, Japan, and their association with tropical and subarctic water masses. J. Oceanography 69 (4), 395–411. doi: 10.1007/s10872-013-0181-9
Hammer W. M. (1975). Underwater observations of blue-water plankton: Logistics, techniques, and safety procedures for divers at sea. Limnol. Oceanography 20 (6), 1045–1051. doi: 10.4319/lo.1975.20.6.1045
Hammer Ø., Harper D. A., Ryan P. D. (2001). Past: paleontological statistics software package for educaton and data anlysis. Palaeontol. Electronica 4 (1), 1–9.
Hays G. C., Doyle T. K., Houghton J. D. (2018). A paradigm shift in the trophic importance of jellyfish? Trends Ecol. Evol. 33 (11), 874–884. doi: 10.1016/j.tree.2018.09.001
Henschke N., Everett J. D., Richardson A. J., Suthers I. M. (2016). Rethinking the role of salps in the ocean. Trends Ecol. Evol. 31 (9), 720–733. doi: 10.1016/j.tree.2016.06.007
Holst S. (2012). Effects of climate warming on strobilation and ephyra production of North Sea scyphozoan jellyfish. Hydrobiologia 690, 127–140. doi: 10.1007/s10750-012-1043-y
Horikawa K., Kodaira T., Zhang J., Murayama M. (2015). δ18Osw estimate for Globigerinoides ruber from core-top sediments in the East China Sea. Prog. Earth Planetary Sci. 2 (1), 1–20. doi: 10.1186/s40645-015-0048-3
Hu D., Wu L., Cai W., Gupta A. S., Ganachaud A., Qiu B., et al. (2015). Pacific western boundary currents and their roles in climate. Nature 522 (7556), 299–308. doi: 10.1038/nature14504
Hwang J.-S., Souissi S., Tseng L.-C., Seuront L., Schmitt F. G., Fang L.-S., et al. (2006). A 5-year study of the influence of the northeast and southwest monsoons on copepod assemblages in the boundary coastal waters between the East China Sea and the Taiwan Strait. J. Plankton Res. 28 (10), 943–958. doi: 10.1093/plankt/fbl031
Hwang J.-S., Wong C. K. (2005). The China Coastal Current as a driving force for transporting Calanus sinicus (Copepoda: Calanoida) from its population centers to waters off Taiwan and Hong Kong during the winter northeast monsoon period. J. Plankton Res. 27 (2), 205–210. doi: 10.1093/plankt/fbh162
Jaffré T., Rigault F., Munzinger J. (2008). Identification and characterization of floristic groups in dry forests relicts of a West Coast region of New Caledonia. Pacific Conserv. Biol. 14 (2), 128–145. doi: 10.1071/PC080128
Ji J., Dong C., Zhang B., Liu Y., Zou B., King G. P., et al. (2018). Oceanic eddy characteristics and generation mechanisms in the Kuroshio Extension region. J. Geophysical Res.: Oceans 123 (11), 8548–8567. doi: 10.1029/2018JC014196
Kang Y.-S., Jo Y.-J., Go W.-J., Kim S.-S., Jeon K.-A., Oh H.-J. (2000). Swarm of salps (Tunicata: Thaliaca) and its impact on marine ecosystem in the south sea of Korea. Sea: J. Korean Soc. Oceanography 5 (1), 47–58.
Kang H.-K., Kim G., Kang J.-H., Kim M., Noh J. H. (2019). Mass occurrence of the salp Salpa fusiformis during spring 2017 in the southern waters of Korea and the northern East China Sea. Ocean Polar Res. 41 (3), 135–145. doi: 10.4217/OPR.2019.41.3.135
Kirkpatrick P., Pugh P. (1984). Siphonophores and velellids: keys and notes for the identification of the species (Leiden, The Netherlands: Brill Archive).
Kitajima S., Furuya K., Hashihama F., Takeda S., Kanda J. (2009). Latitudinal distribution of diazotrophs and their nitrogen fixation in the tropical and subtropical western North Pacific. Limnol. Oceanography 54 (2), 537–547. doi: 10.4319/lo.2009.54.2.0537
Kitamura M., Kumamoto Y., Kawakami H., Cruz E., Fujikura K. (2013). Horizontal distribution of Fukushima-derived radiocesium in zooplankton in the northwestern Pacific Ocean. Biogeosciences 10 (8), 5729–5738. doi: 10.5194/bg-10-5729-2013
Kobari T., Moku M., Takahashi K. (2008). Seasonal appearance of expatriated boreal copepods in the Oyashio–Kuroshio mixed region. ICES J. Mar. Sci. 65 (3), 469–476. doi: 10.1093/icesjms/fsm194
Komatsu T., Sugimoto T., Ishida K. I., Itaya K., Mishra P., Miura T. (2002). Importance of the Shatsky Rise Area in the Kuroshio Extension as an offshore nursery ground for Japanese anchovy (Engraulis japonicus) and sardine (Sardinops melanostictus). Fish. Oceanography 11 (6), 354–360. doi: 10.1046/j.1365-2419.2002.00218.x
Lee C.-R., Kang H.-K., Choi K.-H. (2011). Latitudinal distribution of mesozooplankton community in the Northwestern Pacific Ocean. Ocean Polar Res. 33 (spc3), 337–347. doi: 10.4217/OPR.2011.33.3.337
Lee Y., Min J.-O., Yang E. J., Cho K.-H., Jung J., Park J., et al. (2019). Influence of sea ice concentration on phytoplankton community structure in the Chukchi and East Siberian Seas, Pacific Arctic Ocean. Deep Sea Res. Part I.: Oceanographic Res. Papers 147, 54–64. doi: 10.1016/j.dsr.2019.04.001
Lin P., Ma J., Chai F., Xiu P., Liu H. (2020). Decadal variability of nutrients and biomass in the southern region of Kuroshio Extension. Prog. Oceanography 188, 102441. doi: 10.1016/j.pocean.2020.102441
Loick-Wilde N., Fernández-Urruzola I., Eglite E., Liskow I., Nausch M., Schulz-Bull D., et al. (2019). Stratification, nitrogen fixation, and cyanobacterial bloom stage regulate the planktonic food web structure. Global Change Biol. 25 (3), 794–810. doi: 10.1111/gcb.14546
Mackie G., Pugh P., Purcell J. (1987). Siphonophore biology. Advances in Marine biology 24, 97–262. doi: 10.1016/S0065-2881(08)60074-7
Madin L., Harbison G. (2001). Gelatinous zooplankton. Encyclopedia Ocean Sci., 1120–1130. doi: 10.1006/rwos.2001.0198
Mapstone G. M. (2009). Siphonophora (Cnidaria, Hydrozoa) of Canadian Pacific waters (Ottawa, Canada: NRC Research Press).
McMahon K. W., McCarthy M. D. (2016). Embracing variability in amino acid δ15N fractionation: mechanisms, implications, and applications for trophic ecology. Ecosphere 7 (12), e01511. doi: 10.1002/ecs2.1511
Minagawa M., Wada E. (1984). Stepwise enrichment of 15N along food chains: further evidence and the relation between δ15N and animal age. Geochim. Cosmochim. Acta 48 (5), 1135–1140. doi: 10.1016/0016-7037(84)90204-7
Morita H., Toyokawa M., Hidaka K., Nishimoto A., Sugisaki H., Kikuchi T. (2017). Spatio-temporal structure of the jellyfish community in the transition zone of cold and warm currents in the northwest Pacific. Plankton Benthos Res. 12 (4), 266–284. doi: 10.3800/pbr.12.266
Nishiyama E. Y., Araujo E. M., Oliveira O. M. (2016). Species of Lensia (Cnidaria: Hydrozoa: Siphonophorae) from southeastern Brazilian waters. Zoologia 33 (6), 1–14. doi: 10.1590/s1984-4689zool-20160030
Ohshimo S., Madigan D. J., Kodama T., Tanaka H., Komoto K., Suyama S., et al. (2019). Isoscapes reveal patterns of δ13C and δ15N of pelagic forage fish and squid in the Northwest Pacific Ocean. Prog. Oceanography 175, 124–138. doi: 10.1016/j.pocean.2019.04.003
Palma S., Retamal M. C., Silva N., Silva C. (2014). Horizontal and vertical distributions of siphonophores in relation to oceanographic conditions in Chilean Patagonian fjords. Sci. Marina 78 (3), 339–351. doi: 10.3989/scimar.03966.04B
Park N., Lee W. (2020). Four new records of family Diphyidae (Hydrozoa: Siphonophorae) in Korean waters. J. Species Res. 9 (2), 131–146. doi: 10.12651/JSR.2020.9.2.131
Park N., Lee W. (2022). Eight new records of siphonophores (Cnidaria: hydrozoa) in Korean waters. Diversity 14 (6), 494. doi: 10.3390/d14060494
Post D. M. (2002). Using stable isotopes to estimate trophic position: models, methods, and assumptions. Ecology 83 (3), 703–718. doi: 10.1890/0012-9658(2002)083[0703:USITET]2.0.CO;2
Pugh P. (1991). Co-occurrence of hippopodiid siphonophores and their potential prey. Hydrobiologia 216, 327–334. doi: 10.1007/BF00026482
Pugh P., Baxter E. (2014). A review of the physonect siphonophore genera Halistemma (Family Agalmatidae) and Stephanomia (Family Stephanomiidae). Zootaxa 3897 (1), 1–111. doi: 10.11646/zootaxa.3897.1.1
Purcell J. E. (1980). Influence of siphonophore behavior upon their natural diets: evidence for aggressive mimicry. Science 209 (4460), 1045–1047. doi: 10.1126/science.209.4460.1045
Purcell J. E. (1981). Dietary composition and diel feeding patterns of epipelagic siphonophores. Mar. Biol. 65 (1), 83–90. doi: 10.1007/BF00397071
Purcell J. E. (2005). Climate effects on formation of jellyfish and ctenophore blooms: a review. J. Mar. Biol. Assoc. United Kingdom 85 (3), 461–476. doi: 10.1017/S0025315405011409
Qiu B. (2001). Kuroshio and oyashio currents. Ocean Currents: Derivative Encyclopedia Ocean Sci., 61–72. doi: 10.1006/rwos.2001.0350
Qiu B., Chen S. (2010). Interannual variability of the North Pacific Subtropical Countercurrent and its associated mesoscale eddy field. J. Phys. Oceanography 40 (1), 213–225. doi: 10.1175/2009JPO4285.1
Qiu B., Chen S., Schneider N. (2017). Dynamical links between the decadal variability of the Oyashio and Kuroshio Extensions. J. Climate 30 (23), 9591–9605. doi: 10.1175/JCLI-D-17-0397.1
Raskoff K. A., Sommer F. A., Hamner W. M., Cross K. M. (2003). Collection and culture techniques for gelatinous zooplankton. Biol. Bull. 204 (1), 68–80. doi: 10.2307/1543497
Richard S., Jamet J.-L. (2001). An unusual distribution of Oithona nana Giesbrecht, (1892)(Crustacea: Cyclopoida) in a bay: the case of Toulon Bay (France, Mediterranean Sea). J. Coast. Res. 17 (4), 957–963.
Robison B. H. (2004). Deep pelagic biology. J. Exp. Mar. Biol. Ecol. 300 (1-2), 253–272. doi: 10.1016/j.jembe.2004.01.012
Saitoh S.-i., Suzuki H., Hanzawa N., Tamate H. B. (2011). Species diversity and community structure of pelagic copepods in the marine lakes of Palau. Hydrobiologia 666, 85–97. doi: 10.1007/s10750-010-0095-0
Sakurai Y. (2007). An overview of the Oyashio ecosystem. Deep Sea Res. Part II: Topical Stud. Oceanography 54 (23-26), 2526–2542. doi: 10.1016/j.dsr2.2007.02.007
Seo M. H., Choi S. Y., Park E.-O., Jeong D., Soh H. Y. (2018). Species diversity of planktonic copepods and distribution characteristics of its major species in coastal waters of Korea. Korean J. Environ. Biol. 36 (4), 525–537. doi: 10.11626/KJEB.2018.36.4.525
Shannon C., Wiener W. (1963). The mathematical theory of Communication University Vol. 125 (Urbana: Illinois Press).
Stukel M. R., Décima M., Selph K. E., Gutiérrez-Rodríguez A. (2021). Size-specific grazing and competitive interactions between large salps and protistan grazers. Limnol. Oceanography 66 (6), 2521–2534. doi: 10.1002/lno.11770
Stukel M. R., Gerard T., Kelly T., Knapp A. N., Laiz-Carrión R., Lamkin J., et al. (2020). Plankton food webs of the Gulf of Mexico spawning grounds of Atlantic Bluefin tuna. J. Plankton Res. 44 (5), 763–781. doi: 10.1101/2020.07.29.227116
Taguchi B., Xie S.-P., Schneider N., Nonaka M., Sasaki H., Sasai Y. (2007). Decadal variability of the Kuroshio Extension: Observations and an eddy-resolving model hindcast. J. Climate 20 (11), 2357–2377. doi: 10.1175/JCLI4142.1
Ter Braak C. J., Verdonschot P. F. (1995). Canonical correspondence analysis and related multivariate methods in aquatic ecology. Aquat. Sci. 57 (3), 255–289. doi: 10.1007/BF00877430
Terlizzi A., De Falco G., Felline S., Fiorentino D., Gambi M., Cancemi G. (2010). Effects of marine cage aquaculture on macrofauna assemblages associated with Posidonia oceanica meadows. Ital. J. Zool. 77 (3), 362–371. doi: 10.1080/11250000903464075
Tian Y., Akamine T., Suda M. (2003). Variations in the abundance of Pacific saury (Cololabis saira) from the northwestern Pacific in relation to oceanic-climate changes. Fish. Res. 60 (2-3), 439–454. doi: 10.1016/S0165-7836(02)00143-1
Totton A. (1954). Siphonophora of the Indian Ocean together with systematic and biological notes on related specimens from other oceans. Discovery Rep. 27, 1–162.
Totton A., Bargmann H. E. (1965). A synopsis of the Siphonophora (London: British Museum (Natural History).
Weikert H., Godeaux J. E. (2008). Thaliacean distribution and abundance in the northern part of the Levantine Sea (Crete and Cyprus) during the eastern Mediterranean climatic transient, and a comparison with the western Mediterranean basin. Helgoland Mar. Res. 62 (4), 377–387. doi: 10.1007/s10152-008-0126-7
Yang G., Li C., Guilini K., Wang X., Wang Y. (2017). Regional patterns of δ13C and δ15N stable isotopes of size-fractionated zooplankton in the western tropical North Pacific Ocean. Deep Sea Res. Part I.: Oceanographic Res. Papers 120, 39–47. doi: 10.1016/j.dsr.2016.12.007
Yasuda I. (2003). Hydrographic structure and variability in the Kuroshio-Oyashio transition area. J. Oceanography 59 (4), 389–402. doi: 10.1023/A:1025580313836
Ye W., Zhang G., Zhu Z., Huang D., Han Y., Wang L., et al. (2016). Methane distribution and sea-to-air flux in the East China Sea during the summer of 2013: impact of hypoxia. Deep Sea Res. Part II: Topical Stud. Oceanography 124, 74–83. doi: 10.1016/j.dsr2.2015.01.008
Zhang F., Sun S., Jin X., Li C. (2012). Associations of large jellyfish distributions with temperature and salinity in the Yellow Sea and East China Sea. Hydrobiologia 690, 81–96. doi: 10.1007/s10750-012-1057-5
Keywords: biodiversity, gelatinous zooplankton, indicator species, Kuroshio Extension, siphonophore, stable isotope, trophic position
Citation: Park N, Choi H, Shin K-H and Lee W (2023) Distribution of siphonophores in the Northwest Pacific Ocean and links to environmental conditions. Front. Mar. Sci. 10:1223477. doi: 10.3389/fmars.2023.1223477
Received: 16 May 2023; Accepted: 28 August 2023;
Published: 15 September 2023.
Edited by:
Ana Cristina Costa, University of the Azores, PortugalReviewed by:
Andrew Brierley, University of St Andrews, United KingdomGerlien Verhaegen, University of Greifswald, Germany
Alejandro Damian Serrano, University of Oregon, United States
Copyright © 2023 Park, Choi, Shin and Lee. This is an open-access article distributed under the terms of the Creative Commons Attribution License (CC BY). The use, distribution or reproduction in other forums is permitted, provided the original author(s) and the copyright owner(s) are credited and that the original publication in this journal is cited, in accordance with accepted academic practice. No use, distribution or reproduction is permitted which does not comply with these terms.
*Correspondence: Wonchoel Lee, d2xlZUBoYW55YW5nLmFjLmty