Abstract
In the Arctic Ocean, the northern Chukchi and East Siberian Seas (NCESS) are vulnerable to climate change due to warming, sea ice melting, and surface freshening. To investigate how local physical forcing affects phytoplankton biomass and communities in this area, the multi-year (2015-2020) distributions of summer (August) chlorophyll-a concentrations and size structures using data collected by the Korea-Arctic Ocean Observing System (K-AOOS) program were investigated. The environmental characteristics and phytoplankton communities in the study area showed east-west regional differences. It is characterized by warm fresh waters and strong stratification to the east and cold saline waters and relatively high nutrient and sea ice concentrations to the west. Despite the differences between the east and west regions, patterns of the inter-annual variation in phytoplankton biomass and communities were similar across the entire study area, implying environmental controllers regulating phytoplankton in the NCESS. Inter-annually, higher sea surface salinity and weaker water column stratification were observed in 2017-2019 than in 2015 and 2020, implying the possibility of a potential modulation by the Arctic Oscillation. The shallower nitracline depth and higher surface nutrient concentrations since 2017 compared to the period from 2015-2016, indicate improved nutrient availability due to Atlantic water intrusion. However, average insolation has been relatively low since 2017, with the exception of August 2018. August mean phytoplankton biomass was highest in 2018 in the study area (average 83.7 mgm-2) and was dominated by large-sized phytoplankton. The low phytoplankton biomass in 2017 (23.9 mgm-2) and 2019 (62.4 mgm-2), despite similar characteristics of nutrient concentration to 2018, is likely due to lower average daily insolation in both years (206 μEm-2d-1 and 184 μEm-2d-1 in 2017 and 2019, respectively) compared to the 2018 average (271 μEm-2d-1). These results suggest that increased intrusion through upwelling of Atlantic water, along with nutrient loading, could be a pivotal driving factor contributing to this enhanced production in the NCESS, particularly under conditions where light levels are sufficient for phytoplankton growth and bloom development.
1 Introduction
The Arctic Ocean is undergoing dramatic changes such as the rapid retreat of seasonal sea ice (Perovich, 2011), increase in river discharge into the Arctic Ocean (Peterson et al., 2002), and alterations in ocean circulation (Polyakov et al., 2020). Several studies have examined the effects of these environmental changes on marine ecosystems, particularly phytoplankton (Kahru et al., 2011; Ardyna and Arrigo, 2020). Phytoplankton are microscopic algae that play a crucial role in marine ecosystems as primary producers. Their growth and distribution are limited by several factors including light and nutrient availability. The reduction in sea ice cover over the past few decades has led to changes in the time for which light is available to phytoplankton. This has resulted in a longer growing season for phytoplankton and increased open-water habitat for their growth. This has led to a 30% increase in annual net primary production (NPP) in open waters between 1998 and 2012 (Lewis et al., 2020). However, other alterations in NPP have been observed since 2012, when the minimum sea ice coverage was recorded (Parkinson and Comiso, 2013). While the increase in open water area slowed between 2012 and 2018, the annual NPP in ice-free water continued to increase, which was attributed to increased phytoplankton biomass, suggesting that an increased nitrogen supply could be responsible for the increase in NPP since 2012 (Arrigo et al., 2008; Lewis et al., 2020).
Nutrient supply is subject to several environmental factors such as river discharge, ocean circulation, atmospheric forcing, vertical stratification, and upwelling along the slope, which have been reported as potential causes of increased nutrient loading in the Arctic Ocean (Tremblay et al., 2015; Oziel et al., 2022; Tuerena et al., 2022), but there is no clear evidence of increased nitrate supply to pan-Arctic pelagic ecosystems. While increased pan-Arctic River inflows are expected to affect marine nutrient distributions, the nutrient supply from rivers might be locally important but does not appear to support a significant portion of the Arctic NPP (Gibson et al., 2022).
In the Arctic Ocean, the Northern Chukchi and East Siberian Seas (NCESS) are vulnerable areas where phytoplankton community distribution is altered by sea ice concentration (SIC), water mass distribution, and freshwater discharge (Coupel et al., 2012; Fujiwara et al., 2016; Lee et al., 2019). The spatial distributions of the physical and chemical variables such as seawater temperature, salinity, and nutrient concentrations support an east-west water mass structure (Nishino et al., 2008). However, the effects of these environmental changes on marine phytoplankton remain poorly understood. Although previous studies have reported data on chlorophyll-a (chl-a) concentrations in the NCESS during specific periods, these data have been used primarily as variables to explain the results in the fields of phytoplankton physiology, marine ecology, and biogeochemistry (Ko et al., 2020; Jung et al., 2021; Kim et al., 2022; Ko et al., 2022). To explore how large-scale climate and local physical forcing affect phytoplankton biomass and communities in the NCESS, we investigated the multi-year (2015-2020) distributions of summer (August) chl-a concentrations and size structures using data collected by the Korea-Arctic Ocean Observing System (K-AOOS) program. As phytoplankton dynamics play a crucial role in regulating marine biogeochemical cycles and food webs, it is essential to understand the influence of environmental changes on phytoplankton biomass and size structure.
2 Materials and methods
2.1 Field surveys, measurements, and calculations
The data for this study were collected from six research cruises to the NCESS that were performed as part of the K-AOOS project. (Table 1). Field surveys were conducted onboard the Korean icebreaking research vessel ‘Araon’ every August of each year from 2015 to 2020 (Figure 1). Vertical profiles of seawater temperature, salinity, water pressure, water density (sigma-t), chlorophyll fluorescence, and photosynthetically available radiation (PAR) were obtained from casts of a Seabird 911plus model CTD (Sea-Bird Electronics, USA). Surface PAR was determined using a quantum sensor (LI-1400, LI-COR Inc., USA) every 5 min along the cruise track.
Table 1
| Cruise | Year | Dates | Stations (n) |
|---|---|---|---|
| ARA06B | 2015 | 4 – 19 August | 27 |
| ARA07B | 2016 | 8 – 19 August | 19 |
| ARA08B | 2017 | 9 – 23 August | 22 |
| ARA09B | 2018 | 6 – 23 August | 27 |
| ARA10B | 2019 | 9 – 23 August | 21 |
| ARA11B | 2020 | 6 – 26 August | 35 |
Research cruise, sampling date, and number of stations per cruise in northern Chukchi and the East Siberian Seas during summer (2015-2020).
Figure 1
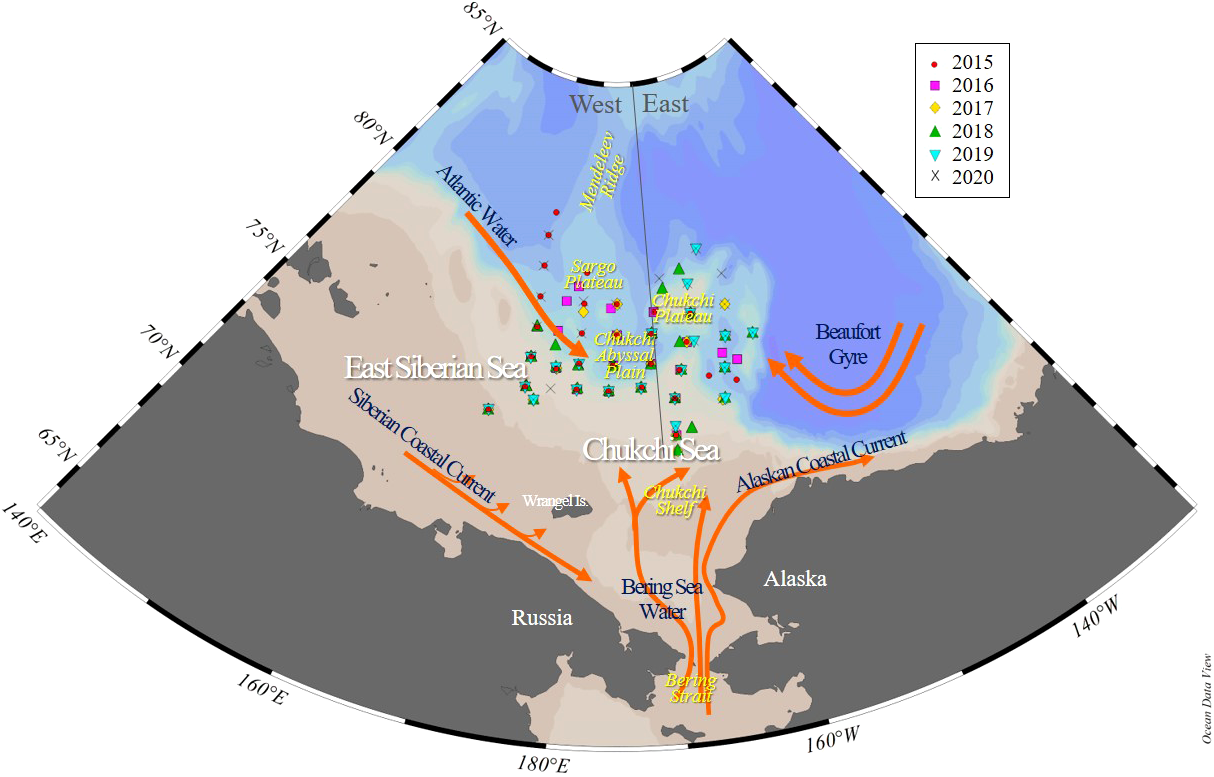
Map showing stations and bathymetry of the northern Chukchi and East Siberian Seas (NCESS). Stations were sampled in August during multiple years (2015-2020). The gray line indicates the study area, geographically divided into east and west, based on 170°W longitude. The orange line indicates the current and circulation elements.
To measure the nutrient and chl-a concentrations, water samples were collected from four to six layers in the upper 100 m using a 10 L PVC Niskin water sampler attached to a CTD rosette system. The macronutrient concentrations including nitrate + nitrite (NOx), ammonium, phosphate (P), and silicate (Si) were measured onboard using standard colorimetric methods adapted for use with a four-channel auto-analyzer (QuAAtro; Seal Analytical, USA) according to the Joint Global Ocean Flux Study (JGOFS) protocols described by Gordon et al. (1993). The total chl-a concentration was determined onboard using samples immediately filtered through glass-fiber filter paper (47 mm; Gelman GF/F), extracted with 90% acetone for 24 h (Parsons et al., 1984), and then measured in a fluorometer (Trilogy, Turner Designs, USA), previously calibrated against pure chl-a (Sigma). The water column integrated chl-a at each station was calculated using linear interpolation. To determine the size-fractionated chl-a concentration, water samples (300–500 mL) from the Niskin bottles were sequentially passed through a cascade connection filtration system including a 20-μm nylon mesh, a Nuclepore filter (Whatman International, UK) with a pore size of 2 μm, and a Whatman GF/F filter (Sieburth et al., 1978). Thus, micro chl-a (>20 μm), nano chl-a (2–20 μm), and pico chl-a (<2 μm) were measured directly. The percentage contribution of the size-fractionated chl-a detected from each mesh size to the total chl-a (sum of size-fractionated chl-a) was determined.
The euphotic depth (Zeu) was estimated as the depth at which the PAR was 1% of its surface value. Nitracline depths (Znc) were determined as the median of the shallowest depths where the gradient of NO2 + NO3 was greater than 0.1 μM m−1 (Coupel et al., 2015). The mixed layer depth (MLD) was defined as the depth at which the density change exceeded 0.05 kg m-3 relative to the reference value at a 5-m depth (Venables and Moore, 2010). Vertical stratification of the water column was estimated by averaging the Brunt–Väisälä buoyancy frequency (N2, BVF) upper 100 m depth. N2 = (g/ρ)(∂ρ/∂z) where z is water depth (m), ρ is the water density (kg m-3), and g is the gravitational acceleration (9.8 m s-2) (Houry et al., 1987; Mojica et al., 2015). The BVF represents the rate at which a small perturbation in stratification re-equilibrates. Hence, it is a useful tool for understanding the stability and vertical mixing of oceanic water columns.
2.2 Satellite data
The daily SIC product of the Advanced Microwave Scanning Radiometer 2 (AMSR2) was downloaded from the Institute of Environmental Physics, University of Bremen, Germany (https://seaice.uni-bremen.de/start/data-archive/) and used to obtain the 7 days average SIC prior to the sampling periods at individual CTD stations, because the ice concentration can vary greatly during the melting period. The retreat timing of the sea ice (Julian day) was defined as the first day that SIC fell below 10% (Fujiwara et al., 2014). The retreat speed of the sea ice (day) was defined as the difference between Julian days with 80% and 20% of SIC. The Arctic Oscillation (AO) index values were downloaded from the National Centers for Environmental Information, National Oceanic and Atmospheric Administration, USA (https://www.ncei.noaa.gov/access/monitoring/ao/). Winter AO is the average value from November of the previous year to April of the current year, derived from the monthly AO index from 2014 to 2020. AO is the strength of the Northern Hemisphere Annular Mode and a climatic pattern characterized by counterclockwise winds circulating around the Arctic at 55°N latitude (Thompson and Wallace, 1998).
2.3 Data analysis
Statistical analyses were carried out using the R4.0.5 software (R Development Core Team, www.r-project.org) and supplemented with the vegan package. Geographic maps and figures were created using the ODV software (R. Schlitzer, Ocean Data View, http://odv.awi.de, 2011). The spatiotemporal environmental variables of the six cruises were summarized using principal component analysis (PCA) based on normalized abiotic data from the surface and subsurface chlorophyll maximum (SCM) layers, and the differences between groups of samples were assessed by analysis of similarities (ANOSIM) (Clarke and Gorley, 2006). To examine the relationship between environmental variables and phytoplankton biomass during cruises in the study area, we used Spearman’s rank correlation for all datasets of normalized abiotic data and the log-transformed and normalized biotic data because most of the data did not satisfy the assumptions of normality. Differences between years were examined using a one-way analysis of variance (ANOVA; Kruskal–Wallis test) based on normalized data (Clarke and Gorley, 2006).
3 Results
The eastern area includes the Chukchi Borderland and Chukchi Plateau, and the western area includes the Chukchi abyssal plain and the East Siberian continental shelf, each of which is separated by the 170°W longitude (Figure 1).
3.1 Environmental variables
Over the six-year period (from 2015 to 2020), the physicochemical environment of the ocean in summer (August) showed complex spatiotemporal variations in the study area (Figure 2; Supplementary Figure 1). The spatial distribution of environmental variables in the NCESS supported a general east-west variation (ANOVA test, p < 0.05), with relatively cold saline waters, higher nutrient, and sea ice concentrations in the west, and warm fresh and oligotrophic waters with low SICs in the east, which is consistent with previous studies (Nishino et al., 2008; Lee et al., 2019). Inter-annual variations in the August mean environmental variables were complex, with significant differences between the years (ANOVA test, p < 0.05). The trends of the inter-annual changes in the August mean variables were similar in the eastern and western areas; however, their yearly variation ranges were larger in the west than east. Thus, the characteristics of the west were better characterized by averaging the entire area over the survey period. In this study, we averaged and compared all stations to understand the inter-annual variability of the environmental and biological characteristics across the NCESS waters in August (Table 2). August mean sea surface temperature was highest in 2019 (1.07 ± 1.88°C) with not much variations in other years (-1.21 – -0.69°C). August mean surface salinity showed relatively low values in 2015 (26.43 ± 1.71) and 2020 (27.17 ± 0.72), respectively. The August mean surface nutrient concentrations were higher in 2017-2020 than in 2015-2016, which is consistent with the inter-annual variation in nutrient concentrations above 50 m (Figure 3). During our cruises, nitrate was nearly depleted at the surface of most stations in the study area. The number of stations with surface nitrate levels below the detection limit was lowest in 2019 (2 out of 21) and highest in 2020 (all stations). Although the SCM depth (Zscm) was shallower in 2017-2020 than 2015-2016, the nutrient concentrations in the SCM layer were higher after 2017 than in 2015-2016. The SICs were lower in the east than in the west, with large inter-annual variations (Figure 4). Mean SICs were lower in 2019-2020 than in 2015-2018 in the western region. In the eastern part of the study area, August mean SICs were lowest in 2019 due to high sea surface temperatures. In 2019, sea ice retreated rapidly and early northward in the study area. The depth-averaged BVF, which indicates water column stratification, was significantly correlated with surface salinity (r = -0.80, p < 0.001), with high August mean values in 2015 (4.80 ± 1.07 × 10⁻⁴ s-1) and 2020 (4.77 ± 1.27 × 10⁻⁴ s-1) when the sea surface salinity was low, indicating strong water column stratification driven by low surface salinity during these years. The euphotic depth was deeper in 2015-2016 (48.5 ± 12.4 m) and shallower since 2017 (41.2 ± 14.0 m), and the SCM depth and nitracline followed a similar pattern to the euphotic depth, becoming shallower since 2017 (Figure 5). The August mean MLD was relatively deep in 2016 and 2017 (17.9 ± 6.1 m and 16.2 ± 6.8 m, respectively), and ranged from 9.6 ± 2.4 m to 12.8 ± 4.8 m in other years. Zeu/Zscm was approximately 1 in 2015-2016 and has been above 1 since then, indicating that light conditions in the SCM layer have been favorable for phytoplankton growth since 2017. The winter mean AO index was high in 2015 and 2020 but low from 2016 to 2019, indicating a weak negative correlation with the August mean surface salinity (r = -0.69, p = 0.128) (Figure 6A). During the study periods, average daily insolation measured at the research vessel was highest in 2018 (August mean ± SD, 271 ± 88 μEm-2d-1) and lowest in 2019 (184 ± 110 μEm-2d-1), with other years ranging from 206 μEm-2d-1 to 235 μEm-2d-1 (Figure 6B).
Figure 2
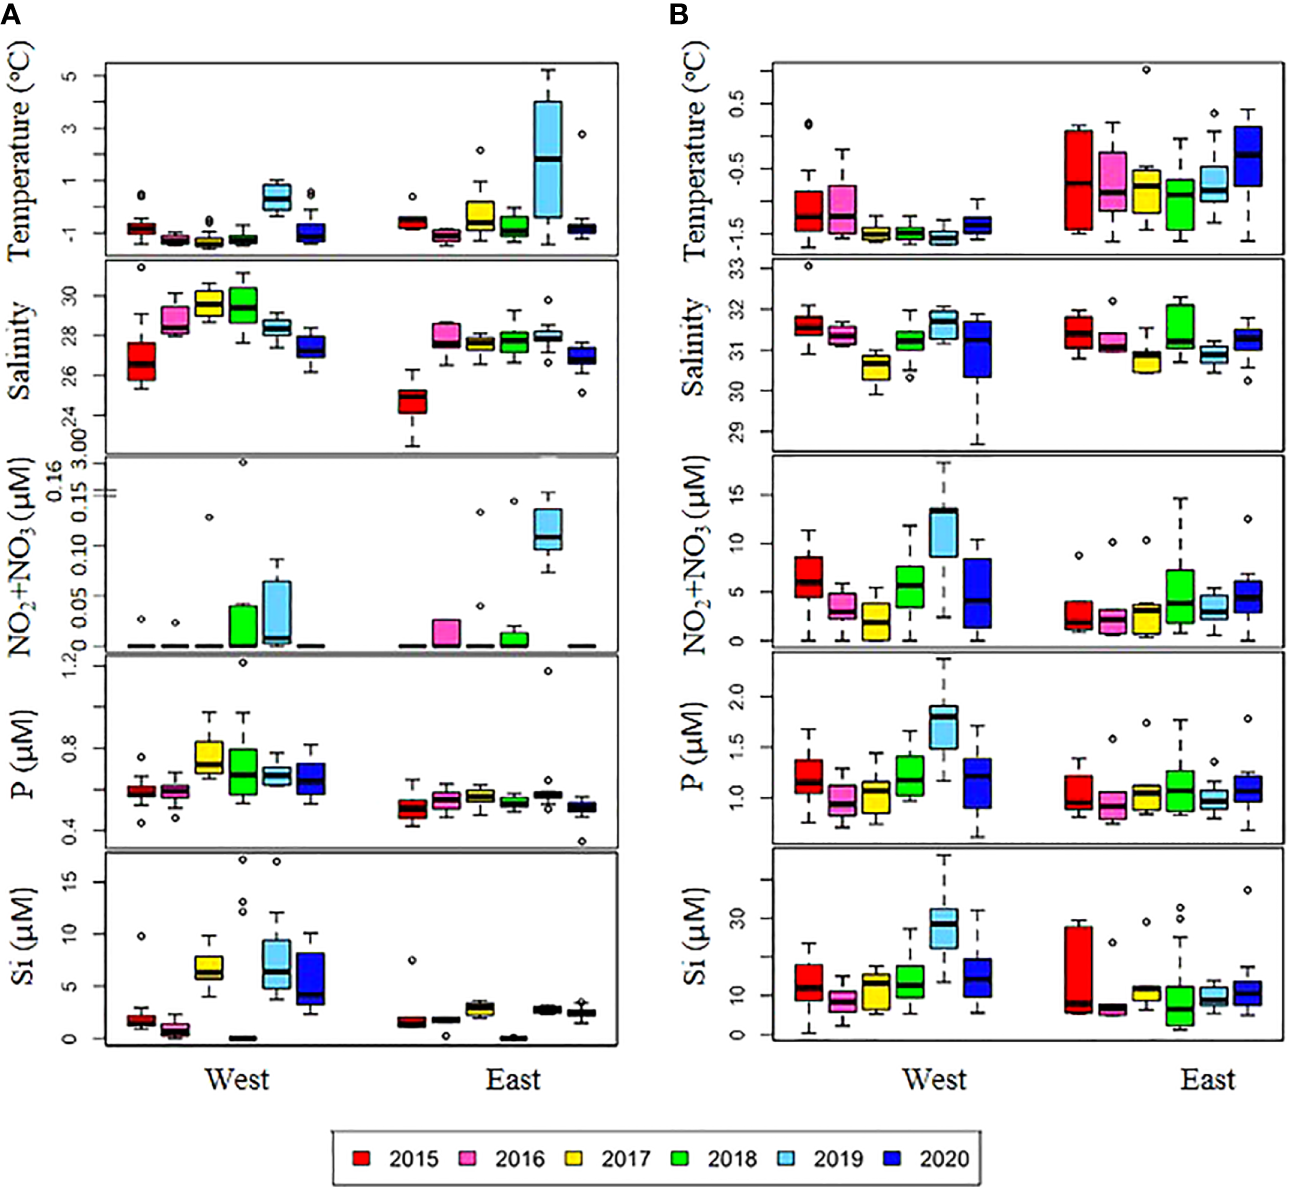
Annual variations in physical and chemical variables in the (A) surface and (B) subsurface chlorophyll maximum (SCM) layers. The box plot represents the data on the east and west sides during six cruises from 2015-2020. The central mark in the box is the median, and the edges of the box are the 25th and 75th marks. NO2+NO3, nitrite and nitrate; P, phosphate; Si, silicate.
Table 2
| Year | 2015 | 2016 | 2017 | 2018 | 2019 | 2020 |
|---|---|---|---|---|---|---|
| Surface layer | ||||||
| Temperature (°C) | -0.69 ± 0.48 | -1.21 ± 0.21 | -0.79 ± 0.93 | -1.01 ± 0.42 | 1.07 ± 1.88 | -0.78 ± 0.77 |
| Salinity | 26.43 ± 1.71 | 28.47 ± 0.94 | 28.76 ± 1.19 | 28.66 ± 1.30 | 28.15 ± 0.71 | 27.17 ± 0.72 |
| NOx (μM) | 0.001 ± 0.005 | 0.035 ± 0.098 | 0.027 ± 0.070 | 0.161 ± 0.605 | 0.083 ± 0.077 | ND |
| P (μM) | 0.57 ± 0.07 | 0.58 ± 0.06 | 0.68 ± 0.13 | 0.63 ± 0.17 | 0.65 ± 0.14 | 0.59 ± 0.11 |
| Si (μM) | 2.10 ± 1.99 | 1.07 ± 0.82 | 5.06 ± 2.28 | 1.58 ± 4.59 | 5.13 ± 3.79 | 4.27 ± 2.69 |
| Total chl-a (μgL-1) | 0.09 ± 0.06 | 0.14 ± 0.18 | 0.37 ± 0.58 | 1.31 ± 2.88 | 0.13 ± 0.08 | 0.12 ± 0.06 |
| Micro-chl-a (%) | 24.1 ± 17.2 | 31.4 ± 21.4 | 18.3 ± 15.1 | 58.0 ± 29.7 | 28.0 ± 24.1 | 19.0 ± 12.9 |
| Nano-chl-a (%) | 35.8 ± 7.8 | 37.1 ± 12.4 | 31.5 ± 12.1 | 34.1 ± 22.8 | 33.1 ± 12.6 | 38.4 ± 11.4 |
| Pico-chl-a (%) | 40.1 ± 16.3 | 31.5 ± 15.6 | 50.2 ± 16.2 | 7.9 ± 11.3 | 38.8 ± 14.3 | 42.6 ± 11.1 |
| Subsurface chlorophyll maximum layer | ||||||
| Temperature (°C) | -1.00 ± 0.60 | -0.93 ± 0.55 | -1.17 ± 0.60 | -1.20 ± 0.49 | -1.09 ± 0.58 | -0.92 ± 0.58 |
| Salinity | 31.57 ± 0.46 | 31.33 ± 0.31 | 30.68 ± 0.37 | 31.31 ± 0.53 | 31.24 ± 0.50 | 31.04 ± 0.79 |
| NOx (μM) | 5.24 ± 3.42 | 3.16 ± 2.46 | 2.52 ± 2.48 | 5.47 ± 4.05 | 7.26 ± 5.47 | 4.83 ± 3.46 |
| P (μM) | 1.15 ± 0.25 | 0.98 ± 0.22 | 1.04 ± 0.23 | 1.19 ± 0.29 | 1.36 ± 0.47 | 1.13 ± 0.28 |
| Si (μM) | 13.11 ± 7.49 | 8.58 ± 5.12 | 11.65 ± 5.42 | 12.48 ± 9.16 | 18.16 ± 11.37 | 13.99 ± 7.37 |
| PAR (μEm-2s-1) | 2.25 ± 2.53 | 3.41 ± 3.54 | 4.27 ± 6.29 | 7.45 ± 8.65 | 2.48 ± 2.50 | 3.49 ± 3.80 |
| Total chl-a (μgL-1) | 2.24 ± 2.60 | 0.90 ± 0.44 | 0.62 ± 0.52 | 3.96 ± 3.92 | 3.04 ± 4.41 | 1.31 ± 2.37 |
| Micro chl-a (%) | 59.1 ± 29.1 | 47.8 ± 28.8 | 23.9 ± 25.2 | 54.5 ± 42.0 | 39.2 ± 38.7 | 21.8 ± 23.9 |
| Nano chl-a (%) | 20.2 ± 11.5 | 21.9 ± 7.5 | 30.0 ± 9.3 | 20.3 ± 14.2 | 28.5 ± 15.9 | 37.9 ± 11.0 |
| Pico chl-a (%) | 20.7 ± 20.4 | 30.3 ± 24.2 | 46.1 ± 21.2 | 25.2 ± 29.4 | 32.3 ± 25.1 | 40.3 ± 17.5 |
| Abiotic and biotic variables at the stations | ||||||
| BVF (×10-4 s-1) | 4.80 ± 1.07 | 3.05 ± 0.62 | 3.08 ± 0.53 | 3.43 ± 0.71 | 4.02 ± 1.36 | 4.77 ± 1.27 |
| Znc (m) | 43.5 ± 17.9 | 46.4 ± 19.8 | 34.2 ± 10.0 | 35.1 ± 14.0 | 33.4 ± 11.9 | 33.4 ± 12.3 |
| Zscm (m) | 49.1 ± 12.0 | 45.4 ± 10.5 | 31.6 ± 10.8 | 35.6 ± 16.7 | 39.5 ± 11.0 | 36.5 ± 9.7 |
| MLD (m) | 9.6 ± 2.6 | 17.9 ± 6.1 | 16.2 ± 6.8 | 9.6 ± 2.4 | 12.8 ± 4.8 | 10.1 ± 3.0 |
| Zeu (m) | 49.4 ± 13.9 | 47.4 ± 10.4 | 39.7 ± 14.2 | 41.6 ± 17.9 | 44.8 ± 14.6 | 39.7 ± 9.5 |
| Zeu/Zscm | 1.00 ± 0.17 | 1.05 ± 0.12 | 1.33 ± 0.44 | 1.37 ± 0.81 | 1.14 ± 0.29 | 1.14 ± 0.31 |
| SIC (%) | 34.3 ± 30.1 | 48.7 ± 24.3 | 28.3 ± 40.2 | 41.4 ± 31.8 | 6.3 ± 20.9 | 33.3 ± 30.3 |
| SIRT (Ordinal date) | 228 ± 16 | 238 ± 9 | 230 ± 16 | 234 ± 17 | 214 ± 11 | 224 ± 24 |
| SIRS (d) | 30 ± 14 | 32 ± 19 | 18 ± 13 | 23 ± 14 | 13 ± 6 | 20 ± 14 |
| meanNOx (μM) | 1.77 ± 1.39 | 1.07 ± 0.81 | 0.51 ± 0.51 | 1.41 ± 1.07 | 2.98 ± 1.77 | 1.21 ± 1.05 |
| meanP (μM) | 0.83 ± 0.16 | 0.72 ± 0.11 | 0.79 ± 0.12 | 0.81 ± 0.15 | 1.02 ± 0.21 | 0.80 ± 0.12 |
| meanSi (μM) | 5.97 ± 3.92 | 3.63 ± 1.56 | 6.67 ± 2.36 | 5.54 ± 4.76 | 11.72 ± 5.84 | 7.52 ± 2.56 |
| StNOx | 26/27 | 15/19 | 18/22 | 16/27 | 2/21 | 35/35 |
| Integrated chl-a (mgm-1) | 62.96 ± 70.08 | 32.03 ± 13.08 | 23.91 ± 22.39 | 83.73 ± 71.69 | 62.38 ± 67.13 | 34.72 ± 36.10 |
| Mean chl-a (μgL-1) | 0.69 ± 0.88 | 0.28 ± 0.12 | 0.31 ± 0.35 | 1.37 ± 1.57 | 0.80 ± 1.20 | 0.35 ± 0.33 |
Annual variations in abiotic and biotic variables (mean ± standard deviation) during cruises in August.
Figure 3
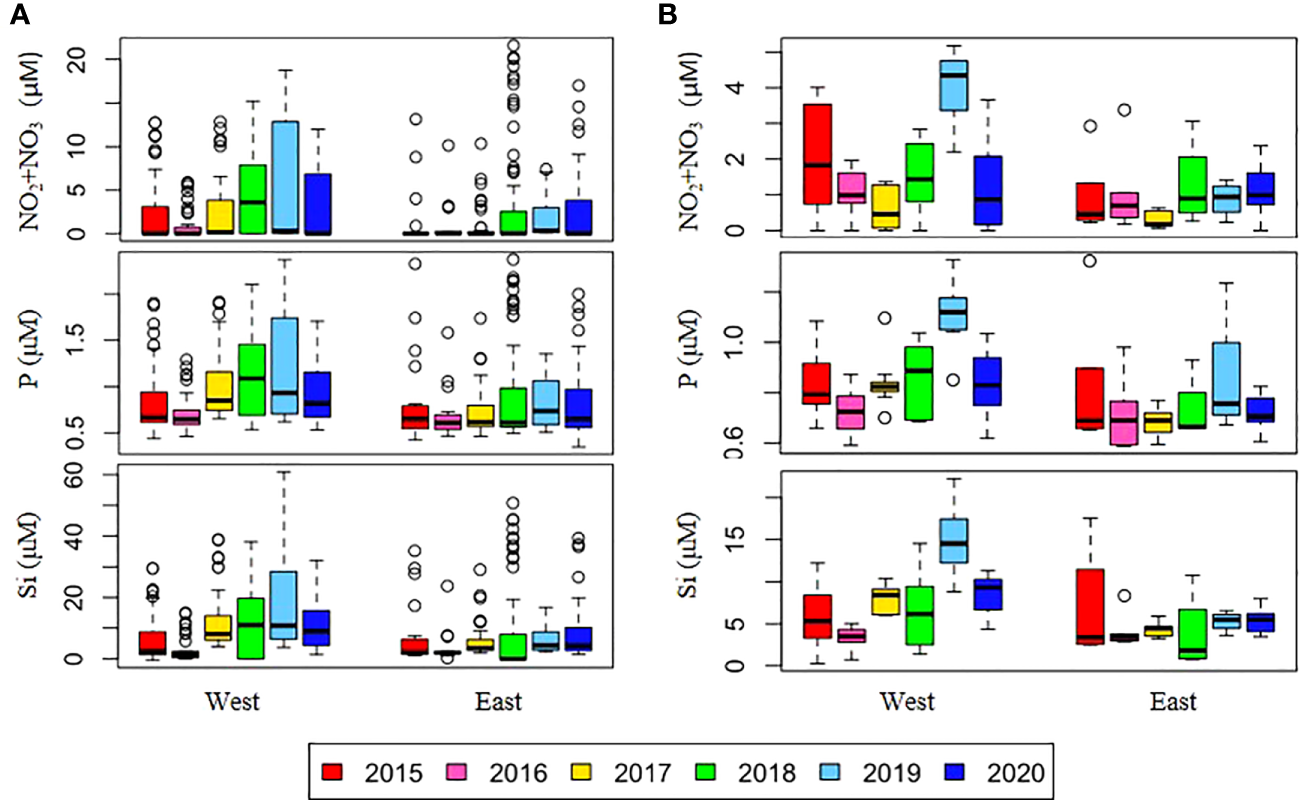
Annual variations in depth-averaged nutrient concentrations in (A) the upper 50 m depth and (B) the SCM depth on the east and west sides of the NCESS during cruises. See (Figure 2).
Figure 4
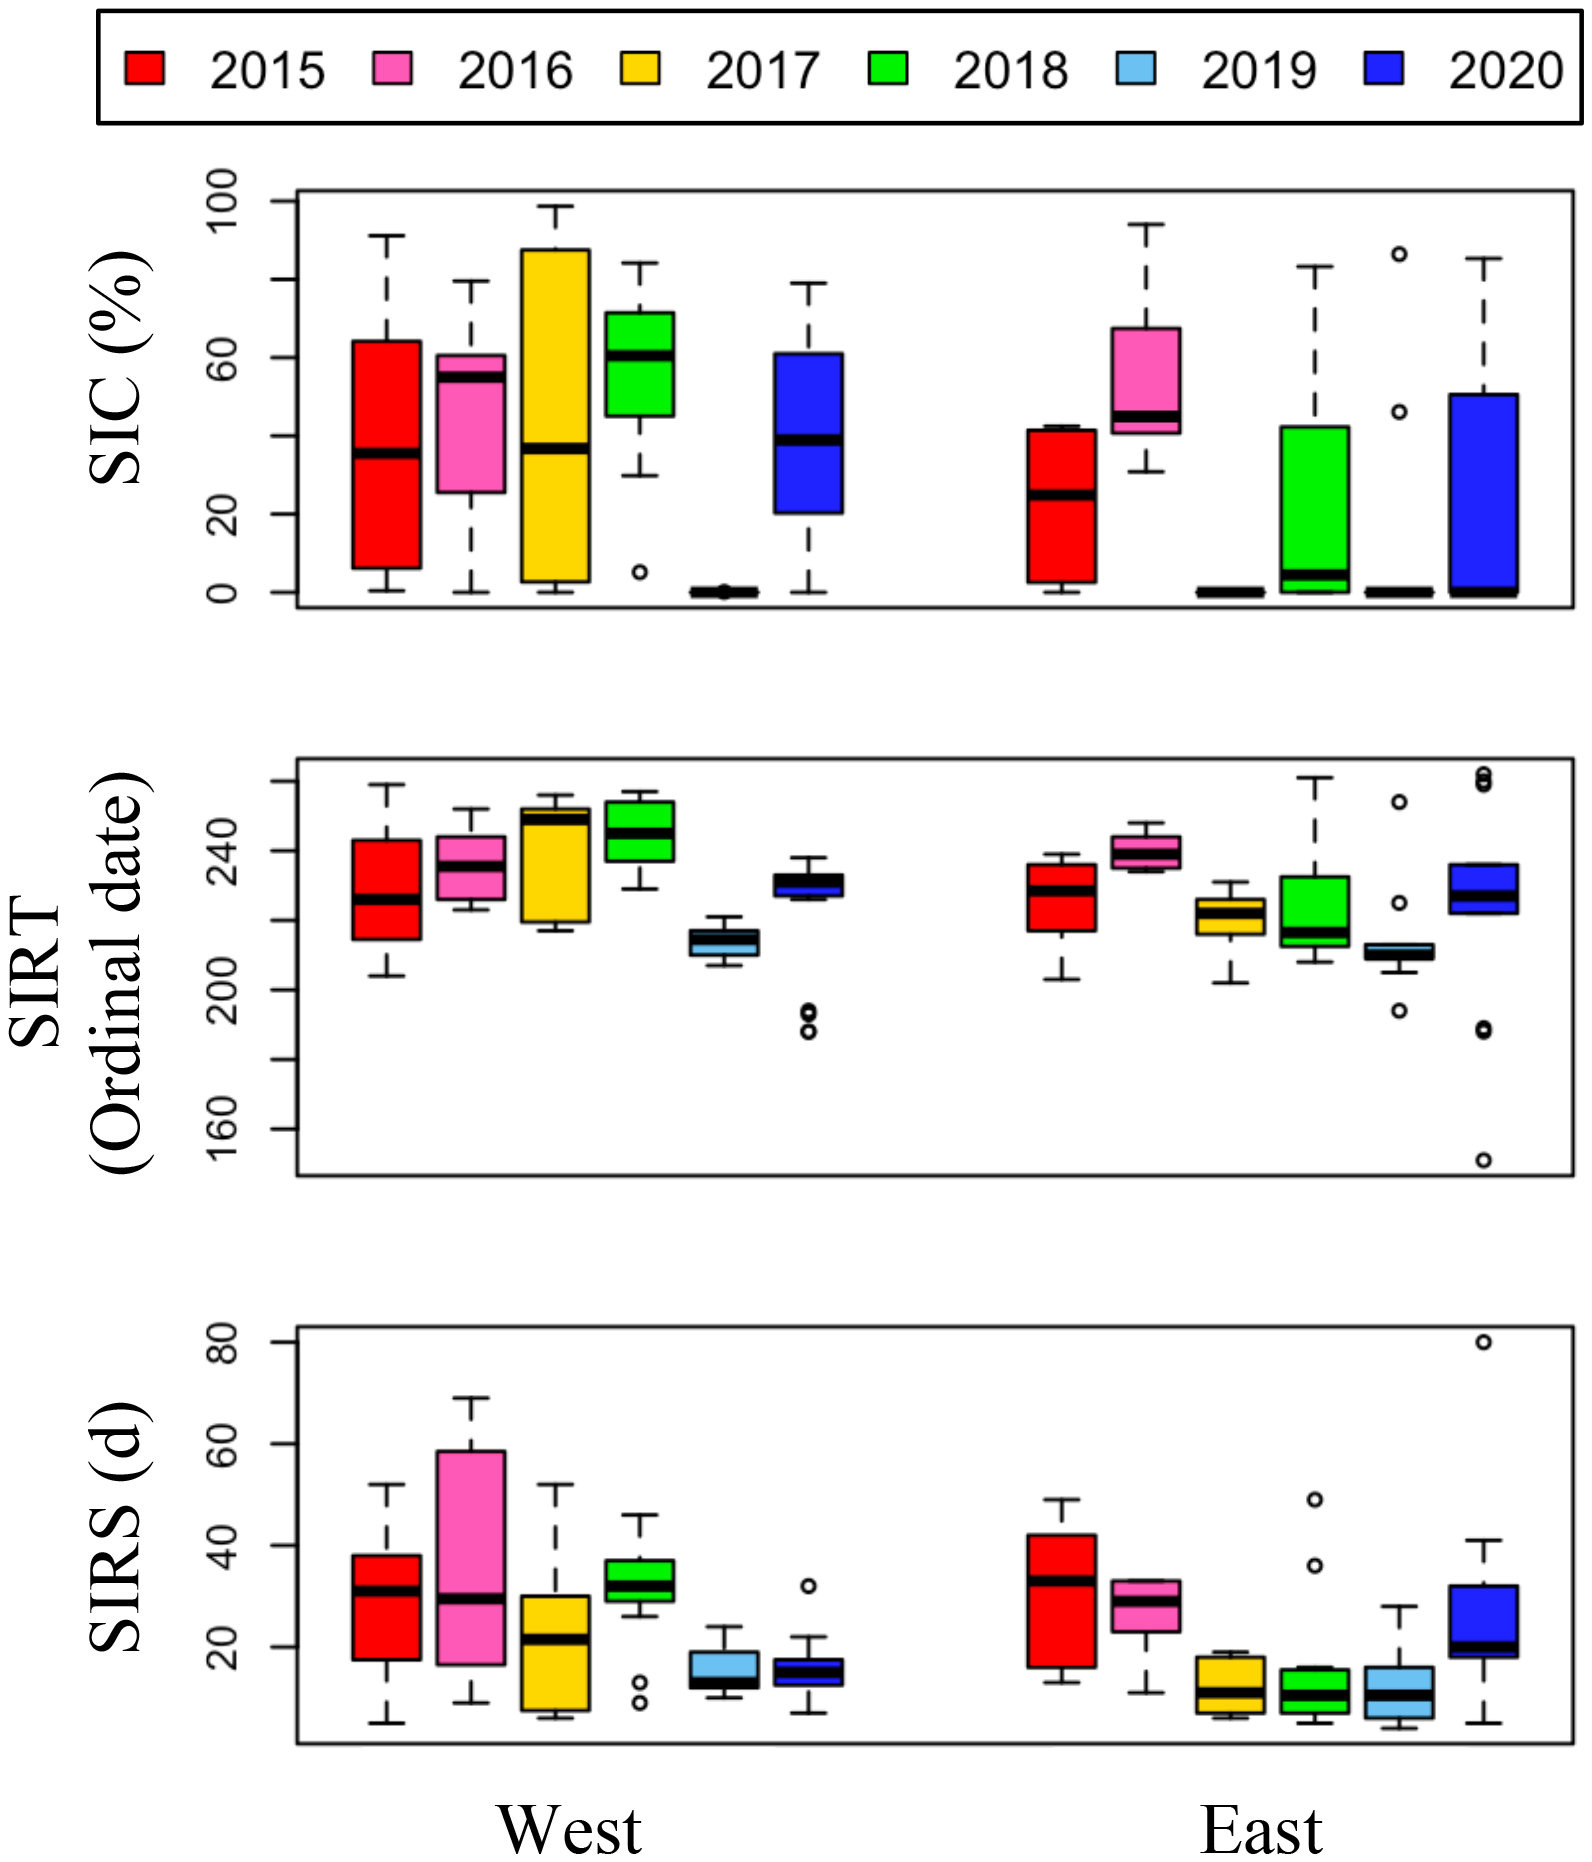
Annual variations of 7 days average sea ice concentration prior to sampling period, sea ice retreat timing (SIRT), and sea ice retreat speed (SIRS) in the east and the west sides of the NCESS during the cruises.
Figure 5
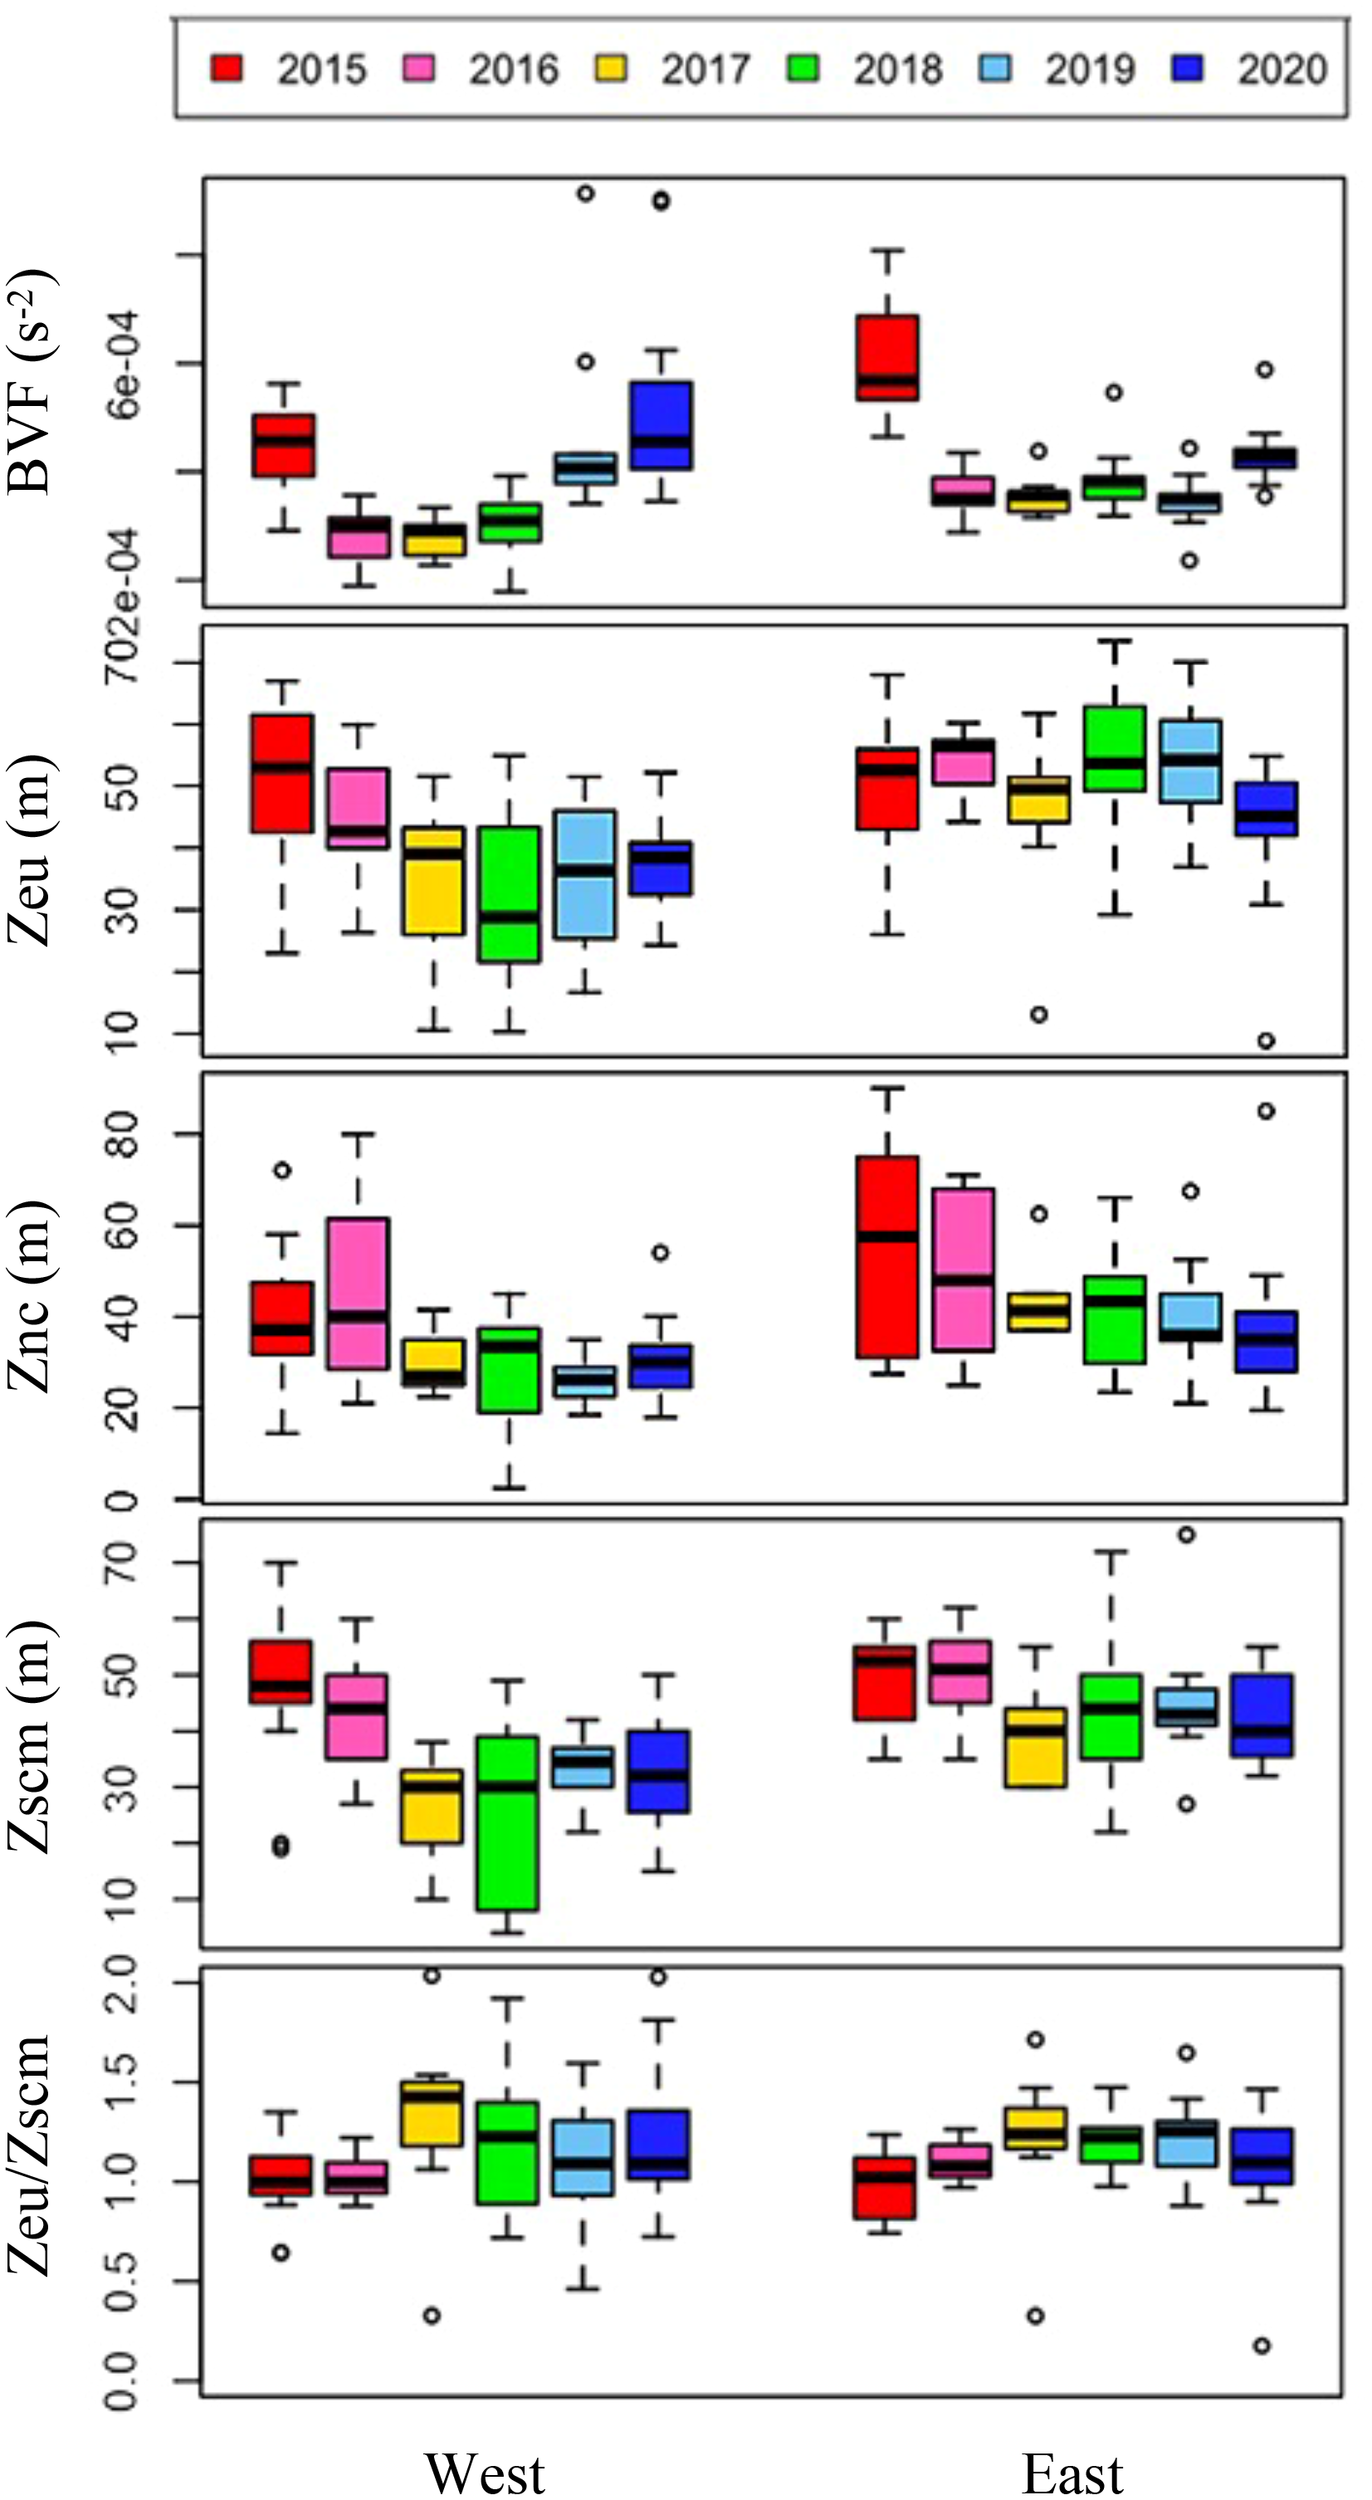
Annual variations in environmental variables derived from the vertical profiles of environmental variables during cruises. The box plot represents the data on the east and west sides during six-year cruises. The central mark in the box is the median, and the edges of the box are the 25th and 75th marks. Abbreviations: BVF, mean Brunt–Väisälä buoyancy frequency (N², s-2) upper 100 m depth; Zeu, euphotic depth (m); Znc, nitracline depth (m); Zscm, subsurface chlorophyll maximum depth (m).
Figure 6
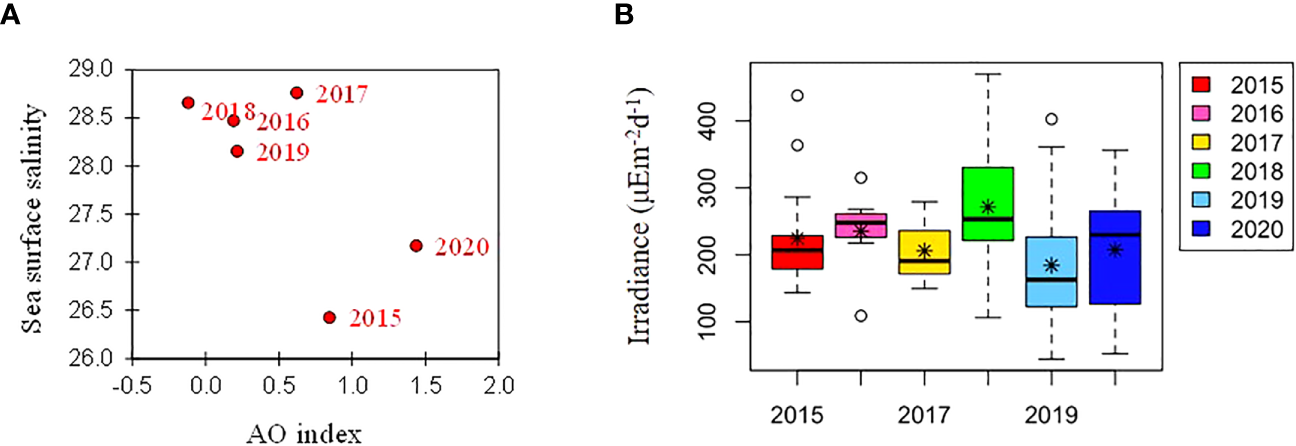
(A) Relationship between winter (NDJFMA) AO index and mean sea surface salinity, and (B) annual variations in daily mean irradiance during cruises. The box plot represents the daily mean irradiance data for the six cruises. The central mark in the box is the median, the asterisk is the mean, and the edges of the box are the 25th and 75th percentiles.
The spatiotemporal environmental variables of the six cruises were summarized using PCA analysis (Figure 7). These two principal components explained a large proportion (60.0%) of the total environmental variability in the surface layer (Figures 7A, B)). The results revealed that the environmental variables differed spatially between the stations located on the eastern and western sides of the study area (ANOSIM R = 0.080, p = 0.002). The west is characterized by higher sea surface salinity, nutrients, and SICs, whereas the east is characterized by strong stratification and greater euphoric depth. The ANOSIM test revealed significant differences between the samples taken in the six years (R = 0.127, p = 0.001). The Zeu vector indicated sample groups in 2015 and 2016, characterized by relatively deeper euphotic depths compared to other years. From 2017 to 2019, the study area exhibited distinct characteristics of western waters, with higher sea surface salinity and higher surface nutrient concentrations. In the SCM layer, the two principal components, which explained 60.7% of the total environmental variability, discriminated the environmental conditions of east-west area (ANOSIM R = 0.132, p = 0.001) and six years [ANOSIM R = 0.074, p = 0.004) (Figures 7C, D)]. Overall, it showed a similar pattern to the surface layer; however, unlike the surface layer which showed large inter-annual variability, the east-west variations were more pronounced.
Figure 7
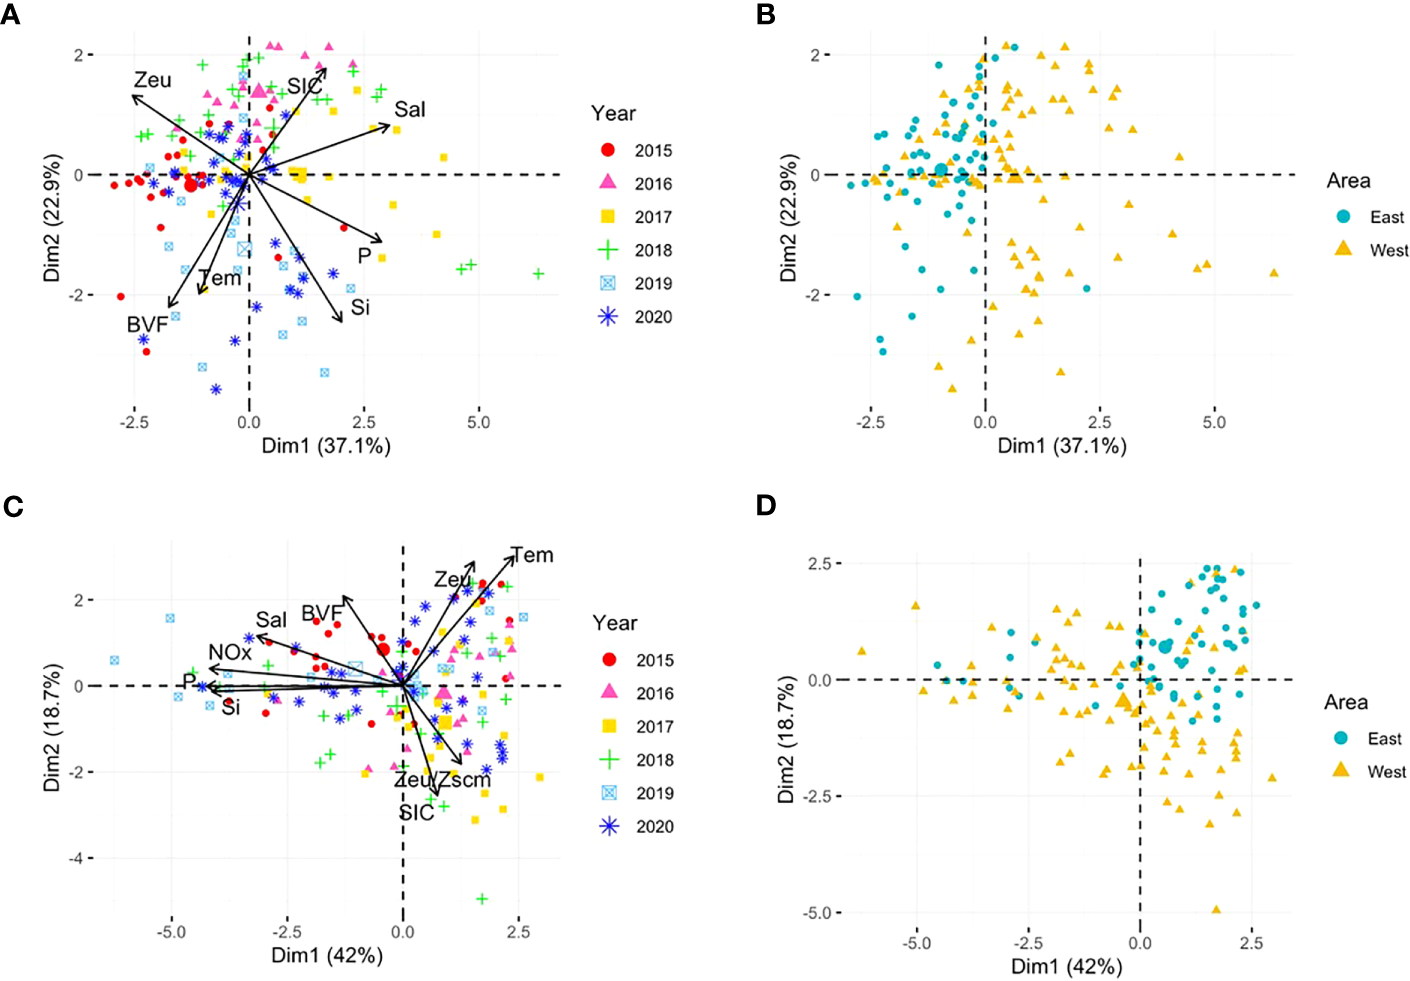
Principal component analysis (PCA) plots based on normalized environmental variable data for the surface (A, B) and SCM (C, D) layers. Colors and shapes indicate the cruise year and sampling area, respectively. In the surface layer, NOx was excluded from PCA because of nitrate depletion at most stations. Tem, temperature; Sal, salinity; NOx, nitrite and nitrate; P, phosphate; Si, silicate; SIC, 7-day average sea ice concentration (%) prior to the sampling period; BVF, mean Brunt–Väisälä frequency upper 100 m depth; Zeu, euphotic depth; Zscm, subsurface chlorophyll maximum layer depth.
3.2 Phytoplankton biomass and size structure
Chl-a concentration, an indicator of phytoplankton biomass, showed distinct spatiotemporal variations (Figure 8). Chl-a was higher in the western than the eastern part of the study area, which is consistent with previous results (Nishino et al., 2008; Lee et al., 2019). The August mean chl-a across all stations were compared to investigate how they changed over six years (Table 2). Mean chl-a integrated throughout the water column was highest in August 2018 (83.73 ± 71.69 mgm-2) and lowest in 2017 (23.91 ± 22.39 mgm-2). The highest value in 2018 was due to high phytoplankton biomass in both the surface and SCM layers. In 2015 and 2019, relatively high depth-integrated chl-a values were observed compared to the other years, mainly because of the high biomass in the SCM layer. Even though the August mean of surface chl-a was slightly higher (0.37 ± 0.58 μgL-1) in 2017 than in 2016 and 2020 (0.14 ± 0.18 μgL-1 and 0.12 ± 0.06 μgL-1, respectively), when the mean integrated chl-a was low (32.03 ± 13.08 mgm-2 and 34.72 ± 36.10 mgm-2, respectively), the lowest mean integrated chl-a was observed in 2017 due to lowest mean chl-a concentration in the SCM layer (0.62 ± 0.52 μgL-1).
Figure 8
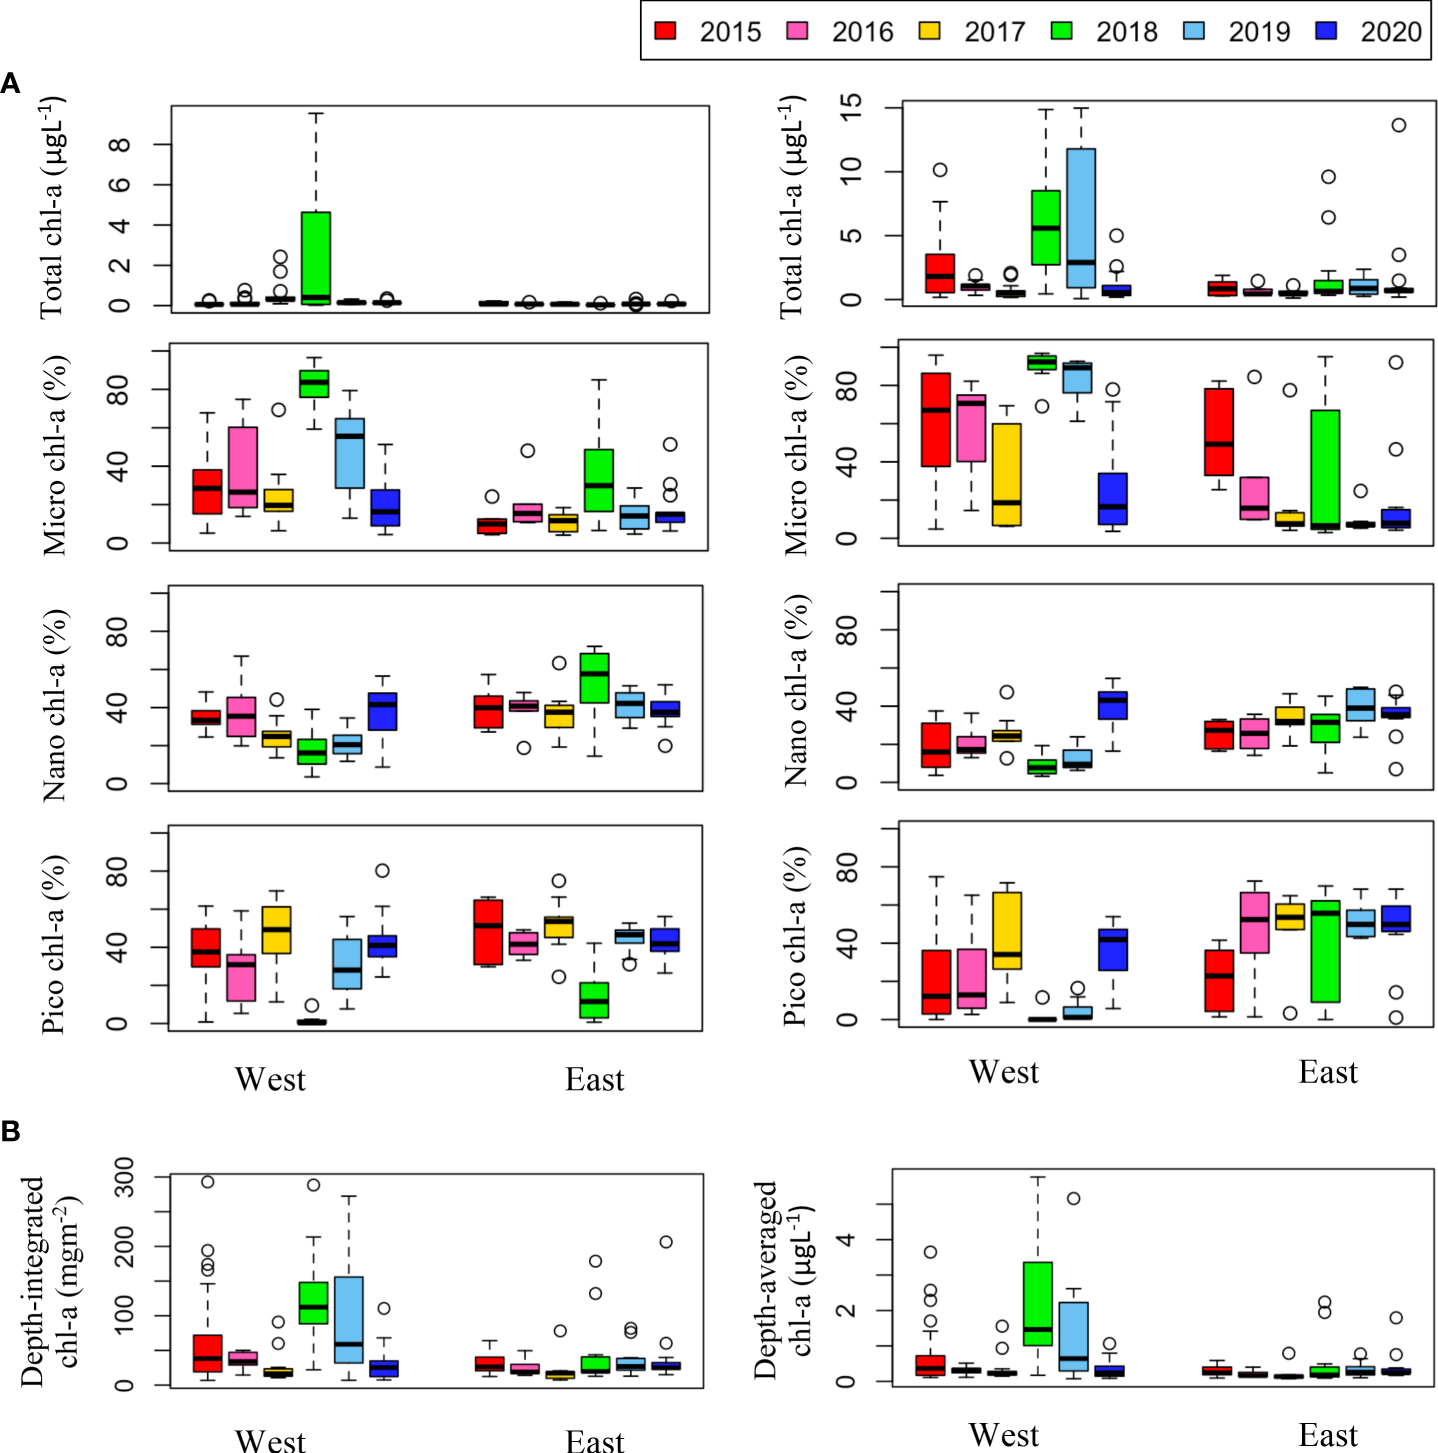
(A) Annual variations in total chl-a concentration (μgL-1) and size-fractionated chl-a (%) in the surface (left panel) and SCM (right panel) layers. Size-fractionated chl-a indicates that micro chl-a (>20 μm), nano chl-a (2–20 μm), and pico chl-a (<2 μm). (B) Annual variations in depth-integrated and depth-averaged chl-a concentrations on the east and west sides of the study area during the cruises.
The phytoplankton size structure showed a spatial distribution characterized by relatively high micro chl-a and diatom dominance in the western waters, as confirmed by microscopic observations (data not shown). In the eastern waters, phytoplankton biomass was dominated by cells less than 20 μm in size. Temporally, both micro chl-a dominance and diatom dominance were higher in 2018 and 2019, when water column integrated chl-a was high, suggesting that the increase in phytoplankton biomass in the study area was mainly driven by an increase in large size phytoplankton (> 20 μm). In the east, inter-annual variability in phytoplankton size structures was not evident in the surface layer, but the dominance rate of small size phytoplankton (< 20 μm) in the SCM layer was higher in 2017-2020 (73.3 ± 29.1%) (with the exception of 2018) than 2015-2016 (45.7 ± 29.2%). The size structure in 2018 and 2020 was dramatically different from that in other years, with higher micro chl-a dominance and lower nano and pico chl-a dominance in both the eastern and western areas. In addition, in 2020, a higher dominance rate of small size phytoplankton was observed in both western and eastern waters.
Correlation analysis of abiotic/biotic variables in the surface and SCM layers over the six-year study period showed that phytoplankton biomass and size structure were significantly correlated with physicochemical variables (Supplementary Table 1). Environmental variables such as seawater temperature, salinity, nutrient concentration, euphotic depth, and nitracline depth were significantly correlated with the total chl-a concentration and size-fraction chl-a dominance rate (p < 0.05) in both the surface and SCM layers. Nutrient concentrations exhibited a positive correlation with large size phytoplankton (> 20 μm) and a negative correlation with small size phytoplankton (< 20 μm). Moreover, correlations with other environmental variables such as seawater temperature, salinity, and water column vertical structure were reversed between the large and small size groups, indicating different spatiotemporal distributions for different phytoplankton size groups. SIC was positively correlated with the total chl-a and micro chl-a in the surface layer (p < 0.05), indicating that SIC may be related to the distribution of large diatoms in the surface layer of the NCESS. The mean value of BVF, which represents water column stability, was significantly correlated with chlorophyll concentration (r = -0.19, p < 0.05) and size-fraction chlorophyll dominance (p < 0.05) in the surface layer but not in the SCM layer, indicating a correlation between surface phytoplankton distribution and water column stability.
4 Discussions
4.1 Spatial variations of environments and phytoplankton biomass
Phytoplankton communities in the NCESS during summer (2015-2020) were influenced by spatial variations in physical and chemical variables in the east-west water mass structure (Lee et al., 2019; Ko et al., 2020). In the study area, the northern Chukchi Sea (east), which is influenced by warmer, lower-salinity Bering Sea Water inflow and the Beaufort Gyre, had a relatively higher surface temperature, lower surface salinity, and lower SICs than the west. Surface nitrate was depleted due to strong stratification, and phytoplankton biomass was low at most stations in the eastern area, with a high dominance of small-sized phytoplankton in this area. The western side of the study area and northern waters of the East Siberian Sea were characterized by higher SICs, cold saline surface waters, higher nutrient concentrations, and higher chl-a concentrations dominated by larger-sized phytoplankton than those on the eastern side. Previous (Lee et al., 2019) and the present studies generally exhibited environmental and phytoplankton distribution characteristics along the east-west water mass structure, but the present study showed more pronounced inter-annual variation than spatial variation in summer (August) during the six-year period from to 2015-2020.
4.2 Sea surface salinity and vertical stability
During the study period, the mean sea surface salinity in August was lower in 2015 and 2020 than in other years. Vertical stability (BVF) was strongly negatively correlated with surface salinity (r = -0.80, p < 0.001), with strong stratification in 2015 and 2020, indicating that salinity affects the vertical structure of the water column in colder waters, such as the Arctic Ocean (Timmermans and Jayne, 2016). Surface freshening in the Arctic Ocean is well documented (Proshutinsky et al., 2009; Carmack et al., 2016) and is known to be caused by increased sea ice melting and river discharge. Sea ice has both strengthening and weakening effects on water column stability. Sea ice melting supplies freshwater to the surface and strengthens vertical stratification, whereas sea ice loss could result in the deepening of the surface mixed layer due to the increased exposure of the ocean surface to wind. During the study period, SIC was positively correlated with surface salinity (r = 0.21, p < 0.01) and negatively correlated with BVF (r = -0.19, p < 0.05), indicating the influence of sea ice melt on surface salinity and water column stability in the NCESS. However, the inter-annual variation in sea-surface salinity is difficult to explain by complex spatiotemporal variability.
Changes in the western limit and areas of the Beaufort Gyre, which is characterized by low surface salinity, could also influence the physicochemical characteristics of the water mass east of the study area (Bertosio et al., 2022a). Morison et al. (2012) suggested that runoff has an important influence on the Arctic Ocean and established that the spatial and temporal manifestations of runoff pathways are modulated by the Arctic Oscillation rather than by the strength of the wind-driven Beaufort Gyre circulation. During our study period, Arctic Oscillation was higher in 2015 and 2020 than in 2016-2019. Correlation analysis showed a negative correlation between the August mean surface salinity and winter mean AO index (r = -0.69, p = 0.128). Field surveys in the study area were conducted in 2021 and 2022. Upon combining and analyzing the data from both years, a statistically significant negative correlation was observed (r = -0.7332, p = 0.038) (data not shown). Thus, the weak correlation in this study could be attributed to the potential influence of sample size on the p-value. The relationship between the AO index and environmental characteristics is still complex and not fully understood. A 37-year archive of observations showed that surface freshening potentially altered nutrient fluxes and primary production in the Arctic Ocean (Polyakov et al., 2020), thus, the influence of sea surface salinity on phytoplankton distribution in the Arctic Ocean needs to be established to predict primary production and marine ecosystems.
4.3 Nutrient concentrations
Strong stratification of the water column weakened the supply of nutrients from deeper layers to the surface. During the study period, surface nutrient concentrations differed between the 2015-2016 period and post-2017 periods, resulting in higher surface nutrient concentrations and a shallower nitracline in the latter period compared to the former (Figure 2). When comparing the surface nutrient concentrations during 2015 and 2020, in a period characterized by high water column stability, we observed that the concentration of surface nutrients was relatively higher in 2020, particularly in the upper 50 m of the water column, than in 2015 (Figure 4A). In August 2017, Jung et al. (2021) observed unprecedentedly high surface nutrient concentrations at the stations of the East Siberian Sea continental shelf and reported that halocline shoaling due to Atlantic water intrusion may be responsible. Bertosio et al. (2022b) reported that this phenomenon continued from 2017 to 2020, with increasingly stronger impacts on the Chukchi Sea. The synergistic effect of stratification weakening due to high surface salinity and water mass uplift to the surface due to Atlantic water intrusion may be responsible for the nutrient supply to the surface. Overall, the Atlantic-origin cold halocline water intrusion that has occurred since 2017 may have lifted the overlying nutrient-rich Pacific Waters to shallower depths, resulting in higher surface salinity in the study area and a supply of nitrate to the surface. Thus, while stratification was strong in both 2015 and 2020 owing to low surface salinity, the halocline uplift in 2020 may have resulted in a different distribution of nutrients in the upper layer than that in 2015. In the study area, nitrate is an important limiting factor for summer phytoplankton distribution (Danielson et al., 2017; Ko et al., 2020). Thus, the nutrient supply to the surface may result in increased phytoplankton biomass. Phytoplankton biomass may have been higher during 2017-2019, when both high surface salinity and Atlantic water intrusion were observed. Our results suggest that the high surface chl-a concentrations across the ocean in 2018 were caused by increased surface nitrate concentrations. However, low phytoplankton biomass was observed in 2017 and 2019, which could not be explained by the nitrate supply to the surface.
During periods of high phytoplankton biomass, the large phytoplankton group exhibited dominance, whereas the small phytoplankton group was more dominant during periods of low biomass. The positive correlation of the large phytoplankton group with nutrient concentrations and the negative correlation of the small phytoplankton group with nutrient concentrations suggest distinct responses to changes in nutrient levels between the two groups. Such differences in response to nutrient concentration indicate that nutrient supply to the surface layer of the study area could lead to the prevalence of large size phytoplankton and an increase in total chl-a. While the large and small size phytoplankton are commonly associated with diatoms and flagellates in this area, respectively (data not shown), the presence of small diatom cells, large flagellate cells, and flagellate communities complicates our understanding of the system. To gain a deeper understanding, community studies utilizing microscopy or photosynthetic pigments should be undertaken to discern the response of each phytoplankton group to nutrient concentrations.
4.4 Limiting factors for phytoplankton distribution
Jung et al. (2021) analyzed a dataset for 2015-2017, which is part of the data used in this study and reported that surface chl-a concentrations were higher in August 2017 than in previous years in part of the East Siberian Continental Shelf owing to shoaling of the nutricline by halocline water intrusions. However, the mean chl-a concentration at all stations in the NCESS in 2017 was not significantly different from that in previous years, probably because of the localized effect of nutricline shoaling on phytoplankton distribution. The surface nitrate concentrations were still below the detection limit at most stations in 2017 (18 of 22 stations), and the August mean nitrate concentration at the upper SCM depth was the lowest in 2017 (Figure 4B), indicating nitrate limitation on phytoplankton growth over the NCESS during this period. In 2019, the surface nitrate, phosphate, and silicate concentrations were high at most stations, and they had the lowest number of stations with nitrate concentrations below the detection limit in the surface layer (2 out of 21). Despite higher nutrient concentrations at the surface layer in 2019, August mean surface chl-a concentration was 10 times lower (0.13 ± 0.08 μgL-1) than in 2018 (1.31 ± 2.88 μgL-1) in the study area. Chl-a concentrations in the SCM layer were slightly higher at some stations on the East Siberian Sea continental shelf, but the average water column-integrated chl-a concentration in the study area was approximately 26% lower in August 2019 than in August 2018.
The low phytoplankton biomass in the study area in August 2019 could be attributed to several factors. Sea ice dynamics, nitrate concentrations, grazing pressure, and light intensity may be important limiting factors for phytoplankton growth during the post-bloom period in August. First, the rapid timing and speed of sea ice retreat and the low August mean sea ice concentration in 2019 (Figure 3) may have influenced the phytoplankton bloom phenology, resulting in an early phytoplankton bloom (Fujiwara et al., 2016; Lee et al., 2019). The August mean nitrate concentration in the upper SCM depth was highest in 2019 (Figure 4B) and is unlikely to be a limiting factor for phytoplankton growth. Grazing pressure at higher trophic levels is likely to be one of the limiting factors for phytoplankton in 2019, as the mesozooplankton abundance was reported to be slightly higher in August 2019 than in August 2018 in the west (Kim et al., 2022). Finally, the mean daily insolation was lowest in 2019 (average 184 μEm-2d-1) in the six-year survey. The low SICs in 2019 resulted in an increased light penetration rate over the air-sea boundary layer. However, reduced insolation may have reduced the intensity of light penetrating the ocean and directly affected phytoplankton growth in the water column. Interestingly, in 2018, the year with the highest integrated chl-a concentration was also the year with strong Atlantic water intrusion, high surface nutrient concentrations, and the highest average insolation during the study period. August 2020 also had low mean chl-a concentrations in the study area, and along with 2017, these two periods were among the lowest values for daily mean insolation. Nitrate limitation in phytoplankton communities has been reported in many studies using field observations and culture experiments in the Arctic Ocean (Tremblay and Gagnon, 2009; Ko et al., 2020; Randelhoff et al., 2020), however, reports on light limitation are rare.
4.5 Importance of light on phytoplankton distribution
Light is a critical factor in phytoplankton growth and productivity in the Arctic Ocean. During the summer, the Arctic experiences nearly 24 h of daylight, which provides light for phytoplankton to photosynthesize and grow. However, the extent of sea ice in the Arctic has been declining owing to climate change, which has led to changes in the amount and timing of light available to phytoplankton. For example, sea ice loss leads to increased light penetration into the ocean, which can stimulate phytoplankton growth in certain areas (Lewis et al., 2020). Light transmittance is considered to be a key factor in the availability of light for phytoplankton in the water column, and the quantity of sunlight also plays a critical role. In this study, the euphotic depth was shallower in 2017-2020 (41.2 ± 14.0 m) compared to 2015-2016 (48.5 ± 12.4 m). Shallowing the euphotic zone reduces the depth at which phytoplankton can grow, causing the SCM layer to develop at shallower depths and limiting phytoplankton growth because the shallower SCM layer has a limited ability to receive nutrients from the bottom. However, in the study area, nutrient concentrations in the SCM layer were not low enough to limit phytoplankton growth because a nitracline was uplifted by Atlantic water intrusion at approximately the same time (2017-2020). The light environment in the SCM layer, represented by Zeu/Zscm, also showed values above 1 since 2017. This suggests that the depth of the euphotic zone is deeper than Zscm, which means that more than 1% of the surface light reaches the SCM layer, and that light is not likely to limit phytoplankton growth. However, compared to 2015 and 2016 (averaging 225 μEm-2d-1 and 235 μEm-2d-1, respectively), the amount of sunlight reaching the surface of the ocean has been lower since 2017 (184 - 207 μEm-2d-1) except for 2018, which averaged 271 μEm-2d-1. Because lower solar irradiance reduces the amount of light transmitted to the water column, the absolute value of light may have decreased, although the proportion of light reaching the depth of the SCM has increased since 2017. In fact, the August mean of PAR observed at SCM depth was highest in 2018 (7.45 ± 8.65 μEm-2s-1), 2019 (2.48 ± 2.50 μEm-2s-1) was the second lowest, and lowest (2.25 ± 2.53 μEm-2s-1) in 2015. Studies on the effects of light on phytoplankton distribution during summer in the Arctic Ocean are rare, but the growth and physiological characteristics of phytoplankton responses to light have recently been reported in NCESS waters (Ko et al., 2022; Shiozaki et al., 2022). Therefore, further research is needed to understand the effects of light on phytoplankton distribution in the study area.
5 Conclusions
The spatial distribution of environmental and biological variables in the NCESS in August supported the hypothesis of a general east-west variation, with relatively cold saline waters, higher nutrient, sea ice, and chl-a concentrations with a prevalence of the large size phytoplankton in the west (northern East Siberian Sea), and warm fresh and oligotrophic waters, low sea ice concentrations, and dominance of small size phytoplankton in the east (northern Chukchi Sea). However, inter-annual variations were more pronounced than spatial variations during the six-year period from 2015-2020, indicating complex interactions between environmental variables and phytoplankton communities in the Arctic Ocean. Inter-annual variations of sea surface salinity affected the water column stability. The intrusion of Atlantic water into the study area since 2017 has led to shoaling of the halocline to shallower depths, subsequently causing an increase in surface salinity and providing nitrate to the surface, consequently influencing the increase in phytoplankton biomass. During periods of high phytoplankton biomass, the dominance of the larger phytoplankton and the prevalence of the smaller phytoplankton during periods of low biomass indicate that different responses to changes in nutrient levels between the two groups occur, implying that nutrient supply to the surface layer of the study area could lead to an increase in large-sized phytoplankton and total chl-a. However, changes in the amount and timing of light available to Arctic Ocean phytoplankton could have complex effects on growth. In this study, although the depth of the Zeu became shallow, the amount of sunlight reaching the ocean surface decreased in 2017 and 2019. Our results imply that the nutrient supply (sea surface salinity, water column vertical stability, and nitracline shoaling) and increased light availability (SIC, Zeu, and insolation) can stimulate phytoplankton growth, leading to an increase in their biomass. Thus, the importance of light as a limiting factor for phytoplankton growth, which has rarely been studied in the study area, should not be overlooked when understanding the impact of environmental changes on phytoplankton growth in the region.
Statements
Data availability statement
The original contributions presented in the study are included in the article/Supplementary Material. Further inquiries can be directed to the corresponding author.
Author contributions
YL contributed to the conception and design of the study. YL, K-HC, JJ, and JM conducted the investigations and processed the data. YL organized the database and performed the statistical analysis and wrote the first draft of the manuscript. EY and S-HK organized the field campaign and contributed to the funding acquisition. All authors contributed to the revision of the manuscript, and have read and approved the submitted version.
Funding
This research was supported by Korea Institute of Marine Science & Technology Promotion (KIMST) funded by the Ministry of Oceans and Fisheries (20210605, Korea-Arctic Ocean Warming and Response of Ecosystem, KOPRI).
Acknowledgments
The authors thank the captain and crew of the IBRV ARAON who were most helpful in all shipboard operations. We gratefully acknowledge the reviewers for their constructive and insightful comments.
Conflict of interest
The authors declare that the research was conducted in the absence of any commercial or financial relationships that could be construed as a potential conflict of interest.
Correction note
A correction has been made to this article. Details can be found at: 10.3389/fmars.2025.1633102.
Publisher’s note
All claims expressed in this article are solely those of the authors and do not necessarily represent those of their affiliated organizations, or those of the publisher, the editors and the reviewers. Any product that may be evaluated in this article, or claim that may be made by its manufacturer, is not guaranteed or endorsed by the publisher.
Supplementary material
The Supplementary Material for this article can be found online at: https://www.frontiersin.org/articles/10.3389/fmars.2023.1237150/full#supplementary-material
References
1
Ardyna M. Arrigo K. R. (2020). Phytoplankton dynamics in a changing Arctic Ocean. Nat. Climate Change10 (10), 892–903. doi: 10.1038/s41558-020-0905-y
2
Arrigo K. R. van Dijken G. Pabi S. (2008). Impact of a shrinking Arctic ice cover on marine primary production. Geophysical Res. Lett35, L19603. doi: 10.1029/2008GL035028
3
Bertosio C. Provost C. Athanase M. Sennéchael N. Garric G. Lellouche J. M. et al . (2022a). Changes in freshwater distribution and pathways in the Arctic Ocean since 2007 in the Mercator Ocean global operational system. J. Geophysical Res. Oceans127 (6), e2021JC017701. doi: 10.1029/2021JC017701
4
Bertosio C. Provost C. Athanase M. Sennéchael N. Garric G. Lellouche J. M. et al . (2022b). Changes in Arctic halocline waters along the East Siberian slope and in the Makarov Basin from 2007 to 2020. J. Geophysical Res. Oceans127 (9), e2021JC018082. doi: 10.1029/2021JC018082
5
Carmack E. C. Yamamoto-Kawai M. Haine T. W. Bacon S. Bluhm B. A. Lique C. et al . (2016). Freshwater and its role in the Arctic Marine System: Sources, disposition, storage, export, and physical and biogeochemical consequences in the Arctic and global oceans. J. Geophysical Research: Biogeosciences121 (3), 675–717. doi: 10.1002/2015JG003140
6
Clarke K. Gorley R. (2006). Primer v. 6: User manual/Tutorial. Plymouth routine in multivariate ecological research (Plymouth: Primer-e Ltd).
7
Coupel P. Jin H. Joo M. Horner R. Bouvet H. Sicre M.-A. et al . (2012). Phytoplankton distribution in unusually low sea ice cover over the Pacific Arctic. Biogeosciences9, 4835–4850. doi: 10.5194/bg-9-4835-2012
8
Coupel P. Matsuoka A. Ruiz-Pino D. Gosselin M. Marie D. Tremblay J.-É. et al . (2015). Pigment signatures of phytoplankton communities in the Beaufort Sea. Biogeosciences12 (4), 991–1006. doi: 10.5194/bg-12-991-2015
9
Danielson S. L. Eisner L. Ladd C. Mordy C. Sousa L. Weingartner T. J. (2017). A comparison between late summer 2012 and 2013 water masses, macronutrients, and phytoplankton standing crops in the northern Bering and Chukchi Seas. Deep Sea Res. Part II: Topical Stud. Oceanography135, 7–26. doi: 10.1016/j.dsr2.2016.05.024
10
Fujiwara A. Hirawake T. Suzuki K. Eisner L. Imai I. Nishino S. et al . (2016). Influence of timing of sea ice retreat on phytoplankton size during marginal ice zone bloom period on the Chukchi and Bering shelves. Biogeosciences13 (1), 115–131. doi: 10.5194/bg-13-115-2016
11
Fujiwara A. Hirawake T. Suzuki K. Imai I. Saitoh S.-I. (2014). Timing of sea ice retreat can alter phytoplankton community structure in the western Arctic Ocean. Biogeosciences11 (7), 1705–1716. doi: 10.5194/bg-11-1705-2014
12
Gibson G. A. Elliot S. Clement Kinney J. Piliouras A. Jeffery N. (2022). Assessing the potential impact of river chemistry on arctic coastal production. Front. Mar. Sci.9, 675. doi: 10.3389/fmars.2022.738363
13
Gordon L. I. Jennings J. C. Jr. Rose A. A. Krest J. M. (1993). A suggested protocol for continuous flow automated analysis of seawater nutrients (phosphate, nitrate, nitrite and silicic acid) in the WOCE hydrographic program and the joint global ocean fluxes study. Methods Manual WHPO91–91.
14
Houry S. Dombrowsky E. De Mey P. Minster J.-F. (1987). Brunt-Väisälä frequency and Rossby radii in the South Atlantic. J. Phys. Oceanography17 (10), 1619–1626. doi: 10.1175/1520-0485(1987)017<1619:BVFARR>2.0.CO;2
15
Jung J. Cho K. H. Park T. Yoshizawa E. Lee Y. Yang E. J. et al . (2021). Atlantic-origin cold saline water intrusion and shoaling of the nutricline in the Pacific Arctic. Geophysical Res. Lett.48 (6), e2020GL090907. doi: 10.1029/2020GL090907
16
Kahru M. Brotas V. Manzano-Sarabia M. Mitchell B. (2011). Are phytoplankton blooms occurring earlier in the Arctic? Global Change Biol.17 (4), 1733–1739. doi: 10.1111/j.1365-2486.2010.02312.x
17
Kim J. H. La H. S. Cho K. H. Jung J. Kang S. H. Lee K. et al . (2022). Spatial and interannual patterns of epipelagic summer mesozooplankton community structures in the western Arctic Ocean in 2016–2020. J. Geophysical Research: Oceans127 (3), e2021JC018074.
18
Ko E. Gorbunov M. Y. Jung J. Joo H. M. Lee Y. Cho K. H. et al . (2020). Effects of nitrogen limitation on phytoplankton physiology in the western Arctic Ocean In summer. J. Geophysical Research: Oceans125 (11), e2020JC016501.
19
Ko E. Gorbunov M. Y. Jung J. Lee Y. Cho K.-H. Yang E. J. et al . (2022). Phytoplankton photophysiology varies depending on nitrogen and light availability at the subsurface chlorophyll maximum in the northern Chukchi Sea. Front. Mar. Sci.9, 979998. doi: 10.3389/fmars.2022.979998
20
Lee Y. Min J.-O. Yang E. J. Cho K.-H. Jung J. Park J. et al . (2019). Influence of sea ice concentration on phytoplankton community structure in the Chukchi and East Siberian Seas, Pacific Arctic Ocean. Deep Sea Res. Part I: Oceanographic Res. Papers147, 54–64.
21
Lewis K. van Dijken G. Arrigo K. R. (2020). Changes in phytoplankton concentration now drive increased Arctic Ocean primary production. Science369(6500), 198–202.
22
Mojica K. D. van de Poll W. H. Kehoe M. Huisman J. Timmermans K. R. Buma A. G. et al . (2015). Phytoplankton community structure in relation to vertical stratification along a north-south gradient in the Northeast Atlantic Ocean. Limnology Oceanography60 (5), 1498–1521. doi: 10.1002/lno.10113
23
Morison J. Kwok R. Peralta-Ferriz C. Alkire M. Rigor I. Andersen R. et al . (2012). Changing arctic ocean freshwater pathways. Nature481 (7379), 66–70.
24
Nishino S. Shimada K. Itoh M. Yamamoto-Kawai M. Chiba S. (2008). East–west differences in water mass, nutrient, and chlorophyll a distributions in the sea ice reduction region of the western Arctic Ocean. J. Geophysical Research: Oceans113 (C00A01). doi: 10.1029/2007JC004666
25
Oziel L. Schourup-Kristensen V. Wekerle C. Hauck J. (2022). The pan-Arctic continental slope as an intensifying conveyer belt for nutrients in the central Arctic Ocean, (1985–2015). Global Biogeochemical Cycles36 (6), e2021GB007268. doi: 10.1029/2021GB007268
26
Parkinson C. L. Comiso J. C. (2013). On the 2012 record low Arctic sea ice cover: Combined impact of preconditioning and an August storm. Geophysical Res. Lett.40 (7), 1356–1361. doi: 10.1002/grl.50349
27
Parsons T. Maita Y. Lalli C. (1984). “Fluorometric determination of chlorophylls,” in A manual of chemical and biological methods for seawater analysis. Eds. ParsonsT.MaitaY.LalliC. (Oxford: Pergamon), 173.
28
Perovich D. K. (2011). The changing Arctic sea ice cover. Oceanography24 (3), 162–173. doi: 10.5670/oceanog.2011.68
29
Peterson B. J. Holmes R. M. McClelland J. W. Vörösmarty C. J. Lammers R. B. ShiklOmanov A. I. et al . (2002). Increasing river discharge to the Arctic Ocean. Science298 (5601), 2171–2173. doi: 10.1126/science.1077445
30
Polyakov I. V. Alkire M. B. Bluhm B. A. Brown K. A. Carmack E. C. Chierici M. et al . (2020). Borealization of the Arctic Ocean in response to anomalous advection from sub-Arctic seas. Front. Mar. Sci.7, 491. doi: 10.3389/fmars.2020.00491
31
Proshutinsky A. Krishfield R. Timmermans M. L. Toole J. Carmack E. McLaughlin F. et al . (2009). Beaufort Gyre freshwater reservoir: State and variability from observations. J. Geophysical Research: Oceans114 (C1). doi: 10.1029/2008JC005104
32
Randelhoff A. Holding J. Janout M. Sejr M. K. Babin M. Tremblay J.-É. et al . (2020). Pan-Arctic Ocean primary production constrained by turbulent nitrate fluxes. Front. Mar. Sci.7, 150. doi: 10.3389/fmars.2020.00150
33
Shiozaki T. Fujiwara A. Sugie K. Nishino S. Makabe A. Harada N. (2022). Bottom-associated phytoplankton bloom and its expansion in the Arctic Ocean. Global Change Biol.28 (24), 7286–7295. doi: 10.1111/gcb.16421
34
Sieburth J. M. Smetacek V. Lenz J. (1978). Pelagic ecosystem structure: heterotrophic compartments of the plankton and their relationship to plankton size fractions. Limnology Oceanography23 (6), 1256–1263. doi: 10.4319/lo.1978.23.6.1256
35
Thompson D. W. Wallace J. M. (1998). The Arctic Oscillation signature in the wintertime geopotential height and temperature fields. Geophysical Res. Lett.25 (9), 1297–1300. doi: 10.1029/98GL00950
36
Timmermans M.-L. Jayne S. R. (2016). The arctic ocean spices up. J. Phys. Oceanography46 (4), 1277–1284. doi: 10.1175/JPO-D-16-0027.1
37
Tremblay J.-É. Anderson L. G. Matrai P. Coupel P. Bélanger S. Michel C. et al . (2015). Global and regional drivers of nutrient supply, primary production and CO2 drawdown in the changing Arctic Ocean. Prog. Oceanography139, 171–196. doi: 10.1016/j.pocean.2015.08.009
38
Tremblay J.-É. Gagnon J. (2009). “The effects of irradiance and nutrient supply on the productivity of Arctic waters: a perspective on climate change,” in Influence of climate change on the changing arctic and sub-arctic conditions (Netherlands: Springer).
39
Tuerena R. E. Mahaffey C. Henley S. F. de la Vega C. Norman L. Brand T. et al . (2022). Nutrient pathways and their susceptibility to past and future change in the Eurasian Arctic Ocean. Ambio51, 355–369. doi: 10.1007/s13280-021-01673-0
40
Venables H. Moore C. M. (2010). Phytoplankton and light limitation in the Southern Ocean: Learning from high-nutrient, high-chlorophyll areas. J. Geophysical Research: Oceans115 (C02015). doi: 10.1029/2008JC005104
Summary
Keywords
phytoplankton biomass, phytoplankton size structure, Chukchi Sea, East Siberian Sea, Arctic Ocean
Citation
Lee Y, Cho K-H, Jung J, Moon JK, Yang EJ and Kang S-H (2023) Multi-year variability of summer phytoplankton biomass and size structure in the northern Chukchi and East Siberian Seas, Arctic Ocean: role of light and nutrient availability. Front. Mar. Sci. 10:1237150. doi: 10.3389/fmars.2023.1237150
Received
08 June 2023
Accepted
14 August 2023
Published
29 August 2023
Corrected
13 June 2025
Volume
10 - 2023
Edited by
Jin Zhou, Tsinghua University, China
Reviewed by
Jacqueline Mary Grebmeier, Center for Environmental Science, University of Maryland, College Park, United States
Rebekah Shunmugapandi, Bigelow Laboratory For Ocean Sciences, United States
Updates
Copyright
© 2023 Lee, Cho, Jung, Moon, Yang and Kang.
This is an open-access article distributed under the terms of the Creative Commons Attribution License (CC BY). The use, distribution or reproduction in other forums is permitted, provided the original author(s) and the copyright owner(s) are credited and that the original publication in this journal is cited, in accordance with accepted academic practice. No use, distribution or reproduction is permitted which does not comply with these terms.
*Correspondence: Youngju Lee, yjlee@kopri.re.kr
Disclaimer
All claims expressed in this article are solely those of the authors and do not necessarily represent those of their affiliated organizations, or those of the publisher, the editors and the reviewers. Any product that may be evaluated in this article or claim that may be made by its manufacturer is not guaranteed or endorsed by the publisher.