 Yan Xu
 Xumeng Huo1
 Ferenc Jordán
- 1College of Marine Science and Technology, China University of Geosciences, Wuhan, China
- 2John von Neumann Faculty of Informatics, Biomatics and Applied Artificial Institution, Óbuda University, Budapest, Hungary
- 3Department of Chemistry, Life Sciences and Environmental Sustainability, University of Parma, Parma, Italy
- 4Guangdong Provincial Key Laboratory of Water Quality Improvement and Ecological Restoration for Watersheds, Institute of Environmental and Ecological Engineering, Guangdong University of Technology, Guangzhou, China
Ecosystems become increasingly similar to each other, based on species composition. Despite the inevitability of homogenized ecosystems due to global change, few studies have specifically addressed the identification of homogeneous systems in food webs. This study focuses on identifying different patterns of marine food web homogenization by selecting 41 marine food webs and establishing an indicator system. The research classifies the food webs into seven main types based on three different homogenization processes (I, II, III, IV, V, VI, and VII), with approximately 60.1%, 46.3%, and 61% of the homogenization being structural, functional, and resource homogenization, respectively. It highlights the importance of homogenization processes in marine ecosystems, which are mainly driven by interactions between structural and resource homogenization. The research found that Type V exhibited universality in both temporal and spatial dimensions, while Type III also showed universality when the food webs were dominated by resource homogenization. On the other hand, Type I, which was associated with human activities, showed locality when the food web only manifested structural homogenization. Functional homogenization often occurred alongside structural homogenization, as seen in Type IV and Type VII. Yet, when the food web exhibited functional homogenization (Type II), it was directly linked to human activities over the past 20 years. The research aimed to improve the methodology in terms of (a) identifying different food web homogenization patterns; (b) establishing indicators system to quantify food web homogenization; and (c) clarifying the ecological significance of food web homogenization. The study provided a comprehensive understanding of food web homogenization and its associated risks, which could inform nature-based ecosystem management strategies to mitigate the impacts of future climate change.
1 Introduction
Ongoing climate change the behavior, reproduction and phenology of many species (Descamps et al., 2019). Some need to change their area and invade new habitats. Together with human-generated introductions, seriously reshuffle species distributions, resulting in homogenization (Lövei, 1997). Altered species composition results in changes in interspecific interactions and, ultimately, the structure and functioning of ecosystems worldwide. Invading species and novel interactions rewire food webs (Bartley et al., 2019). Evidence suggests that this rewiring is creating a novel heterogeneity, resulting in asymmetries and mismatches to physical and abiotic properties (Lehikoinen et al., 2019; Rathore et al., 2020). This heterogeneity is causing structural variations in ecosystems, which in turn affects the link configuration and node features of food web networks (Gonzalez et al., 2020; Schell et al., 2020). Kortsch et al. (2015) detects that the expansion of the sub-network module size dominated by generalist species has increased network connectance and reduced modularity in the Barents Sea (Kortsch et al., 2015). A few generalist and often cosmopolitan species may be involved in a large number of inter-specific interaction, either as prey or predator, host or parasite (Scott and Helfman, 2001). These ubiquitous changes made to networks may result in novel topologies, for example, make them more similar to scale-free networks, with characteristics such as preferential attachment and high clustering coefficient. It will result in both high vulnerability and robustness in a food web (Barabási and Bonabeau, 2003). This process is known as food web homogenization (in terms of topology, beyond homogenization in terms of species composition) and simplifies the interrelationships within the network (Dunne et al., 2004). This reflects the ecological homogenization problem at the food web level, which has been the subject of increasing reports in recent decades. Magurran has proposed that the biotic homogenization phenomenon of fish communities in the North Atlantic reflects community feedback to ocean temperature changes (Magurran et al., 2015). The issue of biotic homogeneity is not limited to one aspect of ecosystems, but rather is widespread throughout various stages. It can be seen in various instances such as the occasional mixing of taxa through paleontological records, breakdown of biogeographic fauna, and genetic similarities in freshwater and terrestrial ecosystems (Olden et al., 2004; Olden, 2006). Biotic homogenization can be classified into three types: genetic, taxonomic, and functional, which explain how homogenization occurs at the molecular, individual, and population levels (Clavel et al., 2011). While homogenized ecosystems are believed to be an inevitable result of global change (Lövei, 1997; Hobbs et al., 2009; Groffman et al., 2014), there has been little research on how homogenization is expressed in food webs and the identification of different types of homogenization processes.
Food web homogenization (FwH) is a phenomenon that reflects several state characteristics of an ecosystem (Rooney and McCann, 2012). One of these characteristics is topological simplification, which occurs when the complexity of the network decreases due to species loss (reduced number of nodes). But beyond the size of the network (in terms of the number of nodes), topology can be simplified in other ways, including connectivity density and network diameter reduction. Several mechanisms may lead to an increased similarity in link structure and reduced network modularity. This structural dynamic is mainly caused by a biotic homogenization process and can result in alterations in interspecific interactions (Cazelles et al., 2019). It is probably presented as a series of network topology problems, such as network sparsification, network path length reduction, network hierarchy flattening and reduced average mutual information in the network (Ulanowicz, 2004). Functional non-redundancy is one of the manifestations of FwH (see also Heymans et al., 2014), where multiple species have similar ecological roles and functions in the food web, leading to increased competition in the ecosystem. Additionally, FwH can also lead to resource centralization, where middle and low-level species occupy core importance, resulting in the formation of hub resource nodes and making the system more vulnerable to directional disturbances (somewhat similarly to an agro-ecological monoculture, in an extreme case, where disturbing the crop species may result in the collapse of the whole system). Phenotypic differences in state characteristics can lead to various ecosystem risks, including biodiversity decline, nutrient cycling imbalances, and eutrophication (Schiettekatte et al., 2020; Obura et al., 2021; Geng et al., 2022). Therefore, it is important to identify the types of food web homogeneity in order to explore systematic risks.
Combined with previous research, biotic homogenization can be characterized by several indicators in the literature (Wang et al., 2021). β-biodiversity can indicate the spatial heterogeneity of the community (Willig et al., 2023), and the Sørensen dissimilarity index (βSOR) is commonly used in ecological research to compare the spatial differentiation between communities (Musseau et al., 2022). The Jaccard index is typically used to calculate compositional similarity excludes joint absence (Fraser et al., 2022), while the Bray-Curtis Similarity index or Morisita’s index is applied to measure relative abundance data (Olden and Rooney, 2006; Knop, 2016). Food web homogenization, on the other hand, is different from biotic homogenization in the general sense, as it includes the connotation of biotic homogenization, but is considered a more detailed elaboration of the complexity of the network object.
Due to the relatively narrow range of demands on primary producers in marine food webs, there is a higher risk of food web homogenization. In this research, we aimed to identify various patterns of homogenization in marine food webs. We selected 41 marine food webs and established an indicator system to classify them into 7 main types (I, II, III, IV, V, VI, and VII) based on 3 different homogenization processes (structural, functional, and resource homogenization). We recorded specific information for each food web, such as latitude, sampling time, and the total number of nodes and links. We used complex network methods to calculate relevant network indicators and established thresholds for these indicators. Finally, we calculated correlations between indicators. This study aims to enhance the methodology in terms of (a) identifying different food web homogenization patterns; (b) establishing an indicator system to quantify food web homogenization; and (c) clarifying the ecological significance of food web homogenization. The work will provide a comprehensive concept of food web homogenization and improve our understanding of the risks associated with homogenizing systems, which will contribute to the development of nature-based ecosystem management countermeasures against future climate change.
2 Methods
2.1 Classification of food web homogenization
Based on the state characteristics of food webs depicted in Figure 1, we categorized food web homogenization into three types. (a) Structural Homogenization (SH), which refers to a topological simplification process in food webs resulting in a decrease in complexity. From the perspective of complex networks, apart from a reduction in the number of nodes or links, this process is predominantly reflected in the issue of decreased modularity. The degree of network modularity is directly proportional to the structural complexity of a network. Therefore, if a network has a high number of nodes and links but few aggregated sub-net modules, it implies that the network structure follows a simple cascading relationship and lacks complex network characteristics such as small-worldness, self-organization, or scale-free properties.
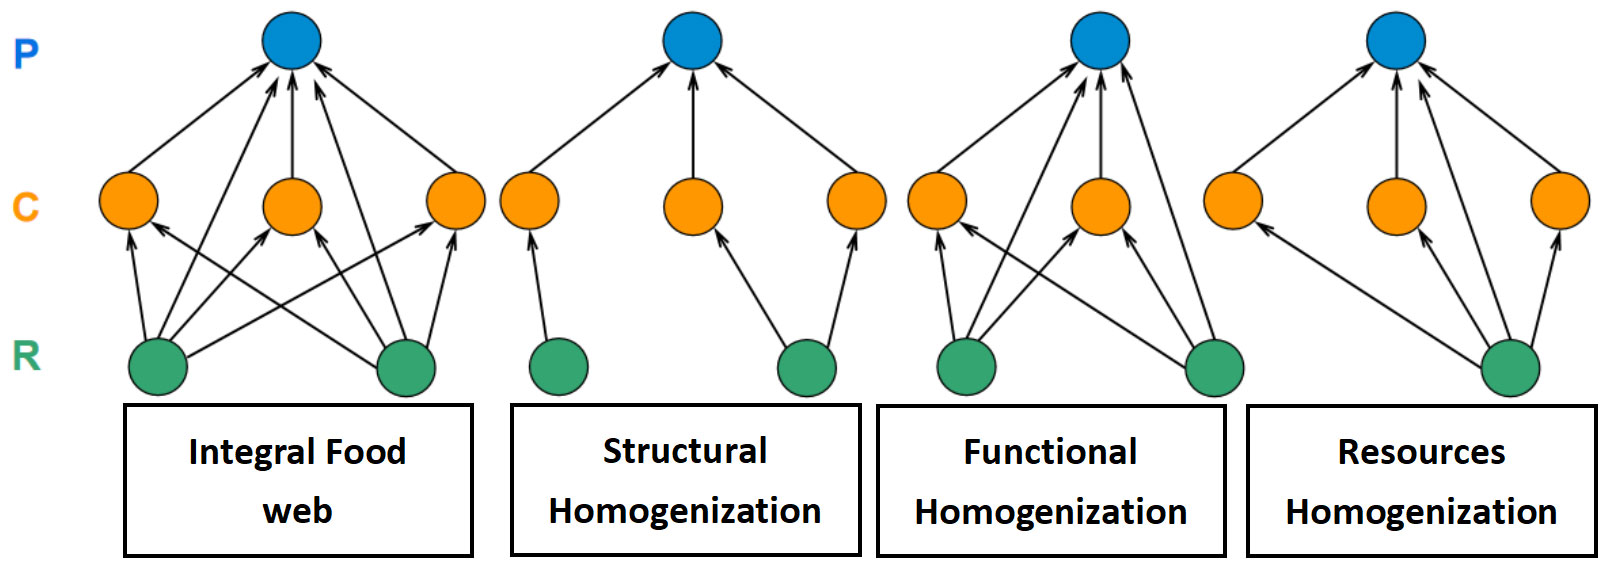
Figure 1 The diagrammatic sketch of food web homogenization. Blue nodes referred to the predator; orange nodes referred to the consumer; green nodes referred to the resource.
(b) Functional homogenization (FH). It represents ecological functional non-redundancy in food webs, which includes a decline of niche overlap or functional diversity. Each species and predator-prey linkages in a food web perform different ecological functions. For example, top predators can directly affect connected prey and indirectly impact basal-species, leading to a trophic cascade (Soler et al., 2015). The functional diversity of species interactions is significantly and positively related to ecosystem stability (Gonzalez et al., 2020). Numerous functionalized redundancy groups can enhance the system’s resistance against random disturbances.
(c) Resources homogenization (RH) refers to a process of resource centralization in food webs. The primary producers in aquatic ecosystems have a relatively unitary composition pattern. In the ocean, phytoplankton is the sole source of primary productivity in oligotrophic regions. In some freshwater lakes affected by human activities, the decline in biomass of benthic organisms and zooplankton, which are prey resources for higher trophic-level species, has resulted in a food web that depends solely on a monodominant resource group for material and energy supply (it referred to a special case of FH).
2.2 Quantifying the food web homogenization
In section 2.1, we used various indicators to quantify FwH. To measure network complexity, we relied on modularity, a key index for structural homogenization. The modularity of a food web is determined by the degree of clustering between nodes. A higher degree of modularity indicates that nodes in the food web tend to form closely connected modules or functional blocks, with relatively fewer connections between modules. Research has demonstrated that modularity is strongly linked to food web complexity (Montoya et al., 2015). For directed networks, we used the Newman-Girvan modularity approach (Newman, 2004), considered a density-based modularity approach (Guimerà et al., 2010). It is a network aggregation method within the complex networks field (Giacomuzzo and Jordán, 2021). To determine the total number of modules, we applied an extension of the Leiden algorithm (Traag et al., 2019). It solved the problem of arbitrarily connected and disconnected communities, which is expressed by the following equation:
where Q represents the network modularity; L is referred to the total number of links; Aij is the adjacency matrix of the food web; kiin represents the in-degree of node i; kjout is the out-degree of node j; δmimj represents the Kronecker delta for module i and j, which provides a succinct encoding of the graph information (Kozen and Timme, 2007). We utilized the R package igraph to calculate food web modularity (https://r.igraph.org/).
In addition, for functional homogenization, we treated interaction profile diversity (IPD) as an indicator to quantify functional diversity or redundancy, reflected heterogeneity in ecosystem traits. We used a network-based measure of functional diversity, based on the positive and negative effects of species i and j up on n steps (i.e. Eij,n+, Eij,n-) and applied the complementary Marczewski-Steinhaus index to quantify the dissimilarity of species interactions (Lin et al., 2022). Apart from Rao’s quadratic entropy method (Botta-Dukát, 2005), the IPD method, which is a network-based approach, calculates the average dissimilarity between two interaction profiles, and the IPD value increases with the higher functional diversity in the food web. The related equations are listed below:
where aij,n represents the n-step effect of species i on species j, in this research, n is assigned 3. dij represents dissimilarity of interaction profiles for species i and j, which ranges from 0 to 1, and large dij referred to high dissimilarity. S represents the total number of species nodes. When the IPD is small, it indicates fewer interactions in the network, resulting in lower functional diversity within the system, thereby potentially giving rise to functional homogenization issues.
To ensure consistency in identifying resource nodes, it is important to recognize that in a food web, not only the basal species with a kiin value of 0 are considered as resources. Primary or secondary consumers such as Antarctic krill (Euphausia superba) are also included. Therefore, for the purpose of this research, we define resource nodes as those with an out-degree significantly greater than their in-degree (kiout>kiin). To achieve this, we propose using the parameter dk.
where dk represents the ratio of out-degree and in-degree with species i. When dk equals 0, it referred to the node as basal species. When a node in a food web has an in-degree smaller than the out-degree, i.e., dk is less than 0.5, it indicates that the node is more often utilized as a food resource by other nodes, while it shows relatively lower preferences in selecting other nodes as food resources. In the ecological context, this suggests that the node plays a prominent role as a prey, being more frequently preyed upon by other nodes, thus qualifying it as a resource node. Correspondingly, when dk is below 0.25, to be specific, over 75% of the links are associated with predation relationships involving the node, positioning it in the upper quartile of the total link count. This considerable number implies that the majority of predators preferentially choose this node as a food resource. Therefore, we defined a resource node when dk is below 0.5 and a core resource node when dk is below 0.25.
The importance of resource nodes increases significantly during the homogenization process, which determines by resource dependence. However, calculating metrics like node importance or centrality alone cannot fully capture the phenomenon of resource homogenization. Resource homogenization is best reflected when a small number of nodes with high keystoneness and importance are targeted by multiple predators in the network (Gouveia et al., 2021). It results in a concentrated being-preyed relationship in the minority nodes. A power law distribution in the out-degree of a network can indicate a resource homogenization process (Stivala et al., 2020). In our study, we utilized the Kolmogorov−Smirnov (KS) test to verify the power law distribution for a food web (Kovalev and Utkin, 2020). We obtained the R-squared, pk(out), value through the maximum likelihood estimation (MLE) approach (supplementary material). The igraph R package (https://r.igraph.org/) was used for the relevant analyses. If the fitting value pk(out) of the output degree distribution of the network is greater than 0.9, it indicates that the network is experiencing a serious issue with resource homogenization.
2.3 Identifying food web homogenization patterns
In real food webs, certain changes may lead to the occurrence of all three types of food web homogenization processes simultaneously. In order to better assess the vulnerability of the ecosystem, it is important to identify homogenization patterns. We propose the following equation:
In a real ecosystem, the function f here is difficult to fit, which may require more related work to seek to find the appropriate function. Our hypothesis is that food web homogenization can be viewed as a superposition of these three processes, and relevant indicators can be used to comprehensively identify homogenization patterns in real food webs.
where FwH represents the comprehensive effects of food web homogenization; SH represents the effects of structural homogenization; FH represents the effects of functional homogenization; RH represents the effects of resource homogenization. According to different permutations and combinations of the three homogenization types, the FwH consists of 7 types. Each type includes 3 levels of FwH intensity by assigning values to three different indicators, such as serious (S), intermediate (I), and ordinary (O). The thresholds for each indicator are calculated based on the food web data in the database we are building, which is determined using percentiles according to the data distribution type and data characteristics. Our database has collected 115 marine food web data sets from around the world, all of which have complete data. For this paper, we randomly selected 41 food webs from this database. Thus, we established the methods to identify food web homogenization processes integrally, as shown in Table 1.
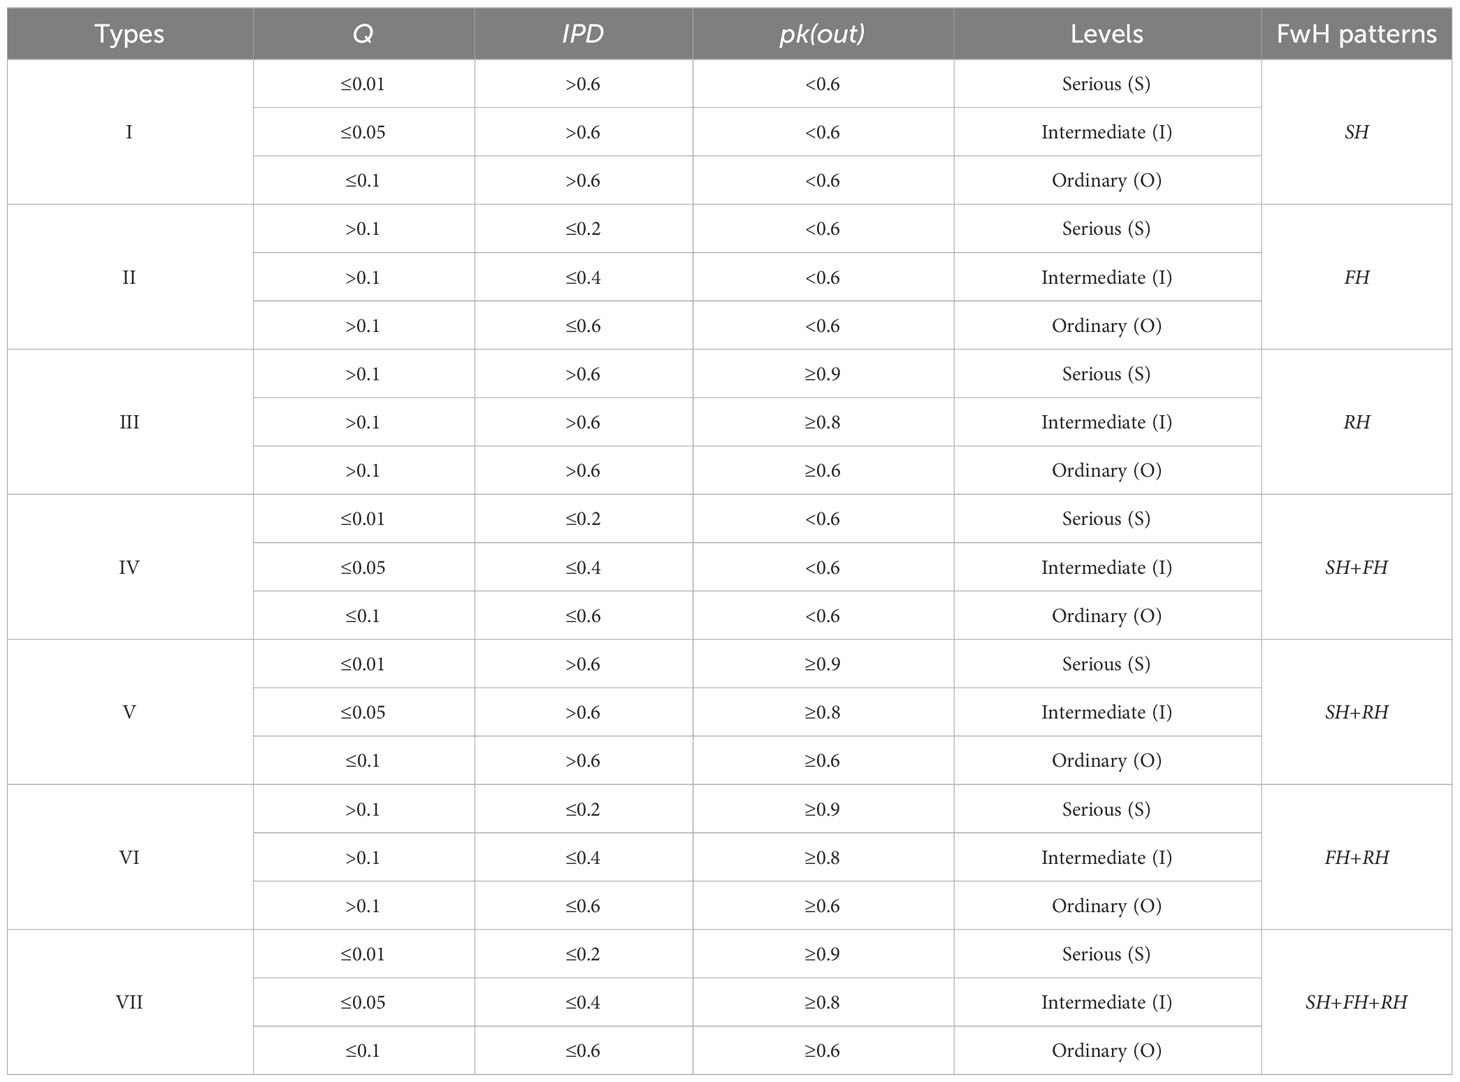
Table 1 The main indicators to identify different food web homogenization patterns.
2.4 Real food web data
We investigated several databases (e.g., EcoBase, http://ecobase.ecopath.org/) and literature (http://www.isiknowledge.com), and randomly acquired 41 marine food webs to identify food web homogenization patterns. These food webs cover different types of marine ecosystems (including estuaries, coastal zone, coral reefs, etc.). Detailed information is listed in the supplementary material. We collected the timeframe during which the authors mentioned in the published articles were actively collecting data, specifically, the time when these food web data were sampled in their natural habitat. As the publication time of literature frequently differs from the actual sampling time, we adopt the latter as a representation of the food web’s state at that specific moment. Ideally, we would need long time series of food webs to follow the temporal dynamics within local ecosystems, but data are quite scarce for this.
3 Results
3.1 Network modularity (Q)
In our study, we calculated the network density-based modularity (Q) of 41 marine food webs using equation (1). We then used the Spearman coefficient to analyze the correlation between Q and related network parameters, such as S, L, time, and module. We found that 60.9% of marine food webs had low network modularity (Q<0.1). Our analysis, as shown in Figures 2A, B, revealed that there was no strong correlation between network modularity and network size (Q~S: cor=-0.103; Q~L: cor=-0.164), but a weak negative correlation existed. It supports our hypothesis that there is no direct relationship between network size and the formation of structural homogenization. According to Figures 2A, B, food webs with smaller network sizes generally appear to be more susceptible to severe SH. However, in the case of small size but highly modular food webs, the risks of SH can be effectively mitigated. Furthermore, in larger-scale food webs, although there still exists a certain level of risk (close to the red line), the formation of severe SH becomes more challenging. In comparison to the time of food web data acquisition, approximately 66.7% of marine food webs recorded low modularity after the year 2008, as seen in Figure 2C. It represents an increase of around 31.8% compared to the proportion of low-Q food webs recorded before 2008, indicating the widespread nature of SH issues. It is worth noting that network modularity does not appear to have a significant correlation with the number of modules (Q~modules: cor=-0.051). However, about 80% of food webs with a high number of modules (modules number>30) have been identified as having a low-Q value, as shown in Figure 2D.
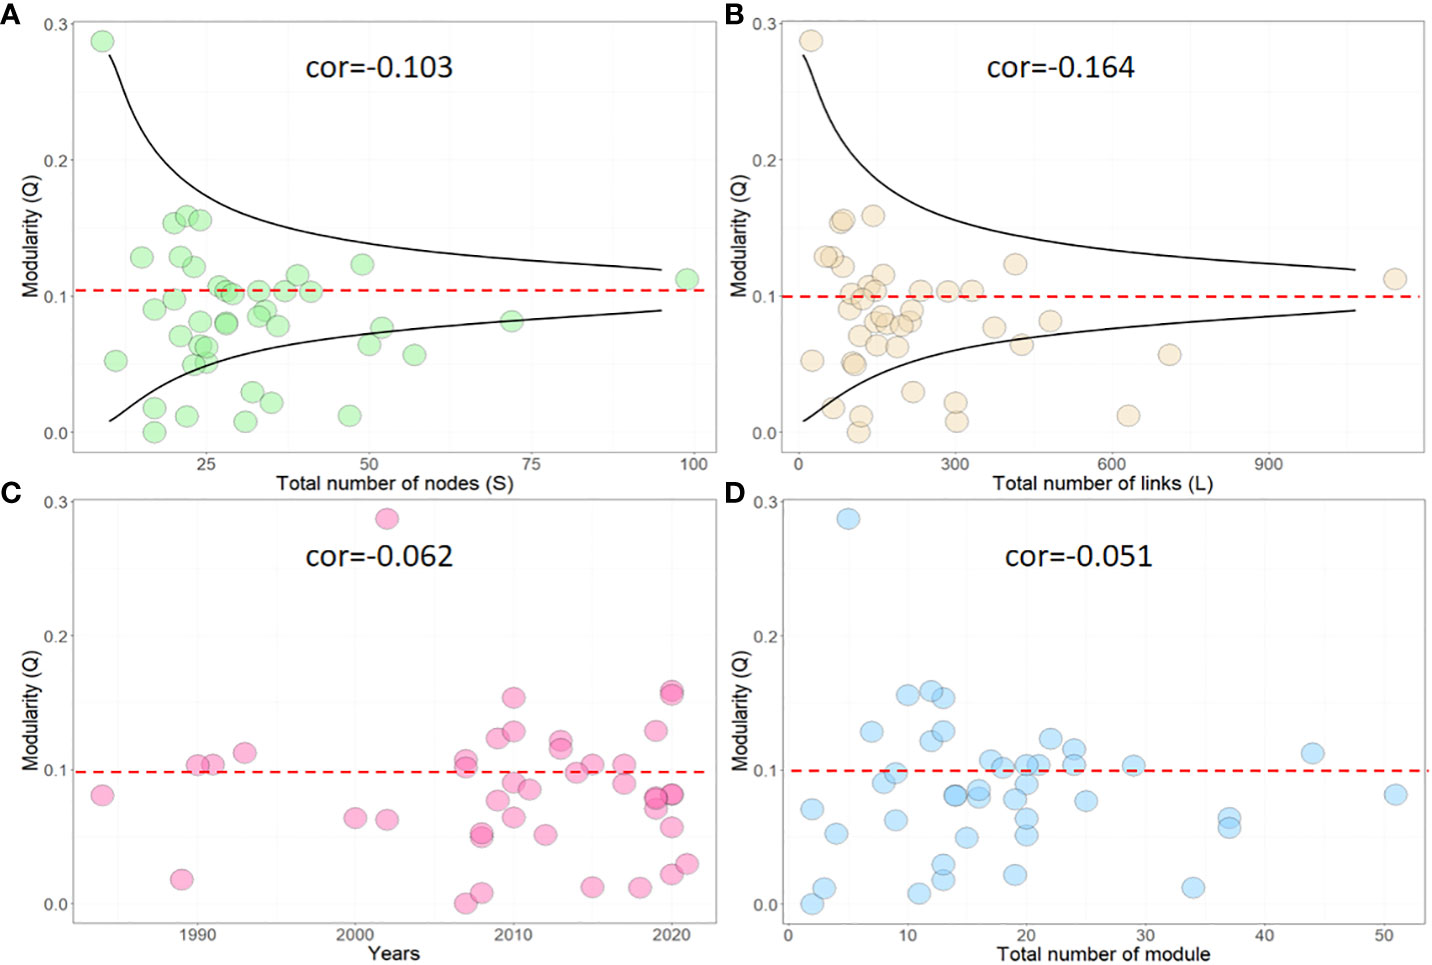
Figure 2 Correlation between network modularity (Q) and other network parameters, including (A) total nodes (S), (B) total links(L), (C) time, and (D) modules. cor represents the Spearman correlation coefficient.
3.2 Interaction profile diversity
We calculated the IPD index of 41 food webs to assess their functional redundancy. We used the Spearman coefficient to determine the correlation between IPD and related network parameters, including S, L, time, and network diversity (Supplementary material). Our results showed that approximately 46.3% of marine food webs had low functional diversity (IPD<0.6). As illustrated in Figures 3A, B, IPD demonstrated a moderate and weak positive correlation with network size (IPD~S: cor=0.402; IPD~L: cor=-0.131). These findings are consistent with the correlation analysis results of Jordán et al. (Lin et al., 2022), and suggest that large-scale networks are more likely to form redundant functional modules, which can significantly reduce the risk of functional homogenization. For food webs with smaller network sizes, the risk of FH is higher (below the red line). It implies that there may be an inherent link between the factors driving FH formation and the decline in biodiversity. Based on the findings presented in Figure 3C, it can be observed that the temporal evolution pattern of IPD displays a certain degree of randomness. It should be noted that this variability does not exhibit a consistent trend across global marine ecosystems. Additionally, when the food web is considered as an undirected network, the network diversity was found to have a slightly positive correlation with IPD, as shown in Figure 3D.
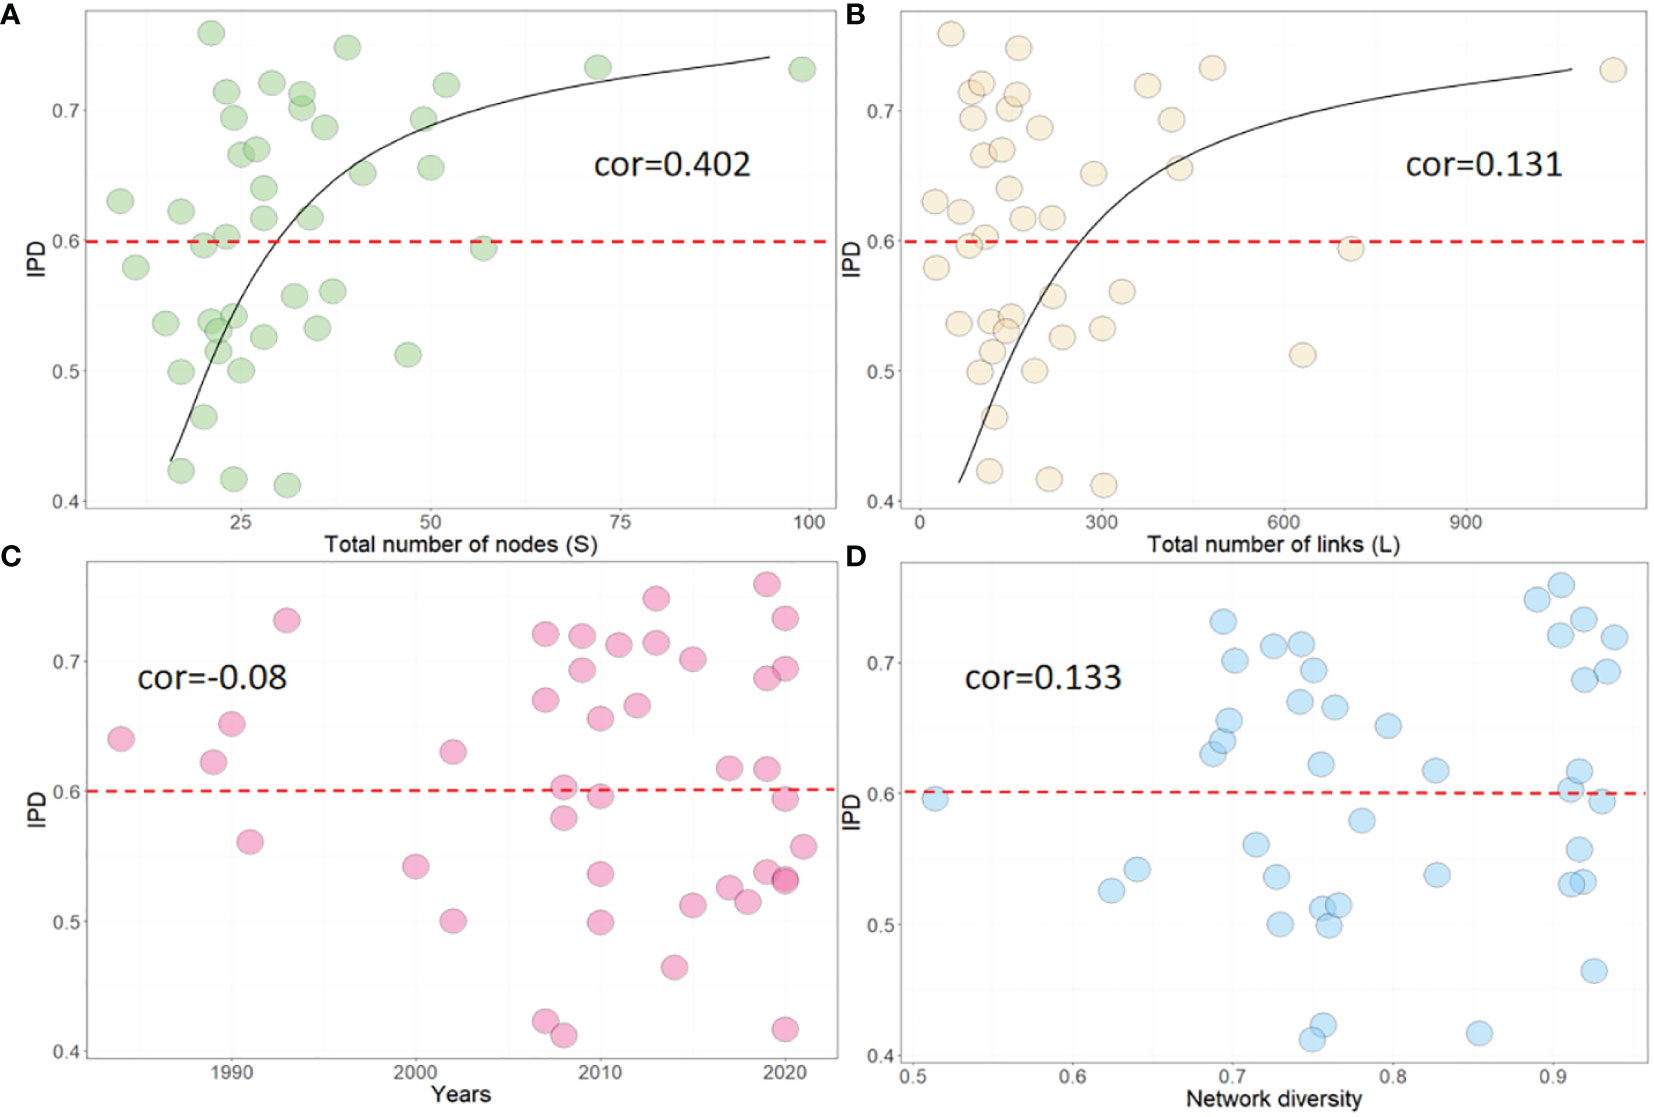
Figure 3 Correlation between IPD and other network parameters, including (A) total nodes (S), (B) total links(L), (C) time, and (D) Network diversity. cor represents the Spearman correlation coefficient.
3.3 Distinguishing resources node and calculating pk(out) value
We also analyzed 41 food webs and calculated their pk(out) values, as well as identified the resource nodes in each web. To explore the relationship between pk(out) and other network parameters, such as S, L, time, and the total number of core resource nodes (when dk<0.25), we used the Spearman coefficient. We found that approximately 61.1% of marine food webs had a high pk(out) value (pk(out)>0.6), indicating a common issue of resource centralization in marine ecosystems. Our analysis also revealed that pk(out) had a moderate positive correlation with network size (pk(out)~S: cor=0.352; pk(out)~L: cor=0.212), but only a weak correlation with temporal dynamics (cor=-0.137), Figures 4A-C. Interestingly, we observed that about 53.3% of food webs had high pk(out) values after the year 2008. However, this figure was 81.8% before 2008, representing a decrease of approximately 34.6%, Figure 4C. Finally, core resource nodes (dk<0.25) express a weak positive correlation with the goodness of fit between the out-degree distribution and the power-law distribution (cor=0.282), Figure 4D. These findings suggest that resource centralization is a widespread phenomenon in marine food webs, and that network size and time may play important roles in shaping network structure.
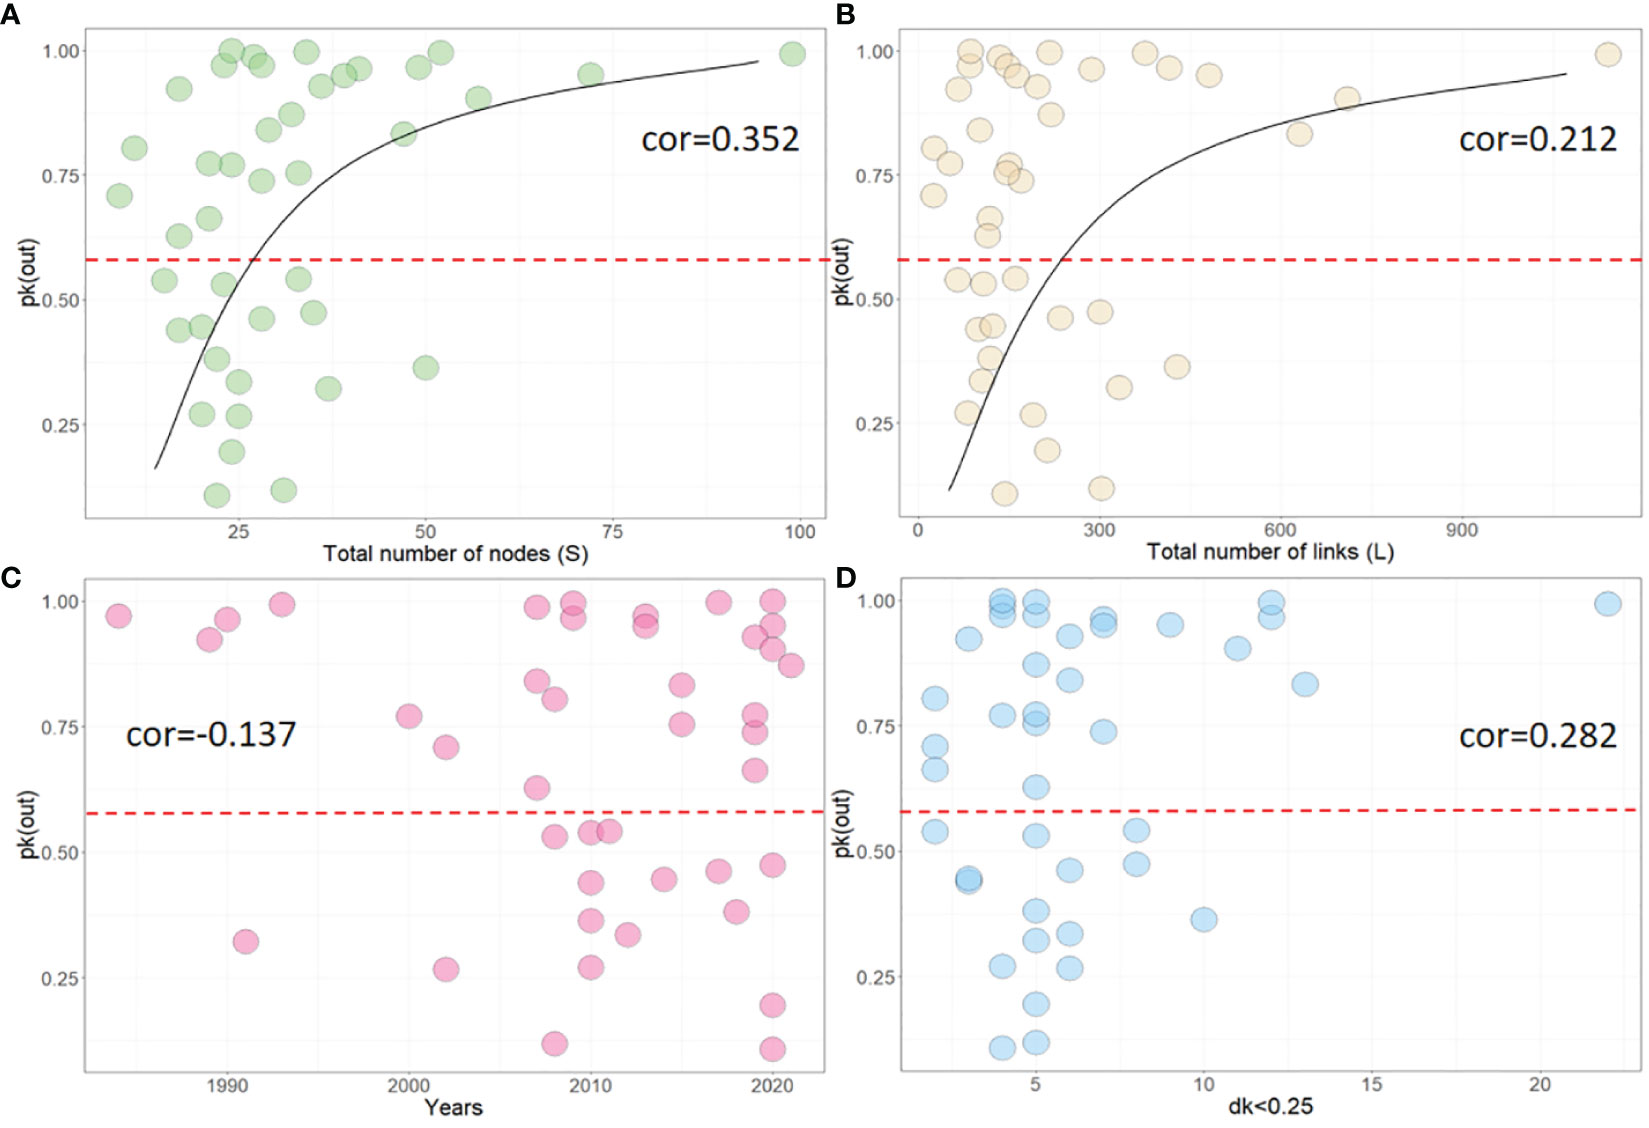
Figure 4 Correlation between pk(out) and other network parameters, including (A) total nodes (S), (B) total links(L), (C) time, and (D) total number of nodes which dk<0.25. cor represents the Spearman correlation coefficient.
3.4 Identifying food web homogenization patterns
According to section 2.3, we were able to identify FwH patterns in 41 marine food webs. Our analysis revealed that 9.56% of food webs fell under type I, showing only SH; 12.1% were classified as type II, showing only FH; 26.8% were categorized as type III, showing only RH; and approximately 17.1% of food webs were classified as type IV (SH+FH), V (SH+RH) and VII (SH+FH+RH), as shown in Figure 5A. We also found that only 7.3% of food webs were in the process of intermediate food web homogenization (I), with types I, III, and V being the most common. Furthermore, we found that all food webs that exhibited serious homogeneity problems were classified as type III. In summary, the proportion of FwH related to SH, FH, and RH are approximately 60.1%, 46.3%, and 61% relatively. It believes that marine ecosystems have a higher probability of undergoing food web homogenization processes involving SH and RH.
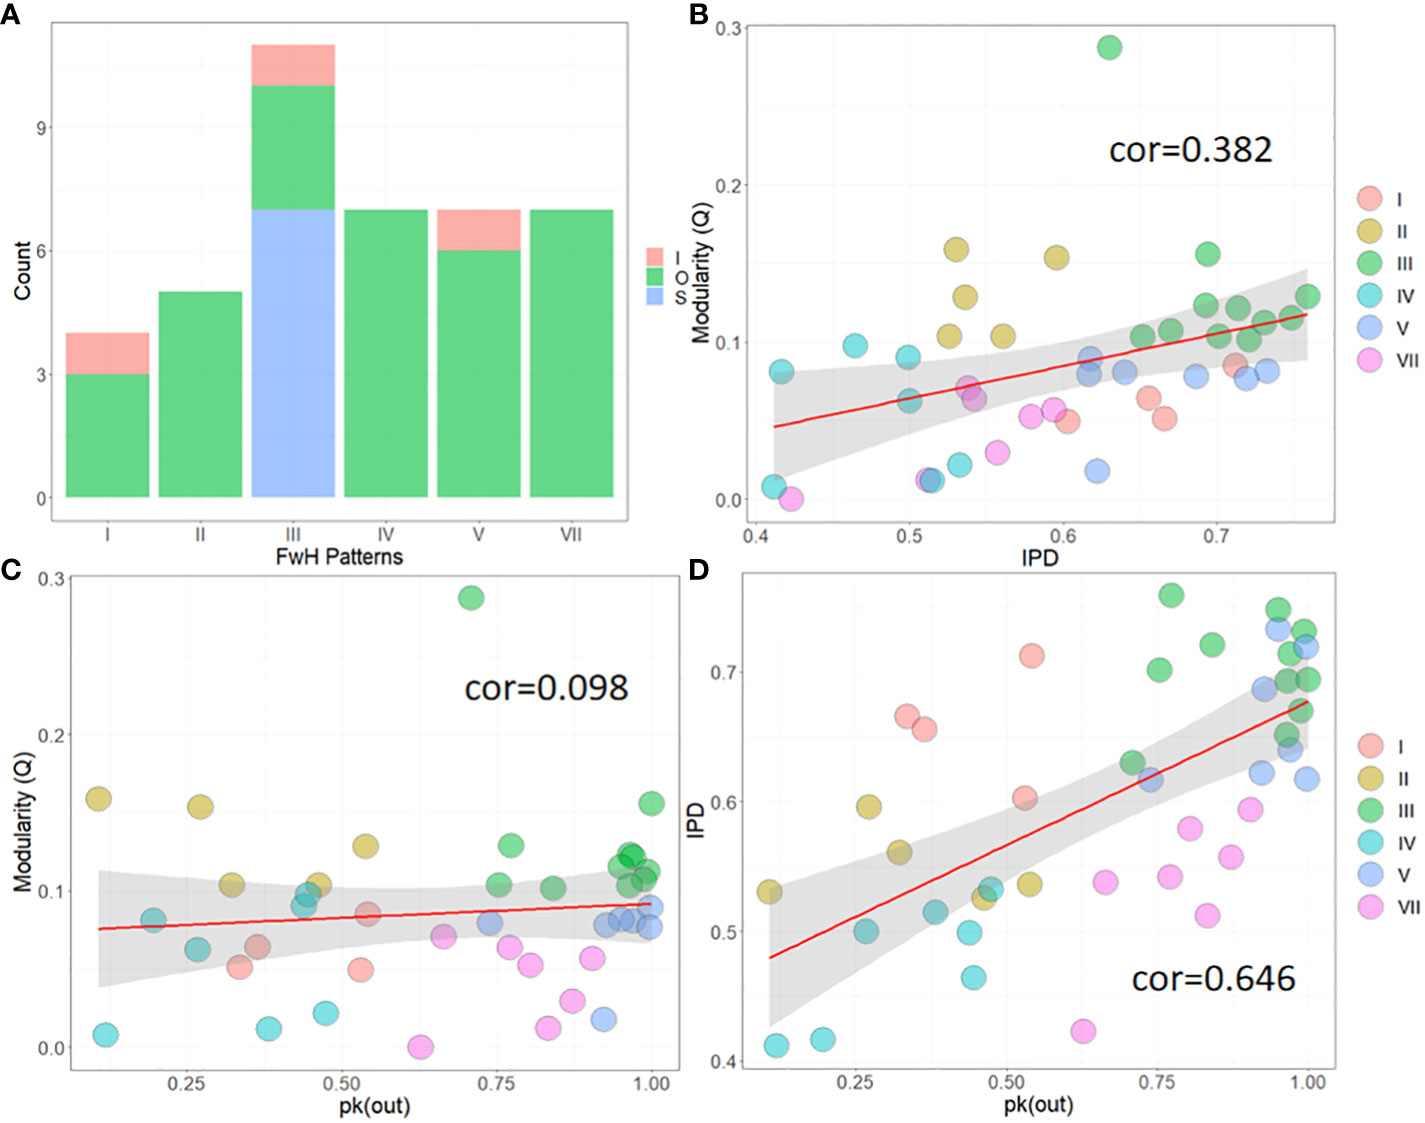
Figure 5 Statistical graph of FwH patterns. (A) the number of different FwH types; (B) Correlation between Q and IPD; (C) Correlation between Q and pk(out); (D) Correlation between IPD and pk(out). Scatter points of different colors represent different FwH types.
Additionally, we also calculated the correlation among Q, IPD, and pk(out), as shown in Figures 5B-D. Our findings suggest that IPD has a moderate and strong positive correlation with Q and pk(out), respectively (pk(out)~IPD: cor=0.646; Q~IPD: cor=0.382). However, Q shows a weak positive correlation with pk(out) (cor=0.098). By using different colored scatter points, we were able to distinguish the different types of FwH, which were located in different graphic orientations. Among these, Figure 5D was the most intuitive. Type III was consistently located in the upper-right of the graph. Therefore, one can roughly differentiate the food web homogenization pattern of a specific study area by calculating the food web IPD and pk(out) values, especially for type I and VII. Yet, to accurately identify FwH patterns, it is still necessary to use the methods provided in this research.
Finally, we examined the distribution of FwH patterns over time and space. We classified marine ecosystems into two categories based on the degree of human impact: significantly human-impacted (S-HI) and insignificantly human-impacted (I-HI). Ecosystems such as nearshore seas, coastal zones, estuaries, and coral reefs were classified as S-HI, while pelagic regions and polar areas were classified as I-HI. Our findings, as shown in Figure 6A, indicate that Types III and V of FwH patterns are present in every latitude belt globally, indicating their ubiquity in marine ecosystems. Type I ecosystems are exclusively found in mid-low latitude regions of the Earth and are only composed of ecosystems belonging to the S-HI category. It suggests that human activities are responsible for the formation of type I ecosystems and they exhibit localized characteristics. In contrast, FwH is more likely to occur in mid-low latitudes while FwH in high latitudes is consistently associated with RH, supporting the high-latitude dominance hypothesis of food webs (Unpublished paper). Types III and V are observed to occur over longer periods than other types, emphasizing their ubiquity in marine ecosystems. Coincidentally, the timeline shows similarities between Type I and Type II ecosystems. Since 2008, Type II ecosystems have consistently been composed of the S-HI category, indicating significant human impact on both types. Overall, the frequency of FwH occurrences has increased in recent decades, potentially due to global climate change and human activities.
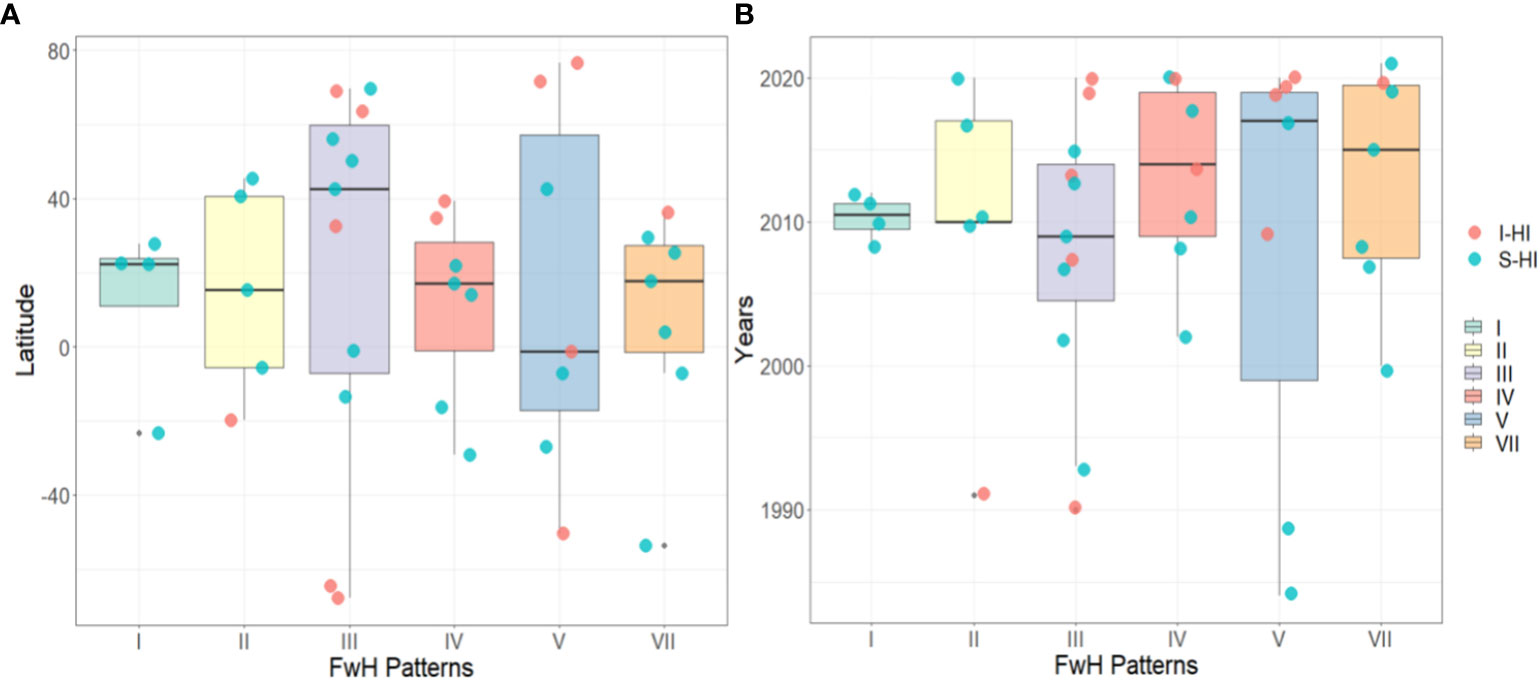
Figure 6 (A) Spatial and (B) temporal distribution of FwH patterns. Scatter points represent the two categories of marine ecosystems based on the degree of human impact: significantly human-impacted (S-HI) and insignificantly human-impacted (I-HI).
4 Discussion
This study aimed to identify different patterns of marine food web homogenization by analyzing 41 marine food webs and developing an indicator system to quantify the different patterns of FwH. The research classified the FwH into three main types, which are structural homogenization (SH), functional homogenization (FH), and resource homogenization (RH). The network indicators, including Q, IPD, and pk(out), were calculated, and different thresholds were assigned to determine 7 types of FwH. Each type contained 3 levels (i.e., S, I, O). The study found that SH has a relationship with the network size of a food web, whereas the formation of FH is not a common occurrence in marine ecosystems and accounts for only 46.3%. In contrast, RH is present on both temporal and spatial scales universally. In conclusion, the frequency of FwH occurrences had increased in the past decades, which could be strongly linked to global climate change and human activities.
In real food webs, these three types of homogenization processes often occur simultaneously. Especially for SH and RH, a higher number of network nodes and links tend to form more sub-networks than others, where the interactions between these sub-networks are typically weakly connected, which enhances the modularity. Thus, increasing the overall stability of the food web (Grilli et al., 2016), as depicted by the upper half of the red dashed line in Figures 2A, B. On the other hand, when there is an excessive number of network nodes and links, because of resource dependence, a large number of upper-level nodes require more resources to sustain their life activities (Barton et al., 2019). These interactions with the core resource nodes (dk<0.25) often lead to the formation of large modules centered around core resource nodes, where numerous connections link to these core resource nodes, resembling a scale-free network structure, as shown by the upper half of the red dashed line in Figures 4A, B. Such networks are often characterized by ecological vulnerability, where perturbations in these networks are likely to result in irreversible ecological risks (Di Mauro et al., 2022). Therefore, as revealed by this study, the homogenization processes of food webs driven by the interactions between SH and RH play a significant role in the natural evolution of marine ecosystems. This might have implications related to the adaptability of these marine ecosystems to global change.
When biodiversity increases to a certain extent, it hinders the formation of SH, as illustrated by the lower half of the red dashed line in Figures 2A, B. However, when biodiversity surpasses a certain ecological threshold, it will lead to the emergence of core resource nodes and the occurrence of the RH issue within the food web. These processes may alternately occur during the ecosystem evolution, which explained why type V, predominantly influenced by both SH and RH, exhibits universality in both temporal and spatial dimensions (Figure 6). Furthermore, the FwH is driven by a single factor of RH, also exhibits universality (Type III), and some food webs even show a serious tendency (S) towards FwH. It is mainly due to the unique characteristics of marine ecosystems. In marine ecosystems, primary producers are relatively uniform and primarily composed of photoautotrophic phytoplankton (Casabianca et al., 2021). In oligotrophic marine areas across the globe, acquiring and sustaining the necessary nutrients for the survival of phytoplankton poses a challenge (Rodríguez-Gómez et al., 2022). Thus, resources become the primary competitive factor, shaping high out-degree nodes, as shown in Figure 4D. When the network size is larger, this phenomenon is more significant. On the other hand, the FwH driven by a single factor of SH shows locality conversely (Type I) and is associated with human activities (Figure 6). Unlike the natural evolution of ecosystems, human activities often lead to instantaneous disruptions in food webs (Wilkinson et al., 2021). If a food web itself has not developed strong stability (highly modular functional groups characterized by weak interactions), it is highly susceptible to module disintegration effects. In such cases, the system has not fully evolved adaptive strategies or redundant functional groups for self-restoration, resulting in structural adjustments (Brose et al., 2019). Severe disturbances can cause the ecosystem to regress to its early evolutionary stage, characterized by the proliferation of generalist species and the formation of SH.
The process of functional homogenization (FH) often accompanies the occurrence of structural homogenization (SH), such as type IV and type VII. It is because the functional overlap is typically positively correlated with the degree of structural modularity, as shown in Figure 5B. When the FwH is driven by a single factor of RH (Type II), which basically consists of ecosystems sensitive to human activities (S-HI) and has been recorded concentratedly in the last 20 years, as depicted in Figure 6. Biologically, it should be related to the interaction of gradient and functional features (Stuart-Smith et al., 2013). Without altering the network structure, the decrease in IPD is directly associated with the sparsification of network interactions. Since IPD is trait-based, this sparsification of functional groups enhances network robustness, which also explains the significant positive correlation between IPD and pk(out), as shown in Figure 5D. In general, the sparsification of functional groups is temporary, but human activities often maintain this stage in a stable manner (e.g., the vulnerability of agricultural and urban ecosystems) (Cannistraci et al., 2013). Changes in human decision-making and management concepts regarding nature may produce different effects. It can be concluded that Type III is more amenable to restoration through human attention to natural sustainability than others. We think that these results may support decision-making in future fisheries management, following better tests on these proposed indicators.
Although Type VI was not observed in the randomly sampled real food web data, it could not be concluded that it does not occur in real networks. Future research will address this issue. It is important to note that the method used in this study is a static computational approach, and more investigation is needed to determine if dynamic models can effectively identify homogenization in food webs. Additionally, long time series data is necessary to support food web data. The findings of this study can contribute to a greater focus on food web homogenization and enhance the theoretical foundation for systematic ecological conservation.
5 Conclusion
Based on the research findings, it can be concluded that the proportion of FwH related to SH, FH, and RH were approximately 60.1%, 46.3%, and 61% respectively. It implies that marine ecosystems have a higher probability of undergoing food web homogenization processes involving SH and RH. The research found that Type V, which was mainly influenced by both SH and RH, exhibited universality in both temporal and spatial dimensions, while Type III also showed universality when the food webs were dominated by RH. Conversely, Type I, which was associated with human activities, showed locality when the food web only manifested SH. The study also found a moderate positive correlation (cor=0.382) between IPD and Q, indicating that FH often occurred alongside SH like type IV and type VII. When the FwH is driven by a single factor of RH (Type II), which basically consists of ecosystems sensitive to human activities (S-HI) and has been recorded concentratedly in the last 20 years. In summary, FwH is more likely to occur in mid-low latitudes, while FwH in high latitudes is consistently associated with RH, which indirectly supports the high-latitude dominance hypothesis of food webs. The frequency of FwH occurrences has increased in the past decades, which is possibly linked to global climate change and human activities. Our work provided a comprehensive concept of food web homogenization and improved the understanding of homogenized system risks, which contributed to the development of nature-based ecosystem management countermeasures against future climate change.
Data availability statement
The original contributions presented in the study are included in the article/Supplementary Material. Further inquiries can be directed to the corresponding author.
Author contributions
YX conceived the ideas, designed methodology, and led the writing of the manuscript. XH collected and analyzed the data. FJ led the revision of the manuscript. MZ visualized data. YC performed validation. JS contributed to the discussion. All authors contributed critically to the drafts and gave final approval for publication.
Funding
This research was supported by: National Natural Science Foundation of China (No. 42277470), Open fund of Key Laboratory of Ecological Prewarning, Protection and Restoration of Bohai Sea, Ministry of Natural Resources (No. 2022106), Foundation of State Environmental Protection Key Laboratory of Coastal Ecological Environment, National Marine Environmental Monitoring Center of China (202310), Knowledge Innovation Program of Wuhan-Shuguang Project (No. 2022020801020210), and was supported by John von Neumann Faculty of Informatics, Óbuda University, Budapest, Hungary. The research of FJ was made by a contract co-financed by the European Union - PON Research and Innovation 2014-2020 based on art. 24, paragraph 3, letter a) of the Law of 30 December 2010, Nr. 240 and subsequent amendments of Ministerial Decree of 10 August 2021 Nr. 1062.
Conflict of interest
The authors declare that the research was conducted in the absence of any commercial or financial relationships that could be construed as a potential conflict of interest.
Publisher’s note
All claims expressed in this article are solely those of the authors and do not necessarily represent those of their affiliated organizations, or those of the publisher, the editors and the reviewers. Any product that may be evaluated in this article, or claim that may be made by its manufacturer, is not guaranteed or endorsed by the publisher.
Supplementary material
The Supplementary Material for this article can be found online at: https://www.frontiersin.org/articles/10.3389/fmars.2023.1245513/full#supplementary-material
References
Barabási A. L., Bonabeau E. (2003). Scale-free networks. Sci. Am. 288 (5), 60–69. doi: 10.1038/scientificamerican0503-60
Bartley T. J., McCann K. S., Bieg C., Cazelles K., Granados M., Guzzo M. M., et al. (2019). Food web rewiring in a changing world. Nat. Ecol. Evol. 3 (3), 345–354. doi: 10.1038/s41559-018-0772-3
Barton M. B., Litvin S. Y., Vollenweider J. J., Heintz R. A., Norcross B. L., Boswell K. M. (2019). Implications of trophic discrimination factor selection for stable isotope food web models of low trophic levels in the Arctic nearshore. Mar. Ecol. Prog. Ser. 613, 211–216. doi: 10.3354/meps12893
Botta-Dukát Z. (2005). Rao's quadratic entropy as a measure of functional diversity based on multiple traits. J. Veg. Sci. 16 (5), 533–540. doi: 10.1111/j.1654-1103.2005.tb02393.x
Brose U., Archambault P., Barnes A. D., Bersier L. F., Boy T., Canning-Clode J., et al. (2019). Predator traits determine food-web architecture across ecosystems. Nat. Ecol. Evol. 3 (6), 919–927. doi: 10.1038/s41559-019-0899-x
Cannistraci C. V., Alanis-Lobato G., Ravasi T. (2013). From link-prediction in brain connectomes and protein interactomes to the local-community-paradigm in complex networks. Sci. Rep. 3 (1), 1613. doi: 10.1038/srep01613
Casabianca S., Bellingeri A., Capellacci S., Sbrana A., Russo T., Corsi I., et al. (2021). Ecological implications beyond the ecotoxicity of plastic debris on marine phytoplankton assemblage structure and functioning. Environ. pollut. 290, 118101. doi: 10.1016/j.envpol.2021.118101
Cazelles K., Bartley T., Guzzo M. M., Brice M. H., MacDougall A. S., Bennett J. R., et al. (2019). Homogenization of freshwater lakes: Recent compositional shifts in fish communities are explained by gamefish movement and not climate change. Glob. Change Biol. 25 (12), 4222–4233. doi: 10.1111/gcb.14829
Clavel J., Julliard R., Devictor V. (2011). Worldwide decline of specialist species: toward a global functional homogenization? Front. Ecol. Environ. 9 (4), 222–228. doi: 10.1890/080216
Descamps S., Ramírez F., Benjaminsen S., Anker-Nilssen T., Barrett R. T., Burr Z., et al. (2019). Diverging phenological responses of Arctic seabirds to an earlier spring. Glob. Change Biol. 25 (12), 4081–4091. doi: 10.1111/gcb.14780
Di Mauro L. S., Pluchino A., Conti E., Mulder C. (2022). Ecological validation of soil food-web robustness for managed grasslands. Ecol. Indic. 141, 109079. doi: 10.1016/j.ecolind.2022.109079
Dunne J. A., Williams R. J., Martinez N. D. (2004). Network structure and robustness of marine food webs. Mar. Ecol. Prog. Ser. 273, 291–302. doi: 10.3354/meps273291
Fraser D., Villaseñor A., Tóth A. B., Balk M. A., Eronen J. T., Andrew Barr W., et al. (2022). Late quaternary biotic homogenization of North American mamMalian faunas. Nat. Commun. 13 (1), 3940. doi: 10.1038/s41467-022-31595-8
Geng M., Zhang W., Hu T., Wang R., Cheng X., Wang J. (2022). Eutrophication causes microbial community homogenization via modulating generalist species. Water Res. 210, 118003. doi: 10.1016/j.watres.2021.118003
Giacomuzzo E., Jordán F. (2021). Food web aggregation: effects on key positions. Oikos 130 (12), 2170–2181. doi: 10.1111/oik.08541
Gonzalez A., Germain R. M., Srivastava D. S., Filotas E., Dee L. E., Gravel D., et al. (2020). Scaling-up biodiversity-ecosystem functioning research. Ecol. Lett. 23 (4), 757–776. doi: 10.1111/ele.13456
Gouveia C., Móréh Á., Jordán F. (2021). Combining centrality indices: maximizing the predictability of keystone species in food webs. Ecol. Indic. 126, 107617. doi: 10.1016/j.ecolind.2021.107617
Grilli J., Rogers T., Allesina S. (2016). Modularity and stability in ecological communities. Nat. Commun. 7 (1), 12031. doi: 10.1890/120374
Groffman P. M., Cavender-Bares J., Bettez N. D., Grove J. M., Hall S. J., Heffernan J. B., et al. (2014). Ecological homogenization of urban USA. Front. Ecol. Environ. 12 (1), 74–81. doi: 10.1890/120374
Guimerà R., Stouffer D. B., Sales-Pardo M., Leicht E. A., Newman M. E. J., Amaral L. A. (2010). Origin of compartmentalization in food webs. Ecology 91 (10), 2941–2951. doi: 10.1890/09-1175.1
Heymans J. J., Coll M., Libralato S., Morissette L., Christensen V. (2014). Global patterns in ecological indicators of marine food webs: a modelling approach. PloS One 9 (4), e95845. doi: 10.1371/journal.pone.0095845
Hobbs R. J., Higgs E., Harris J. A. (2009). Novel ecosystems: implications for conservation and restoration. Trends Ecol. Evol. 24 (11), 599–605. doi: 10.1016/j.tree.2009.05.012
Knop E. (2016). Biotic homogenization of three insect groups due to urbanization. Glob. Change Biol. 22 (1), 228–236. doi: 10.1111/gcb.13091
Kortsch S., Primicerio R., Fossheim M., Dolgov A. V., Aschan M. (2015). Climate change alters the structure of arctic marine food webs due to poleward shifts of boreal generalists. P. R. Soc B-Biol. Sci. 282 (1814), 20151546. doi: 10.1098/rspb.2015.1546
Kovalev M. S., Utkin L. V. (2020). ). A robust algorithm for explaining unreliable machine learning survival models using the Kolmogorov-Smirnov bounds. Neural Netw. 132, 1–18. doi: 10.1016/j.neunet.2020.08.007
Kozen D., Timme M. (2007). Indefinite summation and the Kronecker delta.- Ecommons. Cornell. Edu. https://ecommons.cornell.edu/handle/1813/8352
Lehikoinen A., Lindén A., Karlsson M., Andersson A., Crewe T. L., Dunn E. H., et al. (2019). Phenology of the avian spring migratory passage in Europe and North America: Asymmetric advancement in time and increase in duration. Ecol. Indic. 101, 985–991. doi: 10.1016/j.ecolind.2019.01.083
Lin W. H., Lai S. M., Davis A. J., Liu W. C., Jordán F. (2022). A network-based measure of functional diversity in food webs. Biol. Lett. 18 (6), 20220183. doi: 10.1098/rsbl.2022.0183
Magurran A. E., Dornelas M., Moyes F., Gotelli N. J., McGill B. (2015). Rapid biotic homogenization of marine fish assemblages. Nat. Commun. 6 (1), 8405. doi: 10.1038/ncomms9405
Montoya D., Yallop M. L., Memmott J. (2015). Functional group diversity increases with modularity in complex food webs. Nat. Commun. 6 (1), 7379. doi: 10.1038/ncomms8379
Musseau C. L., Onandia G., Petermann J. S., Sagouis A., Lischeid G., Jeschke J. M. (2022). Nonlinear effects of environmental drivers shape macroinvertebrate biodiversity in an agricultural pondscape. Ecol. Evol. 12 (11), e9458. doi: 10.1002/ece3.9458
Newman M. E. (2004). Fast algorithm for detecting community structure in networks. Phys. Rev. E. 69 (6), 66133. doi: 10.1103/PhysRevE.69.066133
Obura D. O., Katerere Y., Mayet M., Kaelo D., Msweli S., Mather K., et al. (2021). Integrate biodiversity targets from local to global levels. Science 373 (6556), 746–748. doi: 10.1126/science.abh2234
Olden J. D. (2006). Biotic homogenization: a new research agenda for conservation biogeography. J. Biogeogr. 33 (12), 2027–2039. doi: 10.1111/j.1365-2699.2006.01572.x
Olden J. D., Poff N. L., Douglas M. R., Douglas M. E., Fausch K. D. (2004). Ecological and evolutionary consequences of biotic homogenization. Trends Ecol. Evol. 19 (1), 18–24. doi: 10.1016/j.tree.2003.09.010
Olden J. D., Rooney T. P. (2006). On defining and quantifying biotic homogenization. Glob. Ecol. Biogeogr. 15 (2), 113–120. doi: 10.1111/j.1466-822X.2006.00214.x
Rathore S., Bindoff N. L., Phillips H. E., Feng M. (2020). Recent hemispheric asymmetry in global ocean warming induced by climate change and internal variability. Nat. Commun. 11 (1), 2008. doi: 10.1038/s41467-020-15754-3
Rodríguez-Gómez C. F., Vázquez G., Papiol V., Marino-Tapia I., Enriquez C. (2022). Phytoplankton distribution and its ecological and hydrographic controls in two contrasting areas of a stratified oligotrophic system. Hydrobiologia 849 (14), 3175–3195. doi: 10.1007/s10750-022-04924-7
Rooney N., McCann K. S. (2012). Integrating food web diversity, structure and stability. Trends Ecol. Evol. 27 (1), 40–46. doi: 10.1016/j.tree.2011.09.001
Schell C. J., Dyson K., Fuentes T. L., Des Roches S., Harris N. C., Miller D. S., et al. (2020). The ecological and evolutionary consequences of systemic racism in urban environments. Science 369 (6510), eaay4497. doi: 10.1126/science.aay4497
Schiettekatte N. M., Barneche D. R., Villéger S., Allgeier J. E., Burkepile D. E., Brandl S. J., et al. (2020). Nutrient limitation, bioenergetics and stoichiometry: A new model to predict elemental fluxes mediated by fishes. Funct. Ecol. 34 (9), 1857–1869. doi: 10.1111/1365-2435.13618
Scott M. C., Helfman G. S. (2001). Native invasions, homogenization, and the mismeasure of integrity of fish assemblages. Fisheries 26 (11), 6–15. doi: 10.1577/1548-8446(2001)026<0006:NIHATM>2.0.CO;2
Soler G. A., Edgar G. J., Thomson R. J., Kininmonth S., Campbell S. J., Dawson T. P., et al. (2015). Reef fishes at all trophic levels respond positively to effective marine protected areas. PloS One 10 (10), e0140270. doi: 10.1371/journal.pone.0140270
Stivala A., Robins G., Lomi A. (2020). Exponential random graph model parameter estimation for very large directed networks. PloS One 15 (1), e0227804. doi: 10.1371/journal.pone.0227804
Stuart-Smith R. D., Bates A. E., Lefcheck J. S., Duffy J. E., Baker S. C., Thomson R. J., et al. (2013). Integrating abundance and functional traits reveals new global hotspots of fish diversity. Nature 501 (7468), 539–542. doi: 10.1038/nature12529
Traag V. A., Waltman L., Van Eck N. J. (2019). From Louvain to Leiden: guaranteeing well-connected communities. Sci. Rep. 9 (1), 5233. doi: 10.1038/s41598-019-41695-z
Ulanowicz R. E. (2004). Quantitative methods for ecological network analysis. Comput. Biol. Chem. 28, 5–6, 321-339. doi: 10.1016/j.compbiolchem.2004.09.001
Wang S., Loreau M., De Mazancourt C., Isbell F., Beierkuhnlein C., Connolly J., et al. (2021). Biotic homogenization destabilizes ecosystem functioning by decreasing spatial asynchrony. Ecology 102 (6), e03332. doi: 10.1002/ecy.3332
Wilkinson C. L., Chua K. W., Fiala R., Liew J. H., Kemp V., Hadi Fikri A., et al. (2021). Forest conversion to oil palm compresses food chain length in tropical streams. Ecology 102 (1), e03199. doi: 10.1002/ecy.3199
Keywords: food web, homogenization, indicators, structure and function, resources, marine ecosystem
Citation: Xu Y, Huo X, Jordán F, Zhou M, Cai Y and Sun J (2023) Identifying marine food web homogenization patterns. Front. Mar. Sci. 10:1245513. doi: 10.3389/fmars.2023.1245513
Received: 23 June 2023; Accepted: 22 August 2023;
Published: 08 September 2023.
Edited by:
Milko Alberto Jorquera, University of La Frontera, ChileReviewed by:
Shiyuan Ding, Tianjin University, ChinaYing Yang, Dongguan University of Technology, China
Copyright © 2023 Xu, Huo, Jordán, Zhou, Cai and Sun. This is an open-access article distributed under the terms of the Creative Commons Attribution License (CC BY). The use, distribution or reproduction in other forums is permitted, provided the original author(s) and the copyright owner(s) are credited and that the original publication in this journal is cited, in accordance with accepted academic practice. No use, distribution or reproduction is permitted which does not comply with these terms.
*Correspondence: Yan Xu, Z3Jhd2FpbjAwN0AxNjMuY29t