 Nicholas R. Bates
 Rodney J. Johnson
- 1School of Ocean Futures, Julie Ann Wrigley Global Futures Laboratory, Arizona State University, Tempe, AZ, United States
- 2Bermuda Institute of Ocean Sciences, Arizona State University, St. George’s, Bermuda, Bermuda
Ocean physical and biogeochemical conditions are rapidly changing over time. Forty years of observations from 1983 to 2023 collected at the Bermuda Atlantic Time-series Study (BATS) site near Bermuda in the North Atlantic Ocean shows continuing trends of surface warming, increase in salinity, loss of dissolved oxygen (DO), increase in carbon dioxide (CO2), and ocean acidification (OA) effects. Over this period, the ocean has warmed by about +1°C, increased in salinity by +0.136, and lost DO by 12.5 µmol kg−1 or ~6%. Since the 1980s, ocean dissolved inorganic carbon (DIC), total alkalinity (TA), a tracer of anthropogenic CO2 (CTrOCA), and fugacities/partial pressures of CO2 (i.e., fCO2 and pCO2) have continued to increase substantially, with no evidence of a reduction in the rates of change over time. Contemporaneously, ocean pH has decreased by ~0.1 pH units [with ocean acidity (i.e., H+) increasing by >30%], and the saturation states of calcium carbonate minerals (Ωcalcite and Ωaragonite) have decreased. These OA indicators show that the chemical conditions for calcification have become less favorable over the past 40 years. Updating of data and trends at the BATS site show how ocean chemistry of the 2020s is now outside the range observed in the 1980s, and how essential these data are for predicting the response of ocean chemistry and marine ecosystems to future shifting earth and ocean conditions.
1 Introduction
The environmental challenges facing the global oceans are multifold, synergistic, and complex (e.g., Doney et al., 2014; Lenton et al., 2019; Armstrong-McKay et al., 2022). Ocean warming, the rise in ocean heat content, and changes in the global hydrological cycle have continued over the past several decades (e.g., Cheng et al., 2022a; Cheng et al., 2022b; Cheng et al., 2023) with profound implications for ocean circulation (e.g., Jackson et al., 2022). The decrease in ocean dissolved oxygen (DO) concentration (Keeling and Garcia, 2002), a process termed “ocean deoxygenation” (Keeling et al., 2010; Stramma and Schmidtko, 2019), also contributes to a complex interaction of environmental issues [e.g., warming; salinification and changes in the global ocean water cycle; nutrient supply, eutrophication, and changes in ocean ecosystem; and ocean acidification (OA)] that has future synergistic implications for the state of the global ocean (e.g., Doney et al., 2009; Boyd and Hutchins, 2012; Boyd et al., 2018; Glibert et al., 2022).
OA has also emerged as a threat of global significance for ocean chemistry and marine ecosystems (Caldeira and Wickett, 2003) and interrelated to ocean warming, salinification/freshening, and ocean deoxygenation. The substantial uptake of CO2 into the oceans (e.g., Sabine et al., 2004; Khatiwala et al., 2013; Gruber et al., 2019) contributes to OA as emissions of anthropogenic carbon dioxide (CO2) to the atmosphere from a multitude of sources (i.e., fossil fuel use, cement and lime manufacture, and terrestrial ecological and land-use changes, Friedlingstein et al., 2019; Friedlingstein et al., 2020; Friedlingstein et al., 2022; Gruber et al., 2023) continue to rise. The consequential ocean absorption of anthropogenic CO2 modifies seawater chemistry through the shifting of CO2-carbonate chemical equilibria and the reduction in seawater pH. In addition, the reduction in the saturation states for calcium carbonate (CaCO3) minerals (i.e., Ω) such as calcite (Ωcalcite) and aragonite (Ωaragonite, Bates et al., 2014; Bates and Johnson, 2020) have both direct impacts for marine calcification and CaCO3 dissolution.
In the North Atlantic Ocean, physical and biogeochemical conditions are rapidly changing over time. An earlier paper by Bates and Johnson (2020) showed the variability of ocean physics and chemistry changes at two open-ocean hydrographic/biogeochemical sites [i.e., Bermuda Atlantic Time-series Study (BATS), and Hydrostation S] (Schroeder and Stommel, 1969) and one deep ocean flux site (Ocean Flux Program, OFP) near the island of Bermuda (Figure 1). The merged BATS and Hydrostation S data from 1983 provide the longest global ocean time-series record of warming in the surface ocean, increasing salinity (i.e., salinification), loss of oxygen (i.e., deoxygenation), and ocean carbon dioxide (CO2)-carbonate chemistry change that impact OA.
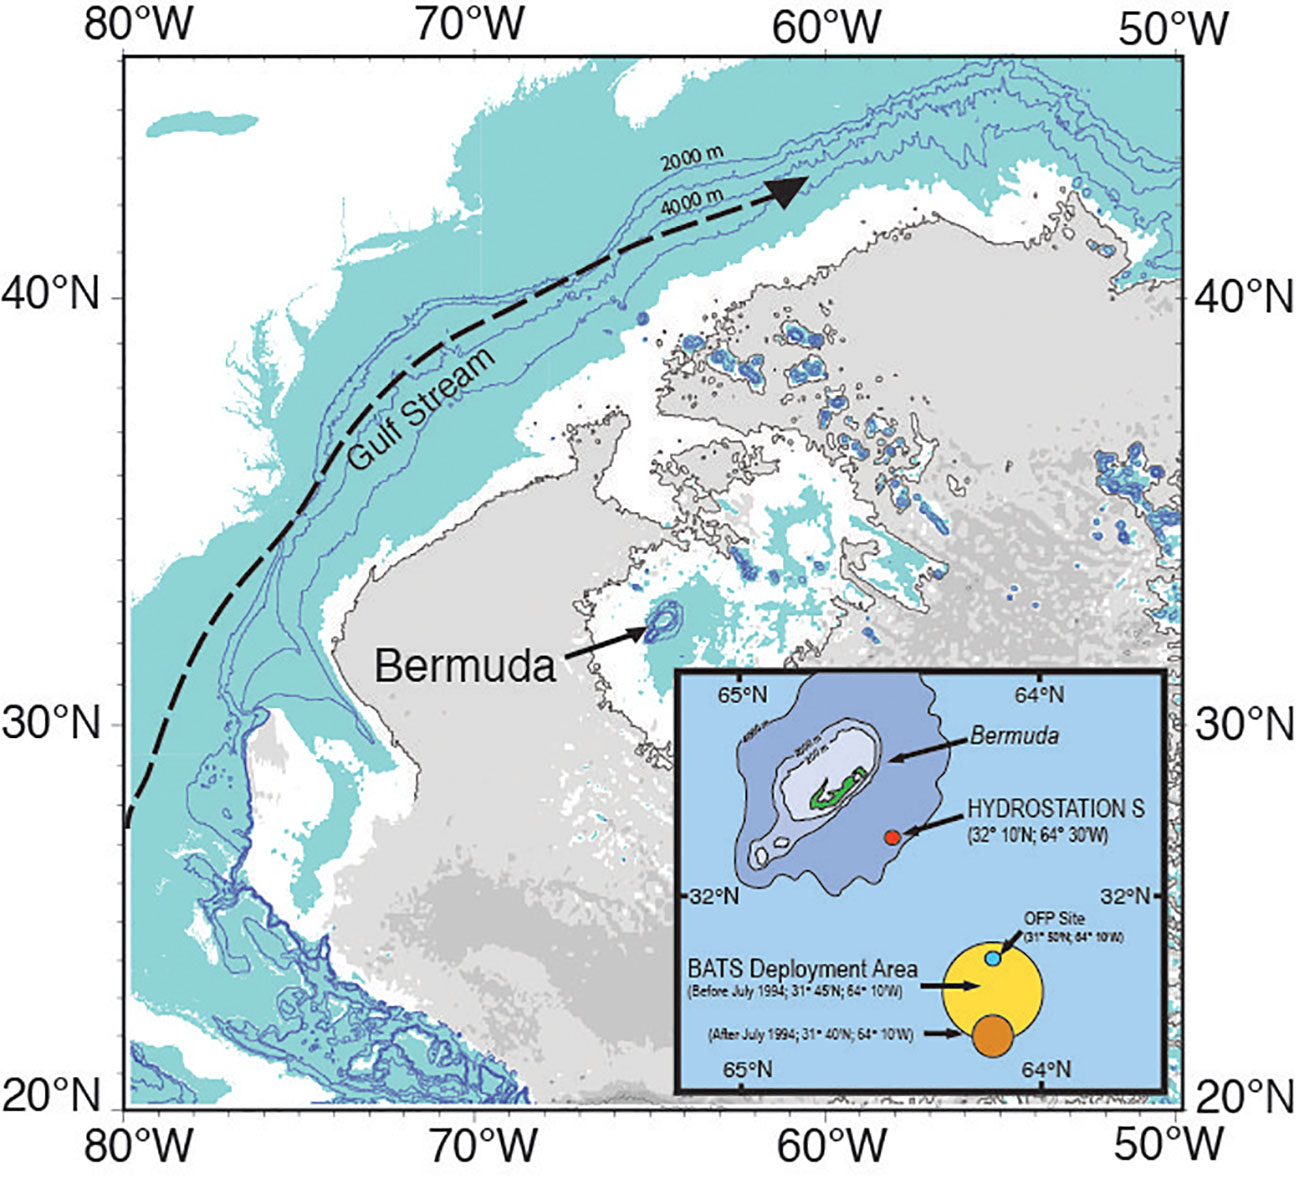
Figure 1 Location map of the island of Bermuda and two ocean time-series (Hydrostation S, 1954 to present; and the Bermuda Atlantic Time-series, BATS, 1988 to present) sites. The position of the Ocean Flux Program (OFP, 1978 to present; deep ocean sediment trap program) is also shown. Ruth Curry is thanked for the main panel figure which is modified here. The inset figure is modified from a figure in Bates and Johnson (2020).
The BATS project is one of several ship-based long-term physical and biogeochemical time-series sites operating in the deep open ocean (Bates et al., 2014; Bates and Johnson, 2022; Sutton et al., 2022; Lange et al., 2023). The sustained observations collected at the BATS and Hydrostation S site spans 40 years from 1983 to 2023. In this paper, we demonstrate ocean physical changes and show that surface ocean biogeochemical parameters continue to increase substantially with no evidence of reduction in the rates of change over time. This paper also serves as a primer for this special issue on the physical seawater and marine ecological changes associated with OA. Updating of data and trends at BATS show how ocean chemistry of the 2020s in the North Atlantic subtropical gyre is now outside the seasonal range observed in the 1980s (Bates, 2017; Bates and Johnson, 2022), and also how essential these data are for predicting the future response of ocean chemistry/biogeochemistry and marine ecology to rapidly changing shifting Earth and ocean conditions.
2 Ocean observations, sampling, and methods
2.1 Ocean observations in the Sargasso Sea
Surface and water column ocean data between 1983 and 2023 were collected at two sustained ocean time-series sites in the Sargasso Sea (North Atlantic Ocean) off the island of Bermuda. Hydrostation S (also termed as the Panulirus site in earlier years) is located at an ocean site approximately 25 km southeast of the island Bermuda (at ~32°10’N, 64°30’W) in the Sargasso Sea, which is part of the oligotrophic gyre of the North Atlantic Ocean. The BATS site is located ~80 km southeast of the island (at ~31°40′N, 64°10′W; Michaels and Knap, 1996) with comprehensive monthly sampling of ocean physics, chemistry, and biology collected since October 1988 onwards (from surface to ~4,200 m deep; Knap et al., 1997; Michaels and Knap, 1996; Steinberg et al., 2001; Lomas et al., 2013; Bates and Johnson, 2022).
2.2 Water sampling, temperature, and CTD measurements
Ship-based sampling at Hydrostation S sampling consists of biweekly hydrographic observations of temperature, salinity, and DO from the surface to ~3,200 m deep since 1954 (Menzel and Ryther, 1960; Phillips and Joyce, 2007). At Hydrostation S, multiple conductivity–temperature–depth (CTD) profiles and hydrocast seawater sampling were conducted through the water column from the surface to ~2,600 m, with sampling at 24 depths. Reversing mercury thermometers were used for thermometric depth between 1983 and 1988. Since 1988, the CTD package has consisted of dual conductivity, dual temperature, and altimeter, and dual DO, transmissometer, fluorometer, and PAR sensor measurements [and using a Sea-Bird 9/11 system extended to full ocean depth at Hydrostation S (~2,600 m) and BATS (~4,500 m)]. The BATS site has been occupied at monthly intervals (biweekly in the January to April period) with multiple CTD profiles and hydrocasts from the surface to 4,500 m deep, with seawater sampling at 36 depths.
Seawater sampling was originally conducted using Nansen bottles until the early 1980s, then replaced with 5- L Niskin samplers until October 1988. Since the late 1980s, a Sea-Bird 9/11 CTD, typically equipped with 12-L Niskin and Ocean Test Equipment (OTE) samplers have been used for physical and biogeochemical sampling at the Hydrostation S and BATS sites (Knap et al., 1997; Bates and Johnson, 2022; Lopez et al., 2023). The seawater sampling order is DO samples, which were the first samples collected after opening of the Niskin/OTE bottles, followed by carbonate-CO2 chemistry, salinity, inorganic nutrients (i.e., for nitrate + nitrite, phosphate and silicate), and other parameters.
2.3 Chemical determination of salinity
Seawater samples for salinity have been collected from the Niskin/OTE bottles from all depths into 125- to 250-mL borosilicate or soda glass bottles (Ocean Scientific, UK). The determination of salinity has been made with a variety of Guildline salinometers (i.e., models 8500A and 8500B) in a temperature-controlled laboratory at the Bermuda Institute of Ocean Sciences (BIOS). Salinity measurements for both BATS and Hydrostation S samples were routinely calibrated with IAPSO standard water (Knap et al., 1997; Bates and Johnson, 2022; Lopez et al., 2023) with an imprecision of<0.002 salinity units. Deep-water replicate samples from >2,000 m also have an imprecision of<0.002. BATS and Hydrostation S bottle salinity measurements from each cruise are also used to calibrate shipboard CTD SBE conductivity sensors and profiles.
2.4 Chemical determination of dissolved oxygen
Seawater DO samples were analyzed on board the ship within 3 to 4 hours of collection. Since October 1988, a series of automated chemical titration systems have been used (1988–present) and based on the long-time established method proposed by Winkler (1888; modified by Strickland and Parsons, 1968). Since 1994, we have used an automated temperature-controlled titration system that was developed by Scripps Institution of Oceanography. This system comprises a Metrohm 665 Dosimat burette for highly precise delivery of the sodium thiosulfate (0.18 M: reagent grade) and an ultraviolet light endpoint detector, with analysis withing 3 to 24 hours of sampling. A manual endpoint detection was used for earlier samples (1983–1988). The replicate precision of DO analyses has been ~0.1 µmol kg−1.
2.5 Chemical determination of dissolved inorganic carbon and total alkalinity
In this paper, dissolved inorganic carbon (DIC) and total alkalinity (TA) samples were chemically determined at BIOS and defined as follows. Here, DIC is defined as:
The term [CO2*] is defined as the sum of dissolved H2CO3 (carbonic acid) and CO2 (carbon dioxide. The chemical definition of TA in seawater is:
The concentrations of represent the primary chemical constituents of alkalinity in seawater, and the primary contributors to the proton/charge balance of seawater (Zeebe and Wolf-Gladrow, 2001; Dickson et al., 2007; Millero, 2013). The units for DIC and TA are µmol kg−1 (Dickson et al., 2007; and references therein).
Details on seawater collection, types of bottles used, and details of earlier chemical analysis are given elsewhere (Keeling, 1993; Bates et al., 1996a; Bates et al., 1996b; Bates, 2001; Bates and Johnson, 2022; Bates et al., 2002; Brix et al., 2004). BATS samples for DIC and TA were typically analyzed within 2 to 3 months of collection.
Seawater TA samples were analyzed using potentiometric titration methods (Bates et al., 1996b). Initially, a manual alkalinity titrator was used in the early 1990s, but replaced by an automated system in the early 2000s (i.e., VINDTA 2S, Versatile Instrument for the Determination of Titration Alkalinity; Bates et al., 2012). TA was determined using the recommended nonlinear least-squares method (Dickson et al., 2007) and 15 to 20 titration points past the carbonic acid endpoint. Certified reference material (CRM) seawater (prepared by A.G. Dickson, Scripps Institution of Oceanography; https://www.dickson.ucsd.edu) was analyzed each sample run, and the former was used for TA calibration from 1992 along with replicate surface Sargasso Sea seawater.
Seawater DIC samples were analyzed using coulometric methods with a SOMMA system (Bates et al., 1996a; Dickson et al., 2007) from 1992 to 2001 at BIOS and with a series of VINDTA 3C systems from 2002 onwards. During the first 2 years of sampling, DIC samples were analyzed at Woods Hole Oceanographic Institution (WHOI) (e.g., BATS cruise 1 to 21) and subsequently at BIOS. DIC measurements were calibrated with known volumes of pure CO2 gas while certified reference materials (CRM’s) were routinely analyzed each day of analysis from 1991. Hydrostation S samples were analyzed at Scripps Institution of Oceanography using manometric methods (1983 to 1988; Keeling, 1993), and BATS samples were collected from 1988 to 1991 at WHOI (Catherine Goyet analyzed these samples for BIOS). As with TA, CRM seawater samples were routinely analyzed during each sample run for calibration and comparison purposes. No significant bias was reported between the chemical methods used to determine DIC (Bates et al., 2012).
The analytical replicate precision for DIC and TA at BIOS was typically<0.03% and<0.05%, for more than 6,000 samples. The analytical accuracy for DIC and TA samples was better than 0.1% (typically ±1 to 2 μmol kg−1) using several thousand CRM samples from 1992 to the present.
2.6 Seawater CO2-carbonate chemistry computation and uncertainties
All the components of the seawater CO2-carbonate system {i.e., [CO2], [H2CO3], , , [H+] or hydrogen ion concentration, fCO2 (fugacity of CO2), pCO2 (partial pressure of CO2), Revelle factor (β), pH, calcium carbonate (CaCO3), and mineral saturation state for calcite (Ωcalcite) and aragonite (Ωaragonite)} were determined from the measurement of DIC and TA along with in situ temperature and salinity data (i.e., Zeebe and Wolf-Gladrow, 2001; Dickson et al., 2007; Millero, 2013) and using program CO2calc (Robbins et al., 2010; CO2-sys version 2.1). Here, the carbonic acid dissociation constants (i.e., pK1 and pK2) of Mehrbach et al. (1973), as refit by Dickson and Millero (1987), were used. The dissociation constants for KHSO4− (Dickson, 1990) and borate ([B]T, Lee et al., 2010) were used. The analytical uncertainty of DIC and TA was ±1 µmol kg−1 with the computation error for fCO2, pH, and Ωcalcite and Ωaragonite estimated at 3 µatm, 0.003, 0.018, and 0.012, respectively (Bates et al., 2012; Orr et al., 2018; Bates and Johnson, 2020).
Seawater fCO2 data were primarily used in this paper (as with the Surface Ocean Carbon Atlas, SOCAT; https://socat.info/), as well as the partial pressure of CO2 (i.e., pCO2). pH is expressed on the seawater scale (Dickson et al., 2007). The Revelle factor (β), pH, Ωcalcite, and Ωaragonite do not have units and are dimensionless. Here, β = ∂ ln fCO2/∂ ln DIC (Bates et al., 2012). Salinity-normalized DIC (i.e., nDIC) and TA (i.e., nTA) data are also useful indicators of long-term changes and represent DIC and TA normalized to a mean salinity of 36.6 (i.e., the average salinity value of Sargasso Sea surface waters, 0–10 m).
2.7 Determination of seawater biogeochemistry tracer CTrOCA using the TrOCA method
Unfortunately, water mass age data that allow direct computation of anthropogenic CO2 such as C* were never collected at the BATS or Hydrostation S site. In this paper, we use the TrOCA (Tracer combining Oxygen, inorganic Carbon, and total Alkalinity) method (Touratier and Goyet, 2004a; Touratier and Goyet, 2004b; Touratier et al., 2007), which has been used as a method to estimate anthropogenic carbon (CANT). Here, TrOCA is defined as the following (Touratier et al., 2007), but we use the term CTrOCA rather than CANT to reflect the use of this term as a quasi-conservative tracer to illustrate long-term changes in CO2-carbonate chemistry:
where θ is the potential temperature. DO, DIC, and TA data are expressed as µmol kg−1. TrOCA values account for both biological (e.g., remineralization of organic matter) and abiotic processes (e.g., precipitation/dissolution of CaCO3) and with an uncertainty of ~6 µmol kg−1 (Touratier et al., 2007). TrOCA is not used in the upper 200 m for CANT estimation due to variability associated with biological changes (and influence on DO, nitrate, phosphate, and DIC) and air–sea gas exchange. It is important to note that CTrOCA values given here do not represent accurate estimates of anthropogenic CO2. It should be noted that it may be possible to determine CANT at biogeochemically well-constrained time-series sites such as BATS.
2.8 Ocean physics, biogeochemistry, and ocean acidification trends
Here, surface (0–10 m) data from the Hydrostation S (1983–1989) and BATS (1988–2023) sites are used in the synthesis for the paper. As noted in earlier papers, there is an increase in sampling frequency over time that can non-seasonally alias estimated trends (sampling has increased from 9 to 12 times a year before 1992 and 14 to 15 times a year afterwards; Bates et al., 2014; Bates and Johnson, 2020).
Trend analysis was performed with observed data and, importantly, seasonally detrended data (Table 1). All data were seasonally detrended as previously done as a best practices approach (Bates et al., 2014; Bates and Johnson, 2020; Sutton et al., 2022) with observed and calculated data that are binned into months (i.e., January, February, etc.) for the period 1983 to 2023 and a uniform time step of ~1 month (i.e., 365 or 366 days/12). A climatological mean and standard deviation were then determined, and anomalies were computed from observed data minus the statistical mean monthly climatological value. This treatment for seasonal weighting of data allows for the reduction of any non-temporal uniformity of data in subsequent trend analysis (Sutton et al., 2022).
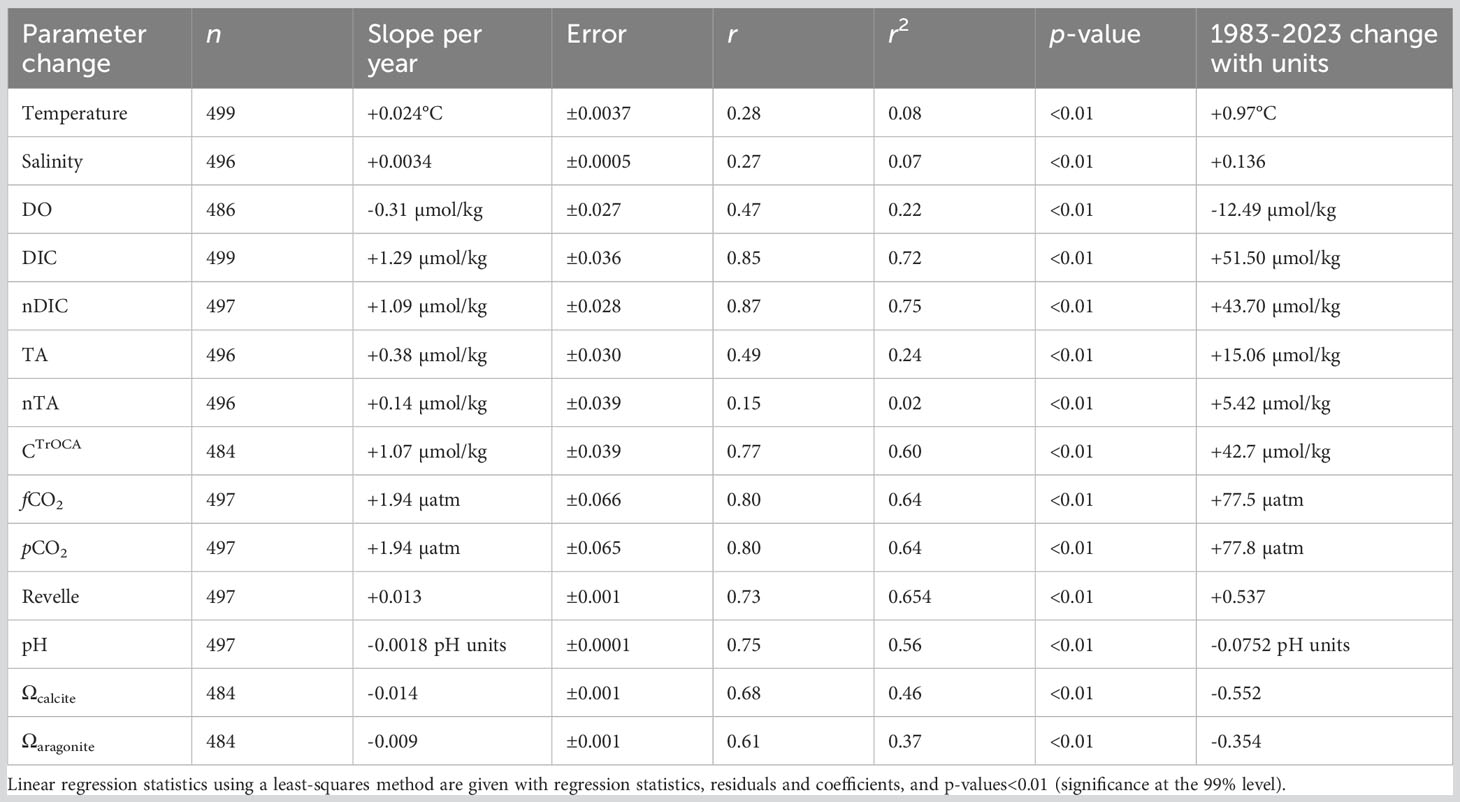
Table 1 Seasonally detrended analysis of rates of change of physical properties, seawater CO2-carbonate chemistry, and OA indicators at BATS-Hydrostation S (1983–2023).
Trend analysis for the period from 1983 to 2023 was determined using linear regression methods with physical and biogeochemical data as the dependent variable and time as the independent; p-values<0.01 were used to determine the statistical significance of the trend (Excel data analysis regression). The statistics generated from least-squares regression approaches were slope, coefficients, error, multiple r, r2, p-value, and n (Table 1). All trends for the period from 1983 to 2023 (Table 1) were statistically significant at greater than the 99% percentile (two-level t-test, p-values<0.01). This synthesis includes trends for temperature, salinity, DO, DIC, nDIC, CTrOCA, TA, nTA, fCO2, pCO2, β (Revelle factor), pH, and Ωcalcite and Ωaragonite (Table 1).
2.9 BATS and Hydrostation S data availability statement
The BATS and Hydrostation S data represent monthly and twice-monthly sampling since October 1988 (twice monthly from 1983 at Hydrostation S). Both BATS and Hydrostation S data are publicly available at https://bats.bios.edu/data/ and permanently archived/distributed at BCO-DMO (Biological and Chemical Oceanography Data Management Office; Woods Hole, USA) with doi’s issued for data (https://www.bco-dmo.org/project/2124). While BATS and Hydrostation S data are made available without any restrictions through BCO-DMO, users of these data should adhere to FAIR (findability, accessibility, interoperability, and reusability) data use principles, and we encourage contact if there are any uncertainties regarding methodological details or interpretation of datasets. This paper and others (e.g., Bates and Johnson, 2020) and original datasets with their doi’s should be cited in any resulting scientific publication from the usage of BATS and Hydrostation S data, as done with other ocean biogeochemical datasets such as SOCAT or Surface Ocean Carbon Atlas (Bakker et al., 2016) and SPOTS or Synthesis Product for Ocean Time-series (Sutton et al., 2022; Lange et al., 2023).
3 Results and discussion
3.1 Surface ocean warming, salinification, and deoxygenation in the Sargasso Sea (1993–2023)
The seasonality of the Sargasso Sea has been well documented ever since Menzel and Ryther (1960) documented the annual cycle of physics and biology in the upper ocean off the island of Bermuda. Since the early 1960s, sustained observations at BATS and Hydrostation S have revealed complex linkages and interactions between local-scale physics (e.g., eddies, McGillicuddy et al., 1999; subtropical mode water formation, Stevens et al., 2020) with the biology and biogeochemistry of the Sargasso Sea (i.e., the North Atlantic subtropical gyre) and the whole North Atlantic Ocean–Arctic Ocean system (e.g., Lomas et al., 2013; Bates and Johnson, 2020; Lomas et al., 2022). The surface of the Sargasso Sea shows a typical seasonality of temperature with a range of ~9–11°C and with summertime highs of ~28–30°C (Figure 2A) and wintertime lows of ~18–20°C. Surface salinities are higher in wintertime (~36.67) and fresher in summer (~36.45) with a seasonal range of ~0.2 to ~0.3 (Figure 2B). The seasonality in salinity generally reflects freshening associated with precipitation in the summertime distributed within a shallower mixed layer (~20–30 m), while precipitation in the wintertime is distributed through a much deeper mixed layer (~100–300 m; Michaels and Knap, 1996; Lomas et al., 2013).
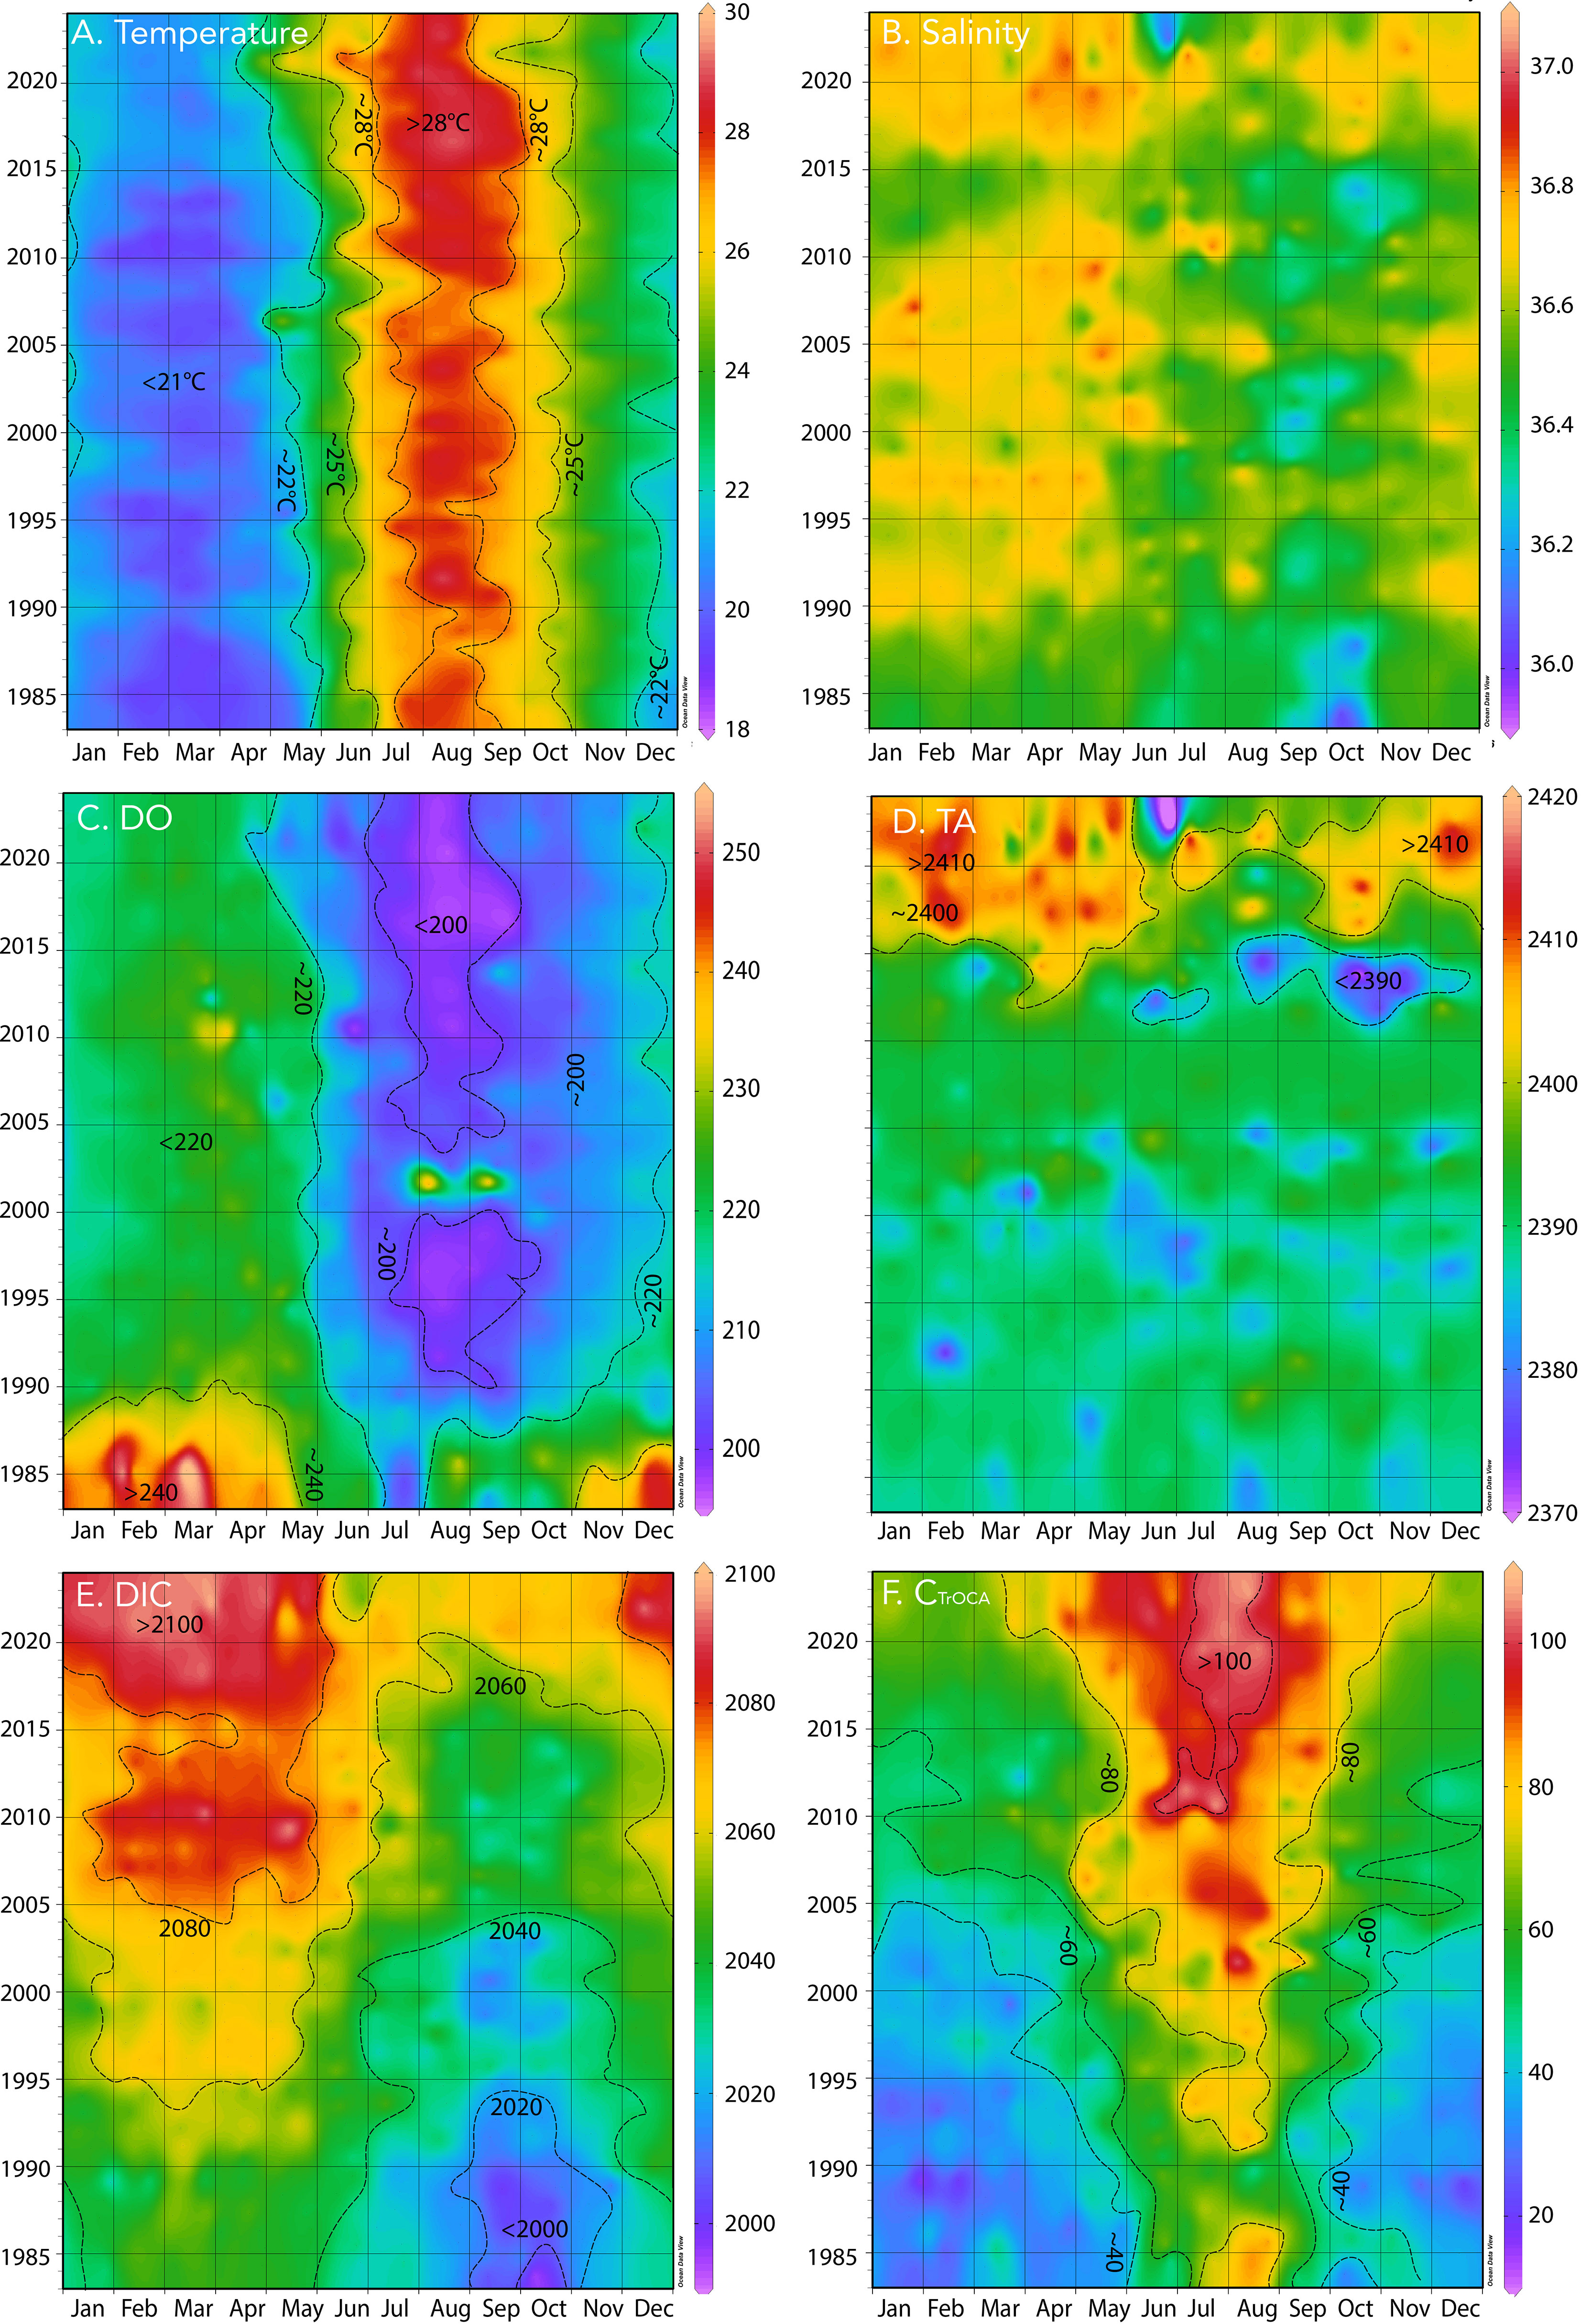
Figure 2 Hovmuller plot of surface physical and biogeochemistry at BATS (1988–2023) with earlier data (1983–1988) from Hydrostation S. (A) Temperature (°C); (B) salinity; (C) dissolved oxygen, DO (µmol kg−1); (D) total alkalinity, TA (µmol kg−1); (E) DIC (µmol kg−1); (F) CTrOCA (µmol kg−1).
Surface DO also exhibits a typical seasonality of ~30–40 µmol kg−1 with wintertime highs of 240 µmol kg−1 and summertime lows of ~200 µmol kg−1 (Figure 2C; note that wintertime DO values were high before 1990). The wintertime higher DO levels are generally associated with higher rates of primary production (Michaels and Knap, 1996; Lomas et al., 2013). Lower DO levels in the summertime are typically associated with lower rates of primary production, stratification, and warmer temperatures and efflux of oxygen from the ocean (Lomas et al., 2013). Similar seasonality of temperature, salinity, and DO has been shown elsewhere (Bates and Johnson, 2020).
From 1983 to the present, surface temperatures have increased at BATS by ~+0.24°C ± 0.04°C per decade and over the past 40 years by +0.97 ± 0.15°C (Figure 3A). As noted by Cheng et al. (2023), long-term trends represent the best data and metrics to quantify climate and ocean changes. The gradual rise in ocean temperatures is an inevitable outcome of Earth’s energy balance, with a faster rate of warming since the 1990s (Cheng et al., 2022a; Cheng et al., 2022b). The warming and increasing stratification of the upper ocean in the Sargasso Sea has been reported with earlier datasets (Bates and Johnson, 2020; Lomas et al., 2022), but here, the warming reported is of sufficient length of time to be statistically significant (Table 1). Since the Bates and Johnson (2020) paper reported a ~0.21°C per decade warming (1983 to 2019 data), this rate of warming has increased to +0.24°C per decade with the addition of 4 years of recent data.
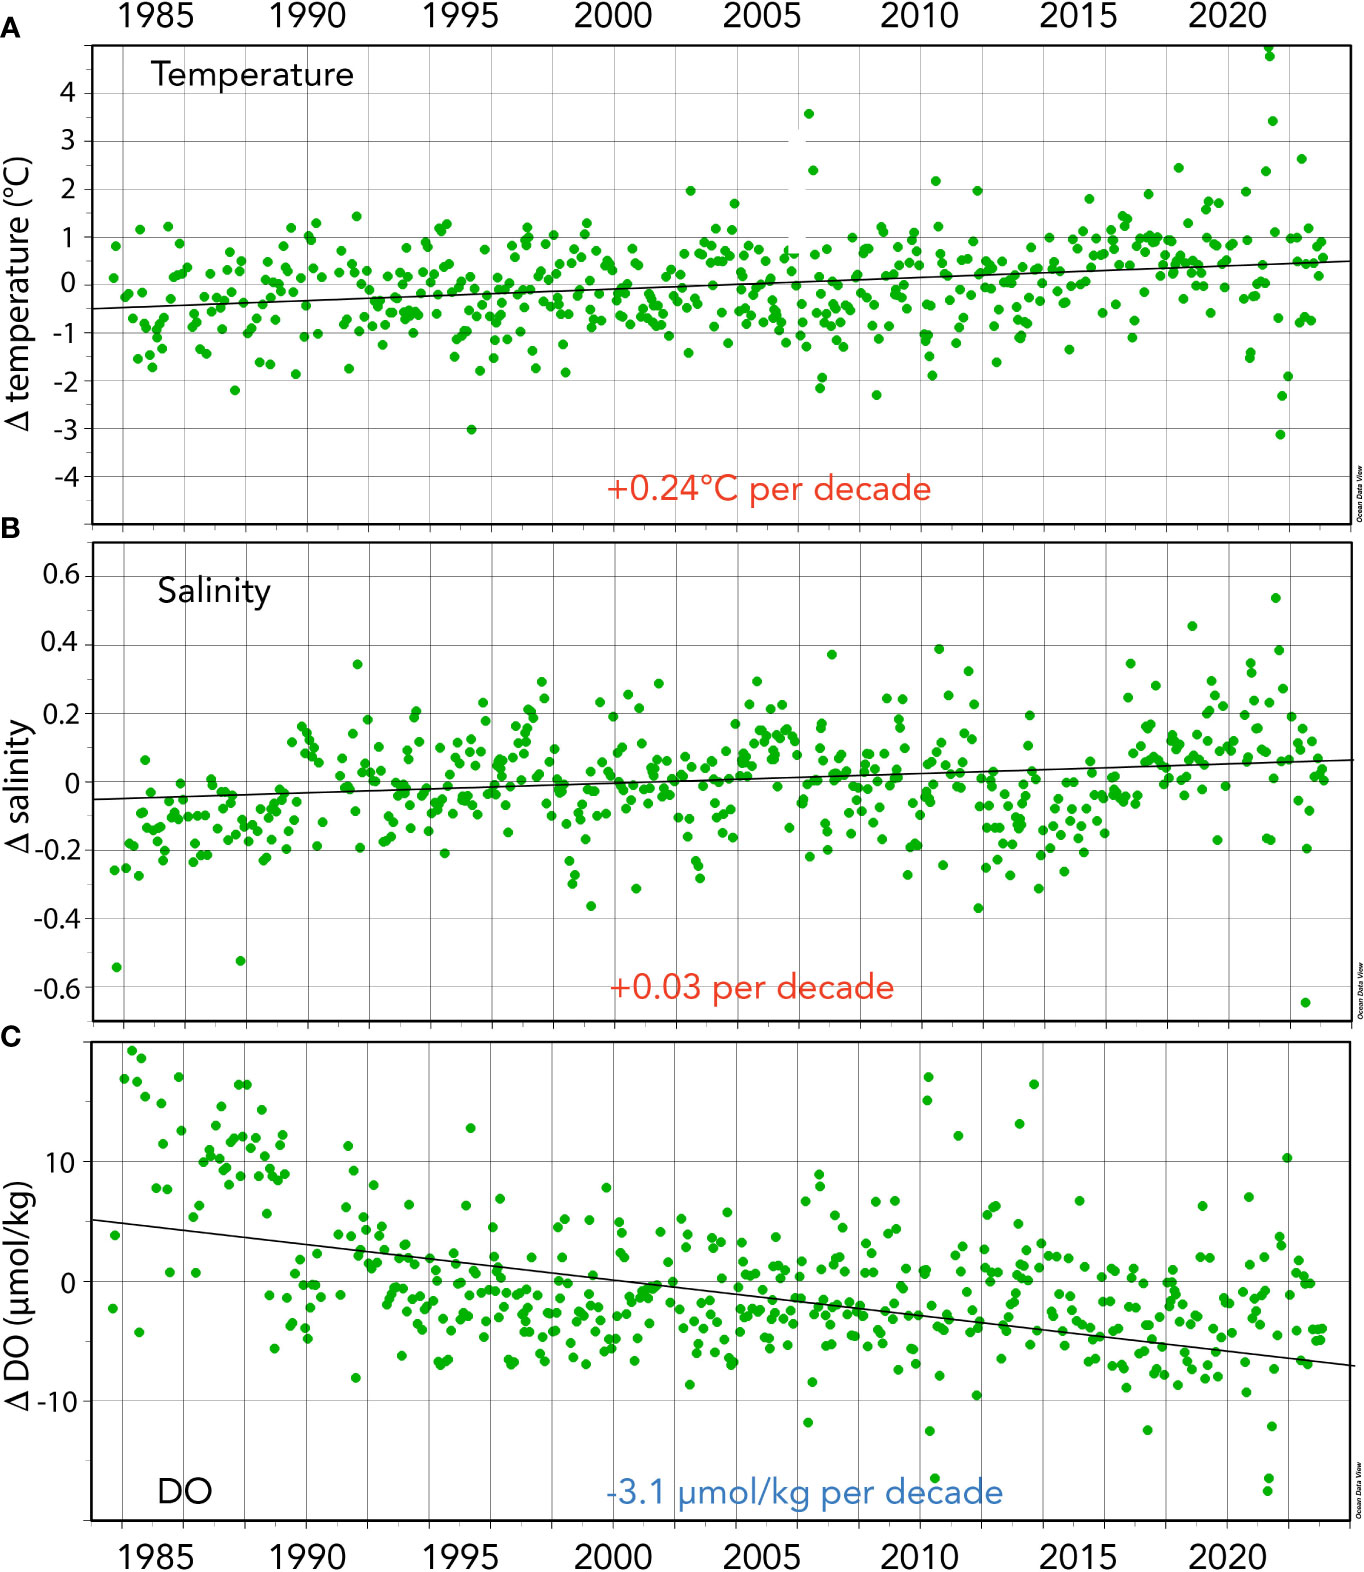
Figure 3 Seasonally detrended seawater properties collected at the BATS site (1988–2023) and combined with earlier data from Hydrostation S (1983–1988). (A) Surface temperature anomalies (Δtemperature; °C) over time. (B) Surface salinity anomalies over time (Δsalinity). (C) Surface dissolved oxygen DO anomalies (ΔDO; µmol kg−1) over time.
Over the past 40 years, surface salinity increased by ~+0.034 ± 0.005 per decade and by +0.136 ± 0.020 from 1983 to 2023. As with the rate of change of temperature at BATS, salinification has also increased at a faster pace recently when comparing rates of +0.029 (Bates and Johnson; 1983-2019) to the rate (+0.034) computed from this extended dataset (i.e., 1983–2023; Table 1; Figure 3B). Recently, Cheng et al. (2020) proposed the Salinity-Contrast (SC) index as a useful way to show the reorganization and amplification of the global hydrological cycle. The SC index is a manifestation of the “salty gets saltier and fresh gets fresher” ocean changes as evidenced by long-term regional and hemispheric differences in the ocean. It is based on the difference in monthly average salinity between high-latitude and low-latitude regions. Cheng et al. (2023) report that the SC index has continued to increase, and compared to a 1981–2010 baseline, the North Atlantic has become saltier. This long-term change in the global hydrological cycle has been observed at BATS, and the “saltiness” of the subtropical gyre continues to increase.
With a broader regional context, warming and increasing heat content of the upper ocean is also observed in the eastern subtropical gyre (e.g., Villarino et al., 2020; Siemer et al., 2021) and subpolar gyre of the North Atlantic Ocean (e.g., Desbruyères et al., 2021; Josey and Sinha, 2022; Rousseau et al., 2023). It should also be noted that the formation rates of subtropical mode water formation south of the Gulf Stream has decreased in the last decade (Stevens et al., 2020). The ~1°C warming of the North Atlantic subtropical gyre observed at the BATS site over the past 40 years is thus another indicator of the physical and circulation changes underway in the North Atlantic Ocean that have global implications through changes in overturning circulation (e.g., Lenton et al., 2019; Jackson et al., 2022). It should also be noted that the acceleration of ocean temperatures in the North Atlantic subtropical gyre, particularly in the last decade, is contemporaneous with faster rates of global ocean warming (Cheng et al., 2023).
Trend analysis of DO shows a decline of −3.1 ± 0.27 µmol kg−1 per decade and a −12.49 ± 0.27 µmol kg−1 decrease over the past 40 years (Table 1). These long-term data show a loss of DO of ~6% from 1983 to 2023 (Figure 3C) and within the range shown for global ocean deoxygenation rates of ~3 to 7 µmol kg−1 decade−1 in the thermocline (Stendardo and Gruber, 2012; Montes et al., 2016). This rate of DO is slightly lower at ~6% compared to 8% reported by Johnson and Bates (2020).
Such changes in DO are synergistic with ocean warming and OA and complex causes such as solubility effects (Garcia and Gordon, 1992), ocean physics, air–sea heat and gas exchange, climate change, stratification and ocean primary production (Levin and Le Bris, 2015), microbial pathways (Lønborg et al., 2016) to zooplankton (Bednarsek et al., 2016), and oxygen minimum zone expansion (Stramma et al., 2010; Rabalais et al., 2014; Duarte et al., 2015).
The causes for deoxygenation of the subtropical gyre of the North Atlantic over the past 40 years are partly due to solubility changes (associated with warming and stratification), and the combined effect of changes in ocean biology and physics (Bates and Johnson, 2022; Lomas et al., 2022). Tagklis et al. (2020) suggested that there is a modulation of North Atlantic Ocean deoxygenation. They suggested that warming of the North Atlantic acts to increase solubility and loss of oxygen, but this effect is somewhat counteracted by weakening of biological carbon export and remineralization (i.e., higher oxygen levels). Recently, Lomas et al. (2022) showed that upper ocean stratification was increasing and rates of primary production were declining in the North Atlantic subtropical gyre over the last couple of decades. Leonelli et al. (2021) report that the North Atlantic oligotrophic gyre has expanded over time with lower nitrate supply in winter to the region near BATS. However, despite these changes, rates of organic carbon export have sustained themselves at similar magnitude over the same period due to “nutrient trapping” below the euphotic zone and changes in community phytoplankton structure that have led to increases in the stoichiometric N:P and C:P ratios of particulate matter produced through photosynthesis (Lomas et al., 2022). At the BATS site, the loss of oxygen has decreased slightly [from −3.7 µmol/kg/decade, 1983 to 2019 (Bates and Johnson, 2020), to −3.1 µmol/kg/decade, 1983 to 2023, Table 1] despite the increasing rate of warming in the subtropical gyre and lower rates of primary production (Lomas et al., 2022), suggesting a complex interaction between “nutrient trapping” and other physical and biological factor influencing ocean oxygen.
3.2 Surface ocean changes in DIC and TA, and CTrOCA in the Sargasso Sea (1993–2023)
The sustained observations near Bermuda at BATS and Hydrostation S represent the longest record of seawater CO2-carbonate chemistry observations and is an indicator of long-term OA in the global ocean (Bates et al., 2014). Surface total alkalinity shows similar seasonal patterns to salinity with a seasonality of ~10 µmol kg−1 (Figure 2D; also Bates and Johnson, 2020), while DIC and nDIC have a seasonality of ~40 µmol kg−1 (Figure 2E; ~30 µmol kg−1 for nDIC not shown).
As discussed earlier, the salinity of the Sargasso Sea has increased by +0.136 or ~0.37% over the past 40 years. Contemporaneously, TA and nTA have increased by +3.8 ± 0.30 µmol kg−1 per decade, and +1.4 ± 0.39 µmol kg−1 per decade, respectively (Figure 4A). From 1983 to 2023, TA and nTA have increased by 6.3% (+15.06 ± 1.20 µmol kg−1) and 2.2% (+5.42 ± 1.56 µmol kg−1), respectively. The rate of TA increase is slightly higher than that reported by Bates and Johnson (2020), which most probably reflects an acceleration in the rate of salinity increase. Part of this increase appears to reflect an increase in nTA over the recent decade (Table 1), but it is difficult to ascertain the cause(s) for this with several competing factors potentially at play in the subtropical gyre. Over the past few decades, there has been a reduction in pelagic calcification (Krumhardt et al., 2016) and calcium carbonate dissolution, and a reduction of atmospheric nitrogen supply to the Sargasso Sea (Bates and Peters, 2007). Both processes should act to increase alkalinity (i.e., nTA) over time. In contrast, Fry et al. (2015) showed that TA* (or nTA) decreases towards the equatorial region. Given that Leonelli et al. (2021) suggest that the North Atlantic Ocean oligotrophic gyre has expanded over time, lower nTA may be influencing the north Sargasso Sea more. On the longer-time scale, coccolithophore calcification in the “Great Calcite Belt” of the Southern Ocean (e.g., Balch et al., 2016) appears to be the important alkalinity control on the subtropical gyres (Krumhardt et al., 2020). If there is a reduction of coccolithophore calcification in the “Great Calcite Belt”, model studies indicate increased alkalinity in the subtropical gyres (e.g., Krumhardt et al., 2022).
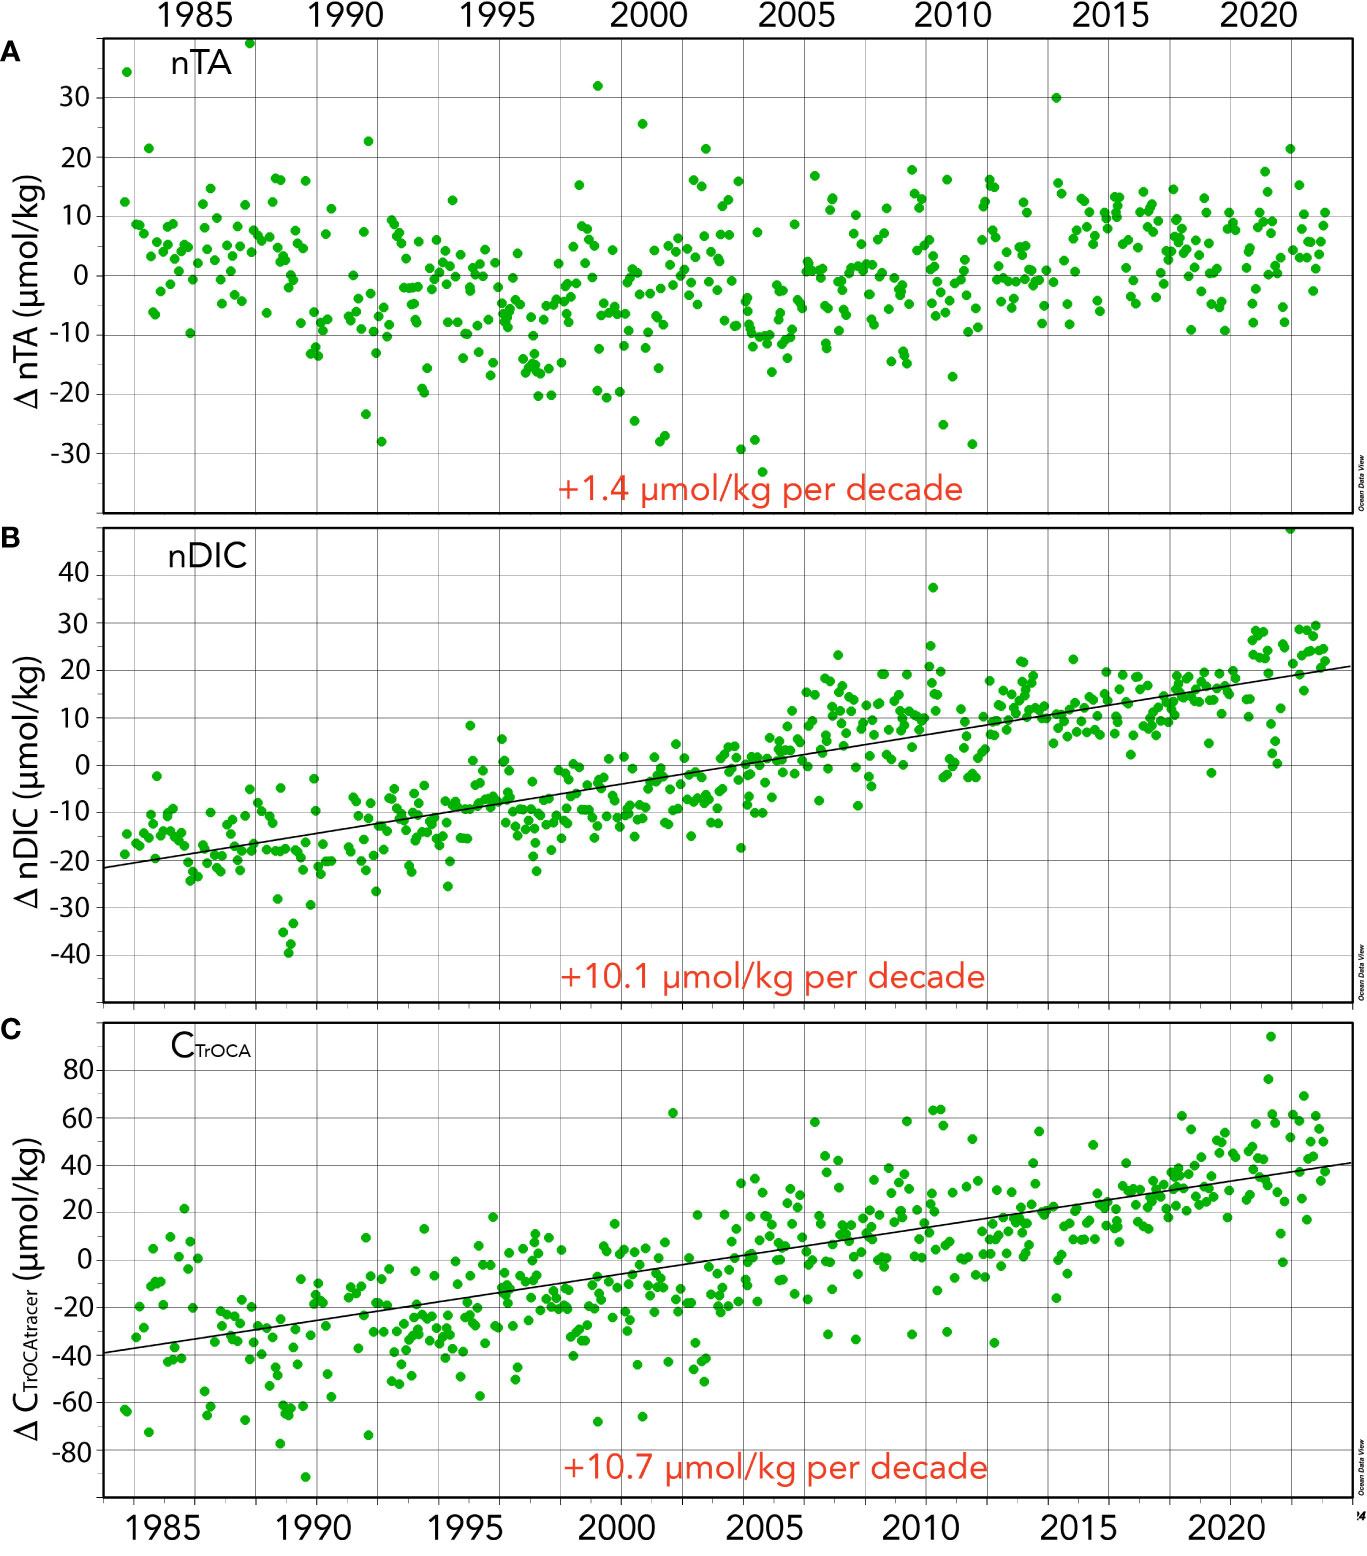
Figure 4 Seasonally detrended seawater CO2-carbonate properties collected at the BATS site (1988–2023) and combined with earlier data from Hydrostation S (1983–1988). (A) nTA anomalies (ΔnTA; µmol kg−1) over time; (B) nDIC anomalies (ΔnDICµmol kg−1) over time; (C) CTrOCA values (ΔCTrOCA; µmol kg−1) over time.
Surface DIC and nDIC have significantly increased from 1983 to 2023 at rates of 12.9 ± 0.36 and 10.9 ± 0.28 µmol kg−1 decade−1, respectively (Figure 4B). Such changes are similar to the rates of changes reported by Bates and Johnson (2020) for the period 1983 to 2019. The 40-year changes in DIC and nDIC are +51.5 ± 1.42 and +43.70 ± 1.12 µmol kg−1, respectively, representing a ~2.51% and ~2.13% change in total dissolved inorganic carbon in the Sargasso Sea. The difference between DIC and nDIC trends indicates that salinity changes contributed approximately 20% of the changes in DIC.
The TrOCA method has limitations in use for anthropogenic CO2 quantification (Yool et al., 2010), but nevertheless provides a useful tracer of ocean chemical changes when used at a fixed location (Bates and Johnson, 2020). In the Sargasso Sea, TrOCA-derived anthropogenic carbon concentration used here as a tracer (CTrOCA) exhibits seasonal ranges of ~30–40 µmol kg−1, and CTrOCA has increased by ~42.7 µmol kg−1 (+71%) over the past 40 years (Figures 2F, 4C). The rate of increase of CTrOCA and nDIC is very similar, with the finding that the ocean uptake of anthropogenic CO2 uptake has substantially changed ocean carbon chemistry over the past 40 years. While we use CTrOCA as a tracer here, Woosley et al. (2016) reported an increase in anthropogenic CO2 of approximately 20 µmol kg−1 in the upper ocean over 15 years (1997–2012) in the western North Atlantic Ocean subtropical gyre. Thus, the rates of CTrOCA increase in the complex mixed layer are similar to rates of anthropogenic CO2 increases across the subtropical North Atlantic Ocean.
3.3 Surface ocean changes in fCO2, pCO2 and Revelle factor in the Sargasso Sea (1993–2023)
Surface seawater fCO2 and pCO2 also exhibit substantial seasonality in the Sargasso Sea with typical ranges of ~70 µatm (Figure 5A; also Bates and Johnson, 2020). The seasonal variability of fCO2 and pCO2 primarily reflects the seasonality of temperature (warming/cooling) and spring–summer DIC decrease and autumn–winter DIC increase (Bates et al., 1996, Bates, 2001; Bates et al., 2012). The rate of change of fCO2 in the Sargasso Sea is +19.4 ± 0.65 µatm decade−1 (Figure 6). The rate of ocean CO2 change is similar to observed changes in atmospheric fCO2, and reported elsewhere (e.g., Bates et al., 2014). The 40-year increase of +77 µatm represents an increase of nearly 25% from 1983 to 2023.
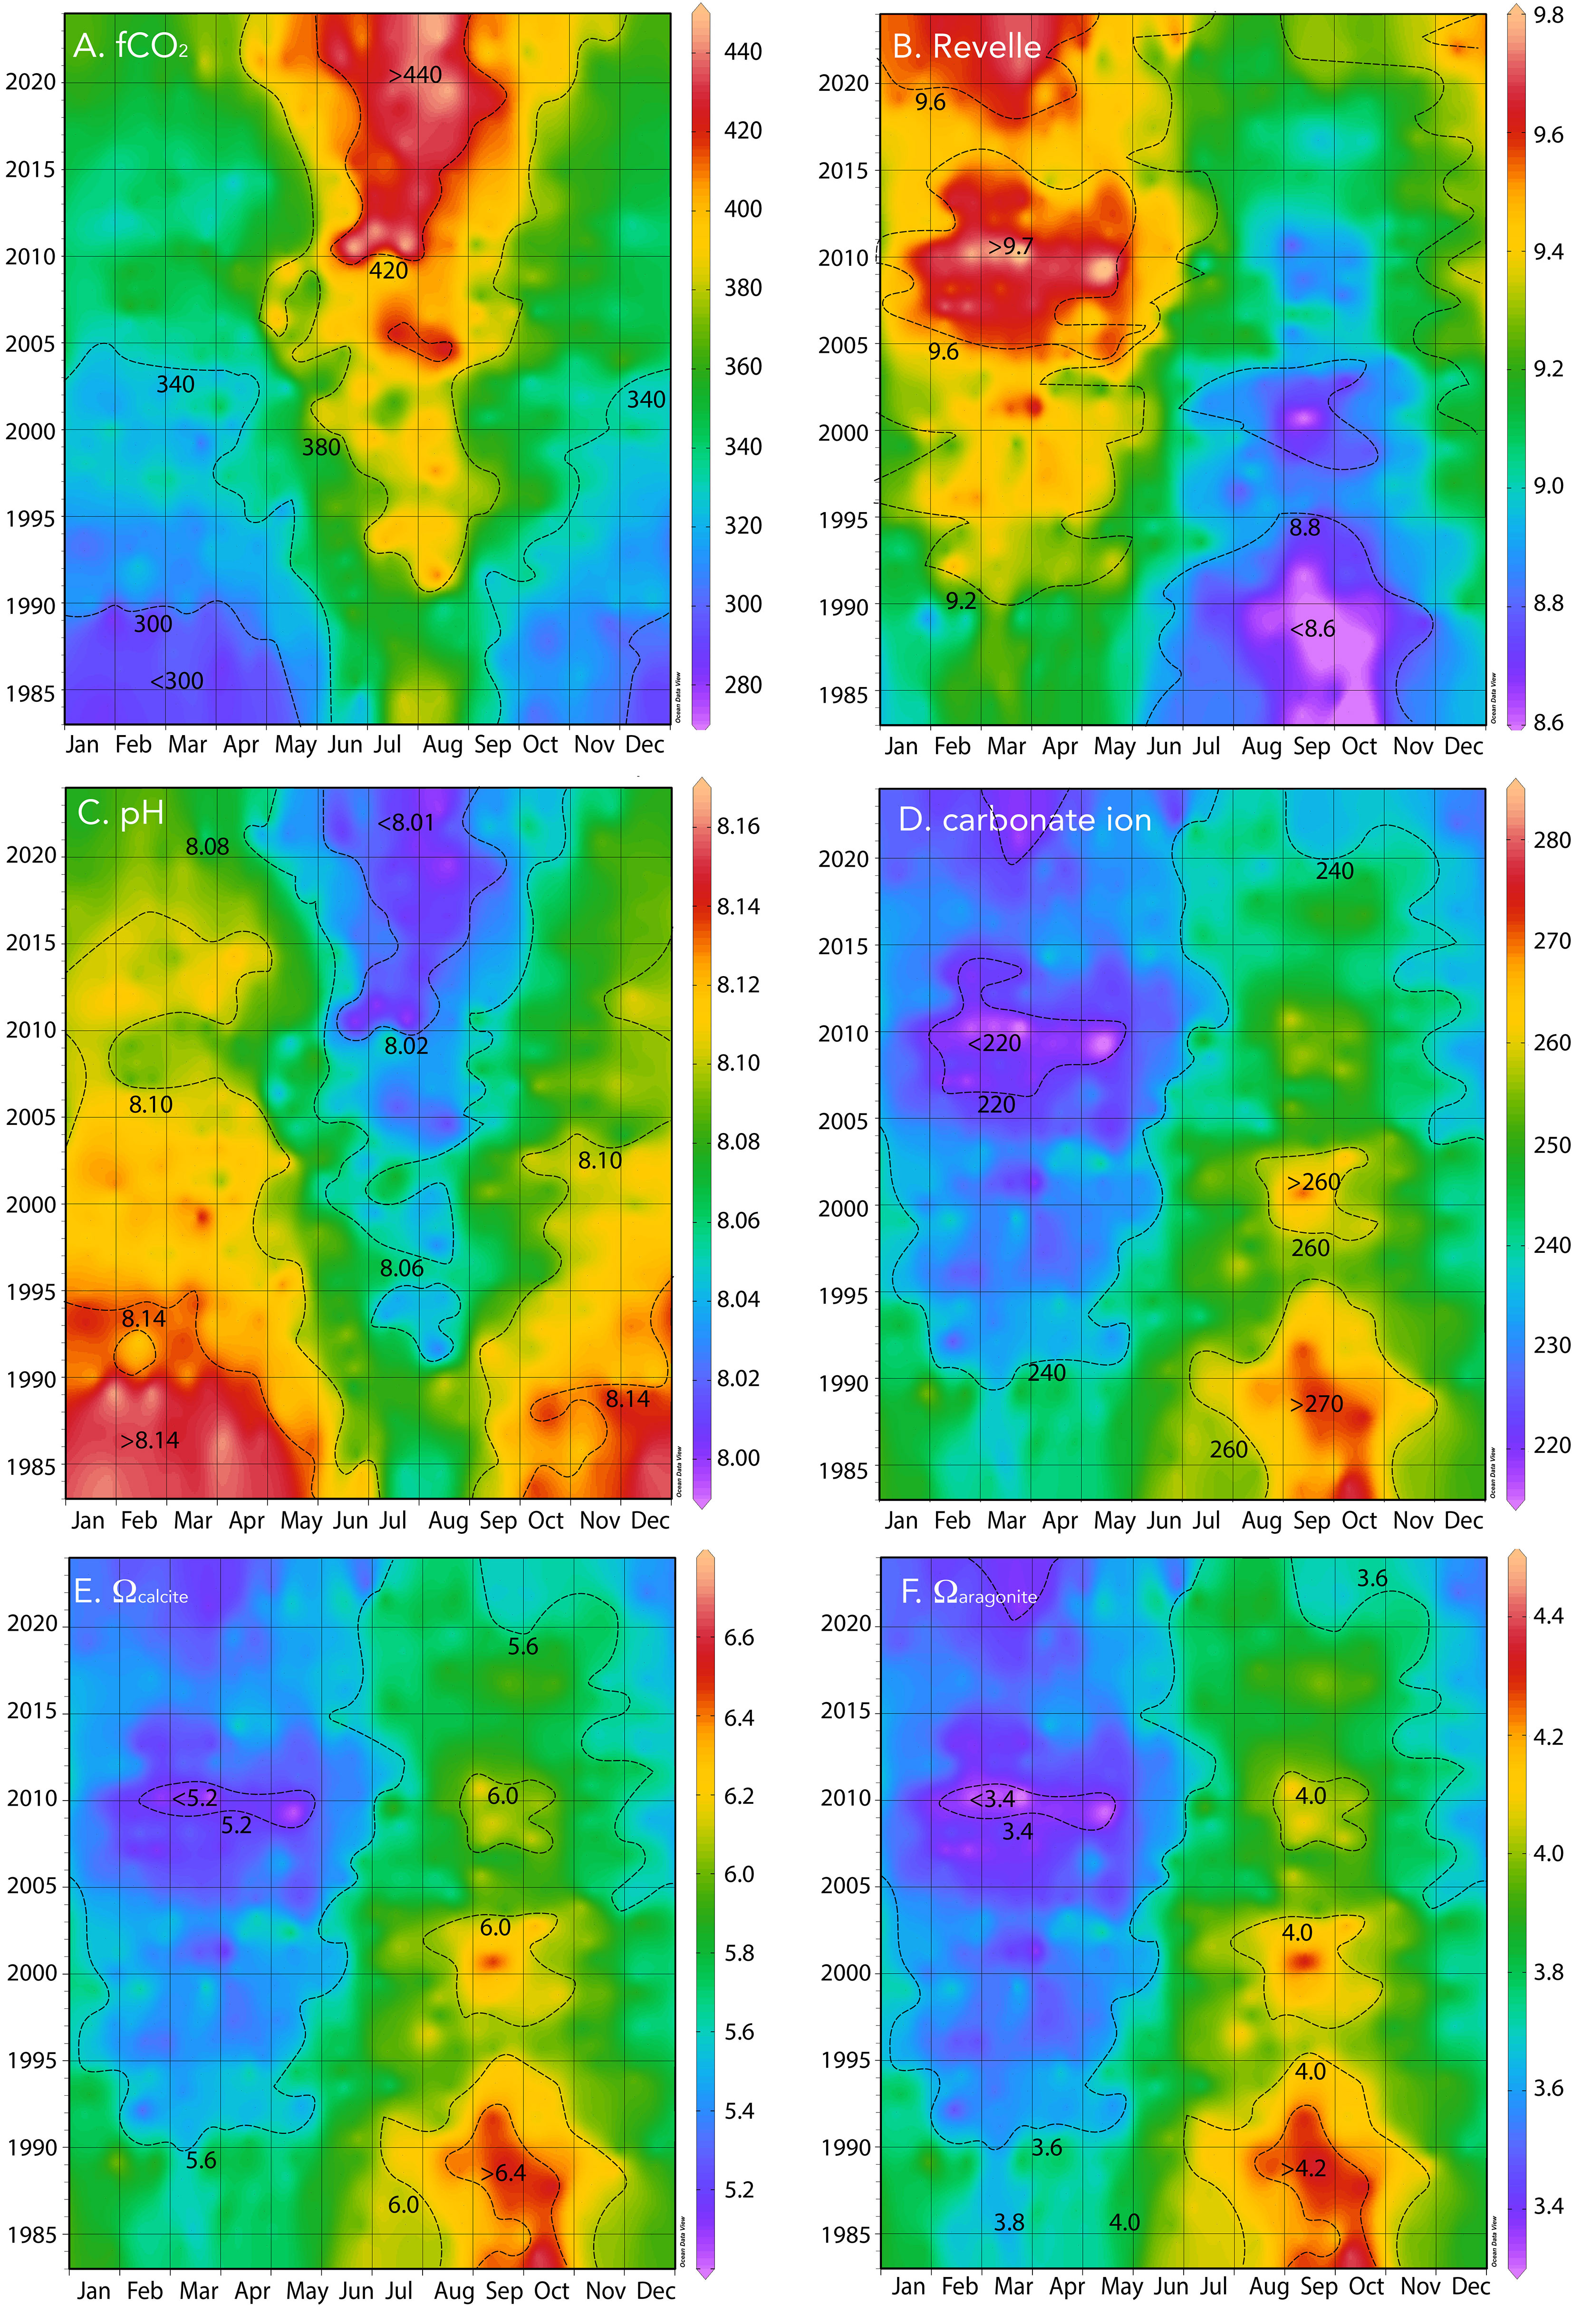
Figure 5 Hovmuller plot of surface physical and biogeochemistry collected at BATS (1988–2023) and combined with earlier data (1983–1988) from Hydrostation S. (A) fCO2 (µatm); (B) Revelle factor; (C) pH (pH units); (D) carbonate ion [CO32−] (µmol kg−1); (E) Ωcalcite; (F) Ωaragonite.
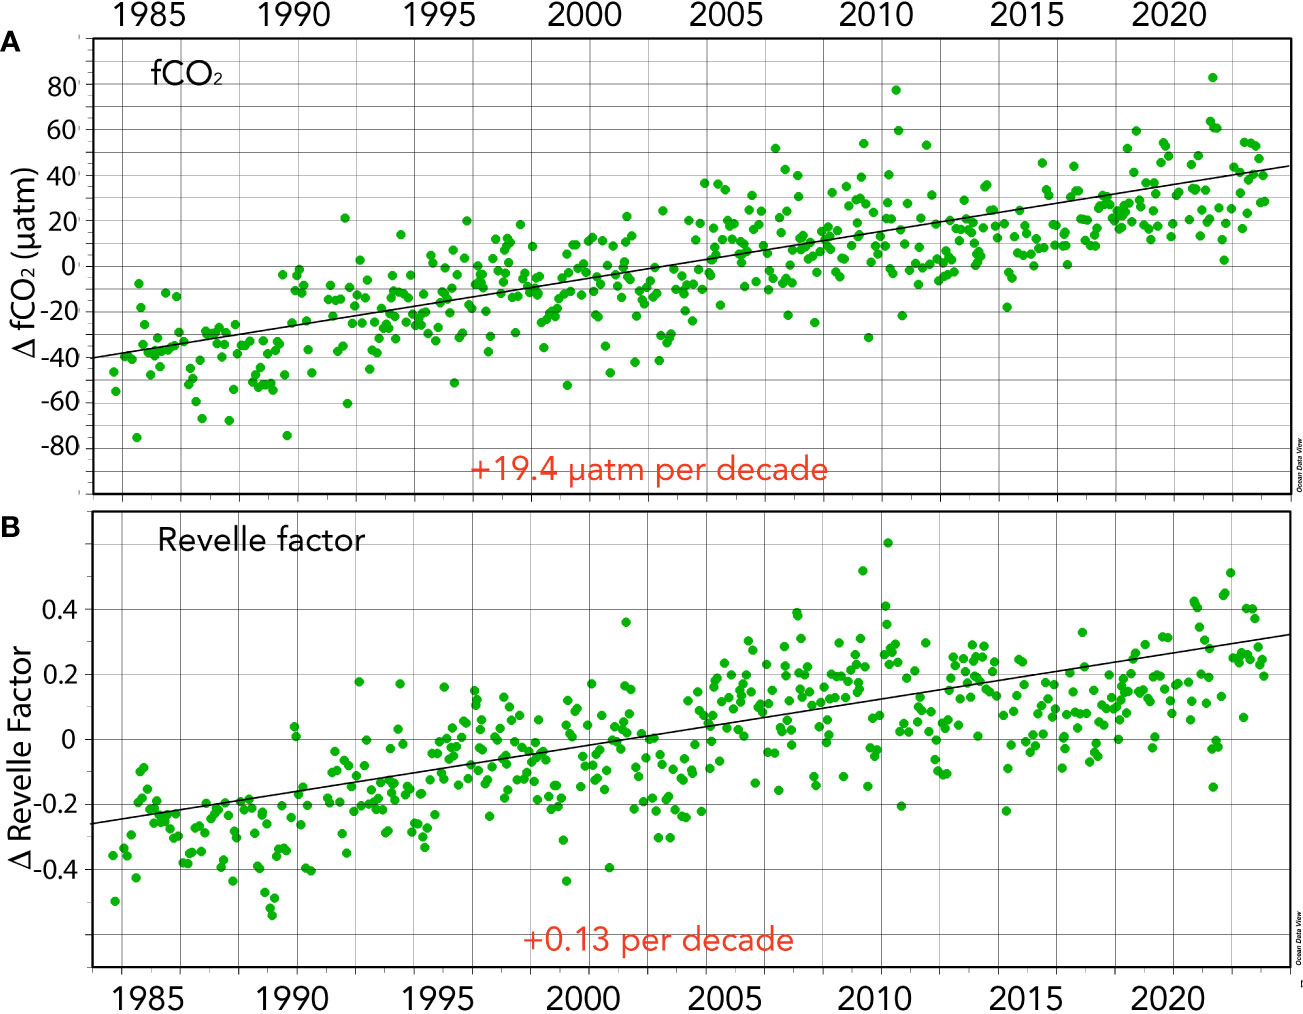
Figure 6 Seasonally detrended air–sea CO2 gas exchange-related properties collected at BATS (1988–2023) and combined with earlier data from Hydrostation S (1983–1988). (A) Surface fCO2 anomalies (ΔfCO2; µatm) over time. (B) Revelle Factor anomalies (ΔRevelle Factor; β) over time.
The combined BATS and Hydrostation S record shows that surface ocean and atmospheric fCO2 have tracked each other contemporaneously over the past 40 years (Bates and Johnson, 2020). The driving force for air–sea CO2 gas exchange (i.e., ΔfCO2; the fCO2 difference between atmosphere and seawater) has changed little since the 1980s, but the air–sea CO2 sink has likely increased as wind speed and wave heights have increased in the North Atlantic over the past few decades. The chemical understanding of CO2-carbonate chemistry in seawater predicts that the ocean capacity to absorb CO2 will decrease as atmospheric CO2 increases (e.g., Zeebe and Wolf-Gladrow, 2001; Dickson et al., 2007; Millero, 2013; Fassbender et al., 2017; Bates and Johnson, 2020). As the Revelle factor (β) increases (Revelle and Suess, 1957), the ocean’s capacity to absorb CO2 decreases.
The seasonality of β in the Sargasso Sea is ~0.5 (Figure 5B). Counterintuitively, the Sargasso Sea takes up CO2 in the wintertime (e.g., Bates, 2001; Bates, 2007) despite highest β values, while during the summertime, values are lowest when the ocean loses CO2 to the atmosphere. This is mostly driven by the seasonal forcing of fCO2 by the seasonal changes in temperature (~8–10°C; Bates et al., 1996; Bates et al., 2012). Importantly, the Revelle factor, β, has increased over the past 40 years (~+0.54 ± 0.01; Table 1; Figure 6). This finding indicates that the ocean capacity to absorb CO2 has declined over the last 40 years (~6% since 1983) with implications for the future fate of anthropogenic CO2 in the atmosphere and its transfer to the ocean. As β values increase in the future, the ocean’s capacity to absorb CO2 from the atmosphere will decrease and constitute another feedback in the understanding of the global carbon cycle.
3.4 Ocean acidification changes in the Sargasso Sea (1993–2023)
The BATS and Hydrostation S data provide an unparalleled signal of ocean acidification in North Atlantic Ocean surface waters (Bates and Johnson, 2020).
The typical seasonality of pH of surface waters varied from wintertime highs of ~8.2 to summertime lows of ~8.08 to 8.10 with a range of ~0.08 (Figure 5C). The pH and carbonate chemistry of the Sargasso Sea remain mildly alkaline at present (~7.98–8.05) with having a seasonality of ~30 µmol kg−1 (Figure 5D). The saturation states for calcite (Ωcalcite) and aragonite (Ωaragonite) exhibit seasonal changes of ~0.6 and 0.5 (Figures 5E, F), respectively, which is largely driven by seasonal temperature and DIC changes.
The pH change is ~−0.018 ± 0.001 decade−1 for the period 1983 to 2023 (Figures 5, 7A, B) and similar to rates reported for the Sargasso Sea (1983–2019, Bates and Johnson, 2020). This represents a 30% increase in hydrogen ion concentration since 1983. Similarly, Ωcalcite and Ωaragonite have decreased by 0.55 and 0.35, respectively (Figures 7A, B).
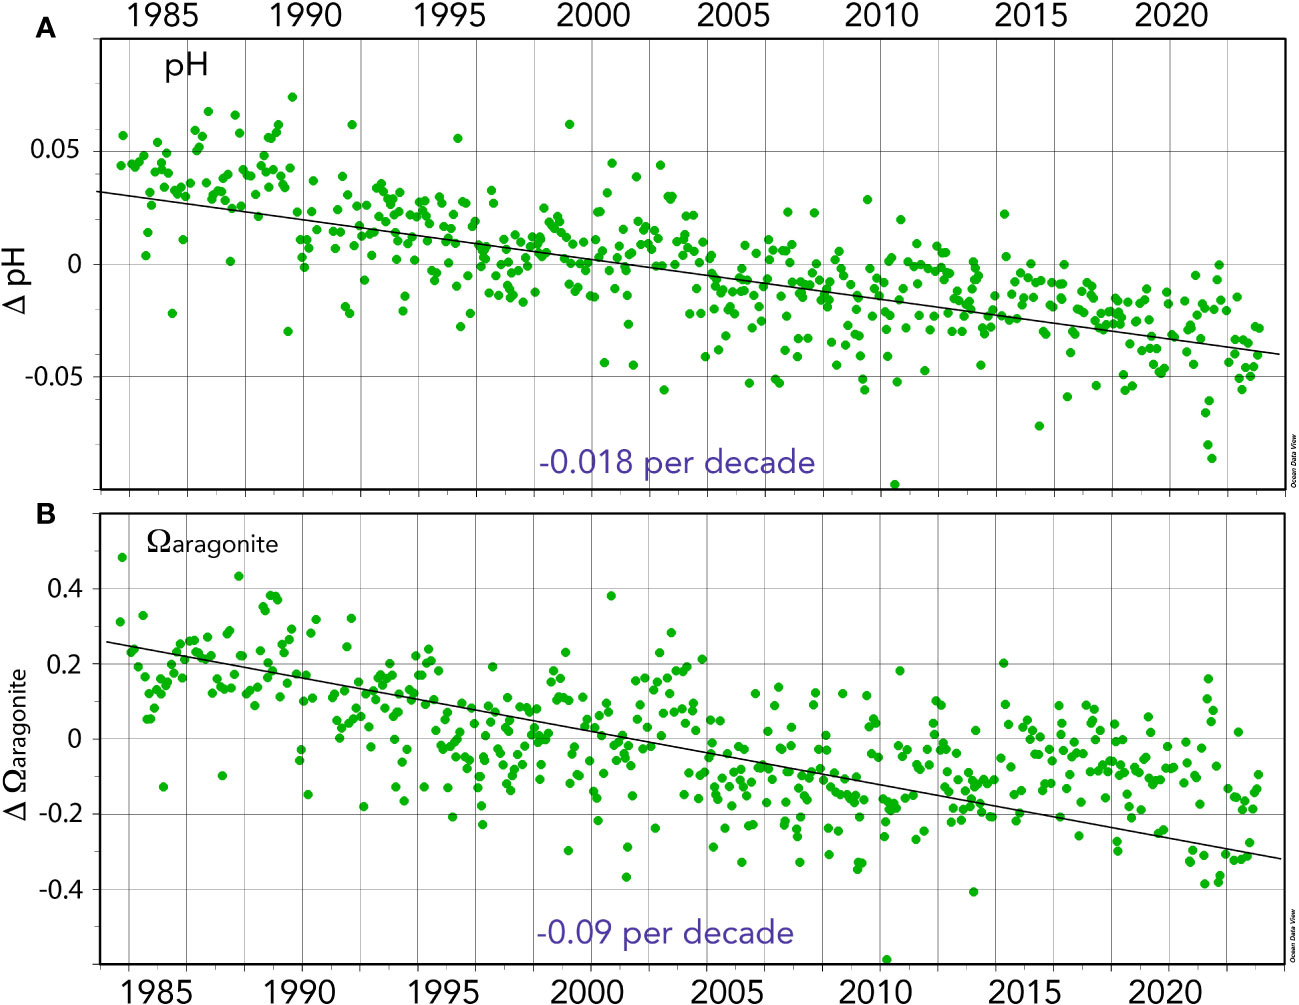
Figure 7 Seasonally detrended ocean acidification (OA)-related properties collected at BATS (1988–2023) and combined with earlier data from Hydrostation S (1983–1988). (A) Surface pH anomalies (pH units) over time (ΔpH). (B) Surface Ωaragonite anomalies over time (ΔΩaragonite).
In the past 40 years, seawater CO2-carbonate chemistry conditions have changed beyond the seasonal chemical ranges observed in the 1980s (Bates and Johnson, 2020). For DIC and fCO2, wintertime and summertime values in the 2020s are now beyond the equivalent seasonal values of the 1980s. Similarly, pH, Ωcalcite, and Ωaragonite values in the 2020s are outside the seasonal chemical values observed in the 1980s.
These OA indicators for the BATS/Hydrostation S records indicate that ocean chemistry changes were likely impactful for those organisms secreting CaCO3 skeletons, tests, or shells (Fabry et al., 2008). As noted earlier, the 1983 to 2023 increase in nTA may partially be due to reduced pelagic calcification in the Sargasso Sea. If the reduction of Ωcalcite and Ωaragonite over time slowly reduces calcification and increases nTA, this represents the first signs of a feedback for OA. As Ωcalcite and Ωaragonite decrease due to anthropogenic CO2 uptake (the primary driver of future ocean CO2 chemistry), an increase in nTA due to reduced calcification will have a secondary effect of slightly increasing Ωcalcite and Ωaragonite.
4 Discussion and summary
Current trends at BATS show how ocean chemistry of the 2020s is now outside the range observed in the 1980s, and how essential these data are for predicting the response of ocean chemistry and marine ecosystems to future shifting earth and ocean conditions (and end-of-century marine chemistry scenarios in the Sargasso Sea; e.g., Bates and Johnson, 2020). The BATS Hydrostation S record from 1983 to 2023 clearly demonstrates the long-term warming in the North Atlantic Ocean subtropical gyre, and contemporaneously with the global acceleration of ocean warming (Cheng et al., 2023). The salinification of the subtropical gyres continues and thus a regional reflection of the long-term SC index trends is shown by Cheng et al. (2023).
The SC index uses data from 1980, and it is a useful metric for showing long-term changes in the oceans. There has been interest in recognizing and demonstrating ocean extremes and compound events (e.g., Gruber et al., 2021; Berger et al., 2022) and blueprints for environmental assessments of oceanic basins such as the North Atlantic Ocean (Roberts et al., 2023). The ocean observations at BATS provide a useful long-term record of OA, but building on this and other efforts, an Alkalinity-Contrast (AC) index may be a potentially helpful metric for OA. The SC index shows, in simple terms, the contrasting/differential changes in subtropical (i.e., “saltier”) and subpolar (i.e., “fresher”) regions as an indicator of the global hydrological cycle reorganization. The method uses monthly salinity averages from high-latitude and low-latitude regions and integrates over 0–2,000 m. The data for an equivalent AC index is much more limited than used for the SC index and consists of data from 1983 in the Sargasso Sea (i.e., BATS/Hydrostation S; the low latitude) and the Irminger and Icelandic Seas (i.e., the high latitude; Olafsson et al., 2009; Bates et al., 2014). An expectation might initially be contrasting trajectories of alkalinity (or other OA indicators) between the subtropical gyre (i.e., BATS; increasing salinity and TA) and subpolar gyre (i.e., Irminger and Icelandic Seas; decreasing salinity and TA). However, like the Sargasso Sea, the Irminger and Icelandic Seas show an increase in salinity and TA from 1983 (Olafsson et al., 2009; Bates et al., 2014; data from Lange et al., 2023). This shows the challenges and complexities of understanding the long-term interactions between warming, salinification/freshening, and OA impacts in different regions of the North Atlantic Ocean, for example.
The combined BATS and Hydrostation S ocean time-series records are one of the few that are longer than 20 years in length (see other sustained time-series in Bates et al., 2014). Over the past couple of decades, numerous additional sustained ocean observations have been established as a mechanism for understanding present and future trends for OA (e.g., Tilbrook et al., 2019) and essential ocean variables (EOVs; Ruhl et al., 2011; Muller-Karger et al., 2018). There will be a pressing need to combine, compare, and synthesize ocean carbon and biogeochemical data for both highest-quality climate trend data analyses and local, regional, and basinal data synthesis. Such efforts will have challenges associated with data/time-series context and combining different types of data/sensor streams to allow for consistent and comparable synthesis (e.g., Sutton et al., 2022; Lange et al., 2023).
Data availability statement
The datasets presented in this study can be found in online repositories. The names of the repository/repositories and accession number(s) can be found in the article/supplementary material.
Author contributions
NB: Conceptualization, Data curation, Formal Analysis, Funding acquisition, Investigation, Methodology, Project administration, Resources, Supervision, Validation, Visualization, Writing – original draft, Writing – review & editing. RJ: Data curation, Project administration, Resources, Writing – review & editing.
Funding
The author(s) declare financial support was received for the research, authorship, and/or publication of this article. This research was produced with financial support from the National Science Foundation through the award (NSF OCE 1756105).
Acknowledgments
The authors would like to thank the principal investigators, researchers, and technicians/specialists who have contributed to the BATS and Hydrostation S projects since their inception. Special thanks are extended to the following: (1) Anthony H. Knap, Anthony F. Michaels, and Craig A. Carlson as former BATS investigators, and current co-investigators Michael W. Lomas and Deborah K. Steinberg; (2) research specialists Rebecca Garley and Matt Enright, and past researchers Frances Howse and Margaret Best; (3) Andrew Dickson for his work on producing seawater CO2-carbonate chemistry reference standards; (4) the late Dave (C.D.) Keeling for his sampling and analysis at Hydrostation S in the 1980s, and Catherine Goyet for her sampling and analysis from 1988 to early 1990; and (5) Ludger Mintrop for his work designing and building research instruments such as the VINDTA. Our additional thanks to the present and past officers and crew of the R/V Weatherbird I, R/V Weatherbird II, and R/V Atlantic Explorer, and many BATS/Hydrostation S research technicians and specialists who have been part of the program over the past 35 years.
Conflict of interest
The authors declare that the research was conducted in the absence of any commercial or financial relationships that could be construed as a potential conflict of interest.
Publisher’s note
All claims expressed in this article are solely those of the authors and do not necessarily represent those of their affiliated organizations, or those of the publisher, the editors and the reviewers. Any product that may be evaluated in this article, or claim that may be made by its manufacturer, is not guaranteed or endorsed by the publisher.
References
Armstrong-McKay D. I., Staal A., Abrams J. F., Winkelmann R., Sakschewski B., Loriani S., et al. (2022). Exceeding 1.5°C could trigger multiple climate tipping points. Science 377, 6611. doi: 10.1126/science.abn7950
Balch W. B., Bates N. R., Lam P., Twining B., Rosengard S. Z., Bowler B. C., et al. (2016). Factors regulating the Great Calcite Belt in the Southern Ocean and its biogeochemical significance. Global Biogeochem. Cycles 30 (8), 2016GB005414. doi: 10.1002/2016GB005414
Balch W. M., Drapeau D. T., Bowler B. C., Record N. R., Bates N. R., Pinkham S., et al. (2022). Changing hydrographic, biogeochemical, and acidification properties in the Gulf of Maine as measured by the Gulf of Maine North Atlantic Time-series, GNATS, between 1998 and 2018. J. Geophys. Res. Biogeosci. 127 (6), e2022JG006790. doi: 10.1029/2022JG006790
Bakker D. C. E., Pfeil B., Landa C. S., Metzl N., O’Brien K. M., Olsen A., et al. (2016). A multi–decade record of high quality fCO2 data in version 3 of the Surface Ocean CO2 Atlas (SOCAT). Earth Sys. Sci. Data 8, 383.
Bates N. R. (2001). Interannual variability of oceanic CO2 and biogeochemical properties in the Western North Atlantic subtropical gyre. Deep–Sea Res. II 48 (8–9), 1507–1528. doi: 10.1016/S0967–0645(00)00151–X
Bates N. R. (2007). Interannual variability of the oceanic CO2 sink in the subtropical gyre of the North Atlantic Ocean over the last two decades. J. Geophys. Res. (Oceans) 112 (C9), C09013. doi: 10.1029/2006JC003759
Bates N. R. (2017). Twenty years of marine carbon cycle observations at Devils Hole Bermuda provide insights into seasonal hypoxia, coral reef calcification and ocean acidification. Front. Mar. Sci. 4 (Article 36). doi: 10.3389/fmars.2017.00036
Bates N. R., Johnson R. J. (2020). Acceleration of ocean warming, salinification, deoxygenation, and acidification in the surface subtropical North Atlantic Ocean. Nat. Commun. Earth Environ. 1, 1–12.
Bates N. R., Astor Y. M., Church M. J., Currie K., Dore J. E., Gonzalez–Davila M., et al. (2014). Changing ocean chemistry: A time–series view of ocean uptake of anthropogenic CO2 and ocean acidification. Oceanography 27 (1), 121–141. doi: 10.5670/oceanog.2014.03
Bates N. R., Best M. H., Neely K., Garley R., Dickson A. G., Johnson R. J. (2012). Indicators of anthropogenic carbon dioxide uptake and ocean acidification in the North Atlantic Ocean. Biogeosciences 9, 2509–2522. doi: 10.10.5194/bg–9–2509–2012
Bates N. R., Johnson R. J. (2022). Ocean observing in the North Atlantic subtropical gyre. Oceanography 34 (4), 32–33. doi: 10.5670/oceanog.2021.supplement.02-14
Bates N. R., Michaels A. F., Knap A. H. (1996a). Seasonal and interannual variability of oceanic carbon dioxide species at the US JGOFS Bermuda Atlantic Time-series Study (BATS) site. Deep Sea Res. Part II 43, 347–383. doi: 10.1016/0967-0645(95)00093-3
Bates N. R., Michaels A. F., Knap A. H. (1996b). Alkalinity changes in the Sargasso Sea: geochemical evidence of calcification? Mar. Chem. 51, 347–358. doi: 10.1016/0304-4203(95)00068-2
Bates N. R., Pequignet A. C., Johnson R. J., Gruber N. (2002). A short–term sink for atmospheric CO2 in subtropical mode water of the North Atlantic Ocean. Nature 420 (6915), 489–493. doi: 10.1038/nature01253
Bates N. R., Peters A. J. (2007). The contribution of atmospheric acid deposition to ocean acidification in the subtropical North Atlantic Ocean. Mar. Chem. 107 (4), 547–558. doi: 10.1016/j.marchem.2007.08.002
Bednarsek N., Harvey C. J., Kaplan I. C., Feely R. A., Mözma J. (2016). Pteropods on the edge: Cumulative effects of ocean acidification, warming and deoxygenation. Prog. Oceanogr. 145, 1–24. doi: 10.1016/j.pocean.2016.04.002
Berger F., Terhaar J., Frölicher T. L. (2022). Compound marine heatwaves and ocean acidity extremes. Nat Commun 13 (1), 4722. doi: 10.1038/s41467-022-32120-7
Boyd P. W., Collins S., Dupont S., Fabricius K., Gattuso J. P., Havenhand J., et al. (2018). Experimental strategies to assess the biological ramifications of multiple drivers of global ocean change – a review. Global Change Biol 24 (6), 2239–2261. doi: 10.1111/gcb.14102
Boyd P. W., Hutchins D. A. (2012). Understanding the responses of ocean biota to a complex matrix of cumulative anthropogenic change. Mar. Ecol. Prog. Ser. 470, 125–135. doi: 10.3354/meps10121
Brix H., Gruber N., Keeling C. D. (2004). Interannual variability of the upper carbon cycle at station ALOHA near Hawaii. Global Biogeochem. Cycles 18, GB4019. doi: 10.1029/2004GB002245
Caldeira K., Wickett M. F. (2003). Anthropogenic carbon and ocean pH. Nature 425, 365. doi: 10.1038/425365a
Cheng L., Abraham J., Trenberth E. E., Fasullo J., Boyer T., Mann M. E., et al. (2023). Another year of record heat for the ocean. Adv. Atmos. Sci. 40, 963–974. doi: 10.1007/s00376-023-2385-2
Cheng L. J., Foster G., Hausfather Z., Trenberth K. E., Abraham J. (2022b). Improved quantification of the rate of ocean warming. J. Climate 35, 4827–4840. doi: 10.1175/JCLI-D-21-0895.1
Cheng L., Trenberth K. E., Gruber N., Abraham J. P., Fasullo J. T., Li G., et al. (2020). Improved estimates of changes in upper ocean salinity and the hydrological cycle. J. Climate 33, 10357–10381. doi: 10.1175/JCLI-D-20-0366.1
Cheng L., von Schuckmann K., Abraham J. P., Trenberth K. E., Mann M. E., Zanna L., et al. (2022a). Past and future ocean warming. Nat. Rev. Earth Environ. 3, 776–794. doi: 10.1038/s43017-022-00345-1
Desbruyères D., Chafik L., Maze G. (2021). A shift in the ocean circulation has warmed the subpolar North Atlantic Ocean since 2016. Nat. Commun. Earth Environ. 2, 48. doi: 10.1038/s43247-021-00120-y
Dickson A. G. (1990). Standard potential of the reaction: AgCl(s)+12H2(g) = Ag(s) + HCl(aq) and the standard acidity constant of the ion HSO4- in synthetic seawater from 273.15 to 318.15 K. J. Chem. Thermodyn. 22 (2), 113–127. doi: 10.1016/0021-9614(90)90074-Z
Dickson A. G., Millero F. J. (1987). A Comparison of the equilibrium constants for the dissociation of carbonic acid in seawater media. Deep Sea Res. Part A 34, 1,733–1,743. doi: 10.1016/0198-0149(87)90021-5
Dickson A. G., Sabine C. L., Christian J. R. (2007). Guide to best practices for ocean CO2 measurements Vol. 3 (Sidney, British Columbia: North Pacific Marine Science Organization, PICES Special Publication).
Doney S. C., Bopp L., Long M. C. (2014). Historical and future trends in ocean climate and biogeochemistry. Oceanography 27 (1), 108–119. doi: 10.5670/oceanog.2014.14
Doney S. C., Fabry V. J., Feely R. A., Kleypas J. A. (2009). Ocean acidification: The other CO2 problem. Annu. Rev. Mar. Sci. 1, 169–192. doi: 10.1146/annurev.marine.010908.163834
Duarte C. M., Fulweiler R. W., Lovelock C. E., Martinetto P., Saunders M. I., Pandolfi J. M., et al. (2015). Reconsidering ocean calamities. BioScience 65 (2), 130–139. doi: 10.1093/biosci/biu198
Fabry V. J., Seibel B. A., Feely R. A., Orr J. C. (2008). Impacts of ocean acidification on marine fauna and ecosystem processes. ICES J. Mar. Sci. 65, 414–432. doi: 10.1093/icesjms/fsn048
Fassbender A. J., Sabine C. L., Pavesky H. I. (2017). Nonuniform ocean acidification and attenuation of the ocean carbon sink. Geophys. Res. Lett. 44, 8404–8413. doi: 10.1002/2017GL074389
Friedlingstein P., O'Sullivan M., Jones M. W., Andrew R. M., Hauck J., Olsen A., et al. (2019). Global carbon budget 2019. Earth Syst. Sci. Data 11, 1783–1838. doi: 10.5194/essd-11-1783-2019
Friedlingstein P., Jones M. W., O'Sullivan M., Andrew R. M., Bakker D. C. E., Hauck J., et al. (2022). Global carbon budget 2021. Earth Syst. Sci. Data 14 (4), 1917–2005. doi: 10.5194/essd-14-1917-2022
Friedlingstein P., O'Sullivan M., Jones M. W., Andrew R. M., Hauck J., Olsen A., et al. (2020). Global carbon budget 2020. Earth Syst. Sci. Data 12, 3269–3340. doi: 10.5194/essd-12-3269-2020
Fry C., Tyrell T., Hain M. P., Bates N. R., Acterberg E. P. (2015). A new method for analyzing processes affecting ocean alkalinity. Mar. Chem. 174, 46–57. doi: 10.1016/j.marchem.2015.05.003
Garcia H. E., Gordon L. I. (1992). Oxygen solubility in seawater: Better fitting equations. Limnol. Oceanogr. 37 (6), 1307–1312. doi: 10.4319/lo.1992.37.6.1307
Glibert P. M., Cai W.-J., Hall E. R., Li. M., Rose K. A., Testa J. M., et al. (2022). Stressing over the complexities of multiple stressors in marine and estuarine systems. Ocean-Land-Atmos. Res. 2022, 9787258. doi: 10.34133/2022/9787258
Gruber N., Bakker D. C. E., DeVries T., Gregor L., Hauck J., Landschützer P., et al. (2023). Trends and variability in the ocean carbon sink. Nat. Reviews Earth Environ. 4, 119–134. doi: 10.1038/s43017-022-00381-x
Gruber N., Boyd P. W., Frölicher T. L., Vogt M. (2021). Biogeochemical extremes and compound events in the ocean. Nature 600, 395–407. doi: 10.1038/s41586-021-03981-7
Gruber N., Clement N., Carter B. R., Feely R. A., Van Heuven S., Hoppema M., et al. (2019). The oceanic sink for anthropogenic CO2 from 1994 to 2007. Science 363, 1193–1199. doi: 10.1126/science.aau5153
Jackson L. C., Biastoch A., Buckley M. C., Desbruyères D., Frajka-Williams E., Moat B., et al. (2022). The evolution of the North Atlantic Meridional Overturning Circulation since 1980. Nat. Rev. Earth Environ. 3, 241–254. doi: 10.1038/s43017-022-00263-2
Josey S. A., Sinha B. (2022). Subpolar Atlantic Ocean mixed layer heat content variability driven by an active ocean. Nat. Commun. Earth Environ. 3, 111. doi: 10.1038/s43247-022-00433-6
Keeling C. D. (1993). “Surface ocean CO2,” in Global Carbon Cycle. Ed. Heimann M. (Springer-Vergag, Heidelberg: Kluwer Publishers), 22–29.
Keeling R., Garcia H. E. (2002). The change in oceanic O2 inventory associated with recent global warming. Proc. Natl. Acad. Sci. U.S.A. 99 (12), 7848–7853. doi: 10.1073/pnas.122154899
Keeling R. F., Körtzinger A., Gruber N. (2010). Ocean deoxygenation in a warming world. Annu. Rev. Mar. Sci. 2 (1), 199–229. doi: 10.1146/annurev.marine.010908.163855
Khatiwala S., Tanhua T., Mikaloff-Fletcher S., Gerber M., Doney S. C., Graven H. D., et al. (2013). Global ocean storage of anthropogenic carbon. Biogeosciences 10, 2169–2191. doi: 10.5194/bg-10-2169-2013
Knap A. H., Michaels A. F., Steinberg D. K., Bahr F., Bates N. R., Bell S., et al. (1997) BATS Methods Manual, Version 4. (Woods Hole, MA, US. U.S:JGOFS Planning Office). 136 pp.
Krumhardt K. M., Long M. C., Lindsay K., Levy M. N. (2020). Southern Ocean calcification controls the global distribution of alkalinity. Global Biogeochem. Cycles 34 (12), e2020GB006727. doi: 10.1029/2020GB006727
Krumhardt K. M., Long M. C., Sylvester Z. T., Petrick C. M. (2022). Climate drivers of Southern Ocean phytoplankton community composition and potential impacts on higher trophic levels. Front. Mar. Sci. 9, 916140. doi: 10.3389/fmars.2022.916140
Krumhardt K. M., Lovenduski N. S., Freeman N. M., Bates N. R. (2016). Increasing coccolithophore abundance in the subtropical North Atlantic from 1994 to 2014. Biogeosciences 13 (4), 1163–1177. doi: 10.5194/bg-13-1163-2016
Lange N., Fiedler B., Álvarez M., Benoit-Cattin A., Benway H., Buttigieg P. L., et al. (2023). Synthesis product for Ocean Time-series (SPOTS)–A ship-based biogeochemical pilot. Earth Sys. Sci. Data. preprint. doi: 10.5194/essd-2023-238
Lee K., Kim T.-W., Byrne R. H., Millero F. J., Feely R. A., Lui Y.-M. (2010). The universal ratio of boron to chlorinity for the North Pacific and North Atlantic oceans. Geochimica Cosmochimica Acta 74, 1801–1811. doi: 10.1016/j.gca.2009.12.027
Lenton T. M., Rockstróm J., Gaffney O., Rahmsdorf S., Richardson K., Steffen W., et al. (2019). Climate tipping points-too risky to bet against. Nature 575, 592–595. doi: 10.1038/d41586-019-03595-0
Leonelli F. E., Bellicicco M., Organelli E., Buongiorno Nardelli B., de Toma V., Cammarota C., et al. (2021). Ultra-oligotrophic expansion in the North Atlantic subtropical gyre relvealed by 21 years of satellite observations. Geophys. Res. Lett. 49 (21), e2021GL096965. doi: 10.1029/2021GL096965
Levin L. A., Le Bris N. (2015). The deep ocean under climate change. Science 350, 766–768. doi: 10.1126/science.aad0126
Lomas M. W., Bates N. R., Johnson R. J., Knap A. H., Steinberg D. K., Carlson C. A. (2013). Two decades and counting: 23–years of sustained open ocean biogeochemical measurements in the Sargasso Sea. Deep–Sea Res. II 93, 16–32. doi: 10.1016/j.dsr2.2013.01.008
Lomas M. W., Bates N. R., Johnson R. J., Steinberg D. K., Tanioka T. (2022). Adaptive carbon response to warming in the Sargasso Sea. Nat. Commun. 13 (1), 1211. doi: 10.1038/s41467-022-28842-3
Lønborg C., Cuevas L. A., Reinthaler T., Herndl G. J., Gasol J., Alvarez–Salgado X., et al. (2016). Temperature dependence of prokaryotic production. Front. Mar. Sci. 3 (131). doi: 10.3389/fmars.2016.00090
Lopez P. Z., Johnson R. J., Medley C. M., Davey E. L., Hayden M. G., Anderson Z. T., et al. (2023). Protocols for the Bermuda Atlantic Time-series Study (BATS) core measurements. ASU-Bermuda Institute of Ocean Sciences, 142 pp.
McGillicuddy D. J., Johnson R., Siegel D. A., Michaels A. F., Bates N. R., Knap A. H., et al. (1999). Mesoscale variations of biogeochemical properties in the Sargasso Sea. J. Geophys. Res. 104 (C6), 13,381–13,394. doi: 10.1029/1999JC900021
Mehrbach C., Culberson C. H., Hawley J. E., Pytkowicz R. M. (1973). Measurement of the apparent dissociation constants of carbonic acid in seawater at atmospheric pressure. Limnol. Oceanogr. 18, 897–907. doi: 10.4319/lo.1973.18.6.0897
Menzel D. W., Ryther J. H. (1960). The annual cycle of primary production in the Sargasso Sea off Bermuda. Deep Sea Res. 6, 351–367.
Michaels A. F., Knap A. H. (1996). Overview of the U.S. JGOFS Bermuda Atlantic time-series study and the hydrostation S program. Deep-Sea Res. II 43 (2-3), 157–198.
Montes E., Muller-Karger F., Cianca A., Lomas M. W., Lorenzoni L., Sabtes S. (2016). Decadal variability in the oxygen inventory of North Atlantic subtropical underwater captured by sustained, long-term oceanographic time series observations. Global Biogeochem. Cycles 30, 460–478. doi: 10.1002/2015GB005183
Muller-Karger F. E., Miloslavich P., Bax N. J., Simmons S., Costell M. J., Pinto I. S., et al. (2018). Advamcing marine biological observations and data requirements of the complementary essential ocean variables (EOVs) and essential biodiversity variables (EBVs) frameworks. Front. Mar. Sci. 5, doi: 10.3389/fmars.2018.00211
Olafsson J., Olafsdottir S. R., Benoit-Cattin A., Danielsen M., Arnarson T. S., Takahashi T. (2009). Rate of Iceland Seaacidification from time series measurements. Biogeosci. 6, 2,661–2,668. doi: 10.5194/bg-6-2661-2009
Orr J. C., Epitalon J.-M., Dickson A. G., Gattuso J.-P. (2018). Routine uncertainty for the marine carbon dioxide system. Mar. Chem. 207, 84–107. doi: 10.1016/j.marchem.2018.10.006
Phillips H. E., Joyce T. M. (2007). Bermuda’s tale of two time series: Hydrostation ‘S’ and BATS. J. Phys. Oceanogr 37, 554–571. doi: 10.1175/JPO2997.1
Rabalais N. N., Cai W.-J., Carstensen J., Conley D. J., Fry B., Hu X., et al. (2014). Eutrophication-driven deoxygenation in the coastal ocean. Oceanography 27 (1), 172–183. doi: 10.5670/oceanog.2014.21
Revelle R., Suess H. (1957). Carbon dioxide exchange between atmosphere and ocean and questions of an increase of atmospheric CO2 during the past decades. Tellus 9, 18–27. doi: 10.3402/tellusa.v9i1.9075
Robbins L. L., Hansen M. E., Kleypas J. A., Meylan S. C. (2010)CO2calc: a user-friendly seawater carbon calculator for Windows, Max OS X, and iOS (iPhone). In: U.S. Geological Survey Open-File Report 2010–1280 (Accessed 11th August 2023).
Roberts J. M., Devey C. W., Biastoch A., Carreiro-Silva M., Dohna T., Dorshel B., et al. (2023). Blueprint for integrating scientific approaches and international communities to assess basin-wide ocean ecosystem status. Nat. Communications Earth Environ. 4, 12. doi: 10.1038/s43247-022-00645-w
Rousseau V., Fraudeau R., Hammond M., Houdegnonto O. J., Ablain M., Blazquez A., et al. (2023). Monitoring the regional ocean heat content change over the Atlantic Ocean with the space geodetic approach. Earth Sys. Sci. Data. [preprint]. doi: 10.5194/essd-2023-236
Ruhl H. A., André M., Beranzoli L., Çaǧatay N., Cannat M., Favali P., et al. (2011). Societal need for improved underestanding of climate change, anthropogenic impacts, and geo-hazard warning drive development of ocean observatories in European Seas. Progress in Oceanography 91 (1), 1–33. doi: 10.1126/science.1097403
Sabine C. L., Feely R. A., Gruber N., Key R. M., Lee K., Bullister J. L., et al. (2004). The oceanic sink for anthropogenic CO2. Science 305, 367–371. doi: 10.1126/science.1097403
Schroeder E., Stommel H. (1969). How representative is the series of Panulirus stations of monthly mean conditions off Bermuda? Prog Oceanogr. 5, 31–40.
Siemer J. P., Machín F., González-Vega A., Arrieta J. J., Gutiérrez-Guerra M. A., Pérez-Hernández M. D., et al. (2021). Recent trends in SST, Chl-a, productivity and wind stress in upwelling and open ocean areas in the upper eastern North Atlantic subtropical gyre. J. Geophys. Research-Oceans 126 (8), e2021JC017268. doi: 10.1029/2021JC017268
Steinberg D. K., Carlson C. A., Bates N. R., Johnson R. J., Michaels A. F., Knap A. H. (2001). Overview of the US JGOFS Bermuda Atlantic Time–series Study (BATS): a decade–scale look at ocean biology and biogeochemistry. Deep–Sea Res. II 48 (8–9), 1405–1447. doi: 10.1016/S0967–0645(00)00148–X
Stendardo I., Gruber N. (2012). Oxygen trends over five decades in the North Atlantic. J. Geophys. Res. 117, C11004. doi: 10.1029/2012JC007909
Stevens S. W., Johnson R. J., Maze G., Bates N. R. (2020). AA recent decline in North Atlantic subtropical mode water formation. Nat. Climate Change. 10 (4), 335–341. doi: 10.1038/s41558-020-0722-3
Stramma L., Schmidtko S. (2019). “Global evidence of deoxygenation,” in Ocean Deoxygenation: Everyone’s problem. Eds. Laffoley D., Baxter J. M. (IUCN Press), 25–36.
Stramma L., Schmidtko S., Levin L. A., Johnson G. C. (2010). Ocean oxygen minima expansions and their biological impacts. Deep Sea Res. 57, 587–595. doi: 10.1016/j.dsr.2010.01.005
Strickland J. D. H., Parsons T. R. (1968). A Practical Handbook of Seawater Analysis (Canada, Ottawa: Fish res. Board).
Sutton A. J., Battisti R., Carter B., Evans W., Newton J., Alin S., et al. (2022). Advancing best practices for assessing trends of ocean acidification time-series. Front. Mar. Sci. 9. doi: 10.3389/fmars.2022.1045667
Tagklis F., Ito T., Bracco A. (2020). Modulation of the North Atlantic deoxygenation by the slowdown of the nutrient stream. Biogeosciences 17, 231–244. doi: 10.5194/bg-17-231-2020
Tilbrook B., Jewett E., DeGrandpre M., Hernandez-Avon J. M., Feely R. A., Gledhill D. K, et al. (2019). An enhanced ocean acidification network: From people to technology to data synthesis and information exchange. Front. Mar. Sci. 6, doi: 10.3389/fmars.2019.00337
Touratier F., Azouzi L., Goyet C. (2007). CFC-11, Δ4C and 3H tracers as a means to assess anthropogenic CO2 concentrations in the ocean. Tellus 59B, 318–325. doi: 10.1111/j.1600-0889.2006.00247.x
Touratier F., Goyet C. (2004a). Applying the new TrOCA approach to assess the distribution of anthropogenic CO2 in the Atlantic Ocean. J. Mar. Syst. 46, 181–197. doi: 10.1016/j.jmarsys.2003.11.020
Touratier F., Goyet C. (2004b). Definition, properties, and Atlantic distribution of the new tracer TrOCA. J. Mar. Syst. 46, 169–179. doi: 10.1016/j.jmarsys.2003.11.016
Villarino E., Irigoien X., Villate F., Iriate A., Uriate I., Zervoudaki S., et al. (2020). Response of copepod communities to ocean warming in three time-series across the North Atlantic and Mediterranean Sea. Mar. Ecol. Prog. Ser. 636, 47–61. doi: 10.3354/meps13209
Woosley R. J., Millero F. J., Wanninkhof R. (2016). Rapid anthropogenic changes in CO2 and pH in the Atlantic Ocean: 2003-2014. Global Biogeochem. Cycles 30 (1), 70–90. doi: 10.1002/2015GB005248
Yool A., Oschlies A., Nurser A. J. G., Gruber N. (2010). A model-based assessment of the TrOCA approach for estimating anthropogenic carbon in the ocean. Biogeosciences 7, 723–751. doi: 10.5194/bg-7-723-2010
Keywords: seawater alkalinity, ocean carbon cycle, ocean carbon dioxide, ocean temperature, ocean salinity, North Atlantic Ocean
Citation: Bates NR and Johnson RJ (2023) Forty years of ocean acidification observations (1983–2023) in the Sargasso Sea at the Bermuda Atlantic Time-series Study site. Front. Mar. Sci. 10:1289931. doi: 10.3389/fmars.2023.1289931
Received: 06 September 2023; Accepted: 25 October 2023;
Published: 08 December 2023.
Edited by:
Abed El Rahman Hassoun, Helmholtz Association of German Research Centres (HZ), GermanyReviewed by:
Cathy Wimart-Rousseau, Helmholtz Association of German Research Centres (HZ), GermanyLeticia Cotrim Da Cunha, Rio de Janeiro State University, Brazil
George Petihakis, Hellenic Centre for Marine Research (HCMR), Greece
Copyright © 2023 Bates and Johnson. This is an open-access article distributed under the terms of the Creative Commons Attribution License (CC BY). The use, distribution or reproduction in other forums is permitted, provided the original author(s) and the copyright owner(s) are credited and that the original publication in this journal is cited, in accordance with accepted academic practice. No use, distribution or reproduction is permitted which does not comply with these terms.
*Correspondence: Nicholas R. Bates, bmljay5iYXRlc0BiaW9zLmVkdQ==; bmJhdGVzOEBhc3UuZWR1
†ORCID: Nicholas R. Bates, orcid.org/0000-0002-0097-0336