 Yan Xu
 Fei Huang1
 Jie Zhu
- 1College of Marine Science and Technology, China University of Geosciences, Wuhan, China
- 2Institute of Environment and Sustainable Development in Agriculture, Chinese Academy of Agricultural Sciences, Beijing, China
- 3Research Center for Eco-environmental Engineering, Dongguan University of Technology, Dongguan, China
- 4Guangdong Provincial Key Laboratory of Water Quality Improvement and Ecological Restoration for Watersheds, Institute of Environmental and Ecological Engineering, Guangdong University of Technology, Guangzhou, China
Spotted seals, a protected species, face multifaceted threats to their habitat, which in turn impact the closely associated trophic networks. These threats will lead to irreversible structural variations within the ecosystem. Therefore, investigating the topological variability of trophic networks in spotted seals is important. Applying environmental DNA methods, field sample collection was conducted in 2021 during both the sea fishing moratorium period and the fishing period to decode fish diversity. Assessing the current status of fish resources by using the multivariate statistics approach. Applying dietary information establishes the spotted seals’ trophic network. Selecting 12 network indexes to analyze the spatiotemporal patterns of network topological attributes. As a result, about 51 families, and 76 genera species were identified. During the sea fishing moratorium and the fishing period, there are 12 and 18 different food resources available for spotted seals, respectively. The diversity index revealed that the FP had greater species richness and diversity than the SP. Comparatively, the Fishing period exhibited higher species richness and biodiversity, likely influenced by habitat heterogeneity and anthropogenic activities. Additionally, the topological features of networks reflected the high clustering coefficients (CC=0.35) and the proportion of omnivorous species (O≈60%), indicating that the network structure in this region tends to form higher trophic-level clustering patterns, which facilitate the formation of weaker interactions between clusters, enhancing the robustness of the network. The higher connectivity complexity index during the fishing period (SC=12.3) supported that the spotted seal’s trophic network was relatively more stable in this period. Thus, during the fishing period, it is crucial to pay more attention to the intensity of human fishing on mid-to-high trophic-level omnivorous fish resources to ensure the sustainability of these potential food resources for spotted seals. This comprehensive study achieved three key objectives: (a) utilizing eDNA to characterize fish diversity during distinct periods, (b) establishing trophic networks of spotted seals, and (c) discerning topological attributes and spatiotemporal patterns within the ecological network. Overall, this study can provide technical and data support for integrated ecological network management and propose suggestions for protecting and recovering spotted seals.
1 Introduction
The spotted seal (Latin name: Phoca largha), a marine pinniped mammal belonging to the Phocidae family, primarily preying on fish, inhabits mid to high-latitude nearshore regions of the North Pacific (Lowry et al., 2000). Since the 16th century, extensive human hunting activities have pushed it to the brink of extinction. Despite conservation efforts, such as the implementation of CITES (Convention on International Trade in Endangered Species of Wild Fauna and Flora) in 1975 (Huxley, 2013), which effectively curbed hunting and contributed to population recovery, and being elevated to first-class national protected species in China, the species still confronts multiple external disruptions (Hendrix et al., 2021). These external disturbances pose severe threats to its habitat and survival (Zhu et al., 2000). Research indicates that nearly 50% of marine species in high-latitude regions are on the brink of extinction (Karlson et al., 2020). First and foremost, the issue of ocean acidification resulting from climate change has led to a reduction in water pH, directly impacting foundational organisms in the marine food chain (i.e., phytoplankton and zooplankton), and subsequently affecting other spotted seal prey resources through trophic cascades (Fassbender et al., 2017; Guzzo et al., 2017). Furthermore, the ongoing expansion of fishing activities not only results in accidental bycatch of spotted seals and habitat disruption but also impacts their foraging resources, diminishing the food resources availability, consequently causing irreversible alterations in the structure and functioning of the nutritional network (Farriols et al., 2016; Pires et al., 2016; D’Alessandro and Mariani, 2021). There is a high probability of inducing resource homogenization within the food web, significantly increasing the system’s vulnerability and diminishing its stability (Xu et al., 2023). Therefore, the conservation and attention to the spotted seal are urgently needed.
Being regarded as top predators, spotted seals play a pivotal and intricate ecological role within food webs (Albouy et al., 2017). Ecosystems facilitate the flow of energy, information transmission, and material cycling through food webs (Trussell et al., 2006). Top predators, in turn, regulate the population of lower-level prey, influencing the flow of material energy within the food web (Danger et al., 2022). This contributes to maintaining material energy balance within ecosystems. Through these trophic cascades, top-down effects prevent overpopulation of prey and excessive harm to primary producers. From an evolutionary perspective, top-level predators promote species’ adaptive evolution within prey populations, as exemplified by the interaction between the Atlantic flounder and cod (Orio et al., 2020). In recent years, the role of top predators in food webs has garnered increasing attention from researchers (Avila et al., 2018). Some studies have suggested the use of the dynamics of top-level predators as one of the indicators for assessing the health of marine ecosystems (Bossart, 2011; Parsons et al., 2015). However, relying solely on population dynamics can be challenging in revealing the state of nutritional networks and interspecies interactions. Hence, network-based systematic analysis methods have emerged as a valuable tool (Brose and Dunne, 2009). Previous research has shown significant quantifiable functional relationships between the topological metrics of different nutritional networks and species richness (Riede et al., 2010; Marina et al., 2018). This relationship aids in identifying both local and overall system states. By quantifying the topological attributes of networks, it has been observed that nutritionally complex networks, such as the food web of Beagle Channel, exhibit less local stability (Rodriguez et al., 2022). It is contributes to verify the diversity-stability debate in ecosystems (McCann, 2000; Bascompte, 2009). Therefore, studying the spatiotemporal patterns of diversity and topological attributes within the trophic network of spotted seals can serve as a reflection of the ecosystem state characteristics. It also provides valuable data support and theoretical guidance for the development of system-based marine biodiversity conservation and management strategies.
The objective of this study is to identify the spatiotemporal patterns of diversity and topological attributes within the trophic network of spotted seals (Phoca largha) and quantify the network state. We selected 6 typical spotted seal habitats considered as our study area, located in Liaodong Bay, China. Applying environmental DNA (eDNA) methods, field sample collection was conducted in 2021 during both the sea fishing moratorium period (SP) and the fishing period (FP), with the collection of three samples from different locations surrounding each habitat. In total, 36 samples and part of the biological samples were collected. Fish diversity was decoded through PCR amplification and high-throughput sequencing techniques. Calculating biodiversity in the study area and assessing the current status of fish resources by using the PCA approach. Additionally, dietary information for species was obtained through database research and stomach content analysis, enabling the construction of the spotted seal’s nutritional network. 12 network topological metrics were selected to analyze the spatiotemporal patterns of network topological attributes. This study enhanced the traditional method in terms of (a) characterizing fish diversity during different periods using eDNA, (b) establishing the high-resolution nutritional network of spotted seals, and (c) discerning the topological attributes and spatiotemporal patterns within the ecological network. The above improvements have overcome the shortcomings of time-consuming, cumbersome and costly sampling faced by traditional sampling.At the same time, Edna has less wear and tear on the collected samples, making it suitable for long-term monitoring.Overall, this research can provide technical and data support for integrated ecological network management and propose recommendations for the conservation and recovery of spotted seals.
2 Materials and methods
2.1 Sampling sites and collections
The Liaodong Bay spotted seal (hereinafter referred to as the “spotted seal”), also known as the Western Pacific spotted seal, is a species that migrates to the Bohai Sea and Liaodong Bay region of China (Han, 2009). It is the only marine pinniped species that breeds in China. Each year (Zhuang et al., 2023). During the winter and spring seasons, the spotted seals migrate to the Liaodong Bay region for overwintering and breeding (Barman et al., 2020). The region has several habitats that support spotted seal populations, with larger populations found in areas like Panjin and Lvshun (Zhuang et al., 2023).
In this study, we employed environmental eDNA technology to monitor fish resource diversity (Kda et al., 2015; Yates et al., 2021). Compared to traditional taxonomic identification-based monitoring methods, the eDNA approach offers advantages such as high sensitivity and detection rates (Yang et al., 2021). Additionally, for endangered species like the spotted seal, the eDNA method reduces the risk associated with lethal biological sampling (Rourke et al., 2022).
According to the migration route and main habitats of spotted seals, six sampling areas (P1: Lvshun nearshore, P2: Fuzhou River estuary, P3: Daliao River estuary, P4: Liao River estuary, P5: Xiaoling River estuary, P6: Penglai nearshore) were designated for this study, as shown in Figure 1. A total of 36 samples were collected from May to June (the sea fishing moratorium period, SP) and September to October (the fishing period, FP) in 2021, with the collection of three samples from different locations surrounding each habitat. Surface environmental water samples (5L per sample) were collected at each sampling area using a water collector. Prior to each sample collection, the water collector was washed with surface water three times. The collected water was then poured into a clean wide-mouth bottle and immediately stored in a vehicle refrigerator at a low temperature (Qu et al., 2020).
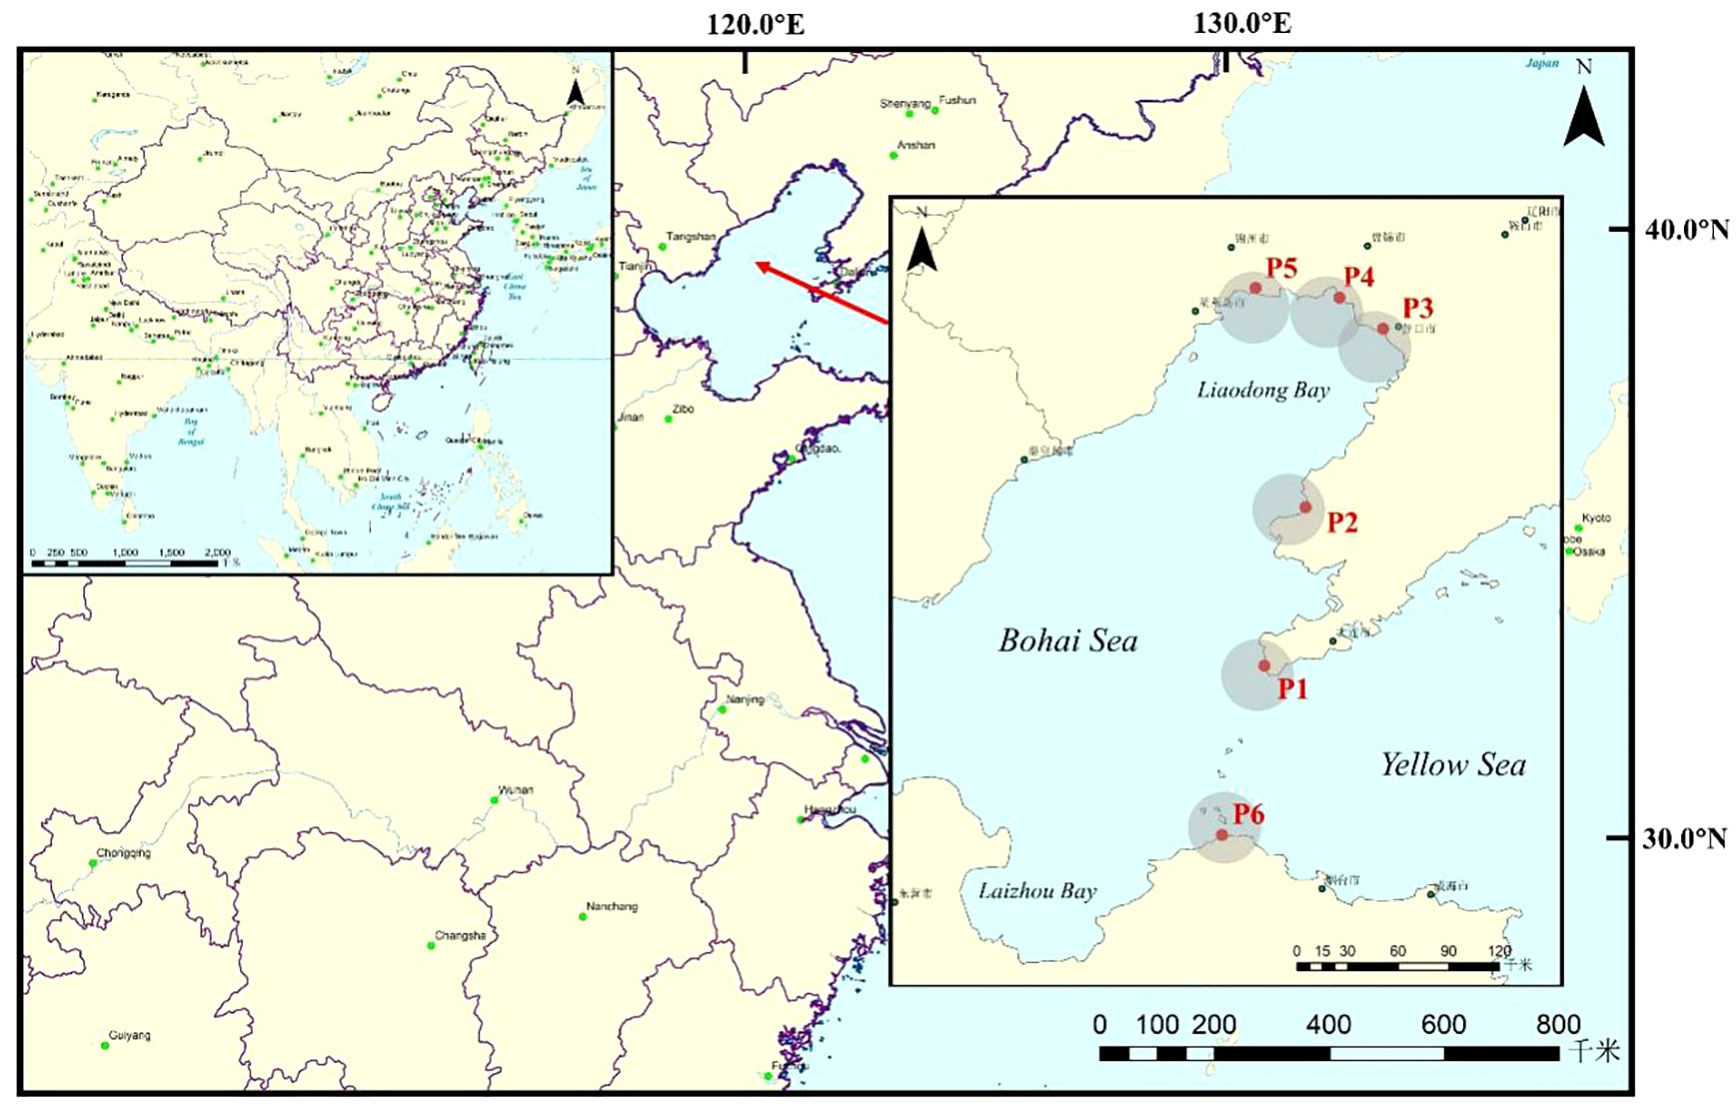
Figure 1 The location of the study area and distribution of sampling regions, Bohai Bay, China. (P1: Lvshun, P2: Fuzhou River, P3: Daliao River, P4: Liao River, P5: Xiaoling River, P6: Penglai).
To prevent contamination by exogenous eDNA, the following measures were taken: (1) All water bottles and filtration devices were cleaned with a 10% bleach solution between each sampling (DiBattista et al., 2017); (2) Researchers changed disposable gloves between different samples during the collection process; (3) A negative control was included in all sampling areas, using 3L of deionized water as the sample. Within 24 hours after sampling, eDNA was enriched on a filter membrane with a pore size of 0.45μm using a vacuum pressure pump (Liu et al., 2021). After filtration, the filter membrane of each sample was carefully folded inward with tweezers, placed in a 50ml centrifuge tube, labeled, and stored in separate plastic bags at -20°C until eDNA extraction. The geographic coordinates of each sampling area were recorded using a handheld GPS device, and water quality parameters such as total dissolved solids (TDS), oxidation-reduction potential (ORP), salinity (S), pH, temperature (T), and dissolved oxygen concentration (O) were measured using a HQ30d portable water quality tester for subsequent analysis and research.
2.2 DNA extraction and PCR amplification
Total DNA in the sample was extracted using the FastDNA® Spin Kit for Soil (MP Biomedicals) extraction kit. DNA extracts were validated on 1% agarose gel and DNA concentration and purity were determined using a NanoDrop 2000 UV-vis spectrophotometer. ABI GeneAmp® 9700 PCR thermocycler using primers MiFish - U - F(5’- GTCGGTAAAACTCGTGCCAGC - 3’) and MiFish - U- R (5’- CATAGTGGGGTATCTAATCCCAGTTTG - 3) PCR amplification was carried out on the variable region. The reaction system is 5×FastPfu Buffer 4μL, 2.5mM dNTPs 2μL, forward primer (5µM) 0.8μL, reverse primer (5µM) 0.8μL, TransStart FastPfu DNA polymerase 0.4μL, BSA 0.4μL, 10ng template DNA supplemented with ddH2O to 20μL. The reaction parameters were as follows: initial denaturation at 95 °C for 5 min, denaturation at 94 °C for the 30s, annealing at 51 °C for 30s, extension at 72 °C for 32 times, then stable extension at 72 °C for 18 min, and finally preservation at 10 °C. There were 3 replicates per sample, and the products of the 3 replicates were mixed. PCR products were extracted from 2% agarose gel and purified using the AxyPrep DNA Gel Extraction Kit. The recovered products were quantified by Quantus™ Fluorometer.
2.3 High throughput sequencing and species annotation
We further sent the samples to Majorbio Bio-Pharm Technology Co. Ltd. (Shanghai, China) for high-throughput sequencing. We used an Illumina MiSeq PE300 platform/NovaSeq PE250 platform and pool purified amplicons in an equimolar fashion and sequenced them paired-end. We used FASTP version 0.20.0 (Chen et al., 2018) (https://github.com/OpenGene/fastp) to control the original sequencing sequences quality; used FLASH version 1.2.7 (Magoc and Salzberg, 2011) (http://www.cbcb.umd.edu/software/flash) for assembling; used UPARSE version 7.1 (Edgar, 2013) (http://drive5.com/uparse) to perform OTU clustering of sequences according to 97% similarity and eliminate chimeras. There were 3 parallel samples in each sampling area. In the statistical process, the three sequence results of a sampling area are added together, and the total sequence value obtained is taken as the final sequence result of the sampling area. The subsequent analysis is based on this value. Species classification annotation was performed for each sequence using RDP Classifier version 2.2 (Wang et al., 2007) (http://rdp.cme.msu.edu). Subsequently, referring to the Fishbase database (https://www.fishbase.se) and the related literature (Liu, 2019) to record and refer to relevant historical documents, further annotate the fish data, screen and improve the taxonomic information of fish, and finally sort out and obtain the list of fish resources in the habitat of spotted seals in Liaodong Bay.
2.4 Statistical analyses
Since there are some sequences in the collected samples that do not match the sequences in the library, we need to eliminate them and calculate the percentage of valid sequences out of the total sequences. Here, we calculated the percentage of each fish’s effective sequences in each sample, and the histogram of fish composition at each sampling region was drawn. We calculated Alpha diversity such as Richness, Chao1 index, ACE index, Shannon index, Pielou index, Invisimpson index, and Coverage index to assess and evaluate the degree of fish diversity at various sampling sites. See Appendix A1 for the exact calculation formula. These indexes reflected community richness, diversity, and community coverage, respectively. Additionally, based on the corresponding abundance data of OTU in each sample, this study estimated the Bray-Curtis distance to explore community composition difference and similarities between various groups of collections, calculated and mapped the principal coordinates PCOA (Principal Co-ordinates Analysis). Besides, this study calculated t-test to recognize the similarity between communities in different regions. RDA (Redundancy analysis) was used to explore the primary environmental elements influencing where fish communities are found. All analyses were performed and visualized on the Excel, Origin, and Tutools platform (https://www.cloudtutu.com). In addition, the dominance index (Y) of the fish community in two periods was calculated by the dominance formula (Yang et al., 2022), the equation as follow:
where is the number of sample points where the fish appears; is the total number of sample points; is the sequence abundance of the fish ; is the total sequence abundance.
2.5 Biological network
2.5.1 Establishing trophic network
We established trophic networks by analyzing eDNA metabarcoding data obtained from our sampling. To achieve a high-resolution feeding web for spotted seals, we refrained from species aggregation. To identify consumer-resource interactions, we conducted a comprehensive literature review using various web databases including Web of Science (https://www.webofscience.com) and Google Scholar (https://scholar.google.com). We identified 52 scientific papers that provided trophic interaction information at the species level. During the sampling process, we collected a subset of biological samples and conducted stomach content analysis using traditional microscopic examination methods. To address concerns about the limitations of our sampling data, we supplemented our findings with stomach content data referenced from relevant literature. Furthermore, additional feeding data were sourced from the World Fish Database website (www.fishbase.de). After sorting out data, we revealed that the diet of spotted seals in the region consisted of 19 fish species belonging to 4 orders, 7 families, and 15 genera (Supplementary Table S1).
Next, we categorized all the data, with species data serving as nodes and trophic relationships as links. We constructed a trophic network determined by an interaction adjacency matrix consisting of S rows and S columns, where S represents the total number of species and taxa involved in the study, and the order of species among rows corresponds to that among columns. The value at the intersection of the ith row and jth column in the food web matrix is either 0 or 1, denoted as aij, indicating whether species j preys on species i, where aij=0 signifies the absence of a feeding relationship between i and j. From this matrix, a directed graph with L trophic links connecting S nodes can be derived, and visualized graphs by Cytoscape (version 3.9.1) (Shannon et al., 2003).
To analyze highly connected clusters of interaction networks in the constructed food web, we utilized the program ‘Molecular Complex Detection’ (MCODE) (Liu et al., 2017). MCODE is a graph-theory-based clustering algorithm that employs the vertex-weighting method to filter out regions of high density by using the density of a map as a weighting factor. This algorithm is commonly used to identify large molecular complexes within protein structures (Nomura et al., 2021). In the graph G=(V, E), |V| represents the number of nodes in the graph, and |E| represents the weight of the interacting connected edges. The network consists of |V| nodes, and the maximum weight of |E| is defined as:
The density of the graph is defined as follows:
MCODE efficiently identifies sections of interaction networks that are highly linked based solely on connectivity data (Bader and Hogue, 2003) to find highly interconnected areas, which reflect the density of nodes and surrounding nodes with the score value of nodes. Besides, we selected the high-score value sub-network and considered it as the stable core sub-network in a food web.
2.5.2 Topological network analysis
To describe the complexity and structural characteristics of a food web (Rodriguez et al., 2022; Cordone et al., 2020), we chose the following 12 topological indexes:
(1) Species (S): total number of species and groups;
(2) Links (L): total number of interactions or nutritional linkages;
(3) Linkage density (D): the number of interactions for each species;
(4) Connectance (C): connectivity or trophic links divided by the total number of possible interactions;
(5) Percentage of top species (T): percentage of species with prey but without predators;
Where is the number of top species;
(6) Percentage of intermediate species (I): percentage of species with prey and predators;
Where is the number of intermediate species;
(7) Percentage of basal species (B): percentage of species with predators but without prey;
Where is the number of basal species;
(8) Percentage of omnivorous species (O): percentage of species that eat prey from more than one trophic level;
Where is the number of omnivorous species;
(9) Mean trophic level (MTL): weighted average of trophic levels for all species;
Where and represent the trophic levels of species and ; for column and row , is the connection matrix of row S and column S. If species prey on species , = 1; If species do not prey on species , = 0; is the number of species capture food species;
(10) Connection complexity index (SC): describing food web stability;
(11) Characteristic path length (ChPath): the average shortest path length between all species pairs;
(12) Clustering coefficient (CC): the average number of species pairs connected to the same species and to each other to describe the clustering coefficient of species nodes in the food web.
Where represents all the edges connecting node to other nodes, if all are neighbors, the maximum is , represents the actual number of neighbors.
3 Results
3.1 Species diversity
3.1.1 Fish species composition monitored by eDNA
In this study, 85 fish species from 16 orders, 51 families, and 76 genera were identified by eDNA metabarcoding (Supplementary Table S2). The total number of species detected in different sampling regions in the two periods is shown in Figure 2. It was found that more fish species were monitored in the FP than in the SP.
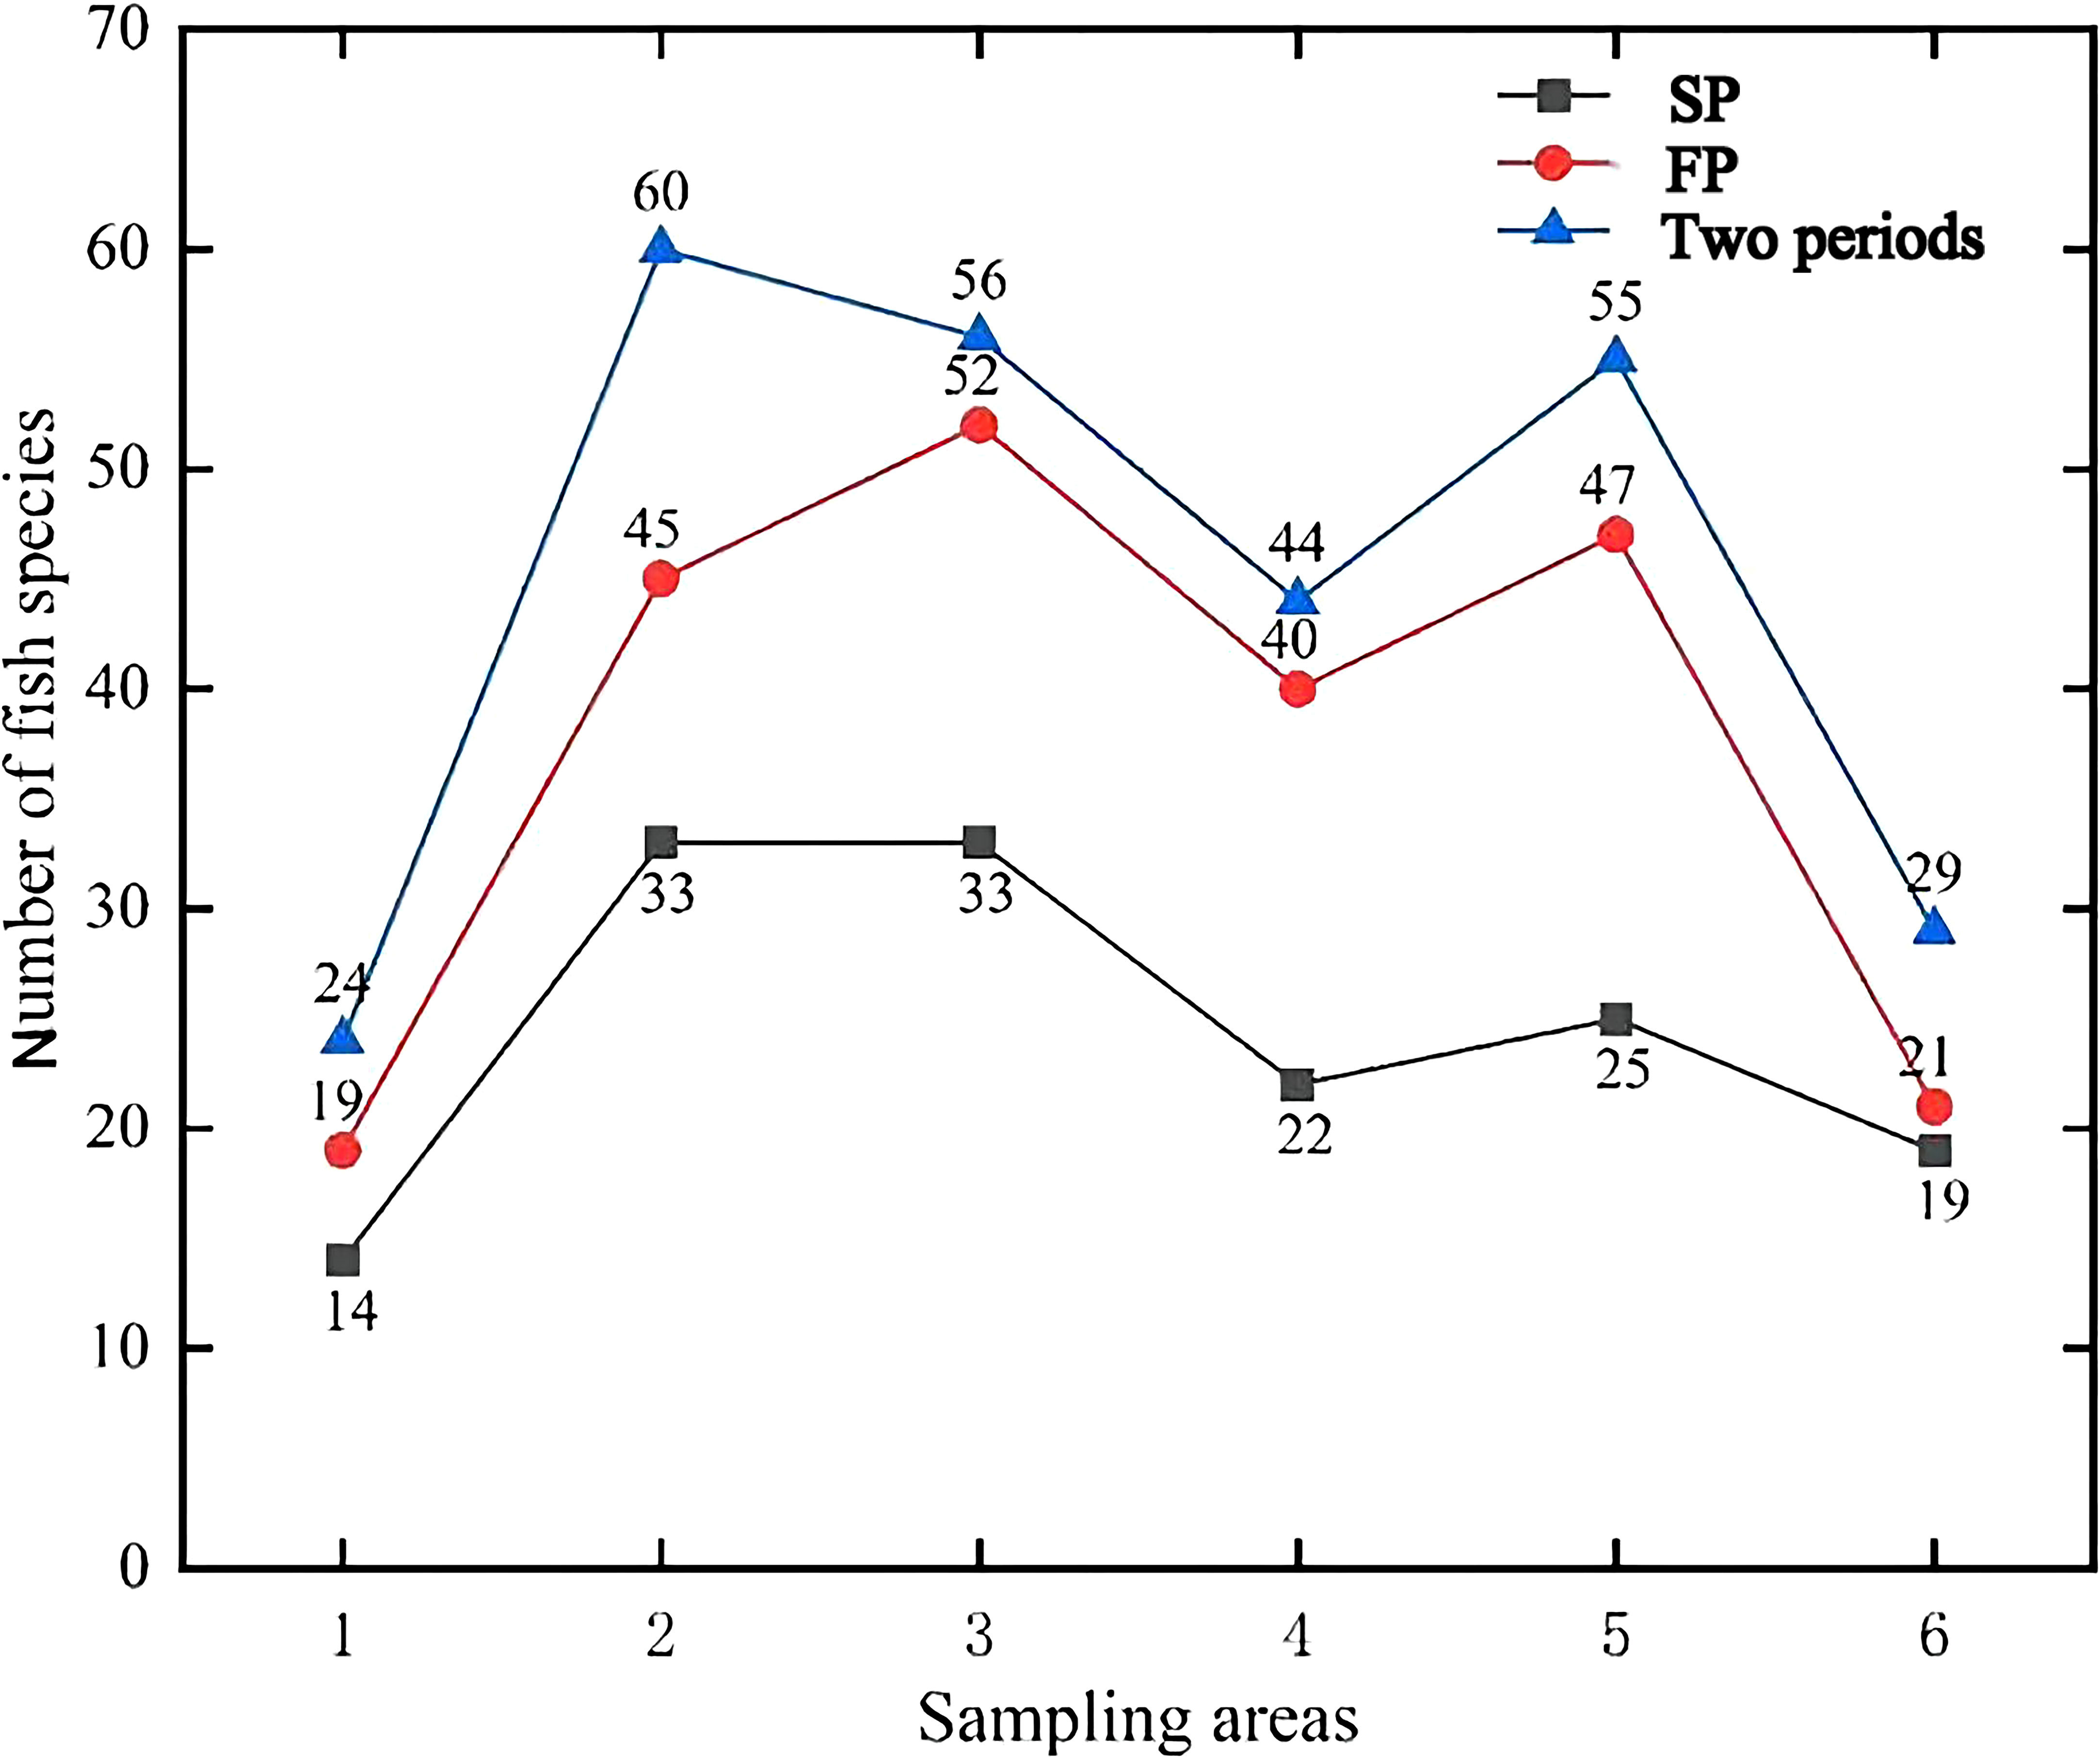
Figure 2 The species line chart for the number of fish species detected by eDNA metabarcoding in different sampling areas in the two periods. (1: Lvshun nearshore, 2: Fuzhou River estuary, 3: Daliao River estuary, 4: Liao River estuary, 5: Xiaoling River estuary, 6: Penglai nearshore).
From Figure 3A, 54 fish species were present throughout the SP, and they belonged to 51 genera, 36 families, and 11 orders. Perciformes (25 species) comprised around 46.3% of all fish species on the level of order, followed by Scorpaeniformes (7 species), which accounted for roughly 13% of the species richness. While other families were discovered with fewer species, Engraulidae and Carangidae had 4 species (7.4%) found on the family level. According to Table 1, the top 15 species represented 95.11% of all sequences and had the highest relative abundance. Trichiurus lepturus, which made up 45.43% of the series in the SP, was the most frequently observed species, followed by Protosalanx chinensis (15.49%) and Remorina albescens (8.67%).

Figure 3 The number and proportion at the taxonomic level of order and family in two periods: (A) SP; (B) FP.
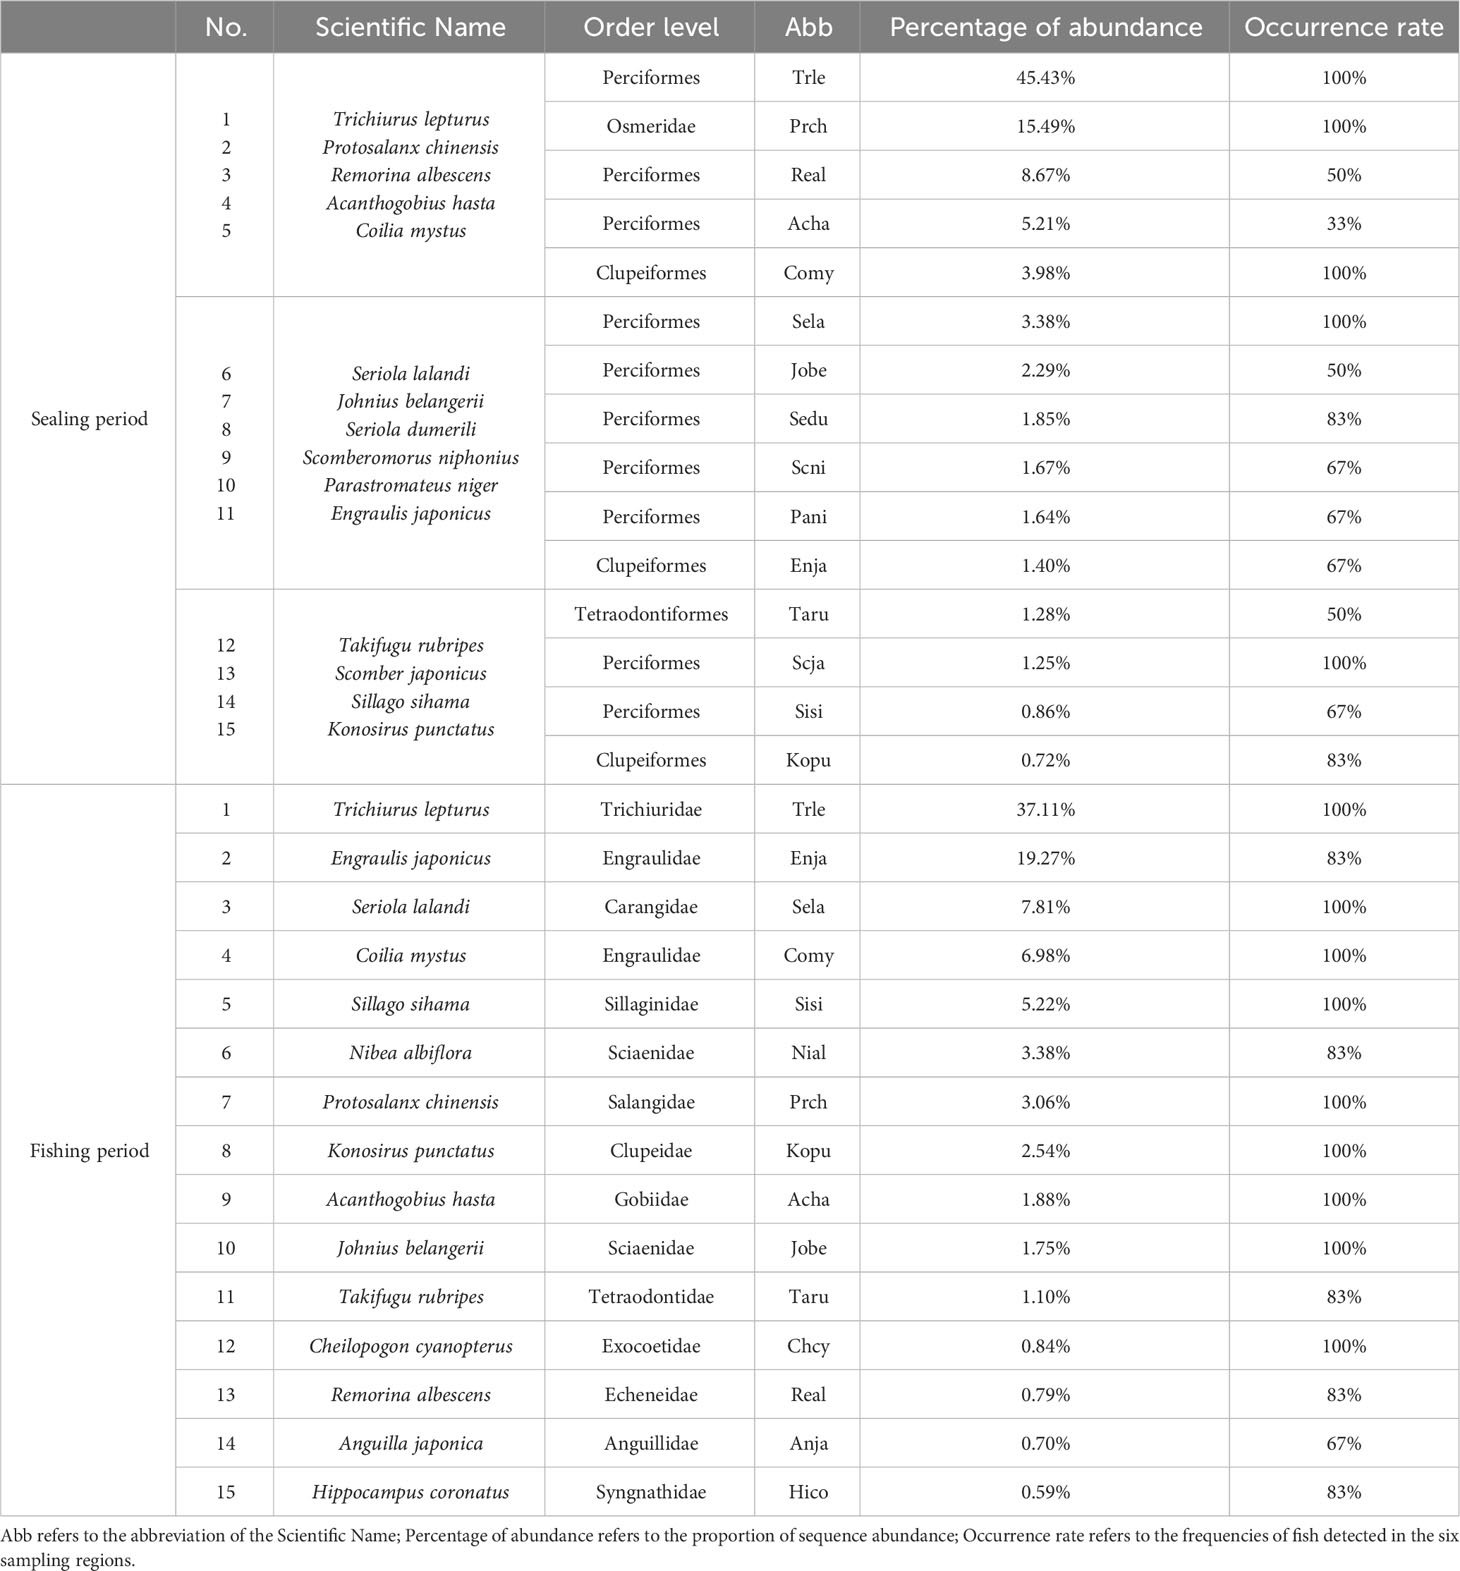
Table 1 The top 15 fish in the percentage of abundance in the Sealing period and the Fishing period, respectively.
From Figure 3B, the biodiversity was higher during the FP when 74 species, 68 genera, 49 families, and 17 orders were detected. On order level, 33 species from Perciformes were identified, occupying 44.6% of the total species richness, followed by 8 species (10.8%) from Clupeiformes. On the family level, Gobiidae and Engraulidae each had 6 species (8.1%), while the remaining families had fewer species (1-3). Table 1 showed that the top 15 species’ relative abundance accounted for 93.03% of total sequences. Trichiurus lepturus (37.11%) still had the highest relative abundance in the environment, 19.27% and 7.81% of sequences were identified as Engraulis japonicus and Seriola lalandi.
According to Equation 1, the index of dominant species Y was used to identify the predominant fish species communities during the two time periods, the results (Y>0.2) are shown in Table 2. During the SP, we regarded 5 species as dominant species, the top 3 species were Trichiurus lepturus, Protosalanx chinensis, and Remorina albescens, respectively. There were 8 dominant species found in the FP, and Trichiurus lepturus, Engraulis japonicus, and Seriola lalandi outcompeted other species. Moreover, we found that 3 species were dominant in both periods: Protosalanx chinensis, Coilia mystus, and Seriola lalandi.
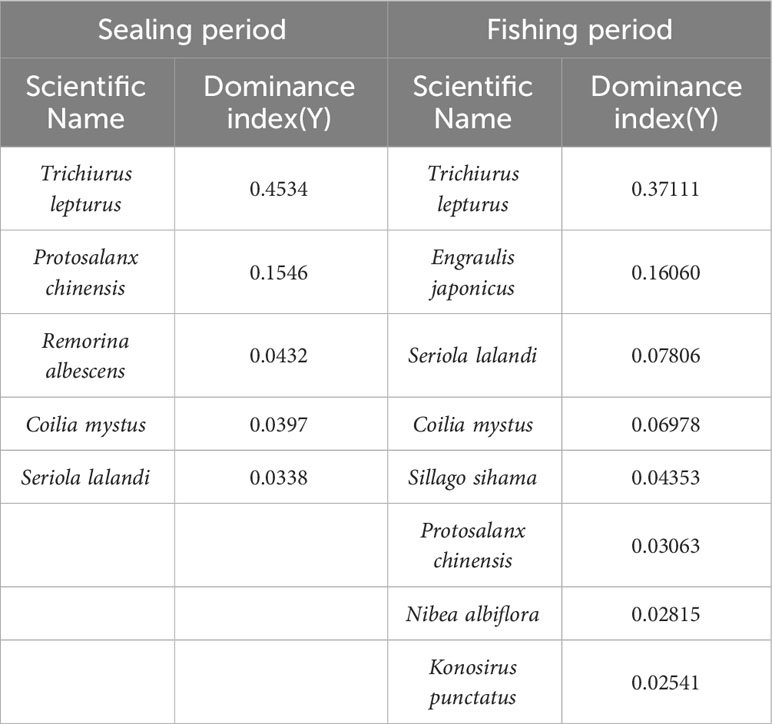
Table 2 Dominance index of dominant species in two periods.
3.1.2 Spatial and temporal patterns of fish biodiversity
A total of 43 (50.59%) species were found through both two periods, while 11 (12.94%) and 31 (36.47%) species were detected in the SP and the FP, respectively (Figure 4A). Besides, we found 5 fish species in all samples: Coilia mystus, Protosalanx chinensis, Seriola lalandi, Trichiurus lepturus, and Scomber japonicu (Figure 4B). The sequence of the fish species abundance in the top five were Trichiurus lepturus, Engraulis japonicus, Protosalanx chinensis, Seriola lalandi, Coilia mystus. In particular, the amounts of their sequences showed spatial and temporal differences (Figure 4C).
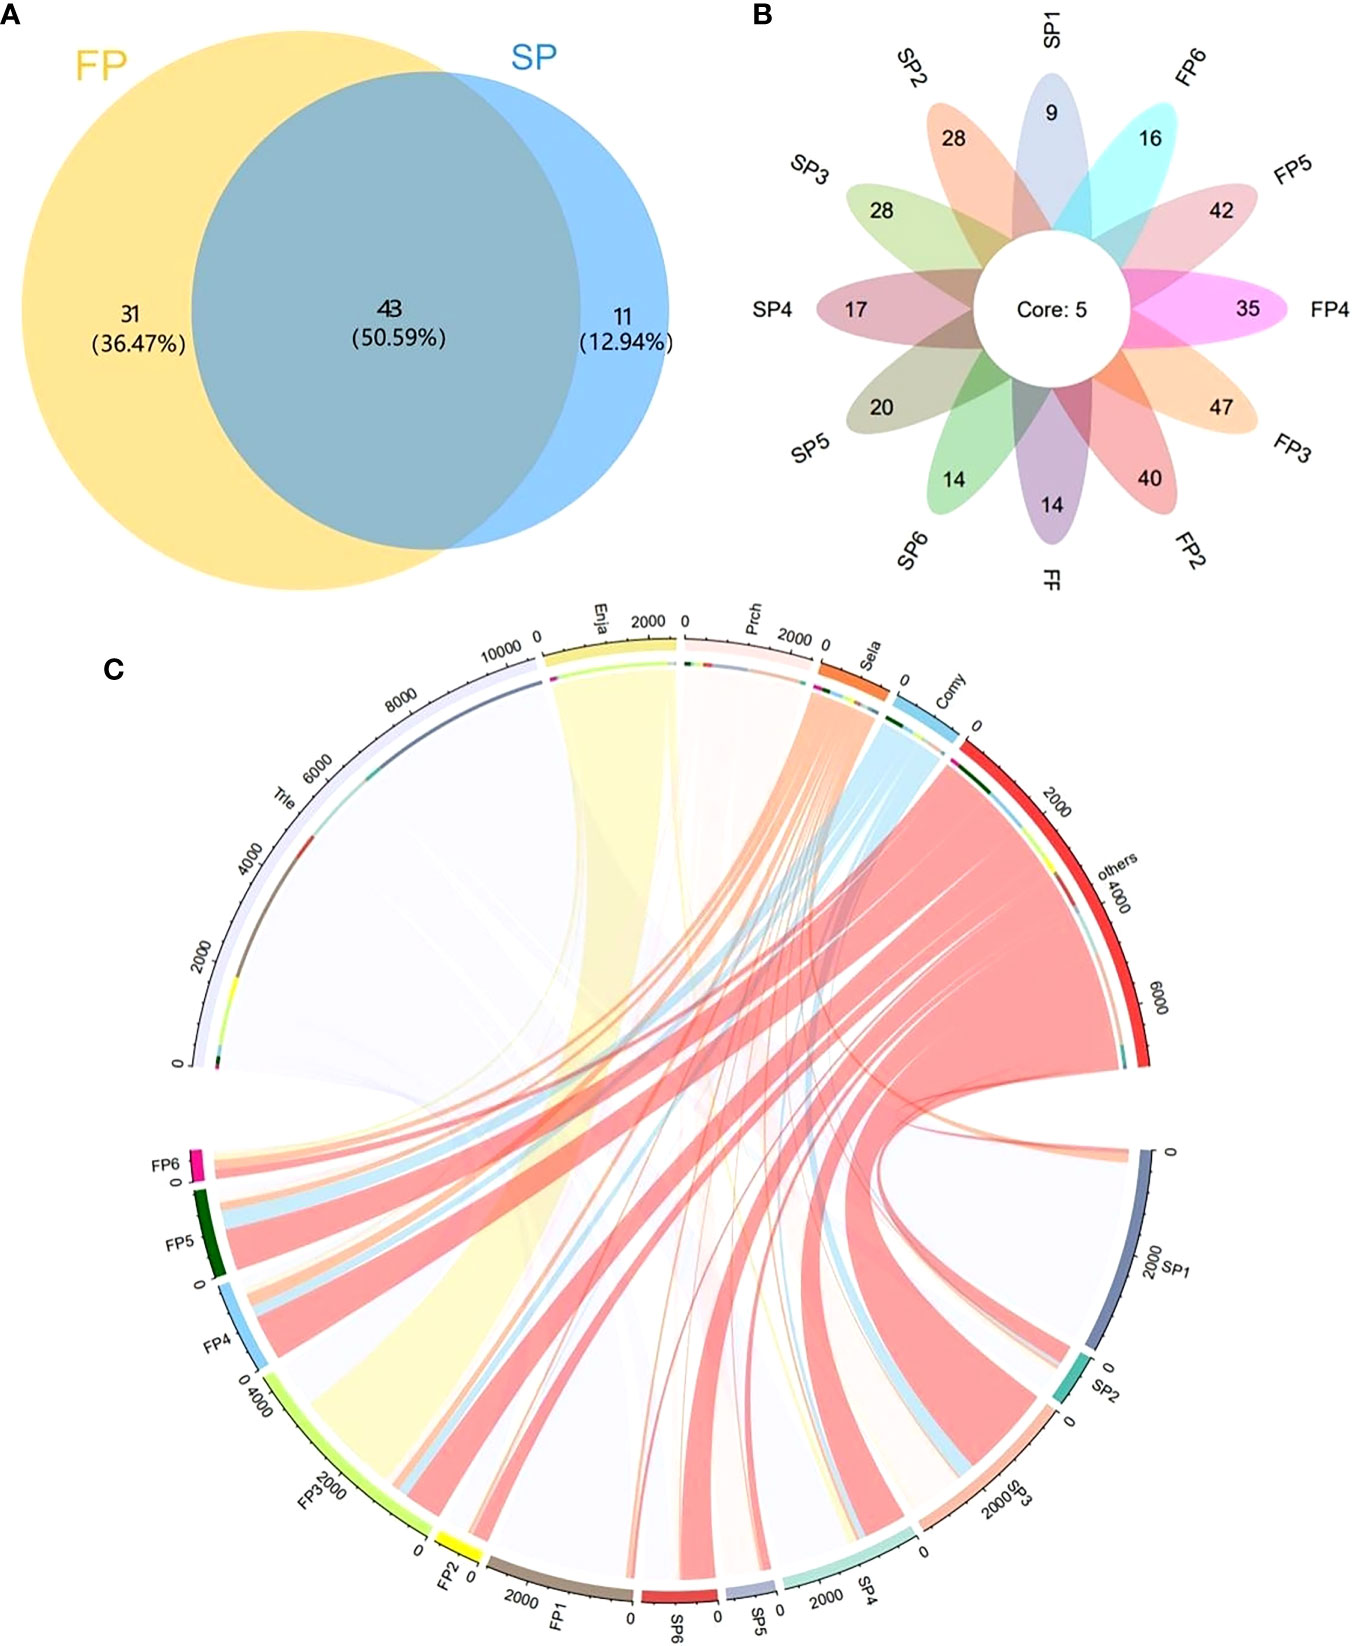
Figure 4 The number of fish species identified during the SP and the FP. (A) Venn diagrams of FP and SP; (B) Venn diagrams of points in both periods; (C) chord diagrams based on sequence abundance.
Alpha diversity of the fish community was compared between the SP and the FP. All samples’ coverage ranged from 0.988-0.999 (Supplementary Table S3), demonstrating that sequencing covered all species so that the results could reflect the actual community. Chao1 ranged from 14 to 54.17, while ACE ranged from 14 to 55.81. These two indices showed a similar trend. The results of Shannon’s (0.36-2.57) and Simpson’s range (0.12-0.89) also show a resemblance. The highest species richness was found in the Daliao River estuary (52) in the FP, and the lowest in Lvshun nearshore (14) in the SP. The t-test results of diversity are shown in Supplementary Table S4. Overall, different samples, including 6 indexes, Richness, Shannon, Simpson, Pielou, Invsimpson, and Coverage, showed no significant differences (p>0.05). It means there is no difference between samples for all of them, showing consistency. However, there is a significant value for Chao1 and ACE indexes in the samples (p<0.05). For these two indexes, the average value of the FP was higher than that of the SP. These findings showed that there were more species overall during the FP than during the SP, indicating a higher level of community variety during the FP.
Based on all sampling sites’ sequence abundance, the Bray standardized similarity coefficient matrix Bray-Curtis distance was used for PCoA analysis to compare similarity and differentiation within samples. Bray standardized similarity refers to the application of the Bray-Curtis distance metric to assess the similarity and differentiation within samples based on the abundance of sequences across various sampling sites. It’s a way to measure how samples compare to each other in terms of their composition. The result shows that two principal coordinates explained 52.39% of the differentiation, and some separate trends can be found between the two periods (Figure 5A). The results showed that the sampling regions were more dispersed during the SP, indicating that the species differences within the community were large. The opposite is true for the sampled data during FP.For almost all sampling areas, some distance also can be found between the two periods, reflecting seasonal differences in species composition. However, SP1 (Lvshun nearshore in the SP) and FP1 (Lvshun nearshore in the FP) were close in the PCoA analysis, indicating that the composition of fish species in P1 (Lvshun nearshore) was similar in the two periods.
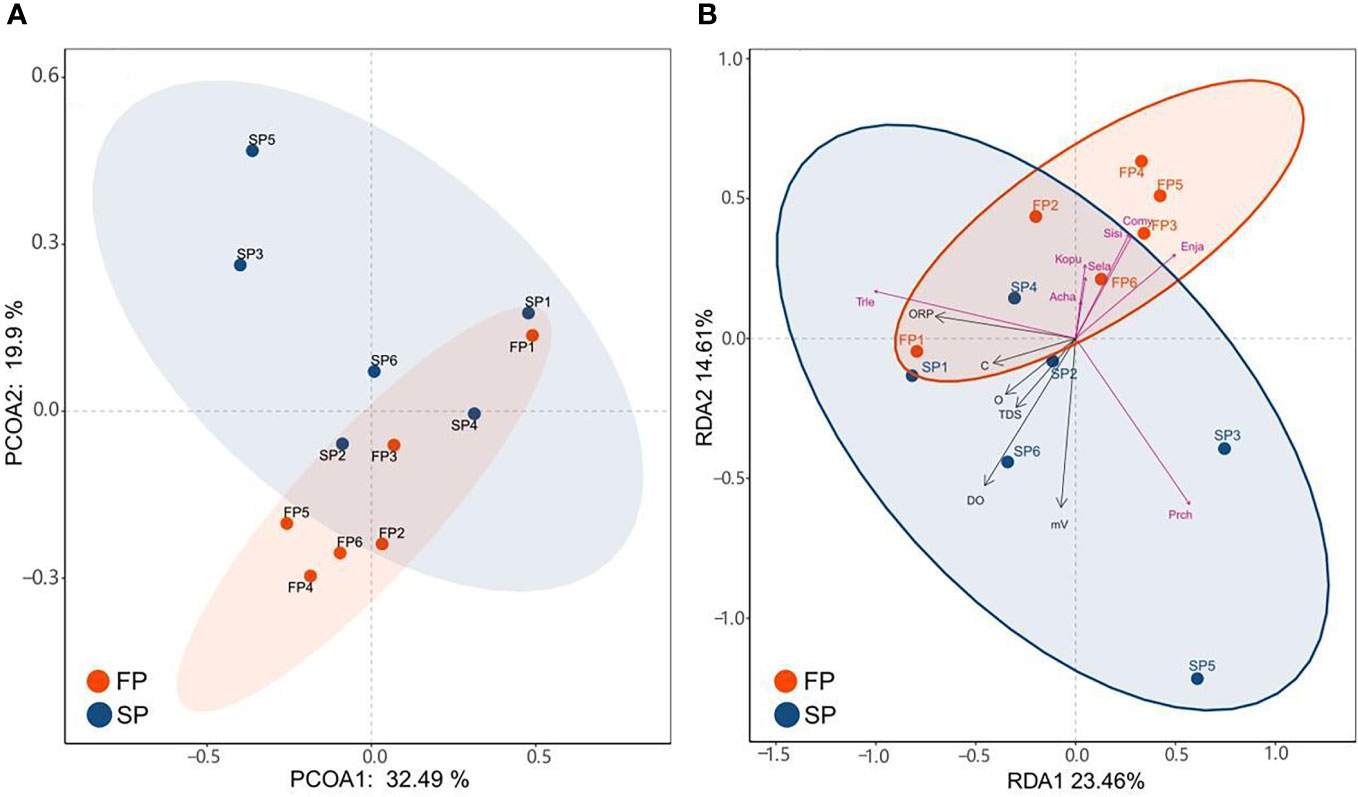
Figure 5 (A) The result of PCoA analysis shows the diversity of fish communities between the two periods. (B) The heatmap showed the relative abundance of fish species at each sampling region.
Differences in the regional and temporal distributions of the species were shown by the heatmap of their relative sequencing abundances (Figure 6A). Briefly, the composition of the community differed among samples. Trichiurus lepturus and Engraulis japonicus had the highest relative abundance and most extensive distribution, whereas Cynoglossus graciliss, Larimichthys polyactis, and Collichthys niveatus distributed narrower. Each sampling site had some specialists, for example, Rachycentron canadum (Raca) only appeared in FP1(Lvshun nearshore), and Acanthogobius hasta (Acha) had a higher abundance in SP4 (Liao river estuary) compared to other samples.
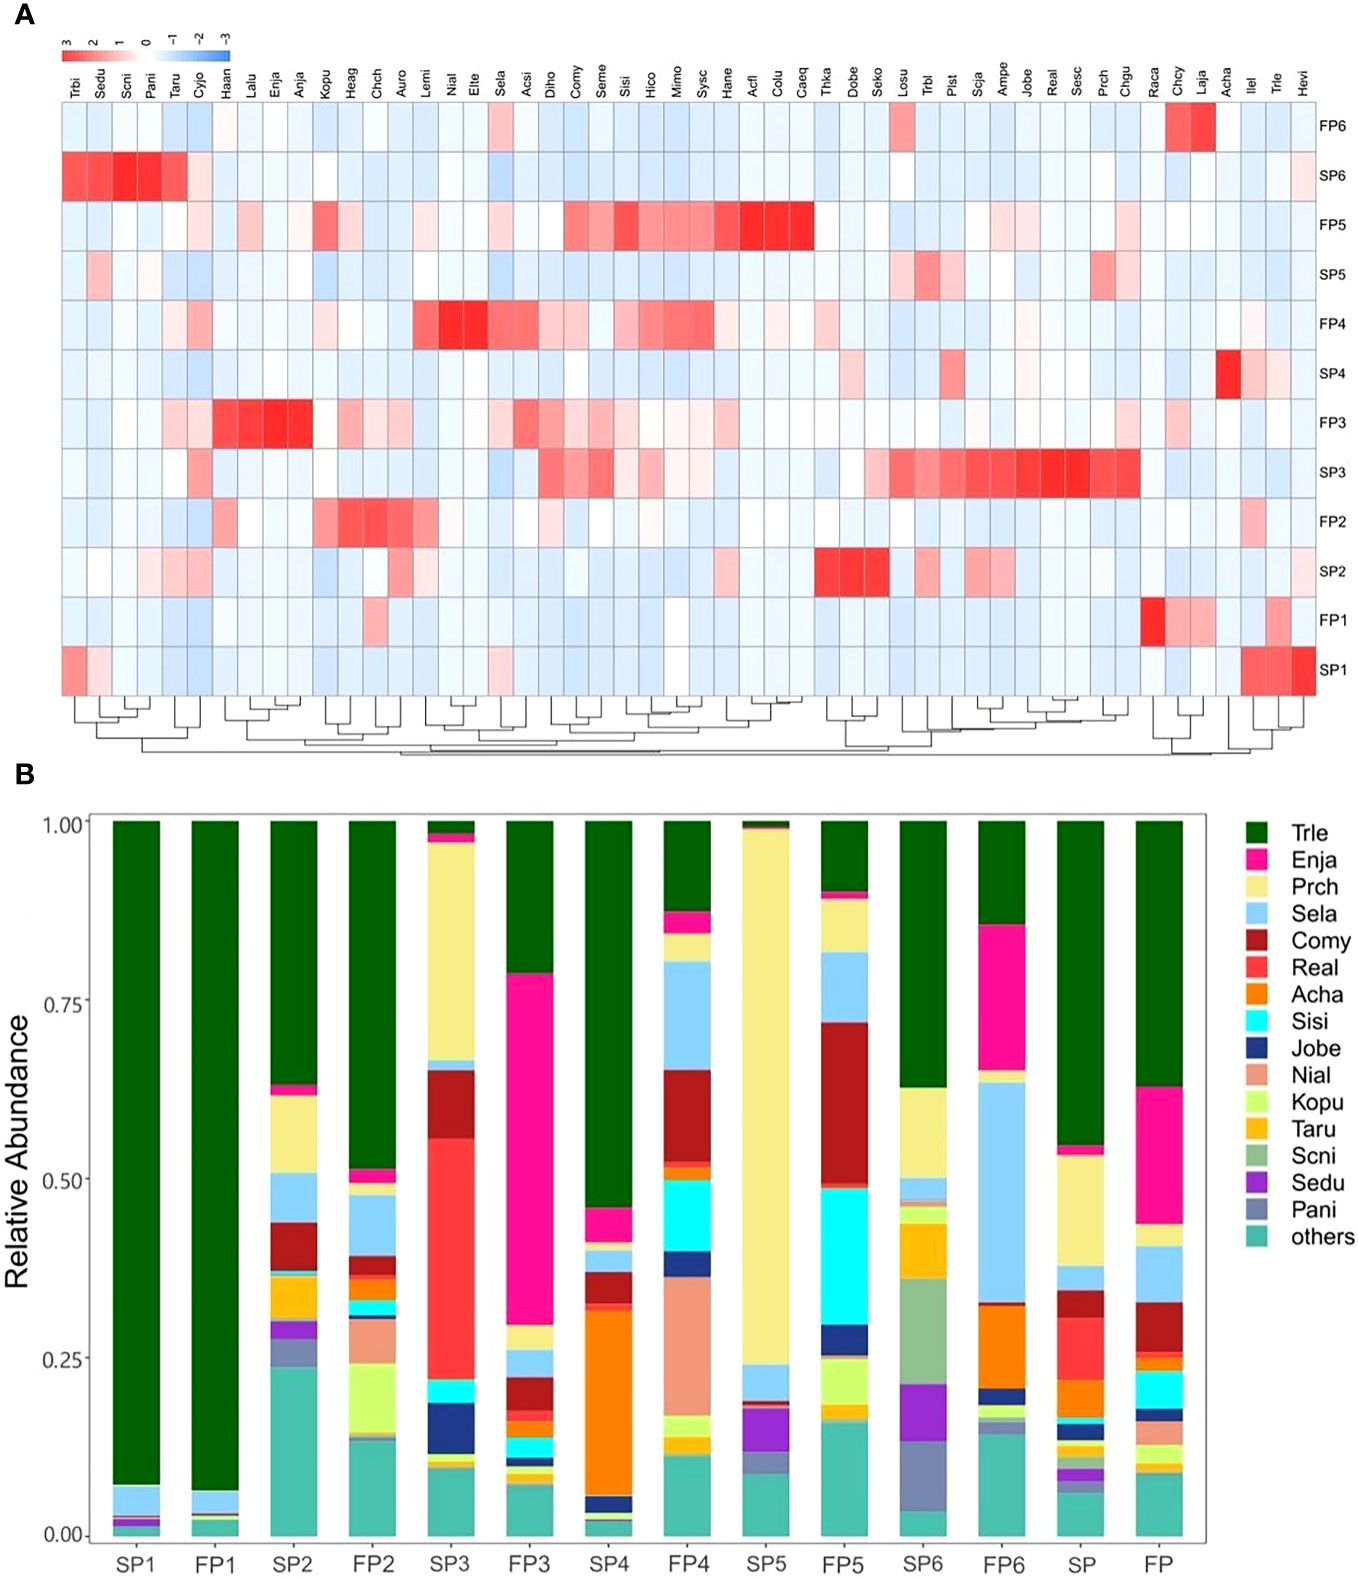
Figure 6 (A) The RDA diagram of the relationship between fish and six environmental factors for two periods. (B) The relative abundance (%) of fish species in different seasons detected in every sampling site.
The diagram based on sequence abundance showed the distribution of fish species is similar at some sites with actual differences (Figure 6B). In Lvshun nearshore (P1), high similarity fish compositions that Trichiurus lepturus dominated, as same as the trend reflected by the results of PCoA analysis. However, the Daliao River estuary (P3) showed a considerable discrepancy compared to Lvshun nearshore, Protosalanx chinensis (Prch) and Remorina albescents (Real) were the dominant species during the SP, which switched to Trichiurus lepturus (Trle) and Engraulis japonicus (Enja) in the FP. Besides, Protosalanx chinensis (Prch) was the main species during the SP, while the FP showed high diversity in Xiaoling River estuary (P5).
3.1.3 Relationship of fish diversity with environmental factors
In this study, 8 different environmental factors were collected, such as total dissolved soil (TDS), the potential of hydrogen (pH), oxidation-reduction potential (ORP), salinity (S), dissolved oxygen (DO), conductivity (C), dissolved oxygen saturation (O) and temperature (T). The measurement results of environmental factors are shown in Supplementary Table S5. The water temperature in each area ranges from 23.6-26.8 °C with an average value of 25.52 °C during the SP and ranges from 18.9°C to 23.6 °C with an average value of 21.73 °C during the FP. The comparison of environmental factor t-test results (mean ± standard deviation) between sampling areas is shown in Supplementary Table S6. It can be seen from the test results that the average values of TDS, S, C, and O in the SP are higher than those in the FP, but ORP, pH, and DO are opposites. The two periods had no significant difference in the above environmental factors. Still, the water was substantially warmer during the SP than it was during the FP (p<0.01).
Using data from the top 8 abundant species found in the two periods and the set of five environmental parameters, RDA analysis was used to highlight the correlations between the environmental factors and the fish species. From Figure 5B, the two RDA axes can explain 39.07% of the structural differences. By studying this figure, it can be found that the samples in the SP and the FP show high dispersion, and there is no consistent relationship between environmental conditions and species distribution. The first-ranking axis and each of the five environmental factors were adversely connected, however, the second-ranking axis was positively correlated. DO has the longest ray arrow, the strongest correlation with the distribution of fish community, and the greatest influence on it, so it is the key environmental factor affecting fish assemblage. This axis is closely related to C, O, and TDS. Furthermore, DO has a strong negative correlation with samples in the FP, but a strong positive correlation with some sampled areas in the SP.
3.2 Trophic network of spotted seals
3.2.1 Network structure analyzing
As shown in Figure 7, the total food webs in the SP and the FP were respectively constructed. Through the food web structure chart, it was clear that the network structure of the FP was more complex than that of the SP, with a high number of connections between Cephalopods and fishes. During the SP period, the total number of nodes in the network was 68, with a total of 353 links. In the FP period, the total number of nodes increased to 88, with a total of 535 links. Among the detected fish species, spotted seals (Phoca largha) preyed on 12 species during the SP, constituting 17.64% of the total node count; and 18 species during the FP, accounting for 20.45% of the total node count. Among them, 11 species existed in both periods.
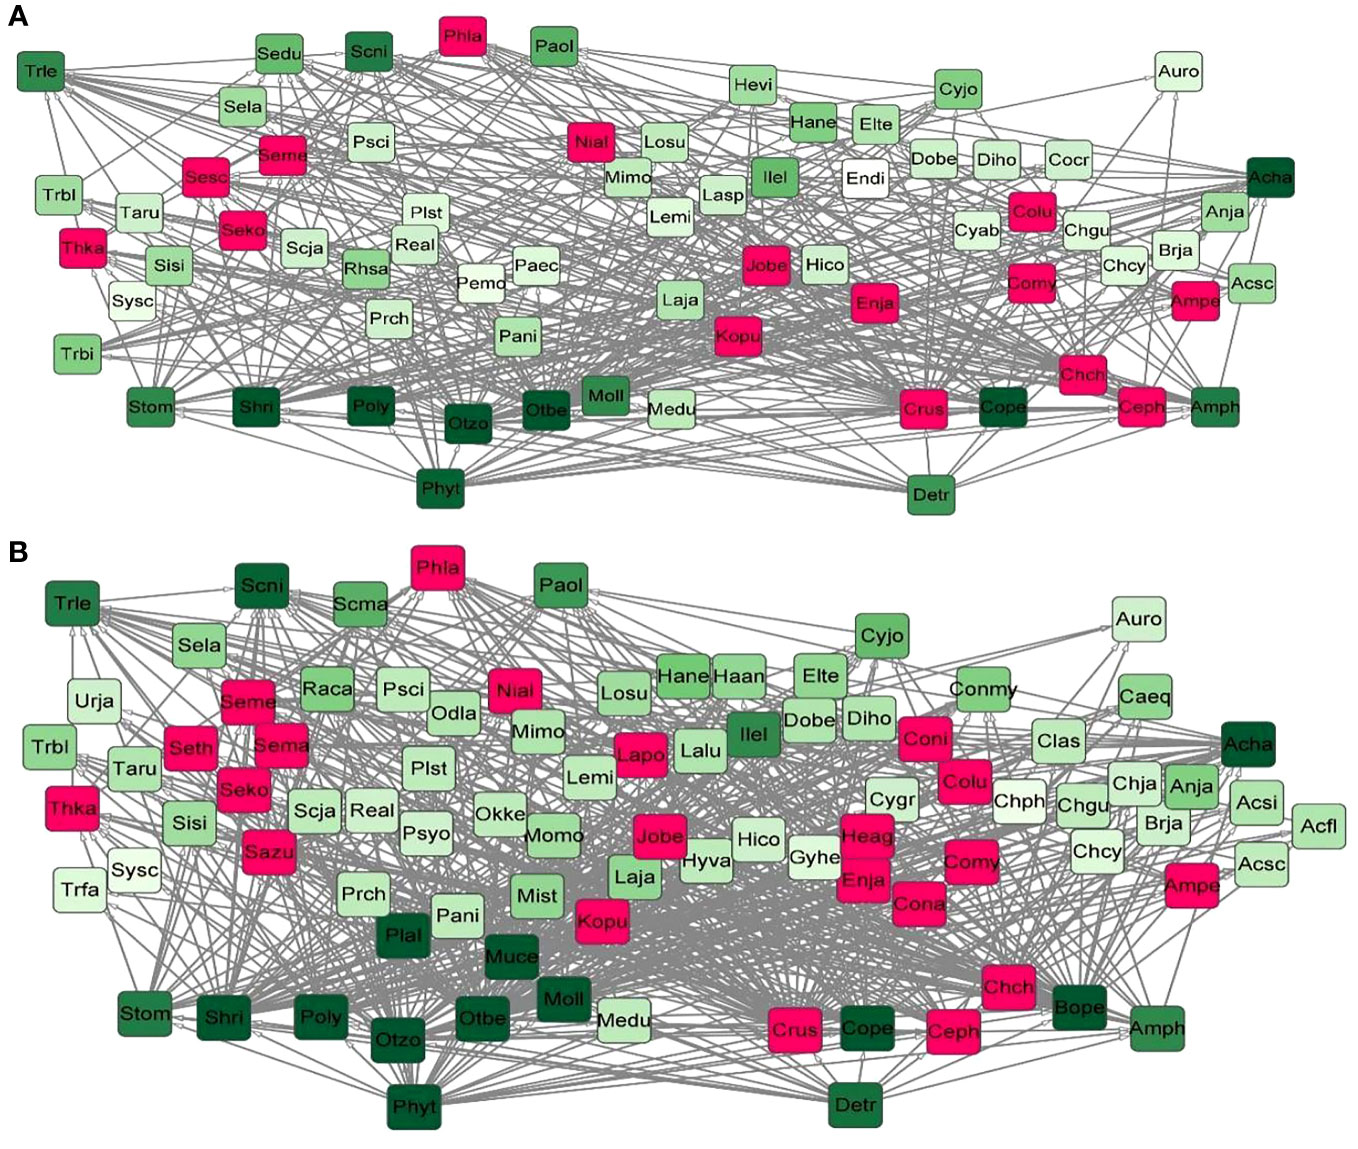
Figure 7 (A) The total food web in the SP. (B) The total food web in the FP. The darker the node color indicated the higher the degree value of species; red nodes represented the feeding species of spotted seals.
According to Equations 1, 2, we selected the sub-network with a high score value and considered it as the stable core sub-network in a food web from 12 food webs in two periods based on the use of the Cytoscape MCODE program (Figure 8). Through these sub-networks, we discovered that the core sub-network scores in the SP higher than these in the FP. Overall, based on the 12 food webs’ partially stable structures, Cephalopods (Ceph) were identified as keystone species 3 times and Coilia mystus (Comy) two times, which were the species that Phoca largha preyed on. Spatially, Comy could be found in the stable structures from P1 and P6, while Ceph appeared in P5, these two species both play critical roles in P2 and P3. Whereas, P4 showed a fluctuation and caused no species could become the critical prey in the food web during two periods.
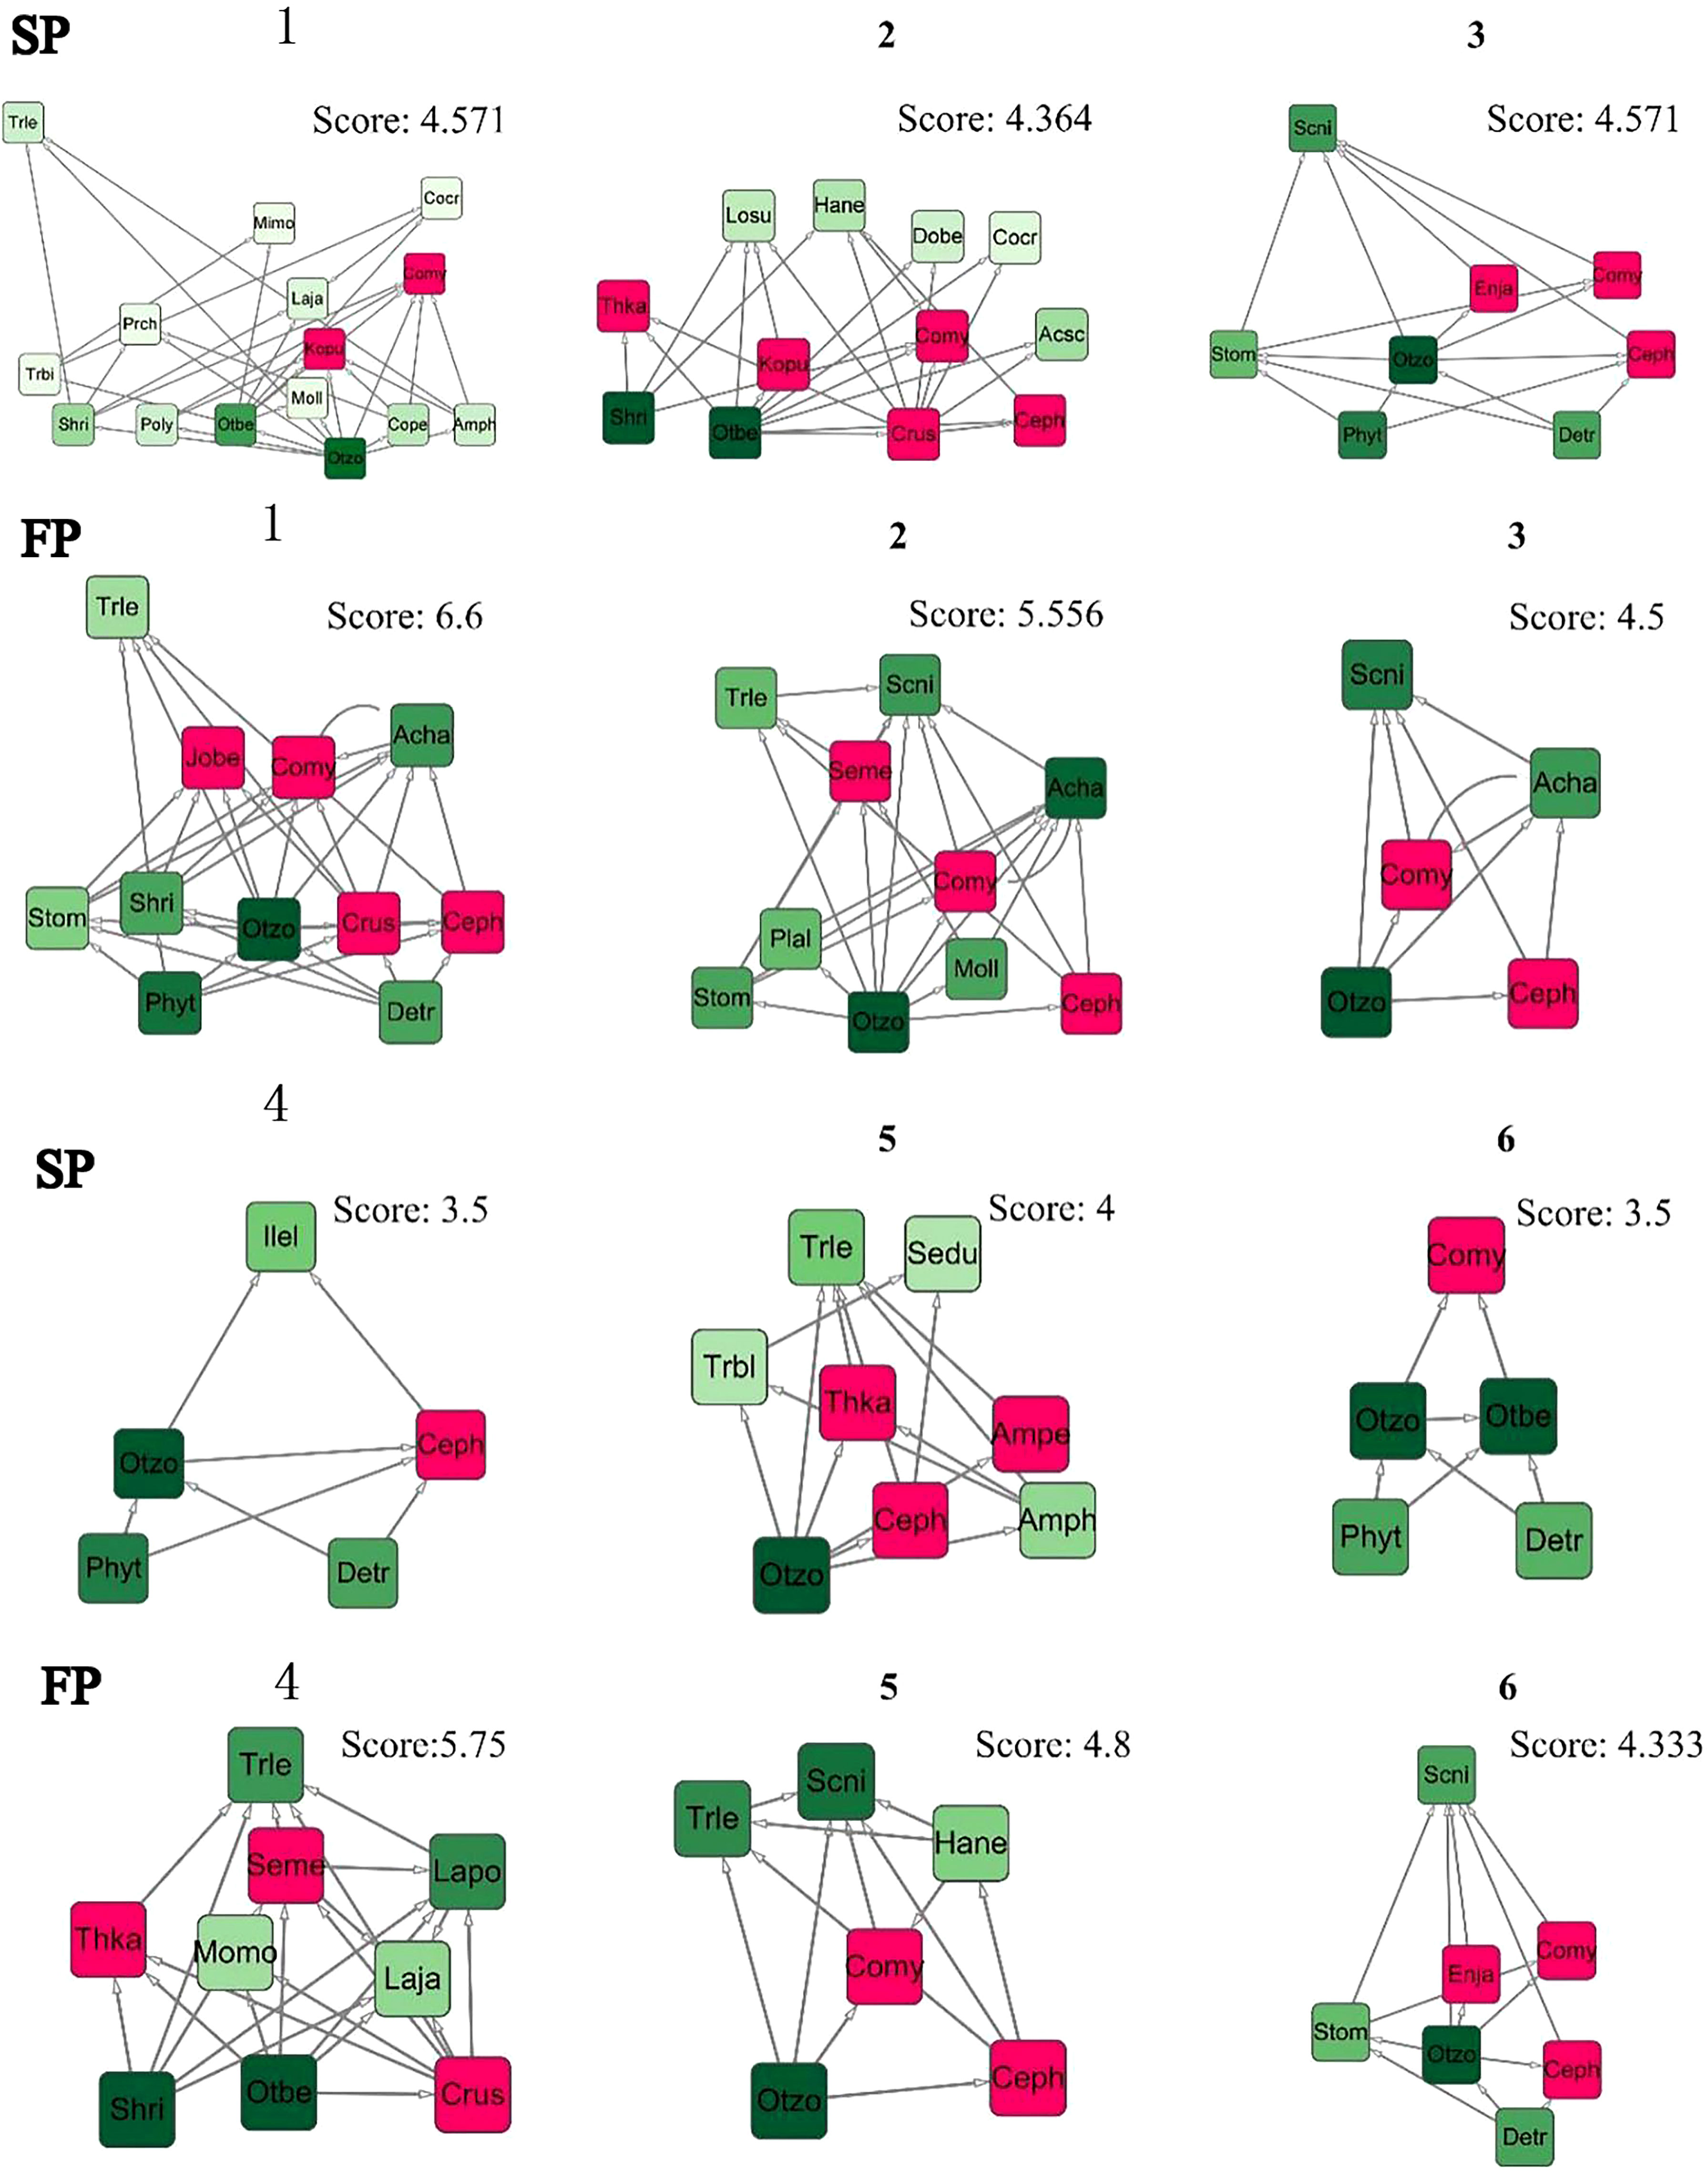
Figure 8 The core of stable sub-network selected with a high score value of the trophic network.
3.2.2 Topological network analysis
According to Equations 4–15, from Table 3, we detected the structural characteristics and complexity of the spotted seals’ food webs. The food web in the SP contained 68 species, while 88 species during the FP. On the one hand, the number of links during the FP (L=535) is almost 1.5 times that of the SP (L=353), but the connectance of the former (C=0.076) is higher than that of the latter (C=0.069); On the other hand, the mean trophic level of the food web in the FP (MTL=3.00) was higher than that in the SP (MTL=2.92). It is worth noting that although the two food networks contain different numbers of species, the proportions of species assigned to the two food webs were very similar: top species (T%, 13% during the SP; 14% during the FP), intermediate species (I%, 83.8% the SP; 83.0% the FP), basal species (B%, 2.9% the SP; 2.3% the FP) and omnivorous species (O%, 58.8% the SP; 61.4% the FP). Intermediate species far outnumber top and basal species, meaning most species were both predators and prey. Besides, the network topological attributes: the characteristic path length (ChPath, 1.98 during the SP; 1.96 during the FP) and the clustering coefficient (CC, 0.345 during the SP; 0.352 during the FP) were similar.
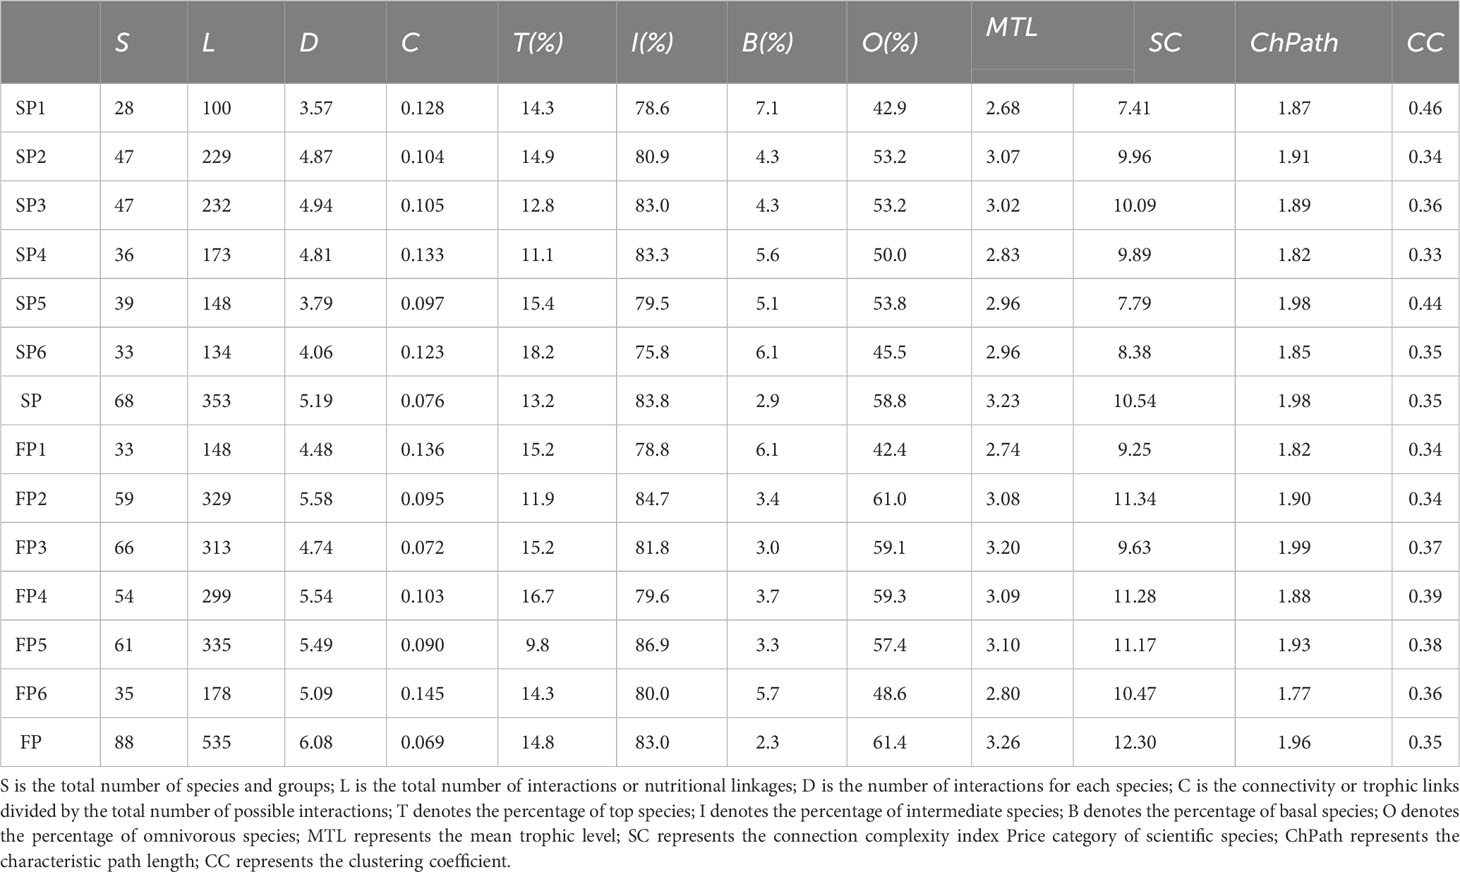
Table 3 Network metric values in the Sealing period (SP) and the Fishing period (FP).
Through t-test results of network parameters (Supplementary Table S7), we discovered that the number of food web nodes in two periods did not differ significantly (P=0.074). However, the mean number of nodes in the FP was higher (51.33 ± 13.98) than in the SP (38.33 ± 7.63). For the number of food web links (the distribution range was 100-335), there were noticeable temporal variations in the quantity of food web links (P=0.034), links found in the FP (267.00 ± 82.09) were significantly higher than that in the SP (169.33 ± 52.94).
The number of links generally increased as node counts climbed, except at Xiaoling River estuary (P5) where they declined during the FP. Similar to the number of links (P=0.034), the distinct link density characteristics (P=0.026) of food webs at different times also showed significant differences, ranging from 3.57 to 5.54. In comparison to the SP (4.34 ± 0.61), the mean number of food web links during the FP (5.15 ± 0.46) was higher. Although there was no statistically significant difference between the two periods (P=0.544), the distribution of food web connectance ranged from 0.072 to 0.136, with the lowest and highest values observed during the FP.
4 Discussion
In this study, we focused on the habitats of spotted seals (Phoca largha) in Liaodong Bay and analyzed fish biodiversity during the closed fishing season (SP, May to June) and the fishing season (FP, September to October) in 2021, based on 36 samples. The results revealed the identification of a total of 85 fish species, with 54 species detected during SP and 74 species during FP. The primary prey species targeted by spotted seals included 12 species during the SP period, constituting 17.64% of the total node count. In the FP period, they consumed 18 species, accounting for 20.45% of the total node count. Comparison with historical records (Cheng, 2004; Liu et al., 2015) showed minimal differences in dominant fish species in the study area, underscoring the utility of eDNA technology. Moreover, the number of fish species discovered during FP significantly exceeded that observed during SP, as reflected in the biodiversity analysis results. A previous study by Wang et al. (2021) had already confirmed the positive impact of the fishing prohibition policy on promoting the recovery of fish populations. Furthermore, variations in fish biodiversity may also be attributed to differences in the habitat heterogeneity of fish species or manifestations of spatial niche differentiation. Notably, Bray-Curtis similarity analysis results indicated significant differences in fish biodiversity between sampling points P1 (Lvshun nearshore) and P6 (Penglai nearshore), revealing that the estuarine habitat environments offer more diverse and stable food resources for spotted seals, Figure 6. In other words, the spatial distribution pattern of fish resources is determined by the long-term influences of habitat heterogeneity, to which spotted seals have adapted through their evolutionary history.
Based on fish resource data, a trophic network for spotted seals was established. We selected 12 network topological measures to analyze the spatiotemporal patterns of network topological properties, describing the complexity characteristics of the network structure. Comparing with network parameters of food webs in other regions (Supplementary Table S8), it was found that the average trophic level (MTL) and clustering coefficient (CC) in the Liaodong Bay nutritional network were both higher than 87.5% of other food webs. Additionally, the intermediate species ratio (I) was also relatively high (Supplementary Table S8). This indicates that the network structure in this region tends to form higher trophic-level clustering patterns, which facilitate the formation of weaker interactions between clusters, enhancing the robustness of the network. Furthermore, the proportion of omnivorous species (O) contributes to forming more links with limited nodes, increasing node degrees, and enhancing the topological importance of omnivorous nodes, which significantly benefits the stability of food webs (Norkko et al., 2007; Xu et al., 2020). Specifically, during both periods, the proportion of omnivorous species (O) reached approximately 60%, with slightly higher values during FP. Overall, the closure of fishing activities appears to have primarily contributed to the recovery of higher trophic-level omnivorous predators in the local fish resources (T increased by 1.6%), which largely fall within the prey category of spotted seals, promoting the complexity of the trophic network. This conclusion is supported by the significantly higher connectivity complexity index during FP (SC=12.3) compared to SP (SC=10.54). Previous studies have suggested that higher food web diversity leads to greater stability (McCann, 2000), indicating that the spotted seal’s trophic network is relatively more stable during FP.
We also found that the food web in Liaodong Bay has a longer characteristic path length compared to most food webs. This suggests that there are longer material energy flow paths and higher ecosystem assimilation efficiency. As a result, the food web has increased redundancy and resistance to disturbances (Marina et al., 2018). The structural analysis of sub-networks revealed that food resources related to spotted seals are often part of highly connected and hierarchical sub-net units, which consist of various omnivorous predators (Figure 8). These sub-net units tend to have higher stability scores. This could be attributed to the fact that species with numerous associations in the food web are linked to specific species, forming multiple interacting clusters (Delmas et al., 2019). In conclusion, our findings suggest that the sources of food for spotted seals in different seasons are not significantly affected by the current fishing ban policy. When winter arrives and spotted seals migrate to the Liaodong Bay area for overwintering and breeding, the network structure they form with local species remains relatively stable. This stability contributes to the recovery of the spotted seal population. However, during the fishing period (FP), it is crucial for the government and species conservation organizations to pay more attention to the intensity of human fishing on mid-to-high trophic-level omnivorous fish resources. This attention is necessary to ensure the sustainability of these potential food resources for spotted seals during the winter season.
In our study, we acknowledge several limitations. Firstly, the degradation process of eDNA can be influenced by various environmental factors, which may potentially affect the experimental results (Mauvisseau et al., 2022). Secondly, we encountered difficulties in identifying many detected sequence fragments through eDNA barcoding, possibly due to insufficient data in the genetic databases. Thirdly, we did not consider predation differences due to age structure, such as the fact that adults and juveniles often feed on different prey, which could impact the network topology. To address these limitations, our future plans include conducting long-term monitoring of the food web structure in Liaodong Bay and expanding the existing database. Additionally, we aim to investigate the effects of network structure variations on spotted seals. Furthermore, we intend to expand the ecological database through long-term field surveys.
5 Conclusion
In conclusion, we conducted in Liaodong Bay, China, using environmental DNA (eDNA) methods and high-throughput sequencing techniques revealed significant findings about the spotted seal habitats and their associated fish diversity.
(a) We identified 85 fish species in total, with Perciformes dominating at 46%. During the sea fishing moratorium period (SP), 54 species were identified, while the fishing period (FP) recorded 74 species, indicating higher species richness in FP across all sampling areas.
(b) The study also constructed and analyzed spotted seals trophic networks, highlighting a more complex structure during FP with increased connections between Cephalopods and fishes. Phoca largha preyed on 12 species during SP and 18 species during FP. The network analysis indicated high clustering coefficients for both periods, suggesting the formation of higher trophic-level clustering patterns, enhancing network robustness. The proportion of omnivorous species (O=60%) contributed to increased stability by forming more links with limited nodes.
(c) Structural analysis of sub-networks revealed that food resources related to spotted seals were part of highly connected and hierarchical sub-net units, consisting of various omnivorous predators. The study emphasized that the spotted seal’s trophic network is relatively more stable during FP, supported by a significantly higher connectivity complexity index. The conclusion emphasized the importance of attention to human fishing intensity on mid-to-high trophic-level omnivorous fish resources during FP for the sustainability of spotted seals’ winter food sources. Overall, the research provides valuable insights for integrated ecological network management and suggestions for the protection and recovery of spotted seals.
Data availability statement
The original contributions presented in the study are publicly available. The Coastal eDNA Genome sequencing can be found here: NCBI with Accession: PRJNA1026063, https://www.ncbi.nlm.nih.gov/bioproject/PRJNA1026063.
Author contributions
YX: Conceptualization, Funding acquisition, Investigation, Methodology, Project administration, Supervision, Writing – original draft, Writing – review & editing. FH: Formal Analysis, Investigation, Methodology, Software, Writing – original draft. MZ: Investigation, Visualization, Writing – review & editing. RG: Writing – review & editing. JZ: Funding acquisition, Project administration, Supervision, Writing – review & editing. QR: Resources, Validation, Writing – review & editing. YC: Supervision, Writing – review & editing.
Funding
The author(s) declare financial support was received for the research, authorship, and/or publication of this article. This research was supported by: National Natural Science Foundation of China (No. 42277470, 42007185), Open fund of Key Laboratory of Ecological Prewarning, Protection and Restoration of Bohai Sea, Ministry of Natural Resources (No. 2022106), Foundation of State Environmental Protection Key Laboratory of Coastal Ecological Environment, National Marine Environmental Monitoring Center of China (202310), Knowledge Innovation Program of Wuhan-Shuguang Project (No. 2022020801020210). We also thanked the Majorbio Bio-Pharm Technology Co. Ltd. (Shanghai, China) for supporting high-throughput sequencing.
Conflict of interest
Author YX was assisted by the Majorbio Bio-Pharm Technology Co. Ltd. for high-throughput sequencing.
The remaining authors declare that the research was conducted in the absence of any commercial or financial relationships that could be construed as a potential conflict of interest.
Publisher’s note
All claims expressed in this article are solely those of the authors and do not necessarily represent those of their affiliated organizations, or those of the publisher, the editors and the reviewers. Any product that may be evaluated in this article, or claim that may be made by its manufacturer, is not guaranteed or endorsed by the publisher.
Supplementary material
The Supplementary Material for this article can be found online at: https://www.frontiersin.org/articles/10.3389/fmars.2023.1305763/full#supplementary-material
References
Albouy C., Delattre V. L., Merigot B., Meynard C. N., Leprieur F. (2017). Multifaceted biodiversity hotspots of marine mammals for conservation priorities. Divers. Distrib. 23, 615–626. doi: 10.1111/ddi.12556
Avila I. C., Kaschner K., Dormann C. F. (2018). Current global risks to marine mammals: Taking stock of the threats. Biol. Conserv. 221, 44–58. doi: 10.1016/j.biocon.2018.02.021
Bader G. D., Hogue C. W. (2003). An automated method for finding molecular complexes in large protein interaction networks. BMC Bioinf. 4 (1), 1–27. doi: 10.1186/1471-2105-4-2
Barman P. P., Yanan H., Liu Q. (2020). Dynamic characteristics of community structure and seasonal variation of fishery species in the Bohai Sea, China. Appl. Ecol. Env. Res. 18 (1), 817–837. doi: 10.15666/aeer/1801_817837
Bascompte J. (2009). Disentangling the web of life. Science 325, 416–419. doi: 10.1126/science.1170749
Bossart G. D. (2011). Marine mammals as sentinel species for oceans and human health. Vet. Pathol. 48, 676–690. doi: 10.1177/0300985810388525
Brose U., Dunne J. A. (2009). “37Chapter 3 Modelling the dynamics of complex food webs,” in Community Ecology: Processes, Models, and Applications. Eds. Verhoef H. A., Morin P. J. (United States: Oxford University Press). Available at: https://academic.oup.com/book/11078.
Chen S., Zhou Y., Chen Y., Gu J. (2018). FASTP: an ultra-fast all-in-one FASTQ preprocessor. Bioinformatics 34, i884–i890. doi: 10.1093/bioinformatics/bty560
Cheng J. S. (2004). Ecological environment and biomes in coastal waters of the Yellow Sea and Bohai Sea (China: Qingdao Ocean University Press). Available at: https://www.zhangqiaokeyan.com/book-cn/081501157090.html.
Cordone G., Salinas V., Marina T. I., Doyle S. R., Pasotti F., Saravia L. A., et al. (2020). Green vs brown food web: Effects of habitat type on multidimensional stability proxies for a highly-resolved Antarctic food web. Food Webs 25, e00166. doi: 10.1016/j.fooweb.2020.e00166
D’Alessandro S., Mariani S. (2021). Sifting environmental DNA metabarcoding data sets for rapid reconstruction of marine food webs. Fish Fish. 22, 822–833. doi: 10.1111/faf.12553
Danger M., Bec A., Spitz J., Perga M.-E. (2022). Questioning the roles of resources nutritional quality in ecology. Oikos 2022, e09503. doi: 10.1111/oik.09503
Delmas E., Besson M., Brice M.-H., Burkle L. A., Dalla Riva G. V., Fortin M.-J., et al. (2019). Analysing ecological networks of species interactions: Analyzing ecological networks. Biol. Rev. 94, 16–36. doi: 10.1111/brv.12433
DiBattista J. D., Coker D. J., Sinclair-Taylor T. H., Stat M., Berumen M. L., Bunce M. (2017). Assessing the utility of eDNA as a tool to survey reef-fish communities in the Red Sea. Coral Reefs 36, 1245–1252. doi: 10.1007/s00338-017-1618-1
Edgar R. C. (2013). UPARSE: highly accurate OTU sequences from microbial amplicon reads. Nat. Methods 10, 996–998. doi: 10.1038/nmeth.2604
Farriols M. T., Ordines F., Somerfield P. J., Pasqual C., Hidalgo M., Guijarro B., et al. (2016). Bottom trawl impacts on Mediterranean demersal fish diversity: Not so obvious or are we too late? Cont. Shelf Res. 137, 84–102. doi: 10.1016/j.csr.2016.11.011
Fassbender A. J., Sabine C. L., Palevsky H. I. (2017). Nonuniform ocean acidification and attenuation of the ocean carbon sink: NonUniform Ocean Acidification. Geophys. Res. Lett. 44, 8404–8413. doi: 10.1002/2017GL074389
Guzzo M. M., Blanchfield P. J., Rennie M. D. (2017). Behavioral responses to annual temperature variation alter the dominant energy pathway, growth, and condition of a cold-water predator. PNAS 114, 9912–9917. doi: 10.1073/pnas.1702584114
Han J. (2009). “Studies on Population Resources and Molecular Genetic Characteristics of Spotted Seals (Phoca largha),” in Chinese Waters (China: Institute of Oceanology, Qingdao, The Chinese Academy of Sciences). Available at: https://d.wanfangdata.com.cn/thesis/Y1613257.
Hendrix A. M., Lefebvre K. A., Quakenbush L., Bryan A., Stimmelmayr R., Sheffield G., et al. (2021). Ice seals as sentinels for algal toxin presence in the Pacific Arctic and subarctic marine ecosystems. Mar. Mammal Sci. 37, 1292–1308. doi: 10.1111/mms.12822
Huxley C. (2013). “CITES: the vision,” in Endangered species threatened convention: the past, present and future of CITES, the convention on international trade in endangered species of wild Fauna and Flora (Washington, Routledge: Earthscan Press). Available at: https://books.google.hu/books?hl=en&lr=&id=2Xr7AQAAQBAJ&oi=fnd&pg=PA3&dq=+CITES:+the+vision.&ots=bpo6oxHftf&sig=zYWJqzmYa_AdeJLn09II1jvbMTA&redir_esc=y#v=onepage&q=CITES%3A%20the%20vision.&f=false.
Karlson A. M. L., Gorokhova E., Gårdmark A., Pekcan-Hekim Z., Casini M., Albertsson J., et al. (2020). Linking consumer physiological status to food-web structure and prey food value in the Baltic Sea. Ambio 49, 391–406. doi: 10.1007/s13280-019-01201-1
Kda B., Jcw B., Em A., Faa C. (2015). Choice of capture and extraction methods affect detection of freshwater biodiversity from environmental DNA. Biol. Conserv. 183, 53–63. doi: 10.1016/j.biocon.2014.11.018
Liu J. (2019). Fishes of Bo Hai. Beijing (China: Science Pres). Available at: https://www.abebooks.com/Fishes-Bo-Liu-Jing/30537577381/bd.
Liu X., Li Y., Wang W., Duan Y., Chai Y., Dong J. (2015). The fish community structure and diversity in the north of Liaodong Bay. Jornal Fisheries China 39, 1155–1165. doi: 10.11964/jfc.20150309766
Liu B., Wang H., Qin B., Fan Z., Xiong W., Chen Y. (2021). Environmental DNA metabarcoding-based monitoring of fish diversity and screening invasion risk of non-native fishes in the Beijing area. J. Biosafety 30, 220–229. doi: 10.3969/j.issn.2095-1787.2021.03.011
Liu H., Wei Q., Huang C., Zhang Y., Guo Z. (2017). Potential roles of intrinsic disorder in maternal-effect proteins involved in the maintenance of DNA methylation. Int. J. Mol. Sci. 18, 1898. doi: 10.3390/ijms18091898
Lowry L. F., Burkanov V. N., Frost K. J., Simpkins M. A., Davis R., DeMaster D. P., et al. (2000). Habitat use and habitat selection by spotted seals (Phoca largha) in the Bering Sea. Can. J. Zoo. 78 (11), 1959–1971. doi: 10.1139/z00-138
Magoc T., Salzberg S. L. (2011). FLASH: fast length adjustment of short reads to improve genome assemblies. Bioinformatics 27, 2957–2963. doi: 10.1093/bioinformatics/btr507
Marina T. I., Salinas V., Cordone G., Campana G., Moreira E., Deregibus D., et al. (2018). The Food Web of Potter Cove (Antarctica): complexity, structure and function. Estuar. Coast. Shelf Sci. 200, 141–151. doi: 10.1016/j.ecss.2017.10.015
Mauvisseau Q., Harper L. R., Sander M., Hanner R. H., Kleyer H., Deiner K. (2022). The multiple states of environmental DNA and what is known about their persistence in aquatic environments. Environ. Sci. Technol. 56, 5322–5333. doi: 10.1021/acs.est.1c07638
McCann K. S. (2000). The diversity-stability debate. Nature 405 (6783), 228–233. doi: 10.1038/35012234
Nomura J., Mardo M., Takumi T. (2021). Molecular signatures from multi-omics of autism spectrum disorders and schizophrenia. J. Neurochem. 159 (4), 647–659. doi: 10.1111/jnc.15514
Norkko A., Thrush S. F., Cummings V. J., Gibbs M. M., Andrew N. L., Norkko J., et al. (2007). Trophic structure of coastal antarctic food webs associated with changes in sea ice and food supply. Ecology 88, 2810–2820. doi: 10.1890/06-1396.1
Orio A., Bergström U., Florin A. B., Šics I., Casini M. (2020). Long-term changes in spatial overlap between interacting cod and flounder in the Baltic Sea. Hydrobiologia 847 (11), 2541–2553. doi: 10.1007/s10750-020-04272-4
Parsons E. C. M., Baulch S., Bechshoft T., Bellazzi G., Bouchet P., Cosentino A. M., et al. (2015). Key research questions of global importance for cetacean conservation. Endanger. Species Res. 27, 113–118. doi: 10.3354/esr00655
Pires A. P. F., Marino N. A. C., Srivastava D. S., Farjalla V. F. (2016). Predicted rainfall changes disrupt trophic interactions in a tropical aquatic ecosystem. Ecology 97, 2750–2759. doi: 10.1002/ecy.1501
Qu C., Stewart K. A., Clemente-Carvalho R., Zheng J., Wang Y., Gong C., et al. (2020). Comparing fish prey diversity for a critically endangered aquatic mammal in a reserve and the wild using eDNA metabarcoding. Sci. Rep. 10, 16715. doi: 10.1038/s41598-020-73648-2
Riede J. O., Rall B. C., Banasek-Richter C., Navarrete S. A., Wieters E. A., Emmerson M. C., et al. (2010). “Scaling of Food-Web Properties with Diversity and Complexity Across Ecosystems,” in Advances in Ecological Research, Vol 42: Ecological Networks. Ed. Woodward G. (United States: Academic Press), 139–170. doi: 10.1016/B978012381363-3.00003-4
Rodriguez I. D., Marina T. I., Schloss I. R., Saravia L. A. (2022). Marine food webs are more complex but less stable in sub-Antarctic (Beagle channel, Argentina) than in Antarctic (Potter cove, Antarctic peninsula) regions. Mar. Environ. Res. 174 (1), 105561. doi: 10.1016/j.marenvres.2022.105561
Rourke M. L., Fowler A. M., Hughes J. M., Broadhurst M. K., DiBattista J. D., Fielder S., et al. (2022). Environmental DNA (eDNA) as a tool for assessing fish biomass: A review of approaches and future considerations for resource surveys. Environ. DNA 4 (1), 9–33. doi: 10.1002/edn3.185
Shannon P., Markiel A., Ozier O., Baliga N. S., Wang J. T., Ramage D., et al. (2003). Cytoscape: A software environment for integrated models of biomolecular interaction networks. Genome Res. 13, 2498–2504. doi: 10.1101/gr.1239303
Trussell G. C., Ewanchuk P. J., Matassa C. M. (2006). The fear of being eaten reduces energy transfer in a simple food chain. Ecology 87, 2979–2984. doi: 10.1890/0012-9658(2006)87[2979:TFOBER]2.0.CO;2
Wang Q., Garrity G. M., Tiedje J. M., Cole J. R. (2007). Naïve Bayesian Classifier for Rapid Assignment of rRNA Sequences into the New Bacterial Taxonomy. Appl. Environ. Microbiol. 73, 5261–5267. doi: 10.1128/AEM.00062-07
Wang R., Lin L., Li H., Zhang R., Li Y. (2021). Potential use of environmental DNA methods in Arctic marine fish diversity research. Chin. J. Polar Res. 33 (1), 148–155. doi: 10.13679/j.jdyj.20200018
Xu Y., Huo X. M., Jordán F., Zhou M. L., Cai Y. P., Sun J. (2023). Identifying marine food web homogenization patterns. Front. Mar. Sci. 10, 1245513. doi: 10.3389/fmars.2023.1245513
Xu C., Liu Y., Cheng Y., Xu B. F., Zhang C. L., Ren Y. P., et al. (2020). Structure and complexity of Haizhou Bay food web based on topological network analysis. Haiyang Xuebao 42 (4), 47–54. doi: 10.3969/j.issn.0253-4193.2020.04.006
Yang K., Ding C., Chen X., Ding L., Huang M., Chen J., et al. (2022). Fish diversity and spatial distribution pattern in the Nujiang River Basin. Biodivers. Sci. 30, 21334. doi: 10.17520/biods.2021334
Yang J., Zhang X., Jin X., Seymour M., Richter C., Logares R., et al. (2021). Recent advances in environmental DNA-based biodiversity assessment and conservation. Divers. Distrib. 27 (10), 1876–1879. doi: 10.1111/ddi.13415
Yates M. C., Cristescu M. E., Derry A. M. (2021). Integrating physiology and environmental dynamics to operationalize environmental DNA (eDNA) as a means to monitor freshwater macro-organism abundance. Mol. Ecol. 30 (24), 6531–6550. doi: 10.1111/mec.16202
Zhu Q., Jiang B., Tang T. Y. (2000). Species, distribution and conservation strategies of Marine mammals in China. Mar. Sci. 24 (9), 35–39. doi: 10.3969/j.issn.1000-3096.2000.09.014
Keywords: eDNA metabarcoding, spotted seals, trophic network, biodiversity, ecological network analysis, Liaodong bay
Citation: Xu Y, Huang F, Zhou M, Gu R, Zhu J, Rong Q and Cai Y (2023) Recognizing topological attributes and spatiotemporal patterns in spotted seals (Phoca largha) trophic networks based on eDNA metabarcoding. Front. Mar. Sci. 10:1305763. doi: 10.3389/fmars.2023.1305763
Received: 02 October 2023; Accepted: 04 December 2023;
Published: 20 December 2023.
Edited by:
Tian Xie, Beijing Normal University, ChinaReviewed by:
Vera G. Fonseca, Fisheries and Aquaculture Science (CEFAS), United KingdomSiyuan Yang, Beijing Institute of Applied Meteorology, China
Copyright © 2023 Xu, Huang, Zhou, Gu, Zhu, Rong and Cai. This is an open-access article distributed under the terms of the Creative Commons Attribution License (CC BY). The use, distribution or reproduction in other forums is permitted, provided the original author(s) and the copyright owner(s) are credited and that the original publication in this journal is cited, in accordance with accepted academic practice. No use, distribution or reproduction is permitted which does not comply with these terms.
*Correspondence: Yan Xu, Z3Jhd2FpbjAwN0AxNjMuY29t; Jie Zhu, emh1amllMDNAY2Fhcy5jbg==