 Kazuki Tachibana1
 Motohiro Shimanaga2*
 Dewi Langlet3,4Koji Seike5,6Masayuki Miyazaki3
 Mitsuhiro Yoshida7
 Takuro Nunoura7
 Hidetaka Nomaki3
- 1Graduate School of Science and Technology, Kumamoto University, Kumamoto, Japan
- 2Centre for Water Cycle, Marine Environment and Disaster Management, Kumamoto University, Kumamoto, Japan
- 3X-star, Japan Agency for Marine-Earth Science and Technology (JAMSTEC), Yokosuka, Japan
- 4Evolution, Cell Biology, and Symbiosis Unit, Okinawa Institute of Science and Technology (OIST), Onna, Japan
- 5Geological Survey of Japan, National Institute of Advanced Industrial Science and Technology (AIST), Tsukuba, Japan
- 6Department of Natural Environmental Studies, Graduate School of Frontier Sciences, The University of Tokyo, Kashiwa, Japan
- 7Research Center for Bioscience and Nanoscience (CeBN), Japan Agency for Marine-Earth Science and Technology (JAMSTEC), Yokosuka, Japan
The Bering Sea is the second largest marginal sea in the North Pacific and is one of the areas with highest biological productivity in high-latitude waters. The continental shelf of the Bering Sea hosts large populations of marine mammals and fishery resources. However, the smaller organisms in benthic ecosystems, including meiofauna, have been largely overlooked in this area, despite their potential importance in ecosystem functioning and the resultant biogeochemical cycles. This study analyzed spatial differences in the total abundance and community structure of the metazoan meiofauna at five stations around the Bering Canyon, located at the southeastern margin of the Bering Sea. Their association with environmental factors in sediments was also studied. The results confirmed that the investigated stations had meiofaunal standing stocks that were comparable to those of other Arctic seas. Among the investigated sediment biological and geochemical parameters (total organic carbon, median grain size, prokaryotic cell numbers, etc.), multivariate analyses showed that the C/N of organic matter in sediments was the main factor associated with meiofaunal community structure.
1 Introduction
The Bering Sea is the second largest marginal sea in the North Pacific (2.27 × 10⁶ km2, Chen et al., 2004). It is a semi-enclosed, high-latitude sea that connects the North Pacific to the Arctic Sea (Stabeno et al., 1999). The Bering Sea is one of the areas with the highest biological productivity in high-latitude waters, with diatom fluxes that are one order of magnitude higher than the adjacent Gulf of Alaska (Chen et al., 2004). The continental shelf of the Bering Sea is known for its large populations of marine mammals and seabirds, and it hosts large fishery resources of the United States (Granger et al., 2011). However, the smaller organisms in benthic ecosystems, including macro- and meiofauna have been largely overlooked in this area, despite their potential importance in ecosystem functioning and the resultant biogeochemical cycles (e.g., Kakui et al., 2020; Langlet et al., 2020).
Meiobenthos, or meiofauna, is a term that describes the benthic organisms that pass a sieve of 0.5–1 mm mesh size and are retained on a sieve of 45 μm (with slightly varying mesh sizes of 31–63 μm), which contains representatives of almost all phyla (Giere, 2009; Schmidt-Rhaesa, 2020). They are ideal organisms for studying the effects of various environmental factors on aquatic ecosystems because of their intimate association with sedimentary environments, high abundance, benthic larvae, and short generation times (Giere, 2009; Schratzberger & Ingels, 2018). Recently, they have also been considered a good bioindicator of climate change in polar regions (Leasi et al., 2021).
The abundance of metazoan meiofauna along continental margins has been reported in different climatic regions for decades, and two major trends have been revealed on a global scale: an exponential decrease in their abundance with water depth reflecting the decrease in food input from the sea surface, and higher abundance in the areas at higher latitudes with enhanced input of organic matter to the seafloor (Tietjen, 1992; Soltwedel, 2000; Rex et al., 2006). Considering the very high surface productivity in the Bering Sea, meiofaunal abundance in this area is expected to be high, even among high-latitude oceans. Recent studies have focused on the taxonomy and ecology of metazoan meiofauna in the Bering Sea. Gemery et al. (2013) investigated the temporal changes in benthic ostracod assemblages in the northern part of the sea from the 1970s to 2010 and revealed that decadal temperature changes affected the species composition. A new species of Kinorhyncha was described from an active marine volcano in the Bering Sea as the first representative of the taxon from the sea (Adrianov and Maiorova, 2020). In sea ice in the central and northern Bering Sea, the dominant meiofaunal taxon was Rotifera, which contributed more than 50% of all individuals (Bluhm et al., 2018). Although these studies provide novel insights into meiofaunal communities in the Bering Sea, systematic information conferring spatial changes in total metazoan meiofaunal abundance and their whole community structure is yet to be found in the Bering Sea (Soltwedel, 2000; Rosli et al., 2017; Stratmann et al., 2020).
In August 2017, surface sediment sampling was conducted at five stations at depths ranging from 1,536 m to 103 m along the Bering Canyon. Based on these samples, spatial changes in the abundance of benthic foraminifera (a dominant group among meiofaunal size protozoans) along a wide gradient of environmental conditions in these sediments have been reported (Langlet et al., 2020). This study suggests that the abundance of foraminifera is controlled by food availability in the area.
In the present study, we focused on whole assemblages of metazoan meiofauna and investigated the following questions:
(1) Is a general bathymetric decreasing trend in meiofaunal abundance observed in the study area?
(2) Is the meiofaunal abundance in the southeastern Bering Sea higher than the “global average” and comparable to that in adjacent arctic regions with high productivity, where a higher abundance of the metazoan meiofauna has been reported?
(3) Which environmental factor(s) regulate(s) spatial differences in meiofaunal community structure at higher taxonomic levels?
2 Materials and methods
2.1 Sampling
Sediment samples were collected during the MR17-04 cruise Leg2 on the Japan Agency for Marine-Earth Science and Technology (JAMSTEC) R/V Mirai from August 5 to 21, 2017, in the southeastern Bering Sea (Figure 1). Five stations were chosen to cover a range of bottom conditions in the area. Stations C (water depth 230 m), B (536 m), and G (1,536 m) are located along the axis of the Bering Canyon, from the continental shelf to the middle bathyal depth (Table 1). Station M (103 m) was located on the landward side of the canyon and just below the area where high densities of krill, fish, seabirds, and whales were observed during the expedition. Station E2 (197 m) was located in a depression whose bottom topography was expected to accumulate organic matter derived from the ocean surface. Sampling was conducted using a multiple corer, which can collect eight sediment cores (7.4 cm inner diameter) simultaneously. On board, three core samples used for meiofaunal analysis were sliced down to 3 cm depth at 0.5-cm intervals to study vertical distribution patterns following the study on benthic foraminifera performed based on two out of these three sediment cores (Langlet et al., 2020). The sediment slices were immediately fixed and preserved in 4% borax buffered formaldehyde. At each station, two additional sediment cores were sliced at every 1 cm depth down to 5 cm; one was used for sedimentology and the other for organic matter analyses, including analysis of total organic carbon (TOC), total nitrogen (TN), C/N ratio [molar basis], stable isotope ratios (δ15N and δ13C), chlorophyll a, and pheopigments. The median grain size (Md) and mud percentage (%mud) were analyzed using a laser granulometer (SALD-2100, Shimadzu Corporation, Japan) according to the method described by Seike et al. (2018). The sediment samples used for TOC and TN concentrations and their isotopic compositions were freeze-dried, pulverized, decalcified, and weighed into pre-cleaned silver capsules (Nomaki et al., 2016; Nomaki et al., 2021). The TOC and TN contents were analyzed using an elemental analyzer (Flash EA 1112, Thermo Fisher Scientific, USA)), and the C/N ratio (molar) was determined using the measured TOC and TN values. Chlorophyll a and pheopigment concentrations were analyzed as reported by Langlet et al. (2020).
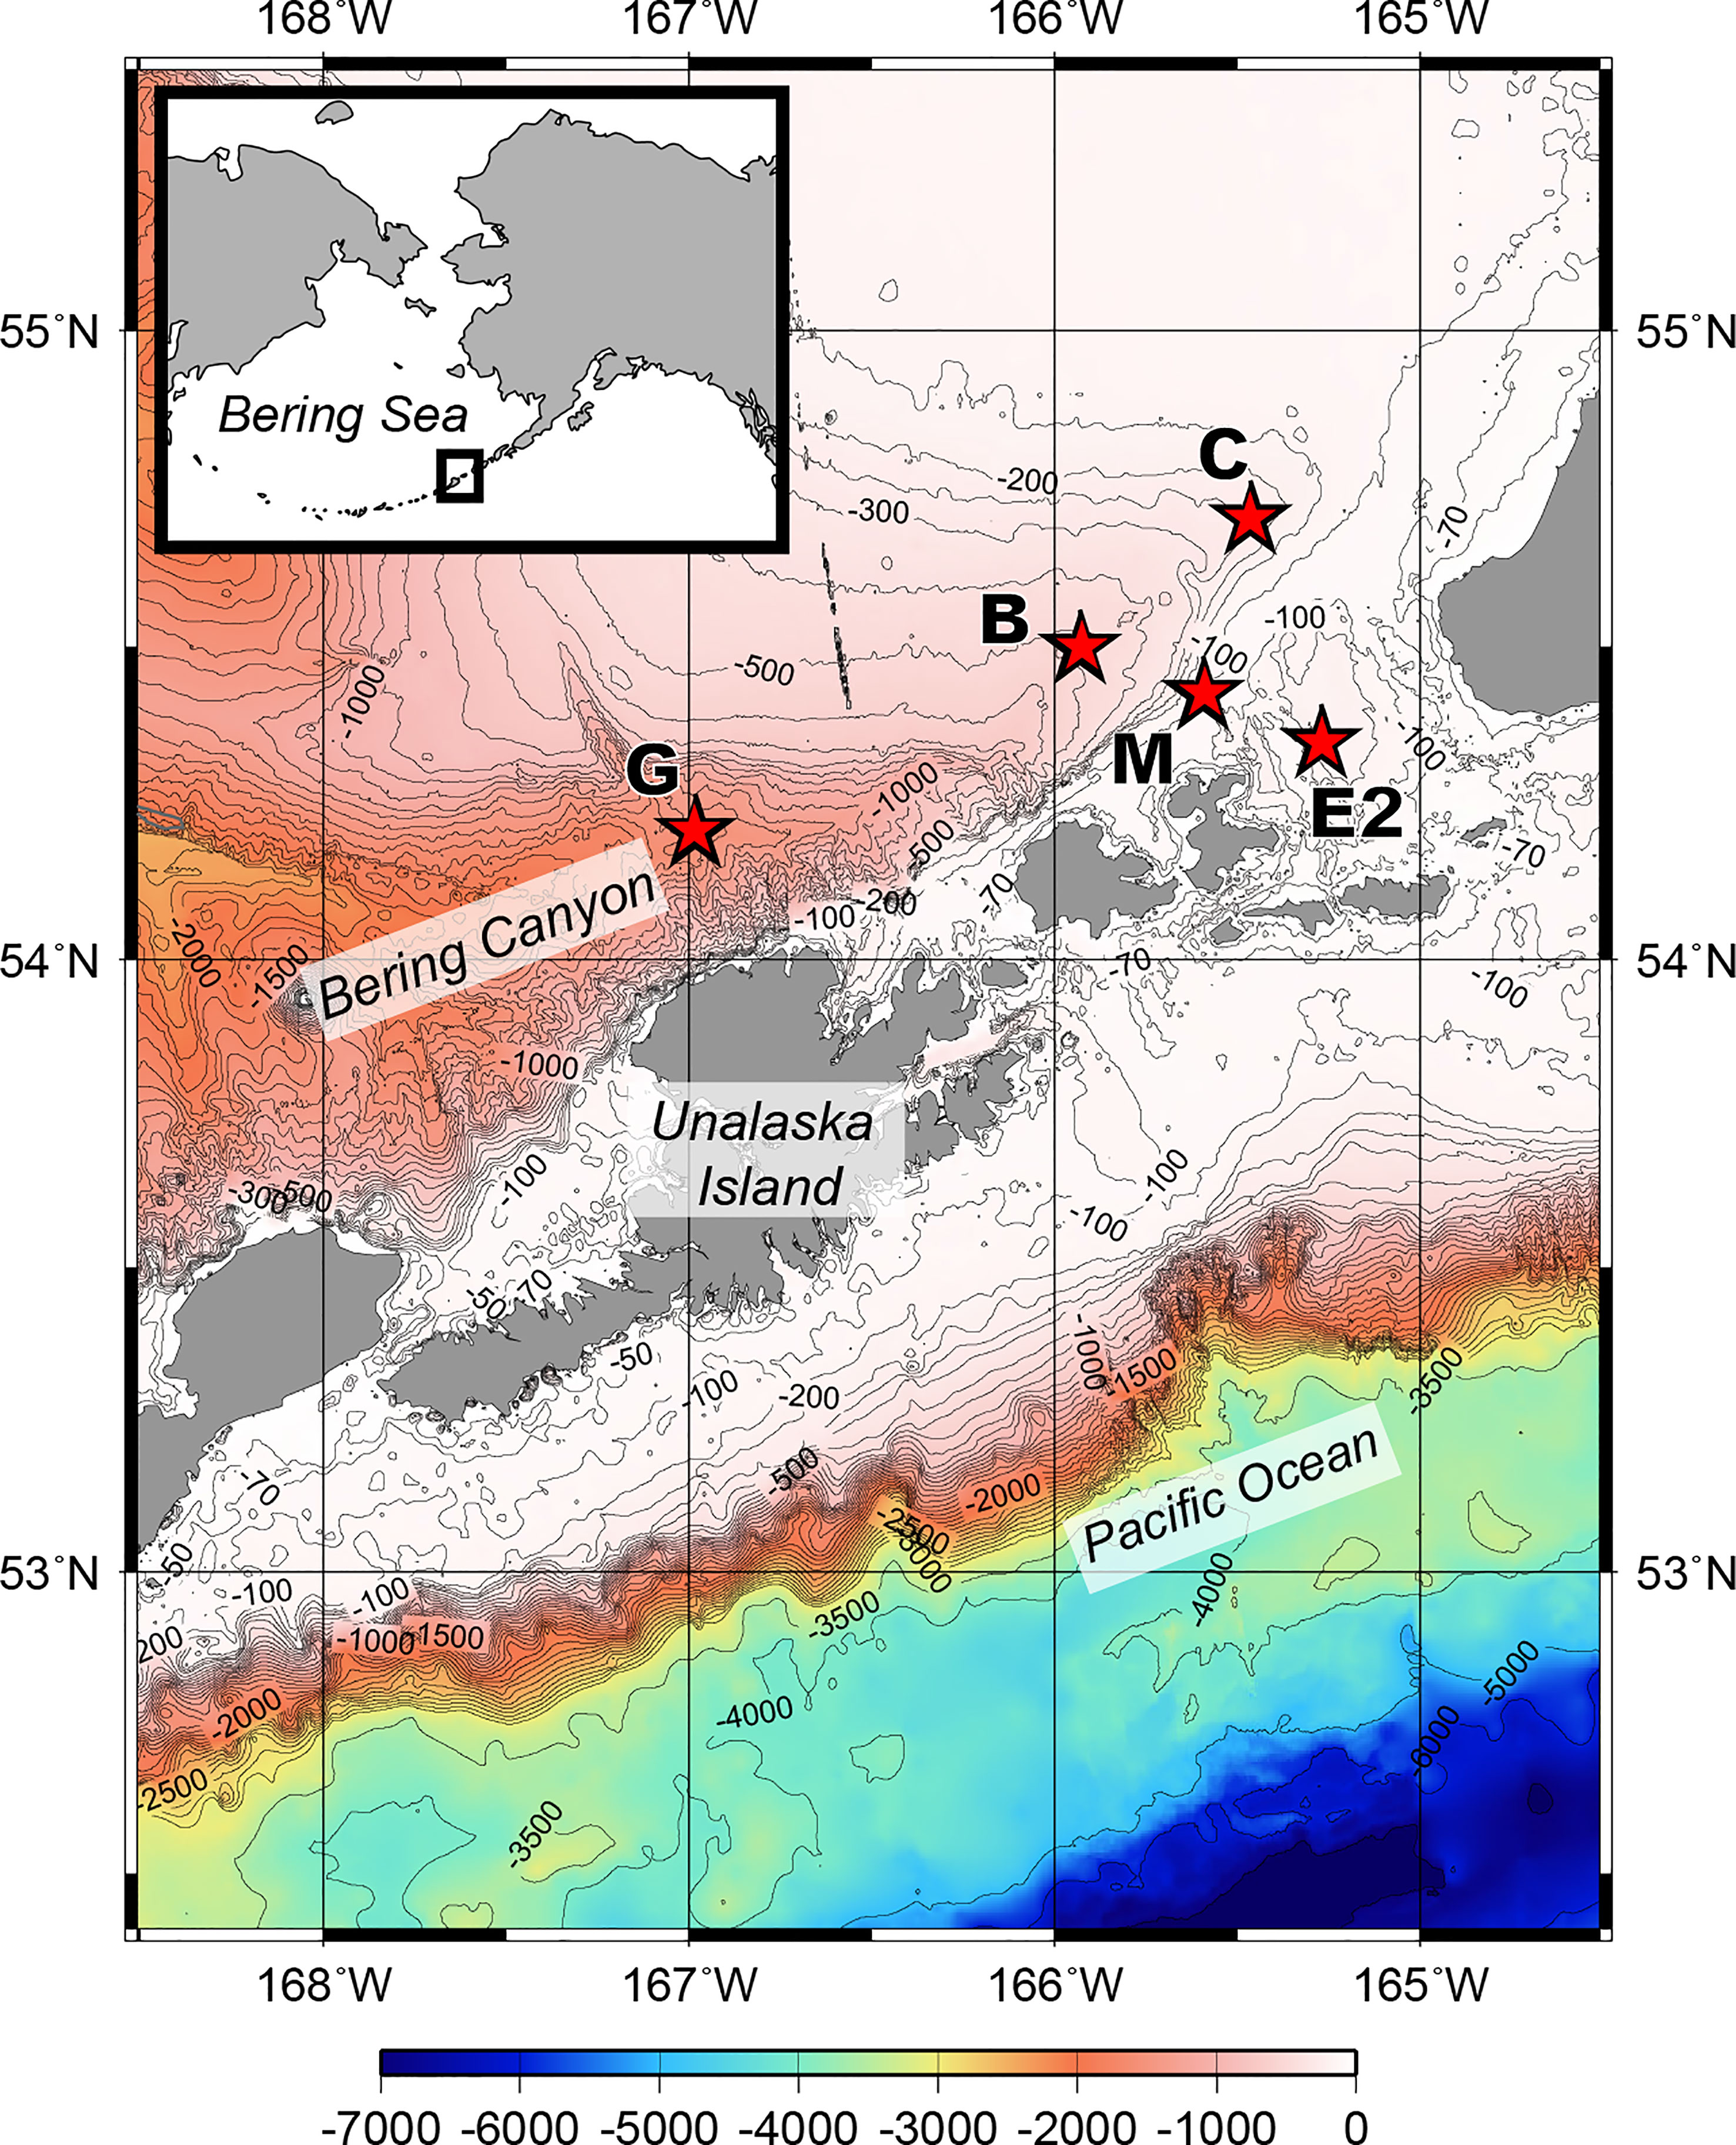
Figure 1 Bathymetric map of the southeastern Bering Sea showing the stations sampled for this study during R/V Mirai MR17-04 cruise Leg2 (JAMSTEC) from August 5 to 21, 2017.
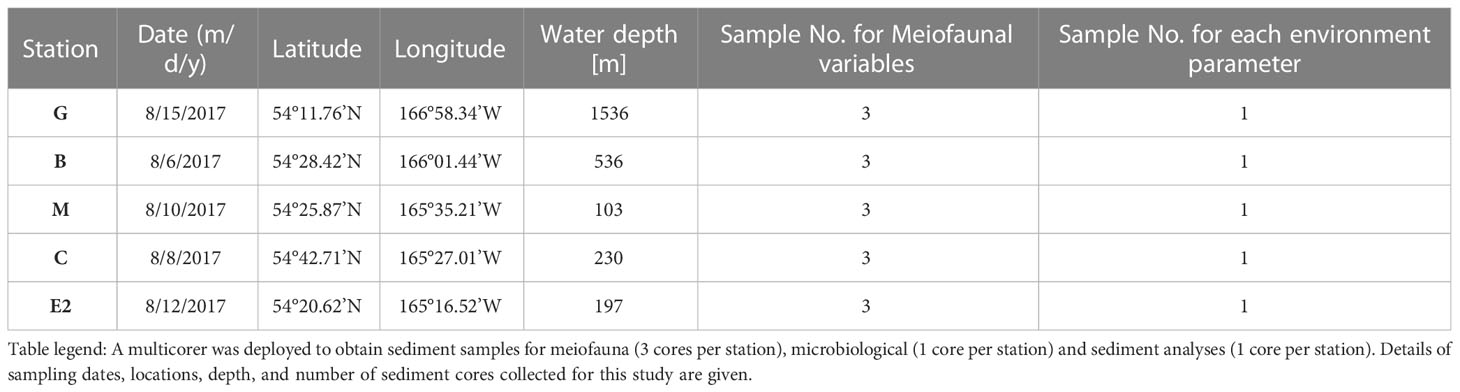
Table 1 Station list and sampling during R/V Mirai MR17-04 cruise Leg2 (JAMSTEC) from August 5 to 21, 2017 to the southeastern Bering Sea.
Another sediment core was processed for microbiological analyses at each station. Sediment cores were sectioned every 0.5 cm above 3 cm depth and every 1 cm from 3 to 10 cm depth in sediments, sampled in plastic bags, and immediately frozen and stored at –80°C.
2.2 Meiofaunal analyses
Metazoan meiofauna were extracted from the sediment by centrifugation with a 63 μm mesh and colloidal silica (Ludox HS40 [1.3 g/mL], Sigma-Aldrich, St. Louis, MO, USA) following the procedures detailed in Danovaro (2010). Extracted meiofauna in each supernatant were sorted and counted under a binocular stereo microscope. Because of the large volume of meiofauna present in the total sediment collected from each sliced sample, the sediment was usually split using a plankton splitter, and half or quarter of the sediments were analyzed. On average, ~250 individuals were sorted and identified in each sample (totally ~1500 individuals for each core). The counts of meiofaunal taxa were summarized as the abundance of each meiofaunal taxon (ind./10 cm2) in each of the three sediment layers (0–1, 1–2, and 2–3 cm) of each core sample (Table S1) for comparisons with the vertical profiles of sediment geochemical parameters, since most of these were measured at 1-cm intervals for one sediment core sample at each station, as mentioned above (see Table S2).
2.3 Direct counting of prokaryotic cells and virus-like particles
In the onshore laboratory, subsamples for direct prokaryotic cell and virus-like particle (VLP) counting were obtained by cracking frozen samples.
For direct prokaryotic cell counting, approximately 1 ml of the frozen sediment was suspended and fixed in phosphate buffered saline (PBS) with 3% neutralized formaldehyde in a 15-ml tube. The samples were then diluted 5-fold with 1 × PBS and sonicated for 20 s with an ultrasonic homogenizer (model UH-50; SMT, Tokyo, Japan). Prokaryotic cells in the aliquot were filtered through a 0.2-μm pore-size membrane filter (GTBP, Merck, Darmstadt, Germany) and then stained with SYBR Green I (Lonza, Basel, Switzerland) at room temperature for 10 min in darkness. Excess dye was flushed from the membrane by rinsing it with another aliquot of 1 × PBS.
To enumerate VLP abundance, a previously described method was applied with minor modifications (Danovaro & Middelboe, 2010; Middelboe et al., 2011; Yanagawa et al., 2014; Yoshida et al., 2018). Briefly, approximately 1-2 ml of frozen sediment was promptly suspended in 10 ml of modified SM buffer (50 mM Tris-HCl, pH 7.5, 10 mM MgSO4, and 100 mM NaCl) containing 5 mM tetrasodium pyrophosphate in a 50-ml centrifuge tube. The slurry was shaken with a ShakeMaster Auto (BioMedical Science, Tokyo, Japan) for 1 min at maximum speed and then sonicated for 1 min with an ultrasonic homogenizer (UH-50; SMT Company, Tokyo, Japan) to detach viral particles from the sediment matrices (Middelboe et al., 2011). After centrifugation for 5 min at 700 × g, microbial cells in the supernatant were removed using a 0.22-μm pore size filter cartridge (Millipore). The cell-free filtrate (approximately 6 ml) was subjected to DNase I treatment (final concentration of 0.01 U/μl; Roche, Mannheim, Germany) for 15 min in darkness to reduce the background fluorescence of extracellular DNA (Danovaro and Middelboe, 2010). The samples were then fixed with 150 μl of 25% glutaraldehyde. VLPs in the sample were filtered with a 0.02-µm pore size Anodisc filter (GE Healthcare, Piscataway, NJ, USA) and then stained with 10× SYBR Gold (Invitrogen, Eugene, OR, USA; Chen et al., 2001) for 15 min in darkness.
For both direct cell and VLP counting, filters were mounted on glass slides with a drop of a solution of 50% PBS and 50% glycerol. In addition, for VLP count samples, 0.5% (final concentration) p-phenylenediamine (Sigma-Aldrich, St. Louis, MO, USA) was also added to minimize fading (Noble and Fuhrman, 1998). Microscopic observations were performed using an Olympus BX53 fluorescence microscope (Tokyo, Japan). Microbial cells and VLP were counted in 10-30 fields for each filter.
2.4 Data for comparisons
Soltwedel (2000) summarized quantitative information on the abundance of metazoan meiofauna along continental margins, reported until the 1990s. Based on these data, the author showed a significant overall relationship between log-transformed meiofaunal density and water depth along continental margins.
Soltwedel (2000) found another significant regression based exclusively on data from eutrophic polar regions.
Although there were variations in the sampling devices used, sampling depth, and size limits for meiofauna among those studies, these equations were adopted in this study to estimate the expected meiofaunal abundance at the same depths as our sampling sites for overall comparisons.
As mentioned previously, no comparative systematic data on meiofaunal abundance has been reported for the Bering Sea. Instead, those reported from sites within a depth range comparable to that of the present study in the adjacent Arctic Sea were used for comparison with our data.
2.5 Univariate and multivariate analyses
A Nonparametric Kruskal-Wallis test, was conducted to test the null hypothesis that the total metazoan meiofaunal abundance in the top 3 cm of sediment did not differ between stations based on three replicates at each station, since the normality and homogeneity of variance between samples are usually unexpected for meiofaunal variables (Zar, 2010). The analysis was performed using R version 4.1.2 (https://www.r-project.org/). Because the sediment layers in each core sample were not independent of each other (cf. Zar, 2010), they were not considered in this analysis.
PRIMER7 software with the add-on package PERMANOVA + (PRIMER-E Ltd., Plymouth, UK) was used for multivariate analyses of the meiofaunal community structure. The Bray–Curtis index was used as the similarity index based on log (x+1) transformed values of abundance of each meiofauna taxon to focus on rare and abundant taxa (cf. Clarke et al., 2014).
Nonmetric MDS (nMDS) was used to assess similarities in meiofaunal community structures among the samples. One-way PERMANOVA was conducted to test the null hypothesis that meiofaunal communities did not differ among the stations (Anderson et al., 2008). SIMPER analysis was used to examine individual taxon contributions to the similarities between samples at each station (Clarke et al., 2014).
In these three analyses, differences between sediment layers were not considered because of the non-independence between sediment layers in the same core sample at each station. Instead, the summed abundance of each taxon in the 0–3 cm sediment was used.
DISTLM was used to determine the best-fit models and partition variance in the response variables (meiofaunal taxa) to assign proportional effects to the measured environmental factors (Anderson et al., 2008).
Sediment geochemical parameters (Md, mud%, TOC concentration, C/N ratio [mol], chlorophyll a, total pigments (chlorophyll a + pigments), and δ15N and δ13C values of total nitrogen and total organic carbon in sediment, respectively), VLP, and prokaryote cell number in sediment, their ratio (V/P), bottom water oxygen concentration (BWO), and water depth were considered in the analysis (Tables S1, S2). The relative values of total pigments per TOC mass [nmol./μg TOC] were also considered as indicators of the availability of fresh organic matter (Table S2), since their associations with the benthic foraminiferal communities at the same stations have already been studied (Langlet et al., 2020).
Because of the limited available data for the environmental factors (N=1) and non-independence between sediment layers in the same core sample, the mean density of each taxon and mean values of geochemical factors in the top 3 cm sediment (except chlorophyll a, total pigments, BMO, and depth, for which one value was available at each station) were used in the analysis (N=5). The values of the environmental factors were not transformed, as PERMANOVA+ automatically normalizes each environmental factor when running the DISTLM (Anderson et al., 2008).
In DISTLM, the marginal test was performed for each of the all environmental factors separately as the first step. In the sequential test, for the next step, the forward selection procedure was used to determine the best combination of predictor variables to explain variation in meiofaunal structure data and to partition the variation explained by the selected predictor variables based on the selection criterion (Akaike information criterion [AIC] in this study).
Before DISTLM was carried out, Draftsman Plots were created for all pairs of environmental factors. They showed that TOC, TN, chlorophyll a, mud%, and water depth were highly correlated with each other (r ≥ 0.95). Because these factors seem to be associated with the amount of organic matter deposited in the sediment, TOC was chosen as the representative factor in the sequential test (cf. Anderson et al., 2008).
Similarly, among C/N, δ13C, and δ15N with high correlations, C/N was chosen as an indicator of organic matter quality for the sequential test. The total pigment was chosen instead of BWO, which was highly correlated with the former. Finally, TOC, C/N, VLP, V/P, Md, total pigments, and pigments/TOC were considered in the sequential test.
dbRDA was used to ordinate fitted values from the models selected by sequential tests and to show the gradient in the meiofaunal communities among samples that could be modeled by the selected environmental factors (Anderson et al., 2008).
3 Results
3.1 Bathymetric patterns in total abundance of metazoan meiofauna
The relationships between bathymetric depth and mean abundance of total metazoan meiofauna in the top 3 cm of the sediment layer are shown in Figure 2. Lower abundances were observed at stations M and C (486 ± 85 and 590 ± 184 ind./10 cm2, respectively, on average [ ± SD]) and higher abundances at Stations E2, B and G (1084± 257, 1022 ± 430, and 806 ± 130 ind./10 cm2). A common trend of declining meiofaunal abundance with increasing water depth was not observed in the study area; no significant difference was detected in total meiofaunal abundances between stations (Kruskal-Wallis Test: P > 0.05). These observed abundances were generally larger than the expected values at comparable depths calculated using the equation by Soltwedel (2000) based on the worldwide-compiled data (gray line in Figure 2), except at Station M, the shallowest site in this study. All these observed abundances were smaller than those calculated based on the regression line (dotted line in Figure 2) based on previous data from the polar regions (Soltwedel, 2000). However, the observed meiofaunal densities in the Bering Sea were within the range of those recently observed at other Arctic Ocean sites with comparable water depths, which are connected to the Bering Sea (Figure 2).
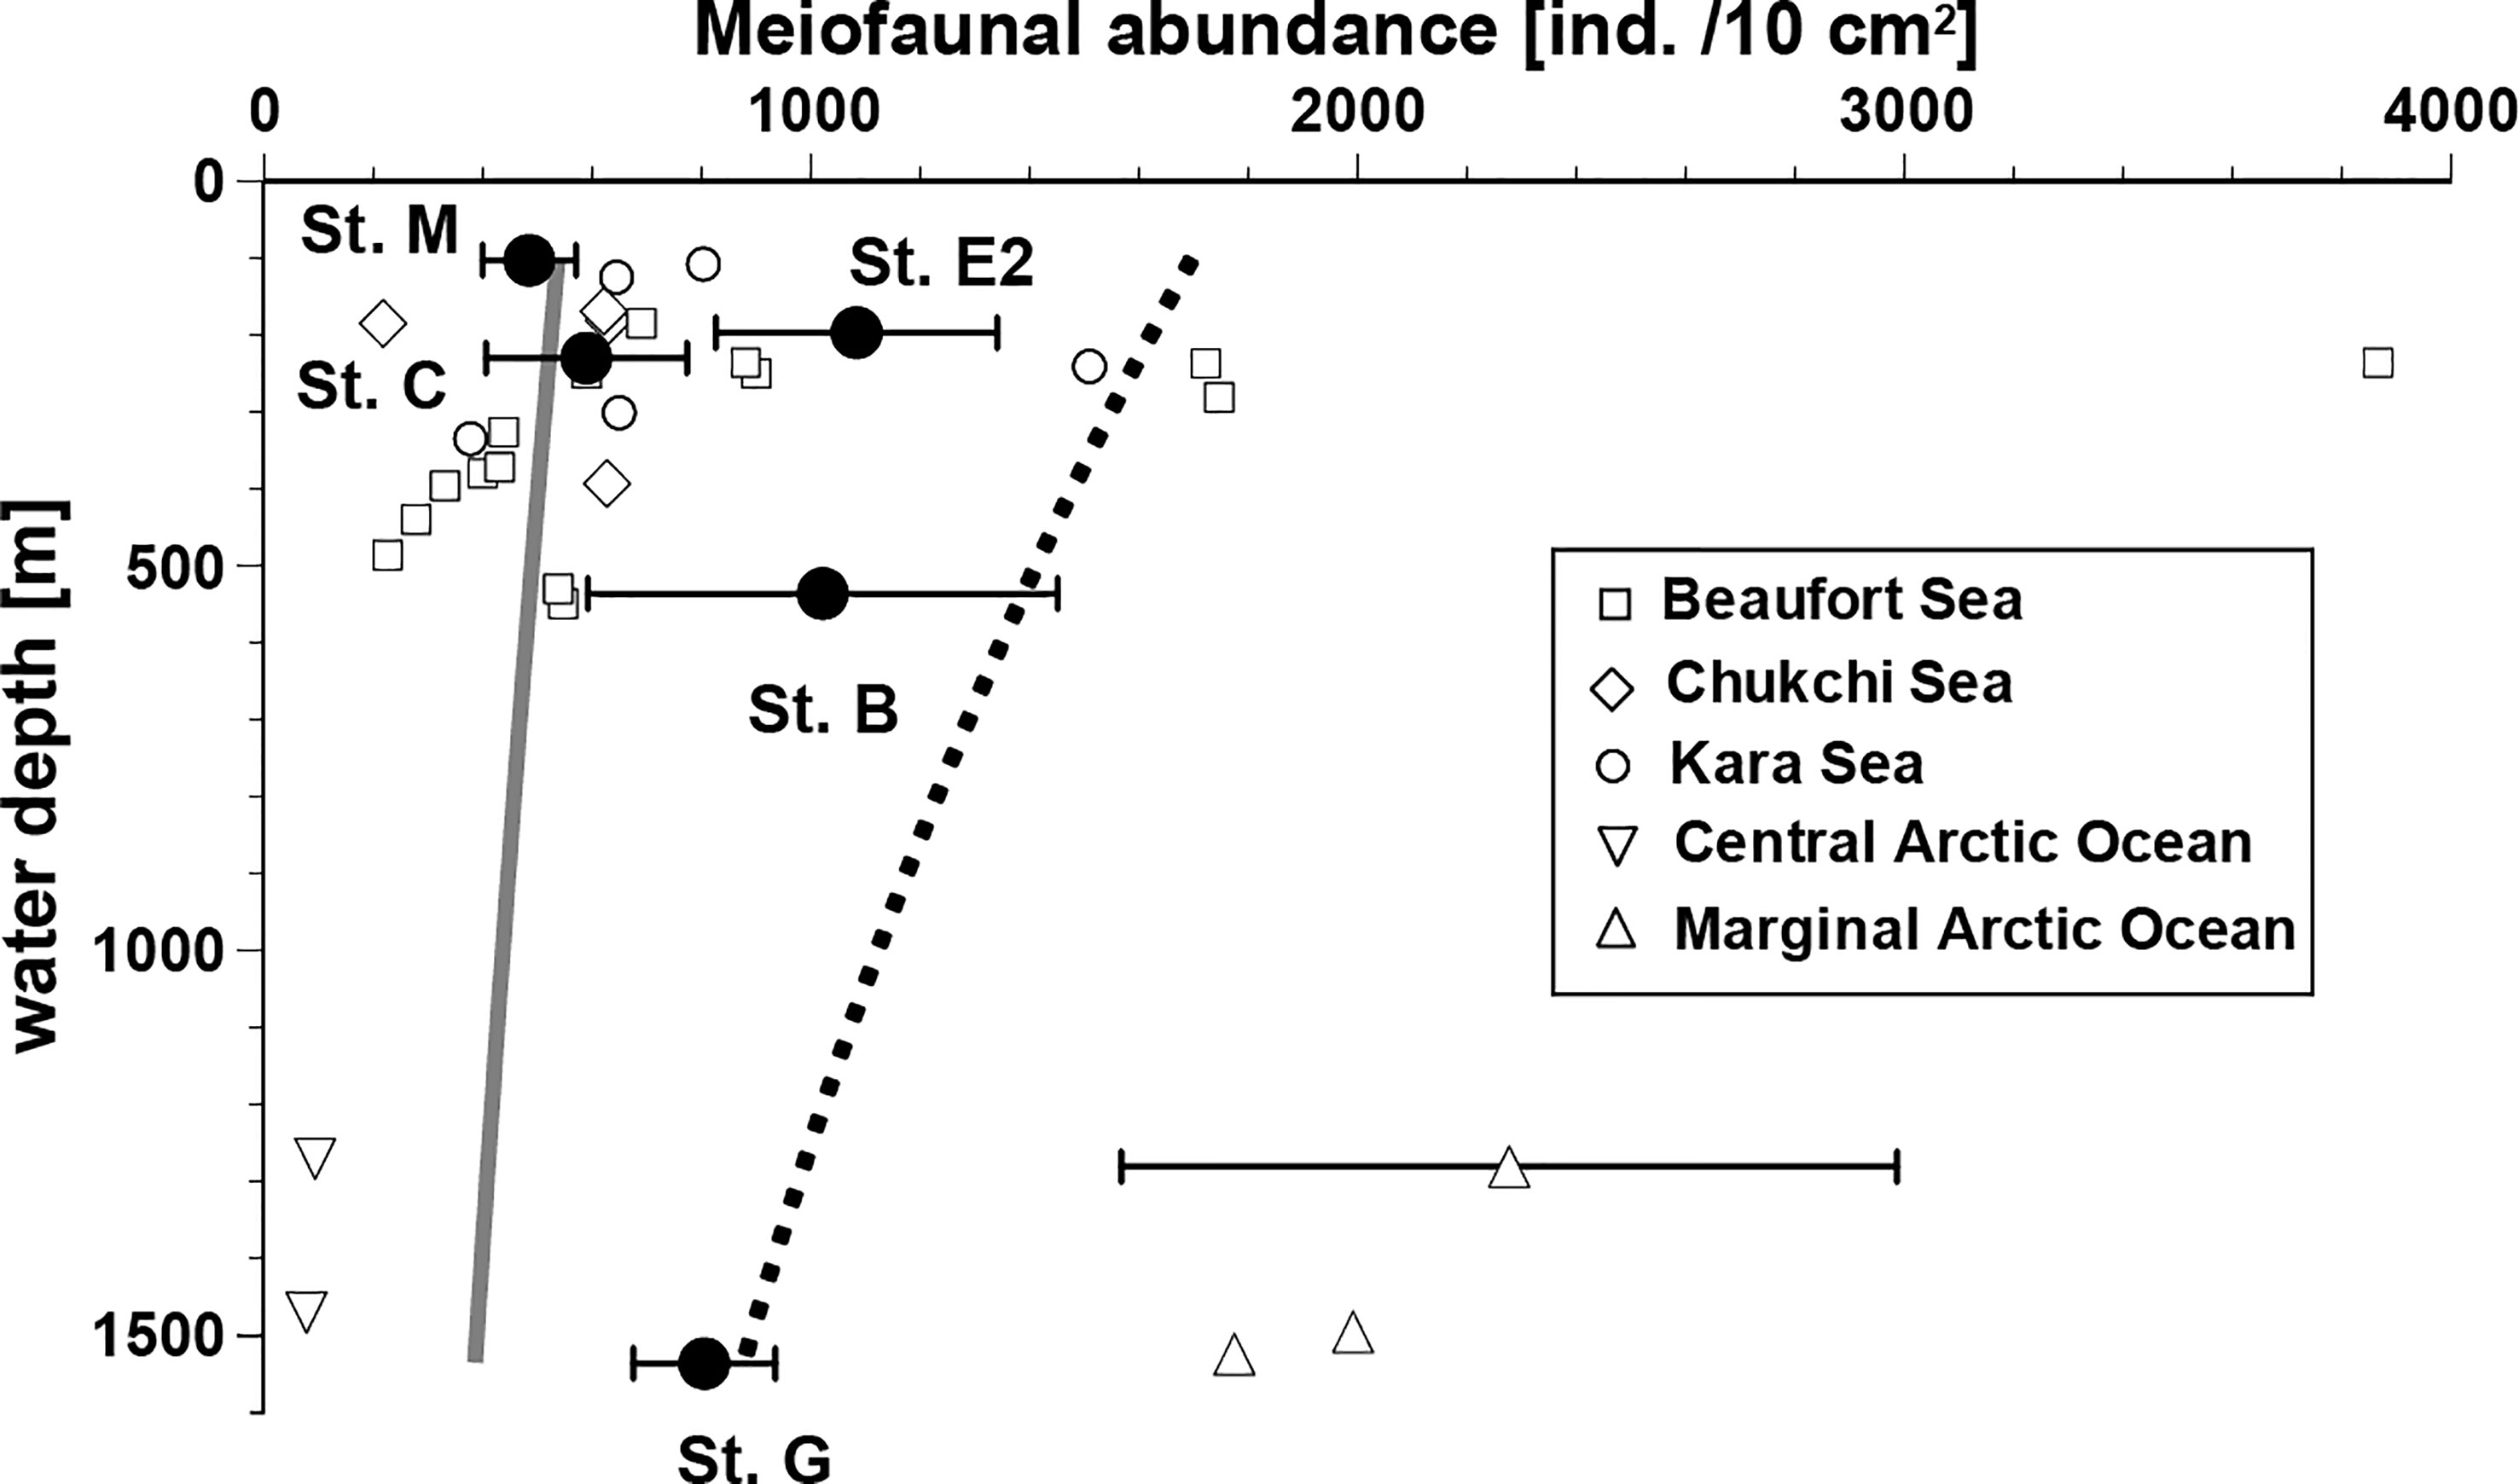
Figure 2 Relationships between water depth and total meiofaunal abundance (mean ± SD, if replicate data available) in the southeastern Bering Sea and in the other sites with similar depths in the adjacent Arctic Seas. Data from the other seas in the Arctic Ocean were obtained from the following sources: Beaufort Sea, Bessière et al. (2007); Chukchi Sea, Lin et al. (2014) and Huang et al. (2021); Kara Sea, Portnova and Polukhin (2018); Central Arctic Ocean, Schewe (2001); Marginal ice zone of Arctic Ocean, Hoste et al. (2007) and Soltwedel et al. (2020). The gray line presents estimated meiofaunal abundances using an equation based on a worldwide data set. The abundances presented by the dotted line are inferred from an equation based on data from eutrophic polar regions, only. Both applied equations were introduced by Soltwedel (2000).
3.2 Vertical profiles and spatial difference of meiofaunal communities in sediments and their associations with environment factors
Total metazoan meiofauna were concentrated in the uppermost 1-cm layer of the sediment and decreased with sediment depth at all investigated stations, but relatively higher densities were also observed in the deeper layers at Stations G and E2 (Figure 3). On average, nematodes were the most abundant taxon in all sediment layers at all stations, particularly in the deeper layers, where their frequencies often exceeded 90%, with a maximum of 98% at the deepest station, G. The other taxa tended to concentrate more strongly in the top 1-cm layer. Among them, benthic copepods and nauplii comprised, on average, 19% and 13% of total individuals in the surface layer, respectively. Taxa other than nematodes were rare in the deeper sediment layers, but relatively higher frequencies of copepods were observed in the deeper layers at some stations, particularly Station C (around 20%).
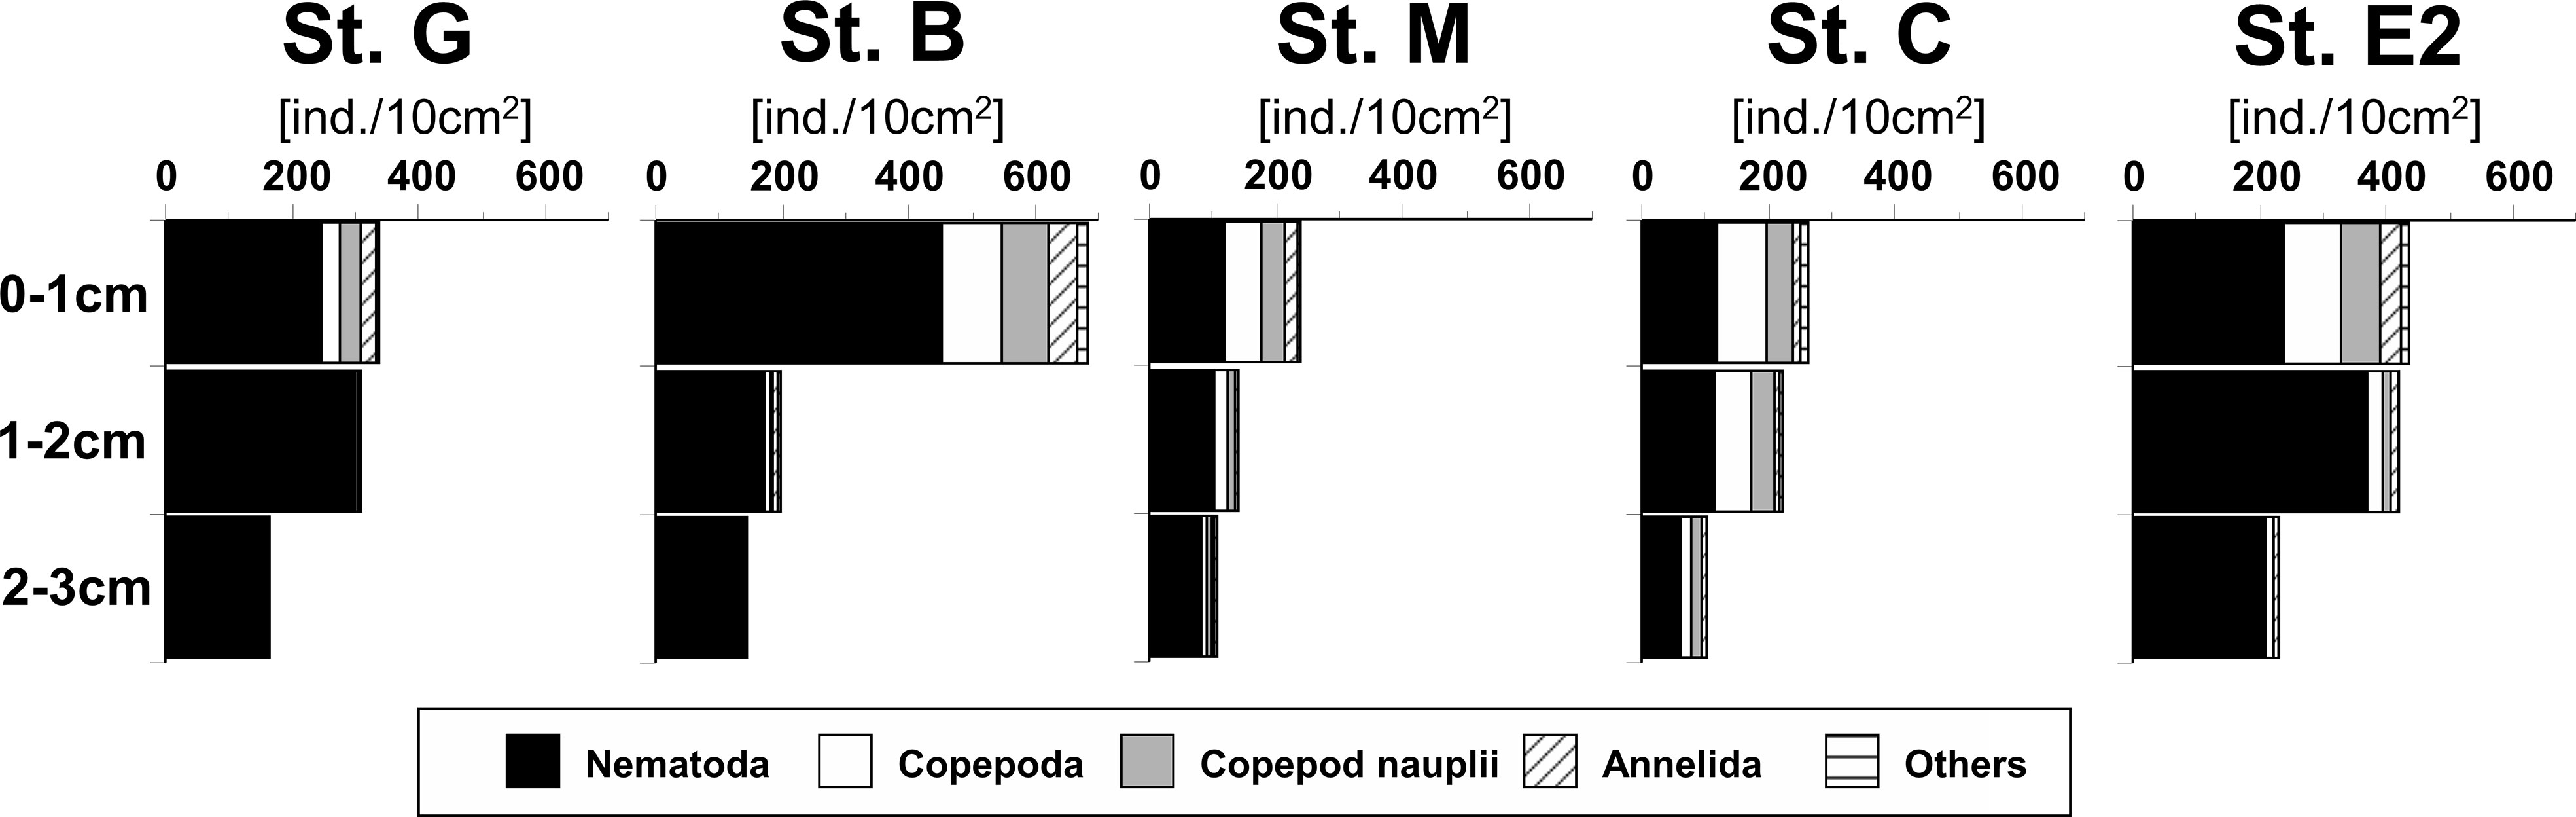
Figure 3 Vertical profiles of cumulative mean abundances of main meiofaunal taxa in the sediment at five stations in the southeastern Bering Sea. “Others” contain taxa with frequencies< 1% such as Kinorhyncha and Ostracoda. Details of densities of all meiofaunal taxa in each sediment layer of all core samples are shown in Table S1.
One-way PERMANOVA detected a significant difference between stations when the pooled abundances of meiofauna taxa in the top 3 cm sediment layer in each core sample were considered (P< 0.01, Figure 4A). No pair-wise test between each pair of stations could detect any significant difference because of the limited sample number (N=3 for each station).
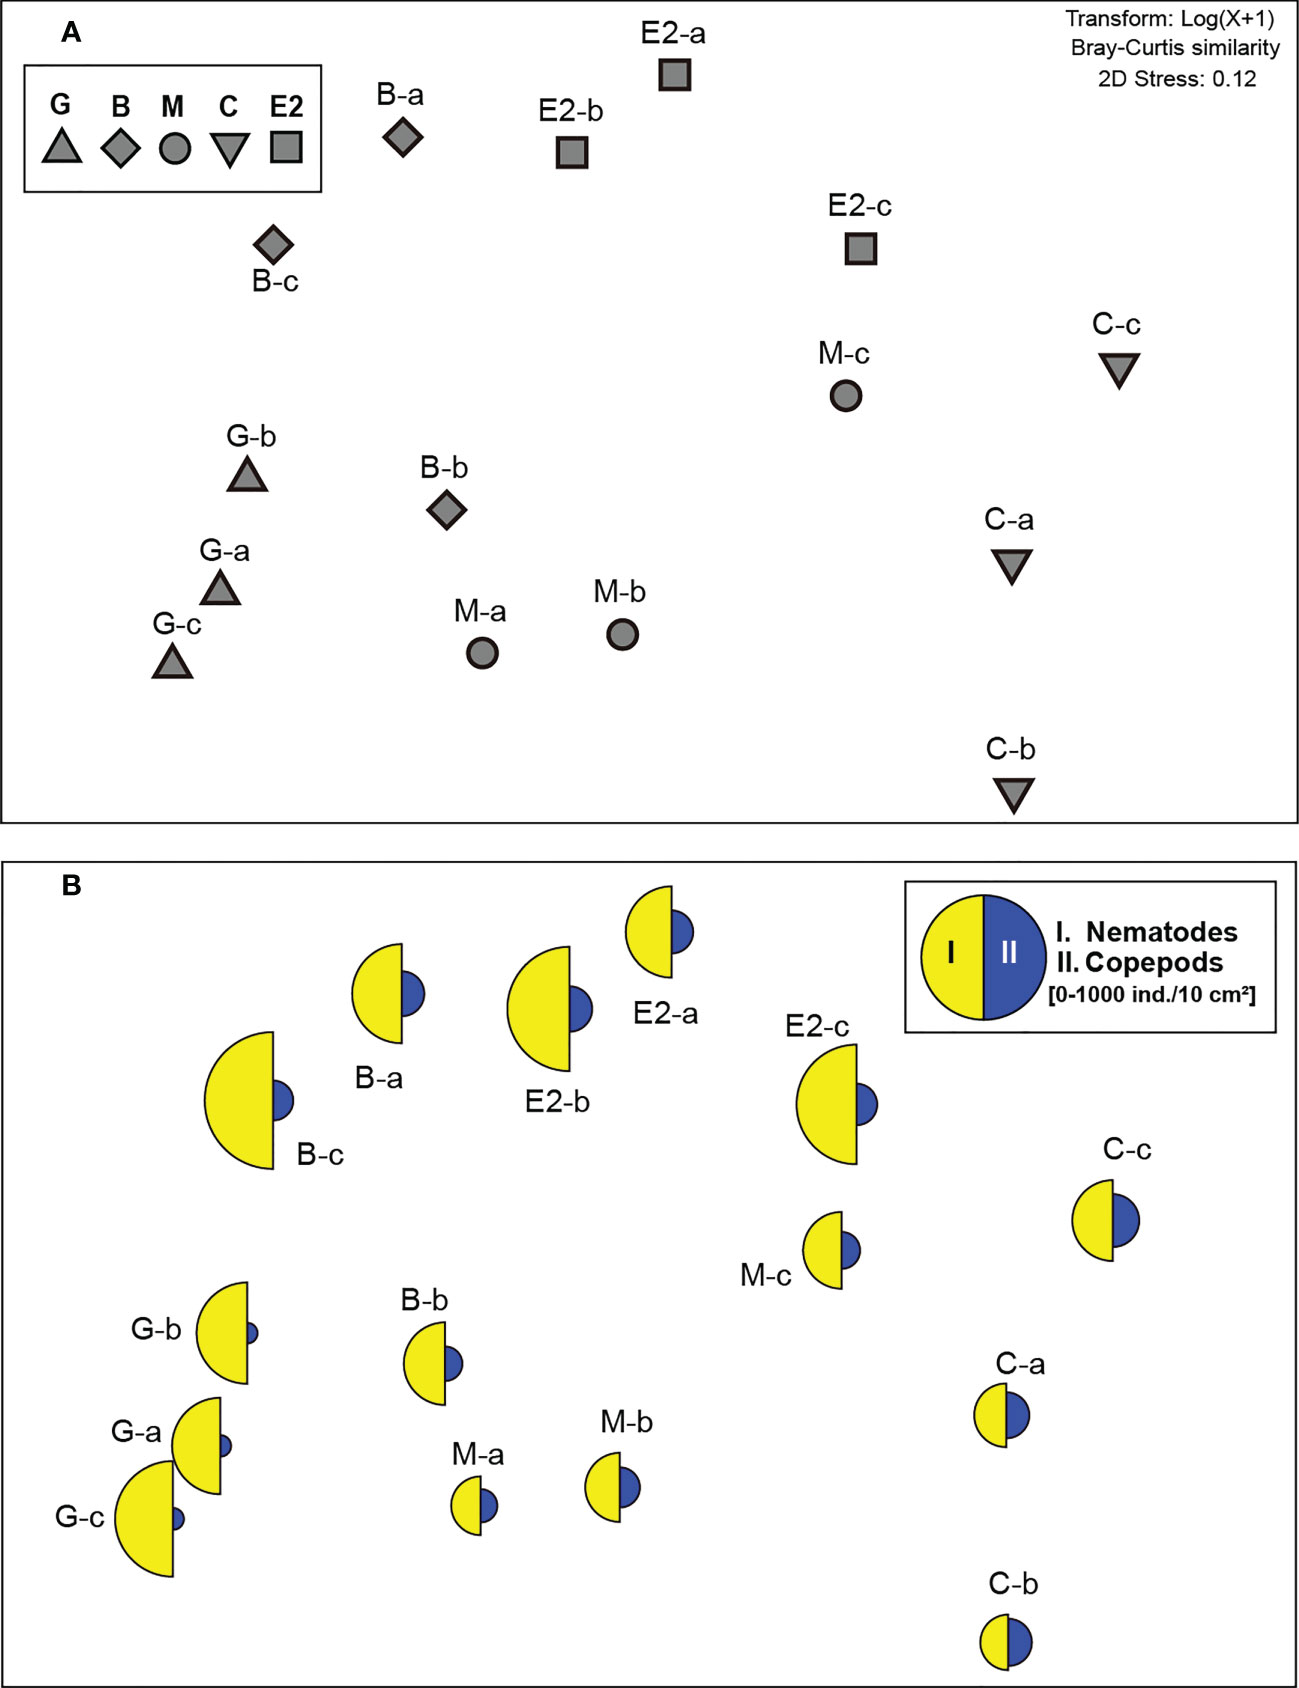
Figure 4 Two-dimensional non-metric multidimensional scaling (nMDS) ordination of meiofaunal communities (0–3 cm sediment depth) at higher taxonomic level in samples from the southeastern Bering Sea. (A) Ordination of single core samples (a–c) from stations G, B, M, C, and E2. (B) Superimposed segmented bubble plot for taxa that mainly contributed to the mean similarity in meiofaunal community structure within each station (detected by SIMPER analysis: I. Nematodes, II. Copepods).
SIMPER analysis detected that the nematodes contributed most strongly to the average similarities in meiofaunal communities at all stations (26.2−35.6%, Figure 4B). The contribution of copepods was detected as the second or third highest (18.6−24.0%, Figure 4B).
Vertical changes in the environmental factors along the sediment depth are shown in Figure 5. TOC and TN concentrations of organic matter, chlorophyll a, and pheopigments were higher at stations with finer sediment particles, most of which were composed of muds (Stations G and B). On the other hand, C/N, δ13C and δ15N of organic matter did not show clear differences in their vertical profiles between stations. However, the relation of total pigments per µg TOC (Pig./TOC), an indicator for fresh organic matter of photosynthetic origin which was calculated for the first sediment centimeter, was highest at station E2.
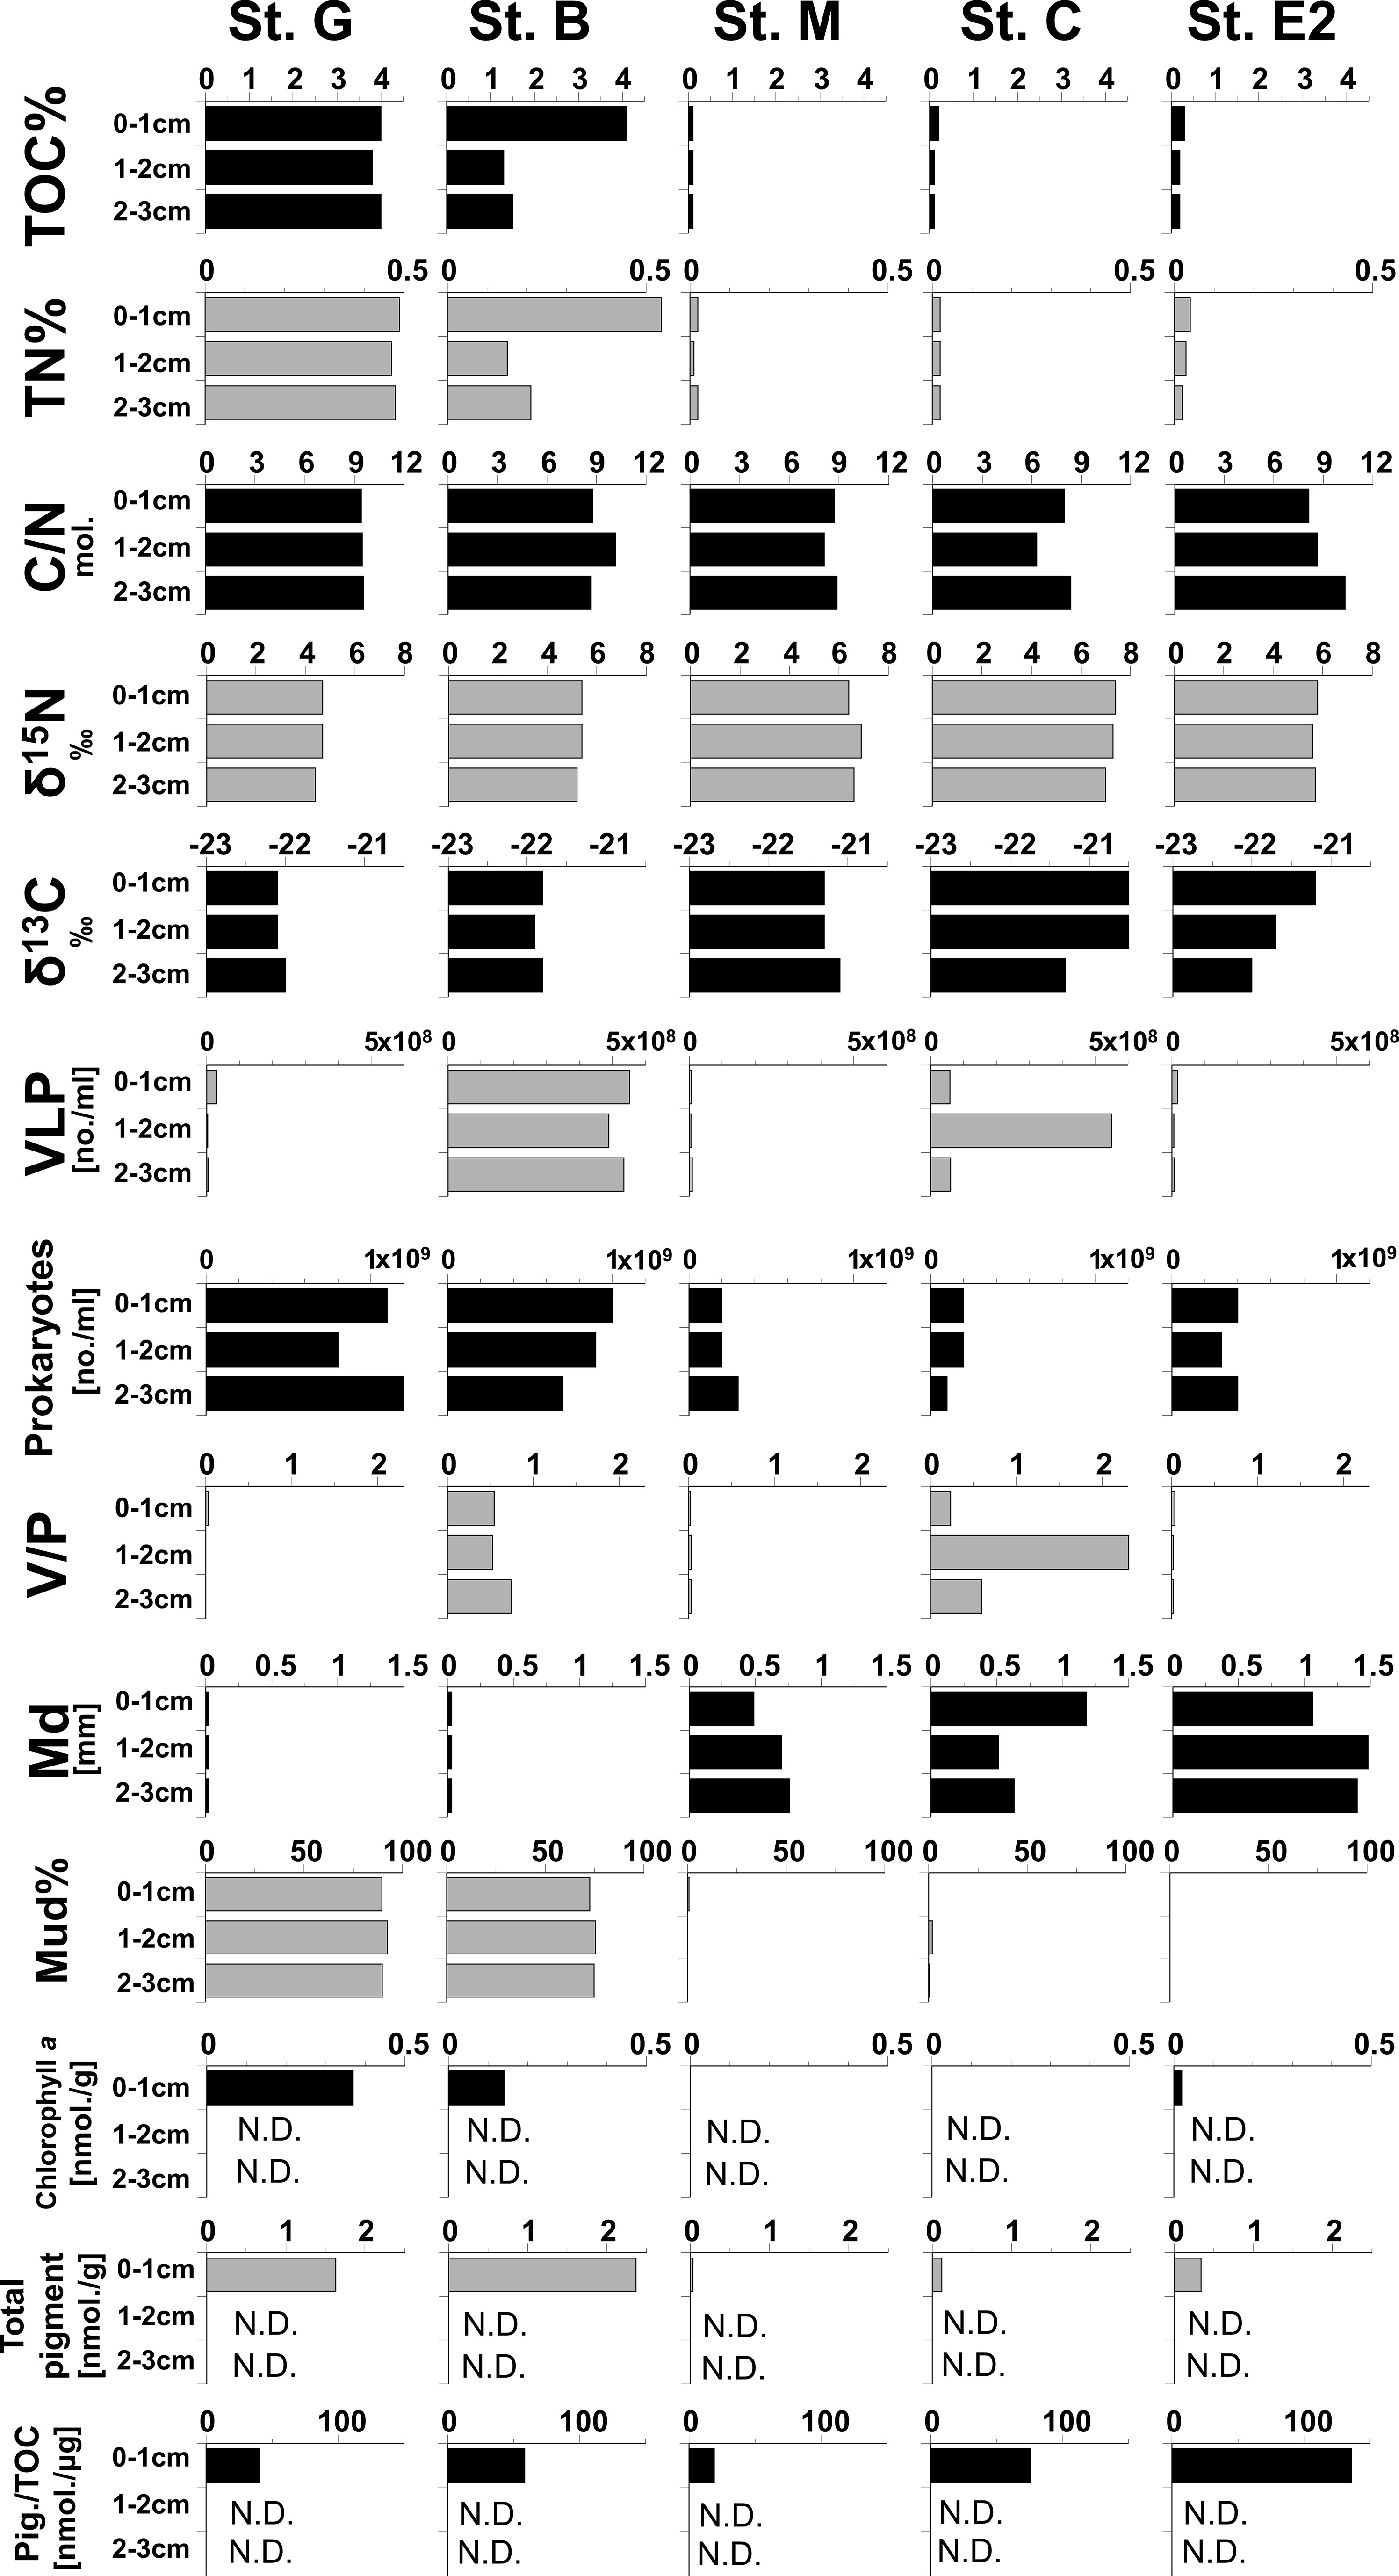
Figure 5 Vertical profiles of geochemical parameters in sediments at five stations in the southeastern Bering Sea. VLP: Virus-like particles, V/P: ratio of numbers of VLP/Prokaryotes, Total pigments: Chlorophyll a + pheopigments, Pig./TOC: Total pigments per μg of TOC in sediment. The data of these parameters are shown in Table S2.
When each of the investigated environmental factors was considered separately, most of the indicators of the quantities or qualities of organic matter, such as TOC, TN, prokaryote number, C/N, δ13C, and δ15N values of organic matter in the sediment, were found to be significantly associated with meiofaunal community structure (Ps<0.05, the marginal tests in Table 2).
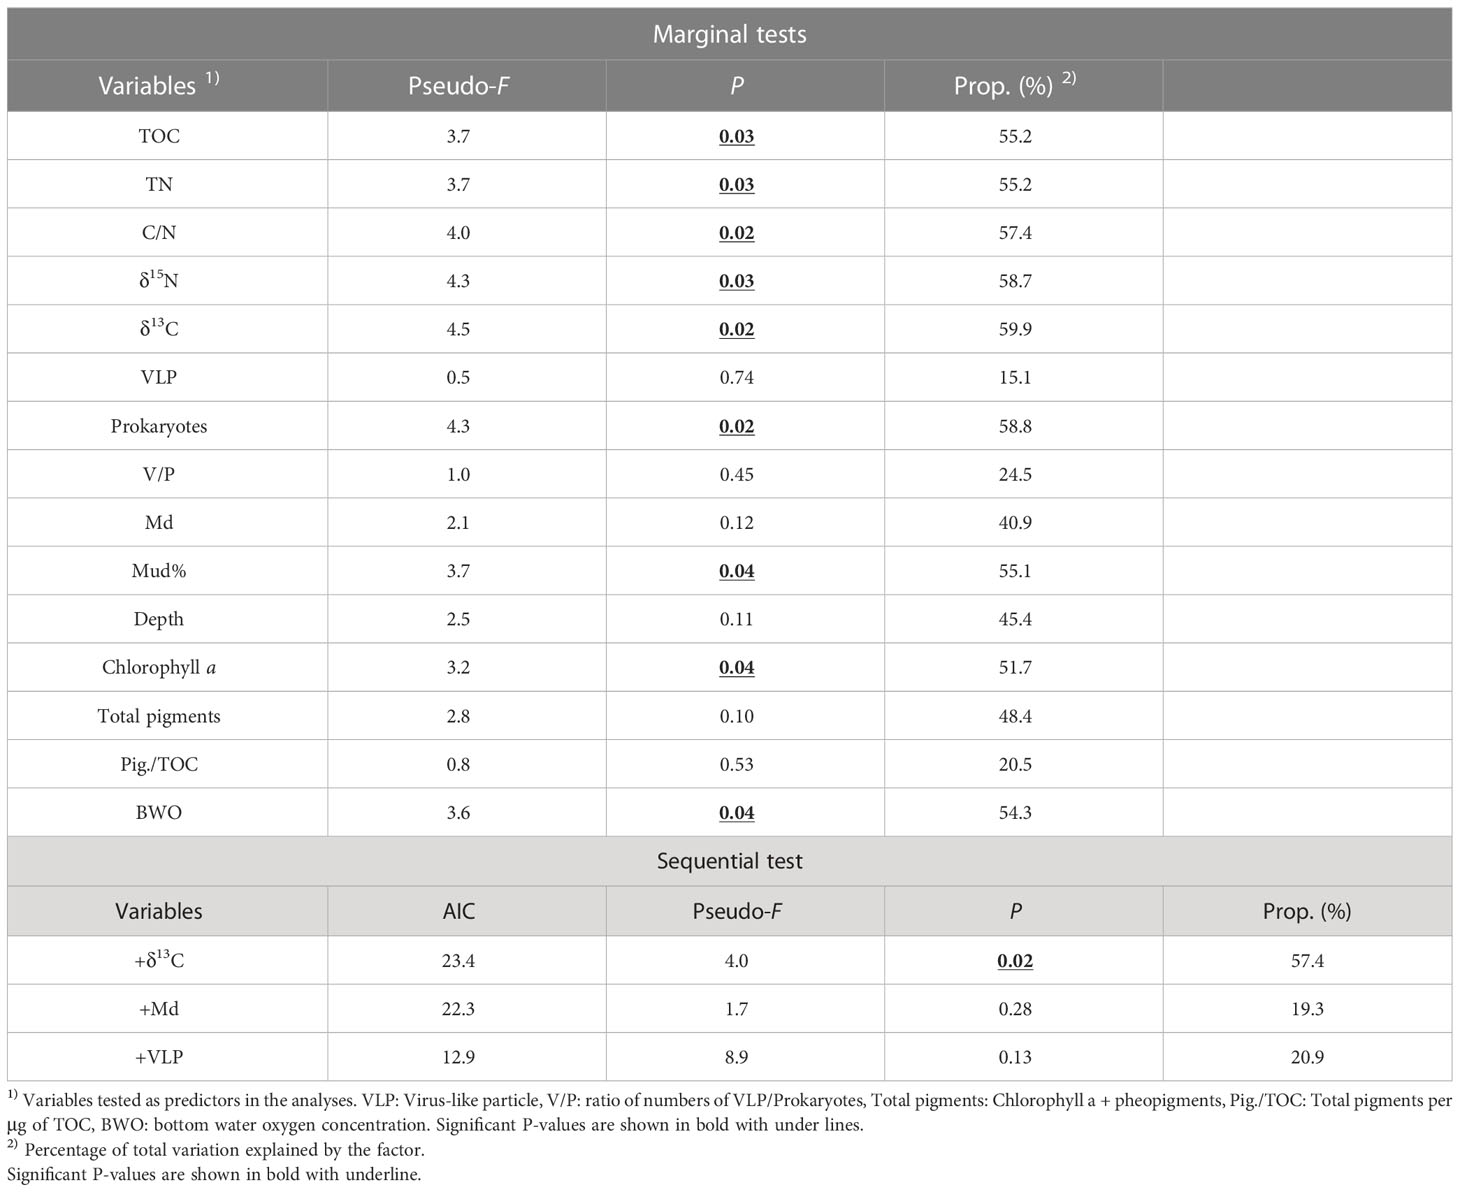
Table 2 Distance-based linear model (DISTLM) analyses of meiofaunal community structure and their explanation by environmental parameters at five stations in the southeastern Bering Sea.
Among the environmental factors chosen for the sequential test (TOC, C/N, VLP, V/P, Md, Total pigments, and Pigments/TOC, see Section 2.5), DISTLM selected only C/N values of organic matter in sediment as the significant parameter that explained 57.4% of meiofaunal community structure (Table 2). Md and VLP abundances were selected as the second and third factors in the selection procedure, although their significance was not revealed (Table 2).
dbRDA showed that 98% of the differences in the overall mean abundances of meiofaunal taxa among the five stations were explained along the gradients of the three factors. In general, a higher abundance of nematodes was observed at stations with higher C/N ratios, and copepod frequencies seemed to be higher in the coarser sediment bottom, partly with a higher number of VLP (Figure 6).
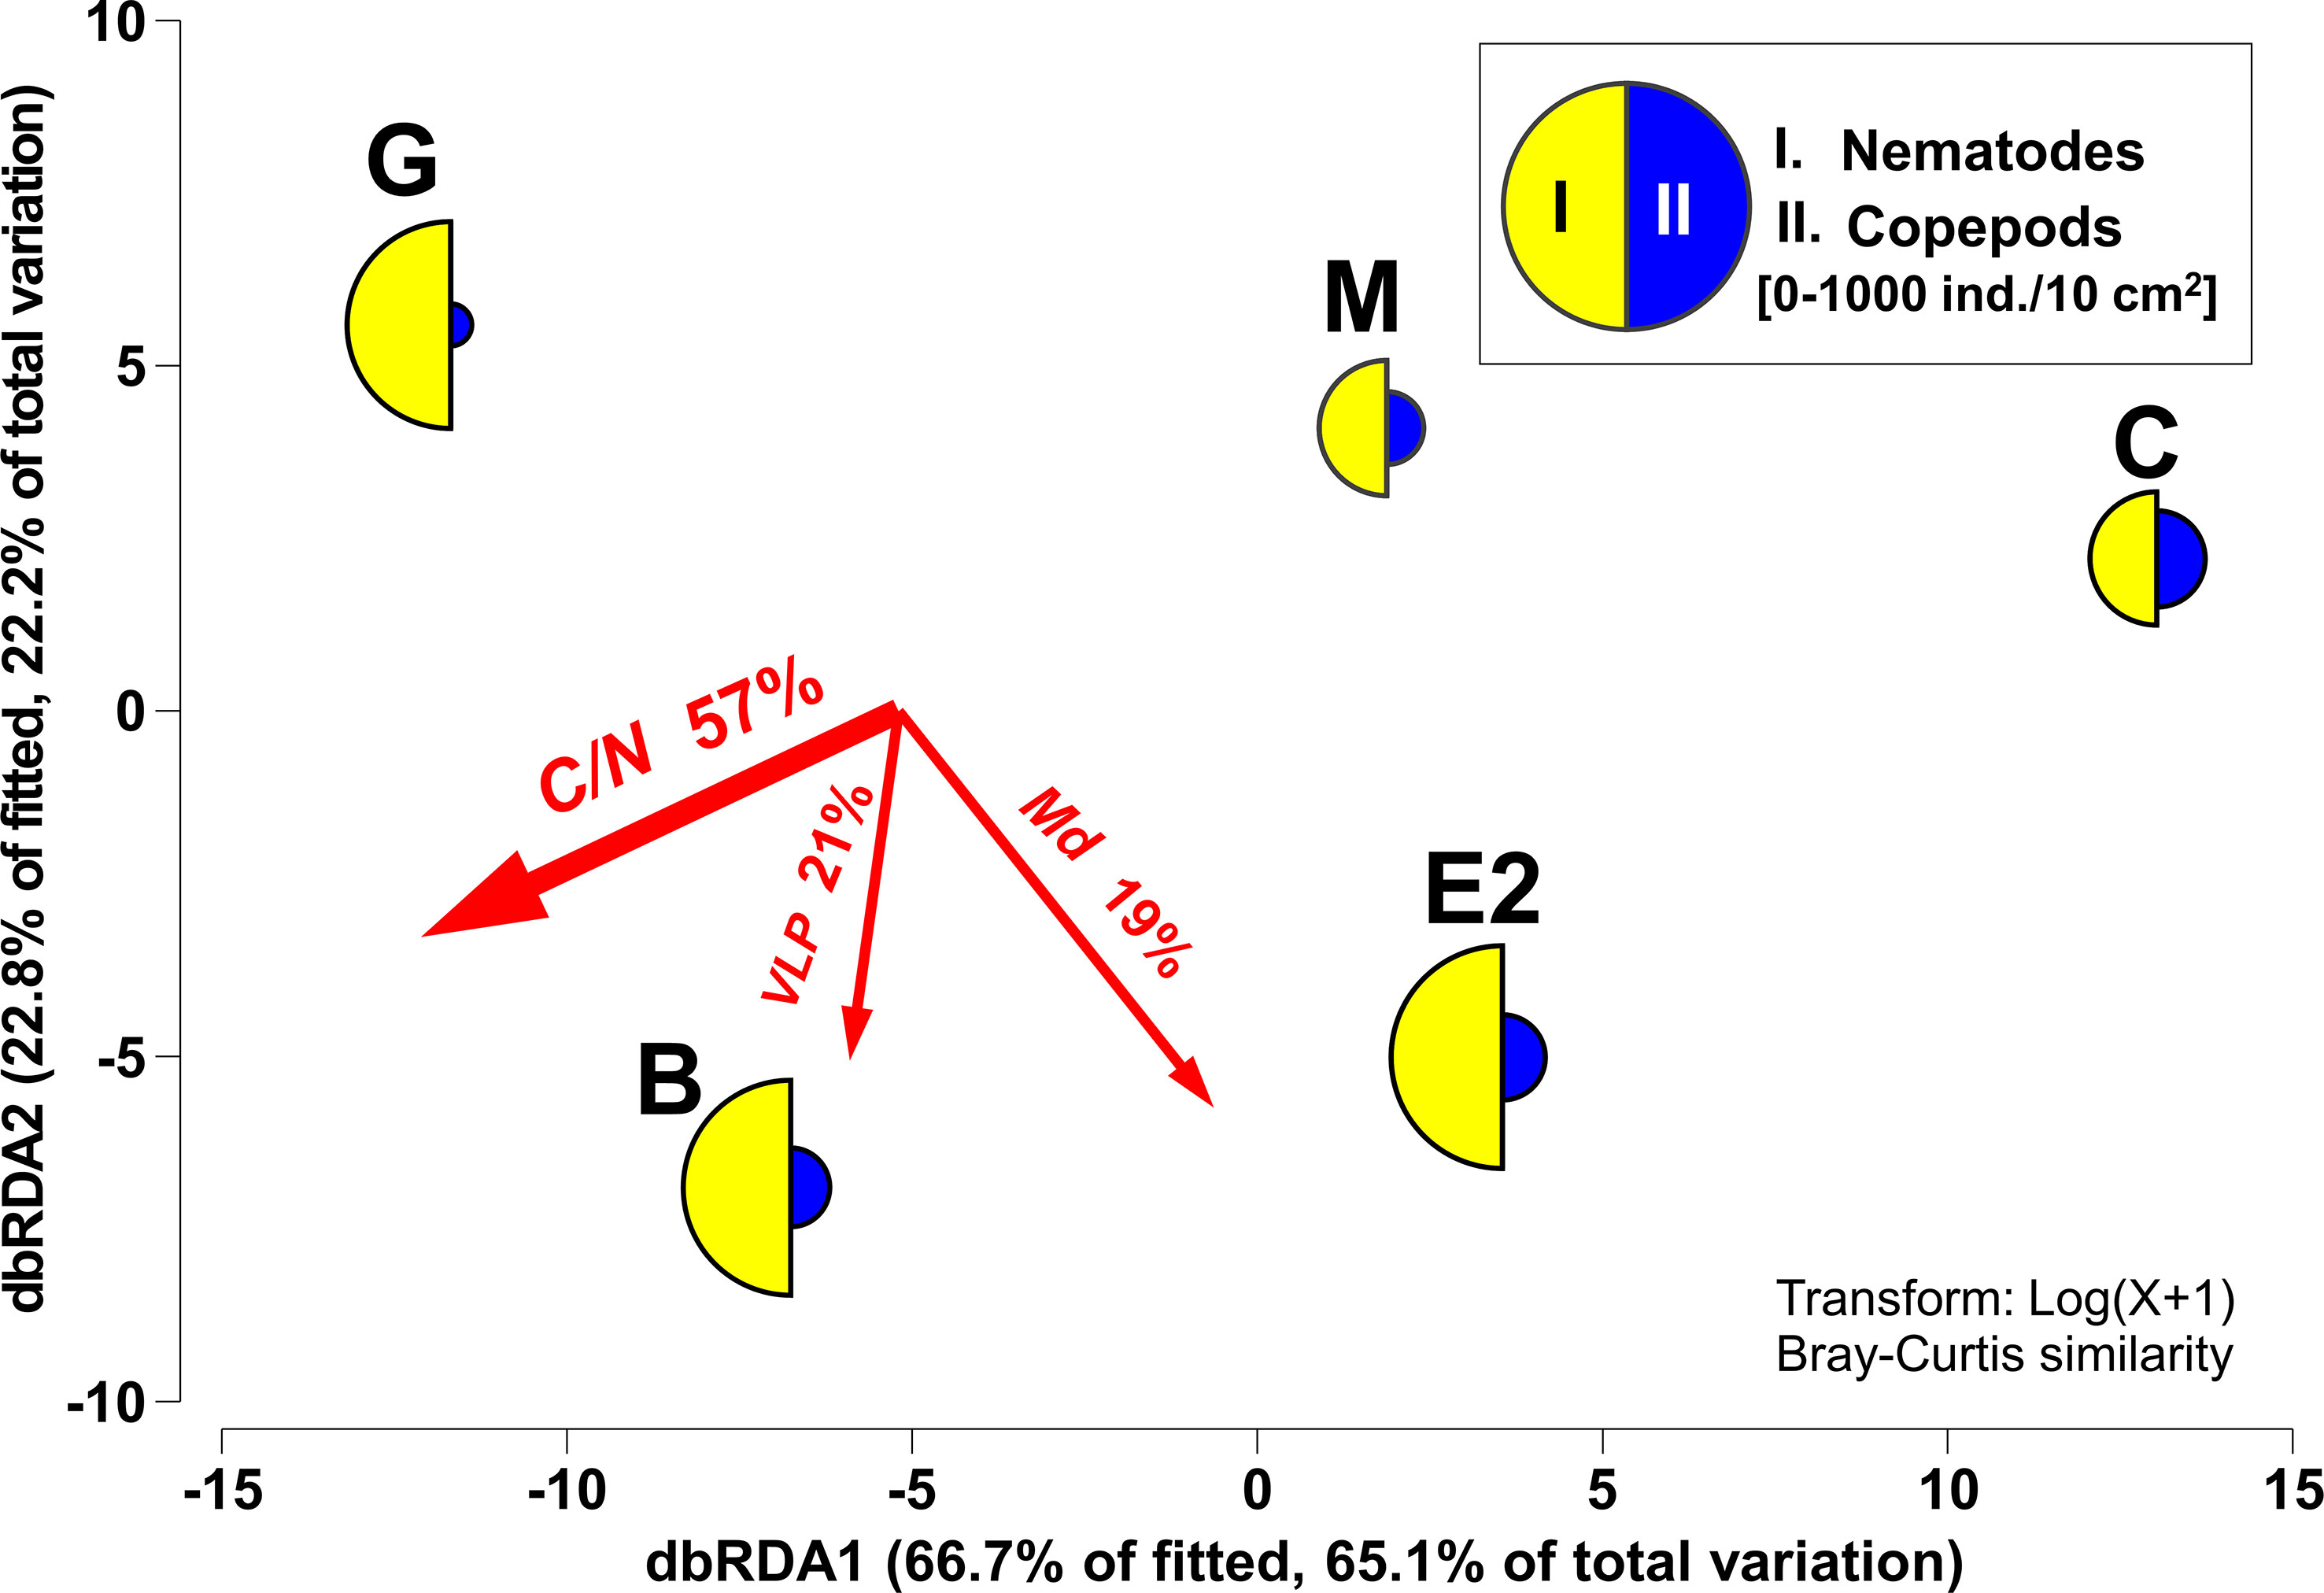
Figure 6 dbRDA of meiofaunal community structure according to DISTLM with selected environmental factors. The percentages of variation in the fitted model and of the total variation in mean abundances of meiofaunal taxa among stations as explained by each of the dbRDA axes are indicated. Mean densities (0–3 cm sediment depth) per station of the two most structuring taxa (I. Nematodes, II. Copepods) superimposed as segmented bubble plot. The directions and lengths of vector overlays denote the directions and strengths of the relationships between the dbRDA axes and environmental factors, respectively. C/N: molar basis C/N ratio, Md: median grain size, VLP: Virus-like particles.
4 Discussion
The total meiofaunal densities observed in the study area tended to be similar (Stations M and C) or higher than the estimated values at the corresponding water depths, based on a previous global dataset (Soltwedel, 2000, Figure 2). At the deep station G, meiofaunal density was within the range of reported values from various eutrophic higher-latitude regions in the Arctic Sea. However, shallower stations M, E2, and C exhibited lower densities than those predicted by the model. It is difficult to compare data from different studies using various methods to process the samples, as mentioned above. In the present study, a sieve of 63 μm was used as the lower limit, and the top 3 cm of the sediment was examined. These processes may have underestimated meiofaunal abundance, although >80% of metazoan meiofauna seem to be concentrated in the top 3-cm layer on continental slopes in general (cf. Itoh et al., 2011). Both factors led to an underestimation of the meiofaunal abundance in our study. We can suggest conservatively that the metazoan meiofaunal abundance in the southeastern Bering Sea is higher than the global average, although further studies are needed to show more clearly that primary production at the sea surface is a major factor determining their standing stocks in the area.
In contrast, a common pattern of meiofaunal abundance, bathymetric decline with water depth, was not clear among the five study sites; the lowest mean abundance was observed at Station M, the shallowest site (depth 103 m; Figure 1). During the expedition, the “Aleutian magic” phenomenon (a gathering of whales and thousands of sea birds feeding on krill, planktonic gastropods, and juvenile cods) was observed near Station M (Langlet et al., 2020), suggesting that surface productivity was enhanced above the station during the sampling period. This high productivity, however, did not likely contribute to fresh organic matter deposition at Station M, possibly because of a strong bottom current leading to coarse bottom sediments, as shown by bottom-water observations during the expedition, but the organic matter seemed to accumulate at Station E2 located in a depression (197 m, Figure 1). This was concordant with the observed pheopigment/TOC ratios in the first sediment centimeter, which is an indicator of fresh food in the sediment: the ratio was highest at Station E2 and lowest at Station M (Figure 5). Even at shallow water depths, the bottom topographies at stations M and C hampered the sedimentation of fluffy phytodetritus, resulting in a low availability of organic matter to meiofauna. Langlet et al. (2020) also reported that among the four stations investigated in their study (except Station C), the number of benthic foraminiferal species and their total abundance were the highest at Station E2. In this study, the highest total metazoan density was observed at Station E2. These results suggest that the total abundance of both meiofaunal-sized protozoans and metazoans is controlled by fresh organic matter deposited in the benthic ecosystem in this area. To confirm this, further samples from deeper sites along the Bering Canyon (> 2000 m depth) are needed.
Mean values for each of the five stations were used for the DISTLM. The analysis revealed that the metazoan meiofaunal community structure was not significantly correlated with the relative amount of pheopigments in the top sediment. Instead, the sequential test of DISTLM selected the C/N values of organic matter as the only significant factor associated with meiofaunal community structure among the investigated parameters, which explained 57% of the variability of the data. The δ15N and δ13C of organic matter were also highly associated with the meiofauna community structure when considered separately (>58%) and showed higher correlations with C/N. These results suggest that meiofaunal communities are associated with differences in the quality of the organic matter, as represented by C/N, rather than its amount.
The observed C/N (6.3−10.3) was comparable to that observed in continental slopes with similar depths off Hokkaido Island, in a boreal region of the Japanese Islands (approximately 8−9 at 500−1500 m, Usui et al., 2006), and off the coast of Antarctica (5−16, at 200−1950 m, Veit-Köhler et al., 2013; Veit-Köhler et al., 2018). In sediments exhibiting high C/N values (> 9 on average, at Station G and specifically Station B), the abundance of nematodes was distinctively high, whereas copepod abundance was lower. In contrast, in the sediment with total organic compounds showing a lower C/N (e.g. 7.6 on average, at Station C), the abundance of copepods was higher.
C/N ratios have been reported to be approximately 5−9 among phytoplankton (Garcia et al., 2018), and the ratios become higher when the organic matter is more degraded (cf. Veit-Köhler et al., 2018). With reference to these previous studies, our results suggest that transport and accumulation of a fraction of more degraded organic matter with higher C/N through the Bering Canyon might cause slightly higher values observed at deeper Stations G and B.
Marine harpacticoids, which comprise most benthic copepods, have been revealed to depend mainly on photosynthetic products as carbon sources in shallow water (Vafeiadou et al., 2014; Cnudde et al., 2015), whereas nematodes have been reported to consume various types of organic matter, such as bacteria and detritus (Moens & Vincx, 1997).
In the bathyal and abyssal depths (1930−4000 m) in the Southern Ocean and the Weddell Sea, on the other hand, both nematodes and copepods seem to feed mainly on degraded organic matter, because the food source is continuously available throughout the year (Veit-Köhler et al., 2013). Since four out of five of our study stations are located at depths of< 550 m, namely in the transmission area from the deeper sublittoral zone to the bathyal zone, food separation between meiofaunal taxa may still remain ambiguous. We need to investigate the feeding ecology of nematodes and copepods, for example, by analyzing stable isotopes of their bodies, to confirm the difference in food resources among taxa that actually cause differences in meiofaunal communities observed in this study.
In the study area, the bottom water oxygen concentration (BWO) at Stations M, C, and E2 was high (> 218 μmol/l), but tended to decrease with increasing water depth, resulting in hypoxic conditions in the middle bathyal zone, and< 28 μmol/L at deep stations B and G (Langlet et al., 2020), where higher nematode abundances were observed. However, this parameter did not show any significant association with meiofaunal communities at a higher taxonomic level.
In general, most benthic copepods are sensitive to low dissolved oxygen levels in bottom water (Kawano et al., 2021), and some species of copepods and nematodes show tolerance to hypoxic and anoxic bottom water conditions (Steyaert et al., 2007; Sergeeva and Zaika, 2013; Nguyen et al., 2018). Further studies based on species or genus levels are required.
This study provides a “snapshot” of meiofaunal assemblages in the investigated area in August 2017 when the phenomenon “Aleutian Magic” occurred on the sea surface above Station M (Langlet et al., 2020). In the eastern Bering Sea, spring and fall blooms can be linked to the production of zooplankton such as large calanoids (Sigler et al., 2014). Our sampling was conducted at the beginning of one such process. In the polar region, a recent metabarcoding approach revealed that season is a significant predictor of the diversity of sea ice and sediment-associated meiofauna at approximately 3 km from the ice edge near Utqiaġvik (Barrow), Alaska (Leasi et al., 2021). The interannual change in seasonal sea ice reduction events in the northern Bering Sea could also result in the production of planktonic copepods (Kimura et al., 2022). Thus, we need further studies on unfolding annual changes in meiofaunal communities in the area, based on time series data covering both non-bloom and bloom seasons.
Data availability statement
The original contributions presented in the study are included in the article/Supplementary Material. Further inquiries can be directed to the corresponding author.
Author contributions
DL and HN participated in the research expedition and collected the samples. KT performed faunal analyses. DL, HN, MM, MY, and TN acquired environmental data. KS analyzed the sediment grain size. MS analyzed the data. KT and MS wrote the manuscript with contributions from other co-authors. All authors contributed to the article and approved the submitted version.
Funding
This study was financially supported by JSPS KAKENHI Grants Number 17K05697 to HN and 23K05942 to DL. DL was supported by the International Research Fellow Program of the Japan Society for the Promotion of Science (Postdoctoral Fellowship for Research in Japan, P16708).
Acknowledgments
We thank the captain, crew, scientists, and technicians of the R/V Mirai for their support during this research cruise. We also thank Yoriko Minegishi and Masami Kanazawa for their prokaryotic cells and VLP counting and Hisami Suga for her pheopigment analyses. We would like to thank Editage (www.editage.com) for English language editing. Comments by the associate editor and three reviewers greatly improved our manuscript.
Conflict of interest
The authors declare that the research was conducted in the absence of any commercial or financial relationships that could be construed as a potential conflict of interest.
Publisher’s note
All claims expressed in this article are solely those of the authors and do not necessarily represent those of their affiliated organizations, or those of the publisher, the editors and the reviewers. Any product that may be evaluated in this article, or claim that may be made by its manufacturer, is not guaranteed or endorsed by the publisher.
Supplementary material
The Supplementary Material for this article can be found online at: https://www.frontiersin.org/articles/10.3389/fmars.2023.996380/full#supplementary-material
References
Adrianov A. V., Maiorova A. S. (2020). Echinoderes vulcanicus Sp. nov. from the active marine volcano piip – the first representative of the kinorhyncha in the Bering Sea (Kinorhyncha: cyclorhagida). Zool. Anz. 289, 35–49. doi: 10.1016/j.jcz.2020.08.006
Anderson M. J., Gorley R. N., Clarke K. R. (2008). PERMANOVA+ for PRIMER: guide to software and statistical methods (Plymouth: PRIMER-E).
Bessière A., Nozais C., Brugel S., Demers S., Desrosiers G. (2007). Metazoan meiofauna dynamics and pelagic–benthic coupling in the southeastern Beaufort Sea, Arctic ocean. Polar. Biol. 30, 1123–1135. doi: 10.1007/s00300-007-0270-6
Bluhm B. A., Hop H., Vihtakari M., Gradinger R., Iken K., Melnikov I. A., et al. (2018). Sea Ice meiofauna distribution on local to pan-Arctic scales. Ecol. Evol. 8, 2350–2364. doi: 10.1002/ece3.3797
Chen F., Lu J., Binder B., Liu Y., Hodson R. E. (2001). Application of digital image analysis and flow cytometry to enumerate marine viruses stained with SYBR Gold. Appl. Environ. Microbiol. 67, 539–545. doi: 10.1128/AEM.67.2.539-545.2001
Clarke K. R., Gorley R. N., Somerfield P. J., Warwick R. M. (2014). Change in marine communities: an approach to statistical analysis and interpretation. 3rd edition (Plymouth: PRIMER-E).
Cnudde C., Moens T., Werbrouck E., Lepoint G., Gansbeke D., De Troch M. (2015). Trophodynamics of estuarine intertidal harpacticoid copepods based on stable isotope composition and fatty acid profiles. Mar. Ecol. Prog. Ser. 524, 225–239. doi: 10.3354/meps11161
Danovaro R. (2010). Methods for the study of deep-sea sediments, their functioning and biodiversity (New York: CRC Press), p458.
Danovaro R., Middelboe M. (2010). “Separation of free virus particles from sediments in aquatic systems,” in Manual of aquatic viral ecology (ASLO), 74–81.
Garcia N. S., Sexton J., Riggins T., Brown J., Lomas M. W., Martiny A. C. (2018). High variability in cellular stoichiometry of carbon, nitrogen, and phosphorus within classes of marine eukaryotic phytoplankton under sufficient nutrient conditions. Front. Microbiol. 9. doi: 10.3389/fmicb.2018.00543
Gemery L., Cronin T. M., Cooper L. W., Grebmeier J. M. (2013). Temporal changes in benthic ostracode assemblages in the northern Bering and chukchi seas from 1976 to 2010. Deep Sea Res. II. 94, 68–79. doi: 10.1016/j.dsr2.2013.03.012
Giere O. (2009). “Meiobenthology,” in The microscopic motile fauna of aquatic sediments, vol. vol 2. (Hamburg: Universität Hamburg), p 527.
Granger J., Prokopenko M. G., Sigman D. M., Mordy C. W., Morse Z. M., Morales L. V., et al. (2011). Coupled nitrification-denitrification in sediment of the eastern Bering Sea shelf leads to 15N enrichment of fixed n in shelf waters. J. Geophys. Res. 116, C11006. doi: 10.1029/2010JC006751
Hoste E., Vanhove S., Schewe I., Soltwedel T., Vanreusel A. (2007). Spatial and temporal variations in deep-sea meiofauna assemblages in the marginal ice zone of the Arctic ocean. Deep Sea Res. I 54, 109–129. doi: 10.1016/j.dsr.2006.09.007
Huang D., Wang J., Zeng Q., Xiao J., Tian P., Fu S., et al. (2021). Preliminary study on community structures of meiofauna in the middle and eastern chukchi Sea. Acta Oceanol Sin. 40, 83–91. doi: 10.1007/s13131-021-1777-3
Itoh M., Kawamura K., Kitahashi T., Kojima S., Katagiri H., Shimanaga M. (2011). Bathymetric patterns of meiofaunal abundance and biomass associated with the kuril and Ryukyu trenches, western north pacific ocean. Deep-Sea Res. I 58, 86–97. doi: 10.1016/j.dsr.2010.12.004
Kakui K., Nomaki H., Komatsu H., Fujiwara Y. (2020). Unexpected low genetic differentiation between Japan and Bering Sea populations of a deep-sea benthic crustacean lacking a planktonic larval stage (Peracarida: tanaidacea). Biol. J. Linn. Soc 131, 566–574. doi: 10.1093/biolinnean/blaa106
Kawano K., Shimanaga M., Ueda R., Nguyen Q. T. D., Wada M. (2021). Impact of seasonal hypoxia on benthic copepod communities in omura bay, a highly enclosed coastal sea in southwestern Japan. Plankton Benthos Res. 16, 93–99. doi: 10.3800/pbr.16.93
Kimura F., Matsuno K., Abe Y., Yamaguchi A. (2022). Effects of early sea-ice reduction on zooplankton and copepod population structure in the northern Bering Sea during the summers of 2017 and 2018. Front. Mar. Sci. 9. doi: 10.3389/fmars.2022.808910
Langlet D., Bouchet V. M. P., Riso R., Matsui Y., Suga H., Fujiwara Y., et al. (2020). Foraminiferal ecology and role in nitrogen benthic cycle in the hypoxic southeastern Bering Sea. Front. Mar. Sci. 7. doi: 10.3389/fmars.2020.582818
Leasi F., Sevigny J. L., Hassett B. T. (2021). Meiofauna as a valuable bioindicator of climate change in the polar regions. Ecol. Indic. 121, 107133. doi: 10.1016/j.ecolind.2020.107133
Lin R., Huang D., Guo Y., Chang Y., Cao Y., Wang J. (2014). Abundance and distribution of meiofauna in the chukchi Sea. Acta Oceanol. Sin. 33, 90–94. doi: 10.1007/s13131-014-0493-7
Middelboe M., Glud R. N., Filippini M. (2011). Viral abundance and activity in the deep sub-seafloor biosphere. Aquat. Microb. Ecol. 63, 1–8. doi: 10.3354/ame01485
Moens T., Vincx M. (1997). Observations on the feeding ecology of estuarine nematodes. J. Mar. Biol. Ass. UK. 77, 211–227. doi: 10.1017/S0025315400033889
Nguyen Q. T. D., Ueda R., Mori F., Kang. T., Kim D., Shimanaga M., et al. (2018). Response of nematode community structure to hypoxia in an enclosed coastal sea, omura bay, for three consecutive years. Plankton Benthos Res. 13, 59−65. doi: 10.3800/pbr.13.59
Noble R. T., Fuhrman J. A. (1998). Use of SYBR green I for rapid epifluorescence counts of marine viruses and bacteria. Aquat. Microb. Ecol. 14, 113–118. doi: 10.3354/ame014113
Nomaki H., Arai K., Suga H., Toyofuku T., Wakita M., Nunoura T., et al. (2016). Sedimentary organic matter contents and porewater chemistry at upper bathyal depths influenced by the 2011 off the pacific coast of tohoku earthquake and tsunami. J. Oceanogr 72, 99–111. doi: 10.1007/s10872-015-0315-3
Nomaki H., Rastelli E., Alves A., Suga H., Samos S., Kitahashi T., et al. (2021). Abyssal fauna, benthic microbes, and organic matter quality across a range of trophic conditions in the western pacific ocean. Progr. Oceanogr 195, 102591. doi: 10.1016/j.pocean.2021.102591
Portnova D., Polukhin A. (2018). Meiobenthos of the eastern shelf of the kara Sea compared with the meiobenthos of other parts of the sea. Reg. Stud. Mar. Sci. 24, 370–378. doi: 10.1016/j.rsma.2018.10.002
Rex M. A., Etter R. J., Morris J. S., Crouse J., McClain C. R., Johnson N. A., et al. (2006). Global bathymetric patterns of standing stock and body size in the deep-sea benthos. Mar. Ecol. Prog. Ser. 317, 1–8. doi: 10.3354/meps317001
Rosli N., Daniel L., Ashley A. R., Probert P. K. (2017). Review of recent trends in ecological studies of deep-sea meiofauna, with focus on patterns and processes at small to regional spatial scales. Mar. Biodivers. 48, 13–34. doi: 10.1007/s12526-017-0801-5
Schewe I. (2001). Small-sized benthic organisms of the alpha ridge, central Arctic ocean. Internat. Rev. Hydrobiol. 86, 317–335. doi: 10.1002/1522-2632(200106)86:3<317::AID-IROH317>3.0.CO;2-V
Schmidt-Rhaesa A. (2020). Guide to the identification of marine meiofauna (Munich: Verlag Dr. Friedrich Pfeil), p608.
Schratzberger M., Ingels J. (2018). Meiofauna matters: the roles of meiofauna in benthic ecosystems. J. Exp. Mar. Biol. Ecol. 502, 12–25. doi: 10.1016/j.jembe.2017.01.007
Seike K., Sassa S., Shirai K., Kubota K. (2018). Lasting impact of a tsunami event on sediment-organism interactions in the ocean. J. Geophys. Res. Oceans 123, 1376–1392. doi: 10.1002/2017JC013746
Sergeeva N., Zaika V. (2013). The black Sea meiobenthos in permanently hypoxic habitat. Acta Zool. Bulg. 65, 139–150.
Sigler M. F., Stabeno P. J., Eisner L. B., Napp J. M., Mueter F. J. (2014). Spring and fall phytoplankton blooms in a productive subarctic ecosystem, the eastern Bering Sea, during 1995–2011. Deep Sea Res. II 109, 71–83. doi: 10.1016/j.dsr2.2013.12.007
Soltwedel T. (2000). Metazoan meiobenthos along continental margins: a review. Prog. Oceanogr. 46, 59–84. doi: 10.1016/S0079-6611(00)00030-6
Soltwedel T., Grzelak K., Hasemann C. (2020). Spatial and temporal variation in deep-sea meiofauna at the LTER observatory HAUSGARTEN in the fram strait (Arctic ocean). Diversity. 12, 279. doi: 10.3390/d12070279
Stabeno P. J., Schumacher J. D., Ohtani K. (1999). “The physical oceanography of the Bering Sea: a summary of physical, chemical, and biological characteristics, and a synopsis of research on the Bering Sea,” in Dynamics of the Bering Sea: a summary of physical, chemical, and biological characteristics, and a synopsis of research on the Bering Sea. Eds. Loughlin T. R., Ohtani K. (University of Alaska Sea Grant: North Pacific Marine Science Organization (PICES), 1–28.
Steyaert M., Moodley L., Nadong T., Moens T., Soetaert K., Vincx M. (2007). Responses of intertidal nematodes to short-term anoxic events. J. Exp. Mar. Biol. Ecol. 345, 175–184. doi: 10.1016/j.jembe.2007.03.001
Stratmann T., van Oevelen D., Martínez Arbizu P., Wei C. L., Liao J. X., Cusson, M., et al. (2020). The BenBioDen database, a global database for meio-, macro- and megabenthic biomass and densities. Sci. Data 7, 206. doi: 10.1038/s41597-020-0551-2
Tietjen J. H. (1992). “Abundance and biomass of metazoan meiobenthos in the deep sea,” in Deep-Sea food chains and the global carbon cycle. Eds. Rowe G. T., Pariente V. (Boston, USA: Kluwer Academic Publishers), 45–62.
Usui T., Nagao S., Yamamoto M., Suzuki K., Kudo I., Montani S., et al. (2006). Distribution and sources of organic matter in surficial sediments on the shelf and slope off tokachi, western north pacific, inferred from c and n stable isotopes and C/N ratios. Mar. Chem. 98, 241–259. doi: 10.1016/j.marchem.2005.10.002
Vafeiadou A. M., Materatski P., Adão H., De Troch M., Moens T. (2014). Resource utilization and trophic position of nematodes and harpacticoid copepods in and adjacent to zostera noltii beds. Biogeosciences 11, 4001–4014. doi: 10.5194/bg-11-4001-2014
Veit-Köhler G., Durst S., Schuckenbrock J., Hauquier F., Durán Suja L., Boris Dorschel B., et al. (2018). Oceanographic and topographic conditions structure benthic meiofauna communities in the weddell Sea, bransfield strait and drake passage (Antarctic). Prog. Oceanogr. 162, 240–256. doi: 10.1016/j.pocean.2018.03.005
Veit-Köhler G., Guilini K., Peeken I., Quillfeldt P., Mayr C. (2013). Carbon and nitrogen stable isotope signatures of deep-sea meiofauna follow oceanographical gradients across the southern ocean. Prog. Oceanogr. 110, 69–79. doi: 10.1016/j.pocean.2013.01.001
Yanagawa K., Morono Y., Yoshida-Takashima Y., Eitoku M., Sunamura M., Inagaki F., et al. (2014). Variability of subseafloor viral abundance at the geographically and geologically distinct continental margins. FEMS. Microbiol. Ecol. 88, 60–68. doi: 10.1111/1574-6941.12269
Yoshida M., Mochizuki T., Urayama S., Yoshida-Takashima Y., Nishi S., Hirai M., et al. (2018). Quantitative viral community DNA analysis reveals the dominance of single-stranded DNA viruses in offshore upper bathyal sediment from tohoku, japan. Front. Microbiol. 9, 75. doi: 10.3389/fmicb.2018.00075
Keywords: Bering Sea, ecology, metazoan meiofauna, standing stock, environment factors
Citation: Tachibana K, Shimanaga M, Langlet D, Seike K, Miyazaki M, Yoshida M, Nunoura T and Nomaki H (2023) Meiofauna in the southeastern Bering Sea: community composition and structuring environmental factors. Front. Mar. Sci. 10:996380. doi: 10.3389/fmars.2023.996380
Received: 17 July 2022; Accepted: 11 April 2023;
Published: 27 April 2023.
Edited by:
Cristina Gambi, Marche Polytechnic University, ItalyReviewed by:
Chih-Lin Wei, National Taiwan University, TaiwanGritta Veit-Köhler, Senckenberg am Meer Wilhelmshaven, Germany
Copyright © 2023 Tachibana, Shimanaga, Langlet, Seike, Miyazaki, Yoshida, Nunoura and Nomaki. This is an open-access article distributed under the terms of the Creative Commons Attribution License (CC BY). The use, distribution or reproduction in other forums is permitted, provided the original author(s) and the copyright owner(s) are credited and that the original publication in this journal is cited, in accordance with accepted academic practice. No use, distribution or reproduction is permitted which does not comply with these terms.
*Correspondence: Motohiro Shimanaga, bW90b2hpcm9Aa3VtYW1vdG8tdS5hYy5qcA==