 Marie Maßmig
 Carolina Cisternas-Novoa
 Anja Engel
- 1Biological Oceanography, Marine Biogeochemistry, GEOMAR Helmholtz Centre for Ocean Research Kiel, Kiel, Germany
- 2Ocean Sciences Centre, Memorial University of Newfoundland, St. John’s, NL, Canada
Deoxygenation is tied to organic carbon (Corg) supply and utilization in marine systems. Under oxygen-depletion, bacteria maintain Corg respiration using alternative electron acceptors such as nitrate. Since anaerobic respiration’s energy yield is lower, Corg remineralization may be reduced and its residence time increased. We investigated the influence of oxygen and alternative electron acceptors’ availability on Corg cycling by heterotrophic bacteria during a continuous culture experiment with Shewanella baltica, a facultative anaerobic γ-Proteobacteria in the Baltic Sea. We tested six different oxygen levels, from suboxic (<5 µmol L-1) to fully oxic conditions, using a brackish (salinity=14 g L-1) media supplied with high (HighN) or low (LowN) inorganic nitrogen concentrations relative to glucose as labile Corg source. Our results show that suboxia limited DOC (glucose) uptake and cell growth only under LowN, while higher availability of alternative electron acceptors seemingly compensated oxygen limitation under HighN. N-loss was observed under suboxia in both nitrogen treatments. Under HighN, N-loss was highest and a C:N loss ratio of ~2.0 indicated that Corg was remineralized via denitrification. Under LowN, the C:N loss ratio under suboxia was higher (~5.5), suggesting the dominance of other anaerobic respiration pathways, such as dissimilatory nitrate reduction to ammonium (DNRA). Bacterial growth efficiency was independent of oxygen concentration but higher under LowN (34 ± 3.0%) than HighN (26 ± 1.6%). Oxygen concentration also affected dissolved organic matter (DOM) cycling. Under oxic conditions, the release of dissolved combined carbohydrates was enhanced, and the amino acid-based degradation index (DI) pointed to more diagenetically altered DOM. Our results suggest bacterial Corg uptake in low-oxygen systems dominated by S. baltica can be limited by oxygen but compensated by high nitrate availability. Hence, suboxia diminishes Corg remineralisation only when alternative electron acceptors are lacking. Under high nitrate:Corg supply, denitrification leads to a higher N:C loss ratio, potentially counteracting eutrophication in the long run. Low nitrate:Corg supply may favour other anaerobic respiration pathways like DNRA, which sustains labile nitrogen in the system, potentially intensifying the cycle of eutrophication. Going forward, it will be crucial to establish the validity of our findings for S. baltica in natural systems with diverse organic substrates and microbial consortia.
1 Introduction
About 1% of the ocean volume is characterized by oxygen concentrations<20 µmol L-1; concentrations may even fall below the current detection limit of 2 nmol L-1 (Revsbech et al., 2009; Ulloa and Pantoja, 2009). The oceanic oxygen content decreased by about 2% over the past 50 years, and water masses with oxygen concentrations <70 µmol L-1 at 200 dbar (which equals approximately 200 m depth) increased between 1960 and 2008 (Stramma et al., 2010; Schmidtko et al., 2017). Depending on the region and assumed climate scenario, different model studies predict a further decrease in oxygen concentrations within the ocean (summarized in Levin, 2018). The combination of sluggish ventilation, i.e. water column stratification, and enhanced nutrient supply followed by higher organic matter loads and subsequently respiratory oxygen demand is the primary driver of low oxygen levels in marine systems. Hence, oxygen minimum zones (OMZs) are often found in upwelling systems at eastern continental margins or in enclosed seas with strong stratification such as the Baltic Sea and the Black Sea, or in systems strongly affected by nutrient pollution from large river systems like the Gulf of Mexico, the Chesapeake Bay or the Adriatic Sea (Pitcher et al., 2021).
In the central Baltic Sea, hypoxic (<60 µmol O2 L-1), suboxic (<5 µmol O2 L-1) and even anoxic (~0 µmol O2 L-1) waters are permanently present in deeper regions and occasionally along the coast (Conley et al., 2009; Carstensen et al., 2014; Andersen et al., 2017). Eutrophication of the Baltic Sea, resulting from high nutrient riverine and aeolian input of riparian states, leads to massive algal blooms, the degradation of which fuels oxygen reduction (Voss et al., 2011). Meanwhile, oxygen supply to the deep Baltic basins is restricted due to a strong halocline at around 60 m depth and the limited inflow of oxygen-rich North Sea water. Next to nutrient loadings, rising water temperatures may further stimulate cyanobacterial blooms and, subsequently, the degradation of organic matter, reducing oxygen (Kabel et al., 2012). A multidecadal time series in Boknis Eck identified decreasing oxygen concentrations at 25 m depth and increased frequency of anoxic and suboxic events during the period 1957 – 2013 (Lennartz et al., 2014; Hepach et al., 2024). This recent deoxygenation is probably induced by increased microbial respiration at warmer water temperatures and reduced ventilation due to the stratification of the water column earlier in the year (Hepach et al., 2024).
Heterotrophic respiration of organic matter involves redox reactions, wherein organic compounds like glucose undergo remineralization using oxygen or alternative electron acceptors. This process yields oxidized carbon (CO2), reduced products (H2O in the case of aerobic respiration), and energy as summarized in Engel et al. (2022). To obtain energy under hypoxic conditions, bacteria may use alternative electron acceptors, such as nitrate and nitrite, for anaerobic respiration, such as denitrification and dissimilatory nitrate reduction to ammonium (DNRA) or chemoautotrophic pathways, e.g. anaerobic ammonium oxidation (anammox) (Lam and Kuypers, 2011). For the anaerobic respiration pathways denitrification and DNRA, the energy gain per oxidized carbon atom is 1 and 36% less than via aerobic respiration (Lam and Kuypers, 2011). Denitrification is the sequential reduction of nitrate (NO32-) to nitrite (NO2-), nitric oxide (NO), nitrous oxide (N2O) to dinitrogen gas (N2), which can escape into the atmosphere, causing a loss of reactive nitrogen in the water column. During DNRA, nitrate is reduced to nitrite in the initial reduction step; however, the end product of this reaction is ammonium (NH4+), which is released to the water column. It has been estimated that 30 to 50% of the oceanic nitrogen loss occurs in OMZs (Lam and Kuypers, 2011 and citations within). The oxygen threshold for anaerobic processes is still under investigation. The suppression of anammox was reported for oxygen concentrations between 1.7- 20 µmol L-1 (Jensen et al., 2008; Kalvelage et al., 2011; Dalsgaard et al., 2014). The reduction of nitrate is less oxygen sensitive occurring at concentrations up to 25 µmol L-1 (Kalvelage et al., 2011), whereas the entire reduction of nitrate to dinitrogen gas might already be inhibited by nanomolar oxygen concentrations (Dalsgaard et al., 2014). Limited literature addresses the oxygen sensitivity of DNRA. Yet, an incubation experiment showed no direct oxygen dependency for the transcription of nrfA, encoding a key enzyme of this process (Dalsgaard et al., 2014).
DNRA, denitrification, and oxic respiration are conducted by heterotrophic bacteria (e.g. Lam and Kuypers, 2011). Heterotrophic bacteria are crucial for the marine carbon cycle since they transform dissolved organic carbon (DOC) into bacterial biomass, which is respired to CO2 or incorporated by bacterivores and thus transferred to higher trophic levels (Azam et al., 1983). Climate-driven changes in ocean circulation and the interplay between primary production, bacterial production (BP), and respiration determines whether a specific area might act as a carbon sink (net uptake of CO2) or source (net release of CO2) (Hoppe et al., 2002). The bacterial carbon demand (BCD) is the total amount of carbon used for anabolic and catabolic processes and can be estimated by the sum of bacterial production and respiration rates. In the Baltic Sea basins, the BCD has been estimated to equal 50 to 70% of the primary production (Hagstrom et al., 2001; Hoikkala et al., 2015), determining the fate of the photosynthetically fixed carbon. The marine bacterial growth efficiency (BGE), defined as the ratio BP/BCD, is, on average, 20% (1- 69%) (Del Giorgio and Cole, 1998). In the Baltic Sea, the BGE is highly variable (5-60%) and depends, among other factors, on substrate quality (summarized in Hoikkala et al., 2015). However, the effect of oxygen limitation on BGE has not been sufficiently investigated. Batch experiments with a microbial community from the Baltic Sea demonstrated similar bacterial growth efficiency (BGE) at both oxic and low oxygen concentrations (Maßmig et al., 2019). However, particle degradation experiments suggested a reduction in the degradation of organic matter under suboxic and anoxic conditions compared to oxic ones, implying a potential decrease in microbial carbon turnover under oxygen-limited conditions (Nguyen and Harvey, 1997; Le Moigne et al., 2017). The apparent contradiction between the findings underscores the complexity of microbial responses to different oxygen concentrations. It also highlights the need for further research to unravel the combined effects of oxygen concentrations and the availability of alternative electron acceptors on total and cell-specific bacterial turnover of carbon, as well as their impact on BGE.
This study investigated whether a decrease in oxygen concentration reduces the bacterial carbon utilization. Additionally, we investigated if nitrate, acting as an alternative electron acceptor, can compensate for the missing oxygen and sustain bacterial carbon turnover. We analyzed the total and cell-specific carbon use, i.e. DOC uptake and particulate organic carbon (POC) production, under six different oxygen conditions with oxygen concentrations ranging from fully oxic to suboxic. The experiments were performed with the γ-Proteobacteria Shewanella baltica,a facultative anaerobe that uses nitrate, among other compounds such as Fe3+ and sulfur compounds, as an electron acceptor (Ziemke et al., 1998). Moreover, S. baltica represents around 77% of the cultivatable nitrate-reducing bacteria in the Gotland Deep (Baltic Sea) (Brettar et al., 2001). We incubated an S. baltica culture under high (HighN) and low (LowN) nitrate and identical glucose concentrations to vary the availability of alternative electron acceptor relative to the labile carbon source, yielding an initial organic carbon (Corg) to DIN (with NO3: NH4 of 1:1) ratio of 1.25 and 6.52, respectively. The experiments were performed in continuous flow through culture systems (chemostats), since they allow for replicate serial sampling. This study aims to enhance our comprehension of bacterial carbon cycling under varying oxygen concentrations in marine waters. This understanding is crucial for projecting potential future responses of marine ecosystems to deoxygenation and eutrophication.
2 Methods
2.1 Experimental set-up
2.1.1 Chemostats
Experiments were conducted with the γ-Proteobacteria S. baltica (DMS no. 9439; Synonym NCTC10735) at 20°C in the dark. S. baltica is a facultative anaerobic bacteria in the Baltic Sea (Ziemke et al., 1998; Brettar et al., 2001). The cell uses alternative electron acceptors, e.g. nitrate, when oxygen concentration becomes limiting (Ziemke et al., 1998). S. baltica has been identified as denitrifying bacteria (Brettar et al., 2001) and N2O producer (Brettar and Höfle, 1993). Full genome sequence of Shewanella baltica DSM 9436 (NCTC10735) is deposited in the European Nucleotide archive under sample accession ERS135390 (http://www.ebi.ac.uk/ena/data/view/ERS135390) and available genome annotations are deposited in the National Centre for Biotechnology Information (https://www.ncbi.nlm.nih.gov/nuccore/UGYM01000002.1). The genome indicates that the strain is capable of conducting DNRA and denitrification based on gene families NapAB, NrfA, Nos, and narXl.
Chemostats were modified 5 L glass bottles (SCHOTT Duran) with an overflow, enabling a constant culture volume of 4.6 L. Applications for sampling, stirring, medium inflow and aeration were installed in the lid (Figure 1A). The medium was stirred with 280 rotations per minute. Filtered (0.2 μm) and autoclaved medium was added constantly to the chemostat (2 ml min−1) through a peristaltic pump to achieve a dilution rate of 0.626 d-1. The medium was dripping in and out of the chemostat to avoid contamination (Borchard et al., 2011). Sampling was conducted through an opening in the lid. All material and filters between the mediums tank and chemostats were autoclaved or acid cleaned. Filters were regularly checked and immediately acid-cleaned or exchanged when signs of contamination occurred.
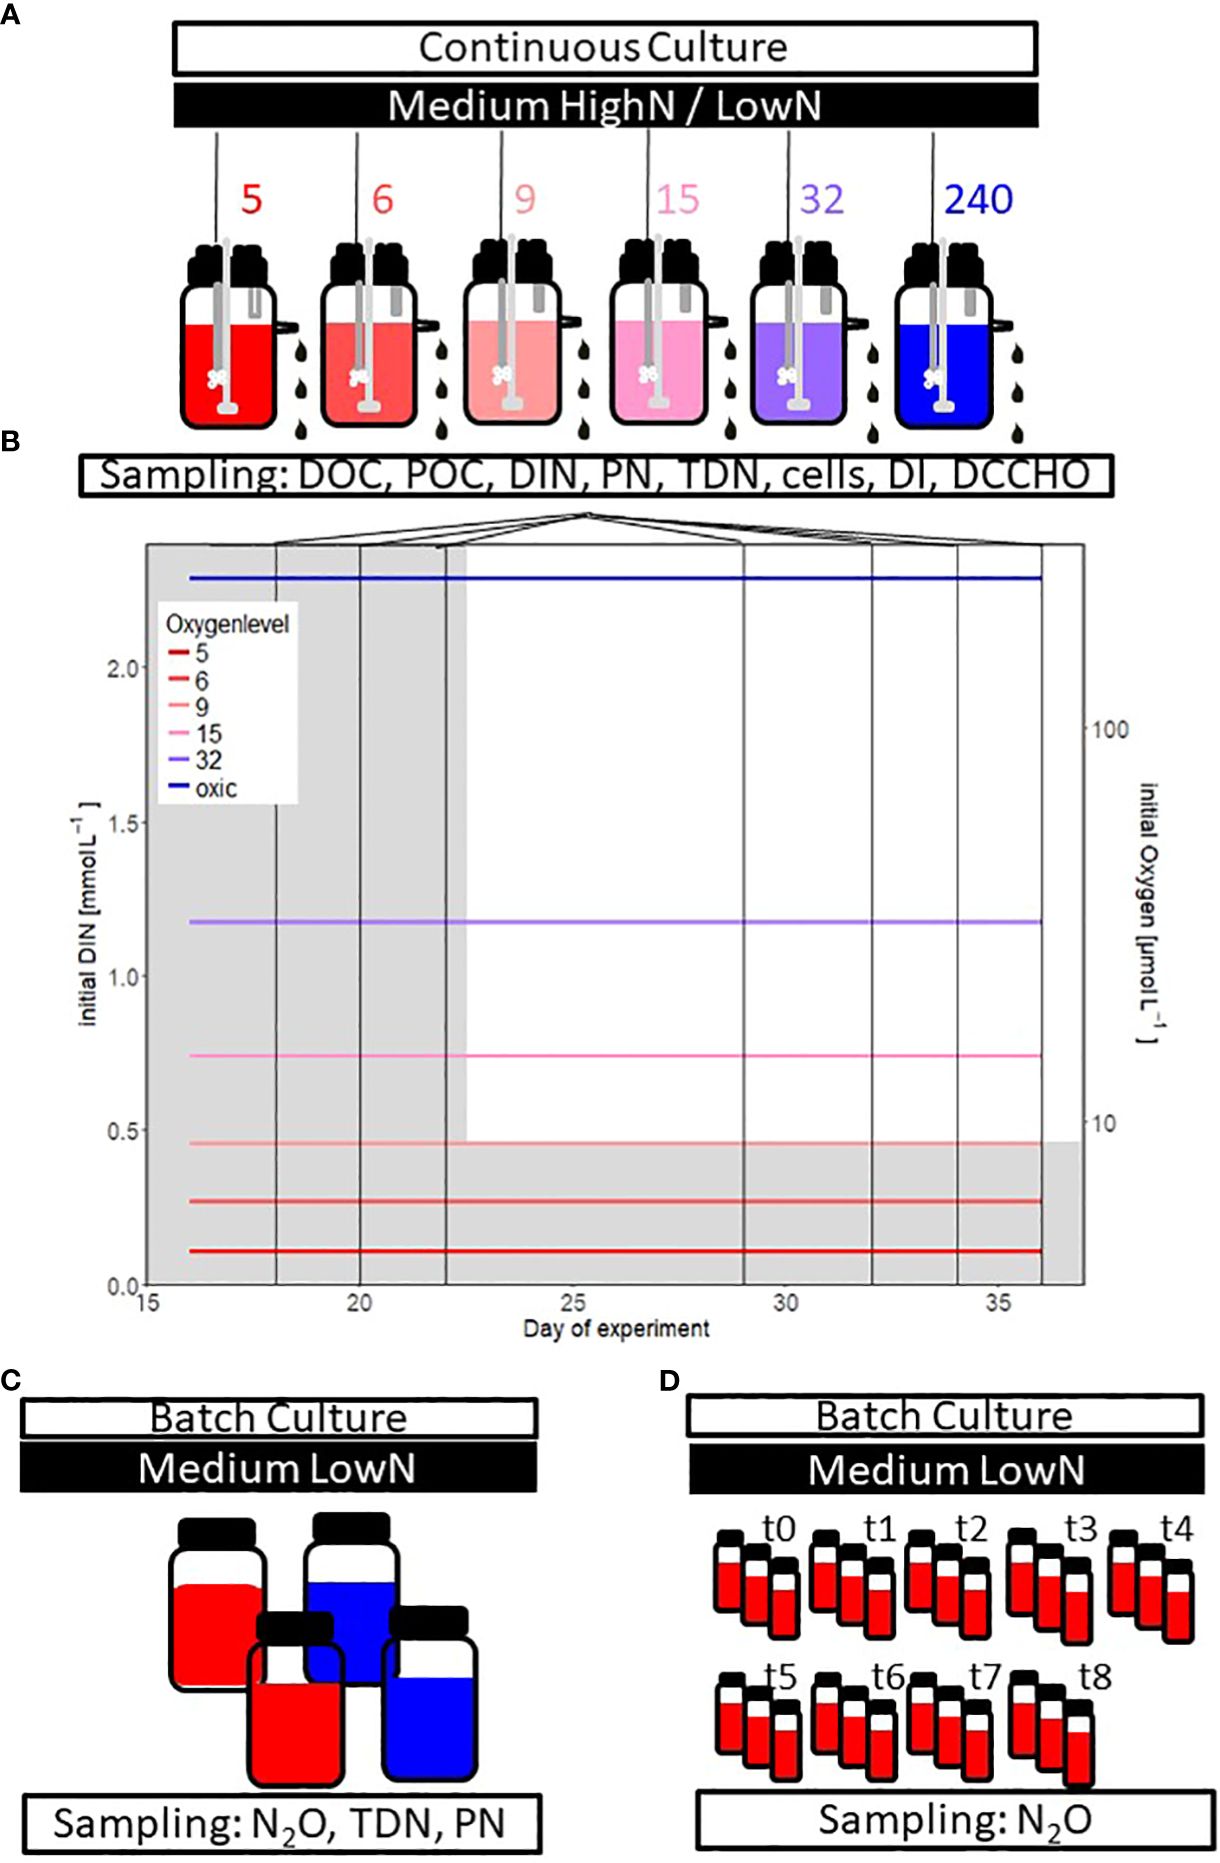
Figure 1 Experimental design of the (A) chemostat experiment with different supplied oxygen levels (in color, 5 to 240 µmol O2 L-1) The oxygen conditions 5 to 15 µmol O2 L-1 are in the text often summarized as “suboxic” conditions. The chemostat experiment started with a HighN (Corg/DIN = 1.25) and changed to a LowN (Corg/DIN = 6.52) medium. The following parameters have been studied: dissolved organic carbon (DOC), particulate organic carbon (POC), dissolved inorganic nitrogen (DIN), particulate nitrogen (PN), total dissolved nitrogen (TDN), cell abundance, the degradation index (DI) based on amino acid composition, dissolved combined carbohydrate (DCCHO) composition and oxygen. (B) initial DIN concentration (grey shading) and prescribed oxygen concentrations over time in the chemostat experiment. Vertical lines indicate sampling days during HighN (days 16, 18, 20, 22) and LowN (days 29, 32, 34 and 36) treatment. (C) Batch experiment’ s set up to verify the observed nitrogen loss during the chemostat study. Two of the four incubation bottles were turned anoxic before sampling nitrous oxide (N2O), TDN and PN (see methods for details). (D) Bottle incubations to investigate the development of N2O production over time. The bottles were sampled at nine consecutive days.
Aeration of the chemostats was regulated with a mass flow controller (MFC, Type 1179 Mass Flow Controller; MKS Instruments, Germany) and the associated digital control panel (Type 647C Multi Gas Controller; MKS Instruments Germany; accuracy 0.7%) as described in detail by Borchard et al. (2011). Air underwent filtration (0.2 µm) as a precaution against contamination before entering the medium via a sterilized bubbling stone (End Line Filter, Thermo Scientific) to maintain a consistent and precise aeration level. Gas flow was adjusted to 19-20 ml min-1 containing compressed ambient air and an anoxic gas mixture (0.13% CO2 in N2; Air Liquide) to obtain a theoretical inflow of 0, 0.25, 0.53 and 2.56% air saturation. The inflow of 0% air saturation was conducted at two different chemostats with and without an oxygen reduction column (copper catalyst, Glasgerätebau Ochs). One chemostat was bubbled with ambient air directly (19% oxygen saturation) to achieve fully oxygenated conditions. Since chemostats are flow-through systems, a slight inflow of oxygen could not be excluded entirely. Oxygen concentrations were measured within the chemostats before adding bacteria, resulting in six oxygen concentrations: 5, 6, 9, 15, 32, and 240 µmol L-1 (Figure 1B). Oxygen concentrations were chosen to represent suboxic conditions (~ 5 µmol L-1) and different states of hypoxic conditions (<60 µmol L-1) as well as fully oxic conditions following Gruber (2011). Throughout the manuscript, these six oxygen conditions will be named O2-5, O2-6, O2-9, O2-15, O2-32 and O2-240. Oxygen conditions from O2-5 to O2-15 were practically suboxic since respiration in those chemostats depleted oxygen concentrations to <1 µmol L-1 at the sampling days (Supplementary Table 1).
The supplied medium for all chemostats was constantly pumped from a 20 L medium tank. The nutrient composition changed between the HighN (Corg: DIN of 1.25) and the LowN (Corg: DIN of 6.52) treatment. The supplied medium was prepared from MilliQ water and additions of autoclaved artificial sea salt (Premium Sea Salt, Dupla Marin) yielding a salinity of 14 g L-1, and the following sterile-filtered nutrients and substrate: glucose (final concentration: 0.5 mmol glucose L-1 = 3 mmol C L-1), sodium phosphate (final concentration: 0.3 mmol L-1), sodium nitrate (final concentration in the HighN treatment: 1.2 mmol L-1 and in the LowN treatment 0.23 mmol L-1) and ammonium chloride (final concentration in the HighN treatment: 1.2 mmol L-1 and in the LowN treatment 0.23 mmol L-1). Moreover, vitamins, metals, and sodium bicarbonate were added following the recipe for the f/2 medium (see Supplementary Table 2) (Guillard and Ryther, 1962; Guillard, 1975). Media composition was tested in pre-studies to determine the nutrient concentrations needed to yield sufficient biomass to enable sampling of all parameters without exceeding the maximum sampling volume of <10% total volume (450 mL) (La Roche et al., 2010).
After inoculating the chemostats with S. baltica, the cells were grown for 29h in batch mode. Then the flow-through (D=0.626 d-1) was started. The experiment ran for 36 days, the first 22 days as HighN treatment, while during the remaining 14 days, the nutrient supply was changed to LowN. After the change in nitrogen concentration, the system was allowed to adapt for one week to new conditions. Sampling for HighN was conducted on days 16, 18, 20 and 22. Sampling for LowN was performed on days 29, 32, 34, and 36. For analysis, only sampling days with the lowest variation in cell abundance (<22%) were included, i.e. data from day 22 were excluded.
2.1.2 Nitrous oxide determination
An additional batch experiment with S. baltica was conducted to investigate a potential nitrogen loss during the chemostat experiment (Figure 1C). Batch cultures were inoculated in the same LowN medium as the chemostat study. The experiment lasted eight days with a start concentration of 2.9 x10⁵ cells mL-1 in four incubation bottles (1.12 L; Zscheiler and Klinger) on a shaker (75 rotations min-1). Incubation bottles were first closed with a gas permeable cotton wool. After five days, two incubations were turned anoxic by sealing the bottles with a gas-tight lid and a septum. They were then purged for two hours with a gas mixture consisting of 0.13% CO2 in pure N2 (Air Liquide), which was passed through an oxygen reduction column equipped with a copper catalyst (Glasgerätebau Ochs). At the end of this experiment, nitrous oxide (N2O) as an intermediate product of denitrification and dissolved and particulate nitrogen was sampled with the same sampling procedure as during the chemostat study (see 2.2).
Furthermore, the production of N2O by S. baltica was directly measured over nine consecutive days in 20 mL N2O sampling vials (Chromatographie Handel Müller GmbH, R20-20br) (Figure 1D). Therefore, 27 vials were filled with the same LowN medium as the chemostats and incubated with S. baltica at the same starting concentration as the batch culture (2.9 x10⁵ cell mL-1) and closed with a gas-tight cup and septum. Incubations were bubbled with a gas mixture containing 0.13% of CO2 in pure N2 (Air Liquide) that was led through an oxygen reduction column (copper catalyst, Glasgerätebau Ochs) for two minutes. Samples for N2O concentrations were taken daily in triplicates by poisoning three incubation bottles. For the first time point, only duplicates could be analyzed.
2.2 Measurements and computations
2.2.1 Bacterial abundance
For bacterial abundance, 4 mL samples were fixed with 200 µL glutaraldehyde (25%) and stored at -20°C for at most two months until analyses by flow cytometry after Gasol and Del Giorgio (2000) (FACS Calibur; Becton Dickinson). Before analysis, samples were sonicated (5 seconds), filtered (50 μm) and diluted up to 40 times with ultra-pure water. Then 10 μL Flouresbrite® fluorescent beads (Polyscience, Inc.) and 10 μL Sybr Green (Invitrogen) (final concentration: 1x of the 1000x Sybre Green concentrate) were added to 400 µl of the diluted sample. The instrument was calibrated with TruCount Beads™ (BD) with a measurement error of 2% RSD.
2.2.2 Oxygen
Oxygen concentration in the chemostats was measured with a needle sensor (Pyroscience; TROXR430; detection limit: 0.005% O2; accuracy: 0.01% O2 at 0.2% O2). In the batch cultures, optical sensors (PreSens; SPPSt3; detection limit: 0.03% O2; accuracy: ± 0.4% at 20.9% and ± 0.05% at 0.2%) were used. To convert oxygen concentrations into μmol L-1, the oxygen solubility table from Unisense a/s (Ramsing and Gundersen, 2000) was used.
2.2.3 Nutrients
Ammonium, nitrate, nitrite and phosphate were measured with a nutrient analyzer (Skalar, San ++, detection limit<0.3 µmol L-1). The required dilution of samples (up to 100 times) resulted in a precision of <1.6 µmol L-1. On the day of sampling, 15 mL of sample were filtered (0.45 μm glass microfiber GD/X membrane, Whatman ™) in rinsed falcon tubes and kept frozen until analysis (at most seven months).
2.2.4 Nitrous oxide
N2O was sampled from the batch cultures bubble-free in 20 mL vials and closed with butyl rubber stoppers and aluminium caps. N2O samples from the batch culture and N2O incubations of the separate experiment in N2O sampling vials were poisoned with 50 µL saturated mercury chloride solution, shaken and stored in the dark at room temperature until analysis for at most one month. Analysis was conducted with a GC/ECD system (Hewlett Packard; 5890 Series II gas chromatograph) that was calibrated daily with four dilutions of a standard gas (Deuste Steininger GmbH, Mühlheim, Germany) with Helium (AirLiquide GmbH Düsseldorf) ranging between 109 and 994 ppm. For methodological details, see Walter et al. (2006).
2.2.5 Particulate organic carbon and particulate nitrogen
POC and particulate nitrogen (PN) were sampled from the overflow. For analysis, 50–150 mL were filtered onto combusted (8 h, 500°C) GF/F filters (~0.7 μm) and stored at -20°C for at most two months. Samples were analyzed with an elemental analyzer (Euro EA, Hechatech) (Sharp, 1974) that was calibrated with acetanilide standard (0.1 to 0.7 mg) and soil standard (2 to 4 mg). The resulting measurement range was 0.3 to 5.2 µmol nitrogen and 5.7 to 41.5 µmol carbon, with a measurement error of 0.4%.
2.2.6 Dissolved organic carbon and total dissolved nitrogen
For analyses of DOC and total dissolved nitrogen (TDN), 20 mL samples were filtered through a syringe filter (0.45 μm glass microfiber GD/X membrane, Whatman™, rinsed with 25 mL MilliQ and 10 mL sample) into a combusted glass ampoule (8 h, 500°C), before 20 µL of 30% ultrapure hydrochloric acid were added. After sealing the ampule, samples were stored in the dark at 4°C for at most two months. Samples of the chemostat experiment were diluted with ultra-pure water (2:1). Samples were analyzed with a TOC−VCSH using a TNM-1 detector (Shimadzu) and the high-temperature catalytic oxidation method modified from Sugimura and Suzuki (1988) as described in Engel and Galgani (2016). Calibration was conducted with potassium hydrogen phthalate standard solutions (0 to 416.7 µmol C L-1) (Merck 109017) and a potassium nitrate standard solution (0-57.1 µmol N L-1) (Merck 105065). Reference seawater standards (Hansell laboratory RSMAS University of Miami) were used to determine the instrument blanks. Between repeated measurements, the relative standard deviation (RSD) is <1%, and the detection limit is 1 µmol L-1 for DOC and 2 µmol L-1 for TDN.
2.2.7 Dissolved carbohydrates and amino acids
Samples for high-molecular-weight (>1kDa) dissolved combined carbohydrates (DCHO) were taken by filtering 20 mL of seawater through 0.45 µm Acrodisc syringe filters into pre-combusted glass vials (4 h, 500°C) and stored frozen at –20°C until analysis. The analysis was conducted according to Engel and Händel (2011). DCHO samples were first desalinated by membrane dialysis (1 kDa MWCO, Spectra Por) for 5 h at 1°C. DCHO samples were hydrolyzed for 20 h at 100°C with 0.4 M HCl final concentration and then neutralized through acid evaporation under a vacuum and nitrogen atmosphere (1 h, 60°C). Samples were analyzed using high-performance anion-exchange chromatography coupled with pulsed amperometric detection (HPAEC-PAD) on a Dionex ICS 3000. The system was calibrated with a mixed sugar standard solution including the neutral sugars: fucose (Fuc), rhamnose (Rha), arabinose (Ara), galactose (Gal), xylose/mannose (Xyl/Man), and glucose (Glc), the amino sugars: galactosamine (GalN), glucosamine (GlcN), and the acidic sugars: galacturonic acid (GalUA), gluconic acid (GluA), glucuronic acid (GlcUA) and muramic acid (MurA).
Samples for dissolved amino acids (DAA) were taken by filtering 20 mL of seawater through 0.45 µm Acrodisc syringe filters into pre-combusted glass vials (4 h, 500°C) and stored frozen at –20°C until analysis. The analysis was performed according to Lindroth and Mopper (1979) and Dittmar et al. (2009) and modified after Engel and Galgani (2016). 1 mL of the DAA sample was hydrolyzed with 1 mL of 30% hydrochloric acid (Merck, supra pure) in sealed ampoules at 100°C for 20 h. The 2 ml DAA hydrolysate was dried in a microwave at 60°C under a nitrogen atmosphere and washed twice with 0.5 mL of MilliQ to remove any remaining acid. DAA samples were re-dissolved in 1 ml MilliQ for analysis and mixed with 9:1 borate buffer (pH 9.5). A 1260 HPLC system (Agilent) with a C18 column (Phenomenex Kinetex, 2.6 µm, 150 x 4.6 mm) was used for analysis after the separation of thirteen different amino acids and in-line derivatization with o-phtaldialdehyde and mercaptoethanol. A linear gradient was run with 100% Solvent A [5% Acetonitrile (LiChrosolv, Merck, HPLC gradient grade) in Sodium dihydrogen-phosphate buffer (pH 7.0; Merck, suprapur)] to 22% solvent B (Acetonitrile) in 50 min. The following standards were used: asparagine + aspartic acid (AsX), glutamine + glutamic acid (GlX), serine (Ser), glycine (Gly), threonine (Thr), arginine (Arg), alanine (Ala), tyrosine (Tyr), valine (Val), isoleucine (Ile), phenylalanine (Phe), leucine (Leu), and γ- aminobutyric acid (GABA). The detection limit of this analysis was ~1.4 nmol L-1 with a precision of 2%. For the O2-240 HighN treatment only two sampling days were analyzed.
2.2.8 Nitrogen and carbon turnover
The net production rates of POC and PN (rPPOC, PN, µmol L-1d-1) were estimated by Equation 1:
where [POC, PN]chem are the POC and PN concentrations within the chemostat, respectively, at the day of sampling, [POC, PN]medium the respective concentrations in the medium, and D is the dilution rate (0.626 d-1). Since the particulate material in the medium tank was removed during filtration, the correction for [POC, N]medium primarily accounted for the adsorption of dissolved carbon and nitrogen onto the GF/F filter. DOC and total dissolved nitrogen (TDN=DIN+DON) net uptake rates (rUDOC, TDN, µmol L-1d-1) were estimated by the difference in DOC and TDN concentration within the chemostats and the supplied medium multiplied by the dilution rate (Equation 2):
Nitrogen and carbon loss rates (µmol L-1d-1) were calculated as the difference between uptake and production rates. The BGE on carbon (BGE-C) was estimated as a ratio between net POC production and net DOC uptake after Kroer (1993) (Equation 3):
In addition, we calculated the BGE based on nitrogen as ratio between net PN production and net TDN uptake (Equation 4):
2.2.9 Degradation Index
The Degradation Index (DI), derived from the amino acid composition, is an indicator of the diagenetic state of organic matter. The DI was calculated with a principal component analysis (PCA), including the molar percentages of all analyzed DAA except GABA. The PCA is a multivariate regression analysis that can be used to elucidate compositional differences among samples in a data matrix and was performed in R version 3.4.2., using the function prcomp (R Core Team, 2017). Lower DI values indicate more degraded, higher values rather fresh organic material. For instance, typically leucine is degraded preferably compared to glycine. The calculation of the DI, based on the molar percentage of DAA, follows the methodology established by Kaiser and Benner (2009) and builds upon the concept of particulate amino acids developed by Dauwe et al. (1999).
2.3 Statistical analysis and creation of figures
Statistical analysis of the chemostat samples was conducted with a significance level of 0.05 in R (version 3.3.3) (R Core Team, 2017). Differences between the oxygen conditions within one nitrogen treatment were conducted with an ANOVA and a following post hoc test (TukeyHSD). To test the effect of different nitrogen treatments under different oxygen conditions, we conducted a multifactorial ANOVA with a following post hoc test (TurkeyHSD). The number of sampling days differed between the HighN (3 sampling days) and LowN treatment (4 sampling days). To have a balanced design, we excluded sampling day 29 during the multifactorial ANOVA, following the advice of Field et al., 2012. Data were summarized with the R package FSA (Olge, 2017). Differences in sugar composition of O2-5 and O2-oxic were investigated using R version 4.0.1 with the Package vegan (Oksanen et al., 2022). Gluconic acid and galacturonic acid were excluded from this analysis as their concentration was always below the detection limit. As for the multifactorial ANOVA, data from sampling day 29 were excluded. The test was performed separately for oxygen and nitrogen influences. The dissimilarity matrix function Bray-Curtis was chosen. To give information on correlations between carbon and nitrogen parameters, a Pearson correlation coefficient matrix was calculated using SigmaStat and visualized as heatmap (Supplementary Table 3).
3 Results
3.1 Experimental conditions and nutrient dynamics in chemostats with varied oxygen levels
Oxygen concentrations differed between O2-suboxic (O2-5 to O2-15), O2-32 and O2-240 conditions throughout the experiment (Supplementary Table 1). Average oxygen concentrations were <0.5 µmol L-1 within the three O2-suboxic condition chemostats, as bacteria immediately reduced the supplied oxygen. Due to respiration, oxygen concentrations in O2-32 decreased to 6.68 ± 2.06 µmol L-1 in the HighN and 11.28 ± 9.66 µmol L-1 in the LowN treatment. In O2-240, the oxygen concentration was 256 and 252 µmol L-1 in HighN and LowN, respectively, and hence fully oxic throughout the experiment. The pH ranged between 7.66 and 8.01 in HighN and 7.43 and 7.57 in LowN (Supplementary Table 1). To assess the differences between the targeted and actual nutrient concentrations in the supplied medium, we measured the nutrient concentrations in the medium tank on all sampling days (Supplementary Table 2). The average nutrient concentrations in the LowN medium were 217 ( ± 4) µmol L-1 nitrate, 235 ( ± 6) µmol L-1 ammonium and 216 ( ± 16) µmol L-1 phosphate. In the HighN medium, we measured 1140 ( ± 15) µmol L-1 nitrate, 1186 ( ± 18) µmol L-1 ammonium and 227 ( ± 9) µmol L-1 phosphate.
The relative standard deviation of cell abundance within each chemostat was <13% and <22% at the consecutive sampling days of the LowN and HighN treatments, respectively. The highest within chemostat variation was found in the HighN treatment at O2-15, O2-32 and O2-240 (Figure 2). In the HighN treatment, cell abundance was significantly highest under O2-32 (17 x 107 cells mL-1) and similar (8-15 x 107 cells mL-1) under all remaining oxygen conditions. In the LowN treatment, cell abundance increased with oxygen concentrations over the whole range. Already under O2-15 conditions cell abundance (9 ± 0.4 x 10⁷ cells mL-1) was significantly (p<0.01) higher than under the other O2-suboxic conditions (6-8 x 10⁷ cells mL-1). Cell abundance was highest at 20 x 107 cells mL-1 in the O2-240 LowN treatment (Figure 2). Moreover, cell abundance under O2-suboxic conditions was higher in the HighN treatment compared to the LowN treatment, with a significant difference under O2-5 conditions (p=0.02) (Figure 2, Supplementary Table 6).
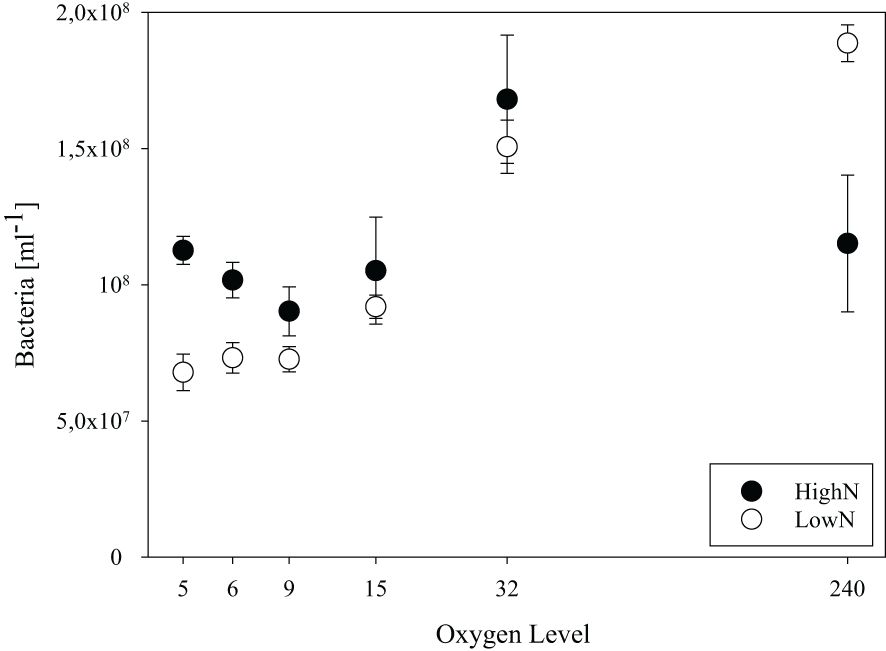
Figure 2 Bacterial abundance in chemostat incubations with different levels of supplied oxygen concentration (µmol L-1) under high (HighN) and low (LowN) reactive nitrogen conditions relative to labile carbon.
DIN speciation differed between O2-suboxic, O2-32, and O2-240 conditions (Figures 3A, B). In the HighN treatment, ammonium concentrations were only slightly lower than in the supplied medium and similar between oxygen levels, varying between 922 and 1117 µmol L-1 (Figure 3A). Nitrite concentrations were below the detection limit in O2-5 to O2-9 and ranged from 4 to 43 µmol L-1 under O2-15 and O2-32 conditions. Under O2-240 conditions, nitrite concentrations were much higher (549 ± 256 µmol L-1). Nitrate concentrations were depleted (<1 µmol L-1) under O2-5-9 conditions and highest under oxic conditions with 480 ± 340 µmol L-1. In the LowN treatment, ammonium concentration differed between oxygen levels and was lowest under O2-240 (4 ± 0.3 µmol L-1) and highest under O2-6 (97 ± 26 µmol L-1) conditions (Figure 3B). Nitrite concentrations were below the detection limit under O2-suboxic conditions but higher under O2-240 (5 ± 10 µmol L-1) and highest under O2-32 (51 ± 24 µmol L-1) conditions. Nitrate concentrations were below the detection limit under O2-suboxic conditions but highest under O2-32 (67 ± 26 µmol L-1).
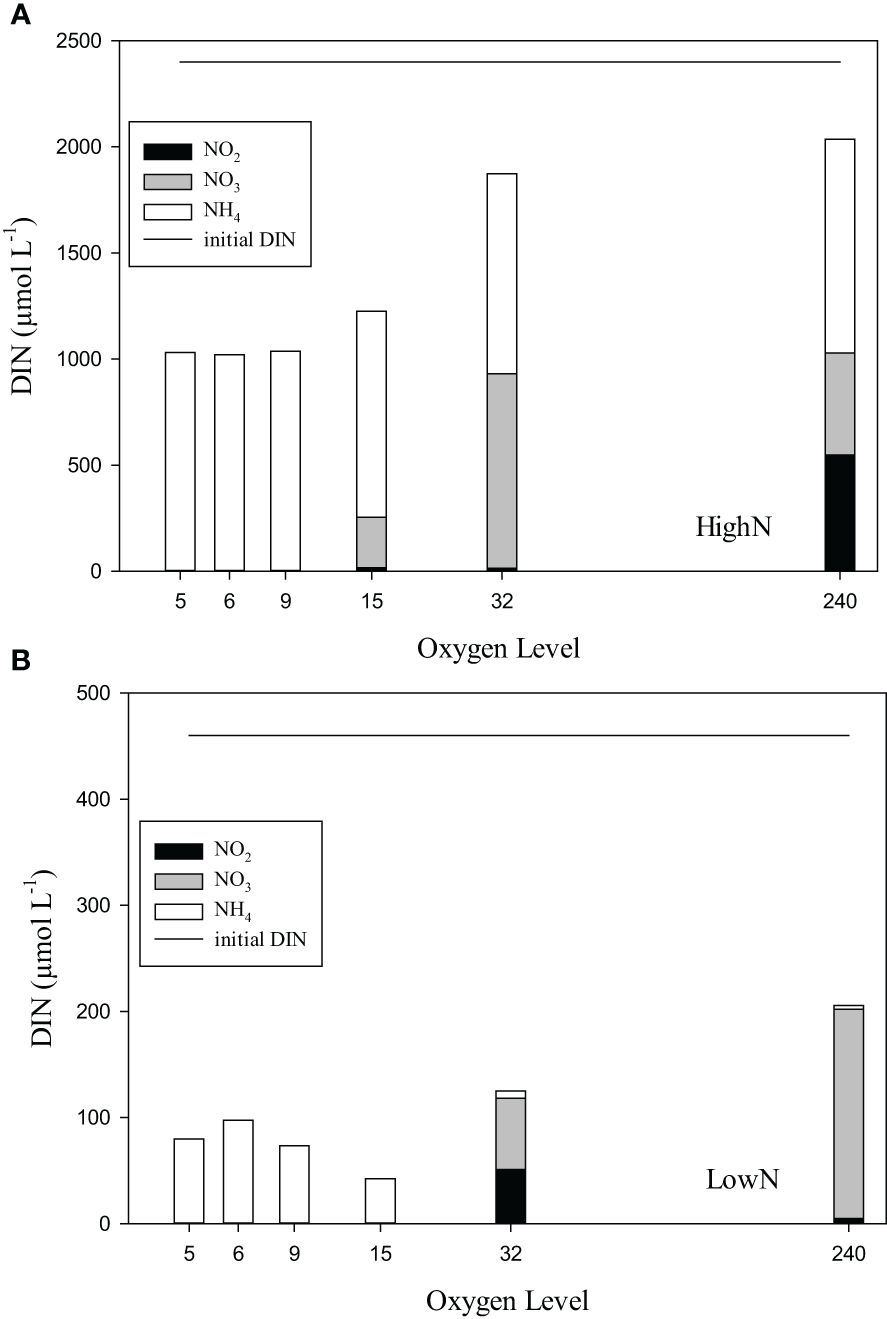
Figure 3 (A, B) The dissolved inorganic nitrogen (DIN) components ammonium (NH4), nitrite (NO2) and nitrate (NO3) in chemostats with different levels of supplied oxygen concentration (µmol L-1) during the HighN and LowN treatments. Initial DIN concentration (NO3 and NH4; 1:1) of the supplied medium was the same for all oxygen levels and is indicated by the straight line.
3.2 Oxygen-dependent nitrogen turnover rates and denitrification
Nitrogen turnover rates were averaged for each chemostat over the experiment duration. TDN net uptake rates (rUTDN) differed between HighN and LowN treatment (Figure 4A). The highest rates were observed in the suboxic HighN treatments O2-5 and O2-6, varying between 731-747 µmol L-1 d-1. rUTDN was somewhat lower at O2-15 with 626 µmol L-1 d-1 and strongly reduced at O2-32 and O2-240. In the LowN treatment, rUTDN was similar in chemostats O2-5 to O2-32 varying between 218 and 274 µmol L-1 d-1, and slightly reduced in the oxic treatment O2-240 with 161 µmol L-1 d-1. Production of PN was not significantly different between the oxygen levels in both nitrogen treatments and ranged between 87 and 128 µmol L-1 d-1 in HighN and between 86 and 129 µmol L-1 d-1 in LowN (Figure 4C). However, PN production showed a slight increase with increasing oxygen concentration in the LowN treatment, in agreement with increasing cell abundance.
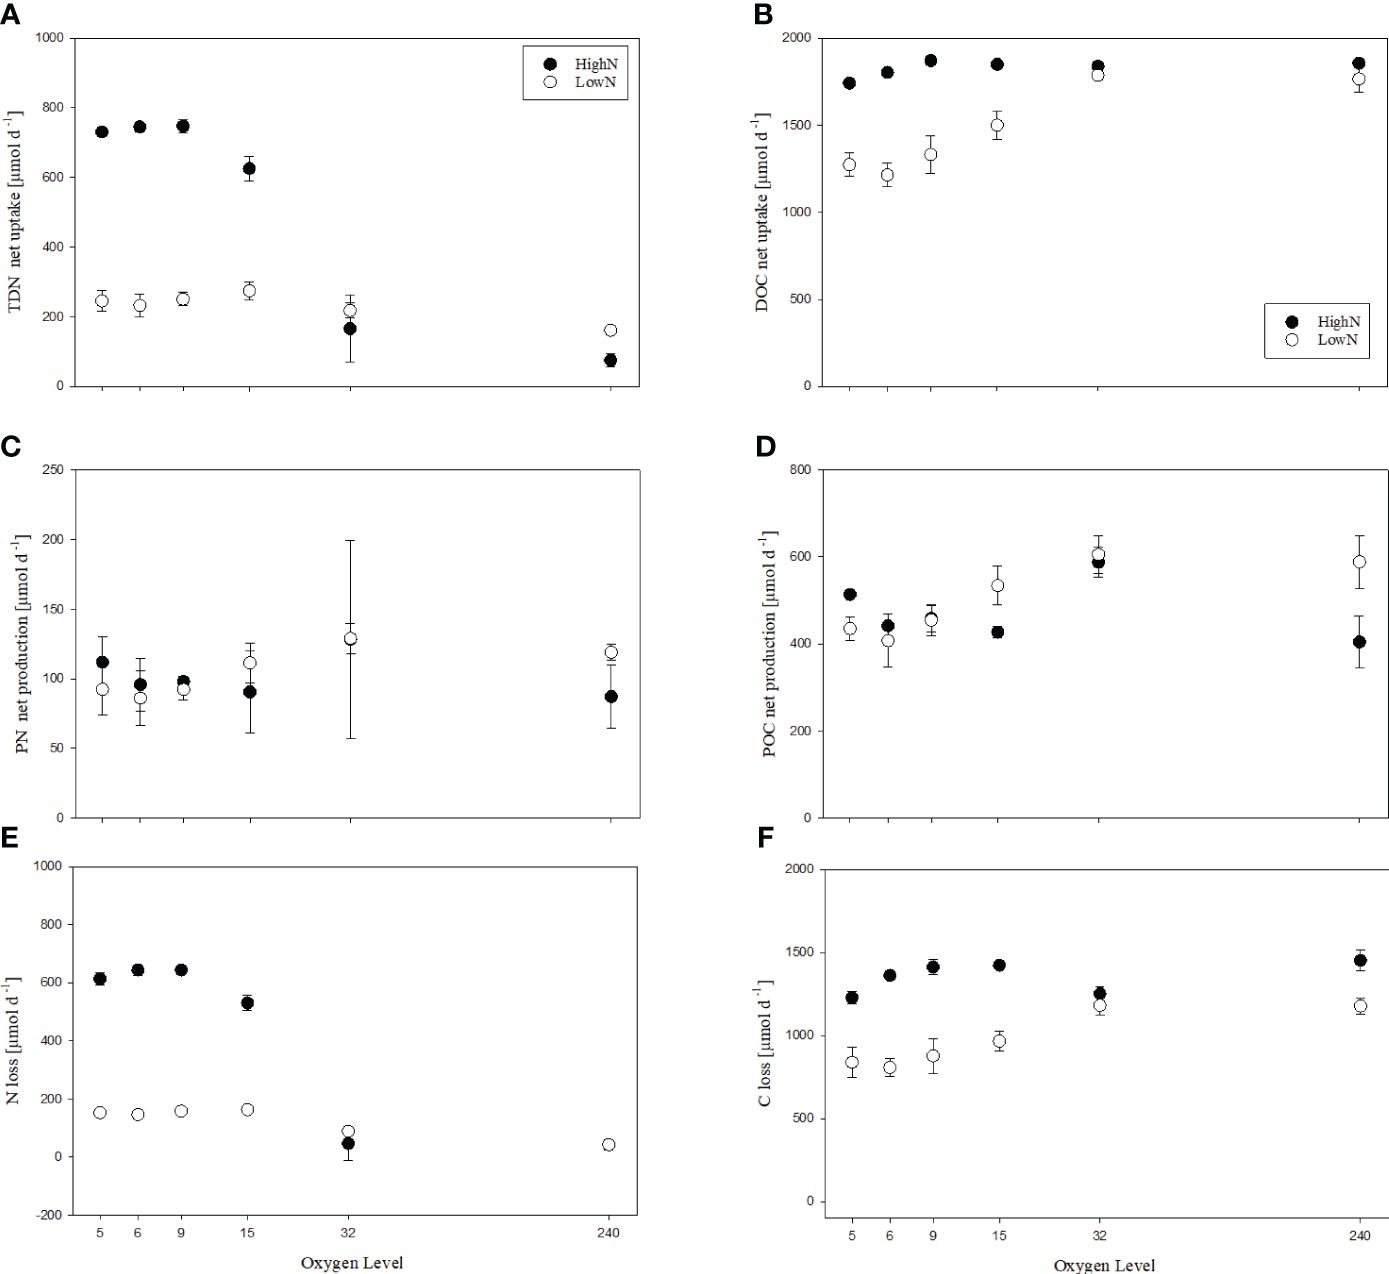
Figure 4 Nitrogen (A, C, E) and carbon (B, D, F) turn-over rates in incubations with different levels of supplied oxygen concentration (µmol L-1) under high (HighN) and low (LowN) reactive nitrogen conditions relative to labile carbon.
Net TDN uptake exceeded PN production in all chemostats except for HighN/O2-240, resulting in a loss nitrogen (Figure 4E). The highest nitrogen loss was observed in the O2-suboxic HighN treatment 613 to -644 µmol L-1 d-1. In the LowN treatments, nitrogen loss was higher in the O2-suboxic chemostats (146 to 163 µmol L-1 d-1) than in the O2-32 (89 µmol L-1 d-1). Under oxic conditions, no nitrogen loss was determined in the HighN treatment, whereas a slight loss was calculated for the LowN treatment (42 ± 5.6 µmol L-1 d-1).
Previous studies have shown that strains of S. baltica denitrify, producing both N2O and, to a large extent, N2 in the Baltic Sea (Brettar et al., 2001) To investigate a possible production of N2O as an intermediate product of denitrification that may explain the observed loss of nitrogen in chemostats under suboxia, we conducted two additional experiments (see methods for details, Figures 1C, D). In the first experiment (batch culture), oxygen concentrations during the first five days were, on average, 224 µmol L-1 (94-269 µmol L-1), being especially low on day 4, probably due to enhanced growth activity. After day 5, two out of the four incubations were exposed to suboxia with oxygen concentrations<0.6 µmol L-1. The other two incubations were kept under oxic conditions (249-265 µmol L-1). In the suboxic incubations, total nitrogen was again lost in significant amounts (-35 and -37 µmol L-1), and N2O concentrations were high (81 and 240 nmol L-1), indicating denitrification by S. baltica. In the two oxic incubations, no significant loss of nitrogen was observed ( ± 7 µmol L-1) (Figure 4E) and N2O concentrations were comparable to atmospheric conditions (10 and 12 nmol L-1) (Supplementary Figure 1). The second experiment (bottle incubation) further confirmed the production of N2O by S. baltica. Concentrations of N2O increased exponentially over time from 2 nmol L-1 at the beginning of the experiment to 56 nmol L-1 after seven days of incubation (Supplementary Figure 2).
3.3 Oxygen-dependent carbon turnover under high and low nitrogen conditions: Implications for DOC and POC dynamics
DOC uptake was generally higher in the HighN compared to the LowN treatment (Figure 4B). In the HighN treatment, DOC uptake varied between 1713 and 1896 µmol L-1 d-1, suggesting efficient depletion of supplied glucose (theoretical glucose supply: 1878 µmol L-1 d-1; measured DOC supply, including other carbon sources in the medium, e.g. vitamins: 2034 ± 10 µmol L-1 d-1). DOC uptake slightly decreased under O2-suboxic conditions, being lowest in O2-5 (p<0.01) and higher in O2-9 than in O2-6 and O2-5 (p<0.01), while it was similar at higher oxygen concentrations (Supplementary Table 4). In the LowN treatment, DOC uptake (1702-1872 µmol L-1 d-1) was significantly higher under O2-32 and O2-240 conditions than under O2-suboxic conditions (p<0.01) and almost equal to the amount of labile carbon supplied in the form of glucose (theoretical carbon supply: 1878 µmol L-1 d-1; measured carbon (DOC) supply: 1995 ± 43 µmol L-1 d-1). DOC uptake was significantly higher under O2-15 compared to O2-5 and O2-6 conditions (p<0.01) (Supplementary Table 5).
The production of POC varied between 343 and 617 µmol L-1 d-1 in the HighN treatment and was highest under O2-32 (Figure 4D). Otherwise, no significant impact of oxygen concentration on POC production was found. In the LowN treatment, however, POC production showed increasing trends with increasing oxygen concentrations and ranged from 353 to 652 µmol L-1 d-1, with significantly higher rates under O2-32 and O2-240, compared to O2-5, O2-6 and O2-9 conditions (p<0.01) (Supplementary Table 5). Additionally, POC production was significantly higher under O2-15 compared to O2-6 conditions (p=0.01) but similar under O2-32 and O2-240 conditions. The increment of DOC uptake and POC production with increasing oxygen concentrations was thus more pronounced in the LowN treatment compared to the HighN treatment.
The trend of oxygen dependence on carbon turnover observed for the LowN treatment reversed after normalization to cell abundance, i.e. the cell-specific carbon uptake and production rates decreased with increasing oxygen concentration, indicating higher cell division rates under more oxic conditions. Cell-specific POC production was significantly higher under O2-suboxic (5-7 fmol cell-1 d-1) compared to O2-32 conditions and decreased significantly further under O2-240 conditions (3-4 fmol cell-1 d-1) (p<0.01) (Supplementary Table 5). The same was true for the cell-specific DOC uptake, being significantly higher under O2-suboxic (16-22 fmol cell-1 d-1) compared to O2-32 and O2-240 (9-13 fmol cell-1 d-1) conditions (p<0.01) (Supplementary Table 5). In the HighN treatment, we observed only a slight decrease in cell-specific POC production with increasing oxygen concentration. Cell-specific POC production under O2-32 (4 ± 0.3 fmol cell-1 d-1) was significantly lower than under O2-9 (5 ± 0.5 fmol cell-1 d-1) (p=0.01) but similar to cell-specific POC production under O2-6, O2-5 and O2-15 conditions. Cell-specific POC production was also similar between O2-32 and O2-240 conditions (Supplementary Table 4). Moreover, cell-specific DOC uptake was lower under O2-32 (11 ± 2 fmol cell-1 d-1) than under O2-suboxic conditions, with a significant difference to the uptake under O2-9 (p=0.01, 21 ± 2 fmol cell-1 d-1) and O2-15 conditions (p=0.05, 18 ± 4 fmol cell-1 d-1). Cell-specific DOC uptake was similar under O2-240 and O2-32 conditions (Supplementary Table 4).
At oxygen levels, O2-5 to O2-15 DOC uptake rates were higher in the HighN treatment, whilst POC production rates were similar in both nitrogen treatments. In consequence, C-loss rates differed strongly between HighN and LowN at low oxygen concentrations (Figure 4F). C-loss rates varied between 1228 and 1452 µmol L-1 d-1 in HighN and between 808 and 1181 µmol L-1 d-1 in LowN. Since carbon is lost from the system primarily as CO2, our data suggest that cell-specific respiration rates were 7.6-15.8 fmol CO2 cell-1 d-1 under HighN and 6.2-12.5 fmol CO2 cell-1 d-1 under LowN. Thereby, cell-specific CO2 production in the LowN was higher under suboxic conditions (O2-5-15:10.5-12.5 fmol CO2 cell-1 d-1) compared to the more oxygenated chemostats (O2-32-240: 6.2- 7.9 fmol CO2 cell-1 d-1). In the HighN treatment, cell-specific respiration was comparable between suboxic (O2-5-15:10.9-15.8 fmol CO2 cell-1 d-1) and oxic conditions (O2-32-240: 7.6- 13.8 fmol CO2 cell-1 d-1).
3.4 Differential carbon and nitrogen turnover responses to oxygen reduction under low and high nitrogen conditions
The LowN and HighN treatments differed in magnitude of carbon and nitrogen turnover and the response to oxygen reduction. The [POC]:[PN] ratio, which here represents the carbon-to-nitrogen ratio of the bacterial-produced biomass, varied between 4.4 and 4.8 (4.58 ± 0.11) in the HighN and between 4.6-5.1 (4.88 ± 0.11) in the LowN treatment. No significant differences of [POC]:[PON]were determined between oxygen concentrations in both treatments (Supplementary Tables 4, 5). In contrast, the ratios of carbon and nitrogen lost from the system in gaseous form (C: N loss) were lower under suboxic conditions in the HighN treatments, ranging from 2.0 ± 0.1 at the lowest O2 -level (O2-5) treatment to 2.69 ± 0.13 in O2-15 and more pronounced to 27 ± 22 in O2-32. Since no nitrogen loss was detectable in the HighN O2-240 chemostat, no C: N loss ratio was determined. In the LowN treatment, C: N loss ratios increased gradually from 5.54 at suboxic levels to 31 in the fully oxic chemostat.
BGEs were compared for growth efficiencies on carbon (BGE_C) and on nitrogen (BGE_N) (Figure 5). In the HighN treatment, the BGE_C ranged between 22 and 34% and did not change consistently with oxygen concentrations, although individual treatments were different (Supplementary Table 4). Under LowN conditions, BGE_C ranged between 29 and 38% and was similar between the different oxygen conditions, also (Figure 5). Nitrogen-based BGE showed the highest differences between HighN and LowN in all suboxic treatments (Figure 5); average BGE_N in the LowN was 37 ± 1.8% and significantly higher than in the HighN treatment (14 ± 0.8%) (p<0.01). This pattern reversed at O2-32, and at fully oxic conditions, dissolved nitrogen was completely assimilated into biomass in HighN. Here, BGE_N was even higher than the theoretical maximum value of 100%. This may be attributed to different efficiencies during PN and TDN sampling and/or analyses.
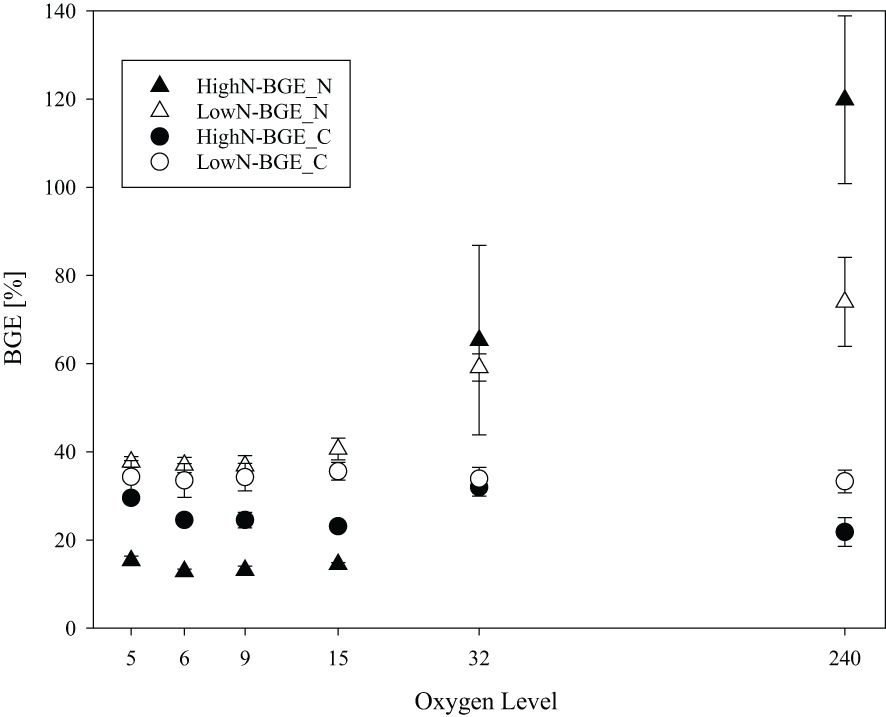
Figure 5 Bacterial growth efficiency with respect to carbon (BGE_C) and nitrogen (BGE_N) in chemostats with different oxygen levels during the HighN and LowN treatments.
3.5 Oxygen-dependent dynamics of organic matter composition under low and high nitrogen conditions
High molecular weight (>1kDa) dissolved combined carbohydrates (DCCHO) were released from the cells during the experiment in all chemostats (Figure 6). DCCHO concentration gradually increased with increasing oxygen levels in the LowN treatment, from 2.0 ± 0.23 µmol L-1 in O2-5 to 14.2 ± 5.6 µmol L-1 in O2-240. In the HighN treatment, the highest DCCHO concentration was observed at O2-32 with 5.0 ± 1.7 µmol L-1 declining to 2.4 ± 0.58 µmol L-1 in O2-5 and 3.0 ± 1.1 µmol L-1 in O2-240. Cell-specific DCCHO production ranged between 1.32 and 4.72 x 10⁻² fmol cell-1 d-1. Both absolute DCCHO concentration and cell-specific DCCHO production were highest in the fully oxic O2-240 LowN chemostat. DCCHO composition differed between the same oxygen levels in HighN and LowN and was pronounced between suboxic (O2-5) and oxic (O2-240) conditions (Figure 7). Little variation was observed between replicate sampling, suggesting that the composition of DCCHO was significantly affected by oxygen concentration (p<0.001). Comparing the suboxic level O2-5 between the nitrogen treatments showed that glucose was the dominant sugar in DCCHO in HighN with a molar fraction of 33 Mol%, followed by glucosamine with 22 Mol%. In the LowN treatments, the fraction of glucosamine was higher, yielding a similar share of glucosamine and glucose (~36 Mol%). Under oxic conditions, DCCHO composition differed from suboxic conditions and contained high amounts of arabinose and mannose/xylose; the fractions of glucose and glucosamine were strongly reduced. In particular, the DCCHO produced in the LowN O2-240 treatment had the highest fractions of arabinose (51 Mol%) and mannose/xylose (45%). Since the total DCCHO concentration in LowN O2-240 was much higher than in all other chemostats, DCCHO production and composition under fully oxic and LowN conditions were clearly distinct. At suboxic conditions, arabinose was absent in both the HighN and the LowN treatment (Supplementary Figure 3).
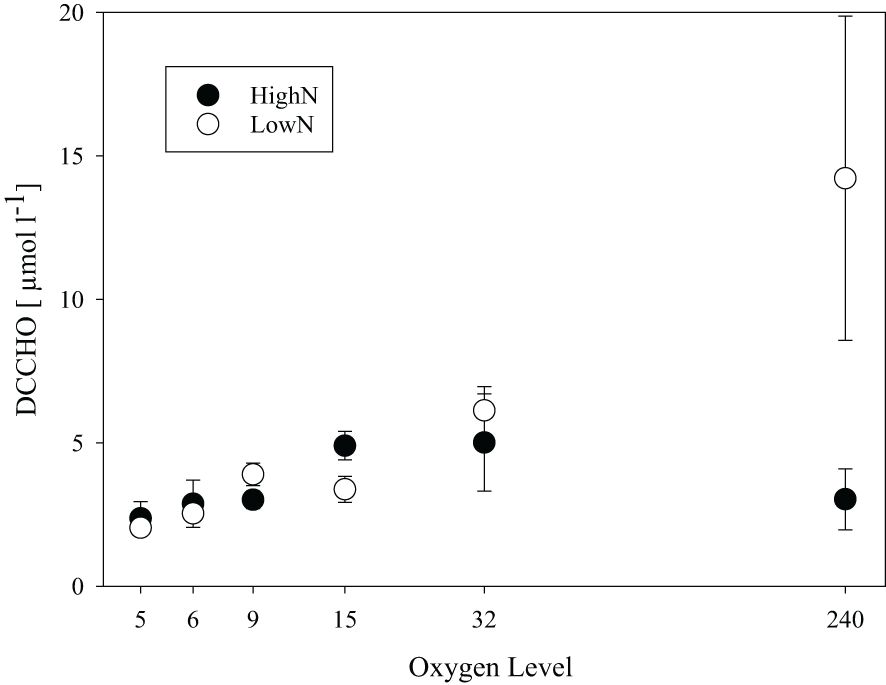
Figure 6 Total concentration of high-molecular-weight dissolved combined carbohydrates (DCCHO) in chemostats with different supplied oxygen levels during the HighN and LowN treatments.
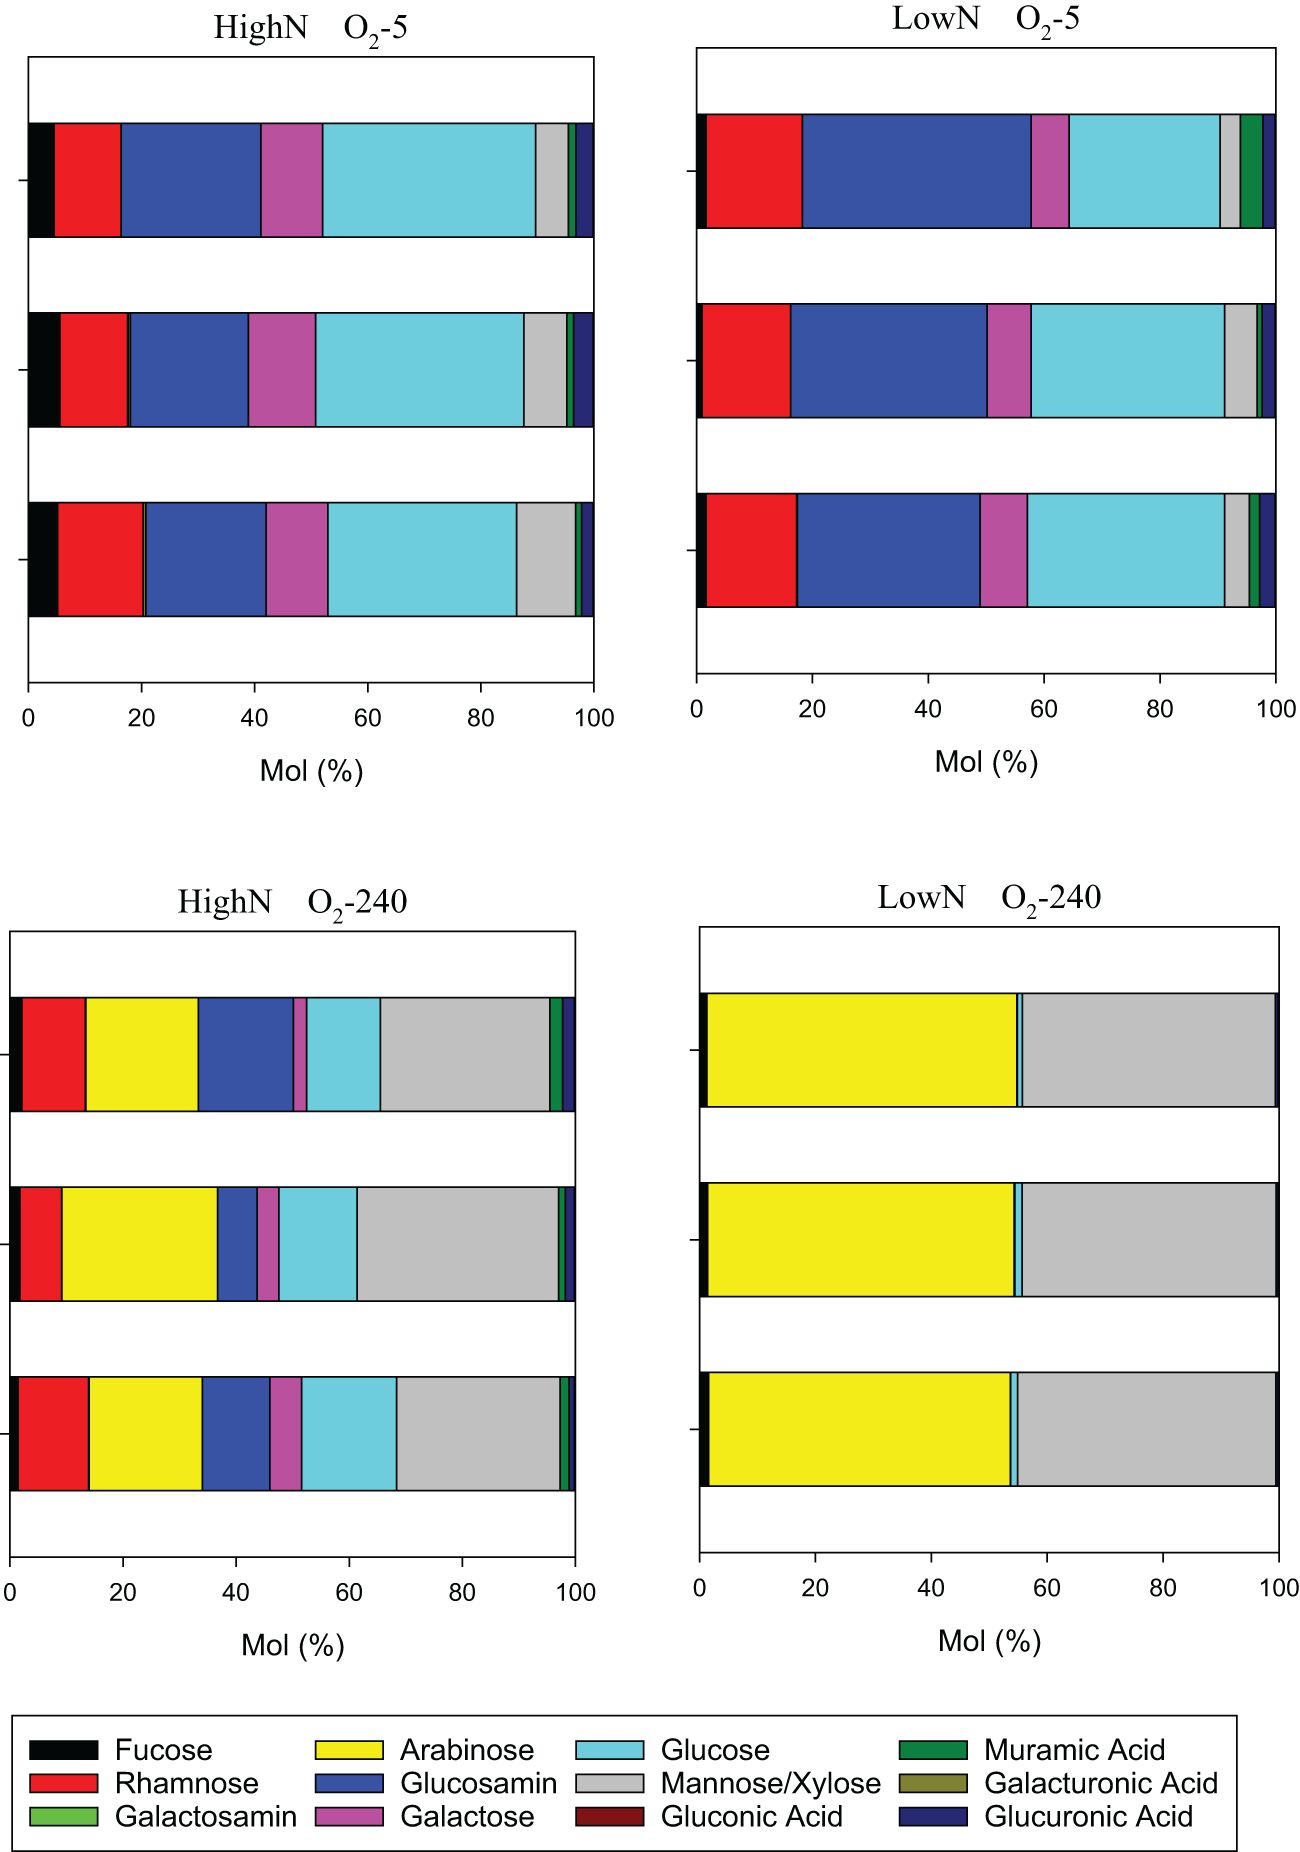
Figure 7 Molar composition of high-molecular-weight dissolved combined carbohydrates (DCCHO) at the lowest and highest oxygen levels during the HighN and LowN treatments.
The DI based on dissolved hydrolysable amino acid composition indicates the diagenetic state of organic matter (Dauwe et al., 1999; Kaiser and Benner, 2009). In the HighN treatment, the DI was significantly lower under O2-32 and O2-240 conditions, suggesting higher reworking of DOM under oxygenated conditions (p<0.01) (Supplementary Figure 4; Supplementary Table 4). Trends differed somewhat in the LowN incubations, where the DI was similar between O2-suboxic and O2-32 conditions but significantly lower only under fully oxic, O2-240 conditions also (p<0.01).
4 Discussion
4.1 Bacterial carbon utilization and nitrogen loss dynamics at different oxygen concentration
We conducted a continuous culture experiment to explore changes in bacterial carbon utilization at different oxygen concentrations. The set-up allowed consecutive sampling without changing the chemical environment (Novick and Szilard, 1950). Notably, there were significant variations in oxygen concentrations among the O2-240, O2-32 and O2-5 to O2-15 conditions (Figure 1B, Supplementary Table 1). The transition to suboxic conditions in O2-5 to O2-15 occurred promptly, while in O2-32 (i.e., hypoxic conditions), oxygen concentrations displayed fluctuations, indicating dynamic changes in respiration rates (Supplementary Table 1).
In continuous culture systems like ours, strictly in chemostats under steady-state conditions, cell yields are determined by the limiting substrate supplied, and growth rates equal dilution rates as long as the dilution rate does not exceed the maximum growth rate (Novick and Szilard, 1950). In our experiment, the cell yield of S. baltica was likely limited by the availability of organic carbon, i.e. glucose. Under higher oxygen conditions, the uptake of DOC was equal to the amount supplied, suggesting a depletion of glucose in the chemostat. Other substrates like TDN or phosphate were still abundant. Under lower oxygen conditions, carbon assimilation was influenced by the availability of oxygen or alternative electron acceptors (i.e., NO3). As a consequence, DOC uptake and the cell yields of S. baltica were reduced.
In addition to the chemostat set-up, we conducted two independent batch experiments with S. baltica to verify nitrogen loss by measuring the intermediate product N2O (Supplementary Figures 1, 2). The proportion between formed N2O and the observed nitrogen loss (0.23 and 0.65%) in the suboxic batch experiment alignes with literature, as only 0.1-6% of denitrified nitrogen can be detected as N2O (Nishio et al., 1983; Seitzinger, 1988; Seitzinger and Kroeze, 1998; Beaulieu et al., 2011). According to Mahne and Tiedje (1995), denitrification is defined as the transformation of at least 80% of reduced nitrate or nitrite into N2O or N2 gas. Under O2-suboxic conditions in the chemostat experiment, 84-95% and ≥100% of nitrate was removed from the system in the HighN and LowN treatment, respectively, suggesting that denitrification was mainly responsible for observed nitrogen loss.
4.2 Impact of electron acceptor availability on cell growth and carbon turnover
Denitrification requires organic compounds as carbon and electron donors. For glucose as an organic substrate, the equation can be described after Kirchman (2018) (Equation 5):
With an energy release of ΔG of -2657 kJ mol-1. According to this, denitrification has a stoichiometric C: N loss ratio of 1.25. Shewanellae can also perform dissimilatory nitrate reduction to ammonium (DNRA) (Chen and Wang, 2015). Based on glucose as an electron donor and carbon source, the equation can be formulated as (Kirchman, 2018) (Equation 6):
The DNRA reaction yields substantially less energy (ΔG of -1767 kJ mol-1) than denitrification, leading to a loss of carbon as CO2 but not nitrogen since NO3- is reduced to NH4+. Compared to denitrification, DNRA also has a lower NO3 requirement.
The differences in the transformation of nitrate to gaseous nitrogen (N loss), in relation to the production of CO2 (C loss), allow an estimation of the ratios of denitrification and DNRA. An average C: N loss ratio of ~2 was determined for all suboxic chemostats in the HighN treatment. This low C:N loss ratio points to denitrification as the dominant anaerobic respiration process, responsible for nitrogen loss. More specifically for the HighN, the observed C:N loss ratio indicates that for every 5 mol of glucose respired by denitrification, 3 mol glucose were respired by DNRA. In the LowN treatment, the average C:N loss ratio under suboxic conditions was 5.5 suggesting that anaerobic respiration pathways other than denitrification became more important. Thus, for every 5 mol of glucose respired by denitrification, 17 mol glucose were likely respired by DNRA, shifting the dominance from denitrification to DNRA. The relatively high concentrations of ammonium in the O2-suboxic LowN treatment (Figure 3A) further indicated the formation of ammonium during DNRA. A small glucose fraction was likely metabolised by aerobic/microaerobic respiration supported by the continuous O2-5 to O2-15 aeration.
Under O2-suboxic conditions, oxygen and nitrate concentrations were close to the detection limit in both treatments, indicating that electron acceptors limited the bacterial cell yield and glucose uptake (Figures 3, 5, Supplementary Table 1). In the LowN treatment, the increasing cell abundance with increasing oxygen concentration showed that oxygen as an electron acceptor stimulated glucose uptake and cell growth (Figure 2). In the HighN treatment, we observed that cell abundance did not consistently decrease with oxygen concentration. This suggests that the supply of nitrate as an alternative electron acceptor mitigated any limitations typically associated with electron acceptors when compared to the LowN treatment (see Figure 2). In both treatments, cell abundances differed between O2-32 and O2-240 conditions, although electron acceptors did not seemingly limited glucose uptake in either of those treatments.
In the HighN treatment, cell abundance was higher in O2-32 than O2-240. In contrast, cell abundance in the O2-240 exceeded abundance in the O2-32 in the LowN treatment. In the treatments with lower cell abundances (O2-240 HighN, O2-32 LowN), nitrite seemed to accumulate, and nitrate concentrations were reduced and more variable compared to the respective treatments with higher cell abundances (O2-32 HighN, O2-240 LowN) (Figures 3A, B). One explanation for the observed differences in cell abundance is insufficient diffusion of oxygen or nitrate through bacterial aggregates, not sustaining the demand for electron acceptors. Interestingly, arabinose, a sugar included in bacterial EPS from biofilms and aggregates (Casillo et al., 2018), was a major component of DCCHO under O2-32 and O2-240 conditions (Figure 7, Supplementary Figure 3), supporting the idea of aggregate formation in these chemostats. Oxygen limiting conditions have already been detected within cyanobacteria and diatom aggregates, supporting our hypothesis (Klawonn et al., 2015; Ploug and Bergkvist, 2015; Bianchi et al., 2018). Aggregate formation, that was also visible within the chemostats may also partially explain lower cell abundance in the HighN O2-240 treatments, as cell counting by flow cytometry cannot resolve cell numbers in aggregates.
The two different anaerobic respiratory pathways considered in this study, denitrification and DNRA yield 1 and 36% per oxidized carbon atom less energy than aerobic respiration, respectively (Lam and Kuypers, 2011). Two hypotheses can be raised: i) the reduced energy yield hampers bacterial activity, or ii) the reduced energy yield can be compensated by an increased anaerobic respiration of labile organic carbon (glucose in this experiment) to enhance the metabolic energy yield. In our study, the POC/PN ratio (4.4-5.1) was well within the range previously observed for bacterial biomass (3.7-5) (Goldman et al., 1987; S. Lee and Fuhrman, 1987). Therefore, the ratio between POC production and DOC uptake can be used as an indicator for BGE_C (Kroer, 1993). The higher cell-specific DOC uptake and the lower C: N loss under O2-suboxic compared to O2-32 and O2-240 conditions in both treatments support the hypothesis of increased anaerobic respiration under oxygen-limiting conditions. However, BGE_C did not consistently change with oxygen concentrations (Figures 5). Hence, enhanced anaerobic respiration almost compensated for the reduced energy gain, resulting in similar BGE_C under oxic and suboxic conditions. BGE_C has been suggested to increase with increasing mineral nutrient supply (DelGiorgio and Cole, 1998). In our study, BGE_C, however, was lower in HighN despite higher NO3- supply; except for O2-32. One explanation might be that a higher fraction of nitrogen is lost from the system during denitrification than during DNRA. Indeed, N loss under suboxia was highest in HighN, while BGE_N and BGE_C were reduced. This suggests that denitrification can compensate for the lower energy gain compared to aerobic respiration at the potential expense of reduced organic matter production. DNRA, in contrast, has a lower energy gain but leads to a supply of NH4 that can be used for biomass production. Switching between denitrification and DNRA would thus allow the cell to adapt to environmental variations in organic carbon and NO3- supply.
4.3 Implications for carbon cycling in oxygen minimum zones
Within marine ecosystems, the microbial loop connects the DOM and POM pools, enabling the transfer of organic matter to higher trophic levels (Azam et al., 1983). Thus, oxygen-dependent differences in bacterial carbon turnover can be highly relevant for food web dynamics. Our results suggest that a high NO3:Corg. supply under suboxia favors denitrification and supports bacterial DOC turnover (DOC uptake, cell growth and POC formation) to a similar extent as aerobic respiration. However, denitrification is at the expense of reactive nitrogen, which is subsequently lost from the system as N2O and N2 and will reduce the build-up of biomass in the long run. Therewith, denitrification is a natural process counteracting eutrophication in systems like the Baltic Sea (Voss et al., 2005). Denitrification is considered to be favored under carbon-limited conditions, while DNRA would be favored in nitrate-limited environments rich in labile carbon (Kelso et al., 1997). Our results support this assumption as the lower NO3:Corg. supply ratio in the LowN chemostats seemingly favored DNRA, resulting in lower POC production, cell growth and higher CO2 release, but keeping nitrogen within the system, either as ammonium, cellular nitrogen or labile DOM. In the Baltic Sea, denitrification rates in the water column are up to two orders higher than DNRA (Bonaglia et al., 2016), which may point to a lack of labile carbon sources. The amino acid-based DI indicated that DOM in the LowN suboxic chemostats was more labile. Production of more labile DOM under suboxic conditions aligns with previous findings of natural Baltic Sea microbial consortia (Maßmig et al., 2019). In contrast, the release of polysaccharides generally increased with oxygen concentration (except for HighN O2-240), and composition changed towards more arabinose and mannose containing DCCHO. Arabinose and mannose have been found in DCCHO, facilitating the adhesion of bacteria to surfaces, biofilm formation and microcolony of bacteria within (Kavita et al., 2013). From an ecological point of view, bacterial microcolony formation provides a defence from size-selective nanoflagellate grazing (Hahn et al., 2000). Since nanoflagellates are likely more susceptible to suboxia, minimizing grazing pressures through flocculation/colony formation may be more beneficial under oxic conditions.
Similar to OMZs, the presented study included environments with fine-scaled variations in oxygen supply. The incubations, often summarized as O2-suboxic (O2-5 to O2-15), differed in cell abundance, DOC-uptake, DI, BGE_C and BGE_N (Figure 2, 4B, 5, Supplementary Table 4). Especially in the LowN treatment, the trends of higher carbon cycling and cell growth with increasing oxygen concentrations are continued at suboxic levels. These results illustrate that even changes of a few µmol in oxygen concentrations have the potential to significantly influence bacterial carbon cycling.
In this study, the monomeric sugar glucose was used as a labile organic carbon substrate. In marine oxygen minimum zones, however, organic carbon is usually bound in more complex molecules that must first enzymatically be broken down and/or converted into labile substrates. Recent work suggests that the metabolisation of organic matter in these systems is also related to the oxygen sensitivity of catabolic enzymes (Giovannoni et al., 2021). Future studies, therefore, need to investigate whether the conclusion that oxygen deprivation does not hinder carbon turnover as long as alternative electron acceptors are abundant also holds when the available organic carbon compounds are more complex and refractory than in our study.
5 Summary and conclusion
In the Baltic Sea, DNRA and denitrification are important anaerobic pathways involved in the heterotrophic carbon cycle. Our study suggests that cell growth and carbon turnover of S. baltica are only limited under suboxia when the supply of alternative electron acceptors is low relative to labile carbon. A decrease in organic carbon decomposition can be expected if the availability of electron acceptors such as nitrate cannot compensate for the reduced energy gain of anaerobic respiration. To better assess the interplay of eutrophication and deoxygenation, future models should take the gradual reduction of bacterial carbon turnover with decreasing oxygen availability and co-limitations of labile organic substrates and electron acceptors into account. This may also help to assess long-term consequences and feedbacks, as DNRA may promote eutrophication while denitrification counteracts it. A combination of community analyses, microbial rate measurement, estimation of physical fluxes and determination of available electron acceptors are needed to validate our results for natural environments with fluctuating oxygen concentrations, such as the Baltic Sea.
Data availability statement
The original contributions presented in the study are included in the article/Supplementary Material. Further inquiries can be directed to the corresponding author.
Author contributions
MM: Writing – review & editing, Writing – original draft, Visualization, Validation, Methodology, Investigation, Formal analysis. CCN: Writing – review & editing, Supervision, Investigation. AE: Writing – review & editing, Writing – original draft, Visualization, Supervision, Resources, Funding acquisition, Formal analysis, Conceptualization.
Funding
The author(s) declare financial support was received for the research, authorship, and/or publication of this article. This study was funded by the Helmholtz Association within the Program-Oriented Funding (PoF), and is a contribution to PoF IV Topic 6.3.
Acknowledgments
We thank Kristina Bayer, Ute Henschel Humeida, Jutta Wiese, Tanja Rahn, Tania Klüver, Ruth Flerus, Judith Pionthek, Jon Roa, Marina Zamanillo for the support during the experimental design, pre-experiments and during the experiment, Bente Gardeler for nutrient analysis, Hermann Bange, Damian A. Arévalo-Martínez and Annette Kock for the support during N20 analysis and Benjamin Pontiller for helping with S. baltica genome information.
Conflict of interest
The authors declare that the research was conducted in the absence of any commercial or financial relationships that could be construed as a potential conflict of interest.
Publisher’s note
All claims expressed in this article are solely those of the authors and do not necessarily represent those of their affiliated organizations, or those of the publisher, the editors and the reviewers. Any product that may be evaluated in this article, or claim that may be made by its manufacturer, is not guaranteed or endorsed by the publisher.
Supplementary material
The Supplementary Material for this article can be found online at: https://www.frontiersin.org/articles/10.3389/fmars.2024.1328392/full#supplementary-material
References
Andersen J. H., Carstensen J., Conley D. J., Dromph K., Fleming-Lehtinen V., Gustafsson B. G., et al. (2017). Long-term temporal and spatial trends in eutrophication status of the Baltic Sea. Biol. Rev. 92, 135–149. doi: 10.1111/brv.12221
Azam F., Fenchel T., Field J., Gray J., Meyer-Reil L., Thingstad F. (1983). The ecological role of water-column microbes in the sea. Mar. Ecol. Prog. Ser. 10, 257–263. doi: 10.3354/meps010257
Beaulieu J. J., Tank J. L., Hamilton S. K., Wollheim W. M., Hall R. O., Mulholland P. J., et al. (2011). Nitrous oxide emission from denitrification in stream and river networks. Proc. Natl. Acad. Sci. 108, 214–219. doi: 10.1073/pnas.1011464108
Bianchi D., Weber T. S., Kiko R., Deutsch C. (2018). Global niche of marine anaerobic metabolisms expanded by particle microenvironments. Nat. Geosci. 11, 263–268. doi: 10.1038/s41561-018-0081-0
Bonaglia S., Klawonn I., De Brabandere L., Deutsch B., Thamdrup B., Brüchert V. (2016). Denitrification and DNRA at the Baltic Sea oxic-anoxic interface: Substrate spectrum and kinetics. Limnol. Oceanogr. 61, 1900–1915. doi: 10.1002/lno.10343
Borchard C., Borges A. V., Händel N., Engel A. (2011). Biogeochemical response of Emiliania huxleyi (PML B92/11) to elevated CO2 and temperature under phosphorous limitation: A chemostat study. J. Exp. Mar. Biol. Ecol. 410, 61–71. doi: 10.1016/j.jembe.2011.10.004
Brettar I., Höfle M. (1993). Nitrous oxide producing heterotrophic bacteria from the water column of the central Baltic : abundance and molecular identification. Mar. Ecol. Prog. Ser. 94, 253–265. doi: 10.3354/meps094253
Brettar I., Moore E. R. B., Höfle M. G. (2001). Phylogeny and abundance of novel denitrifying bacteria isolated from the water column of the central Baltic Sea. Microb. Ecol. 42, 295–305. doi: 10.1007/s00248-001-0011-2
Carstensen J., Andersen J. H., Gustafsson B. G., Conley D. J. (2014). Deoxygenation of the Baltic Sea during the last century. PNAS 111, 5628–5633. doi: 10.1073/pnas.1323156111
Casillo A., Lanzetta R., Parrilli M., Corsaro M. M. (2018). Exopolysaccharides from marine and marine extremophilic bacteria: structures, properties, ecological roles and applications. Mar. Drugs 16, 69. doi: 10.3390/md16020069
Chen Y., Wang F. (2015). Insights on nitrate respiration by Shewanella. Frontiers in Marine Science 1, 80.
Conley D. J., Björck S., Bonsdorff E., Carstensen J., Destouni G., Gustafsson B. G., et al. (2009). Hypoxia-related processes in the Baltic Sea. Environ. Sci. Technol. 43, 3412–3420. doi: 10.1021/es802762a
Dalsgaard T., Stewart F. J., Thamdrup B., De Brabandere L., Revsbech N. P., Ulloa O., et al. (2014). Oxygen at nanomolar levels reversibly suppresses process rates and gene expression in anammox and denitrification in the oxygen minimum zone off northern Chile. MBio 5, e01966–e01914. doi: 10.1128/mBio.01966-14
Dauwe B., Middelburg J. J., Herman P. M. J., Heip C. H. R. (1999). Linking diagenetic alteration of amino acids and bulk organic matter reactivity. Limnol. Oceanogr. 44, 1809–1814. doi: 10.4319/lo.1999.44.7.1809
Del Giorgio P. A., Cole J. J. (1998). Bacterial growth efficiency in natural aquatic systems. Annu. Rev. Ecol. Syst. 29, 503–541. doi: 10.1146/annurev.ecolsys.29.1.503
Dittmar T., Cherrier J., Ludichowski K. U. (2009). “The analysis of amino acids in seawater,” in Practical guidelines for the analysis of seawater. Ed. Wurl O. (CRC Press, Boca Raton), 67–78.
Engel A., Galgani L. (2016). The organic sea-surface microlayer in the upwelling region off the coast of Peru and potential implications for air–sea exchange processes. Biogeosciences 13, 989–1007. doi: 10.5194/bg-13-989-2016
Engel A., Händel N. (2011). A novel protocol for determining the concentration and composition of sugars in particulate and in high molecular weight dissolved organic matter (HMW-DOM) in seawater. Mar. Chem. 127, 180–191. doi: 10.1016/j.marchem.2011.09.004
Engel A., Kiko R., Dengler M. (2022). Organic matter supply and utilization in oxygen minimum zones. Annu. Rev. Mar. Sci. 14, 355–378. doi: 10.1146/annurev-marine-041921-090849
Field A., Miles J., Field Z. (2012). Discovering statistics using R. Eds. Field A., Miles J., Field Z. (London: SAGE Publications Ltd).
Gasol J. M., Del Giorgio P. A. (2000). Using flow cytometry for counting natural planktonic bacteria and understanding the structure of planktonic bacterial communities. Scientia Marina 64, 197–224. doi: 10.3989/scimar.2000.64n2197
Giovannoni S., Chan F., Davis E., Deutsch C., Wolf S. (2021). Biochemical barriers on the path to ocean anoxia? Mbio 12, e01332–e01321. doi: 10.1128/mBio.01332-21
Goldman J. C., Caron D. A., Dennett M. R. (1987). Regulation of gross growth efficiency and ammonium regeneration in bacteria by substrate C: N ratio1. Limnol. Oceanogr. 32, 1239–1252. doi: 10.4319/lo.1987.32.6.1239
Gruber N. (2011). Warming up, turning sour, losing breath : ocean biogeochemistry under global change. Phili. Trans. R. Soc 369, 1980–1996. doi: 10.1098/rsta.2011.0003
Guillard R. R. L. (1975). “Culture of phytoplankton for feeding marine invertebrates,” in Culture of Marine Invertebrate Animals (Springer US, Boston, MA), 29–60. doi: 10.1007/978-1-4615-8714-9_3
Guillard R. R. L., Ryther J. H. (1962). Studies of marine planctonic diatoms: I. Cyclotella nana Hustedt and Detonula confervacea Cleve. Can. Can. J. Microbiol. 8, 229–239. doi: 10.1139/m62-029
Hagstrom A., Azam F., Kuparinen J., Zweifel U. (2001). “Pelagic plankton growth and resource limitations in the Baltic Sea,” in A system analysis of the Baltic Sea. Eds. Wulff F. E., Rahm L. A., Larsson P. (Springer-Verlag, Berlin, Heidelberg).
Hahn M. W., Moore E. R. B., Höfle M. G. (2000). Role of microcolony formation in the protistan grazing defense of the aquatic bacterium Pseudomonas sp. MWH1. Microb. Ecol. 39, 175–185.
Hepach H., Piontek J., Bange H. W., von Jackowski A., Engel A. (2024). Enhanced warming and bacterial organic matter degradation as key factors for coastal hypoxia in the Southwestern Baltic Sea. Nat. Commun. Earth Envirn. under review.
Hoikkala L., Kortelainen P., Soinne H., Kuosa H. (2015). Dissolved organic matter in the Baltic Sea. J. Mar. Syst. 142, 47–61. doi: 10.1016/j.jmarsys.2014.10.005
Hoppe H. G., Gocke K., Koppe R., Begler C. (2002). Bacterial growth and primary production along a north–south transect of the Atlantic Ocean. Nature 416, 168–171. doi: 10.1038/416168a
Jensen M. M., Kuypers M. M. M., Gaute L., Thamdrup B. (2008). Rates and regulation of anaerobic ammonium oxidation and denitrification in the Black Sea. Limnol. Oceanogr. 53, 23–36. doi: 10.4319/lo.2008.53.1.0023
Kabel K., Moros M., Porsche C., Neumann T., Adolphi F., Andersen T. J., et al. (2012). Impact of climate change on the Baltic Sea ecosystem over the past 1 , 000 years. Nat. Climate Change 2, 871–874. doi: 10.1038/nclimate1595
Kaiser K., Benner R. (2009). Biochemical composition and size distribution of organic matter at the Pacific and Atlantic time-series stations. Mar. Chem. 113, 63–77. doi: 10.1016/j.marchem.2008.12.004
Kalvelage T., Jensen M. M., Contreras S., Revsbech N. P., Lam P., Günter M., et al. (2011). Oxygen sensitivity of anammox and coupled N-cycle processes in oxygen minimum zones. PloS One 6, e29299. doi: 10.1371/journal.pone.0029299
Kavita K., Mishra A., Jha B. (2013). Extracellular polymeric substances from two biofilm forming Vibrio species: characterization and applications. Carbohydr. Polymers 94, 882–888. doi: 10.1016/j.carbpol.2013.02.010
Kelso B., Smith R. V., Laughlin R. J., Lennox S. D. (1997). Dissimilatory nitrate reduction in anaerobic sediments leading to river nitrite accumulation. Appl. Environ. Microbiol. 63, 4679–4685. doi: 10.1128/aem.63.12.4679-4685.1997
Kirchman D. L. (2018). Processes in microbial ecology (Oxford University Press). doi: 10.1093/oso/9780198789406.001.0001
Klawonn I., Bonaglia S., Brüchert V., Ploug H. (2015). Aerobic and anaerobic nitrogen transformation processes in N2-fixing cyanobacterial aggregates. ISME J. 9, 1456–1466. doi: 10.1038/ismej.2014.232
Kroer N. (1993). Bacterial growth efficiency on natural dissolved organic matter. Limnol. Oceanogr. 38, 1282–1290. doi: 10.4319/lo.1993.38.6.1282
Lam P., Kuypers M. M. M. (2011). Microbial nitrogen cycling processes in oxygen minimum zones. Annu. Rev. Mar. Sci. 3, 317–348. doi: 10.1146/annurev-marine-120709-142814
La Roche J., Rost B., Engel A. (2010). “Bioassays , batch culture and chemostat experimentation,” in Approaches and tools to manipulate the carbonate chemistry., Guide for Best Practices in Ocean Acidification Research and Data Reporting. Eds. Riebesell U., Fabry V., Hansson L., Gattuso J.-P. (Publication Office of the European Union), 81–94.
Lee S., Fuhrman J. E. D. A. (1987). Relationships between Biovolume and biomass of naturally derived marine bacterioplankton. Appl. Environ. Microbiol. 53, 1298–1303. doi: 10.1128/aem.53.6.1298-1303.1987
Le Moigne F. A. C., Cisternas-Novoa C., Piontek J., Maßmig M., Engel A. (2017). On the effect of low oxygen concentrations on bacterial degradation of sinking particles. Sci. Rep. 7, 16722. doi: 10.1038/s41598-017-16903-3
Lennartz S. T., Lehmann A., Herrford J., Malien F., Hansen H.-P., Biester H., et al. (2014). Long-term trends at the Boknis Eck time series station ( Baltic Sea ), 1957 – 2013 : does climate change counteract the decline in eutrophication ? Biogeosciences 11, 6323–6339. doi: 10.5194/bg-11-6323-2014
Levin L. A. (2018). Manifestation, drivers, and emergence of open ocean deoxygenation. Annu. Rev. Mar. Sci. 10, 229–260. doi: 10.1146/annurev-marine-121916-063359
Lindroth P., Mopper K. (1979). High performance liquid chromatographic determination of subpicomole amounts of amino acids by precolumn fluorescence derivatization with o-phthaldialdehyde. Anal. Chem. 51, 1667–1674. doi: 10.1021/ac50047a019
Maßmig M., Piontek J., Le Moigne F. A. C., Cisternas-Novoa C., Engel A. (2019). Potential role of oxygen and inorganic nutrients on microbial carbon turnover in the Baltic Sea. Aquat. Microb. Ecol. 83, 95–108. doi: 10.3354/ame01902
Mahne I., Tiedje J. M. (1995). Criteria and methodology for identifying respiratory denitrifiers. Appl. Environm. Microbiol. 61, 1110–1115. doi: 10.1128/aem.61.3.1110-1115.1995
Nguyen R. T., Harvey H. R. (1997). Protein and amino acid cycling during phytoplankton decomposition in oxic and anoxic waters. Organic Geochem. 27, 115–128. doi: 10.1016/S0146-6380(97)00076-4
Nishio T., Koike I., Hattori A. (1983). Estimates of denitrification and nitrification in coastal and estuarine sediments. Appl. Environ. Microbiol. 45, 444–450. doi: 10.1128/aem.45.2.444-450.1983
Novick A., Szilard L. (1950). Description of the chemostat. Science 112, 715–716. doi: 10.1126/science.112.2920.715
Oksanen J., Simpson G. L., Guillaume Blanchet F., Kindt R., Legendre P., Minchin P. R., et al. (2022). vegan: Community Ecology Package. R package version 2.6-2. Available at: https://CRAN.R-project.org/package=vegan.
Pitcher G. C., Aguirre-Velarde A., Breitburg D., Cardich J., Carstensen J., Conley D. J., et al. (2021). System controls of coastal and open ocean oxygen depletion. Prog. Oceanogr. 197, 102613. doi: 10.1016/j.pocean.2021.102613
Ploug H., Bergkvist J. (2015). Oxygen diffusion limitation and ammonium production within sinking diatom aggregates under hypoxic and anoxic conditions. Mar. Chem. 176, 142–149. doi: 10.1016/j.marchem.2015.08.012
Ramsing N., Gundersen J. (2000). seawater and gases: Tabulated physical parameters of interest to people working with microsensors in marine systems. Unisense.
R Core Team (2017). R: A language and environment for statistical computing (Vienna, Austria: R Foundation for Statistical Computing). Available at: http://www.r-project.org.
Revsbech N. P., Larsen L. H., Gundersen J., Dalsgaard T., Ulloa O., Thamdrup B. (2009). Determination of ultra-low oxygen concentrations in oxygen minimum zones by the STOX sensor. Limnol. Oceanogr.: Methods 7, 371–381. doi: 10.4319/lom.2009.7.371
Schmidtko S., Stramma L., Visbeck M. (2017). Decline in global oceanic oxygen content during the past five decades. Nature 542, 335–339. doi: 10.1038/nature21399
Seitzinger S. P. (1988). Denitrification in freshwater and coastal marine ecosystems: Ecological and geochemical significance. Limnol. Oceanogr. 33, 702–724. doi: 10.4319/lo.1988.33.4_part_2.0702
Seitzinger S. P., Kroeze C. (1998). Global distribution of nitrous oxide production and N inputs in freshwater and coastal marine ecosystems. Global Biogeochem. Cycles 12, 93–113. doi: 10.1029/97GB03657
Sharp J. H. (1974). Improved analysis for “particulate” organic carbon and nitrogen from seawater1. Limnol. Oceanogr. 19, 984–989. doi: 10.4319/lo.1974.19.6.0984
Stramma L., Schmidtko S., Levin L. A., Johnson G. C. (2010). Ocean oxygen minima expansions and their biological impacts. Deep Sea Res. Part I: Oceanogr. Res. Papers 57, 587–595. doi: 10.1016/j.dsr.2010.01.005
Sugimura Y., Suzuki Y. (1988). A high-temperature catalytic oxidation method for the determination of non-volatile dissolved organic carbon in seawater by direct injection of a liquid sample. Mar. Chem. 24, 105–131. doi: 10.1016/0304-4203(88)90043-6
Ulloa O., Pantoja S. (2009). The oxygen minimum zone of the eastern South Pacific. Deep Sea Res. Part II: Topical Stud. Oceanogr. 56, 987–991. doi: 10.1016/j.dsr2.2008.12.004
Voss M., Baker A., Bange H. W., Conley D., Deutsch B., Engel A., et al. (2011). “Nitrogen processes in coastal and marine ecosystems,” in The European Nitrogen Assessment: Sources, Effects and Policy Perspectives. Ed. Sutton M. (Cambridge University Press, New York, USA), 147–176.
Voss M., Emeis K. C., Hille S., Neumann T., Dippner J. W. (2005). Nitrogen cycle of the Baltic Sea from an isotopic perspective. Global Biogeochem. Cycles 19, GB3001. doi: 10.1029/2004GB002338
Walter S., Bange H. W., Breitenbach U., Wallace D. W. R. (2006). Nitrous oxide in the North Atlantic Ocean. Biogeosci. Discussions 3, 993–1022. doi: 10.5194/bg-3-607-2006
Keywords: deoxygenation, eutrophication, bacteria, DOC, nitrous oxide, denitrification
Citation: Maßmig M, Cisternas-Novoa C and Engel A (2024) Uncovering the role of oxygen on organic carbon cycling: insights from a continuous culture study with a facultative anaerobic bacterioplankton species (Shewanella baltica). Front. Mar. Sci. 11:1328392. doi: 10.3389/fmars.2024.1328392
Received: 26 October 2023; Accepted: 04 March 2024;
Published: 25 March 2024.
Edited by:
Feixue Fu, University of Southern California, United StatesReviewed by:
Clarissa Karthäuser, Woods Hole Oceanographic Institution, United StatesThomas Smith Weber, University of Rochester, United States
Helmut Maske, Center for Scientific Research and Higher Education in Ensenada (CICESE), Mexico
Copyright © 2024 Maßmig, Cisternas-Novoa and Engel. This is an open-access article distributed under the terms of the Creative Commons Attribution License (CC BY). The use, distribution or reproduction in other forums is permitted, provided the original author(s) and the copyright owner(s) are credited and that the original publication in this journal is cited, in accordance with accepted academic practice. No use, distribution or reproduction is permitted which does not comply with these terms.
*Correspondence: Anja Engel, YWVuZ2VsQGdlb21hci5kZQ==