 Sang-Yeob Kim
 Ho Jin Lee2
 Kyung Tae Jung
 Haejin Kim
 Kyeong Ok Kim
- 1Korea Institute of Ocean Science and Technology, Busan, Republic of Korea
- 2Department of Ocean Science, Korea Maritime and Ocean University, Busan, Republic of Korea
- 3Ocean Environment Research Institute of Oceanic Consulting and Trading, Gangneung, Republic of Korea
This study investigates that the subsurface pathways, travel time, and its interannual variability of Fukushima-derived tracers subducted with the North Pacific subtropical mode water (NPSTMW) using 22-year-long (1994–2015) eddy-resolving (1/12°) and eddy-permitting (1/4°) ocean reanalysis. The NPSTMW is a thick subsurface layer with low potential vorticity and relatively uniform potential density, making it a key indicator of the North Pacific oceanic conditions. A series of Lagrangian particle tracking simulations quantitatively revealed that the Fukushima-derived particles moved along the Kuroshio Extension (KE) and spread over the majority of the subtropical region in the northwestern Pacific within 4–5 years. Approximately 36% of the particles flowed eastward in the Kuroshio-Oyashio transition zone (KO) and thereafter re-emerged to the sea surface at the remote area (near dateline), and 30% of particles moved along the KE. The remaining 34% subducted into NPSTMW layer and then widely spread out to the subtropical region along the re-circulation gyre (RG), exhibiting a subsurface pathway during entire particle tracking. When the particles were released, their pathway was immediately determined, whether it flowed along the KO (>36°N), KE (30°–36°N), or RG (<30°N). Furthermore, the interannual variability of the pathways was significantly associated with the dynamic states of KE, such as the path length of the Kuroshio jet. This result implies that understanding the subsurface dynamics and its variability of the KE and NPSTMW is crucial for predicting the dispersion of radioactive materials in the subsurface layer and its potential impact.
1 Introduction
The North Pacific subtropical mode water (NPSTMW) is a thick subsurface layer with low potential vorticity (PV) and a relatively uniform potential density (σθ = 24.8–25.7 kg m-3) (Masuzawa, 1969; Oka and Qiu, 2012). The NPSTMW affects geochemical tracers and the subtropical counter current (Kobashi et al., 2006; Bates, 2012). The NPSTMW subducts into the thermocline maintaining the wintertime sea surface temperature (SST) and re-emerges to the surface during the following winter, affecting the upper-layer distribution of nutrients and the oceanic uptake of carbon dioxide (Sugimoto and Hanawa, 2005; Bates, 2012; Oka et al., 2019; Oka et al., 2021). Therefore, the NPSTMW can be considered as a good indicator of the oceanic conditions of the North Pacific.
After the Fukushima Daiichi Nuclear Power Plant (FDNPP) accident, which was triggered by the Tohoku earthquake and tsunami on the 11th March 2011, a large amount of contaminated water (~3.5 PBq) containing radioactive isotopes entered the Pacific Ocean and the atmospheric deposition (12–15 PBq) as well (Buesseler et al., 2011, 2012; Yoshida and Kanda, 2012; Kanda, 2013; Nagao et al., 2013). Many previous studies have reported that a considerable amount of the radioactive materials were subducted into the subsurface of the NPSTMW in the Kuroshio Extension (KE) region (Kumamoto et al., 2014, 2018; Kaeriyama et al., 2016; Inomata et al., 2018). Using observational data along 149°E section during 2011–2012, Kumamoto et al. (2014) found the subsurface radiocesium maximum at a depth of 300 m in the subtropical region and that its amount was about 6 PBq of 134Cs in the mode water layer.
Subducted radioactive materials within the NPSTMW spread into the subtropical region of the North Pacific (Men et al., 2015; Cedarholm et al., 2019; Lee et al., 2023). Men et al. (2015) reported that 134Cs was found at 21.50°N, 125.00°E at a depth of 200 m near Taiwan Island after monitoring the area between 2011 and 2014. They suggested that the radioactive materials originating from FDNPP spread into the subtropical region along the subtropical gyre of the North Pacific. Using high-resolution reanalysis data from March 2011 to April 2013 and a backward particle tracking simulation, Cedarholm et al. (2019) demonstrated that the subsurface pathway, reaching the deepest observed cesium location in 2013, runs along the KE to ~165°E, where it turns sharply southward on the 26.5σθ isopycnal surface. Using an eddy-permitting (1/4° horizontal resolution) numerical ocean model to estimate the dispersion path and travel time of the 137Cs released directly from the FDNPP from 2011 to 2020, Lee et al. (2023) reported that subsurface 137Cs spread clockwise in the subtropical region, while a portion driven by the NPSTMW was dispersed southward.
Meanwhile, based on the analysis of observational data between 1993–2004, Qiu and Chen (2006) found that NPSTMW formation is increased (reduced) when the KE is stable (unstable). Furthermore, Kim et al. (2022) demonstrated that NPSTMW formation was closely related to the meridional and zonal movements of the Aleutian Low, which stimulates sea surface height anomalies propagating westward from the central North Pacific. Xu et al. (2016) reported that the eddy effect also plays an important role in transporting the NPSTMW into the subtropical region by estimating PV transport using an anti-cyclonic eddy. Using 17 Argo-profiling floats and 3,000 hydrographic profiles, they suggested that the subduction and southward transport of the NPSTMW by the anti-cyclonic eddy are comparable to that by the mean flow in terms of magnitude. Although many studies have reported the subsurface pathways of radioactive materials through NPSTMW formation, the interannual variability of the pathways has not yet been revealed due to limited study periods and the spatial-temporal limitation of observational and model data. In addition, the subsurface pathway of radioactive materials has not been thoroughly investigated compared to its surface pathway in previous studies (Behrens et al., 2012; Aoyama et al., 2013; Inomata and Aoyama, 2023) because of the restraint of the observational data.
Here, we quantitatively investigated the subsurface pathways of particles on the 25.2σθ isopycnal surface, which corresponds to the NPSTMW, originating from Fukushima, as well as the travel time and interannual variabilities of the particles using 22 years (1994–2015) of ocean reanalysis data. The purpose of this study was to (1) investigate the subsurface pathways and travel time of particles originating from FDNPP during cooling seasons and (2) to reveal the interannual variability of the pathways. In this study, we consider the transport including subduction for the pathways of the particles. The term “subduction” is regarded as ventilation of the water mass, which leads to particle movement from the mixed layer into the underneath layer (thermocline). This paper is organized as follows. Section 2 explains the materials and methods. Section 3 explains the results of analyses of the subsurface pathways and its interannual variability of the particles. Finally, Section 4 summarized and concludes the paper.
2 Materials and methods
2.1 Ocean reanalysis data
Two ocean reanalysis data models were used in the study; the HYCOM (Hybrid Coordinate Ocean Model; HYCOM Global Ocean Forecast System version 3.1) (Chassignet et al., 2007) and the GREP (Global Ocean Reanalysis Ensemble Product) (Storto et al., 2019). The GREP comprises four ensemble members, which are C-GLORS, GLOSEA5, GLORYS2, and ORAS5, respectively. In this study, the ensemble mean of the four GREP ensemble members was used for particle tracking and analysis of the results. The HYCOM has an eddy-resolving horizontal resolution (~1/12° both in longitude and latitude) with 40 vertical levels and enhanced resolution near the surface. All GREP ensemble members share the tripolar ORCA025 grid, which is an eddy-permitting horizontal resolution (~1/4° both in longitude and latitude), with 75 vertical levels and enhanced resolution near the surface.
HYCOM data, obtained every 3 hours, and GREP-ensemble (hereafter GREP) data, obtained daily, were analyzed and validated from January 1994 to December 2015. To examine the simulated NPSTMW in both reanalysis data, the vertical section of the density and potential vorticity (PV) was compared, which was zonally averaged over the longitudinal band of 140°–155°E, with the EN4 observational data (Good et al., 2013) (Supplementary Figure 1). Compared with the EN4, both reanalysis data reproduced the relatively thicker subsurface layer between 25.0 and 25.5 kg m-3 with the low PV (< 2.0 × 10⁻¹⁰ m-1 s-1) well, indicating the presence of NPSTMW. In both reanalysis data, the low PV water, i.e., NPSTMW, was located between 100 m and 300 m in the latitudinal band from 25°N to 35°N, although the HYCOM reproduced a relatively thicker layer in the vertical direction compared to those of the EN4 and GREP models. Although the GREP reproduces a relatively denser NPSTMW, the cores of the NPSTMW, which correspond to the minimum PV, appear on the 25.2σθ isopycnal surface in both reanalysis data. This result is consistent with previous observations (EN4, Good et al., 2013) and reports (Masuzawa, 1969; Oka and Qiu, 2012).
To validate the temperature distribution on the core layer of the NPSTMW, the horizontal distributions of the simulated temperature on the 25.2σθ isopycnal surface was compared with the EN4 (Supplementary Figure 2). Both reanalysis data reproduced the horizontal distribution of the temperature on the 25.2σθ isopycnal surface well when compared to that of the EN4; for example, simulated 5°, 10°, and 15°C isotherms were distributed at similar positions with the EN4. In the subtropical region, the differences between the two reanalysis data collections and EN4 were less than 0.1°C, while, the differences were over 1°C in the subpolar region and the marginal seas (the Yellow Sea and the East Sea/Japan Sea) due to limitations associated with the observational data, such as the Argo floats, during data assimilation for those regions. However, in this study, we focused on the subtropical region, where the NPSTMW is mainly formed and spreads; therefore, it is sufficient to investigate the pathways of the FDNPP-originating particles along the NPSTMW layer.
To validate the interannual variability of the KE, the KE index, which is defined by the normalized SSH anomaly in the KE region (140°–165°E, 31°–36°N) (Qiu et al., 2014), was compared with the estimated index from the AVISO data (Supplementary Figure 3). The KE indices from both reanalysis data collections were highly correlated with the estimated index from the AVISO data; the correlation coefficients were 0.92 for HYCOM and 0.98 for GREP. Because the NPSTMW is formed in the KE region and spreads into the subtropical region, both reanalysis data collections were used to investigate the variability of the pathways of the FDNPP-originating particles along the NPSTMW layer. The KE state is represented by the KE index which reflects the KE’s strength, path length and meridional position; the increase of KE index, which is defined as domain averaged SSH, in significant meanderings with rich eddies, while the decrease of KE index tends to straighten its paths (Qiu et al., 2014). When the KE jet is in a stable dynamic state, satellite altimeter data further reveal tendencies with increasing eastward transport and with pronounced northward position shift, while the southern re-circulation gyre (RG) tends to strengthen and the regional eddy kinetic energy level tends to decrease. The reverse is true when the KE jet switches to an unstable dynamic state (Qiu and Chen, 2006).
2.2 Particle tracking model and experiments
A Lagrangian particle tracking model was used to investigate the pathway and the variability of the FDNPP-originating particles (Seo and Park, 2020; Kim et al., 2021). It was based on that employed by Kim et al. (2021) but included the derivatives of the diffusion coefficients, which prevent the artificial accumulation of particles in regions of low diffusivity (Proehl et al., 2005; Lynch et al., 2015; Periáñez et al., 2019) (Equation 1).
where, is the position of a particle at time , is the time interval (4 h), and input data is the ocean current. The input data were linearly interpolated to particle positions and model time steps. The Runge-Kutta fourth order scheme was used for time integration (Dormand and Prince, 1980). is defined as a random number between -1 and 1, and is defined as a horizontal diffusion coefficient adopted from the Smagorinsky (1963) mixing scheme (Griffies and Hallberg, 2000; Iwasaki et al., 2017; Choi et al., 2018). When a particle reached a land grid, it was set to be reflected elastically to the nearest ocean grid since it cannot be beached.
The particles were released at one hundred points in the region of 141.2°–142.0°E, 36.7°–38.1°N (71 km × 156 km), and were 0.09° and 0.16° apart in the zonal and meridional directions, respectively (Figure 1A). It is noted that the area of our release point (71 km × 156 km) is similar to that of a previous study (45 km × 150 km) by Behrens et al. (2012), who conducted a long-term tracer simulation over 10 years using the atmospheric forced ocean model. It is also noted that we also conducted the particle tracking simulations in a much smaller area (18 km × 44 km), and the results were robust (Supplementary Figure 4). One hundred particles were released every 3 days from January 1st 1994 to December 28th 2011, and a total 216,000 particles were released. It should be noted that particles were not released on every day of the month. The particle trajectories were calculated up to 5 years; for example, from January 1st 1994 to December 31st 1998. The forward tracking simulation was conducted on the 25.2σθ isopycnal surface, which is the core layer of the NPSTMW (Supplementary Figure 1), to investigate the pathways and variability of the FDNPP-originating particles within the NPSTMW subduction. The domain from 115°E to 160°W and 10°N to 50°N was designated as our study region, where the NPSTMW is mainly observed (Masuzawa, 1969; Oka and Qiu, 2012; Rainville et al., 2014). The results are robust regardless of the 25.0σθ and 25.5σθ isopycnal surfaces, which comprise the upper layer of the NPSTMW (not shown).
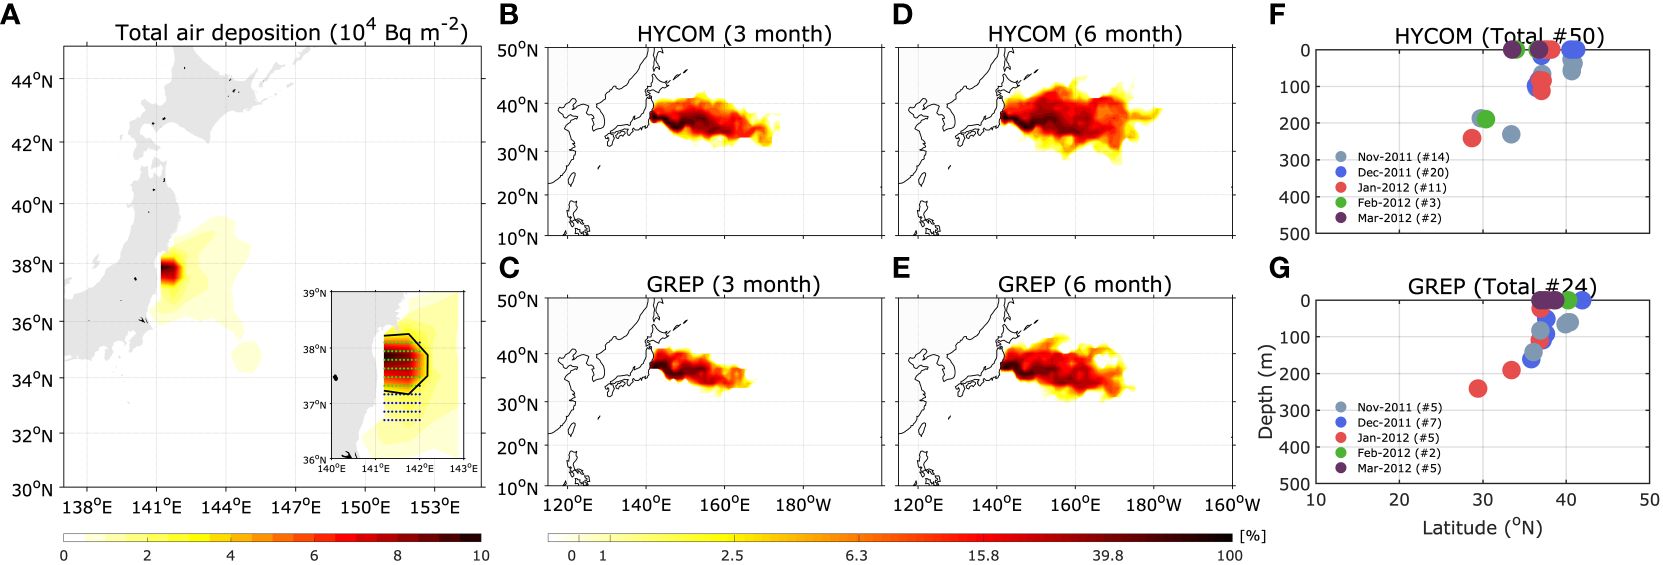
Figure 1 (A) Atmospheric deposition of 137Cs estimated by KAERI (Korea Atomic Energy Research Institute, Suh et al., 2017). Initial particle deployment site (100 release points) is overlapped in thumbnail map. Thick black contour indicates 137Cs = 30,000 Bq m-2. Probability of particle trajectories during 3 months from the FDNPP (release period: March 11th to 31st of 2011) of (B) HYCOM and (C) GREP data. (D, E) Same as (B, C) but 6 months. (F, G) Particle positions at the meridional section along 149°E from the (F) HYCOM and (G) GREP data.
In the present study, the cooling seasons were the main focus, because the NPSTMW is formed and subducted into the subsurface layer during the cooler seasons. To investigate the pathways of the particles during the NPSTMW subduction, the particles within the mixed layer were analyzed after they were released, similar to Cedarholm et al. (2019) who investigated the particles entering the mixed layer near the FDNPP via backward tracking on the 26.5σθ isopycnal surface, which is outside of the NPSTMW density range (25.0–25.5σθ), from 166°E, 30°N using the HYCOM data from March 2011 to April 2013. The mixed layer depth (MLD) was defined as the thickness of the mixed layer where the vertical density gradient () is less than 3.0 × 10⁻³ kg m-4, which is consistent with the criterion of PV (2.0 × 10⁻¹⁰ m-1 s-1) for NPSTMW. Further, Kim et al. (2022) and Nishikawa and Kubokawa (2012)’s definition of the MLD was used, which is more suitable to detect low PV water. The particles, which were released from December to April within the MLD, were 82,173 for HYCOM and 79,903 for GREP, respectively. In both May and November, some of particles were found to be located within the MLD; however, the number was too few, thus we did not consider those months for the analysis.
2.3 Validation of the particle tracking simulations
To validate the particle tracking simulations, we estimated the probability of the particles released from March 11th to 31st of 2011 by considering the atmospheric deposition. Figure 1A shows the atmospheric deposition of 137Cs estimated by the KAERI (Korea Atomic Energy Research Institute). Most of radionuclide were deposited near the Fukushima Daiichi Nuclear Power Plant (FDNPP) and it is located the northern part of the initial particle deployment site. Therefore, we only consider the particles within the 137Cs concentration of 30,000 Bq m-2 (thumbnail map in Figure 1A) and released from March 11th to 31st in 2011. It was revealed that the results shown in the revised manuscript are all comparable, supporting validity of our source field approach in our process-oriented study. This was in fact expected because analysis of KAERI’s results showed that the atmospheric deposition was 0.08 PBq at the south of Kuroshio Extension (141°–143°E, 30°–35°N), while it was 1.47 PBq at the northern area (141°–143°E, 35°–40°N). When we reduce the comparison sea region of 141°–143°E, 32°–35°N and 141°–143°E, 35°–38°N, the atmospheric deposition amounts are 0.07 PBq and 1.18 PBq, respectively. The amount of atmospheric deposition at the sea region north of KE is significantly larger than that at the sea region south of KE. After 3 months, the particles flowed eastward across 160°E (Figures 1B, C). After 6 months, the particles reached the dateline and spread in meridional direction (Figures 1D, E). Figures 1F, G show the distributions of the particles at the vertical-latitudinal section along 149°E during the winter of 2011–2012. In the subsurface layer the particles were distributed in the latitudinal band of 25°–35°N between 100 and 300 m. This result is similar to that of the observed 134Cs in the same area during the winter of 2012 (Kumamoto et al., 2014). It is noted that the results were robust regardless of particle release points’ number (30 by 30 points) (Supplementary Figure 5).
We also compared the particle distributions along 147°E and 165°E sections with the observed radiocesium of Aoyama et al. (2016) and Kaeriyama et al. (2023). Supplementary Figure 6 shows the particle distribution at 147°E section. Simulated results from both reanalysis data show that the particle distributions of 2013 are similar each other and comparable to the observation in Kaeriyama et al. (2023), though the simulated particles were located relative shallower depth (100–300 m) compared to the observed one (200–400 m). Comparison simulated results with Figures 1F, G (149°E section from 2011 November to 2012 March) displays that the particles moved further southward and spread in vertical direction during a year (2012–2013). Supplementary Figure 7 shows the particle distribution at 165°E section during June-July-August of 2012 and 2015. Simulated results show that the particle distributions of 2012 and 2015 are more or less similar to the observations of Aoyama et al. (2016) and Kaeriyama et al. (2023), which show the southward extension of particles and observed radiocesium concentrations in 2015. However, close examination reveals that there are some differences between simulated particle distributions and observed concentrations; the simulated particle distributions show an elongated pattern associated with oblique subduction, while the observations are widely distributed in vertical direction. It is obvious that this attributes to the limitation in particle tracking method on the isopycnal surface.
3 Results
3.1 Subsurface pathways of Fukushima-originating particles
The results of forward tracking on the 25.2σθ isopycnal surface are shown in Figure 2 using the probability distribution and mean travel time (Rypina et al., 2014). In both reanalysis data, the particles originating from the FDNPP flowed east along the KE, and then moved southwest across the KE in the zonal band of 160°E–180° (Figures 2B, C). The particles spread towards the east of the Philippines and Taiwan islands along the subtropical gyre and then moved northward along the KE. Although particle tracking was conducted on the 25.2σθ isopycnal surface in this study, the spreading patterns in both reanalysis data are similar to those reported in previous studies (Behrens et al., 2012; Rossi et al., 2013; Cedarholm et al., 2019). It takes approximately 3–5 years to reach the southwestern part of the North Pacific from the FDNPP (Figures 2D, E), which has been confirmed in previous observational and modeling studies (Behrens et al., 2012; Aoyama et al., 2018; Inomata et al., 2018; Wang et al., 2022). In the subtropical region (< 30°N), the probability and travel time in the HYCOM were approximately 5% higher and 6 months faster than those of the GREP, because the horizontal resolution and eddy activity differ between the HYCOM (1/12°, eddy-resolving) and the GREP (1/4°, eddy-permitting). It should be noted that less than 1% of the total particles moved towards the subpolar region, the South China Sea, and the marginal sea of the western North Pacific, such as the East Sea/Japan Sea. Furthermore, it should be noted that the results are robust, regardless of particle tracking on the 25.0σθ and 25.5σθ isopycnal surfaces, which are the density criteria of the NPSTMW (25.0–25.5σθ).
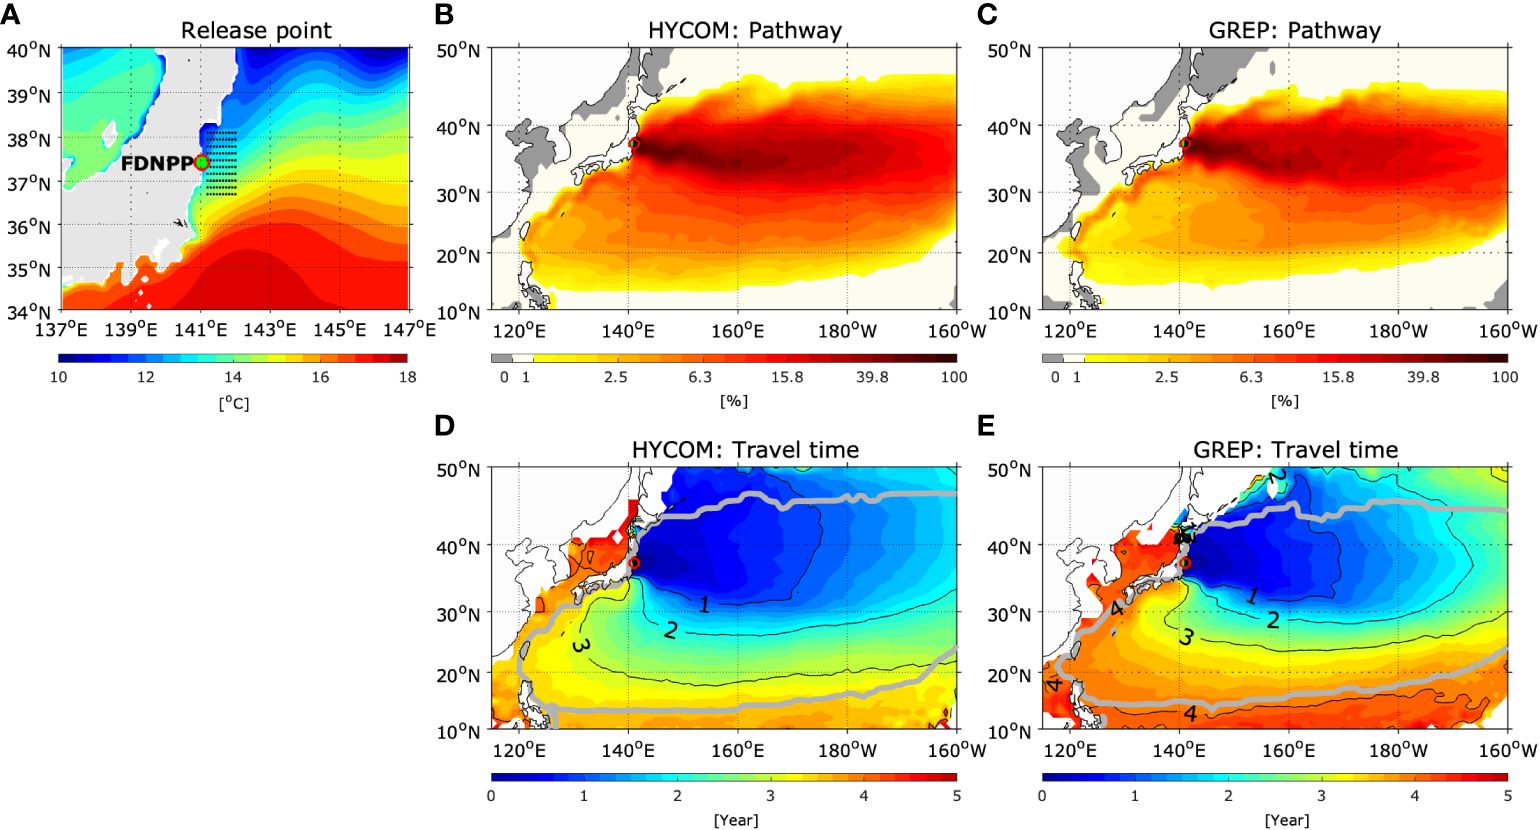
Figure 2 (A) Initial particle deployment site (100 black dots) for the forward particle tracking simulations on the 25.2σθ isopycnal surface. The green dot denotes the location of the Fukushima Daiichi Nuclear Power Plant. Color shading indicates the climatological mean temperature on the 25.2σθ isopycnal surface. (B) Probability and (D) travel time of particles from the HYCOM data. The thick gray line in (D) indicates the 1% probability contour. (C, E) same as (B, D) but for the GREP data.
To quantify the pathways of the particles, we separated the pathways into three groups according to the trajectories (longitude, latitude, and time) of each particle based on clustering analysis (Gaffney, 2004). Figure 3 displays the three patterns of the particle trajectories in both reanalysis data. The HYCOM and GREP exhibited reasonably similar results, although there were some differences in their trajectories due to the horizontal resolution. Approximately 36% (cluster 1) and 30%–31% (cluster 2) of the particles moved eastward along the Kuroshio-Oyashio transition zone and KE, respectively. The remaining (33%–34%, cluster 3) portion had strong spatial variability, and flowed eastward until reaching the longitudinal band at 160°–170°E, and then continued to move southwestward along the re-circulation gyre. It was noted that the portions of each cluster were generally similar (±2%), regardless of the released season. These results suggest that approximately two-thirds of the particles from the FDNPP flow directly eastward over the dateline along the KE, while one-third of the particles flow southward across the KE, and then spread into the entire subtropical region. We defined clusters 1, 2, and 3 as the Kuroshio-Oyashio transition zone (KO), Kuroshio Extension (KE), and Recirculation Gyre (RG) patterns, respectively.
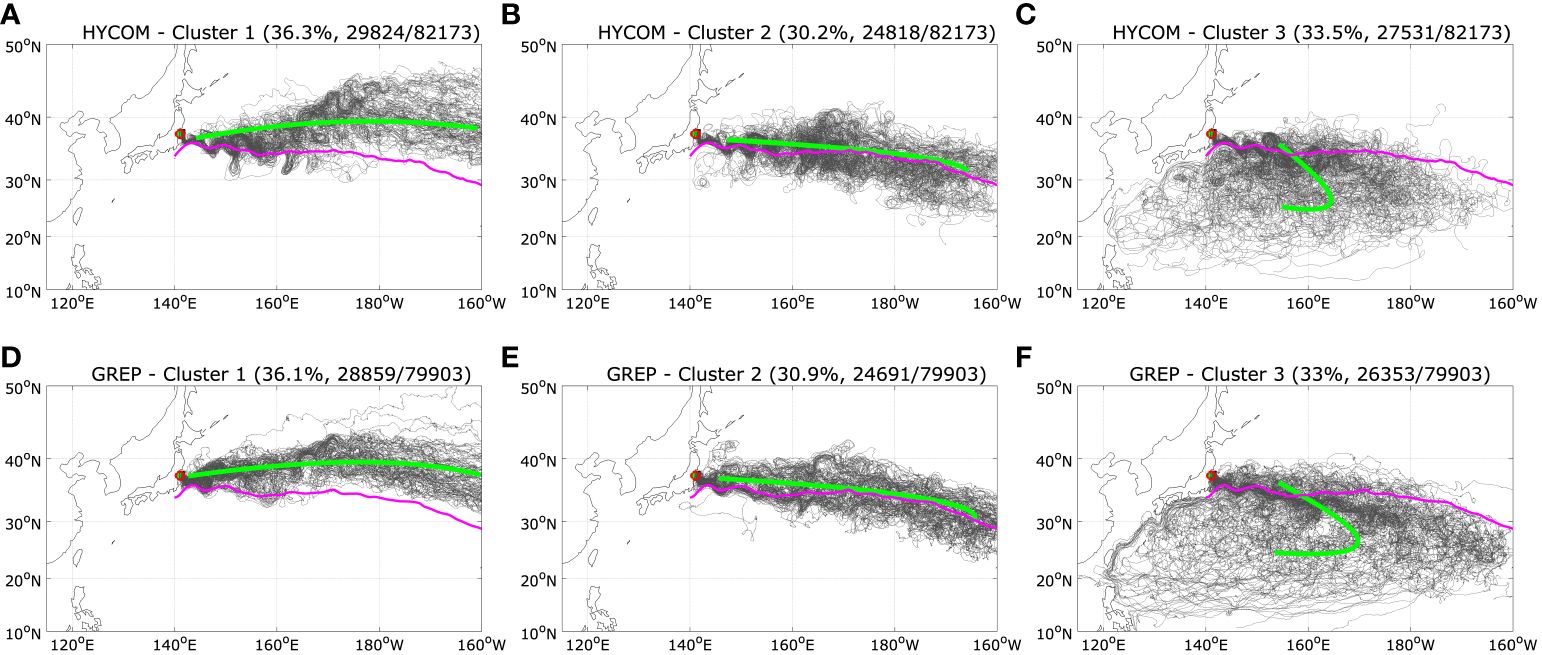
Figure 3 Random selection of one hundred trajectories, which are separated in (A) cluster 1; Kuroshio-Oyashio transition zone (KO) pattern, (B) cluster 2; Kuroshio Extension (KE) pattern, and (C) cluster 3; Recirculation Gyre (RG) pattern from the HYCOM data. The number of particles in each cluster is shown in parentheses. The thick green lines indicate the mean regression trajectories, which represent the major pathways of the total particle trajectories in each cluster. The magenta line denotes the Kuroshio axis defined as the 12°C isotherm at a depth of 300 m (Mizuno and White, 1983). (D–F) same as (A–C) but for the GREP data.
3.2 Characteristics of the three subsurface pathways
To categorize the properties of each cluster, we averaged the longitudinal and latitudinal positions, and the depth, temperature, and salinity of the trajectories using the tracking time in each cluster (Figure 4). The longitudinal positions of the KO and KE patterns steadily increased in an eastward direction and it took approximately one year to reach the dateline (Figures 4A, F). After they had passed the dateline, the eastward movement speed rapidly decreased, because the current speeds of the Oyashio and Kuroshio gradually decrease in an eastward direction. Because calculation of the particle tracking was halted when the particles reached 160°W, the number of particles within the analysis domain dramatically decreased after 1–2 tracking years, thus the longitudinal positions were almost the same after 2 tracking years (KO for ~168°W and KE for ~171°W). In contrast, the longitudinal position of the RG pattern increased in an eastward direction until reaching 165°E (~1.2 tracking year), and then turned southwestward, as shown in Figures 3C, F.
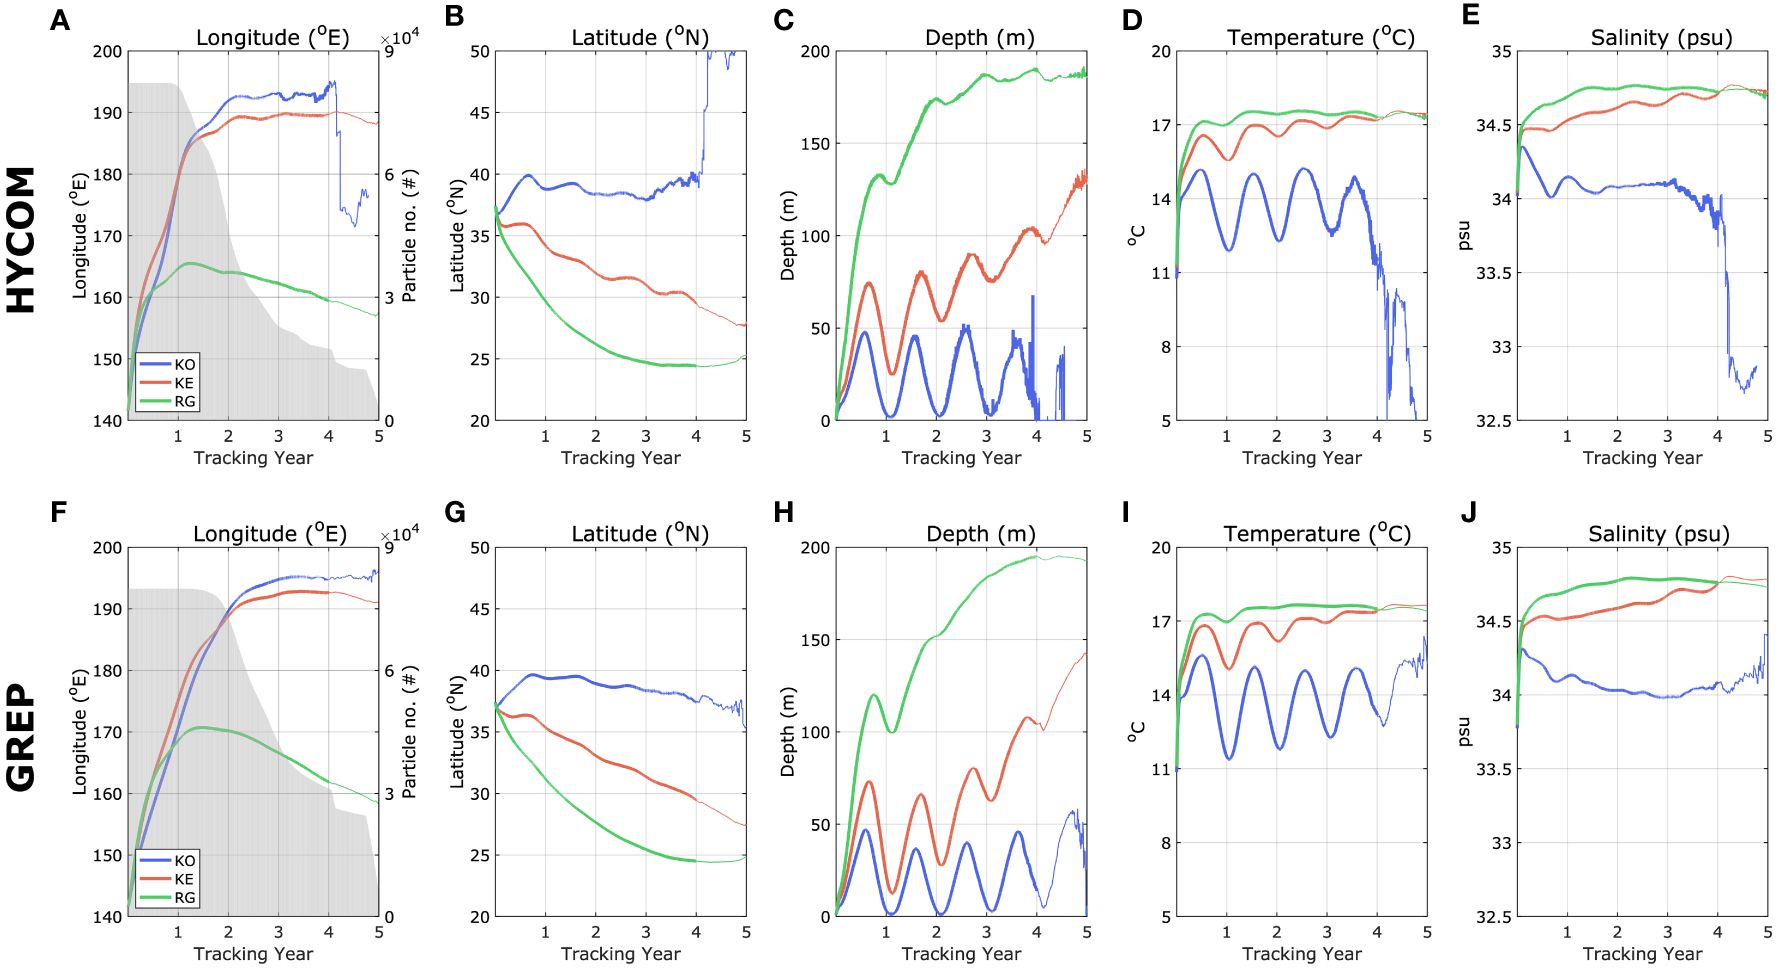
Figure 4 Mean properties of the (A) longitudinal, (B) latitudinal, (C) depth positions, (D) temperature, and (E) salinity of the three clusters (blue for KO, red for KE, and green for RG) at each tracking time. The background shade in (A) indicates the number of particles in the study area (115°E–160°W, 10°–50°N) at each tracking time. (F–J) same as (A–E) but for the GREP data.
Notably, the latitudinal positions of the three patterns were distinctly different during 5 tracking years, i.e., KO north of 36°N, KE for 30°–36°N band, and RG south of 30°N (Figures 4B, G). The pathways were immediately separated in each meridional direction as soon as the particles were released, thus we examined whether the pathways of the particles were affected by the meridional ranges at the release point. We found that the meridional range of the release point was not associated with the pathways (Supplementary Figure 8). In other words, the particles released at the northern (middle and southern) part of the deployment location did not follow the KO (KE and RG) pattern. This result suggests that the pathways and fates of the particles were primarily determined by the state of the ocean when they were released. We will show the relationship between the variability of the pathways and the dynamic states of the KE in following Section.
The three patterns exhibited significantly different time evolutions in terms of depth, temperature, and salinity (Figures 4C–E, H–J). The depth and temperature of the KO pattern exhibited strong seasonal variation. The particles of the KO pattern subducted by approximately 50 m during the warming seasons (April to November), and then re-emerged into the sea surface during the cooling seasons (December to following March), which is referred to as the re-emergence process (Alexander et al., 1999; Sugimoto and Hanawa, 2005). The KE pattern exhibited relatively weak seasonal variation in terms of depth and temperature when compared to those of the KO pattern. Meanwhile, the particles of the RG pattern sank by 190 m at ~17.5°C and ~34.7 psu, which are the typical properties of the NPSTMW (100–300 m, 16°–20°C, 34.6–34.8 psu) (Masuzawa, 1969; Oka and Qiu, 2012), and indicates a subsurface pathway during entire particle tracking. This result suggests that the RG pattern represents the subducted portion of Fukushima-originating particles within the subsurface layer, with the NPSTMW towards the south of the KE.
To examine the subduction of the particles into the subsurface via the RG pattern, we plotted the particle positions, 1 year after release from the FDNPP, at the meridional section along 149°E (Figure 5). It is noted that Figure 5 is a minor fraction of the particles released from the FDNPP. In both reanalysis data, the particles were distributed between the surface and 300 m and were mostly located at the latitudinal band of 25°–35°N at a depth of 100–300 m (Figures 5C, D). In the HYCOM, the particles extended by 15°N in the meridional direction, while an extension of 20°N was observed in the GREP data. In addition, the total number of particles at 149°E of the HYCOM (#1545) was 2.25 times larger than that of the GREP (#687), because the HYCOM [eddy-resolving horizontal resolution (1/12°)] reproduced a larger meander and more vigorous eddy activities in the KE region, thereby transporting more particles south across the KE when compared to the GREP (1/4°, eddy-permitting horizontal resolution).
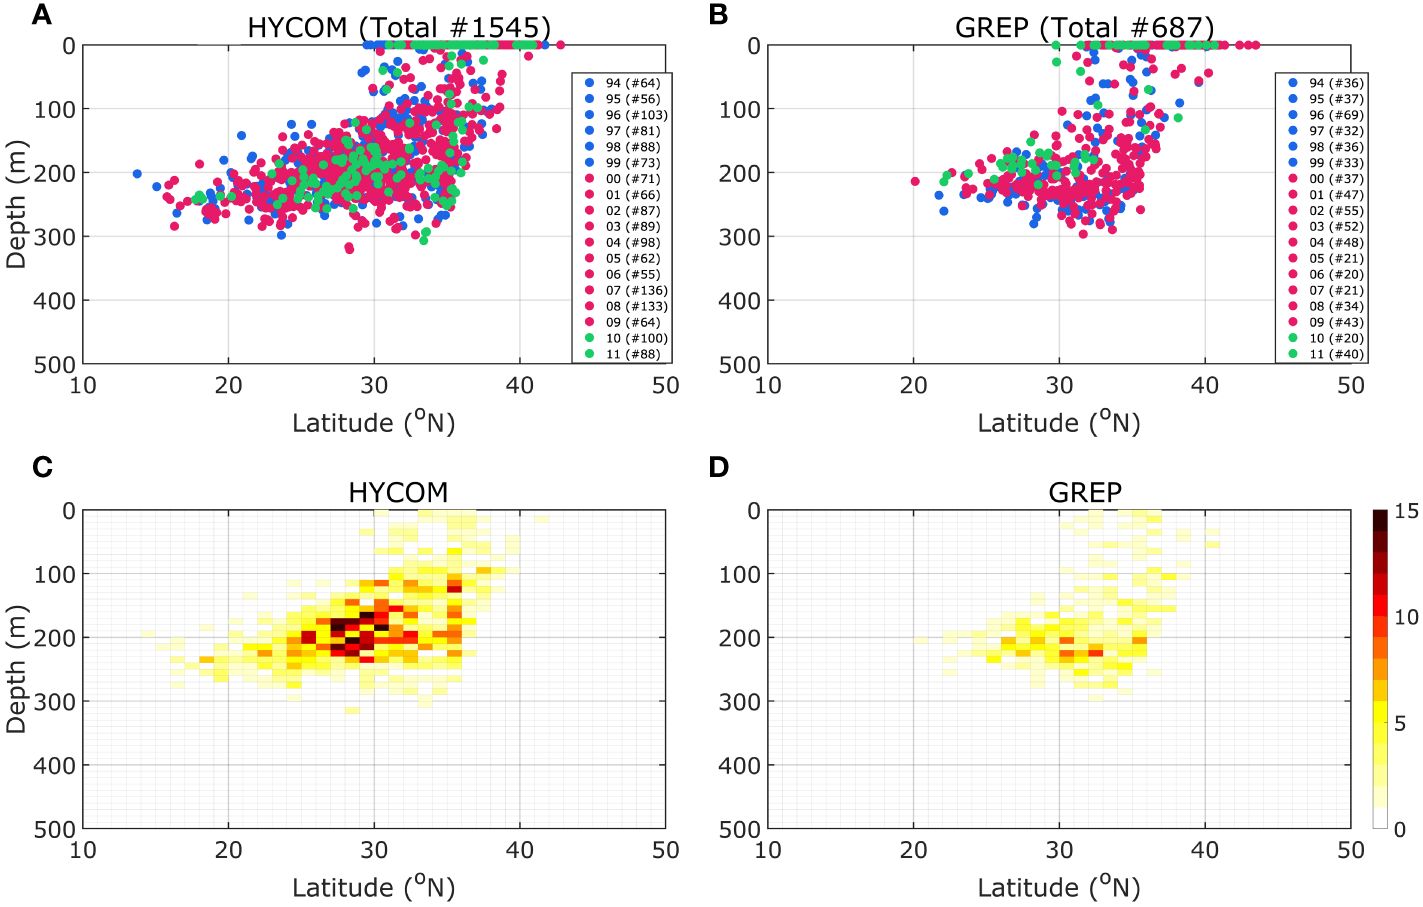
Figure 5 Particle positions (1 year after release from the FDNPP) at the meridional section along 149°E from the (A) HYCOM data and (B) GREP data. The number of particles in each year is shown in parentheses. The number of particles in each 1° (meridional) by 10 m (vertical) grid box for the (C) HYCOM data and (D) GREP data.
This result is consistent with the characteristics of the RG pattern demonstrating the subducted portion of the Fukushima-originating particles within the subsurface layer in the NPSTMW south of the KE (Figures 3, 4B, C). The distribution patterns of the particles at 149°E were reasonably similar to the vertical distribution of the NPSTNMW or low PV water (Supplementary Figure 1). Furthermore, the subducted pattern of the particles was also similar to that of the 134Cs observed in the same area during the winter of 2012 by Kumamoto et al. (2014), who located a subsurface 134Cs maximum at a depth of 300 m. They suggested that it had been transported southward with the formation/subduction of the NPSTMW within 10 months after the accident (Figure 3A of Kumamoto et al., 2014). It is noted that the vertical distributions of the particle along 165°E and 30°N are also quite similar compared to the previous observations (Yoshida et al., 2015; Aoyama et al., 2016) (Supplementary Figures 9, 10). We also compared the distribution of the particles, which were released in March 2011, in the 149°E area during the winter of 2011–2012 (Figures 1F, G). Although, the number of particles were few, the subducted patterns are similar to those displayed in Figure 5.
3.3 Interannual variability of the subsurface pathways
The number of particles in the 149°E area exhibited strong interannual variation. For example, it increased in the mid-1990s and decreased in the late-1990s and early-2000s (Figures 5A, B). To investigate the interannual variability of the subsurface pathways, we estimated the annual portions of the three patterns (Figure 6) from the total particles (82,173 for HYCOM and 79,903 for GREP). Strong interannual variabilities were observed in the time series of the three patterns. In addition, three patterns exhibited clear relationships with each other. For example, in the mid-1990s and early-2000s, the KO portion decreased, while the KE and RG portions increased. In contrast, in the late-1990s and mid-2000s, the KE and RG portions decreased, while the KO portion increased. This result suggests that the primary trajectory of particles can change between the KO and other pathways (KE and RG). The correlation coefficients between the KO and KE (RG) were –0.78 (–0.75) for the HYCOM and –0.85 (–0.88) for the GREP, respectively. The relationship between the KE and RG was relatively lower in the HYCOM (rKE_RG = 0.16) than the GREP (rKE_RG = 0.50). The RG pattern represents the subducted particles within the NPSTMW (Supplementary Figure 11); the correlation coefficients were 0.51 for HYCOM and 0.59 for GREP with regards to the RG pattern and the number of particles south of 30°N and below 100 m along the 149°E area shown in Figure 5.
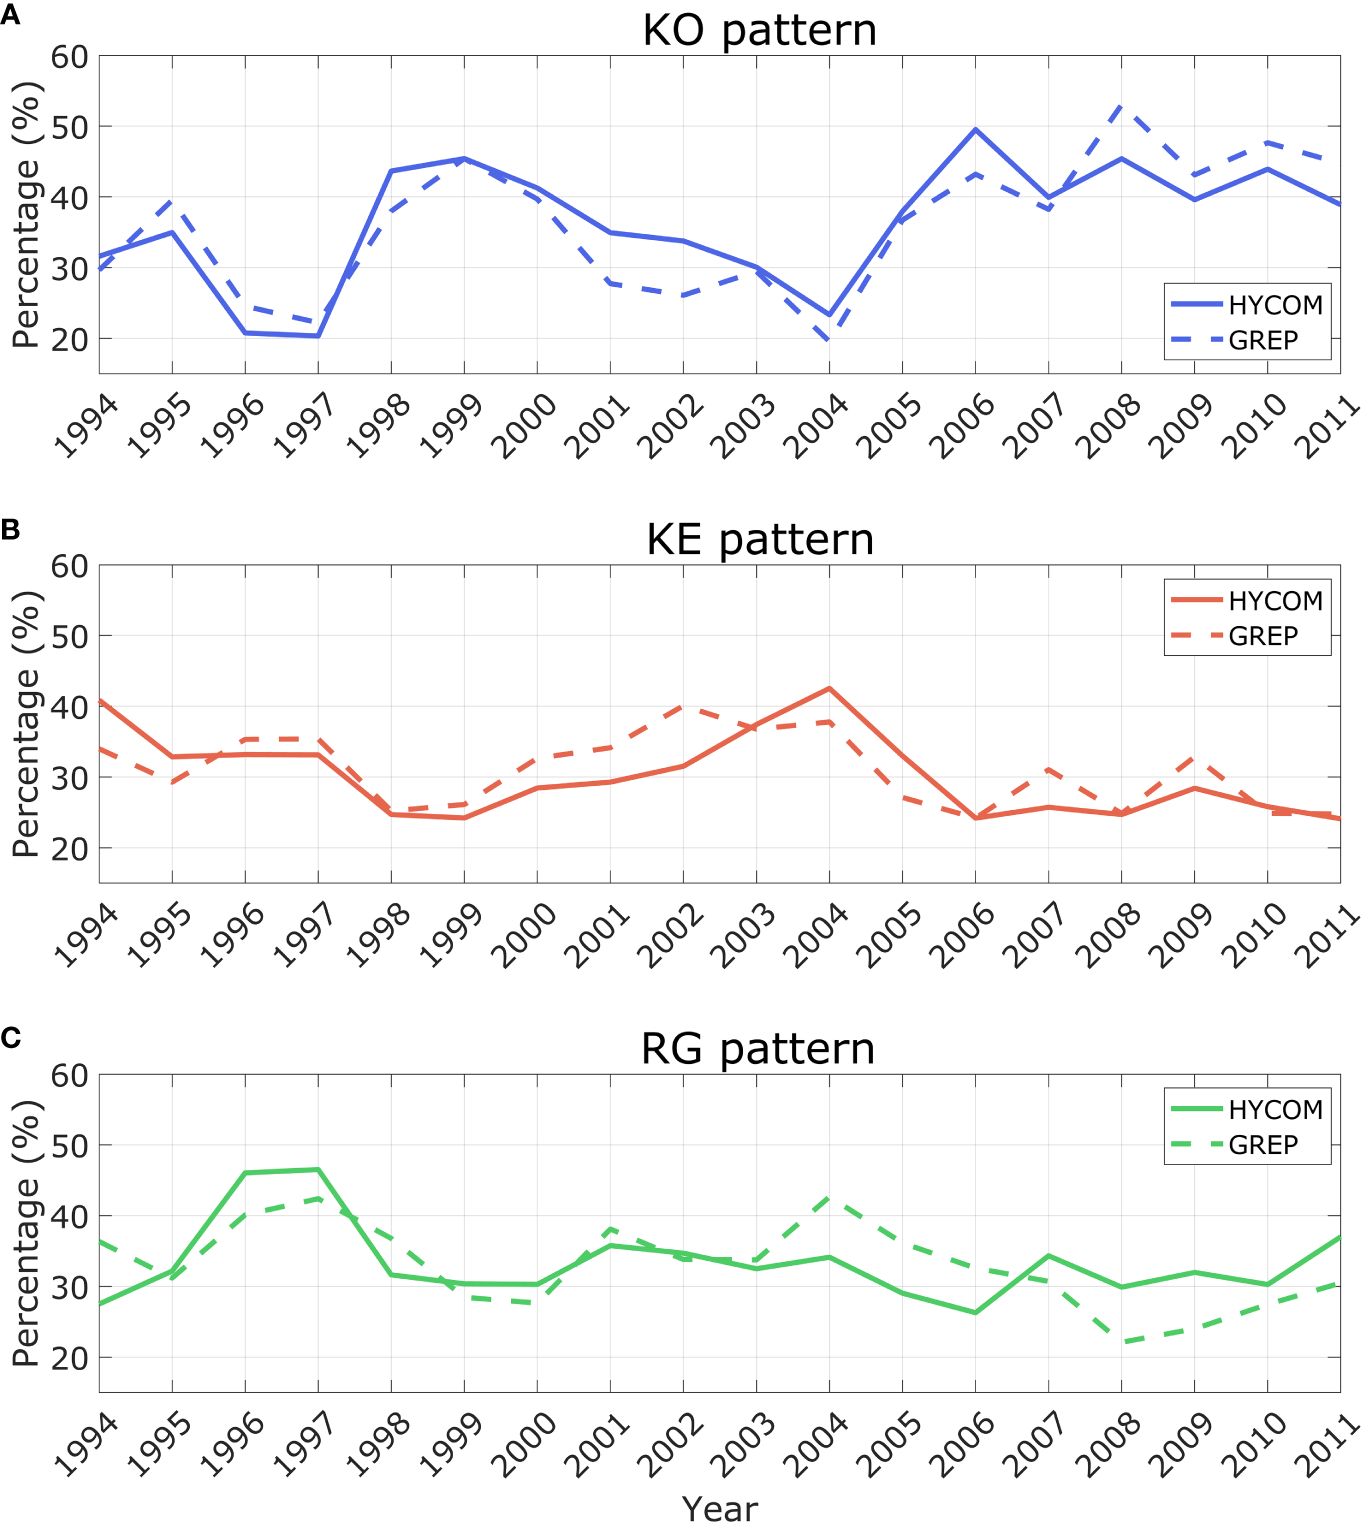
Figure 6 Annual portion of the (A) KO, (B) KE, and (C) RG patterns from the HYCOM data (solid line) and GREP data (dashed line). Note that the year (e.g., 1995) indicates the particle deployment period from December of the previous year (e.g., 1994) to the following April (e.g., 1995).
Figure 7 displays the interannual variabilities of the Kuroshio path length and the annual portion of the subsurface pathway (RG) estimated with HYCOM and GREP data. It should be noted that the subsurface paths in both reanalysis data were significantly correlated with the Kuroshio path length, but with opposite correlations. HYCOM exhibited a positive correlation, which suggests that the proportion of RG patterns increase (decreases) when the Kuroshio path is in a large (small) tortuous state. We can assume that the opposite relationship between the two reanalysis data models is due to the horizontal resolutions; the eddy-resolving HYCOM reproduces mesoscale eddies well, enhancing the southward NPSTMW subduction, while the GREP, which has an eddy-permitting resolution, cannot represent it.
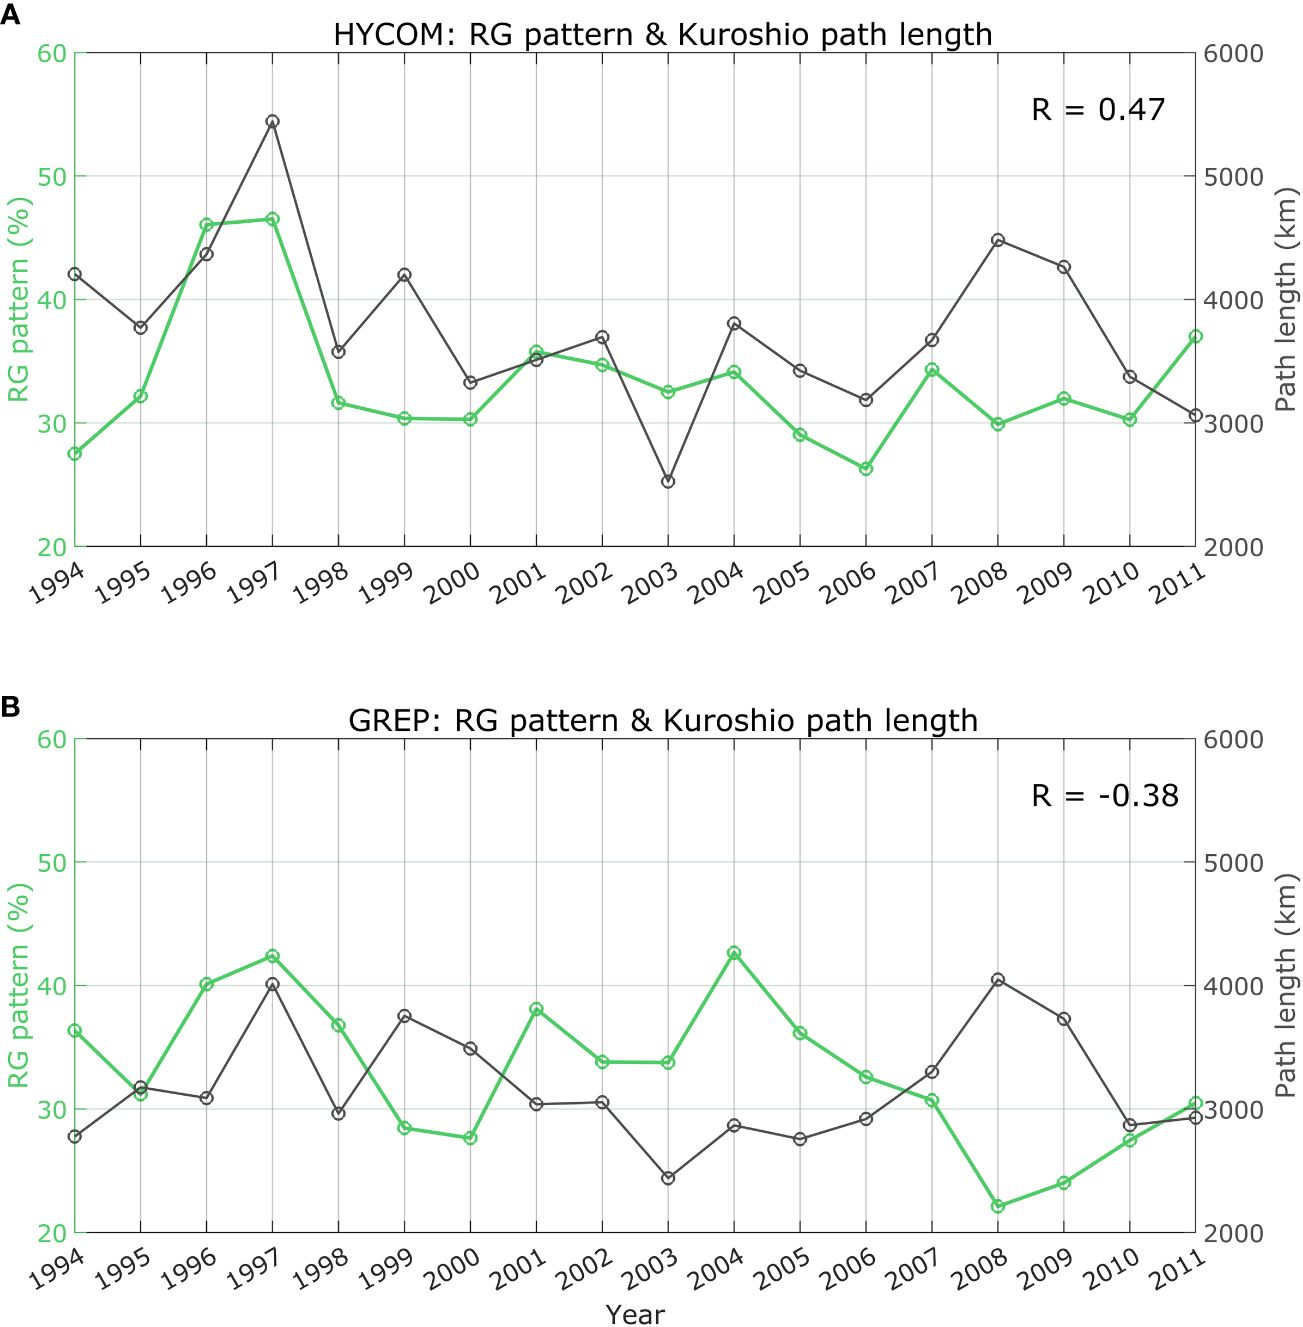
Figure 7 Time series of annual portion of the RG pattern (green) and the path length (black) of the Kuroshio main axis, which is defined by a 50 cm contour of the sea surface height in the regions of 141°–165°E during the cooling seasons (December to following April) from (A) the HYCOM data and (B) GREP data. Note that the year (e.g., 1995) indicates the particle deployment period from December of the previous year (e.g., 1994) to the following April (e.g., 1995).
4 Summary and discussion
The possible subsurface pathways and variabilities of the FDNPP-originating particles were quantitatively investigated using a 22-year-long (1994–2015) ocean reanalysis and Lagrangian particle modeling on the 25.2σθ isopycnal surface, which corresponds to the core layer of the NPSTMW. The reanalysis data reproduced the NPSTMW and KOE variability well. A series of forward particle tracking analyses revealed that the particles spread over the entire western North Pacific along the (1) KO (~36%), (2) KE (~31%), and (3) RG (~34%) (Figure 8). We discovered that it took approximately 4–5 years to reach the eastern coast of Taiwan, the Philippine islands, and the marginal seas of the western North Pacific, such as the East Sea/Japan Sea, which is consistent with the results of previous observational and modeling studies (Behrens et al., 2012; Aoyama et al., 2018; Inomata et al., 2018; Wang et al., 2022).
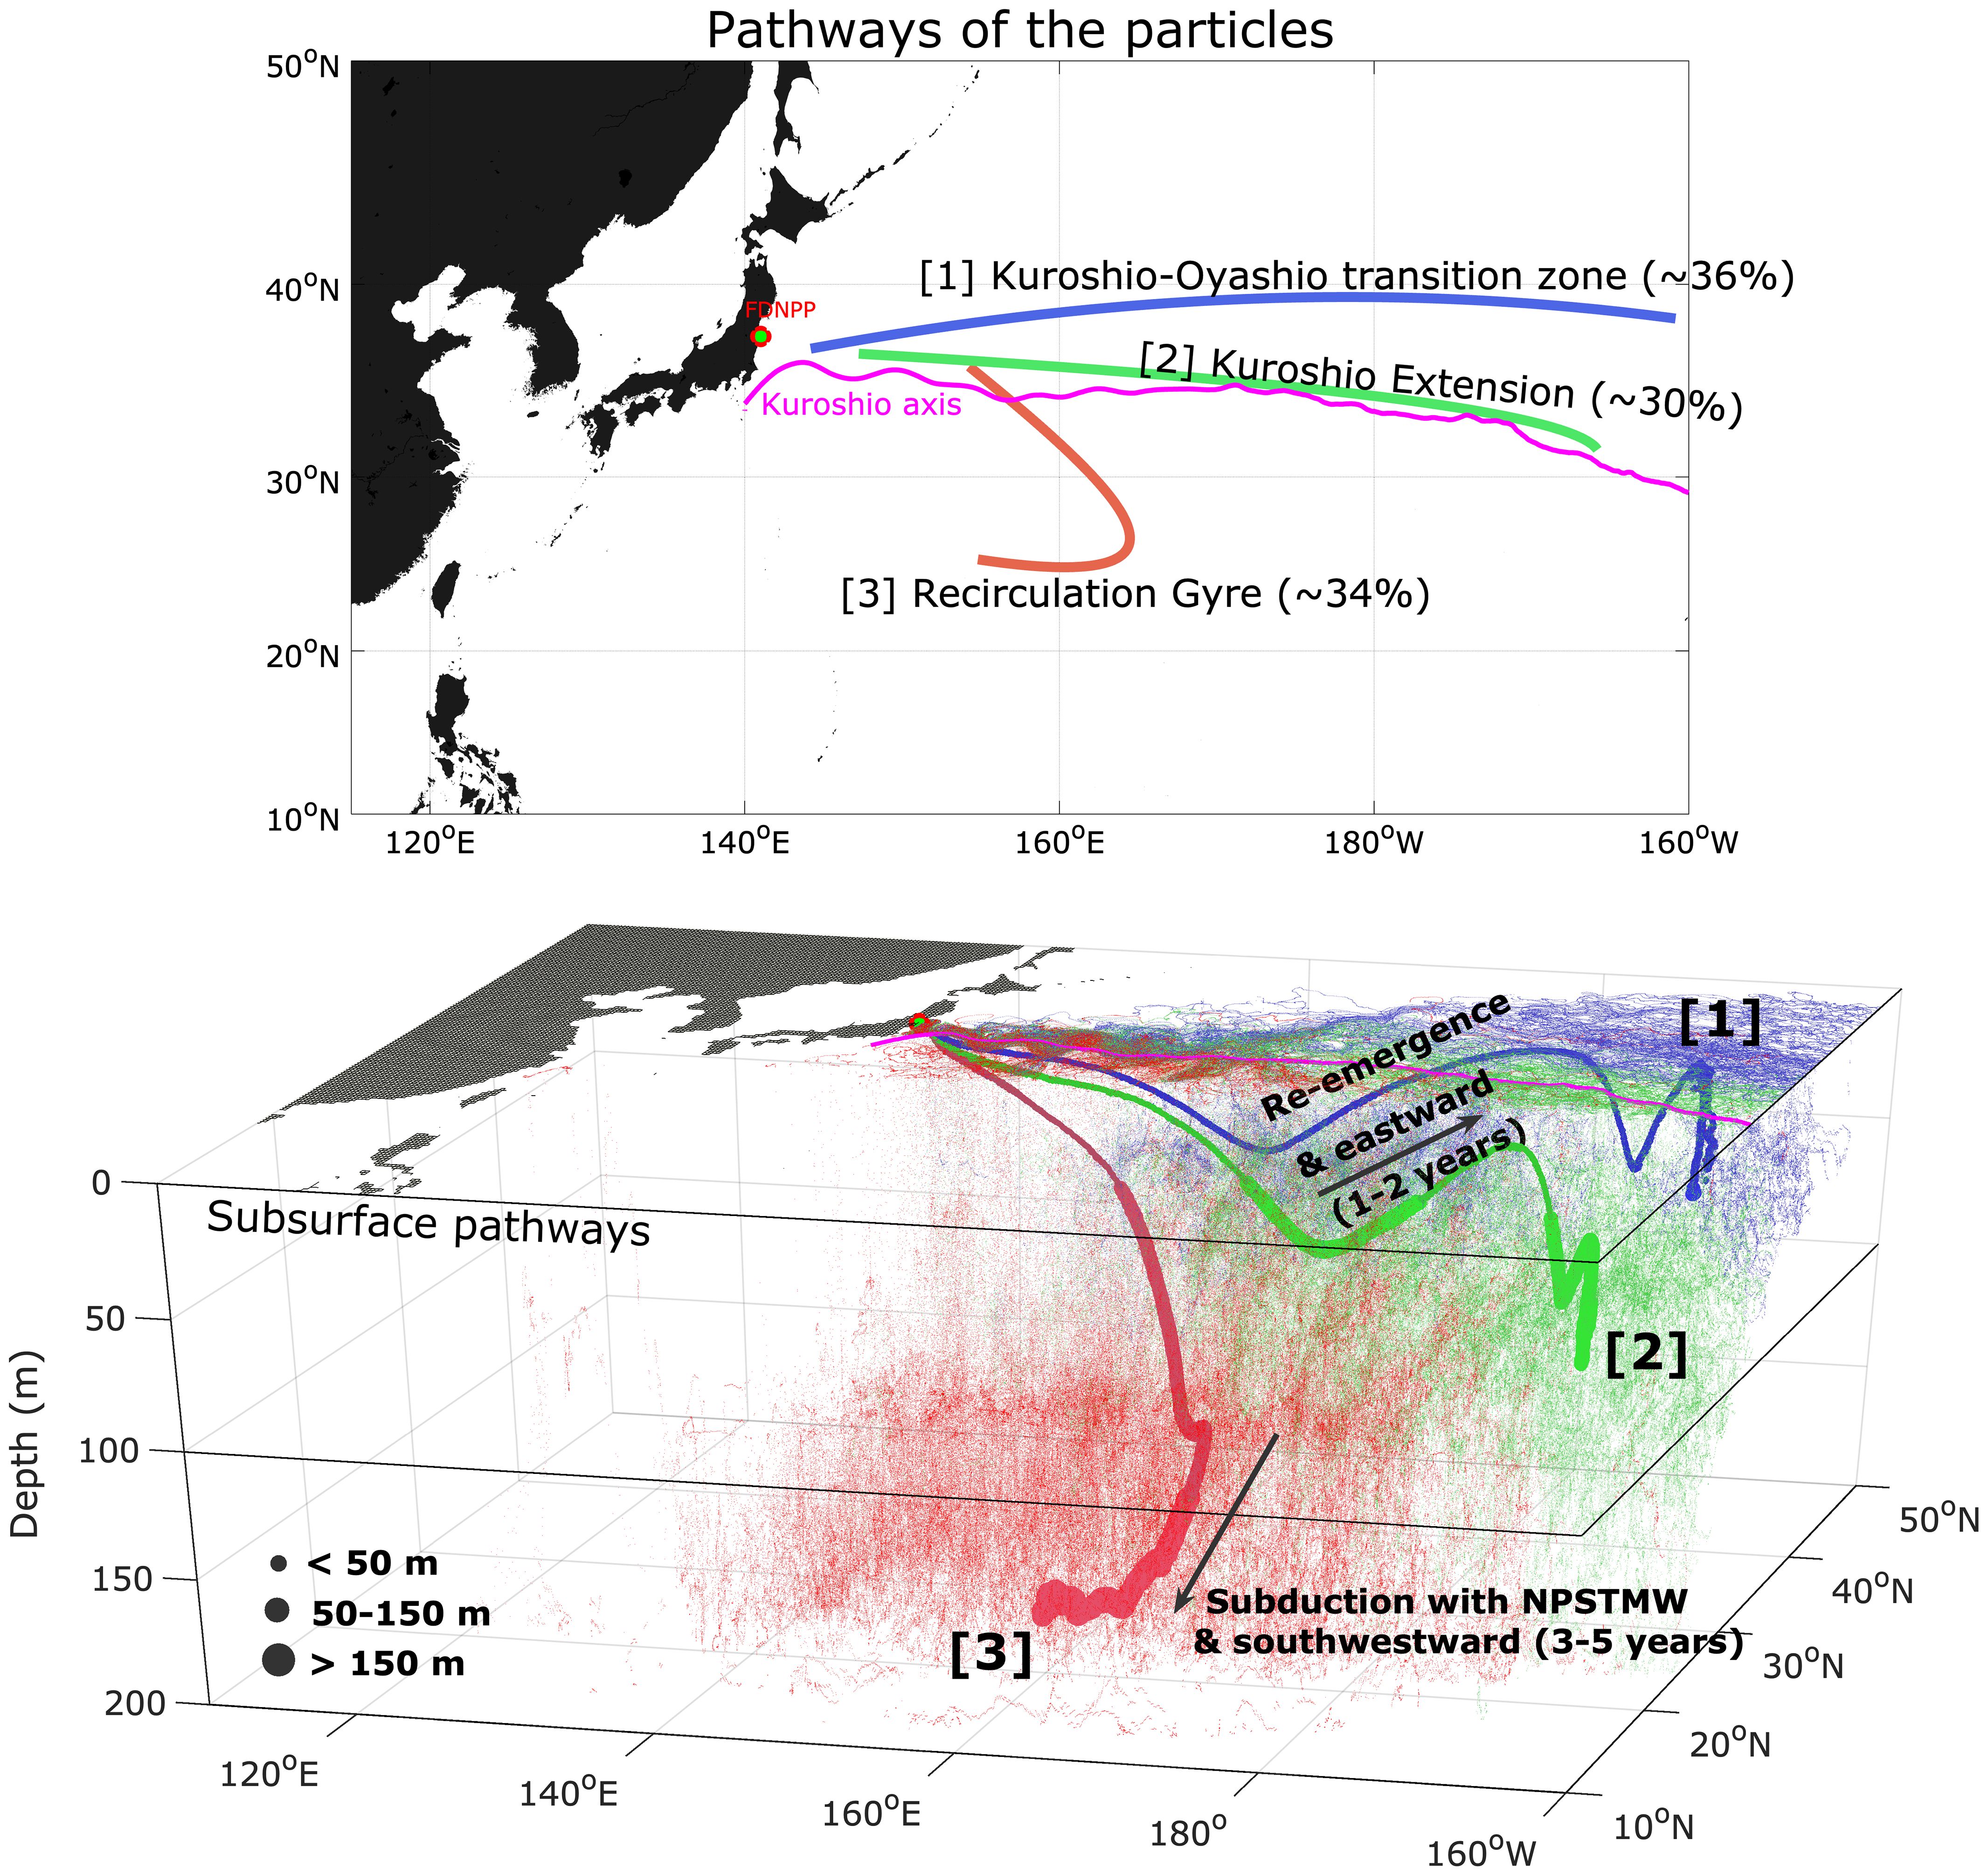
Figure 8 Schematic map of three subsurface pathways of the particles.
When the particles were released, their pathways were immediately determined, whether they flowed along the KO (> 36°N), KE (30°–36°N), or RG (< 30°N) patterns. The particles along the KO and KE patterns moved eastward and it took approximately one year to reach the dateline, while the particles along the RG pattern turned southwestward near 165°E. The depth and temperature of the KO pattern displayed strong seasonal variation, whereas the KE pattern displayed relatively weak seasonal variation in terms of depth and temperature. The RG pattern represents the subducted portion of the Fukushima-originating particles within the subsurface layer of the NPSTMW south of the KE.
In a recent study using a 3-dimensional hydrodynamic model (Lee et al., 2023), it was reported that a radioactive tracer originating from the FDNPP took approximately 8–9 years to reach the Taiwan and Philippine islands and followed a clockwise trajectory; however, there may have been limited southward movement that dissipated rapidly. This main propagation indicates a relatively longer travel time compared to previous studies (Behrens et al., 2012; Aoyama et al., 2018; Inomata et al., 2018; Wang et al., 2022) because they consider the limitation associated with the minimum concentration of 0.01 Bq m-3 of the tracer dyne method. Further observational and modeling studies are required to understand the detailed pathway and travel time of the FDNPP-originating particles in the subsurface layer.
Several previous studies suggested that the eddy activities in the KE region affect the variability of the NPSTMW transport and its subsurface spread into the subtropical region (Uehara et al., 2003; Qiu and Chen, 2006; Nishikawa et al., 2010; Oka and Qiu, 2012). Oka and Qiu (2012) reported that the NPSTMW subduction, revealed using Argo float data and high-resolution models, was quite different from that obtained using a non-eddy permitting or eddy permitting model. They suggested that the subduction of NPSTMW may be larger due to the enhanced eddy transport in the unstable KE period, which is accompanied by high regional eddy activity. Nishikawa et al. (2010) also reported that eddy subduction contributed to approximately half of the total STMW subduction. In this study, the relationship between the subsurface pathways and the eddy activities were not specifically investigated, although the variabilities of the RG pathways were found to be significantly correlated with the path length of the Kuroshio jet (Figure 7). We can assume that the different relationships observed in the reanalysis data are related to the horizontal resolution. Therefore, it is important to reproduce realistic eddy activities in the numerical ocean model to predict the time-space evolution of the particles in the subsurface layer. Moreover, our findings imply that the variability of the pathways is significantly associated with KE variability in the North Pacific region. The relationship between the local KE dynamics and the eddy activity needs to be further investigated in the future.
In order to quantitatively estimate the proportion of particles originated from the northern and southern KE, we have conducted an additional sensitivity experiment with larger atmospheric deposition including the south and north of KE (Figure 9A). We consider the particles released within 1 m (sea surface deposition) from March 11th to 31st in 2011 and the 137Cs deposition flux of 1,000 Bq m-2 following both reviewer’s comment. The subsurface pathways in 6 months are similar compared to those of Figure 1, although the pathways rather spread in north-south direction at the KE region (Figures 9B, E). Figures 9C, D, F, G show the distributions of the particles at the vertical section along 149°E during the winter of 2011–2012. In the HYCOM, the concentration of the 137Cs originated from the northern (southern) KE is 90,793 (33,018) Bq m-2 and it is about 73% (27%) of total 137Cs along 149°E section (Figures 9C, D). The ratio is similar in the GREP (north: 35,744 Bq m-2, 74% and south: 12,393 Bq m-2, 26%) (Figures 9F, G). This result suggested that more than 70% of the subsurface radioactive were originated from the northern KE as discussed in this study as well as the previous studies (Kumamoto et al., 2014; Kaeriyama et al., 2016; Cedarholm et al., 2019). It is noted that the local atmospheric deposition also can be a source of the subsurface radioactive as shown in Figures 9D, E, although the atmospheric deposition and oceanic input were not quantitatively distinguished in this study. Therefore, it is needed to quantitatively estimate the ratio between the atmospheric deposition and oceanic input considering the concentration of the radioactive using 3-D particle tracking simulation in further study. For the origin of the rest subsurface radioactive materials, we might guess two contributions, namely subduction south of KE and MLD deepening by the persistent meso-scale eddy (Kouketsu et al., 2012), consequently resulting in the cross-sectional pattern of two separated patches with one maximum in the north (near surface) and the other in the south (subsurface) regions.
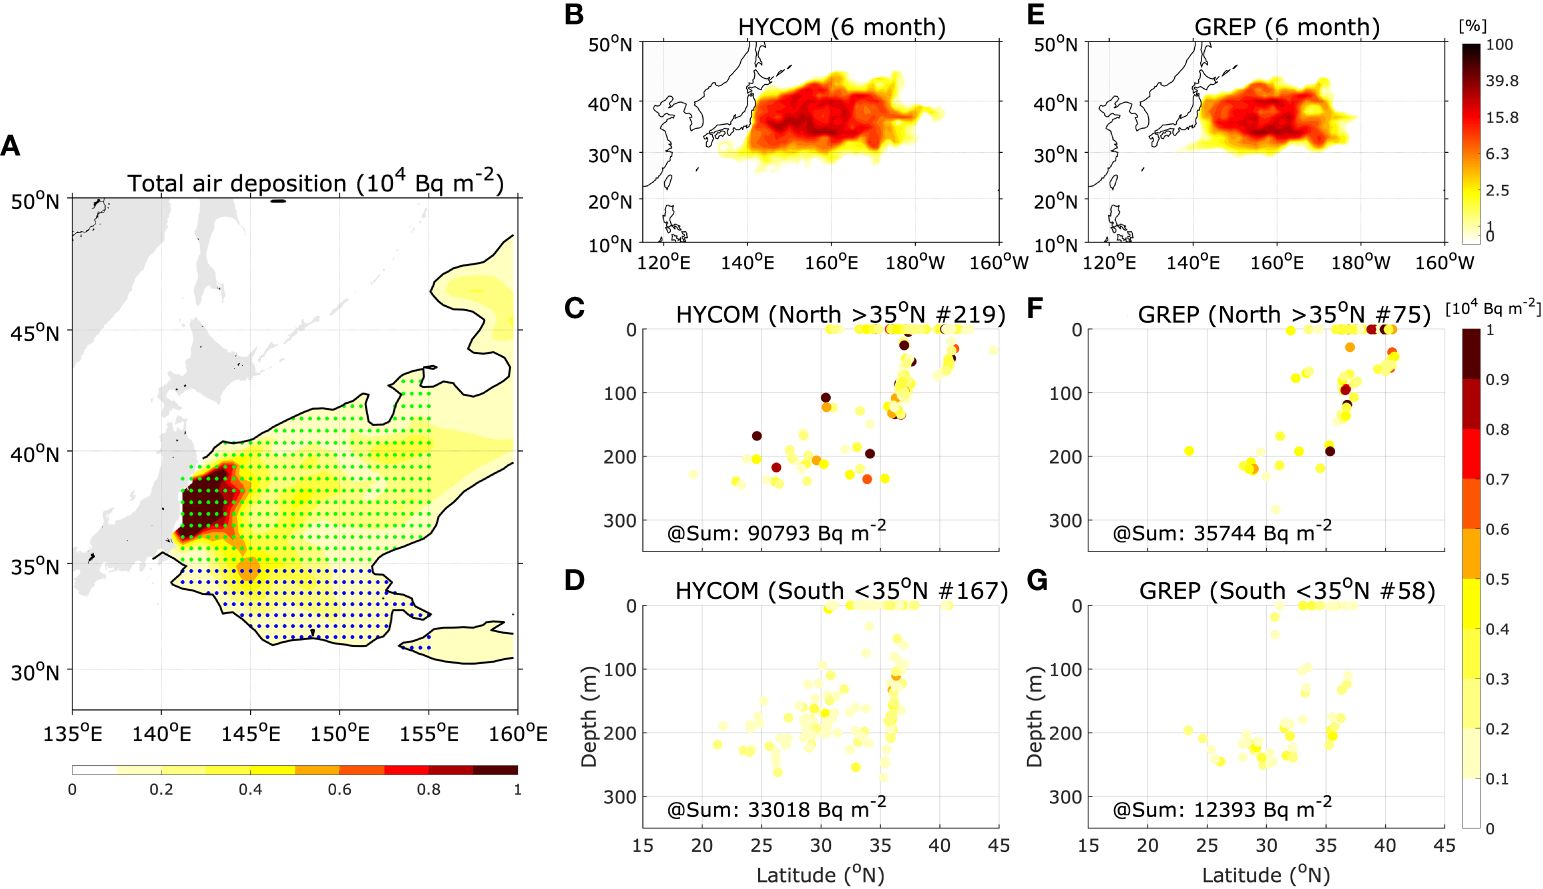
Figure 9 (A) Atmospheric deposition of 137Cs estimated by KAERI (Korea Atomic Energy Research Institute, Suh et al., 2017). Green (blue) dots indicate the initial particle deployment site in the northern (southern) Kuroshio Extension (KE). Thick black contour indicates 1,000 Bq m-2 of 137Cs. Probability of particle trajectories during 6 months after release (release period: March 11th to 31st of 2011) of (B) HYCOM and (E) GREP. Vertical distribution of the particles, which were originated from the southern KE, along 149°E section from the (C) HYCOM and (D) GREP. Color shades indicate the concentration of 137Cs at the release points of each particle. (F, G) Same as (C, D) but for the northern KE.
Data availability statement
The original contributions presented in the study are included in the article/Supplementary Material. Further inquiries can be directed to the corresponding author.
Author contributions
S-YK: Conceptualization, Data curation, Formal analysis, Funding acquisition, Investigation, Methodology, Software, Validation, Visualization, Writing – original draft, Writing – review & editing. HL: Conceptualization, Data curation, Funding acquisition, Methodology, Validation, Writing – review & editing. KJ: Data curation, Methodology, Validation, Writing – review & editing. HK: Writing – review & editing. KK: Data curation, Funding acquisition, Methodology, Project administration, Supervision, Validation, Writing – review & editing.
Funding
The author(s) declare financial support was received for the research, authorship, and/or publication of this article. We gratefully acknowledge that this research was supported by the Korea Institute of Marine Science & Technology Promotion (KIMST), funded by the Ministry of Oceans and Fisheries (RS-2023-00256141, Development of a global marine radioactive contamination effect prediction system). In-house projects of KIOST titled “Strengthening of prediction capabilities for marine changes and future projection of ocean climate in the vicinity of the Korean peninsula (PEA0203)”, and “Basic Science Research Program through the National Research Foundation of Korea (NRF)” were funded by the Ministry of Education, Korea (Grant No. NRF-2020R1A6A3A01098150). LHJ was supported by Korea CCUS Association (K-CCUS) grant funded by the Korea Government (MOE, MOTIE) (KCCUS20220001, Human Resources Program for Reduction of greenhouse gases).
Acknowledgments
The authors are grateful acknowledge to Dr. Seongbong Seo in KIOST and Dr. Kyung-Suk Suh in KAERI for their useful comments on particle tracking simulation and the atmospheric deposition of radionuclides data. The authors express their gratitude to the editor and two reviewers for their efforts in reviewing the paper and making valuable suggestions.
Conflict of interest
Author KJ is employed by Oceanic Consulting and Trading participating in the R&D project (RS-2023-00256141) as a collaborating partner.
The remaining authors declare that the research was conducted in the absence of any commercial or financial relationships that could be construed as a potential conflict of interest.
Publisher’s note
All claims expressed in this article are solely those of the authors and do not necessarily represent those of their affiliated organizations, or those of the publisher, the editors and the reviewers. Any product that may be evaluated in this article, or claim that may be made by its manufacturer, is not guaranteed or endorsed by the publisher.
Supplementary material
The Supplementary Material for this article can be found online at: https://www.frontiersin.org/articles/10.3389/fmars.2024.1358032/full#supplementary-material
References
Alexander M. A., Deser C., Timlin M. S. (1999). The reemergence of SST anomalies in the North Pacific Ocean. J. Climate 12, 2419–2433. doi: 10.1175/1520-0442(1999)012<2419:TROSAI>2.0.CO;2
Aoyama M., Hamajima Y., Hult M., Uematsu M., Oka E., Tsumune D., et al. (2016). 134Cs and 137Cs in the North Pacific Ocean derived from the March 2011 TEPCO Fukushima Dai-ichi Nuclear Power Plant accident, Japan. Part one: surface pathway and vertical distributions. J. Oceanogr. 72, 53–65. doi: 10.1007/s10872-015-0335-z
Aoyama M., Hamajima Y., Inomata Y., Kumamoto Y., Oka E., Tsubono T., et al. (2018). Radiocaesium derived from the TEPCO Fukushima accident in the North Pacific Ocean: Surface transport processes until 2017. J. Environ. Radioactivity 189, 93–102. doi: 10.1016/j.jenvrad.2018.03.014
Aoyama M., Uematsu M., Tsumune D., Hamajima Y. (2013). Surface pathway of radioactive plume of TEPCO Fukushima NPP1 released 134Cs and 137Cs. Biogeosciences 10, 3067–3078. doi: 10.5194/bg-10-3067-2013
Bates N. R. (2012). Multi-decadal uptake of carbon dioxide into subtropical mode water of the North Atlantic Ocean. Biogeosciences 9, 2649–2659. doi: 10.5194/bg-9-2649-2012
Behrens E., Schwarzkopf F. U., Lübbecke J. F., Böning C. W. (2012). Model simulations on the long-term dispersal of 137Cs released into the Pacific Ocean off Fukushima. Environ. Res. Lett. 7, 34004. doi: 10.1088/1748-9326/7/3/034004
Buesseler K., Aoyama M., Fukasawa M. (2011). Impacts of Fukushima nuclear power plants on marine radioactivity. Environ. Sci. Technol. 45, 9931–9935. doi: 10.1021/es202816c
Buesseler K., Dai M., Aoyama M., Benitez-Nelson C., Charmasson S., Higley K., et al. (2012). Fukushima Daiichi-derived radionuclides in the ocean: Transport, fate, and impacts. Annu. Rev. Mar. Sci. 9, 173–203. doi: 10.1146/annurev-marine-010816-060733
Cedarholm E. R., Rypina I. I., Macdonald A. M., Yoshida S. (2019). Investigating subsurface pathways of Fukushima Cesium in the Northwest Pacific. Geophys. Res. Lett. 46, 6821–6829. doi: 10.1029/2019GL082500
Chassignet E. P., Hurlburt H. E., Smedstad O. M., Halliwell G. R., Hogan P. J., Wallcraft A. J., et al. (2007). The HYCOM (hybrid coordinate ocean model) data assimilative system. J. Mar. Syst. 65, 60–83. doi: 10.1016/j.jmarsys.2005.09.016
Choi J. G., Jo. Y. H., Moon I. J., Park J., Kim D. W., Lippmann T. C. (2018). Physical forces determine the annual bloom intensity of the giant jellyfish Nemopilema nomurai off the coast of Korea. Regional Stud. Mar. Sci. 24, 55–65. doi: 10.1016/j.rsma.2018.07.003
Dormand J. R., Prince P. J. (1980). A family of embedded Runge-Kutta formulae. J. Comput. Appl. Mathematics 6, 19–26. doi: 10.1016/0771-050X(80)90013-3
Gaffney S. J. (2004). Probabilistic curve-aligned clustering and prediction with regression mixture models. University of California, Irvine, CA, 281. Available at: http://www.ics/uci/edu/pub/sgaffney/outgoing/sgaffney_thesis.pdf.
Good S. A., Martin M. J., Rayner N. A. (2013). EN4: Quality controlled ocean temperature and salinity profiles and monthly objective analyses with uncertainty estimates. J. Geophys. Research: Oceans 118, 6704–6716. doi: 10.1002/2013JC009067
Griffies S. M., Hallberg R. W. (2000). Biharmonic friction with a Smagorinsky viscosity for use in large-scale eddy-permitting ocean models. Monthly Weather Rev. 128, 2935–2946. doi: 10.1175/1520-0493(2000)128<2935:BFWASL>2.0.CO;2
Inomata Y., Aoyama M. (2023). Evaluating the transport of surface seawater from 1956 to 2021 using 137Cs deposited in the global ocean as a chemical tracer. Earth System Sci. Data 15, 1969–2007. doi: 10.5194/essd-15-1969-2023
Inomata Y., Aoyama M., Hamajima Y., Yamada M. (2018). Transport of FNPP1-derived radiocaesium from subtropical mode water in the western North Pacific Ocean to the Sea of Japan. Ocean Sci. 14, 813–826. doi: 10.5194/os-14-813-2018
Iwasaki S., Isobe A., Kako S., Uchida K., Tokai T. (2017). Fate of microplastics and mesoplastics carried by surface currents and wind waves: A numerical model approach in the Sea of Japan. Mar. pollut. Bull. 121, 85–96. doi: 10.1016/j.marpolbul.2017.05.057
Kaeriyama H., Aoyama M., Kumamoto Y. (2023). “Radiocaesium in the ocean interior as mode waters in the North Pacific,” in Radionuclides in the Marine Environment: Scien-tific view on the Fukushima Dai-ichi Nuclear Power Station Accident by 7 oceanographers. Eds. Aoyama M., Inomata Y., Kaeriyama H., Kumamoto Y., Otosaka S., Tateda Y., et al (Tsukuba: Univ. of Tsukuba Press).
Kaeriyama H., Shimizu Y., Setou T., Kumamoto Y., Okazaki M., Ambe D., et al. (2016). Intrusion of Fukushima-derived radiocaesium into subsurface water due to formation of mode waters in the North Pacific. Sci. Rep. 6, 22010. doi: 10.1038/srep22010
Kanda J. (2013). Continuing 137Cs release to the sea from the Fukushima Dai-ichi nuclear power plant through 2012. Biogeosciences 10, 6107–6113. doi: 10.5194/bg-10-6107-2013
Kim S.-Y., Kwon Y. O., Park W., Lee H. J. (2022). Multidecadal regime shifts in North Pacific subtropical mode water formation in a coupled atmosphere-ocean-sea ice model. Geophys. Res. Lett. 49, e2022GL099406. doi: 10.1029/2022GL099406
Kim S.-Y., Park Y.-G., Kim Y. H., Seo S., Jin H., Pak G., et al. (2021). Origin, variability, and pathways of East Sea Intermediate Water in a high-resolution ocean reanalysis. J. Geophys. Research: Oceans 126, e2020JC017158. doi: 10.1029/2020JC017158
Kobashi F., Misudera H., Xie S. P. (2006). Three subtropical fronts in the North Pacific: Observational evidence for mode water-induced subsurface frontogenesis. J. Geophys. Res. 111, C09033. doi: 10.1029/2006JC003479
Kouketsu S., Tomita H., Oka E., Hosoda S., Kobayashi T., Sato K. (2012). The role of meso-scale eddies in mixed layer deepening and mode water formation in the western North Pacific. J. Oceanogr. 68, 63–77. doi: 10.1007/s10872-011-0049-9
Kumamoto Y., Aoyama M., Hamajima Y., Aono T., Kouketsu S., Murata A., et al. (2014). Southward spreading of the Fukushima-derived radiocesium across the Kuroshio Extension in the North Pacific. Sci. Rep. 4, 4276. doi: 10.1038/srep04276
Kumamoto Y., Aoyama M., Hamajima Y., Oka E., Murata A. (2018). Time evolution of Fukushima-derived radiocesium in the western subtropical gyre of the North Pacific Ocean by 2017. J. Radioanal. Nucl. Chem. 318, 2181–2187. doi: 10.1007/s10967-018-6133-5
Lee S. T., Jung J., Kim G., Tak Y. J., Cho. Y. K. (2023). Subsurface dispersion path and travel time of radiocesium from Fukushima by mode water. Front. Mar. Sci. 10. doi: 10.3389/fmars.2023.1104786
Lynch D. R., Greenberg D. A., Bilgili A., Macgillicuddy D. J., Manning J. P., Aretxabaleta A. L. (2015). Particles in the coastal ocean. Theory and Applications (NY: Cambridge University Press).
Masuzawa J. (1969). Subtropical mode water. Deep-Sea Res. Oceanographic Abstracts 16, 463–472. doi: 10.1016/0011-7471(69)90034-5
Men W., He J., Wang F., Li Y., Huang J., Yu X. (2015). Radioactive status of seawater in the northwest Pacific more than one year after the Fukushima nuclear accident. Sci. Rep. 5, 7757. doi: 10.1038/srep07757
Mizuno K., White W. B. (1983). Annual and interannual variability in the Kuroshio current system. J. Phys. Oceanogr. 13, 1847–1867. doi: 10.1175/1520-0485(1983)013<1847:AAIVIT>2.0.CO;2
Nagao S., Kanamori M., Ochiai S., Tomihara S., Fukushi K., Yamamoto M. (2013). Export of 134Cs and 137Cs in the Fukushima river systems at heavy rains by Typhoon Roke in September 2011. Biogeosciences 10, 6215–6223. doi: 10.5194/bg-10-6215-2013
Nishikawa S., Kubokawa A. (2012). Mixed layer depth front and subduction of low potential vorticity water under seasonal forcings in an idealized OGCM. J. Oceanogr. 68, 53–62. doi: 10.1007/s10872-011-0086-4
Nishikawa S., Tsujino H., Sakamoto K., Nakano H. (2010). Effects of mesoscale eddies on subduction and distribution of subtropical mode water in an eddy-resolving OGCM of the western North Pacific. J. Phys. Oceanogr. 40, 1748–1765. doi: 10.1175/2010JPO4261.1
Oka E., Qiu B. (2012). Progress of North Pacific mode water research in the past decade. J. Oceanogr. 68, 5–20. doi: 10.1007/s10872-011-0032-5
Oka E., Nishikawa H., Sugimoto S., Qiu B., Schneider N. (2021). Subtropical mode water in a recent persisting Kuroshio large-meander period: part I - formation and advection over the entire distribution region. J. Oceanogr. 77, 781–795. doi: 10.1007/s10872-021-00608-3
Oka E., Yamada K., Sasano D., Enyo K., Nakano T., Ishii M. (2019). Remotely forced decadal physical and biogeochemical variability of North Pacific subtropical mode water over the last 40 years. Geophys. Res. Lett. 46, 1555–1561. doi: 10.1029/2018GL081330
Periáñez R., Bezhenar R., Brovchenko I., Duffa C., Iosjpe M., Jung K. T., et al. (2019). Marine radionuclide transport modelling: Recent developments, problems and challenges. Environ. Model. Software 122, 104523. doi: 10.1016/j.envsoft.2019.104523
Proehl J. A., Lynch D. R., McGillicuddy D. J. Jr., Ledwell J. R. (2005). Modeling turbulent dispersion on the North Flank of Georges Bank using Lagrangian particle methods. Continental Shelf Res. 25, 875–900. doi: 10.1016/j.csr.2004.09.022
Qiu B., Chen S. (2006). Decadal variability in the formation of the North Pacific subtropical mode water: Oceanic versus atmospheric control. J. Phys. Oceanogr. 36, 1365–1380. doi: 10.1175/JPO2918.1
Qiu B., Chen S., Schneider N., Taguchi B. (2014). A coupled decadal prediction of the dynamic state of the Kuroshio Extension system. J. Climate 27, 1751–1764. doi: 10.1175/JCLI-D-13-00318.1
Rainville L., Jayne S. R., Cronin M. F. (2014). Variations of the North Pacific subtropical mode water from direct observations. J. Climate 27, 2842–2860. doi: 10.1175/JCLI-D-13-00227.1
Rossi V., Sebille E. V., Gupta A. S., Garçon V., England M. H. (2013). Multi-decadal projections of surface and interior pathways of the Fukushima Cesium-137 radioactive plume. Deep-Sea Res. I 80, 37–46. doi: 10.1016/j.dsr.2013.05.015
Rypina I. I., Jayne S. R., Yoshida S., Macdonald A. M., Buesseler K. (2014). Drifter-based estimate of the 5 year dispersal of Fukushima-derived radionuclides. J. Geophys. Research: Oceans 119, 8177–8193. doi: 10.1002/2014JC010306
Seo S., Park Y.-G. (2020). Destination of floating plastic debris released from ten major rivers around the Korean Peninsula. Environ. Int. 138, 105655. doi: 10.1016/j.envint.2020.105655
Smagorinsky J. (1963). General circulation experiments with the primitive equations. Monthly Weather Rev. 91, 99–164. doi: 10.1175/1520-0493(1963)091<0099:GCEWTP>2.3.CO;2
Storto A., Masina S., Simoncelli S., Iovino D., Cipollone A., Drevillon M., et al. (2019). The added value of the multi-system spread information for ocean heat content and steric sea level investigations in the CMEMS GREP ensemble reanalysis product. Climate Dynamics 53, 287–312. doi: 10.1007/s00382-018-4585-5
Sugimoto S., Hanawa K. (2005). Remote reemergence areas of winter sea surface temperature anomalies in the North Pacific. Geophys. Res. Lett. 32, L01606. doi: 10.1029/2004GL021410
Suh K.-S., Kim S., Min B.-I. (2017). Atmospheric dispersion and sea surface deposition of radionuclides by the Fukushima nuclear accident. J. Coast. Res. 79, 85–88. doi: 10.2112/SI79-018.1
Uehara H., Suga T., Hanawa K., Shikama N. (2003). A role of eddies in formation and transport of North Pacific subtropical mode water. Geophys. Res. Lett. 30, 1705. doi: 10.1029/2003GL017542
Wang F., Men W., Yu T., Huang J., He J., Lin J., et al. (2022). Intrusion of Fukushima-derived radiocesium into the East China sea and the Northeast South China Sea in 2011–2015. Chemosphere 294, 133546. doi: 10.1016/j.chemosphere.2022.133546
Xu L., Li P., Xie S. P., Liu Q., Liu C., Gao W. (2016). Observing mesoscale eddy effects on mode-water subduction and transport in the North Pacific. Nat. Commun. 7, 10505. doi: 10.1038/ncomms10505
Yoshida N., Kanda J. (2012). Tracking the Fukushima radionuclides. Science 336, 1115–1116. doi: 10.1126/science.1219493
Keywords: Fukushima-derived materials, North Pacific subtropical mode water, Kuroshio extension, Ocean reanalysis, Particle tracking simulation
Citation: Kim S-Y, Lee HJ, Jung KT, Kim H and Kim KO (2024) A study on the pathways and their interannual variability of the Fukushima-derived tracers in the northwestern Pacific. Front. Mar. Sci. 11:1358032. doi: 10.3389/fmars.2024.1358032
Received: 19 December 2023; Accepted: 26 February 2024;
Published: 13 March 2024.
Edited by:
Xiaohui Xie, Ministry of Natural Resources, ChinaReviewed by:
Yuichiro Kumamoto, Japan Agency for Marine-Earth Science and Technology (JAMSTEC), JapanHideki Kaeriyama, Japan Fisheries Research and Education Agency (FRA), Japan
Copyright © 2024 Kim, Lee, Jung, Kim and Kim. This is an open-access article distributed under the terms of the Creative Commons Attribution License (CC BY). The use, distribution or reproduction in other forums is permitted, provided the original author(s) and the copyright owner(s) are credited and that the original publication in this journal is cited, in accordance with accepted academic practice. No use, distribution or reproduction is permitted which does not comply with these terms.
*Correspondence: Kyeong Ok Kim, a29raW1Aa2lvc3QuYWMua3I=