 Annemarie Wood
 Luke McCartin
 Santiago Herrera
 Andrea M. Quattrini
 Allen G. Collins
- 1Department of Invertebrate Zoology, National Museum of Natural History, Smithsonian Institution, Washington, DC, United States
- 2Department of Biological Sciences, Lehigh University, Bethlehem, PA, United States
- 3Lehigh Oceans Research Center, Lehigh University, Bethlehem, PA, United States
- 4National Systematics Laboratory, Office of Science & Technology, National Oceanic and Atmospheric Administration (NOAA) Fisheries, Washington, DC, United States
While gelatinous zooplankton (GZ) constitute a vital component of the marine food web, understanding their biology and ecology has been hindered because traditional collection methods often destroy their fragile bodies. Environmental DNA (eDNA) sequencing is a non-invasive approach that can detect organisms that are difficult to sample, enabling the DNA of understudied taxa to be sequenced. Here, we present the first application of eDNA metabarcoding targeting Ctenophora and Medusozoa. We first assessed the applicability of an anthozoan eDNA primer set designed to a 28S barcode in anthozoans for amplifying this region in ctenophores and medusozoans, including the creation of a 28S reference library for Ctenophora. After determining that the primers complement these groups well, the primers were used to analyze eDNA samples from mesophotic and deep-sea sites off the Gulf Coast of the southern USA. We recovered sequences belonging to a diverse array of GZ taxa and used these data to distinguish GZ communities by site and ecosystem type, characterize community diversity, and facilitate a better understanding of how these mysterious organisms interact within their ecosystem. The versatility of this primer set presents an exciting opportunity to research taxa that have been historically difficult to study, while further contributing to our understanding of their ecological roles in the deep sea.
1 Introduction
Gelatinous zooplankton (GZ) such as ctenophores (phylum: Ctenophora) and pelagic medusozoans (phylum: Cnidaria) play vital roles in marine ecosystems worldwide, yet they remain understudied. As carnivores, they consume other zooplankton and are thus primed to initiate top-down effects on primary consumers and producers (Segura-Puertas et al., 2009; Mills, 1995; Chi et al., 2021; Potter et al., 2023), and serve as potential bioindicators for plastic pollution (Macali and Bergami, 2020). Jellies also function as food sources; although once considered “trophic dead-ends’’ due to their low nutrition content, recent studies have found they constitute a sizable percentage of prey for a diverse range of animals (Hays et al., 2018; Brodeur et al., 2021; Diaz Briz et al., 2017; Cardona et al., 2012). Many gelatinous zooplankton groups specialize in feeding on other gelatinous taxa, and their various roles as predator and prey coupled with their range across different depth zones allow these organisms to facilitate energy transfer throughout pelagic food webs (Robison, 2004; Choy et al., 2017; Chi et al., 2021). Since many gelatinous zooplankton have benthic and pelagic life stages, the establishment, survival and proliferation of benthic and pelagic populations directly link midwater and bottom ecosystems. They are also critical in benthic-pelagic coupling via nutrient exchange from their waste products and decaying bodies and provide sustenance for scavengers as “food falls” (Smith et al., 2016). Their distribution throughout the water column allows ctenophores and medusozoans to interact with diverse marine communities from the surface to the abyssal zone.
These organisms are also important to understand from a human perspective, as they can form enormous blooms that wreak havoc on fisheries (Júnior et al., 2022; Ivanov et al, 2000). Jellies can rapidly aggregate into huge masses due to key biological traits, such as fast individual growth rates and short generation times, allowing them to dominate an ecosystem when the environmental conditions are favorable. Swift jelly aggregations can destroy local fish populations since jellies compete directly with fish by eating their eggs and indirectly by consuming their prey (Ivanov et al., 2000). When these fisheries collapse, it has drastic significance for local food sources as well as people’s livelihoods (Oguz et al., 2008; Zaitsev and Mamaev, 1997). Medusozoans can additionally pose a health risk to swimmers through envenomation (Fenner, 1998; Haddad et al., 2018), and the sheer abundance of gelatinous organisms during blooms can block up industrial machinery (De Donno et al., 2014). Anthropogenic impacts such as climate change and eutrophication may contribute to jelly blooms, potentially increasing the negative impacts of these aggregations in recent years, although there has been a lack of direct evidence supporting this claim (Purcell et al., 2007; Pitt et al., 2018). Determining the taxonomic composition of ctenophore and medusozoan communities, especially in places that humans also frequent, is crucial for clarifying the spatial and temporal distribution of the species responsible for issues like blooms, toxin production, and fishery collapse.
Despite the relevance of ctenophores and medusozoans to marine communities, the composition of these communities is still not well understood in many regions worldwide. In the Gulf, the biology and ecology of gelatinous zooplankton remain poorly studied (Segura-Puertas et al., 2009; Moss, 2009). Most studies on jellies focus on coastal and neritic waters rather than open-water oceanic regions (Segura-Puertas et al., 2009; Puente-Tapia et al., 2021). Very few species have been reported in the deep waters of the Gulf, possibly due to the challenges and high costs of sampling in the deep sea (Puente-Tapia et al., 2021). The few existing studies of zooplankton in the Gulf tend to focus on zooplankton broadly (Hopkins, 1982; Ortner et al., 1989) rather than focusing on gelatinous taxa, with ctenophore studies being particularly limited. Reflecting this paucity of information, the Ocean Biodiversity Information System (OBIS) contains just 26 occurrence records of ctenophores for 10 taxa (eight identified to species) across a region encompassing our sampling sites south of Texas and Louisiana (see below) during the years 1885 to 2021. Over the same period and geographic region, OBIS records 821 records for 30 medusozoan taxa, with the vast majority of occurrences identified only to class level.
These communities remain obscure because gelatinous zooplankton are difficult to collect via traditional sampling methods. Collecting specimens with nets tends to pulverize their soft, fragile bodies, and visual surveys may overlook them due to their semi-transparency and small body size (Júnior et al., 2022; Haddock, 2004; Hosia et al., 2017). Moreover, zooplankton species are notoriously patchy in their distributions, over both micro- and meso-scales (Robinson et al., 2021), driven by complex biological and environmental drivers (e.g., Folt and Burns, 1999; Luo et al., 2014). These challenges have made it notoriously difficult to study these animals that have profound roles in our ocean. Biodiversity assessment methods utilizing environmental DNA, or eDNA, present a promising opportunity for researching understudied taxa (Govindarajan et al., 2021; Di Capua et al., 2021) such as ctenophores and medusozoans. These methods rely on sequencing the genetic material — such as epidermal cells, gametes, or excretory waste — contained in environmental samples, like water or sediments (Seymour, 2019; Thomsen and Willerslev, 2015). eDNA analysis often allows us to obtain data on organisms that are not collected via traditional sampling because it does not rely on the organism being visible at the time of sampling and can therefore inform a more complete picture of the community by detecting organisms that may be overlooked. Additionally, eDNA analysis is non-invasive and does not require the organism to be captured, which is advantageous for species conservation.
eDNA has already been employed to study and monitor a range of marine organisms and communities, including corals (Everett and Park, 2018; Shinzato et al., 2021). McCartin et al. (2024) designed a primer set (referred to as Anth-28S-eDNA) that targets 28S rDNA across anthozoan corals (octocorals, black corals, and scleractinians). Medusozoans and ctenophores were among the additional taxa sequenced using the Anth-28S-eDNA primers, indicating that this primer set might also be used to address communities beyond anthozoan corals. The applicability of this primer set for organisms other than Anthozoa presents a promising opportunity to target multiple understudied taxa using the same workflow.
Here, we aimed to evaluate the applicability of the Anth-28S-eDNA primer set for detecting ctenophore and medusozoan eDNA as well as assess its potential for distinguishing taxa and characterizing community composition across a broad depth range (from 8 to 531 meters). We utilized previously generated eDNA sequencing data (McCartin et al., 2024) collected from Niskin bottles attached to a remotely operated vehicle (ROV) and Conductivity Temperature Depth (CTD) Rosette in mesophotic and deep waters off the Gulf Coast of the southern USA that had not yet been analyzed for gelatinous zooplankton. We first evaluated the complementarity of the Anth-28S-eDNA primers with a diverse array of 28S sequences from ctenophores and medusozoans. Subsequently, amplicon sequence variants (ASVs) from the field samples were analyzed to 1) determine what environmental variables explain variation in community structure, 2) characterize and compare family composition between benthic day and pelagic night ecosystems, and 3) analyze alpha diversity by site. The versatility of this primer set presents an exciting opportunity to research taxa that have been historically difficult to study and contribute to our understanding of their ecological role in the deep sea.
2 Methods
2.1 Creation of 28S reference datasets
When we initiated this work in late 2023, just three complete ctenophore 28S sequences were in GenBank (Sayers et al., 2023). We used previously published SRA datasets deposited in the National Center for Biotechnology Information (NCBI) to assemble the ribosomal genes (28S) of 50 ctenophores representative of the taxonomic diversity of the phylum as follows (Supplementary Table S1). The first 8 million reads in the dataset were separated and then assembled using the “Map to Reference’’ function and built-in mapper of Geneious Prime 2023 (https://www.geneious.com), with three iterations using an exemplar 28S ctenophore sequence as the seed reference. In contrast to the case of ctenophores, 28S has been used extensively in phylogenetic systematics analyses of medusozoans (Collins et al., 2006; Cartwright et al., 2008; Bayha et al., 2010; Bentlage et al., 2010; Maronna et al., 2016; Miranda et al., 2016; Bentlage et al., 2018). Therefore, to create a local reference database for 28S sequences of Medusozoa, we conducted a comprehensive GenBank search of all available 28S sequences for the clade. The GenBank query used the terms “(large subunit ribosomal rna) AND Hydrozoa[Organism])) NOT Mitochondrial)” and was repeated replacing “Hydrozoa’’ with “Scyphozoa”, “Cubozoa”, and “Staurozoa’’ respectively. The resulting 2,208 sequences were downloaded as a FASTA file.
2.2 In silico evaluation of Anth-28S-eDNA primer set
The Anth-28S-eDNA primer set was tested in silico on the ctenophore and medusozoan 28S reference datasets to evaluate primer complementarity. The bioinformatic process of determining complementarity between the primers and the 28S sequences was conducted separately on the ctenophore and medusozoan datasets but consisted of the same workflow. We used cutadapt (Martin, 2011) to extract all ctenophore and medusozoan sequences that matched the Anth-28S-eDNA primers with two or fewer mismatches and contained at least 10 overlapping bases. Two rounds of cutadapt were conducted on the 28S alignments. First, the cutadapt command contained the flag “action=retained” in order to conserve the sequences matching the primers, including the primer-binding region, in the resulting sequence list. The second round of cutadapt trimmed the primers from the resulting sequences. All sequences were aligned in Geneious Prime (version 2023.2.1) using MAFFT (v7.490) (Katoh et al., 2002). Default parameters used for MAFFT multiple sequence alignment consisted of the Auto algorithm, a scoring matrix of 200PAM/k=2, a gap open penalty of 1.53, and an offset value of 0.123. Forward and reverse Anth-28S-eDNA primers were added to the alignment using the “Add primers to sequence” function with a modified version of Primer3 (version 2.3.7), allowing for two mismatches in the binding region. The resulting annotation table containing base mismatch information was used to compile a summary table with R (version 4.3.3), RStudio (version 2023.12.1 + 402), and tidyverse (Wickham et al., 2019) to visualize the number and location of mismatches between the primers and each 28S sequence. For the ctenophore and medusozoan reference sequences that matched the Anth-28S-eDNA primer set, taxonomic family identifications were added from GenBank.
To test the ability of the 28S barcode amplified using the primers to distinguish between taxa, separate matrices of sequence similarities were calculated between aligned ctenophore and medusozoan sequences using Geneious Prime. Similarities between ctenophore and medusozoan sequences at the family and genus levels were summarized and analyzed in R using tidyverse packages.
2.3 eDNA sampling and metabarcoding library preparation
Water samples were collected for eDNA analysis during a research expedition on the R/V Point Sur (owned by the University of Southern Mississippi and operated by the Louisiana Universities Marine Consortium) to survey mesophotic banks (30 to 200 meters deep) and deep-sea coral habitats (> 200 meters deep) in waters off the Gulf coast of the southern USA in August 2021. Briefly, eDNA samples were collected using Niskin bottles at the seafloor during remotely-operated vehicle (ROV) dives and in the water column during conductivity, temperature, depth (CTD) casts. Water samples were taken in at least duplicate, if not triplicate or quadruplicate, during each sampling event. Sample collection, eDNA sample processing, and metabarcoding library preparation are described in detail in McCartin et al. (2024) (Supplementary Table S4). Here, we will include information that is critical to interpret the results in the context of the analysis for ctenophores and medusozoans.
2.3.1 ROV water sampling
ROV dives were conducted using the Global Explorer (Oceaneering Inc., Houston, TX, USA) at four sites and varying sampling depths: south of Stetson Bank (55 meters), Bright Bank and to its east (67, 84, 85, and 111 meters), Viosca Knoll (lease block VK826; 474 meters), and Green Canyon (lease block GC354; 527 and 531 meters). Using 1.7 L Niskin bottles, water samples were taken at the seafloor near coral communities. Two to four replicate samples were taken with separate Niskin bottles at each location and depth. Latitude and longitude coordinates of the ROV position during each sampling event were determined using ultra-short baseline positioning (USBL). The ROV was also equipped with a CTD unit to measure environmental conditions and a 4K video camera.
Across sampling sites and depths, bottom habitat and benthic biological communities differed. The bottom habitat at the site south of Stetson Bank, located on the continental shelf (Figure 1), appeared to be mainly consolidated carbonate draped in a substantial layer of sediment. The water at this site was turbid, consistent with its location on the continental shelf. Bright Bank is located at the shelf edge, and the water was clear here. Bottom habitat at depths of 67, 84, and 85 meters was characterized by consolidated carbonate with abundant crustose coralline algae interspersed with patches of sediment. Sampling sites at depths of 84 and 85 meters were close to one another but were distinguished by the fact that one set of sample replicates was taken in a sedimented area and another was taken near an aggregation of Swiftia exserta octocorals. Water samples taken to the east of Bright Bank were taken at a depth of 111 meters near sedimented-draped carbonates that hosted a unique assemblage of benthic invertebrates and fish. The two deep-sea sampling sites at Viosca Knoll and Green Canyon (VK826 and GC354) differed in their longitude (Figure 1), depths, and in the fact that VK826 supports a substantial reef framework created by the scleractinian coral Desmophyllum pertusum.
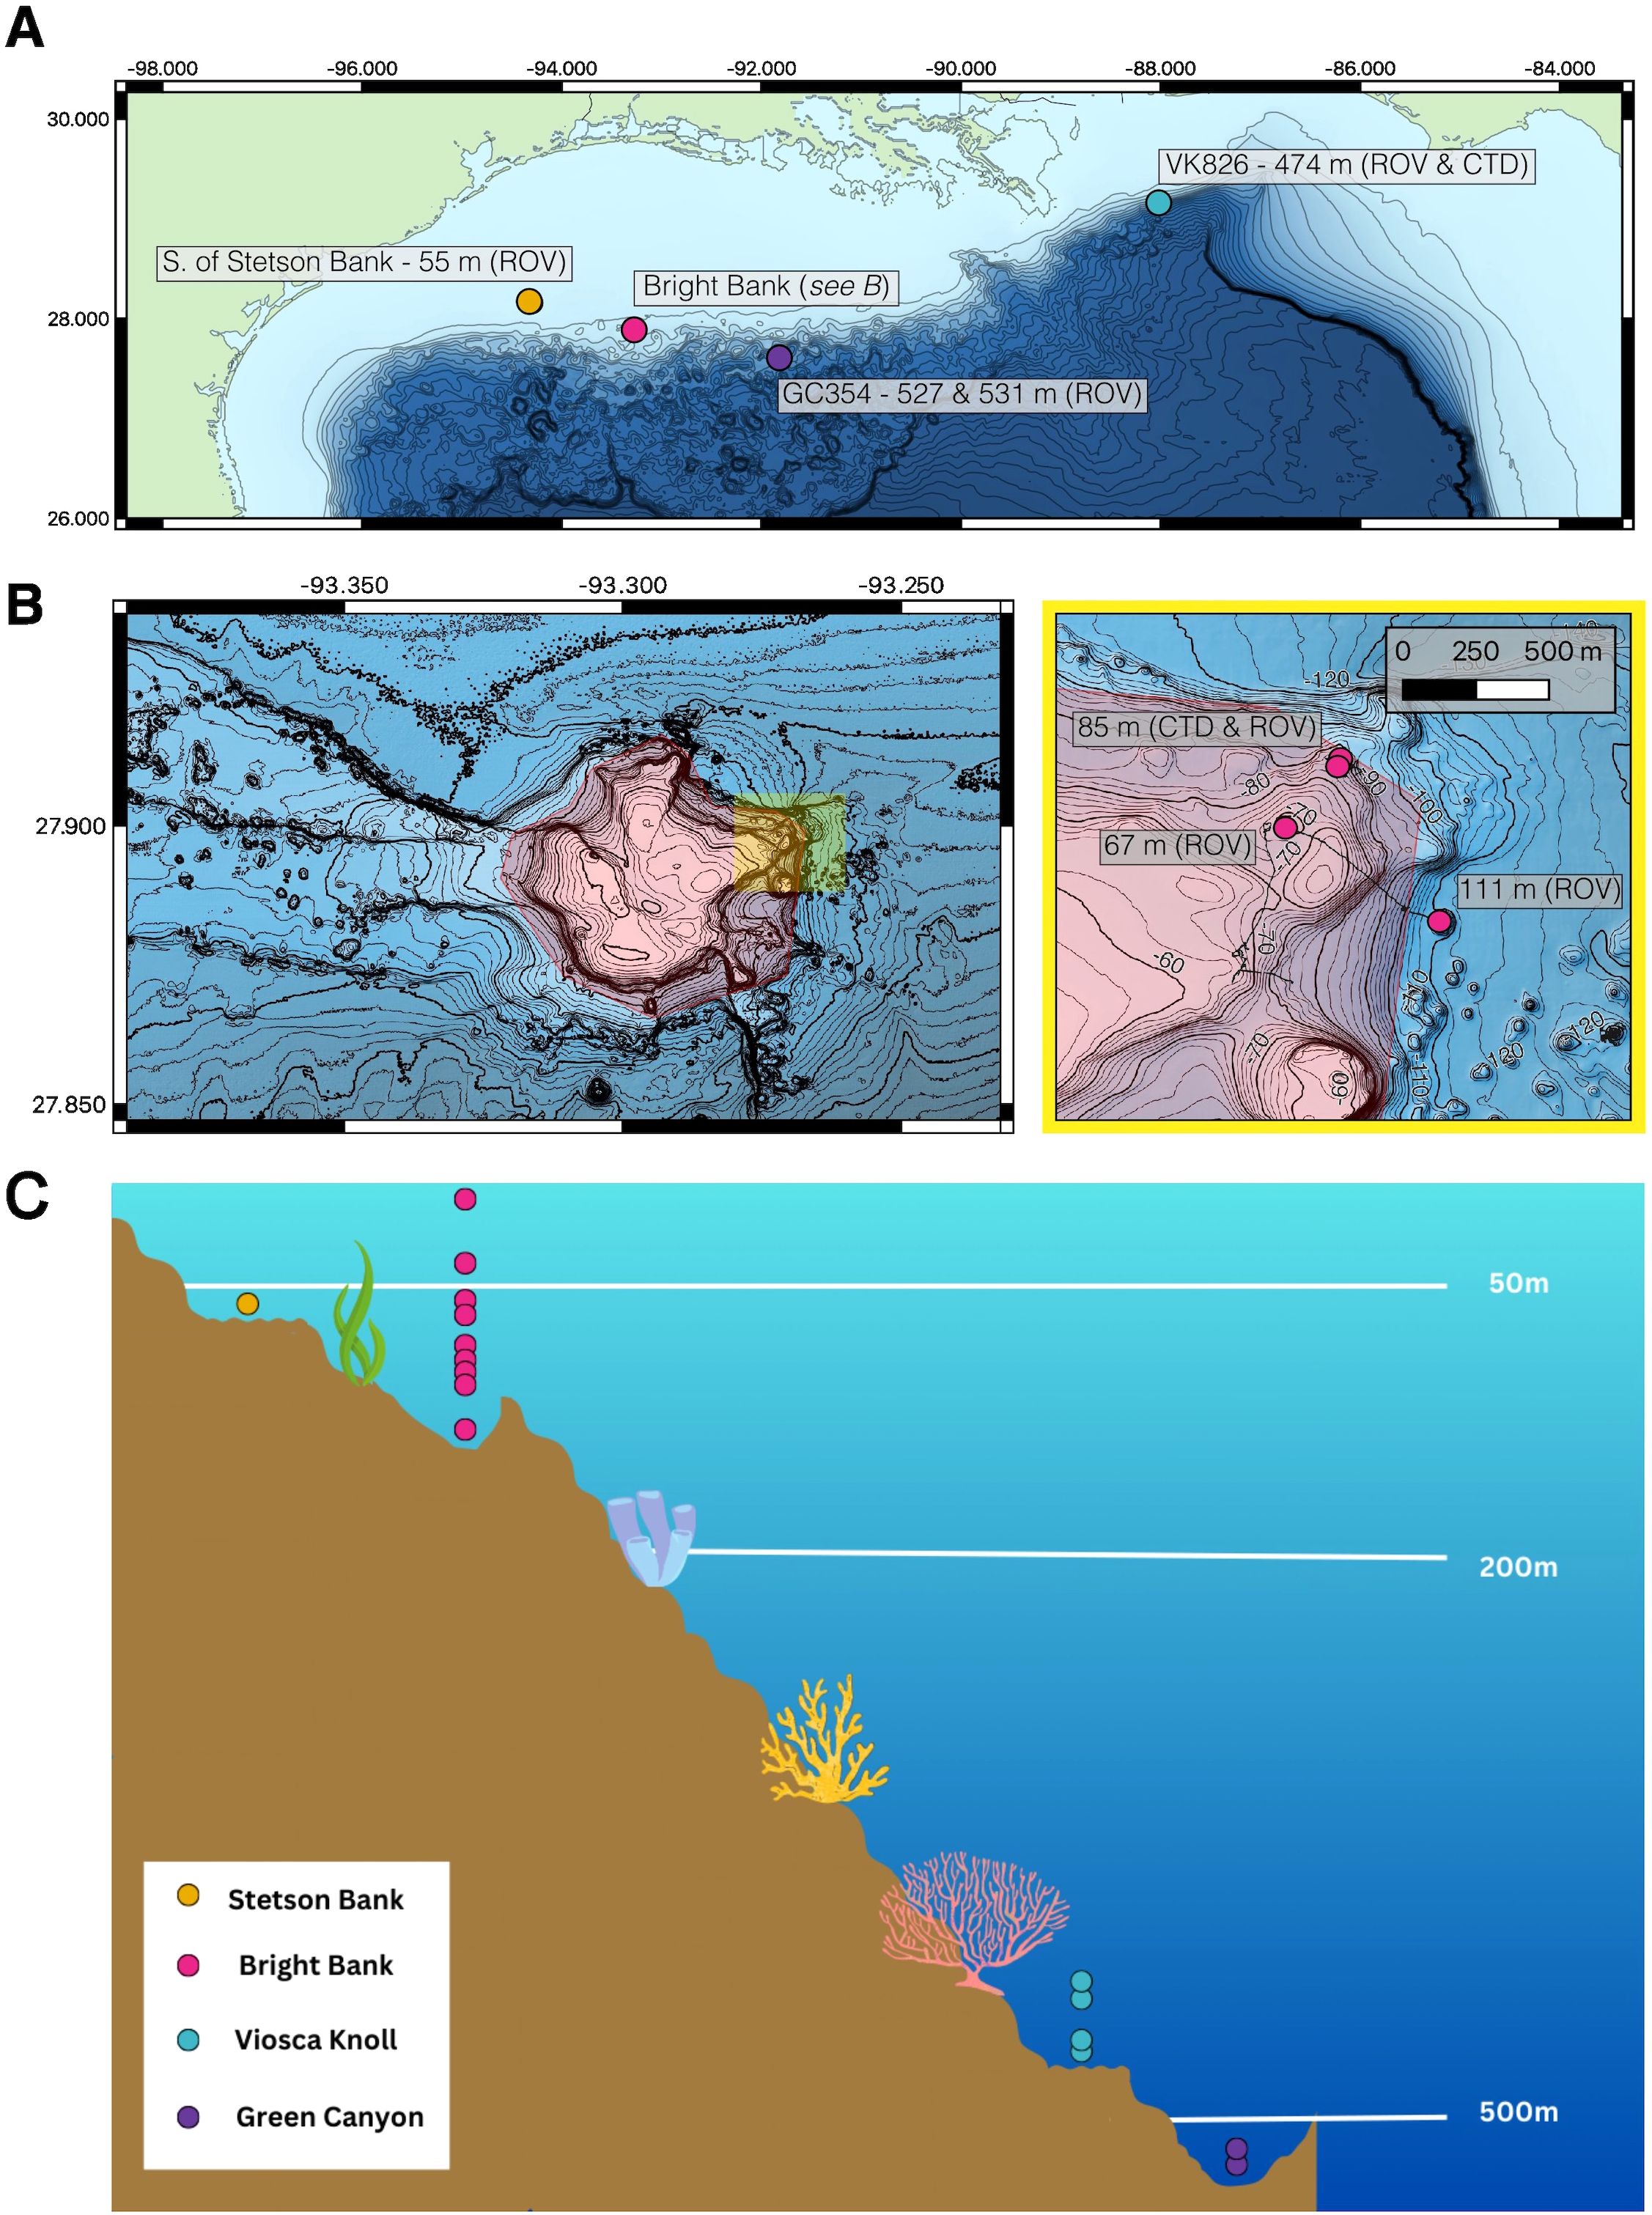
Figure 1. (A) Map of eDNA sampling sites off the Gulf Coast of the southern USA adapted from McCartin et al. (2024). (B) Bright Bank samples were collected from three separate locations with differing depths. (C) All unique depths at which eDNA samples were taken for each site. Stetson Bank was sampled at 55m, Bright Bank from 8-111m, Viosca Knoll from 447-475m, and Green Canyon from 527-531m. Bathymetry sources in the maps include the Global Multi-Resolution Topography Data Synthesis (Ryan et al., 2009) and the USGS Multibeam Mapping of Selected Areas of the Outer Continental Shelf, Northwestern Gulf of Mexico (Gardner and Beaudoin, 2005). Contour lines represent 100 meter isobaths in (A) and 10 and 2 meter isobaths in (B). ROV navigational tracks are plotted between sampling locations and intersect contour lines (B).
2.3.2 CTD water sampling
CTD casts were conducted using a rosette of 12L Niskin bottles and a Seabird 911plus CTD unit. The rosette was also equipped with an altimeter to determine the distance from the seafloor during sampling events. CTD casts were performed at night after ROV dives had finished for the day. One CTD cast was conducted at the sampling site at 85 meters at Bright Bank and at VK826. The ship was positioned at the latitude and longitude where ROV sampling was conducted at the seafloor, the CTD rosette was lowered as close to the seafloor as possible (within 2 meters of the seafloor), and samples were taken at this depth and shallower depths in the water column on the upcast. During the CTD cast at Bright Bank, samples were taken at 84, 79, 61, 40 and 8 meters, and the bottom depth was approximately 85 meters. At VK826, samples were taken at 468, 464, 458, and 447.7 meters, and the bottom depth was approximately 469 meters.
2.3.3 eDNA purification and sequencing
Once the ROV or CTD rosette was recovered, eDNA samples were processed immediately by filtering the collected water over 0.22 µm pore size polyethersulfone Sterivex filters (MilliporeSigma, Burlington, MA, USA). Filtration was conducted using peristaltic pumps with tubing that was bleach-sterilized and rinsed with ultra-pure water between samples. On each day, a sampling negative control using the ultra-pure water was also processed to monitor for contamination. Sterilization of field sampling equipment, precautions taken to mitigate the risk of cross contamination, and methods for taking sampling negative controls are described in detail in section 1.3 of the supplementary methods from McCartin et al. (2024).
Since the volume of the Niskin bottles mounted to the ROV and CTD rosette differed, the volume of water that was filtered for each eDNA sample also differed. We filtered as much water as possible from the Niskins mounted to the ROV. The average volume filtered ± one standard deviation was 0.91 ± 0.14 L. For the CTD collected samples, the average volume filtered ± one standard deviation was 4.01 ± 0.99 L. Comparable volumes of ultrapure water were filtered to serve as sampling negative controls. The average volume ± one standard deviation of ultra-pure water filtered for the sampling negative controls was 3.09 ± 1.27 L. To associate environmental data with eDNA samples, in situ measurements of temperature and conductivity were recorded at the times of eDNA sampling events during ROV dives and CTD casts. A small volume (~50 ml) of seawater was taken from the Niskin bottles prior to eDNA filtration, and pH of the sample was measured using an Oakton pH 150 waterproof portable pH meter (Environmental Express, Charleston, S.C., USA).
After filtration, Sterivex filters were stored at -80°C on the ship, transported to the lab on dry ice, and stored to -80°C until DNA extraction. DNA was extracted from the filters using the DNEasy Blood and Tissue Kit (Qiagen, Hilden, Germany) and a modified protocol for extraction from the filter capsule itself (see Spens et al., 2017 and Govindarajan et al., 2022). To prepare libraries, duplicate PCR reactions were conducted for each sample using the Anth-28S-eDNA primers. The PCR products were pooled and indexed as described by McCartin et al. (2024). Libraries were sequenced using an Illumina MiSeq with v3 chemistry to obtain 300bp paired-end reads. Raw sequencing data are available on the NCBI Sequence Read Archive (SRA) under BioProject PRJNA1159220.
To mitigate the risk of contamination during DNA extraction and library preparation, DNA extraction was conducted at a designated bench where PCR products and DNA extracts from tissue samples were never handled. The bench was bleach sterilized before extraction. The pipettes that were used (also dedicated to extracting eDNA samples) were also bleach sterilized and UV irradiated before extraction. PCR amplification was conducted using sterilized and UV irradiated pipettes in a bleach sterilized and UV irradiated hood with positive airflow and HEPA filtration. To monitor for contamination during DNA extraction and metabarcoding library preparation, sampling negative controls, extraction negative controls, and PCR negative controls, consisting of the PCR reaction mix with molecular-grade water instead of DNA template, were processed and sequenced alongside the field samples. These steps are described in further detail in section 3.1 of the supplementary methods from McCartin et al. (2024).
2.4 Data analysis
2.4.1 Bioinformatics pipeline
Forward and reverse primers were trimmed from demultiplexed, paired-end sequencing reads from each sample using cutadapt with the default settings and a minimum overlap of 5 nucleotides. The reverse complements of the forward and reverse primers were optionally trimmed from the reverse and forward reads, respectively, if they were identified. Sequences were quality filtered and trimmed, denoised of sequencing errors, merged, and cleaned of chimeras using DADA2 (Callahan et al., 2016). Forward reads were trimmed to 250 base pairs, reverse reads were trimmed to 175 base pairs, and the maximum number of expected errors per read was set to 2. A tab-delimited ASV table and FASTA file with ASV sequences was generated as the outputs of the DADA2 pipeline.
2.4.2 Taxonomic classification and curation of ASVs
Phyla were assigned to the ASVs to distinguish between ctenophores and medusozoans for all downstream analyses. The ASVs were searched using NCBI’s BLAST tool with blastn. The search included the following flags: -db nt to query the nucleotide database, -max_target_seqs 10 to return the top 10 target sequences, and -outfmt “6 qseqid sacc staxid sscinames evalue bitscore pident qcovs” to specify what search results were desired. In R, unique scientific names were selected and searched in the World Registry of Marine Species (WoRMS) database (WoRMS 2023) with get_wormsid and classification from the package taxize (Chamberlain and Szöcs, 2013) to retrieve the taxonomic classification for each matching scientific name. Low-quality sequence matches were removed so as to retain all ASVs that contained more than 85% of the query sequence, had the highest similarity to the query sequence, and exactly matched at least 85% of the query sequence. In order to remove non-target taxa (i.e., Anthozoa) from downstream analyses, only the ASVs identified as “Tentaculata”, “Nuda”, “Hydrozoa”, “Scyphozoa”, “Staurozoa”, or “Cubozoa” at the Class level were selected. The remaining top BLAST hits were combined with the WoRMS taxonomy results to create a table of each ASV sequence and its identified phylum (either Ctenophora or Cnidaria).
In order to create a match list, the FASTA file of ASVs was made into a BLAST database with makeblastdb and the flags -parse_seqids and -dbtype nucl. The ASVs were then compared to each other using blastn to query this database with the flags -outfmt 6 qseqid sseqid pident, such that the match list results would contain the percentage similarity between each pair of ASVs. The flag -qcov_hsp_perc 80 was included as well. The resulting match list was imported to R, along with the table of ASV counts in each sample and the BLAST results for the ASVs. The command lulu (Frøslev et al., 2017) was performed on the table of ASV counts per sample and the match list with a minimum match of 95 to retain only ASVs that had at least a 95% match.
To serve as references for the taxonomic classification of the ASVs, we created a list containing the nucleotide sequence of each reference sequence used for the in silico tests of primer complementarity along with its associated Kingdom, Phylum, Class, Order, Family, Genus, and Species. Taxonomy of the ctenophore reference sequences was manually added based on a “dummy” classification (Supplementary Table S1) that we created because the current classification of Ctenophora does not reflect phylogenetic relationships in many respects (e.g., non-monophyletic Cydippida and Tentaculata) and is in need of revision (Podar et al., 2001; Simion et al., 2015; Townsend et al., 2020; Whelan et al., 2017). For the medusozoan reference sequences, the GenBank accession ID numbers of every reference sequence containing the barcode of interest were searched in GenBank with epost and esummary to return the corresponding taxonomy ID. The unique taxonomy IDs were then searched again in GenBank using efetch to find the most complete taxonomy available for each reference sequence.
After curation with lulu, all unique ASVs from the phyloseq object identified as Ctenophora and Cnidaria were then assigned taxonomy using assignTaxonomy and addSpecies in the package dada2 (Callahan et al., 2016). The read abundances of each ASV were calculated and added to the table of classifier results.
Phyloseq was used to assemble taxonomy data, sequencing read abundance data, and sample metadata. During this round, taxonomy data was composed of the ctenophore and medusozoan classifier results returned by assignTaxonomy and assignSpecies. One phyloseq object was created containing both ctenophore and medusozoan data, excluding all ASVs that were not taxonomically assigned to at least the class level.
Contaminant ASVs, or ASVs that were highly frequent in the negative controls, were identified using isContaminant from the package decontam (Davis et al., 2018). The method “prevalence” was used to identify contaminants by comparing their prevalence in negative controls to prevalence in actual samples, and a probability threshold of 0.1 was used. No contaminant ASVs were found. The number of medusozoan and ctenophore reads in the majority of the negative controls ranged from zero to two; one negative control had 40 reads.
2.4.3 Community assemblage and diversity analyses
Negative controls were removed from the phyloseq object before all remaining ASVs were imported to Geneious Prime, aligned with MAFFT, and used to construct a phylogenetic tree with FastTree default settings (version 2.1.11) (Price et al., 2010). This tree was rooted at the midpoint and added to the working phyloseq object. Both unweighted and weighted UniFrac distance matrices were calculated using the UniFrac function from the phyloseq package with options normalized = TRUE, parallel = FALSE, and fast = TRUE. Unweighted UniFrac distances take solely presence/absence into account, whereas weighted UniFrac distances incorporate relative abundance.
All negative controls from the sample metadata were removed, and the environmental variables of depth, salinity, water temperature, and pH were standardized to range from 0 to 1 with decostand from vegan (Oksanen et al., 2024). Two distance-based redundancy analyses (dbRDA) were performed with dbrda from vegan on the standardized environmental variables and on the unweighted and weighted UniFrac distance matrices, separately. A PERMANOVA test was performed on each UniFrac distance matrix coupled with the standardized environmental variables using adonis2 from vegan to determine which variables significantly explain any variation seen in the ordination. adonis2 used 999 permutations and assessed significance for each term with by = “terms”.
For Bright Bank and Viosca Knoll, which were the only sites that had both ROV and CTD samples, all ROV samples and CTD samples taken less than 5.8 meters above the seafloor were used to construct two separate phyloseq objects in order to test if ROV and CTD samples were significantly different. ASVs in each object were imported to Geneious, aligned with MAFFT, and used to construct a phylogenetic tree with FastTree. These trees were rooted at the midpoint and added back to their respective phyloseq objects. Unweighted UniFrac distance matrices were computed with options normalized = TRUE, parallel = FALSE, and fast = TRUE. PERMANOVA tests were conducted on the UniFrac matrices with adonis2 to determine significant differences between ROV and CTD samples.
To examine the benthic daytime community, we selected all ASVs from the phyloseq object that came from ROV samples and removed all ASVs with zero read abundance. All ASVs not classified to at least the family level were also removed. Relative sequencing read abundance of taxa at each site was plotted with ggplot (Wickham, 2016). The same process was used to examine the pelagic nighttime community, except we selected all ASVs from samples that were collected by CTD. All other steps performed were the same.
Using the phyloseq object, all ASVs with a sequencing read abundance of zero were removed. Chao1 (ASV richness) and Shannon’s diversity index were calculated with estimate_richness and boxplots were created by site using plot_richness from phyloseq. Faith’s phylogenetic diversity was calculated using estimate_pd and plotted in ggplot by site. Species accumulation curves were calculated separately for each site using the random accumulation method with specaccum from vegan. Accumulation curves were plotted together with base R.
3 Results
3.1 Complementarity of primer set for Ctenophora and Medusozoa
The primer set matched especially well to the alignment of ctenophore 28S sequences, with 79.1% of the sequences perfectly matching the forward primer and 89.6% perfectly matching the reverse primer (Table 1). All of the ctenophore sequences matched the primers with two or fewer mismatches. The medusozoan alignment was less complementary, with 10.4% of the sequences perfectly matching the forward primer and 81.1% perfectly matching the reverse primer. Out of all the medusozoan sequences analyzed, 81.7% matched the primers with two or fewer mismatches. Twenty-six of 33 ctenophore families were represented among the reference sequences with two or fewer mismatches to the primer set. Within Medusozoa, six of eight cubozoan families, five of six staurozoan families, 19 of 23 scyphozoan families and 67 of 133 hydrozoan families were represented by reference sequences with two or fewer mismatches to the Anth-28S-eDNA primer set (Table 2).
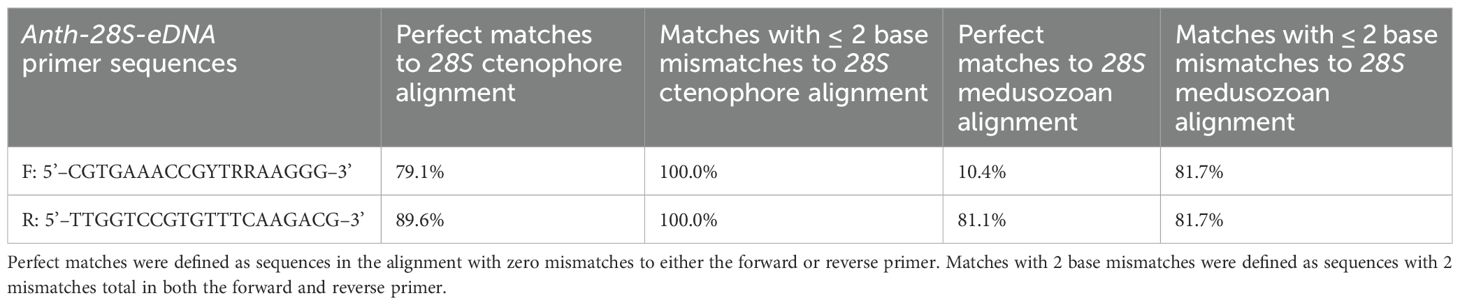
Table 1. Complementarity of diverse 28S alignments of Ctenophora and Medusozoa with Anth-28S-eDNA primer set, as represented by the percentage of base mismatches.
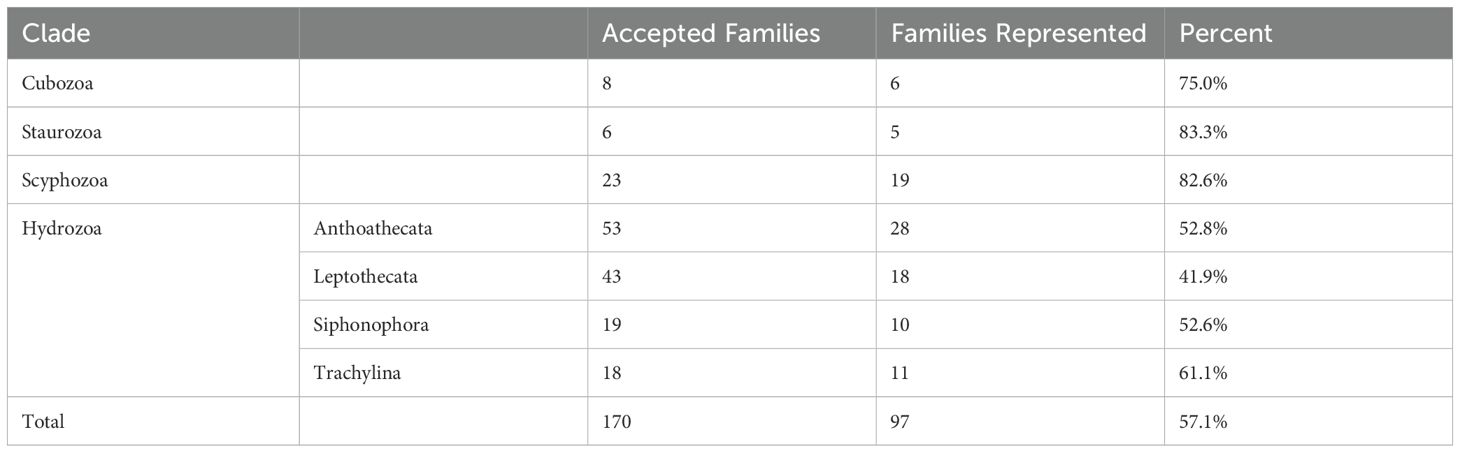
Table 2. Medusozoan families with exemplar sequences with two or fewer mismatches to the Anth-28S-eDNA primers.
For both the ctenophore and medusozoan reference datasets, no two families had the exact same 28S barcode (Supplementary Table S2). There was a maximum percent identity of 99.5% and median of 82.8% for ctenophore families and a maximum percent identity of 98.4% and median of 58.6% for medusozoan families, demonstrating that this barcode can be used to distinguish families within these taxa.
3.2 Data overview
After primer trimming, quality filtering and trimming reads, denoising sequencing errors, merging, and chimera removal, there was an average of 12,429 reads per sample with a standard deviation of 8,866. In total, 1,188 ASVs were recovered by the Anth-28S-eDNA primer set and 766 ASVs remained after curation with LULU. Of these 766, 67 ASVs were classified as Ctenophora, and 190 were classified as Medusozoa. Out of the 67 ctenophore ASVs, 58 were classified to at least the order level, 56 were further classified to the family level, 47 were further classified to the genus level, and 3 to the species level. Out of the 190 medusozoan ASVs, 187 were classified to at least the order level, 136 were further classified to the family level, 113 were further classified to the genus level, and 8 to the species level. Within Medusozoa, only Hydrozoa and Scyphozoa were represented. There were 33 families represented, comprising 11 ctenophore families (out of 25 total families) and 24 medusozoan families, specifically from Hydrozoa and Scyphozoa (out of 170 total families).
3.3 Community structure analysis
ROV samples taken at the seafloor and CTD samples taken within 5.8 meters above the seafloor were significantly different at both Bright Bank (PERMANOVA, p = 0.006) and Viosca Knoll (PERMANOVA, p = 0.016). ROV samples were considered representative of the benthic day community and CTD samples were considered representative of the pelagic night community. The benthic community analysis included 25 ROV samples: four from Stetson Bank, 12 from Bright Bank, three from Viosca Knoll, and six from Green Canyon. The pelagic community analysis included 22 CTD samples: 12 from Bright Bank and ten from Viosca Knoll.
The composition of ctenophore and medusozoan communities varied noticeably depending on whether presence/absence data was considered or if relative sequencing read abundance was considered. When presence/absence data was used to perform a dbRDA, the environmental variables accounted for 37.7% of the variance. Samples taken from the same site appeared to group together, and samples collected by CTD from the same site clustered more tightly together than those collected by ROV (Figure 2A). All the environmental variables considered were significant except for conductivity, with depth explaining the most variation between samples (PERMANOVA: p < 0.001, R2 = 0.12), followed by sampling method of either ROV or CTD (PERMANOVA: p < 0.001, R2 = 0.10) and altitude (PERMANOVA: p < 0.001, R2 = 0.05). When sequencing read abundance relative to the total amount of ctenophores and medusozoans was considered, 27.5% of variance between samples was explained by the environmental variables. The clustering of samples by sample type or site was not evident on the dbRDA plot (Figure 2B). Only conductivity (PERMANOVA: p < 0.02, R2 = 0.07), altitude (PERMANOVA: p < 0.02, R2 = 0.07), and depth (PERMANOVA: p < 0.02, R2 = 0.06) were significant, but explained little of the variation in the data. Any underlying patterns in organismal or DNA abundance could be confounded by bias in PCR amplification.
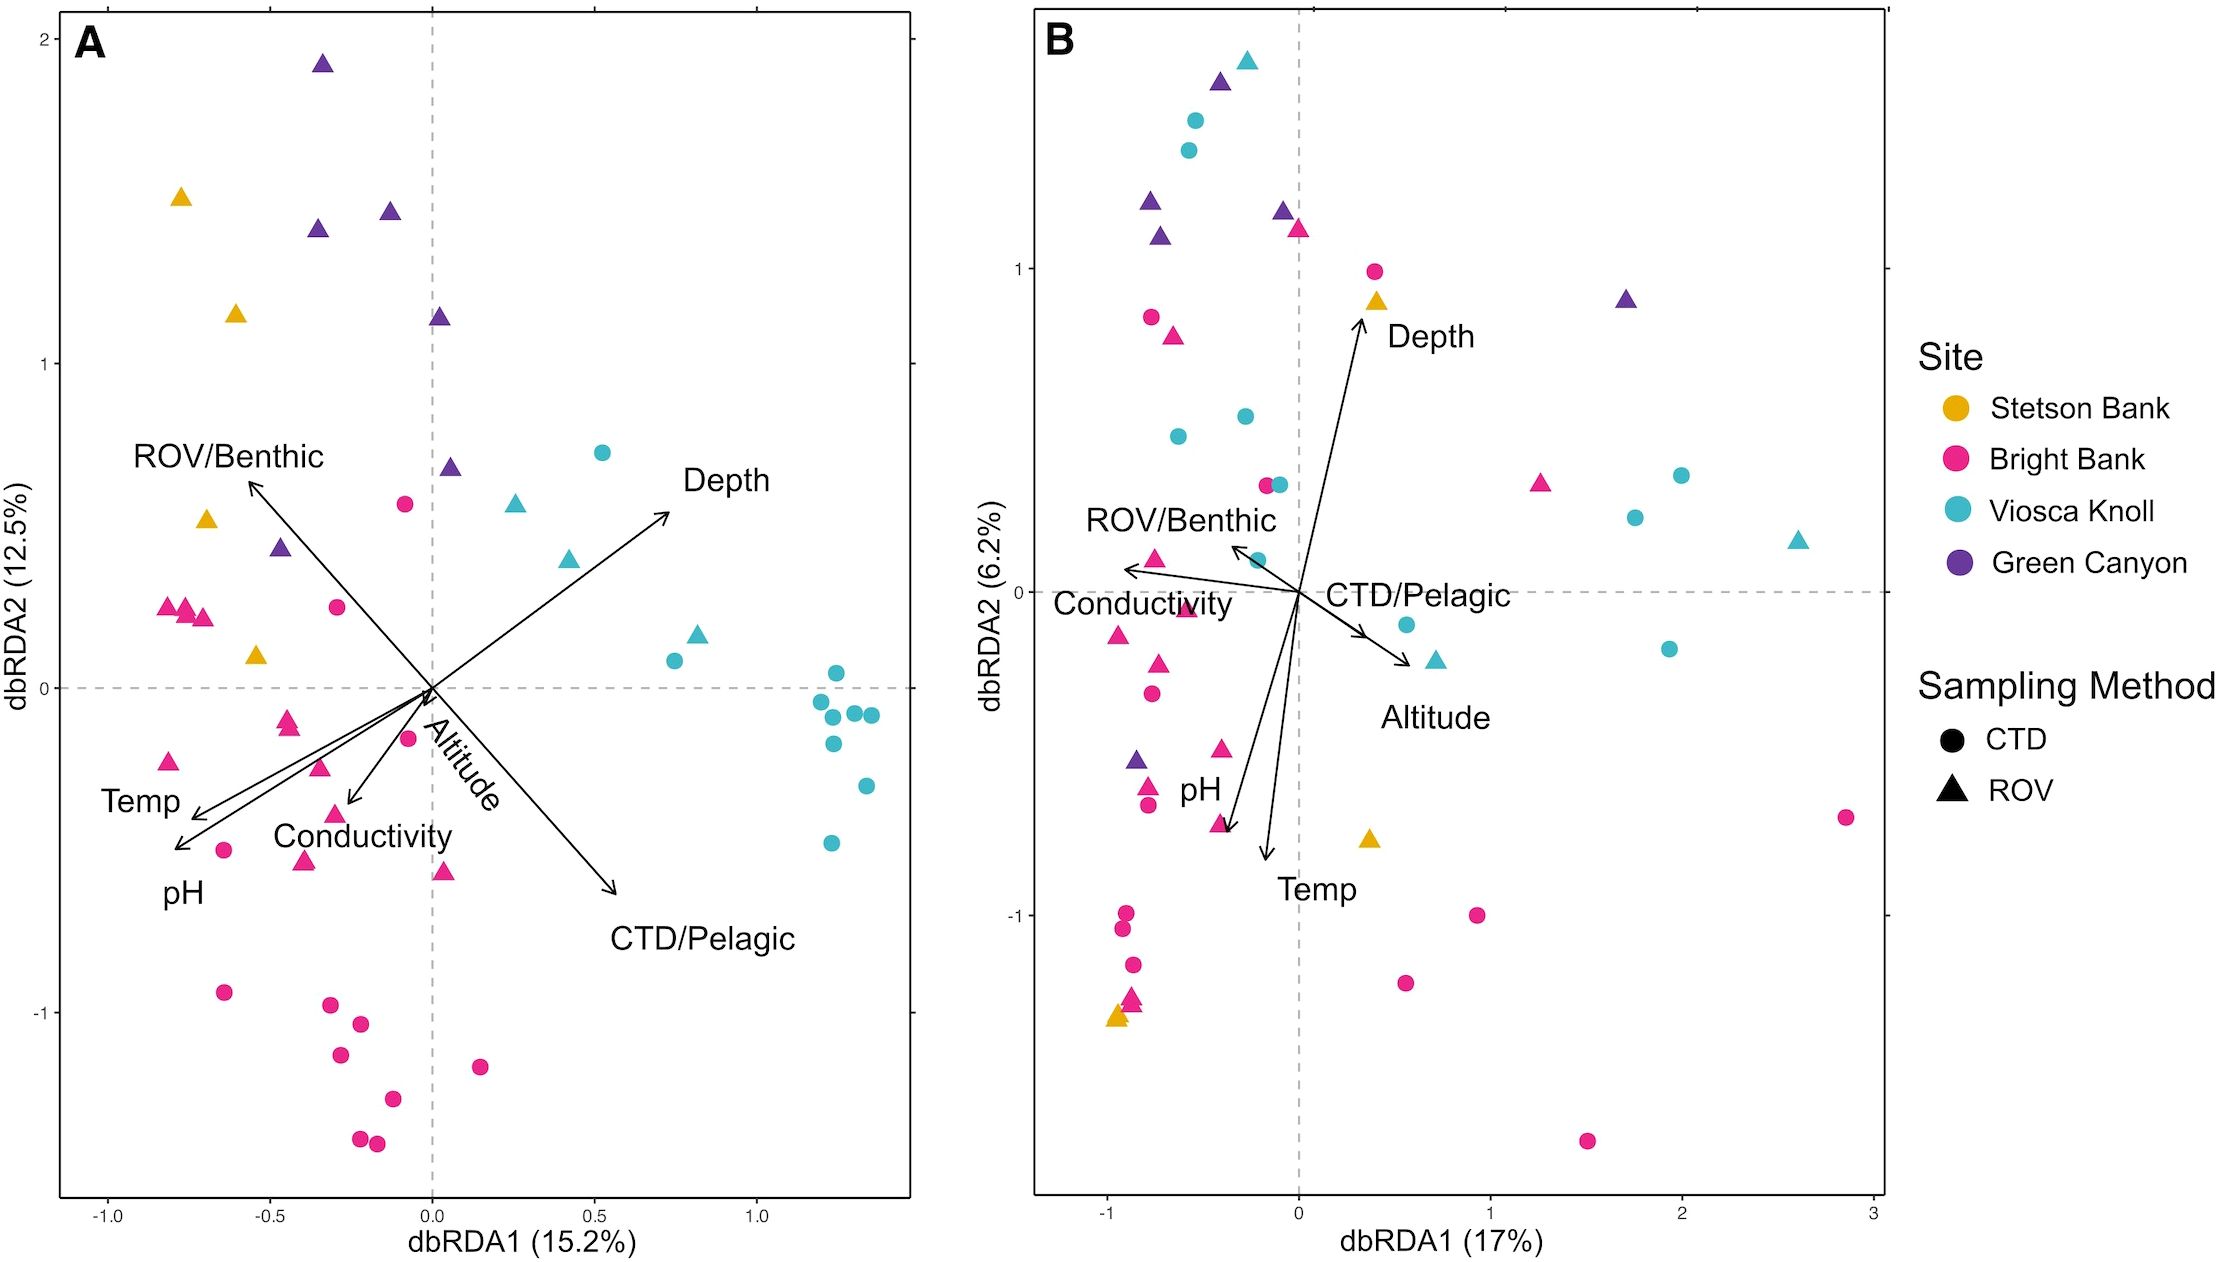
Figure 2. Distance-based redundancy analysis of UniFrac distances between eDNA samples. Depth ranges for sample collection were Stetson Bank, 55m; Bright Bank, 8-111m; Viosca Knoll, 448-474m; Green Canyon, 527-531m. (A) dbRDA of unweighted UniFrac distances. (B) dbRDA of weighted UniFrac distances.
3.4 Benthic day (ROV) and pelagic night (CTD) community composition
In total, 192 ASVs were detected and identified to at least the family level, representing 11 ctenophore and 24 medusozoan families (Supplementary Table S3). All ctenophore families detected consist of holopelagic species (Figure 3A), whereas medusozoan families include species with holopelagic, meroplanktonic, and benthic habits (Figure 3B). There were 24 families represented in the benthic day (ROV) samples compared to 30 in pelagic night (CTD) samples, with 19 ctenophore and medusozoan families shared between benthic day and pelagic night communities. In order of highest to lowest sequencing read abundance, shared families consist of the ctenophore families Cydippidae, Haeckeliidae, Mertensiidae, Lampoctenidae, Charistephaneidae, Ocyropsidae and Bathocyroidae, and the medusozoan families Rhopalonematidae, Diphyidae, Cuninidae, Erennidae, Halicreatidae, Agalmatidae, Physophoridae, Zancleidae, Aeginidae, Eudendriidae, Hippopodiidae, and Nausithoidae. Twenty-one of 56 ctenophore ASVs and 29 of 136 medusozoan ASVs identified to the family level were detected in both benthic day (ROV) and pelagic night (CTD) samples (Supplementary Table S3).
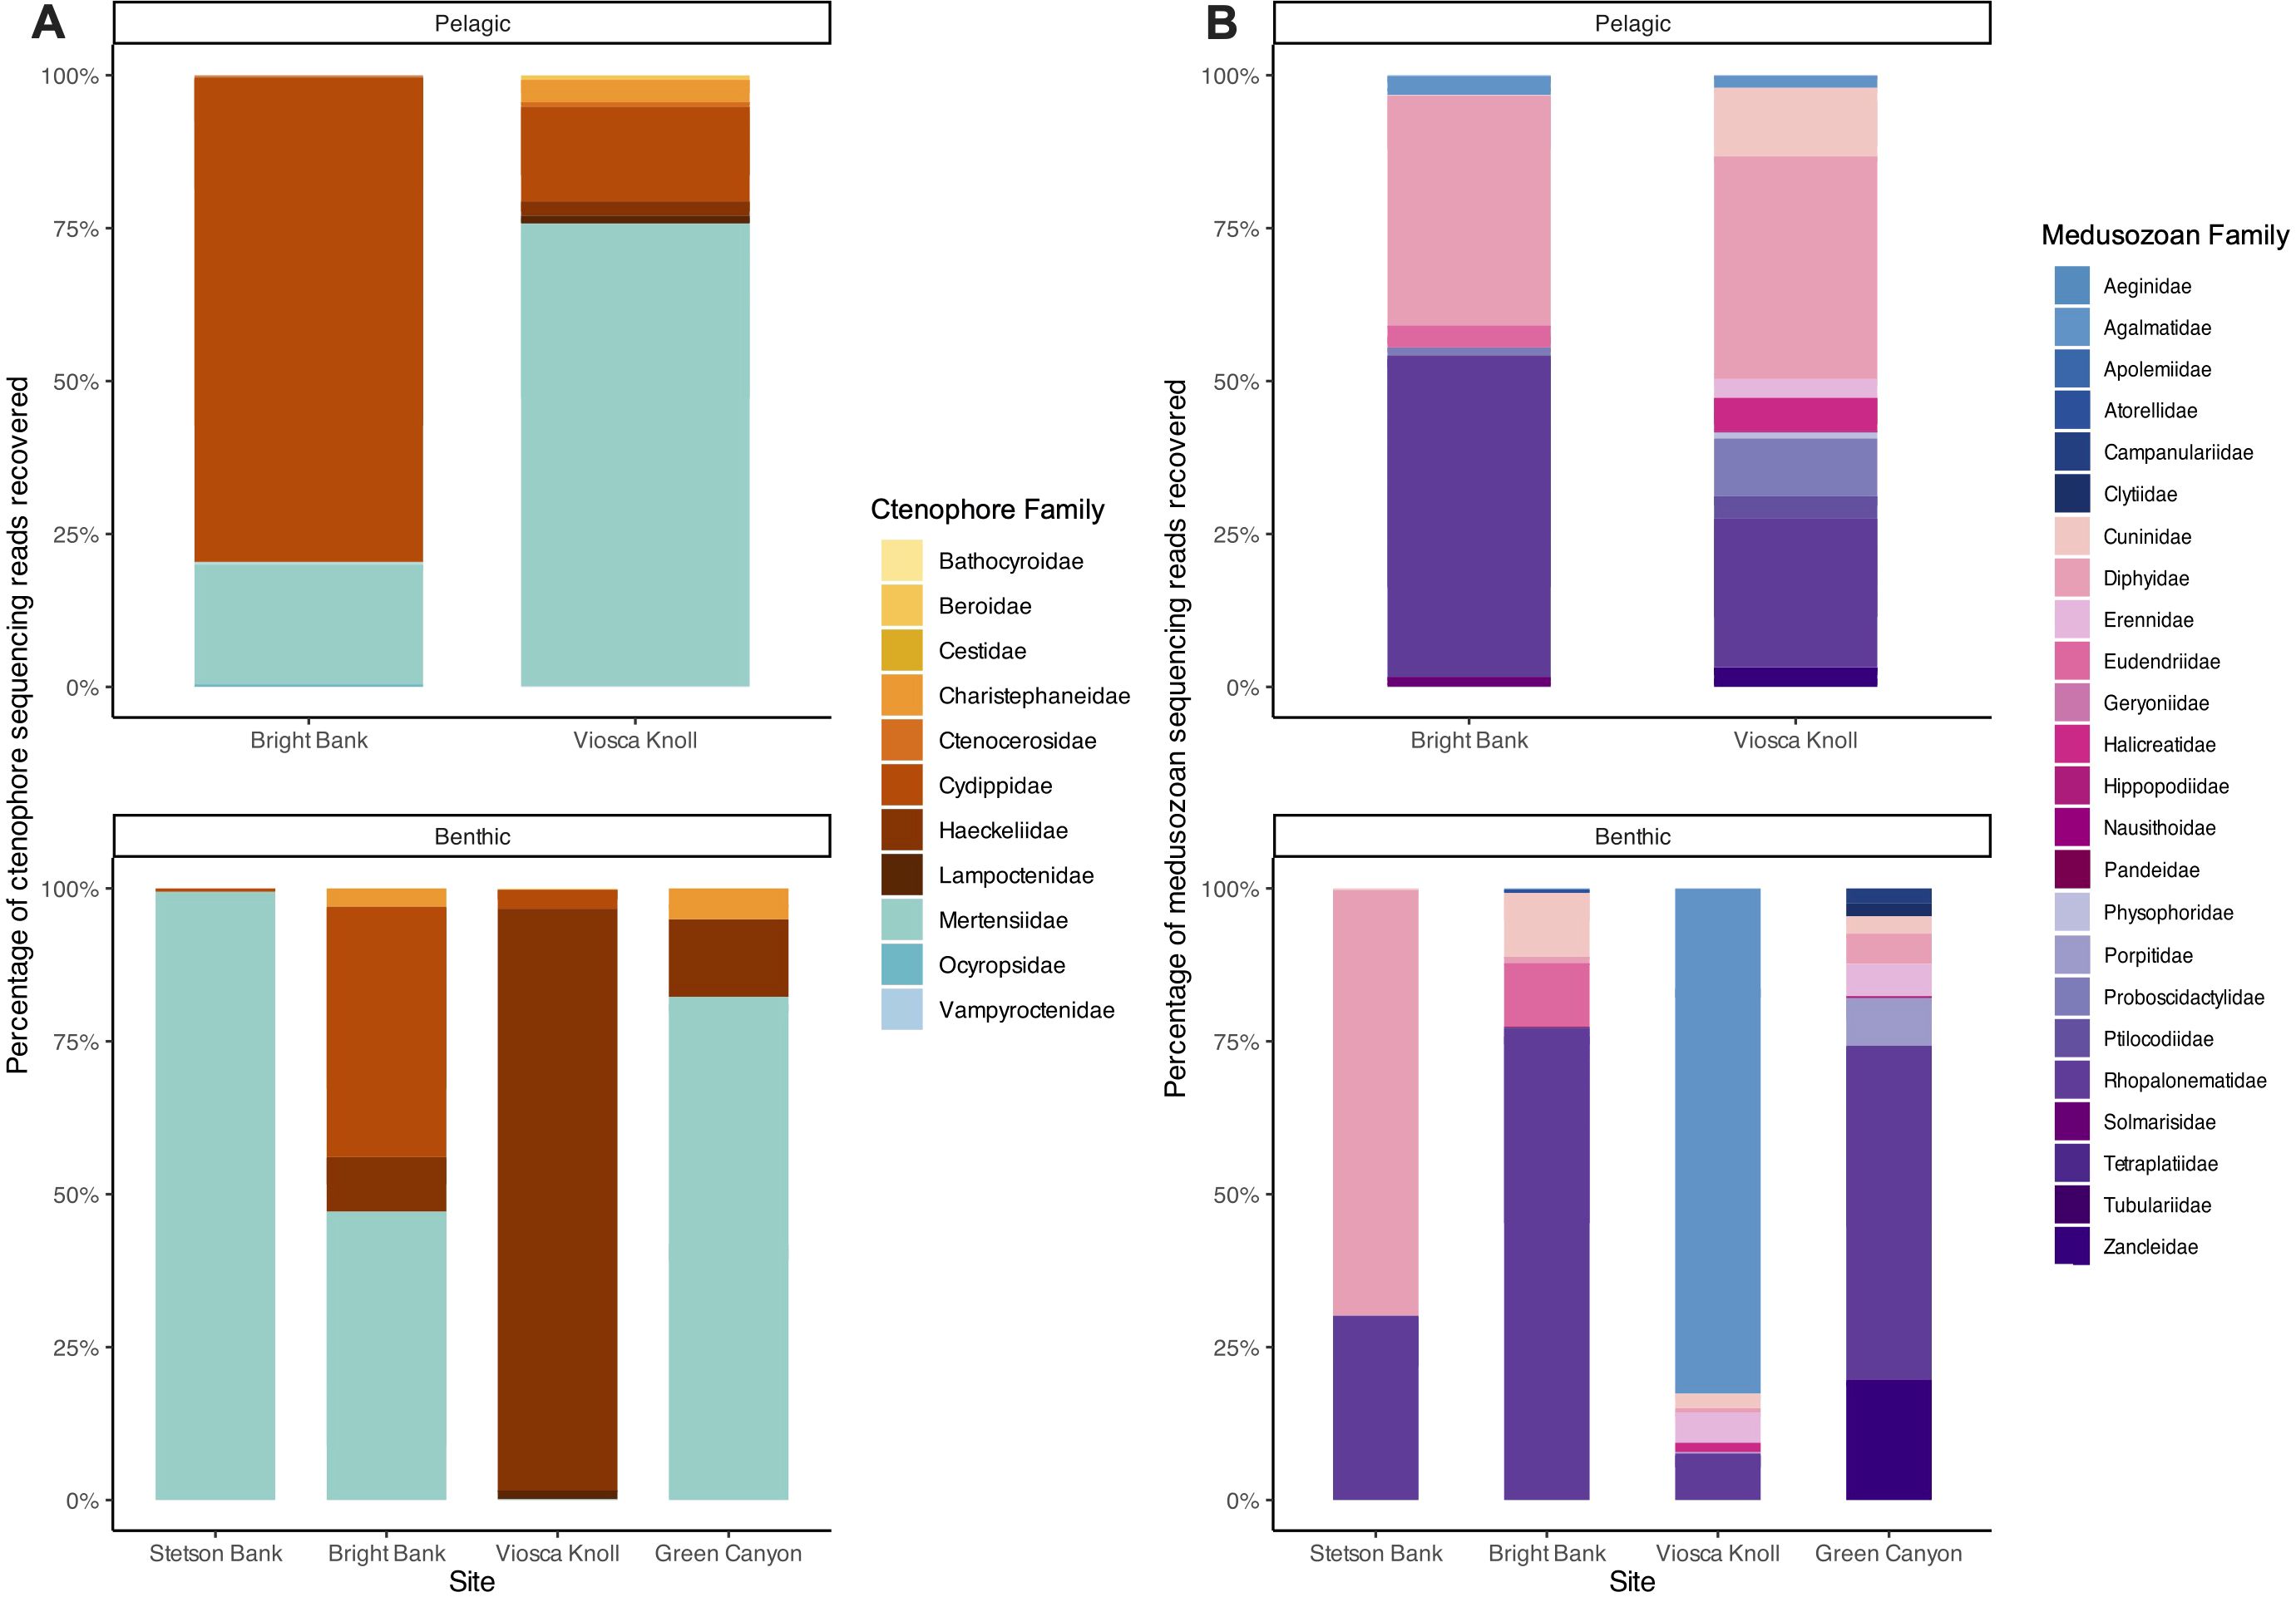
Figure 3. Ctenophore and medusozoan community composition at the family level across sites. All ASVs identified to at least the family level were included. (A) Percentage of ctenophore sequencing reads recovered in pelagic and benthic samples. (B) Percentage of medusozoan sequencing reads recovered in pelagic and benthic samples.
For the benthic day (ROV) samples, unique families were all medusozoan, representing the families Atorellidae, Porpitidae, Pandeidae, Campulanariidae, and Clytiidae. The families unique to pelagic night (CTD) samples contained a mix of ctenophores (“Ctenocerosidae”, Beroidae, Vampyroctenidae, and Cestidae), and medusozoans (Proboscidactylidae, Ptilocodidae, Solmarisidae, Tetraplatiidae, Tubulariidae, Apolemiidae, and Geryoniidae).
At the benthos during the day, two medusozoan families, Rhopalonematidae and Diphyidae, and two ctenophore families, Mertensiidae and Cuninidae, were consistently present at all sites. Dominant families, or families with the highest relative sequencing read abundance, were identified at each site for both Medusozoa and Ctenophora. Within Medusozoa, Rhopalonematidae was the dominant family at Bright Bank and Green Canyon, Diphyidae at Stetson Bank, and Agalmatidae at Viosca Knoll. Within Ctenophora, Mertensiidae was the dominant family at Stetson Bank and Green Canyon, both Mertensiidae and Cydippidae were most abundant at Bright Bank, and Haeckeliidae was dominant at Viosca Knoll. The five families that were exclusive to the benthic daytime samples were all meroplanktonic medusozoans with benthic hydroid stages.
In the water column at night (CTD), the ctenophore families Cydippidae, Mertensiidae, Ocyropsidae, Haeckeliidae, and Charistephaneidae, and the medusozoan families Diphyidae, Rhopalonematidae, Agalmatidae, Proboscidactylidae, Solmarisidae, Ptilocodiidae, Aeginidae, and Cuninidae were present at every site. Medusozoan and ctenophore communities were both dominated by two main families. Rhopalonematidae and Diphyidae were the most prominent medusozoan taxa at both Bright Bank and Viosca Knoll. Mertensiidae and Cydippidae prevailed over other ctenophores, with most ASVs identified as Cydippidae sampled from Bright Bank and as Mertensiidae from Viosca Knoll. Three meroplanktonic families were found exclusively in the pelagic night samples, but it is not possible to determine whether polyp or medusa stages were being detected.
3.5 Alpha diversity of benthic day communities
Alpha diversity of benthic daytime communities sampled by ROV followed the same general pattern regardless of diversity measure used. In order of lowest to highest average diversity, the pattern tended to be Stetson Bank, Green Canyon, Bright Bank, and Viosca Knoll (Figure 4A). Bright Bank had higher variability in alpha diversity than the other sites. This same trend was represented in the pelagic night data, as Bright Bank consistently had lower average alpha diversity than Viosca Knoll (Figure 4B). Although the species accumulation curves show that none of the sites were sampled enough to adequately represent their diversity (Figure 5), they reflect the same pattern seen in the alpha diversity data from Figure 4.
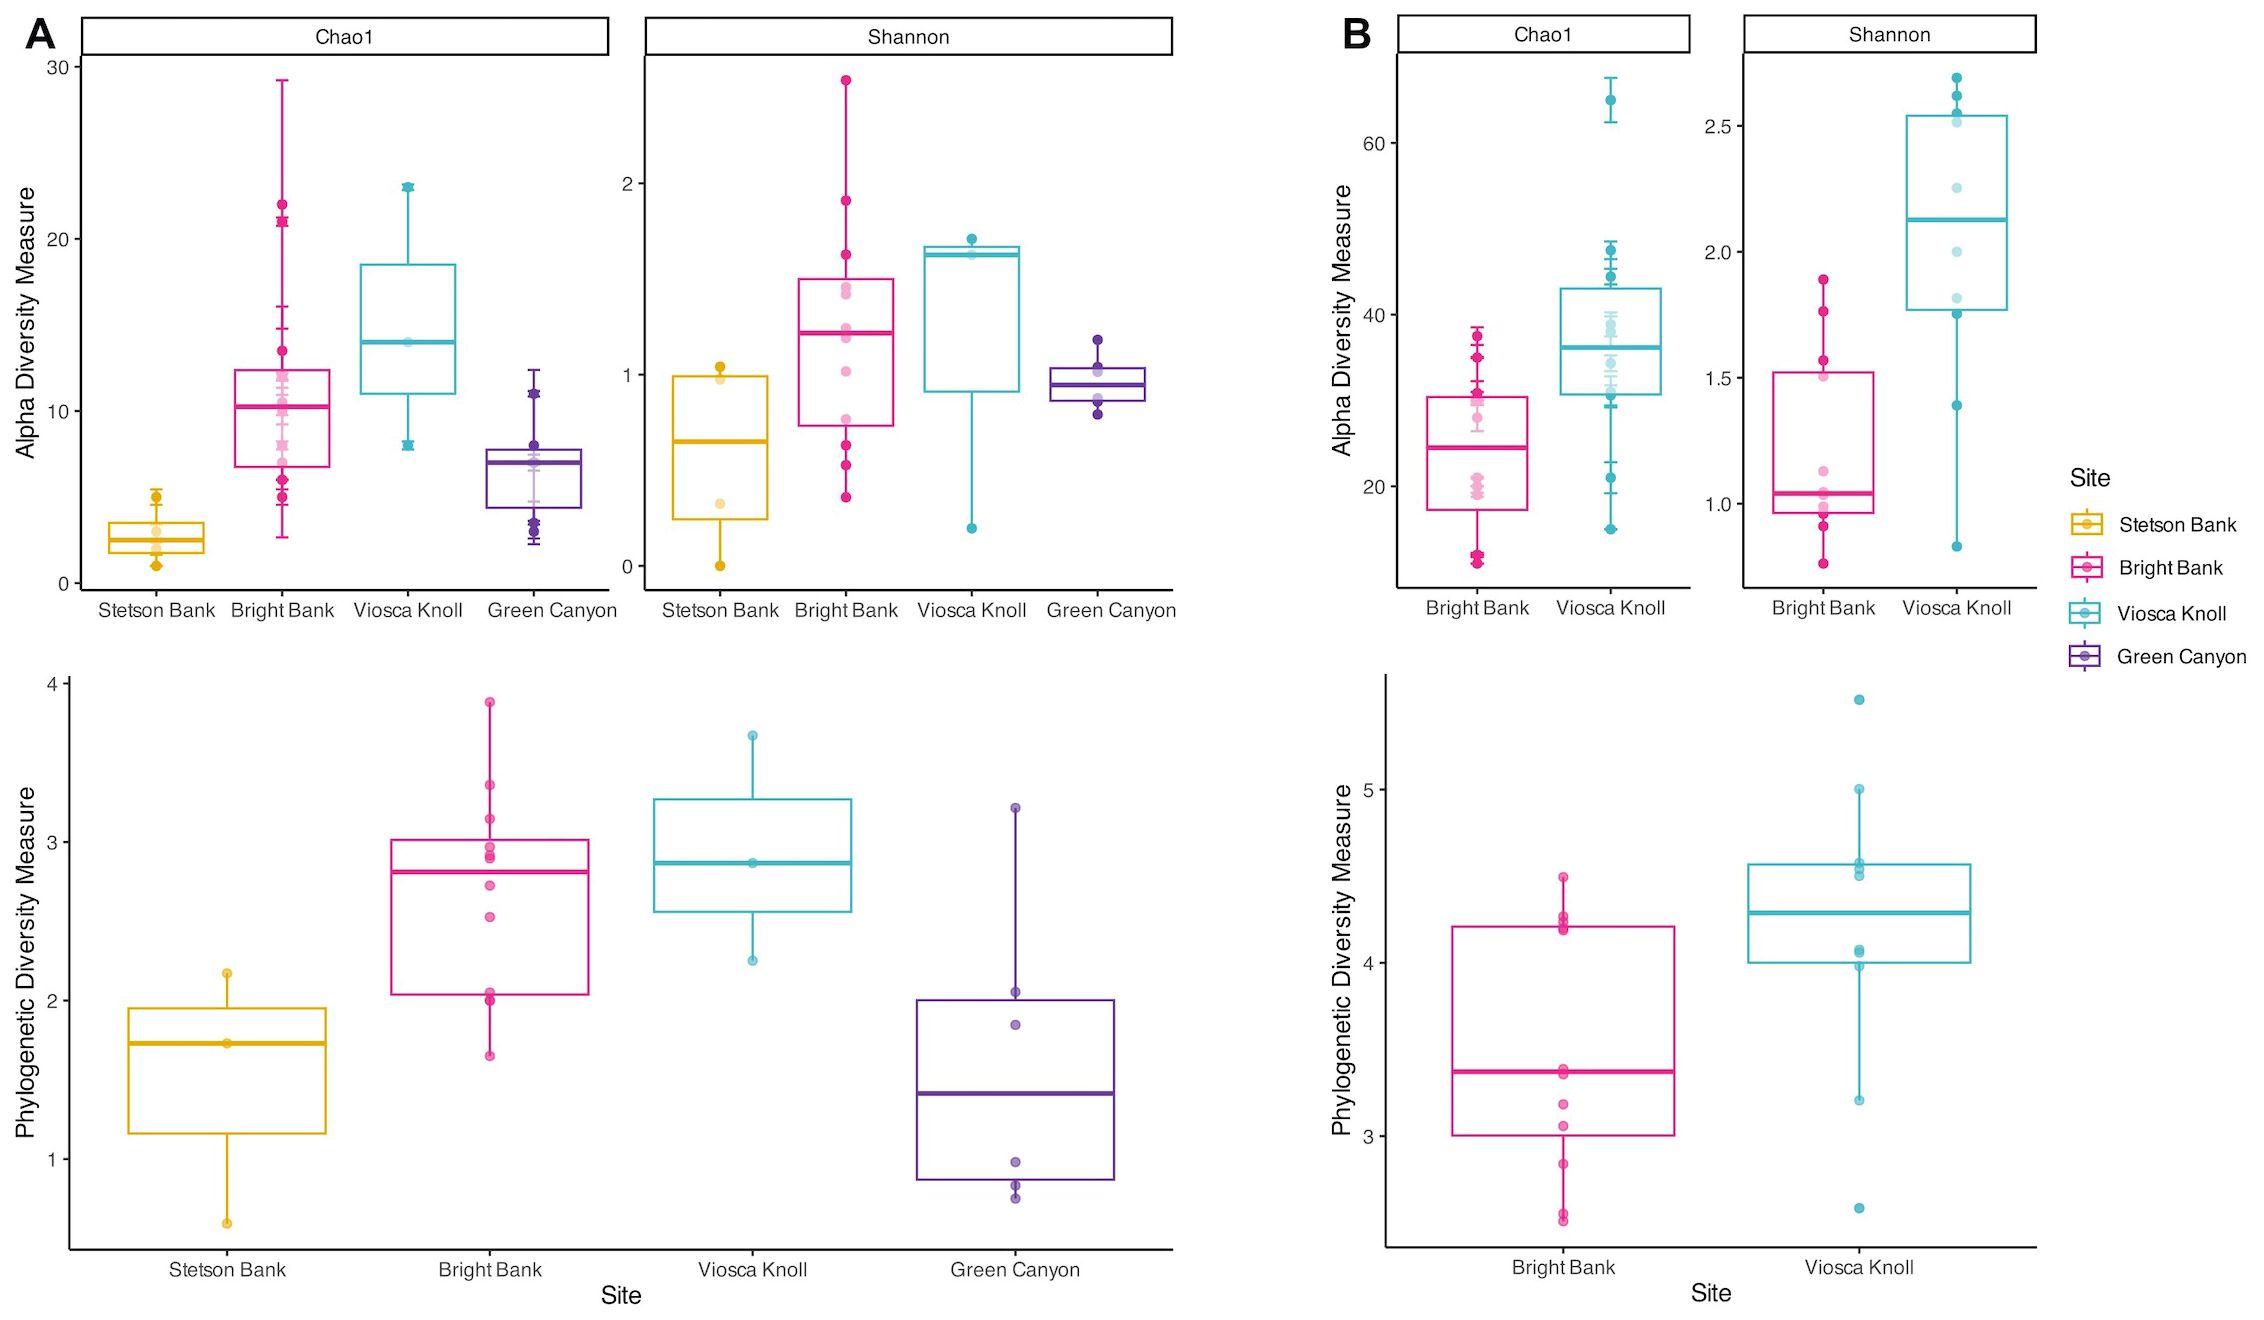
Figure 4. Measures of alpha diversity and phylogenetic diversity for ctenophore and medusozoan benthic day and pelagic night communities. Sites increase in depth from left to right. (A) Diversity measures across sites with benthic samples. (B) Diversity measures across sites with pelagic samples.
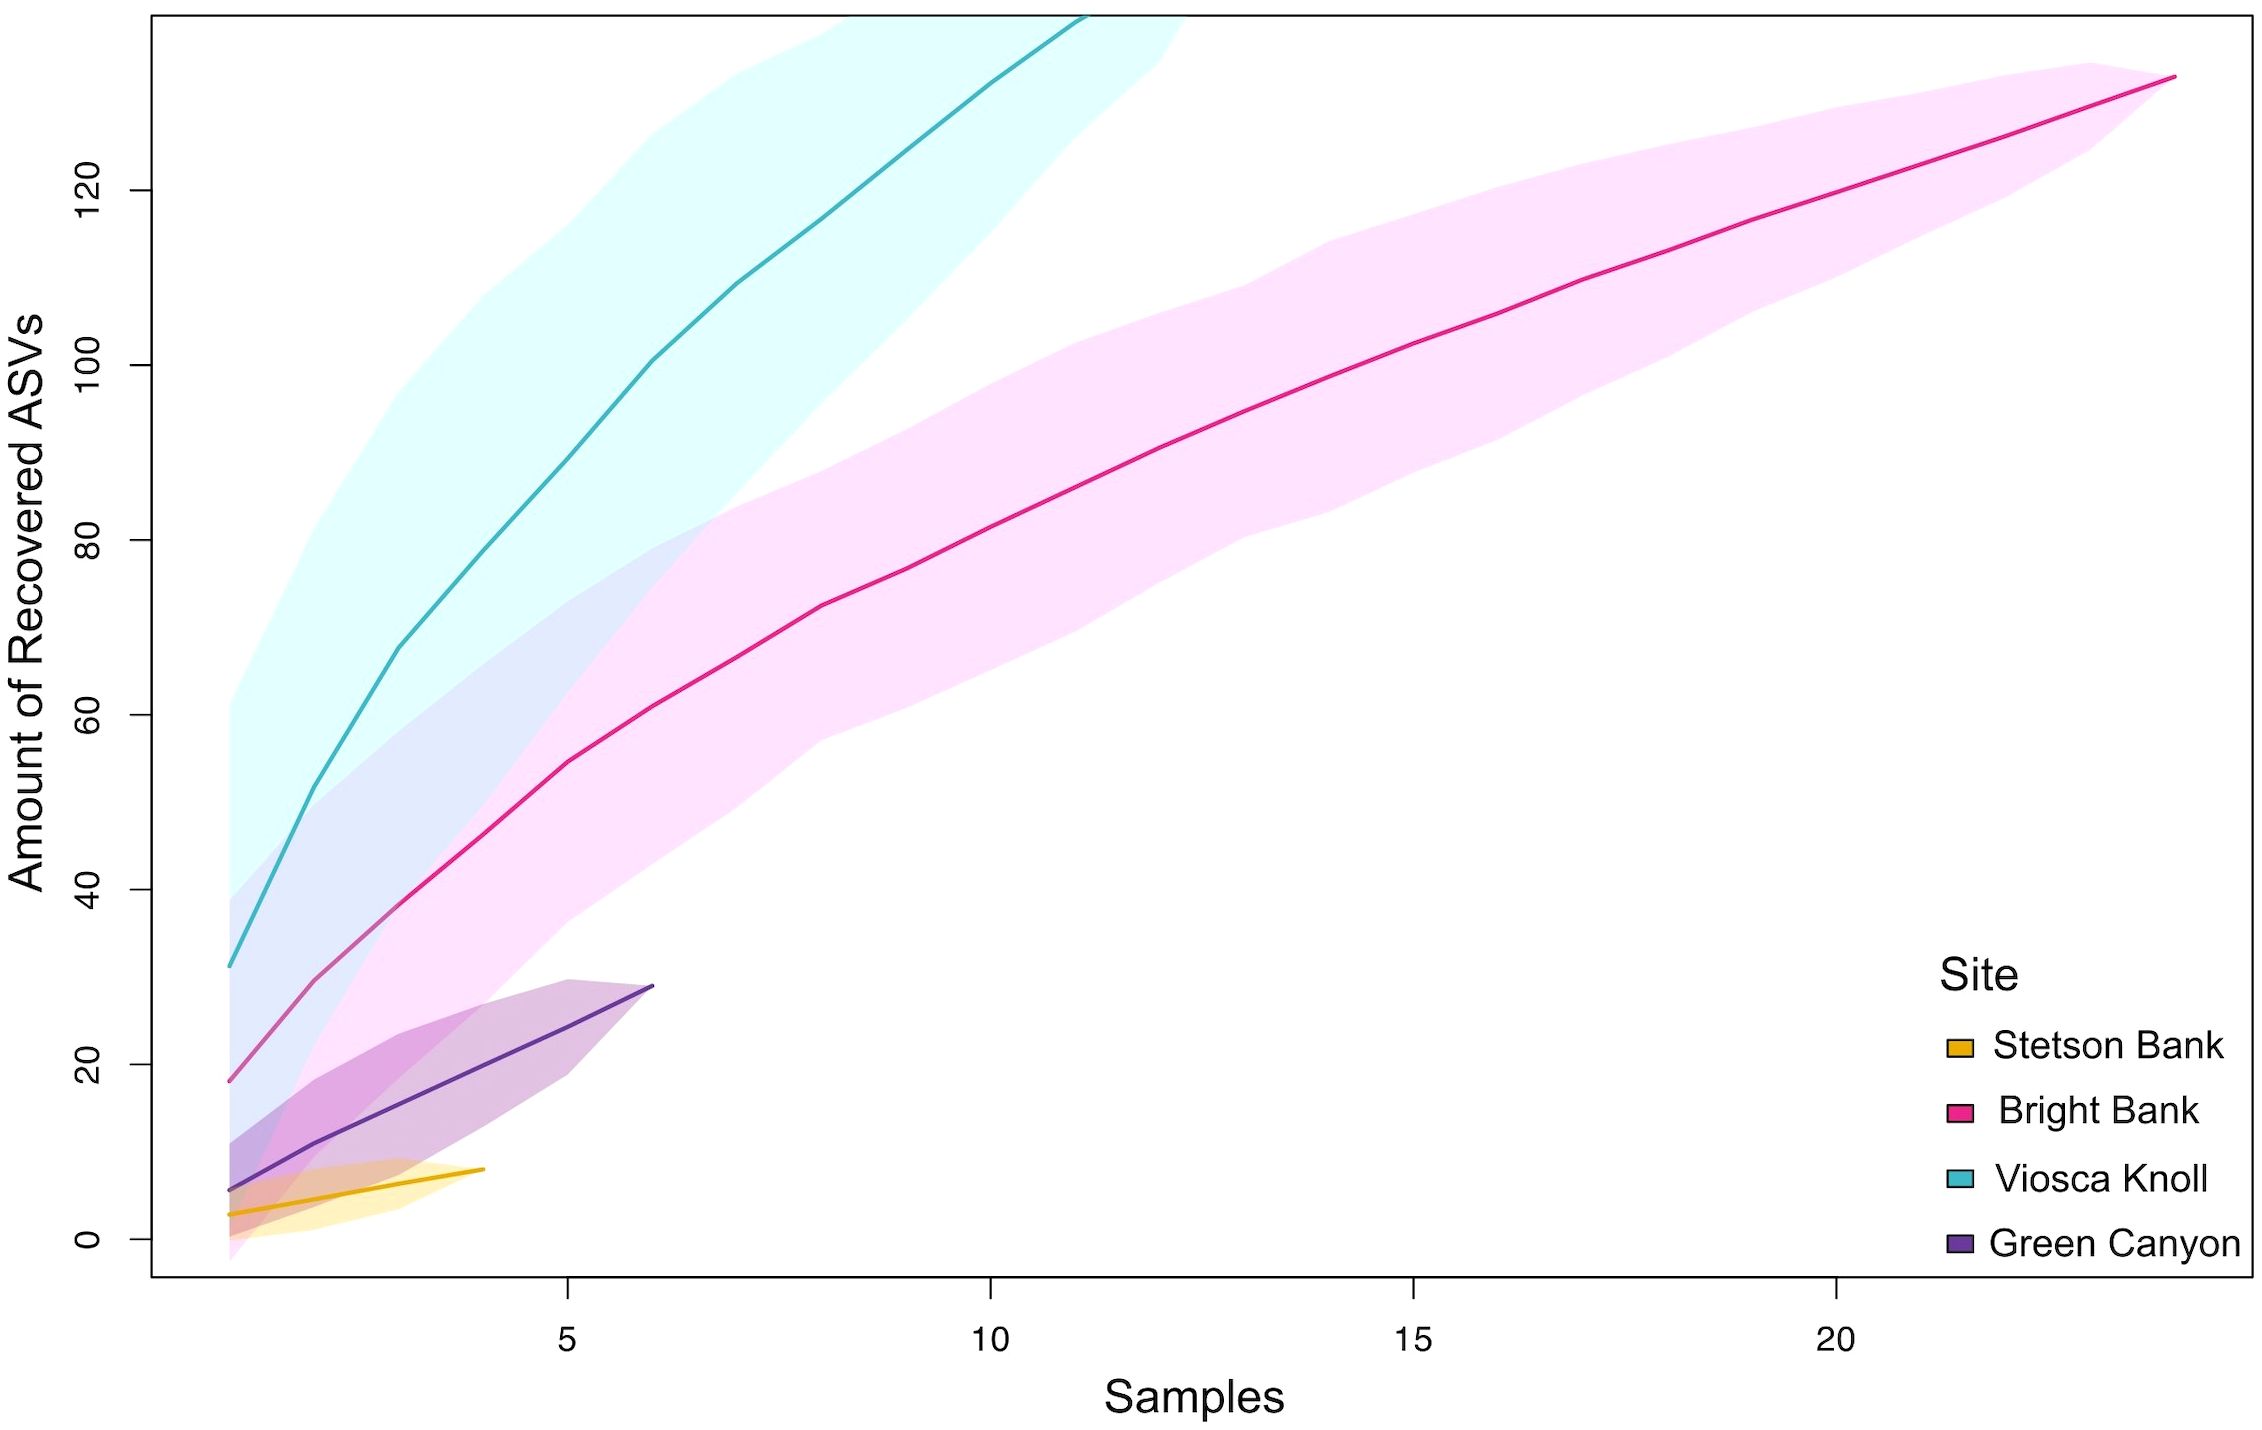
Figure 5. Species accumulation curves by site. Number of samples collected on x-axis and number of recovered ctenophore and medusozoan ASVs identified on y-axis. Shaded polygons represent confidence intervals.
4 Discussion
4.1 Anthozoan primer set complements 28S from Ctenophora and Medusozoa
Based on the in silico assessment, nearly all ctenophores and more than 80% of medusozoans in the 28S reference datasets are likely to be amplified by the Anth-28S-eDNA primers, assuming they can be amplified with up to 2 mismatches to the primers. The high percentage of complementary ctenophore sequences suggests that the primer set can capture a broad range of ctenophore diversity from eDNA samples. Only one base pair in the primer set would need to be changed in order to perfectly match the ctenophore reference sequences. The results indicate that a lower percentage of medusozoans can be recovered, which may be due to the occurrence of mismatches towards the 3’ end of the primer sequence that may interfere with primer binding. However, the primer set is still expected to amplify a large proportion of accepted families across medusozoan diversity (Table 1), suggesting that the Anth-28S-eDNA primers will aid in exploring significant medusozoan biodiversity that might go undetected otherwise. Using one primer set to target multiple taxa — Anthozoa, Ctenophora, and Medusozoa — streamlines eDNA lab workflow, such that more sequencing data can be obtained and used to address multiple taxa with the same amount of time and effort.
Having a metabarcoding primer set that readily amplifies ctenophore and medusozoan taxa presents an exciting development in GZ research by augmenting researchers’ ability to obtain sequencing data for these understudied taxa in a non-invasive, non-destructive manner, and the potential to uncover more about their community composition and distribution. For example, within our data we detected an ASV for the hydrozoan Porpita, a colonial neustonic form known as a “blue button”. Rather than being detected near the surface, however, Porpita was detected as present in 4 of 6 samples near the bottom (sampled by ROV) from below 500 m at both of the Green Canyon sampling points. While it is known that Porpita produces free-swimming medusae, little has been known about their depth distribution (Helm, 2021). However, a recent study sampled surface waters off the Pacific coast of Mexico and detected larval Porpita colonies as well as planula larvae, documenting this stage for the first time (Santiago-Valentín et al., 2024). The surface waters sampled by Santiago-Valentín and colleagues (2024) did not contain medusae, and the production of planula larvae has still yet to be observed. Our study raises the possibility that Porpita medusae sink to bottom waters to carry out the sexually reproductive phase of their lifecycles, although alternative explanations could include the sinking of fecal matter for some organism that fed upon adult Porpita or the sinking of a senesced animal tissue or body. Either of these alternative interpretations for our unexpected detection of Porpita DNA at 500 m involve links between deep benthic ecosystems with those at the ocean’s surface.
We expect that the majority of sequences identified with this primer set will represent members of the gelatinous zooplankton community. However, several taxa are restricted to the benthos and, therefore, are not technically zooplankton (e.g., some groups within Leptothecata and Anthoathecata). Thus, these primers will likely enrich a diversity of medusozoans from the water column to the benthos. Indeed, we detected benthic taxa (e.g. Eudendriidae) in our metabarcode profiles. However, the medusa stages of medusozoans tend to be considerably larger in body size and more dispersed than the polyp stages, which should skew our sampling toward medusae and thus the GZ component of Medusozoa. Other studies have suggested that larger animals are easier to detect in eDNA samples (Derycke et al., 2021).
While 28S is a promising marker for metabarcoding analyses to characterize Ctenophora and Medusozoa assemblages, its power to distinguish species is still unknown. While 28S has been applied as a barcode within sponges (e.g., Erpenbeck et al., 2016; Voigt and Wörheide, 2016; Itskovich et al., 2022), it has been little explored as a viable barcode for ctenophores or medusozoans. Within ctenophores, studies aimed at elucidating species showed mixed success for 28S as a barcode, with some species having distinct sequence signatures but other more recently diverged species being invariant in 28S (Johnson et al., 2022; Alamaru et al., 2017). Regarding medusozoans, 28S has been used extensively in phylogenetic studies of different clades (e.g., Collins et al., 2006; Cartwright et al., 2008; Bayha et al., 2010; Bentlage et al., 2010; Maronna et al., 2016; Miranda et al., 2016; Bentlage et al., 2018) and the 28S marker has been sampled from multiple exemplars of the same species in a few systematics studies (Montano et al., 2015; Cunha et al., 2017). We are not aware of any study that has explicitly assessed 28S as a barcode for medusozoans, but these studies mirror the case with ctenophores, with many distinct species within a genus being differentiated by 28S, but also with some more recently diverged species being invariant in 28S.
In our community analyses, family data were used because the majority of the recovered ASVs would have been excluded if we only used those that were identified to the species level (8 of 257 ASVs). Family was the lowest taxonomic rank that would represent the majority of recovered ASVs (188 out of 257) while still providing useful ecological and biological information.
4.2 eDNA primer set distinguishes spatially separate communities
The two dbRDAs demonstrated the power of metabarcoding with the Anth-28S-eDNA primer set to distinguish medusozoan and ctenophore communities by geographic location and ecosystem type (benthic/day-ROV or pelagic/night-CTD). In addition, using this primer set in conjunction with environmental data can help determine which environmental factors may be responsible for driving similarities or differences between those communities.
GZ assemblages were site-specific, although there was some overlap in community members (Figure 2A). The PERMANOVA test results also indicate that GZ communities are structured by both depth and proximity to the seafloor; in both dbRDA analyses, depth and altitude were among the top three variables that significantly explained the most data variance. This assertion can be seen in the tighter clustering of pelagic night samples away from benthic day samples. Previous studies have also found that GZ assemblages are spatially differentiated from one another. Zaldua-Mendizabal et al. (2021) found that GZ assemblages were distinctly differentiated across sites as a result of location-specific environmental conditions, with water column depth as one of the main factors determining assemblage differences. It has also been suggested that hydrographic boundaries and water mass dynamics, which are driven by the physical topography of a particular site, distinguish zooplankton assemblages (Haberlin et al., 2019; Doyle et al., 2007; Youngbluth et al., 2008). The influence of location-specific environmental factors and water column depth may explain why we see spatially separate jelly communities in our results. Geographic distance was not incorporated in the dbRDA analysis and we therefore cannot assert that latitude and longitude are influencing our results. However, we note that sites for which we detected more similar communities (Figure 2A) have less geographic distance between them (Figure 1A). There may therefore be some correlation between geographic distance and GZ community composition, with higher community similarity between sites that are closer together (O’Donnell et al., 2017).
eDNA transport could influence the interpretation of our results across sites and depths, since currents and mixing can transport particles away from their sources. We consider this possibility, but also note that results from a number of studies suggest that eDNA is distinct across depths in the absence of water column mixing (Andruszkiewicz et al., 2019; Allan et al., 2021; Canals et al., 2021; Govindarajan et al., 2021; Monuki et al., 2021; Govindarajan et al., 2023). Some of these studies analyzed eDNA samples collected with Niskin bottles (Canals et al., 2021; Govindarajan et al., 2021, Govindarajan et al., 2023). In August at our sampling locations, a thermocline was present below depths of approximately 20 meters. This is consistent with limited mixing typical of the warm, late summer at our stations (Supplementary Figure S1). Further, we found that the amount of eDNA from corals in these samples decreased rapidly with altitude above the seafloor, suggesting limited vertical transport near the benthos (McCartin et al., 2024). eDNA metabarcoding data also discriminates between biological communities connected by water movement (e.g. Port et al., 2016; Jeunen et al., 2019). Our field sites are distant and bathymetrically isolated from one another and also represent substantial geological features (e.g. Bright Bank). We can reasonably assume that dispersal of eDNA between our sites is not important for interpreting differences in a broad sense among our sites.
Compared to Figure 1A, there were no clear visual patterns in the data shown in Figure 2B, which accounted for relative sequencing read abundance. Samples do not appear to be grouped by site, ecosystem/sampling method/time of day, or any other environmental variable. Fewer variables are significant — only conductivity, altitude, and depth — than with presence/absence data. This more haphazard grouping suggests that the amount of DNA from a species detected in one sample is highly variable when compared to other samples, even those from the same location or ecosystem type. This high degree of variability, when relative abundance is considered, could reflect local patchiness of DNA shed from individual organisms over small distances, possibly related to the mobility of most medusozoans and ctenophores. Preliminary research on jelly eDNA suggests that eDNA release rate is highly inconsistent from individual to individual (Minamoto et al., 2017). Andruszkiewicz Allan et al (2021) also reported high variability in the concentrations of eDNA sampled from tanks of scyphozoans and suggested that this patchy signaling could be explained by scyphozoans shedding genetic material in larger chunks, since their main body is formed by acellular mesoglea and their cells may not slough off like other organisms. This is consistent with our results, since uneven signals could be caused by jellies sporadically shedding larger eDNA fragments.
4.3 Community composition of Ctenophora and Medusozoa
A diverse set of medusozoan and ctenophore families were readily detectable using these primers, opening the door to understanding more about GZ community composition and how it varies across space and time within marine environments.
In this study, there are some limitations to assertions we can make due to our sampling. The samples we used were taken during the day at close proximity to the bottom by ROV (at four sites) and in the water column at night by CTD rosette (at two sites). Further, the volume of the samples that was filtered differed between the two methods, because the Niskin bottles on the ROV had a smaller capacity than the Niskin bottles on the CTD rosette. This difference could translate to differences in the spatiotemporal resolution of the methods and also influence estimates of alpha diversity. While sample volume can influence measurements of alpha diversity, samples that differ in volume have been shown to elucidate similar patterns in community composition (Govindarajan et al., 2022; Peres and Bracken-Grissom, 2024). Our data show that GZ communities sampled by ROV and CTD significantly differ at the two sites where both types of sampling were conducted. CTD/pelagic night samples are richer in terms of families (30 vs. 24) and ASVs (162 vs. 80) detected than the ROV/benthic day samples (Supplementary Table S3). One might predict that GZ communities are richer at night than they are during the day due to diel vertical migration (as well as horizontal transport), which occurs in both deep and shallow waters (Harvey et al., 2009; Williamson et al., 2011), when many pelagic zooplankton species make their nocturnal journey to shallower depths in order to feed. However, it is not possible to disentangle whether these differences are due to proximity to the bottom, time of day, sampling method, or a combination of these factors. Future studies with sampling both at the bottom and throughout the water column during the same time frame would more appropriately address what factors drive community differences.
4.3.1 Dominant families are holopelagic
One or two families comprised the bulk of the ASVs in each community. The main dominant families — Rhopalonematidae or Diphyidae within Medusozoa and Mertensiidae or Cydippidae within Ctenophora — consist of species that live out their lives entirely within the water column, indicating that the most abundant GZ taxa living in proximity to the bottom are holopelagic (rather than medusae with benthic stages). Detecting predominantly pelagic medusozoans in the ROV samples was surprising given that benthic taxa (corals) were detected and that benthic medusozoan richness is far greater than holopelagic and meroplanktonic medusozoan richness combined.
Indeed, holopelagic taxa are much more prevalent overall in our metabarcoding profiles (24 of 35 families and 159 of 192 ASVs), and even among the daytime samples taken by ROV (17 of 24 families and 67 of 80 ASVs). GZ species inhabiting the water column are often observed in close proximity to the bottom. Specific predator-prey interactions between benthic and pelagic species have been noted, (e.g., the squat lobster Euminida picta consuming Atolla jellyfish; Nizinski et al., 2023), although observations of jellies being consumed by benthic taxa in the deep sea have been rather limited to larger animals (Gregorin et al., 2024). The preponderance of holopelagic taxa represented in our samples near the bottom suggests that there are ample opportunities for benthic and pelagic organisms to interact and is consistent with the idea that these systems are tightly linked. Gelatinous zooplankton have been previously described in relation to benthic-pelagic coupling, mainly as a food source when their dead bodies sink to the seafloor (Gregorin et al., 2024). However, the patterns of their predation and cycling have been noted as lacking (Drazen and Sutton, 2017), indicating that ctenophores and medusozoans have a likely underestimated role in linking these ecosystems in ways that have not yet been described.
4.3.2 Diversity patterns
Our study areas contain a diversity of ctenophores and medusozoans that our sampling did not come close to capturing adequately (Figure 5). While our relatively limited sampling prevents us from discerning the true extent of GZ diversity at these sites, considering the environmental context of each location informs us about what factors may be influencing GZ community composition and alpha diversity. Out of the four sites, Viosca Knoll consistently had the highest diversity by a variety of measures (richness, evenness, and phylogenetic diversity) (Figures 4, 5). These diversity measures generally indicated that Bright Bank had the second highest diversity, followed by Green Canyon and lastly Stetson Bank.
Viosca Knoll is densely populated by the reef-forming coral Desmophyllum pertusum and receives an influx of nutrients and organic matter via discharge from the Mississippi-Atchafalaya River system (Mienis et al., 2012). The terrestrial material released into the Gulf can affect productivity at Viosca Knoll through direct transport of nutrients to the seafloor and indirectly by causing an uptick in primary productivity at the surface that sinks to the seafloor over time. The abundance of cold water corals at Viosca Knoll may also be facilitating a nutrient-rich environment, as they are known to release carbon (Wild et al., 2008). The high diversity of ctenophores and medusozoans at Viosca Knoll may be related to the productivity of this site, as the plentiful food sources could support a high diversity of jellies as well as the development of deep reefs. We detected comparatively lower GZ diversity at the other deepwater site in our study, Green Canyon, which is characterized by coral gardens, cold seeps, and biogeochemical cycling supporting chemosynthetic organisms (Cordes et al., 2009). While it is conceivable that the extreme chemical environment at Green Canyon is less suitable for gelatinous zooplankton, little is known about interactions between microbial and GZ communities in these types of environments.
The shallow mesophotic sites in our study are also characterized by contrasting amounts of diversity. Bright Bank displays high ctenophore and medusozoan diversity. This site is characterized by high epibenthic species richness and warm clear water that helps sustain a booming coral ecosystem (Sammarco et al., 2016). Ctenophores and medusozoans may be thriving on the plentiful food sources present in such a diverse ecosystem and additionally may serve as prey for other organisms living near the coral. Stetson Bank is also known to support the development of rich reef environments, but our sampling was from a deeper, more turbid locality within Stetson Bank. High turbidity can block sunlight from reaching corals and negatively impact productivity. It may be that the low GZ diversity at this site also stems from the turbid conditions.
4.3.3 Food web interactions
As ctenophores and medusozoans are key members of the marine food web, identifying the taxa in benthic day and pelagic night communities can reveal ecological interactions taking place between predator and prey. Ten different families were exclusive to the pelagic nighttime samples and in this case diverse holopelagic taxa were prevalent (n=8), including the ctenophores Beroe (family Beroidae) that prey upon other jellies and the ribbon-shaped Velamen (Cestidae) that forage for small copepods (Stretch, 1982; Matsumoto and Harbison, 1993), as well as the worm-shaped narcomedusa Tetraplatia volitans and the shallow-water limnomedusan Liriope tetraphylla. Many diverse taxa were detected in both benthic day and pelagic night samples (Figure 3). For example, all five siphonophore families were detected, including species that likely eat fish (Erennidae), others that likely feed upon copepods (Diphyidae, Hippopodiidae), and others that are generalists (Agalmatidae) (Damian-Serrano et al., 2021). Ctenophores with different prey preferences are also common to both benthic day and pelagic night communities, such as Haeckelia, which feeds upon medusae and Charistephane fugians, which feeds on small copepods (Haddock, 2007).
5 Conclusions
We have demonstrated that a 28S eDNA primer set designed for anthozoans can also capture a diverse range of medusozoan cnidarians and ctenophores. As these taxa serve multiple important functions within marine ecosystems, applying this primer set to GZ studies presents an opportunity to build our understanding of the ecological and biological features of this vital community. Our eDNA-based approach yielded several advantages for understanding GZ diversity, as seen compared to historical entries in repositories like the Ocean Biodiversity Information System (OBIS). In our region of study, OBIS has 26 records of ctenophores representing six families over the course of nearly 140 years; our single set of samples yielded 67 ctenophore ASVs representing 11 families, illustrating how eDNA-based sampling will revolutionize understanding of species distributions. Similarly, over the same time period OBIS contains 821 records for 16 medusozoan families, as compared to the 190 medusozoan ASVs representing 24 families. Despite being limited by incomplete reference genetic data, eDNA provides a quick way to collect occurrence data in addition to greater specificity of identifications for medusozoans as compared to OBIS.
These primers could be applied in targeted studies investigating the distribution of GZ, at both micro- and meso-scales, and how environmental conditions and biological factors influence those distributions, as well as the role of GZ in ecologically important processes such as trophic interactions and biogeochemical cycling. We recognize the ongoing difficulties with drawing definitive conclusions from eDNA data given the uncertainties about fate and transport; regardless, its potential to elucidate groups that have historically been overlooked should be taken advantage of. Jellies are key players in an ocean constantly grappling with anthropogenic impacts, and we therefore hope that this primer set can begin to fill the long-standing gap in gelatinous zooplankton studies.
Data availability statement
The original contributions presented in the study are publicly available. This data can be found here: NCBI SRA, accession PRJNA1159220.
Author contributions
AW: Data curation, Formal analysis, Investigation, Writing – original draft, Writing – review & editing. LM: Conceptualization, Data curation, Formal analysis, Funding acquisition, Investigation, Resources, Writing – original draft, Writing – review & editing. SH: Funding acquisition, Resources, Supervision, Writing – review & editing. AQ: Funding acquisition, Resources, Supervision, Writing – review & editing. AC: Conceptualization, Data curation, Formal analysis, Supervision, Writing – original draft, Writing – review & editing.
Funding
The author(s) declare that financial support was received for the research and/or publication of this article. Funding was provided by the Smithsonian Institution Fellowship Program, the Bureau of Ocean Energy Management, the NMNH’s Ocean DNA Initiative, and the National Oceanic and Atmospheric Administration’s Oceanic and Atmospheric Research, Office of Ocean Exploration and Research, under award NA18OAR0110289 to SH at Lehigh University and sub-awards to AQ at the Smithsonian Institution and Cathy McFadden at Harvey Mudd College. The fieldwork component of this study was funded by NOAA’s National Centers for Coastal Ocean Science, Competitive Research Program under award NA18NOS4780166 to SH at Lehigh University.
Acknowledgments
Thank you to Chris Meyer and the Smithsonian NMNH Coral Lab for support. This work was also supported by a Lehigh University CAS Dean's Opportunity Grant. All or portions of the laboratory and/or computer work were conducted in and with the support of the LAB facilities of the National Museum of Natural History or its partner labs.
Conflict of interest
The authors declare that the research was conducted in the absence of any commercial or financial relationships that could be construed as a potential conflict of interest.
Generative AI statement
The author(s) declare that no Generative AI was used in the creation of this manuscript.
Correction note
This article has been corrected with minor changes. These changes do not impact the scientific content of the article.
Publisher’s note
All claims expressed in this article are solely those of the authors and do not necessarily represent those of their affiliated organizations, or those of the publisher, the editors and the reviewers. Any product that may be evaluated in this article, or claim that may be made by its manufacturer, is not guaranteed or endorsed by the publisher.
Supplementary material
The Supplementary Material for this article can be found online at: https://www.frontiersin.org/articles/10.3389/fmars.2025.1535149/full#supplementary-material
References
Alamaru A., Hoeksema B. W., van der Meij S. E., Huchon D. (2017). Molecular diversity of benthic ctenophores (Coeloplanidae). Scientific Reports 7 (1), 6365. doi: 10.1038/s41598-017-06505-4
Allan E. A., DiBenedetto M. H., Lavery A. C., Govindarajan A. F., Zhang W. G. (2021). ). Modeling characterization of the vertical and temporal variability of environmental DNA in the mesopelagic ocean. Sci. Rep. 11, 21273. doi: 10.1038/s41598-021-00288-5
Andruszkiewicz E. A., Koseff J. R., Fringer O. B., Ouellette N. T., Lowe A. B., Edwards C. A., et al. (2019). Modeling environmental DNA transport in the coastal ocean using lagrangian particle tracking. Front. Marine Sci. 6. doi: 10.3389/fmars.2019.00477
Andruszkiewicz Allan E., Zhang W. G., C. Lavery A., Govindarajan A. (2021). Environmental DNA shedding and decay rates from diverse animal forms and thermal regimes. Environ. DNA 3, 492–514. doi: 10.1002/edn3.141
Bayha K. M., Dawson M. N., Collins A. G., Barbeitos M. S. (2010). Evolutionary relationships among scyphozoan jellyfish families based on complete taxon sampling and phylogenetic analyses of 18S and 28S ribosomal DNA. Integr. Comp. Biol. 50, 436–455. doi: 10.1093/icb/icq074
Bentlage B., Cartwright P., Yanagihara A. A., Lewis C., Richards G. S., Collins A. G. (2010). Evolution of box jellyfish (Cnidaria: Cubozoa), a group of highly toxic invertebrates. Proc. R. Soc. B: Biol. Sci. 277, 493–501. doi: 10.1098/rspb.2009.1707
Bentlage B., Osborn K. J., Lindsay D. J., Hopcroft R. R., Raskoff K. A., Collins A. G. (2018). Loss of metagenesis and evolution of a parasitic life style in a group of open-ocean jellyfish. Mol. Phylogenet Evol. 124, 50–59. doi: 10.1016/j.ympev.2018.02.030
Brodeur R. D., Buckley T. W., Lang G. M., Draper D. L., Buchanan J. C., Hibpshman R. E. (2021). Demersal fish predators of gelatinous zooplankton in the Northeast Pacific Ocea. N. Mar. Ecol. Prog. Ser. 658, 89–104. doi: 10.3354/meps13489
Callahan B. J., McMurdie P. J., Rosen M. J., Han A. W., Johnson A. J. A., Holmes S. P. (2016). DADA2: High-resolution sample inference from Illumina amplicon data. Nat. Methods 13, 581–583. doi: 10.1038/nmeth.3869
Canals O., Mendibil I., Santos M., Irigoien X., Rodríguez-Ezpeleta N. (2021). Vertical stratification of environmental DNA in the open ocean captures ecological patterns and behavior of deep-sea fishes. Limnol. Oceanogr. Lett. 6, 339–347. doi: 10.1002/lol2.10213
Cardona L., Álvarez De Quevedo I., Borrell A., Aguilar A. (2012). Massive consumption of gelatinous plankton by mediterranean apex predators. PloS One 7, e31329. doi: 10.1371/journal.pone.0031329
Cartwright P., Evans N. M., Dunn C. W., Marques A. C., Miglietta M. P., Schuchert P., et al. (2008). Phylogenetics of hydroidolina (Hydrozoa: cnidaria). J. Mar. Biol. Ass. 88, 1663–1672. doi: 10.1017/S0025315408002257
Chamberlain S. A., Szöcs E. (2013). taxize: taxonomic search and retrieval in R. F1000Research, 2, 191. https://f1000research.com/articles/2-191/v2.
Chi X., Dierking J., Hoving H.-J., Lüskow F., Denda A., Christiansen B., et al. (2021). Tackling the jelly web: Trophic ecology of gelatinous zooplankton in oceanic food webs of the eastern tropical Atlantic assessed by stabl e isotope analysis. Limnology Oceanography 66, 289–305. doi: 10.1002/lno.11605
Choy C. A., Haddock S. H. D., Robison B. H. (2017). Deep pelagic food web structure as revealed by in situ feeding observations. Proc. R. Soc. B: Biol. Sci. 284, 20172116. doi: 10.1098/rspb.2017.2116
Collins A. G., Schuchert P., Marques A. C., Jankowski T., Medina M., Schierwater B. (2006). Medusozoan phylogeny and character evolution clarified by new large and small subunit rDNA data and an assessment of the utility of phylogenetic mixture models. Systematic Biol. 55, 97–115. doi: 10.1080/10635150500433615
Cordes E. E., Bergquist D. C., Fisher C. R. (2009). Macro-ecology of gulf of Mexico cold seeps. Annu. Rev. Mar. Sci. 1, 143–168. doi: 10.1146/annurev.marine.010908.163912
Cunha A. F., Collins A. G., Marques A. C. (2017). Phylogenetic relationships of Proboscoida Broc(Cnidaria, Hydrozoa): Are traditional morphological diagnostic characters relevant for the delimitation of lineages at the species, genus, and family levels? Mol. Phylogenet. Evol. 106, 118–135. doi: 10.1016/j.ympev.2016.09.012
Damian-Serrano A., Haddock S. H. D., Dunn C. W. (2021). The evolution of siphonophore tentilla for specialized prey capture in the open ocean. Proc. Natl. Acad. Sci. 118, e2005063118. doi: 10.1073/pnas.2005063118
Davis N. M., Proctor D. M., Holmes S. P., Relman D. A., Callahan B. J. (2018). Simple statistical identification and removal of contaminant sequences in marker-gene and metagenomics data. Microbiome 6, 226. doi: 10.1186/s40168-018-0605-2
De Donno A., Idolo A., Bagordo F., Grassi T., Leomanni A., Serio F., et al. (2014). Impact of stinging jellyfish proliferations along south italian coasts: human health hazards, treatment and social costs. Int. J. Environ. Res. Public Health 11, 2488–2503. doi: 10.3390/ijerph110302488
Derycke S., Maes S., Van den Bulcke L., Vanhollebeke J., Wittoeck J., Hillewaert H., et al. (2021). Detection of Macrobenthos Species With Metabarcoding Is Consistent in Bulk DNA but Dependent on Body Size and Sclerotization in eDNA From the Ethanol Preservative. Front. Mar. Sci. 8. doi: 10.3389/fmars.2021.637858
Diaz Briz L., Sánchez F., Marí N., Mianzan H., Genzano G. (2017). Gelatinous zooplankton (ctenophores, salps and medusae): an important food resource of fishes in the temperate SW Atlantic Ocean. Marine Biol. Res. 13, 630–644. doi: 10.1080/17451000.2016.1274403
Di Capua I., Piredda R., Mazzocchi M. G., Zingone A. (2021). Metazoan diversity and seasonality through eDNA metabarcoding at a Mediterranean long-term ecological research site. ICES J. Marine Sci. 78, 3303–3316. doi: 10.1093/icesjms/fsab059
Doyle T. K., Houghton J. D. R., Buckley S. M., Hays G. C., Davenport J. (2007). The broad-scale distribution of five jellyfish species across a temperate coastal environment. Hydrobiologia 579, 29–39. doi: 10.1007/s10750-006-0362-2
Drazen J. C., Sutton T. T. (2017). Dining in the deep: the feeding ecology of deep-sea fishes. Annu. Rev. Marine Sci. 9, 337–366. doi: 10.1146/annurev-marine-010816-060543
Erpenbeck D., Voigt O., Al-Aidaroos A. M., Berumen M. L., Büttner G., Catania D., et al. (2016). Molecular biodiversity of Red Sea demosponges. Marine Pollution Bull. 105, 507–514. doi: 10.1016/j.marpolbul.2015.12.004
Everett M. V., Park L. K. (2018). Exploring deep-water coral communities using environmental DNA. Deep Sea Res. Part II: Topical Stud. Oceanography 150, 229–241. doi: 10.1016/j.dsr2.2017.09.008
Fenner P. J. (1998). Dangers in the ocean: the traveler and marine envenomation. II. Marine vertebrates. J. Travel Med. 5, 213–216. doi: 10.1111/j.1708-8305.1998.tb00510.x
Folt C. L., Burns C. W. (1999). Biological drivers of zooplankton patchiness. Trends Ecol. Evol. 14, 300–305. doi: 10.1016/S0169-5347(99)01616-X
Frøslev T. G., Kjøller R., Bruun H. H., Ejrnæs R., Brunbjerg A. K., Pietroni C., et al. (2017). Algorithm for post-clustering curation of DNA amplicon data yields reliable biodiversity estimates. Nat. Commun. 8, 1188. doi: 10.1038/s41467-017-01312-x
Gardner J. V., Beaudoin J. (2005). High-resolution multibeam bathymetry and acoustic backscatter of selected northwestern gulf of Mexico outer shelf banks. Gulf Mexico Sci. 23, (1). doi: 10.18785/goms.2301.03
Govindarajan A. F., Francolini R. D., Jech J. M., Lavery A. C., Llopiz J. K., Wiebe P. H., et al. (2021). Exploring the use of environmental DNA (eDNA) to detect animal taxa in the mesopelagic zone. Front. Ecol. Evol. 9. doi: 10.3389/fevo.2021.574877
Govindarajan A. F., Llopiz J. K., Caiger P. E., Jech J. M., Lavery A. C., McMonagle H., et al. (2023). Assessing mesopelagic fish diversity and diel vertical migration with environmental DNA. Front. Marine Sci. 10. doi: 10.3389/fmars.2023.1219993
Govindarajan A. F., McCartin L., Adams A., Allan E., Belani A., Francolini R., et al. (2022). Improved biodiversity detection using a large-volume environmental DNA sampler with in situ filtration and implications for marine eDNA sampling strategies. Deep Sea Res. Part I: Oceanographic Res. Papers 189, 103871. doi: 10.1016/j.dsr.2022.103871
Gregorin C., Vega Fernández T., Di Camillo C. G., Musco L., Puce S. (2024). Big enough for an extra-large meal: a review on predation upon large animals by benthic cnidarians. Hydrobiologia 851, 4307–4323. doi: 10.1007/s10750-024-05523-4
Haberlin D., Raine R., McAllen R., Doyle T. K. (2019). Distinct gelatinous zooplankton communities across a dynamic shelf sea. Limnology Oceanography 64, 1802–1818. doi: 10.1002/lno.11152
Haddad V., Morandini A. C., Rodrigues L. E. (2018). Jellyfish blooms causing mass envenomations in aquatic marathonists: report of cases in S and SE Brazil (SW atlantic ocean). Wilderness Environ. Med. 29, 142–145. doi: 10.1016/j.wem.2017.09.012
Haddock S. (2004). A golden age of gelata: past and future research on planktonic ctenophores and cnidarians. Hydrobiologia 530–531, 549–556. doi: 10.1007/s10750-004-2653-9
Haddock S. H. D. (2007). Comparative feeding behavior of planktonic ctenophores. Integr. Comp. Biol. 47, 847–853. doi: 10.1093/icb/icm088
Harvey M., Galbraith P. S., Descroix A. (2009). Vertical distribution and diel migration of macrozooplankton in the St. Lawrence marine system (Canada) in relation with the cold intermediate layer thermal properties. Prog. Oceanography 80, 1–21. doi: 10.1016/j.pocean.2008.09.001
Hays G. C., Doyle T. K., Houghton J. D. R. (2018). A paradigm shift trophic importance jellyfish? Trends Ecol. Evol. 33 (11), 874–884. doi: 10.1016/j.tree.2018.09.001
Helm R. R. (2021). The mysterious ecosystem at the ocean’s surface. PloS Biol. 19, e3001046. doi: 10.1371/journal.pbio.3001046
Hopkins T. L. (1982). The vertical distribution of zooplankton in the eastern Gulf of Mexico. Deep Sea Res. Part A. Oceanographic Res. Papers 29, 1069–1083. doi: 10.1016/0198-0149(82)90028-0
Hosia A., Falkenhaug T., Baxter E. J., Pagès F. (2017). Abundance, distribution and diversity of gelatinous predators along the northern Mid-Atlantic Ridge: A comparison of different sampling methodologies. PloS One 12, e0187491. doi: 10.1371/journal.pone.0187491
Itskovich V., Kaluzhnaya O., Glyzina O. (2022). The utilityof 28S rDNA for barcoding of freshwater sponges (Porifera, spongillida). Diversity 14, 1126. doi: 10.3390/d14121126
Ivanov V. P., Kamakin A. M., Ushivtzev V. B., Shiganova T., Zhukova O., Aladin N., et al. (2000). Invasion of the caspian sea by the comb jellyfish mnemiopsis leidyi (Ctenophora). Biol. Invasions 2, 255–258. doi: 10.1023/A:1010098624728
Jeunen G.-J., Knapp M., Spencer H. G., Lamare M. D., Taylor H. R., Stat M., et al. (2019). Environmental DNA (eDNA) metabarcoding reveals strong discrimination among diverse marine habitats connected by water movement. Mol. Ecol. Resour. 19, 426–438. doi: 10.1111/1755-0998.12982
Johnson S. B., Winnikoff J. R., Schultz D. T., Christianson L. M., Patry W. L., Mills C. E., et al. (2022). Speciation of pelagic zooplankton: Invisible boundaries can drive isolation of oceanic ctenophores. Frontiers in Genetics 13, 970314. doi: 10.3389/fgene.2022.970314
Júnior M. N., Tosetto E. G., Baldoni L. C., Dutto S., Hidaka M., Lindsay D. J., et al. (2022). “Gelatinous zooplankton,” in Marine biology: A functional approach to the oceans and their organisms. Eds. Pan J., Pratolongo P. (Boca Raton, Florida: CRC Press).
Katoh K., Misawa K., Kuma K., Miyata T. (2002). MAFFT: a novel method for rapid multiple sequence alignment based on fast Fourier transform. Nucleic Acids Res. 30, 3059–3066. doi: 10.1093/nar/gkf436
Luo J. Y., Grassian B., Tang D., Irisson J. O., Greer A. T., Guigand C. M., et al. (2014). Environmental drivers of the fine-scale distribution of a gelatinous zooplankton community across a mesoscale front. Marine Ecol. Prog. Ser. 510, 129–149. doi: 10.3354/meps10908
Macali A., Bergami E. (2020). Jellyfish as innovative bioindicator for plastic pollution. Ecol. Indic. 115, 106375. doi: 10.1016/j.ecolind.2020.106375
Maronna M. M., Miranda T. P., Peña Cantero Á.L., Barbeitos M. S., Marques A. C. (2016). Towards a phylogenetic classification of Leptothecata (Cnidaria, Hydrozoa. ). Sci. Rep. 6, 18075. doi: 10.1038/srep18075
Martin M. (2011). Cutadapt removes adapter sequences from high-throughput sequencing reads. EMBnet.journal 17, 10–12. doi: 10.14806/ej.17.1.200
Matsumoto G. I., Harbison G. R. (1993). ). In situ observations of foraging, feeding, and escape behavior in three orders of oceanic ctenophores: Lobata, Cestida, and Beroida. Marine Biol. 117, 279–287. doi: 10.1007/BF00345673
McCartin L. J., Saso E., Vohsen S. A., Pittoors N. C., Demetriades P., McFadden C. S., et al. (2024). Nuclear eDNA metabarcoding primers for anthozoan coral biodiversity assessment. PeerJ 12, e18607. doi: 10.7717/peerj.18607
Mienis F., Duineveld G. C. A., Davies A. J., Ross S. W., Seim H., Bane J., et al. (2012). The influence of near-bed hydrodynamic conditions on cold-water corals in the Viosca Knoll area, Gulf of Mexico. Deep Sea Res. Part I: Oceanographic Res. Papers 60, 32–45. doi: 10.1016/j.dsr.2011.10.007
Mills C. E. (1995). Medusae, siphonophores, and ctenophores as planktivorous predators in changing global ecosystems. ICES J. Marine Sci. 52, 575–581. doi: 10.1016/1054-3139(95)80072-7
Minamoto T., Fukuda M., Katsuhara K. R., Fujiwara A., Hidaka S., Yamamoto S., et al. (2017). Environmental DNA reflects spatial and temporal jellyfish distribution. PloS One 12, e0173073. doi: 10.1371/journal.pone.0173073
Miranda L. S., Hirano Y. M., Mills C. E., Falconer A., Fenwick D., Marques A. C., et al. (2016). Systematics of stalked jellyfishes (Cnidaria: Staurozoa). PeerJ 4, e1951. doi: 10.7717/peerj.1951
Montano S., Maggioni D., Arrigoni R., Seveso D., Puce S., Galli P. (2015). The hidden diversity of zanclea associated with scleractinians revealed by molecular data. PloS One 10, e0133084. doi: 10.1371/journal.pone.0133084
Monuki K., Barber P. H., Gold Z. (2021). eDNA captures depth partitioning in a kelp forest ecosystem. PloS One 16, e0253104. doi: 10.1371/journal.pone.0253104
Moss A. G. (2009). “Ctenophora of the gulf of Mexico,” in Gulf of Mexico origin, waters, and biota: volume I, biodiversity. Eds. Felder D. L., Camp D. K. (College Station, Texas: Texas A&M University Press), 403–412.
Nizinski M. S., McClain-Counts J. P., Ross S. W. (2023). Habitat utilization, demography, and behavioral observations of the squat lobster, Eumunida picta (Crustacea: Anomura: Eumunididae), on western North Atlantic deep-water coral habitats. Deep Sea Res. Part I: Oceanographic Res. Papers 193, 103953. doi: 10.1016/j.dsr.2022.103953
O’Donnell J. L., Kelly R. P., Shelton A. O., Samhouri J. F., Lowell N. C., Williams G. D. (2017). Spatial distribution of environmental DNA in a nearshore marine habitat. PeerJ 5, e3044. doi: 10.7717/peerj.3044
Oguz T., Fach B., Salihoglu B. (2008). Invasion dynamics of the alien ctenophore Mnemiopsis leidyi and its impact on anchovy collapse in the Black Sea. J. Plankton Res. 30, 1385–1397. doi: 10.1093/plankt/fbn094
Oksanen J., Simpson G. L., Blanchet F. G., Kindt R., Legendre P., Minchin P. R., et al. (2024). vegan: community ecology package. Available online at: https://cran.r-project.org/web/packages/vegan/index.html (Accessed September 19, 2024).
Ortner P. B., Hill L. C., Cummings S. R. (1989). Zooplankton community structure and copepod species composition in the northern Gulf of Mexico. Continental Shelf Res. 9, 387–402. doi: 10.1016/0278-4343(89)90040-X
Peres P. A., Bracken-Grissom H. (2024). Water volume, biological and PCR replicates influence the characterization of deep-sea pelagic fish communities. Environmental DNA. 7 (2), p.e70086. doi: 10.1101/2024.08.26.609755
Pitt K. A., Lucas C. H., Condon R. H., Duarte C. M., Stewart-Koster B. (2018). Claims that anthropogenic stressors facilitate jellyfish blooms have been amplified beyond the available evidence: A systematic review. Front. Mar. Sci. 5. doi: 10.3389/fmars.2018.00451
Podar M., Haddock S. H. D., Sogin M. L., Harbison G. R. (2001). A molecular phylogenetic framework for the phylum ctenophora using 18S rRNA genes. Mol. Phylogenet. Evol. 21, 218–230. doi: 10.1006/mpev.2001.1036
Port J. A., O’Donnell J. L., Romero-Maraccini O. C., Leary P. R., Litvin S. Y., Nickols K. J., et al. (2016). Assessing vertebrate biodiversity in a kelp forest ecosystem using environmental DNA. Mol. Ecol. 25, 527–541. doi: 10.1111/mec.13481
Potter B., Corrales-Ugalde M., Townsend J. P., Colin S. P., Sutherland K. R., Costello J. H., et al. (2023). Quantifying the feeding behavior and trophic impact of a widespread oceanic ctenophore. Sci. Rep. 13, 2292. doi: 10.1038/s41598-023-27955-z
Price M. N., Dehal P. S., Arkin A. P. (2010). FastTree 2 – approximately maximum-likelihood trees for large alignments. PloS One 5, e9490. doi: 10.1371/journal.pone.0009490
Puente-Tapia F. A., Gasca R., Schiariti A., Haddock S. H. D. (2021). An updated checklist of ctenophores (Ctenophora: Nuda and Tentaculata) of Mexican seas. Regional Stud. Marine Sci. 41, 101555. doi: 10.1016/j.rsma.2020.101555
Purcell J. E., Uye S., Lo W.-T. (2007). Anthropogenic causes of jellyfish blooms and their direct consequences for humans: a review. Mar. Ecol. Prog. Ser. 350, 153–174. doi: 10.3354/meps07093
Robinson K. L., Sponaugle S., Luo J. Y., Gleiber M. R., Cowen R. K. (2021). Big or small, patchy all: Resolution of marine plankton patch structure at micro-to submesoscales for 36 taxa. Sci. Adv. 7, eabk2904. doi: 10.1126/sciadv.abk2904
Robison B. H. (2004). Deep pelagic biology. J. Exp. Marine Biol. Ecol. 300, 253–272. doi: 10.1016/j.jembe.2004.01.012
Ryan W. B. F., Carbotte S. M., Coplan J., O’Hara S., Melkonian A., Arko R., et al. (2009). Global Multi-Resolution Topography (GMRT) synthesis data set. Geochem. Geophys. Geosyst. 10, Q03014. doi: 10.1029/2008GC002332
Sammarco P., Nuttall M., Beltz D., Hickerson E., Schmahl G. P. (2016). Patterns of mesophotic benthic community structure on banks off vs inside the continental shelf edge, gulf of Mexico. Gulf Mexico Sci. 33 (1), 77–92. doi: 10.18785/goms.3301.07
Santiago-Valentín J. D., Bautista-Guerrero E., Rodríguez-Troncoso A. P., Franco-Gordo M. D. C., Razo-López M. A., Godííínez-Domínguez E. (2024). Morphological and Molecular Identification of Porpita porpita (Hydrozoa: Porpitidae) Larval and Colonial Phases. Diversity 16 (7), 425.
Sayers E. W., Bolton E. E., Brister J. R., Canese K., Chan J., Comeau D. C., et al. (2023). Database resources of the national center for biotechnology information in 2023. Nucleic Acids Res. 51, D29–D38. doi: 10.1093/nar/gkac1032
Segura-Puertas L., Celis L., Chiaverano L. (2009). “Medusozoans (Cnidaria: cubozoa, scyphozoa, and hydrozoa) of the gulf of Mexico,” in Gulf of Mexico origin, waters, and biota: volume I, biodiversity. Eds. Camp D. K., Felder D. L. (College Station, Texas: Texas A&M University Press), 369–379.
Seymour M. (2019). Rapid progression and future of environmental DNA research. Commun. Biol. 2, 1–3. doi: 10.1038/s42003-019-0330-9
Shinzato C., Narisoko H., Nishitsuji K., Nagata T., Satoh N., Inoue J. (2021). Novel mitochondrial DNA markers for scleractinian corals and generic-level environmental DNA metabarcoding. Front. Mar. Sci. 8. doi: 10.3389/fmars.2021.758207
Simion P., Bekkouche N., Jager M., Quéinnec E., Manuel M. (2015). Exploring the potential of small RNA subunit and ITS sequences for resolving phylogenetic relationships within the phylum Ctenophora. Zoology 118, 102–114. doi: 10.1016/j.zool.2014.06.004
Smith B. E., Ford M. D., Link J. S. (2016). ). Bloom or bust: synchrony in jellyfish abundance, fish consumption, benthic scavenger abundance, and environmental drivers across a continental shelf. Fisheries Oceanography 25, 500–514. doi: 10.1111/fog.12168
Spens J., Evans A. R., Halfmaerten D., Knudsen S. W., Sengupta M. E., Mak S. S. T., et al. (2017). Comparison of capture and storage methods for aqueous macrobial eDNA using an optimized extraction protocol: advantage of enclosed filter. Methods Ecol. Evol. 8, 635–645. doi: 10.1111/2041-210X.12683
Stretch J. J. (1982). Observations on the abundance and feeding behavior of the cestid ctenophore, velamen parallelum. Bull. Marine Sci. 32, 796–799.
Thomsen P. F., Willerslev E. (2015). Environmental DNA – An emerging tool in conservation for monitoring past and present biodiversity. Biol. Conserv. 183, 4–18. doi: 10.1016/j.biocon.2014.11.019
Townsend J., Tassia M., Damian-Serrano A., Whelan N., Halanych K., Sweeney A. (2020). A mesopelagic ctenophore representing a new family, with notes on family-level taxonomy in Ctenophora: Vampyroctena delmarvensis gen. nov. sp. nov. (Vampyroctenidae, fam. nov.). Marine Biodiversity 50. doi: 10.1007/s12526-020-01049-9
Voigt O., Wörheide G. (2016). A short LSU rRNA fragment as a standard marker for integrative taxonomy in calcareous sponges (Porifera: Calcarea). Org Divers. Evol. 16, 53–64. doi: 10.1007/s13127-015-0247-1
Whelan N. V., Kocot K. M., Moroz T. P., Mukherjee K., Williams P., Paulay G., et al. (2017). Ctenophore relationships and their placement as the sister group to all other animals. Nat. Ecol. Evol. 1, 1737–1746. doi: 10.1038/s41559-017-0331-3
Wickham H., Averick M., Bryan J., Chang W., McGowan L., François R., et al. (2019). Welcome to the tidyverse. JOSS 4, 1686. doi: 10.21105/joss.01686
Wild C., Mayr C., Wehrmann L., Schöttner S., Naumann M., Hoffmann F., et al. (2008). Organic matter release by cold water corals and its implication for fauna–microbe interaction. Mar. Ecol. Prog. Ser. 372, 67–75. doi: 10.3354/meps07724
Williamson C. E., Fischer J. M., Bollens S. M., Overholt E. P., Breckenridge J. K. (2011). Toward a more comprehensive theory of zooplankton diel vertical migration: Integrating ultraviolet radiation and water transparency into the biotic paradigm. Limnology Oceanography 56, 1603–1623. doi: 10.4319/lo.2011.56.5.1603
Youngbluth M., Sørnes T., Hosia A., Stemmann L. (2008). Vertical distribution and relative abundance of gelatinous zooplankton, in situ observations near the Mid-Atlantic Ridge. Deep Sea Research Part II: Topical Studies in Oceanography 55 (1-2), 119–125. doi: 10.1016/j.dsr2.2007.10.002
Zaitsev Y., Mamaev V. (1997). Marine biological diversity in the Black Sea: a study of change and decline (New York: United Nations Publications).
Keywords: gelatinous zooplankton, metabarcoding, mesophotic, deep-sea, large subunit ribosomal RNA
Citation: Wood A, McCartin L, Herrera S, Quattrini AM and Collins AG (2025) Anthozoan eDNA primer set characterizes Ctenophora and Medusozoa inhabiting mesophotic and deep waters off the Gulf Coast of the southern USA. Front. Mar. Sci. 12:1535149. doi: 10.3389/fmars.2025.1535149
Received: 26 November 2024; Accepted: 02 April 2025;
Published: 09 May 2025; Corrected: 23 June 2025.
Edited by:
Marialetizia Palomba, University of Tuscia, ItalyReviewed by:
Armando Macali, University of Tuscia, ItalyKamil Hupalo, University of Duisburg-Essen, Germany
Copyright © 2025 Wood, McCartin, Herrera, Quattrini and Collins. This is an open-access article distributed under the terms of the Creative Commons Attribution License (CC BY). The use, distribution or reproduction in other forums is permitted, provided the original author(s) and the copyright owner(s) are credited and that the original publication in this journal is cited, in accordance with accepted academic practice. No use, distribution or reproduction is permitted which does not comply with these terms.
*Correspondence: Annemarie Wood, YS53b29kMjAxOUBnbWFpbC5jb20=