 Chang Cao
 Shuyang Ma
 Yang Liu
 Hao Tian
 Shigang Liu
 Jianchao Li1,2†
 Yongjun Tian
- 1Deep Sea and Polar Fisheries Research Center and Key Laboratory of Mariculture, Ministry of Education, Ocean University of China, Qingdao, China
- 2Frontiers Science Center for Deep Ocean Multispheres and Earth System and Key Laboratory of Mariculture, Ministry of Education, Ocean University of China, Qingdao, China
- 3Third Institute of Oceanography, Ministry of Natural Resources, Xiamen, China
Pacific saury (Cololabis saira) is a typical small pelagic fish in the northwestern Pacific with considerable fluctuations in productivity, bringing about great economic and ecological concerns. Numerous studies have suggested that the population dynamics of Pacific saury is an integrated process affected by multiple environmental and climatic drivers. However, little has hitherto been done to incorporate the non-stationary effects of multiple drivers, impeding progress in the understanding of the population dynamics and the development of management strategies. In this study, we adopted multivariate statistical analyses such as variable coefficients generalized additive models to determine the non-stationary effects of climatic and environmental variations on the population dynamics of Pacific saury. The results showed that Pacific saury populations in the northwestern Pacific responded to the climate regime shifts in the late 1980s and early 2000s. Non-stationarity was identified in the relationships between climate/environment and Pacific saury. The dynamics of Pacific saury from 1970 to 2021 could be divided into four periods: the 1970s and 1980s when the Siberian High and the intensification of the East Asian winter monsoon drove down the water temperature, providing a suitable habitat and resulting in an increase in resource abundance; In the 1990s, the rise in temperature led to a reduction in resource abundance; At the beginning of the 21st century, the enhancement of the Siberian High brought about a suitable habitat, and the resource abundance showed a significant increase; The unfavorable high water temperature environment in the 2010s caused the resource abundance to decrease once again. This study highlights that precise identification of the population status and climatic conditions is helpful to achieve good trade-offs between resource exploitation and protection and to facilitate ecosystem-based management for Pacific saury fisheries.
1 Introduction
Changes in the abundance and productivity of biological populations in the northwestern Pacific have often been associated with large-scale modes of climate variability (Wang et al., 2022). Due to the climate variability and anthropogenic changes that have been witnessed worldwide, conventional statistical models based on the stationary assumption tend to be biased and void of predictive skills, which would present great challenges in forecasting potential ecological risks (Dormann et al., 2013; Williams and Jackson, 2007). A process is stationary if it follows a probability density that is constant over time, while it is non-stationary if the probability density is time-dependent (Litzow et al., 2019a; Wolkovich et al., 2014). Non-stationarity refers to the phenomenon where the statistical characteristics of data or systems (such as the mean and variance, among others) change over time, space, or other factors (Litzow et al., 2018). An increasing number of studies have emphasized the presence of non-stationary relationships between small pelagic fish populations, communities, or ecosystem structure and climate/environment in different marine ecosystems (Puerta et al., 2019; Litzow et al., 2018; Szuwalski and Hollowed, 2016; Feng et al., 2024). These findings highlight the relationship between biology and climate factors characterized by discontinuous nonlinear dynamics (Wolkovich et al., 2014; Vasilakopoulos et al., 2017; Litzow et al., 2018; Damalas et al., 2021). For instance, in the North Sea ecosystem, the relationship between cod and sea surface temperature (SST) shifted in the 1970s, associated with nonlinear changes in the ecological thresholds and nutrient amplification within the ecosystem (Kirby and Beaugrand, 2009). In the Gulf of Alaska, the relationship between biological abundance and climate was shown to be weakened or reversed in the late 1980s, which is consistent with the increased variance in the North Pacific gyre oscillation (NPGO) (Puerta et al., 2019). With regard to the North Pacific Ocean, non-stationarity in the climate and ecosystem has been observed, along with spatial differences between the Northwest and Northeast Pacific (Ma et al., 2020). Analysis of the non-stationary relationship between biological and abiotic factors, as well as the underlying mechanisms, is crucial for elucidating the effects of climate variability on species or ecosystem changes and for understanding the biological responses to multiple drivers. This understanding is essential for the formulation of adaptive management strategies that take ongoing climate variability into account (Williams and Jackson, 2007; Dormann et al., 2013; Litzow et al., 2018; Ma et al., 2020). Therefore, investigations into the existence and mechanisms of non-stationary relationships are crucial for a better understanding of the biological responses to multiple drivers and for the development of adaptive management strategies.
Pacific saury (Cololabis saira) is a small pelagic fish that is widely distributed throughout the subtropical and subarctic regions of the North Pacific (Miyamoto et al., 2019; Yatsu, 2019). This species is commercially exploited in Japan, Russia, Vanuatu, Korea, Chinese Taipei, and the Chinese Mainland [Food and Agriculture Organization (FAO) website: http://www.fao.org/fishery/species/3001/en]. The fishing vessels of Japan and Russia operate mainly within their exclusive economic zones (EEZs), whereas those of other countries fish within the North Pacific high seas west of 165°E (Yatsu et al., 2021). The role of the intermediate trophic level, such as small pelagic fishes, seems to be crucial: small pelagic fishes exert top-down control on zooplankton and bottom-up control on top predators, a process known as “wasp-waist” type of control (Bakun, 2006; Cury et al., 2000). Therefore, large fluctuations in the populations of small pelagic fishes, due to fishing or natural factors, can significantly affect both plankton and predators (Santos et al., 2007), ultimately influencing the community composition and modifying the structure and function of marine ecosystems (Bakun, 2006). As typical r-strategists, Pacific saury are highly sensitive to external environmental changes and have increasingly caused concerns for fishers and fisheries-related researchers on a global scale (Alheit and Peck, 2019). Japan was the first country to utilize Pacific saury resources, achieving the largest catches of this species in the world during the last century. Japan maintains long time series of catch per unit effort (CPUE) data (in tons per net), which show similar annual variations with catch. The total catch of Pacific saury has varied greatly, from 18.1 × 10⁴ tons in 1998 to 63.1 × 10⁴ tons in 2014 (FAO, 2021). In 2020 and 2021, the total catch of Pacific saury decreased to 14.0 × 10⁴ and 9.3 × 10⁴ tons, respectively (https://www.npfc.int/summary-footprint-pacific-saury-fisheries, last accessed October 12, 2022). This decrease in fish landings has become a serious problem.
The life span of Pacific saury is short, approximately 2 years (Suyama et al., 2006), with 1-year-old fish (age 1) being the main target of fisheries. During their short life cycle, Pacific saury migrate over a large area (Figure 1). Their primary spawning grounds are located in the Kuroshio and Kuroshio Extension regions during winter (Fuji et al., 2023; Yatsu et al., 2013). Hatched larvae and juveniles are transported east along the Kuroshio Extension (Oozeki et al., 2015), after which they migrate north from subtropical regions into the subarctic Oyashio waters from May to July. There, they feed on the abundant copepods found in these regions (Miyamoto et al., 2020). Subsequently, they commence spawning migration toward the west in August or September (Kakehi et al., 2020, 2022; Miyamoto et al., 2019). However, current research on Pacific saury within the northwestern Pacific has primarily considered the responses to climate and environmental factors to be stable, and the non-stationarity in the relationships between these factors over time has not been evaluated (Liu et al., 2019; Yatsu et al., 2021).
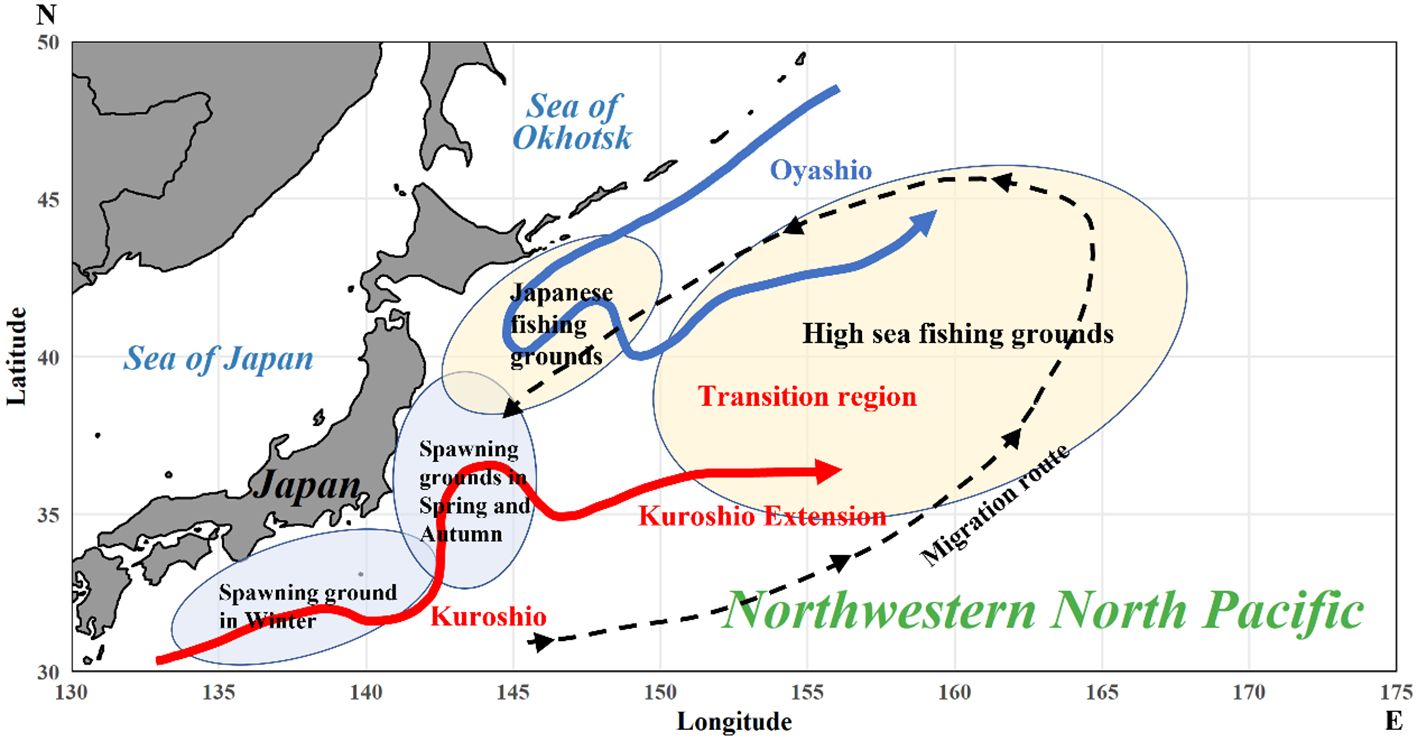
Figure 1. Schematic diagram showing the spawning ground and migration route of Pacific saury with the oceanographic structures along the Pacific coast of Japan. The solid red line represents the Kuroshio Current and Kuroshio Extension, while the solid blue line represents the Oyashio Current. The dotted line with arrows represents the migration route of Pacific saury. The oval areas represent the spawning and fishing grounds of Pacific saury.
Understanding how populations and communities respond to climatic variability is critical for predicting the ecological consequences of climate change and for anticipating efficient management approaches for commercially exploited species and marine ecosystems. For instance, Ma et al. (2023) discovered non-stationary effects of multiple drivers on the dynamics of Japanese sardine (Sardinops melanostictus, Clupeidae), suggesting the importance of density-dependent effects, fishing activities, and environmental drivers, particularly SST, to the long-term population dynamics of Japanese sardine. Feng et al. (2024) found non-stationarity in the relationships between climate/environment and the four most important species in the Humboldt Current System, with different species showing different threshold years. A lot of research has been done to investigate the variations in the abundance of Pacific saury in relation to oceanic–climate changes (Tian et al., 2002, 2003, 2004; Xing et al., 2022; Yatsu et al., 2021; Liu et al., 2019). There is increasing evidence that the variations in the abundance of Pacific saury are influenced by the oceanic and climate environment. However, little has hitherto been done to incorporate the non-stationary effects of multiple drivers, impeding progress in the understanding of the population dynamics of Pacific saury and the development of management strategies for the protection of fishery resources. Therefore, there is an urgent need to explore the non-stationary effects of multiple drivers on the long-term population dynamics of Pacific saury. To this end, this study collected Pacific saury catch and biomass data, as well as regional SST data and large-scale climate indices (CIs), to analyze the long-term trend in catch and to reveal the non-stationary effects of environmental and climatic drivers on the population dynamics of Pacific saury. This study aimed to: 1) explore the long-term variability in Pacific saury, the environment, and climate in the northwestern North Pacific; 2) identify regime shifts in climate, environmental variables, and Pacific saury abundance; and 3) investigate the non-stationarity in the relationships between biological responses and physical drivers. The results contribute to understanding the potential mechanisms of resource variability in marine organisms under multiple pressures and provide essential insights into the scientific management of Pacific saury fishery resources, as well as for ensuring the resilience of long-term predictions concerning the impacts of climate variability.
2 Materials and methods
2.1 Data description and sources
2.1.1 Fishery data
Japan has the longest history of Pacific saury fishing, with catch prior to the 2010s having been much higher than those by other countries (Supplementary Figure S1). At the same time, only Japan has assembled long time series of CPUE data (Supplementary Figure S1). CPUE is often positively related to the availability of fisheries and is regarded as an indicator of fish abundance. The total catch data for the earlier period of 1950–2015 were obtained from FAO (FAO, 2021), while those for the later period of 2015–2021 were from NPFC (https://www.npfc.int/summary-footprint-pacific-sauryfisheries). The annual total catch and the CPUE (in metric tons/vessel) reported by The North Pacific Fisheries Commission (NPFC) from 1995 to 2021 may be regarded as being representative of stock abundance to investigate its potential link between climate change and Pacific saury. Such fishery capture data or the CPUE of many small pelagic fishes have been deemed as a suitable proxy for stock abundance in a lot of previous research (Liu et al., 2019; Hou et al., 2022; Xing et al., 2022). Therefore, in this study, we integrated both the catch and CPUE data to obtain a relatively long time series to represent the abundance of Pacific saury.
2.1.2 Environment data
Monthly SST field data with a resolution of 1° × 1° (latitude × longitude) for the geographical range of 20°–50° N, 120°–180° E and for the period 1950–2021 were obtained from the Hadley Centre Sea Ice and Sea Surface Temperature (HadISST) dataset (https://www.metoffice.gov.uk/hadobs/hadisst/) (Rayner et al., 2003). The HadISST dataset is a unique combination of monthly globally complete fields of SST and sea ice concentration on a 1° latitude–longitude grid from 1870 to the present. The boundaries of the SST field were chosen to include the entire migratory range of Pacific saury, which varies with stock abundance. The monthly SST fields were averaged over January to March (JFM), April to June (AMJ), July to September (JAS), and October to December (OND) to obtain the winter, spring, summer, and autumn SST fields, respectively.
2.1.3 Climate data
The Pacific decadal oscillation (PDO), NPGO, Arctic Oscillation Index (AOI), Siberian High Index (SHI), Aleutian Low Index (ALI), Southern Oscillation Index (SOI), and East Asian Monsoon Index (MOI) are useful large-scale CIs to define the climate variability in the North Pacific (Thompson and Wallace, 1998; Hare and Mantua, 2000; Gong et al., 2001; Mantua and Hare, 2002; Wu and Wang, 2002; Di Lorenzo et al., 2008). All of these large-scale CIs are derived from open-access online databases and have a monthly temporal scale for the period 1950–2020. These large-scale CIs are often associated with variations in the fish communities and ecosystems in the North Pacific (Tian et al., 2014, 2023; Liu et al., 2019; Ma et al., 2019). Large-scale climate processes, such as the Siberian High, Aleutian Low, Arctic oscillation, and Asian monsoon, are most active in winter (Wu and Wang, 2002; Gong et al., 2001; Lee et al., 2025). Therefore, the winter (from December to February, a period that is frequently used in relevant research) average for each index was calculated to represent climatic variability (Alheit and Bakun, 2010; Tu et al., 2015; Ma et al., 2019; Ma et al., 2020). Details of these CIs are provided in Supplementary Table S1. In addition to the above indices related to the North Pacific, the Atlantic multidecadal oscillation (AMO), defined as the detrended mean SST anomaly of the North Atlantic (0°–60° N), was also considered here due to its strong teleconnection with the northwestern North Pacific (Wu et al., 2020; Sun et al., 2017).
2.2 Data analyses
2.2.1 Empirical orthogonal function
Empirical orthogonal function (EOF) analysis has been used to determine a set of orthogonal spatial modes (i.e., the association or loading of each grid on the trend) along with a set of uncorrelated time coefficients that represent dominant trends in the space–time field data (Hannachi et al., 2007; Thorson et al., 2020). In this study, EOF analysis was used to identify the most important SST variability pattern in the northwestern Pacific. We calculated the spatial modes and time coefficients of the winter (January–March), spring (April–June), summer (July–September), and autumn (October–December) SST fields and retained the first four principal components (PCs) of each to focus on the dominant variability patterns (Litzow and Mueter, 2014). For convenience of description, the spatial modes and time coefficients of the PCs were shortened into EOFs and PCs, respectively (similar to Hannachi et al., 2007). The EOF was conducted using singular value decomposition of the centered and scaled (average 0 and variance 1) data matrix, which is considered a preferred method for numerical accuracy (Venables and Ripley, 2002). The EOF was performed with the “prcomp” routine (psych package) (Revelle, 2022) in R (R Core Team, 2020).
2.2.2 Regime shift detection
Breakpoint analysis was used to identify abrupt shifts in the biological time series and in their functional relationships (similar to Möllmann et al., 2021). This algorithm detects breakpoints in linear regression models by identifying where the coefficients shift between multiple stable regression relationships. The optimal model with m breakpoints and m + 1 segments was determined by minimizing the residual sum of squares (Zeileis et al., 2003). The biological time series was log-transformed in order to better identify linear relationships. Breakpoint analysis was performed with the “breakpoints” routine (strucchange package) (Zeileis et al., 2002) in R (R Core Team, 2020).
In addition, sequential t-test analysis of the regime shifts (STARS) (Rodionov, 2004) and Bayesian change point analysis (Erdman and Emerson, 2008) were also used to identify abrupt shifts in the time series to increase the accuracy of time nodes. STARS was performed with the code published in Stirnimann et al. (2019), while the Bayesian change point analysis was performed with the “bcp” routine (bcp package) (Erdman and Emerson, 2008) in R (R Core Team, 2020).
2.2.3 Relationship between Pacific saury and physical drivers
Pearson’s correlation analyses were applied to determine linear correlations between the catch and biomass and the monthly SST fields, as well as between the monthly SST fields and the CIs. The number of degrees of freedom of the coefficients obtained from the significance tests was adjusted based on the potential autocorrelation in the PCs (Bretherton et al., 1999; Pyper and Peterman, 1998). Analyses were conducted using the “corr.test” routine (psych package) in R (R Core Team, 2020).
Generalized additive models (GAMs) and threshold generalized additive models (TGAMs) were utilized to determine the type of relationships (stationary or non-stationary) between the biological responses and SSTs (physical drivers). A “stationary” relationship is defined as a single function throughout the entire time period and is formulated by a GAM (Ciannelli et al., 2004) as Equation 1:
where Y is the biology time series; X is the SST; and s, α, and ϵ are the smooth function (with k ≤ 3 to avoid overfitting), intercept, and error terms, respectively. In contrast, a “non-stationary” relationship is depicted by two (or more) functions during different time periods with the biological responses to physical drivers changing abruptly over a threshold year (Litzow et al., 2018). Recent studies have supported that TGAMs perform well in identifying the change point of a relationship by fitting two functions for different periods, which can be used to understand whether the Pacific saury–climate relationship in the northwestern Pacific is non-stationary and to determine the regime–shift point as well. The non-stationary relationship is formulated by a TGAM (Puerta et al., 2019) as Equation 2:
where y is the threshold year that separates different periods with different biological responses to physical drivers. The y value, a year between the 10th and the 90th of the time series, was determined such that the generalized cross-validation (GCV) score of the model was minimized (Casini et al., 2009). Residuals of the fitted models were calculated to examine the temporal autocorrelations. In cases of autocorrelated residuals, the GAM and TGAM were extended to general additive mixed model (GAMM) and threshold generalized additive mixed model (TGAMM) with a correlation structure of autoregressive process of order 1 (corAR1) (Wood, 2006; Ma et al., 2021a). GCV was not appropriate for threshold year selection in the TGAMM; thus, the “genuine” cross-validatory squared prediction error (gCV) was used in the threshold year selection process. The gCV accounts for the estimation of the threshold year and the degrees of freedom for all stationary and non-stationary formulations (Ciannelli et al., 2004). In addition, the fitness of the stationary (GAMs) and non-stationary models (TGAMs) were also compared based on gCV. Analyses were conducted with the “mgcv” package in R (R Core Team, 2020).
The variable coefficient generalized additive models (vcGAMs) invented by Litzow et al. (2019a) were used to reveal the non-stationary response–driver relationships between population dynamics and external drivers. We considered four situations of response–driver relationships that were assumed either stationary (no breakpoint) or non-stationary with respectively one, two, or three breakpoints that partitioned the entire time period. For the three non-stationary situations, the drivers were assumed either invariant (unchangeable through segments) with time or variant among segments. Therefore, a total of seven scenarios were modeled (Table 1). The formula for vcGAM is as Equation 3:
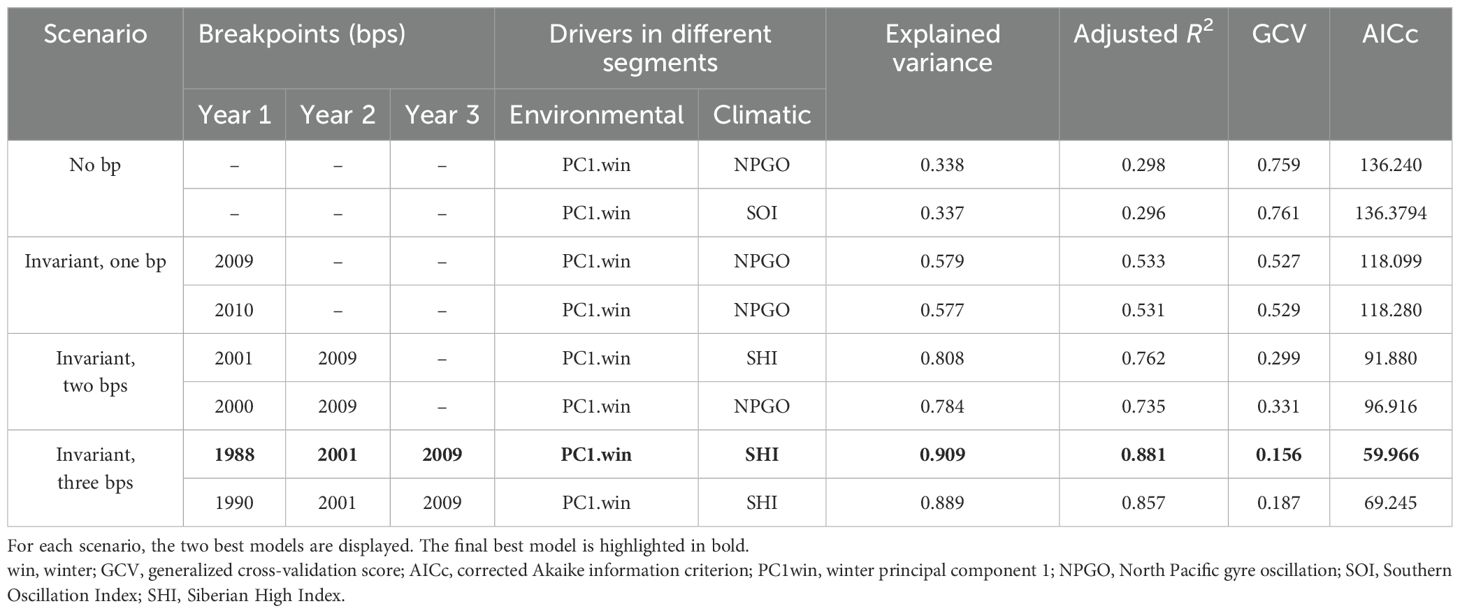
Table 1. Results of the model selection.
where Y is the response variable; α is the intercept; s represents a smooth function with degrees of freedom ≤3 (a relatively small number to give conservative limitation on the degrees of freedom due to the relatively shorter time series data in the segment-specific fitting) to avoid overfitting; X1 and X2 are the fishing and climatic variables, respectively; and ϵ is the error term. The subscript i represents the number of breakpoints ranging from 0 (no breakpoint) to 3 (three breakpoints or four segments). The value of breakpoints was set to ensure each segment had a minimum length of 8 years, a relatively long period that is reasonable for a stable relationship. The identification of breakpoints and the model selections were based on comprehensive considerations of the explained deviance (R2), the adjusted R2, the GCV score (Golub et al., 1979), and the corrected Akaike information criterion (AICc) (Hurvich and Tsai, 1993). The higher the R2 and the adjusted R2 and the lower the GCV and AICc, the better the model fits.
3 Results
3.1 Climate and SST variability of the northwestern Pacific
Multiple regime shift detections achieved consensus and indicated that three climatic regime shifts occurred in the past decades in the North Pacific (Figure 2; Supplementary Figures S2, S3). The first one occurred in the mid-1970s and featured a sharp decrease in the strength of the Aleutian Low pressure system, a shift from cold to warm phase of the PDO. After that, a climatic regime shift happened in the late 1980s, with an abrupt decline in the strength of the Siberian High pressure system and an enhanced Arctic oscillation. The latest climatic regime shift was observed in the mid- and late 1990s and was represented by an upward shift in the AMO and NPGO, respectively.
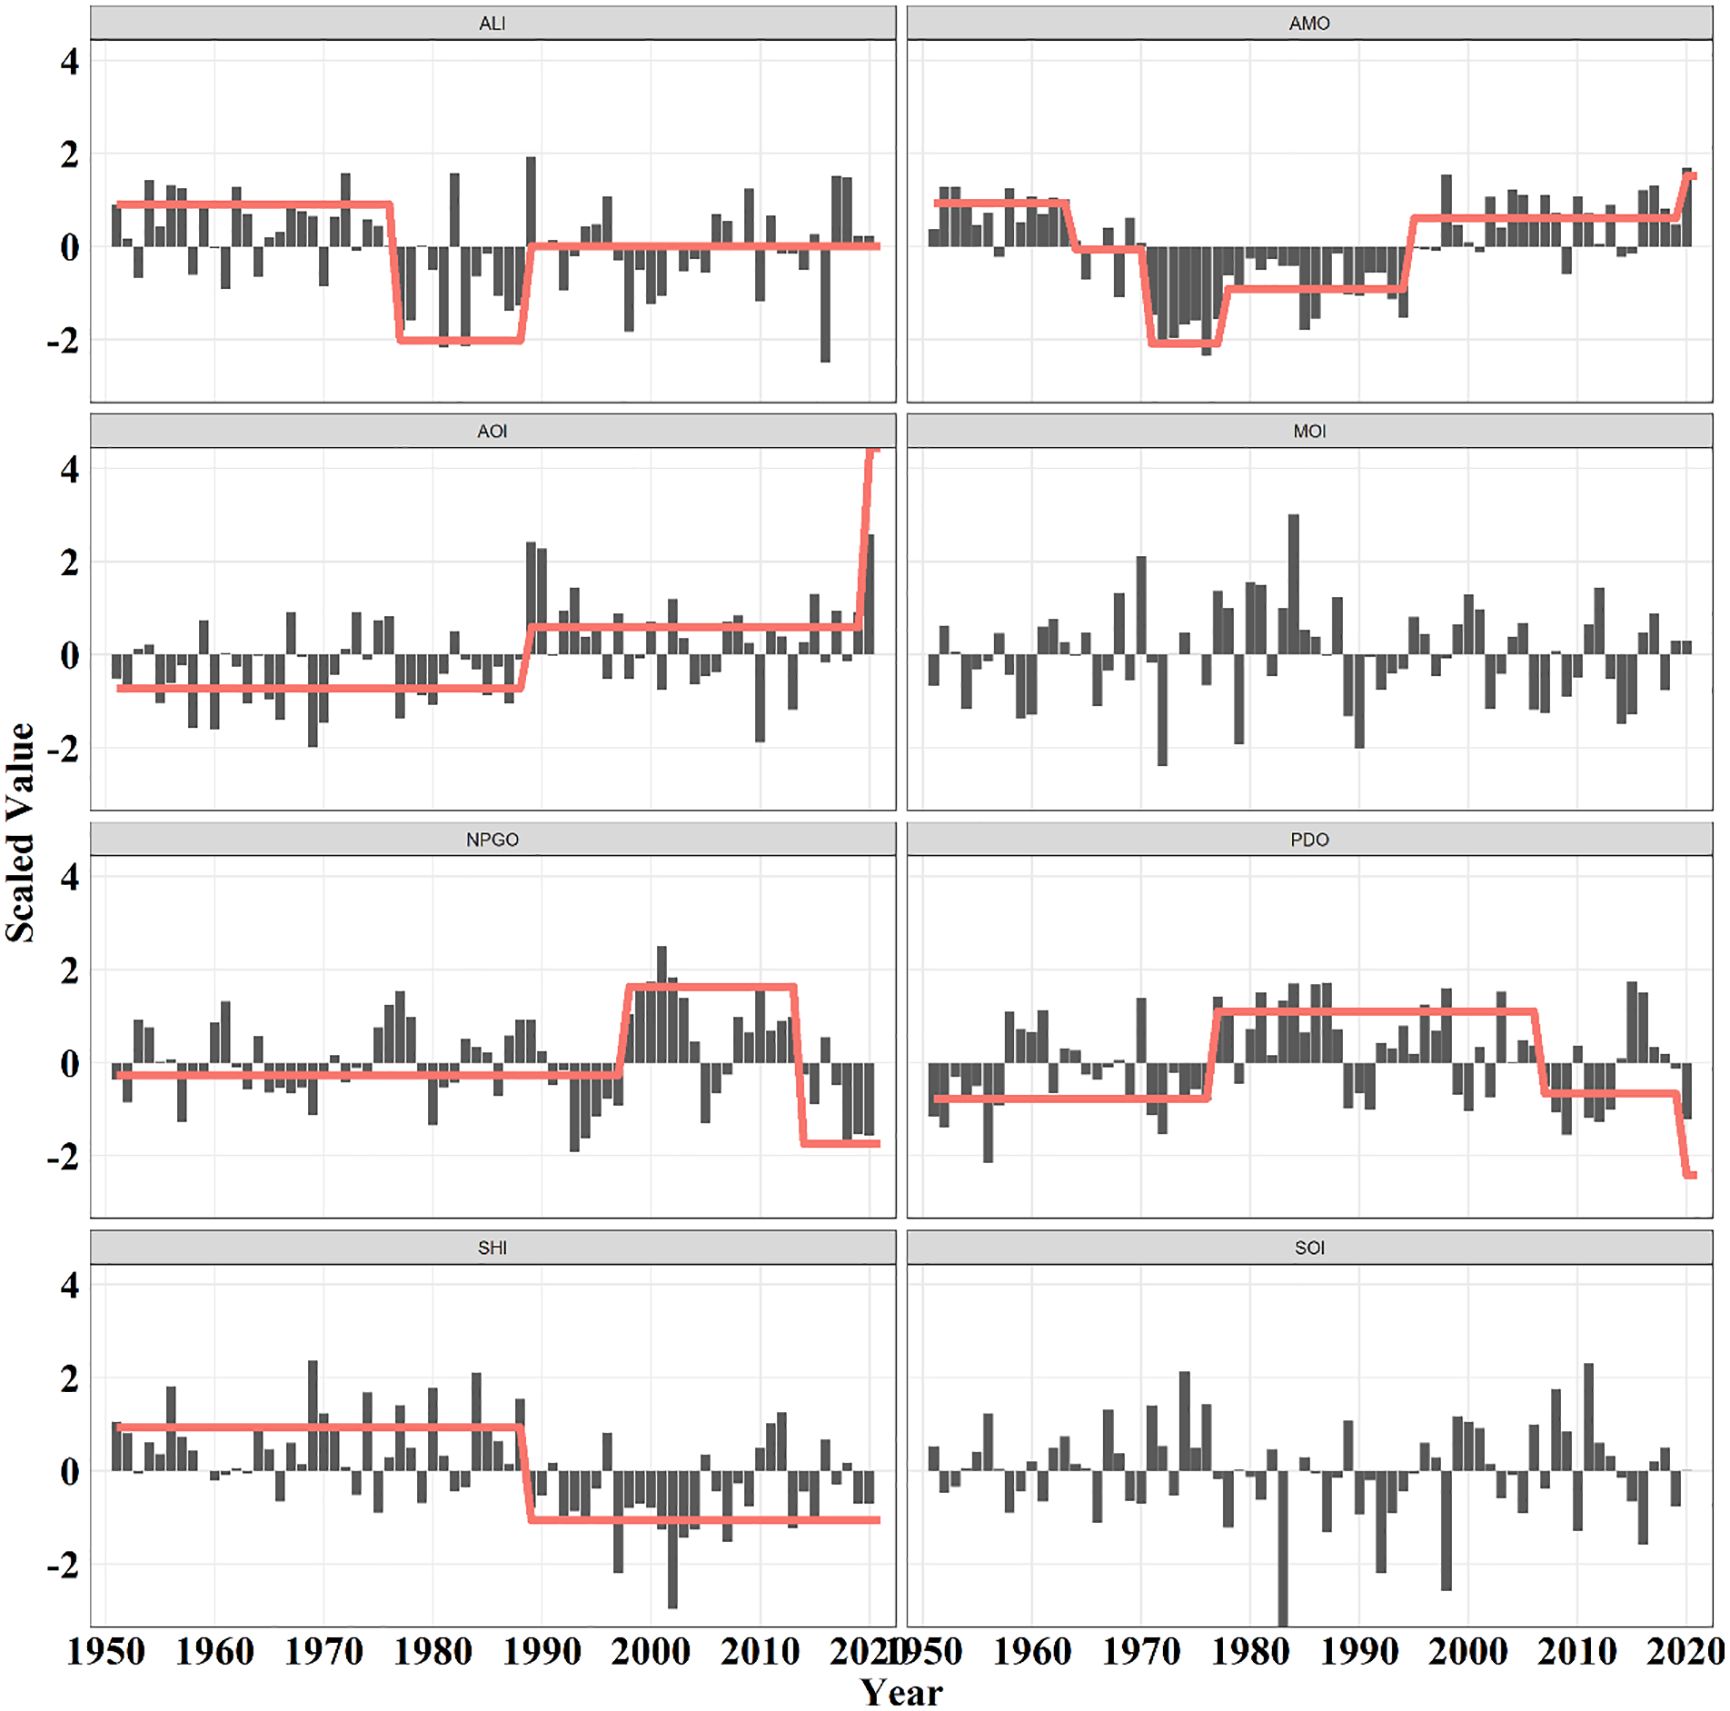
Figure 2. Trajectories of scaled climatic indices. Vertical lines and texts represent the time nodes of the regime shifts, while horizontal lines indicate the regime means determined by the breakpoint analysis.
The first four PCs/EOFs well represented the regional SST variability, explaining approximately 74.27%, 70.86%, 71.34%, and 74.47% of the total variance for the winter, spring, summer, and autumn SST fields, respectively (Supplementary Figures S4-S7). Winter PC1 (winPC1) explained 35.49% of the total variance, increasing dramatically in the late 1980s. Spring PC1 (sprPC1) explained approximately 30% of the total variance, increasing dramatically in the late 1980s and the late 1990s. Summer PC1 (sumPC1) explained approximately 32% of the total variance, showing a decrease in the late 1970s. Autumn PC1 (autPC1) explained approximately 37% of the total variance, increasing dramatically in the late 1980s. Both PC3 and PC4 featured interannual fluctuations without long-term trends.
The spatial modes of the SST fields showed that both EOF1 represented homogeneous patterns (Supplementary Figures S4-S7). The winter, summer, and autumn EOF2 showed meridional differences with inverse loadings between the subtropical and temperate zones, while spring EOF2 showed different patterns. Winter EOF3 indicated zonal differences with negative loadings in the Oyashio Extension and positive loadings in the Kuroshio Extension area. In contrast, spring EOF3 had negative loadings in the subtropics and positive loadings in the temperate zone. Winter EOF4 showed negative loadings in the oceanic area and positive loadings in the coastal area, as well as spring EOF4.
3.2 Correlations between climate/environment and Pacific saury
The CIs and PCs had intra- and inter-associations (Figure 3). There was a significant positive correlation between AMO and winPC1, sprPC1, and sumPC1. PDO was positively correlated with winPC2 and sprPC3, but showed negative correlations with winPC4, sprPC1/2/4, sumPC3, and autPC3. NPGO showed positive correlations with winPC2 and sumPC4. AOI only had positive correlations with winPC1, sprPC1, and autPC1, but showed a negative correlation with sprPC3. SHI showed negative correlations with winPC1 and sprPC4. MOI only showed negative correlations with winPC1 and sprPC2. SOI had positive correlations with winPC3/4, sprPC4, and sumPC3 and a negative correlation with sprPC3. ALI showed positive correlations with winPC4 and sprPC2/4, which is different compared with PDO. The CIs could be divided into two groups. The first includes SHI and AOI, which were negatively correlated (r = −0.46, p < 0.001); the second consists of ALI, PDO, SOI, and NPGO, which were correlated to different extents with each other.
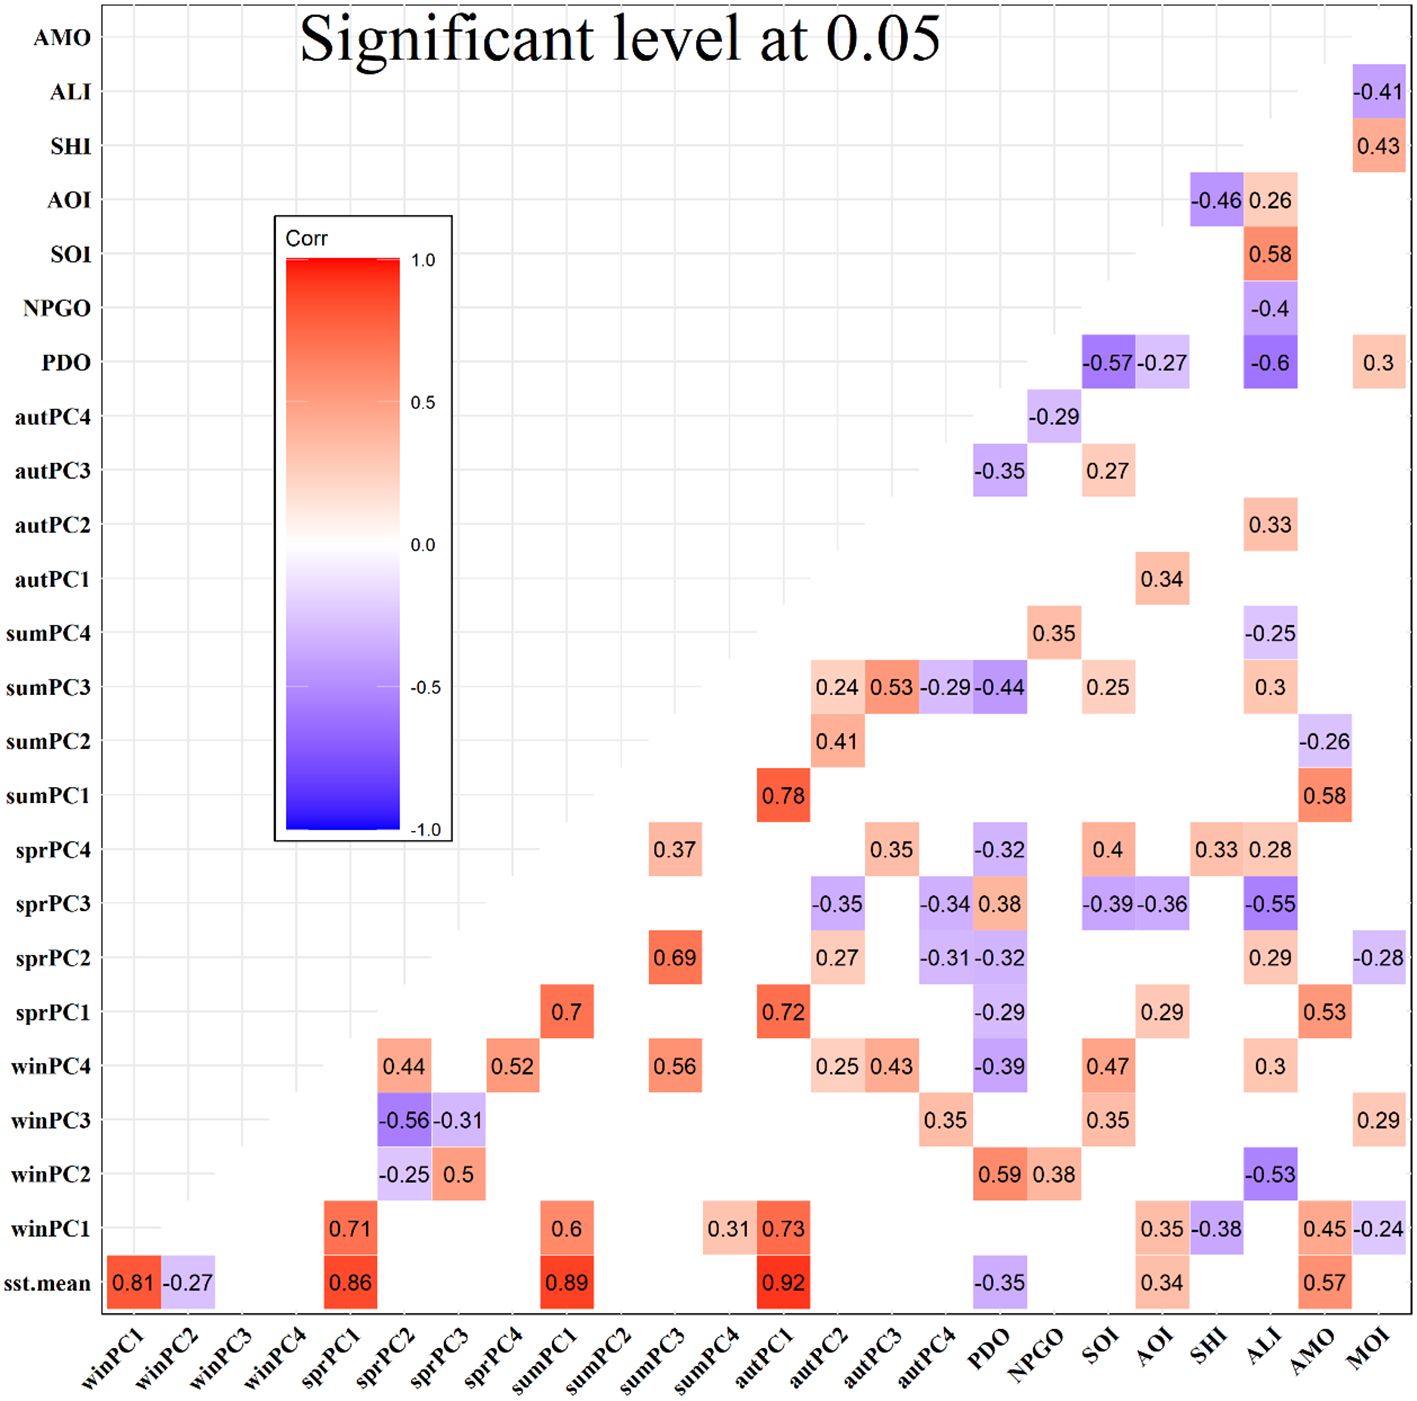
Figure 3. Correlations between climatic indices and principal components. Coloured squares indicate significant correlations with a significant level of 0.05.
The correlation analysis between the water temperature and the CIs in the Northwest Pacific revealed a negative correlation between PDO and SHI with water temperature, while AOI and AMO exhibited positive correlations. The remaining indices showed either weak or insignificant correlations. Specifically, PDO was primarily associated with water temperatures in Oyashio and the eastern fishing areas, whereas SHI and AMO were linked to water temperatures in the region affected by Kuroshio (Figure 4).
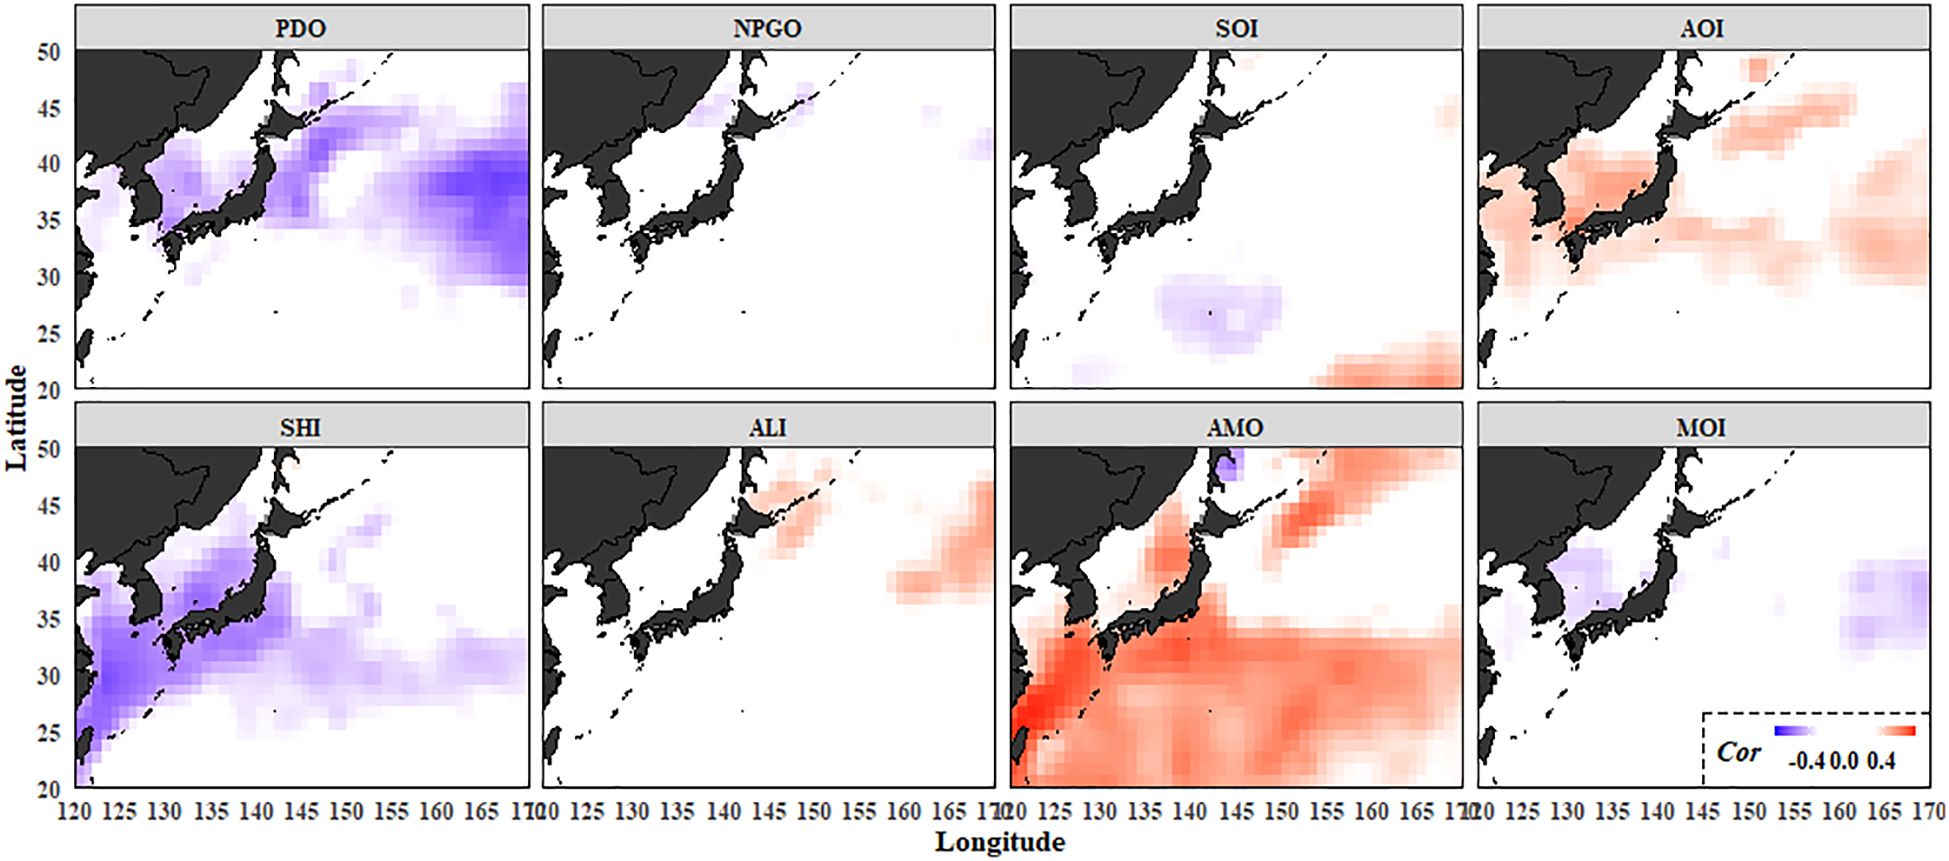
Figure 4. Maps of the correlation coefficients (Cor) between the winter (January–March) sea surface temperature (SST) field and the climatic indices. PDO, Pacific decadal oscillation; NPGO, North Pacific gyre oscillation; AOI, Arctic Oscillation Index; SHI, Siberian High Index; MOI, East Asian Monsoon Index; SOI, Southern Oscillation Index; ALI, Aleutian Low Index; AMO, Atlantic multidecadal oscillation. Colored grids indicate significant correlations (p < 0.05).
The catch and CPUE data were individually correlated with the water temperature data. The CPUE data were observed to exhibit a significant negative correlation with water temperature, predominantly in the high seas region of the Pacific saury fishing grounds (Figure 5).
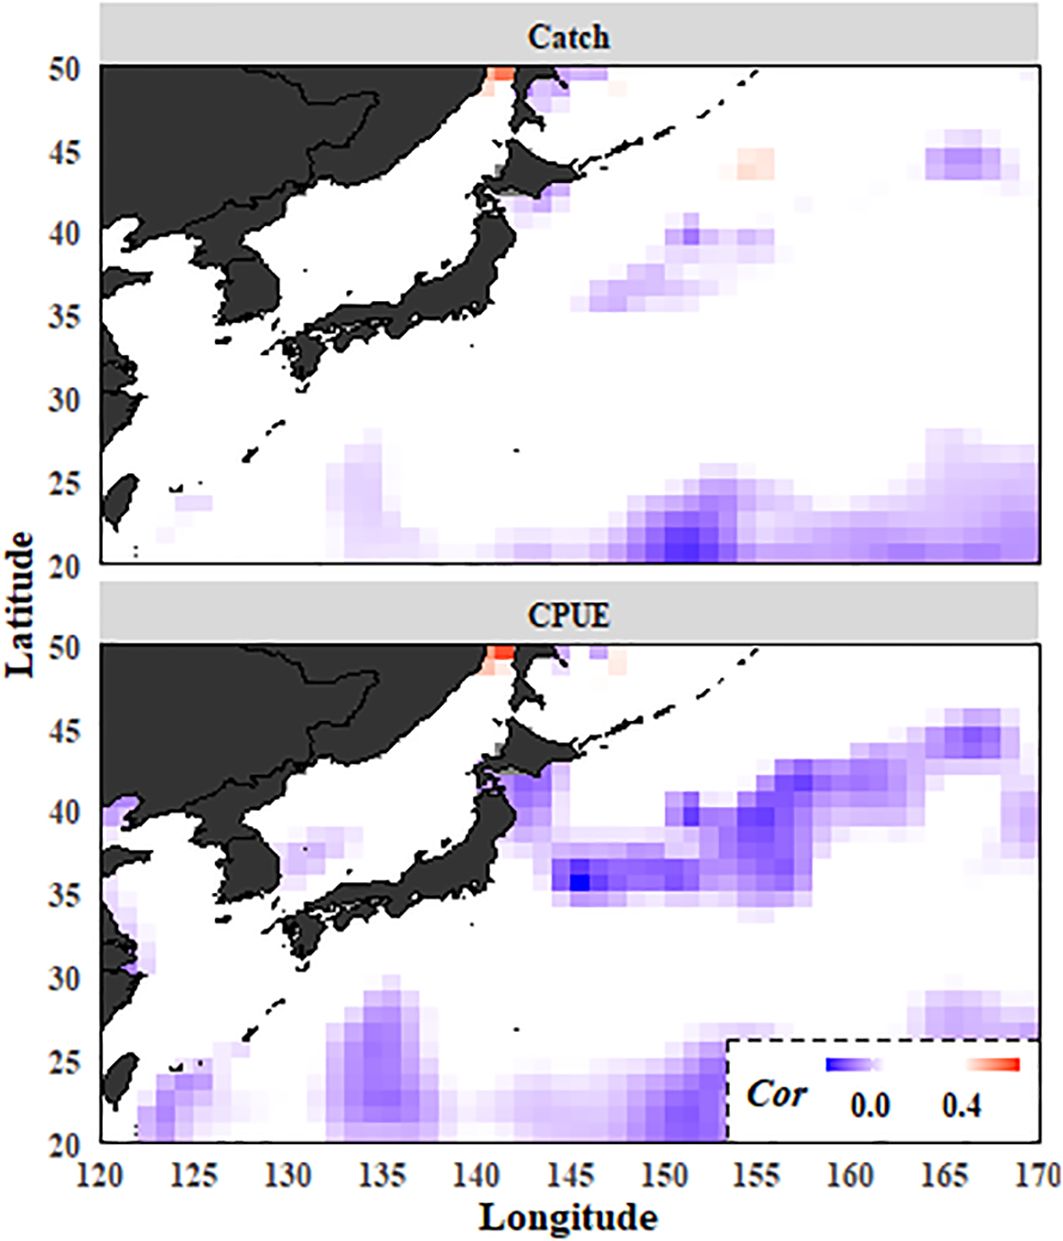
Figure 5. Maps of the correlation coefficients (Cor) between winter (January–March) sea surface temperature (SST) field and Pacific saury. Colored grids indicate significant correlations (p < 0.05).
3.3 Non-stationary relationship between climate/environment and Pacific saury
For all the models relating Pacific saury to the CIs and EOFs, the non-stationary model generally resulted in a lower gCV. Model comparisons among the stationary (GAM) and non-stationary (TGAM) formulations supported the non-stationary relationship between Pacific saury abundance and the CIs and PCs within the northwestern Pacific Ocean (Figure 6). According to the variations in the GCV, threshold years were selected to distinguish eras for fitting driver–response relationships separately (Figure 6). TGAMs provided a better fit for the relationship between Pacific catch and physical drivers than did GAMs. Different years were distinguished by the threshold year based on the variations in the GCV, indicating an alteration in the relationship between Pacific saury catch and the physical drivers. The fitted curves of the best TGAMs for the periods before and after the selected threshold years showed different patterns, implying that the biology–environment relationships were altered across the threshold years (Figure 6). The best-fit model for catch is a non-stationary model with SSTlag0 as the driver and with thresholds in 1987. The best-fit TGAM curves exhibited distinct patterns before and after the selected threshold years, indicating a shift in the relationship between Pacific saury catches and the physical drivers across these threshold years.
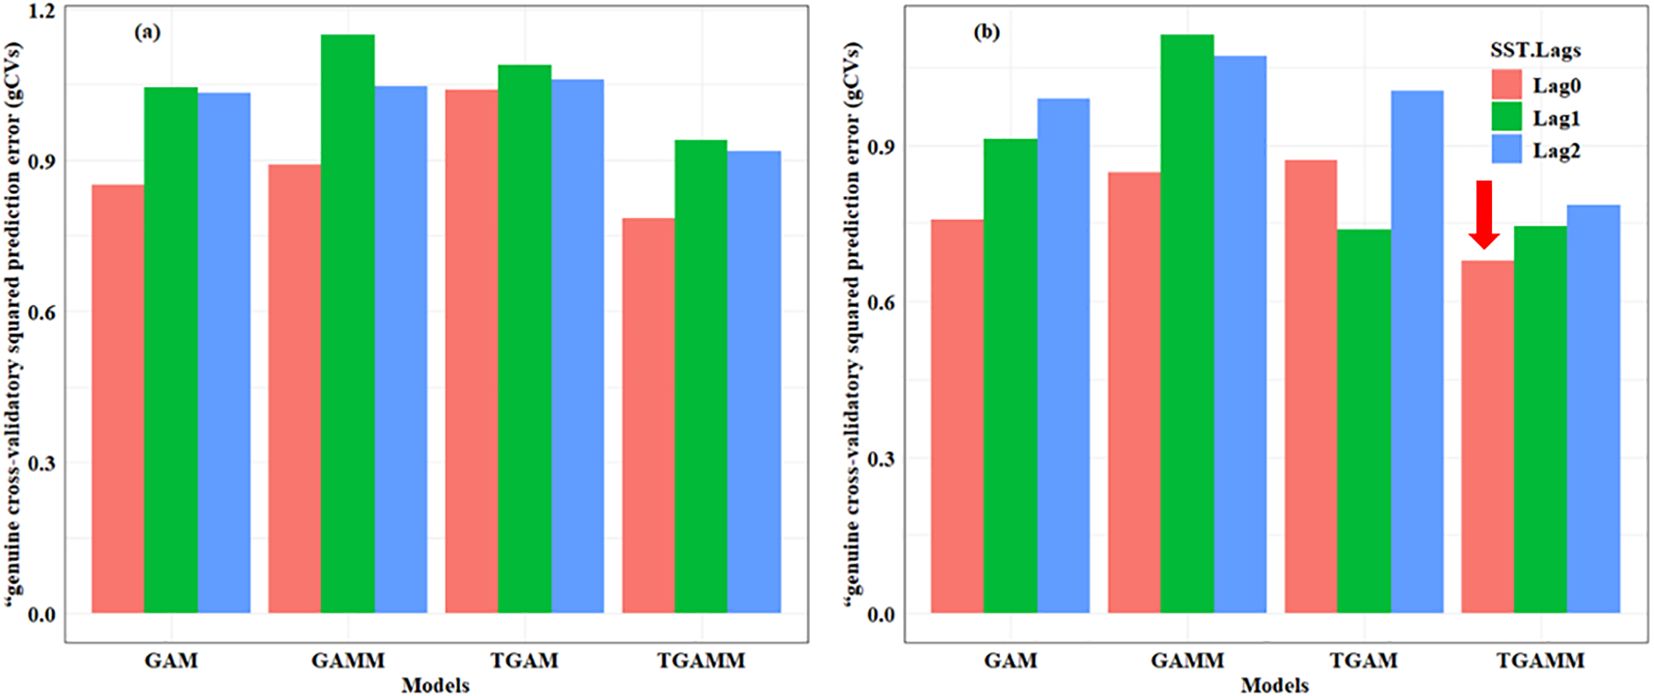
Figure 6. Comparisons of the “genuine” cross-validatory squared prediction errors (gCVs) of the generalized additive models (GAMs), generalized additive mixed models (GAMMs), threshold general additive models (TGAMs), and threshold generalized additive mixed models (TGAMMs) with the sea surface temperatures and their lags (0–2 years) as explanatory variables for catch (a) and catch per unit effort (CPUE) (b), represented by different colors. Arrows indicate the best-fit models selected using both the minimum gCV and the plausibility of the trajectory criteria.
As the CPUE data showed a stronger correlation with water temperature, this study analyzed CPUE data with climate and environmental data using vcGAMs. Non-stationary models achieved better performance than the stationary models when relating the CPUE to the climatic drivers (Table 1). The best stationary model was the one including winPC1 and NPGO as drivers, explaining 33.8% of the CPUE variance. Under the case of invariant drivers, considering non-stationarity increased the amount of variance explained up to 90.9% when the breakpoints increased to 3 (Table 1 and Figure 7). The best model with invariant drivers was the one that identified PC1.win and SHI as the most influential drivers with breakpoints in 1988, 2001, and 2009 (Table 1 and Figure 7).
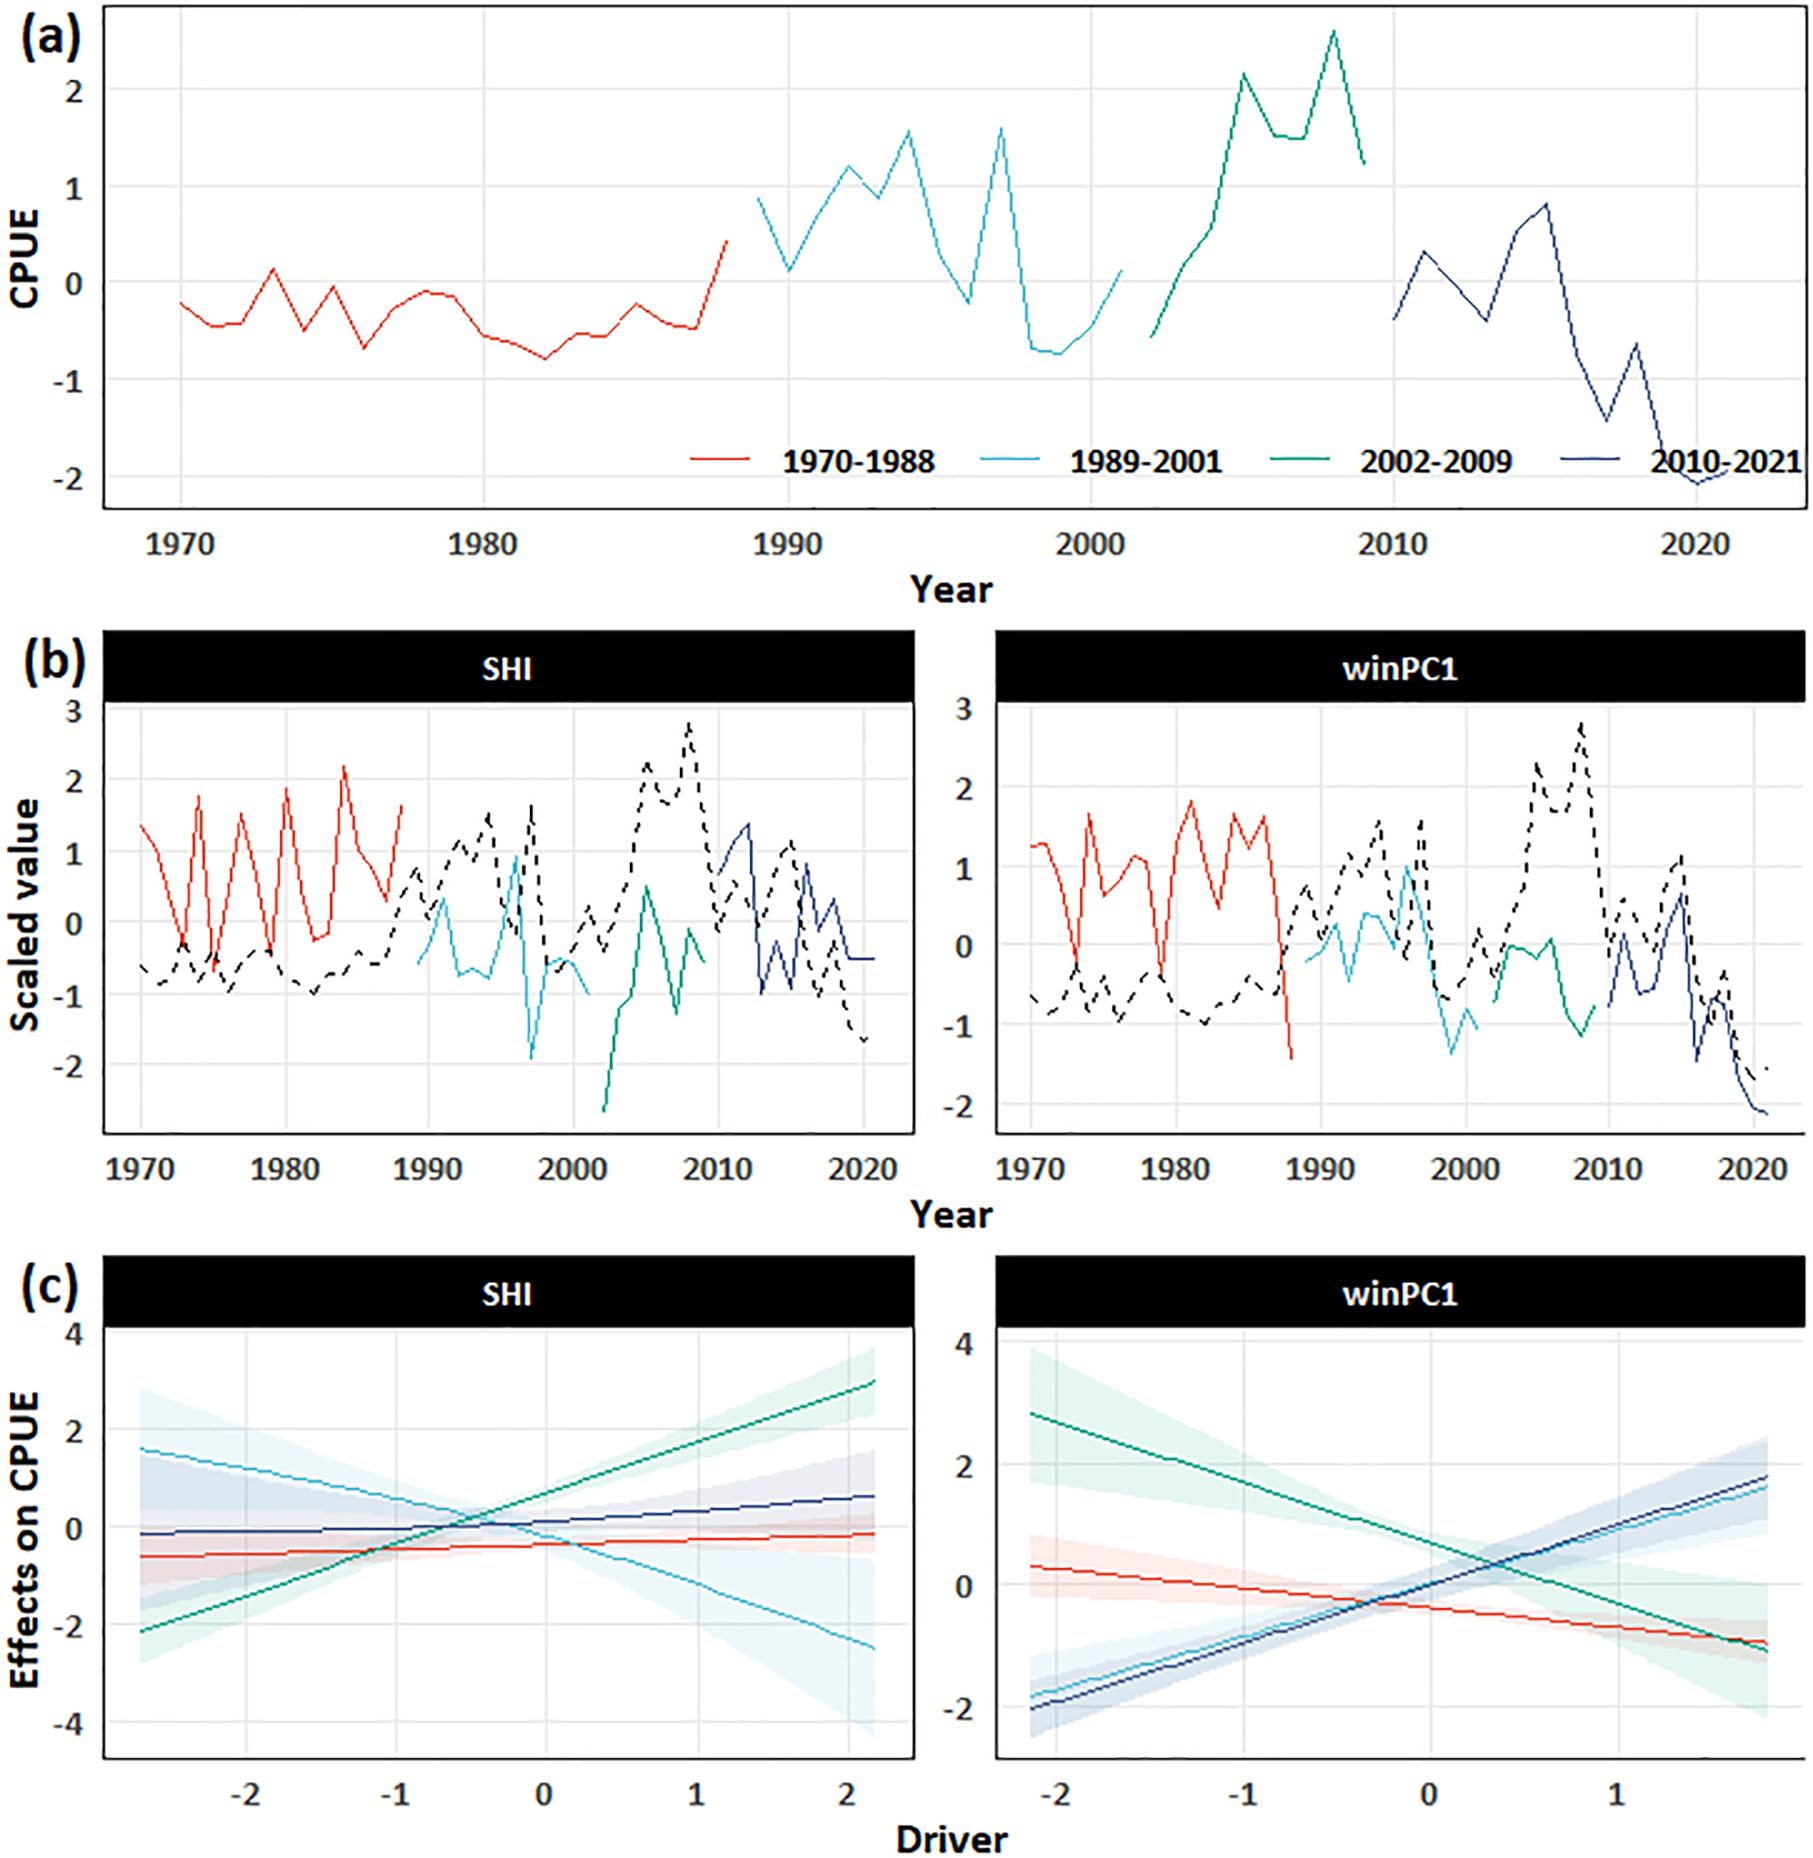
Figure 7. Results of the final best model show. (a) Solid lines represent original residuals, and dashed lines represent fitted values. (b) Climatic and environment drivers. (c) Effect of climatic and environmental drivers on the residuals. Colors indicate different periods divided by the final best model. CPUE, catch per unit effort; SHI, Siberian High Index.
4 Discussion
4.1 Climate change and variability and their effects on the thermal changes in the northwestern Pacific
To explore the long-term variations in the catch of small pelagic fishes in the northwestern Pacific and the response patterns to driving factors, Pacific saury were chosen as the research targets in combination with climate and environment data.
Low-frequency shifts in the North Pacific climate have significant impacts on marine ecosystems (Di Lorenzo et al., 2008; Hare and Mantua, 2000). Climate change could affect the variability of the Siberian High pressure systems and the monsoon and further the regional thermal changes (Hsu et al., 2013; Miao et al., 2020; Zhao et al., 2018). The PDO and NPGO were closely associated with the thermal and nutrient variations in the North Pacific. Driven by the Aleutian Low [represented by the North Pacific Index (NPI)], they have been shown to have great biological effects in the northeastern North Pacific (Di Lorenzo et al., 2008; Newman et al., 2016; Overland et al., 2008). However, they showed little correlation with the winter SST field in the tropical northwestern North Pacific, which may indicate their weak effects on the biological variability in this region. The SHI- and ALI-dominant patterns affected the different modes of the regional SST fields. The SHI was correlated with the PC1s of the winter and spring SST fields, which represented the primary pattern in the regional thermal changes. It should be noted that the PC1s of the winter and spring SST fields were tightly correlated with the mean winter and spring SSTs, respectively, suggesting that the PC1s also contain long-term warming signals (Figure 3) (Zhang et al., 2010). The ALI was associated with the winter PC2 (the primary decadal-scale variability modes) and the spring PC3, both highlighting inverse patterns in mid-latitude and tropical areas. These results indicate that thermal changes in the northwestern Pacific were composite processes affected by different climate variability modes and climate change.
4.2 Non-stationary climatic and environment effects on Pacific saury population dynamics
We employed an analytical framework that integrated both traditional and advanced statistical methods. Traditional statistical methods including EOF, STARS, and correlation analyses have been extensively used in research works on climate-induced small pelagic fish variability in the North Pacific (Chang et al., 2019; Ma et al., 2022; Wang et al., 2022). Advanced methods including TGAMs and vcGAMs thrived in recent years with their unique characteristics that cater to the present research demands (Ma et al., 2023; Feng et al., 2024). TGAMs consider the non-stationary driver–response relationships and have been successfully used in determining the critical transitions and assessing ecosystem resilience. Therefore, the analytical framework serves as an effective approach in investigating climate-induced Pacific saury variability.
Non-stationarity in the relationships between climatic/environmental drivers and Pacific saury responses was verified by our research. Previous studies presented clear evidence for the non-stationarity in the climate–biology relationships in the northeastern North Pacific (Litzow et al., 2018, 2019b; Puerta et al., 2019). The long-term population dynamics of Pacific saury were subject to climatic and environmental effects. These effects were non-stationary with time-dependent drivers, intensities, and functional relationships (Figure 7). Significant interannual and interdecadal variations in the Pacific saury catch were identified, which strongly respond to climate and environmental changes, and the response patterns showed differences with other small pelagic fishes in the northwestern Pacific such as sardine (Figures 5, 7; Table 1) (Ma et al., 2023). Favorable climatic conditions in the 1980s sustained high-level abundance for sardine, while the abundance of Pacific saury was stable. Strong negative density-dependent and climatic effects led to the sardine collapse in the 1990s, and Pacific saury also decreased due to the unsuitable environment. Negative triple effects, particularly the high fishing pressure, restricted the sardine increase in the 2000s. Pacific saury showed an increasing trend in abundance with suitable environment. Suitable climatic conditions accompanied by low fishing pressure contributed to the population recovery in the 2010s, while Pacific saury showed a decreasing trend with the unsuitable environment, which is different from sardine. The main reasons for the trend difference between sardine and Pacific saury may be their different traits and the fishing pressure. The Pacific saury fishery had a low fishing effort in the 2000s and an increased fishing effort in the 2010s, which is different from that of sardine fishery.
In addition, our results indicate the presence of non-stationarity in the fish–environment relationships in the Pacific areas, providing evidence for the widespread non-stationarity in the climate-induced biological variability patterns in the North Pacific. A global-scale climatic regime shift occurred in the late 1980s with considerable ecological effects (Reid et al., 2016). However, it is difficult to tackle the impact of fishing as the effects of fishing pressure and climate variability often interact, making them hard to distinguish. It is well known that winter is the main spawning season for most species in the Kuroshio ecosystem, such as yellowtail, blue mackerel, Japanese sardine, and Pacific saury (Liu et al., 2019; Tian et al., 2012; Yasuda et al., 1999; Yukami et al., 2009; Wang et al., 2021). Utilizing a mixture of two linear regression models revealed that the variability in the survey CPUE was positively correlated with the winter SST of the previous year in the Kuroshio Recirculation Region (KR) throughout the survey period, except for 1994–2002 (Ichii et al., 2018).
Both the biomass and the catch of Pacific saury in the northwestern North Pacific have declined largely since the 2010s with increasing pressure from Mainland China and Taiwan, raising the big concern of fishing impact on the population dynamics. The main objective of this study was to investigate the non-stationary relationship between climate and environmental factors and the population dynamics of Pacific saury without considering the fishing pressure factor. Yatsu et al. (2021) hypothesized that the abundance variability of Pacific saury in 1982–2018 was driven by environmental factors and fishing, with the latter exerting more adverse effects after 2016. Recent studies have demonstrated that rather than increased fishing effort, unfavorable conditions both in the spawning ground in Kuroshio waters and the nursery ground in Oyashio waters resulted in the large decline in the catch and biomass of Pacific saury (Liu et al., 2019, 2022; Xing et al., 2022).
There is abundant literature on the role of climate forcing in the biological variability in the North Pacific (Lan et al., 2014; Li et al., 2019; Overland et al., 2008). Most of these studies, with some exceptions such as that of Litzow et al. (2018), modeled relationships among climatic, oceanic, and biological variables as stationary (Wolkovich et al., 2014). However, our research clearly pointed to the existence of non-stationarity in the relationships between the physical drivers and the biological responses. The decreasing collinearity in the environmental variables caused by declines in the variances of pressure systems seems to be an inducement of the non-stationary relationships (Litzow et al., 2019; Litzow et al., 2020a, b). In addition, the accurate recognition of climate states (or eras) is highlighted for its crucial role in the identification of non-stationarity in environment–community relationships. Furthermore, analytical techniques considering non-stationarity achieved better fitness than traditional techniques with stationary assumptions; thus, these techniques are desired for future research. Abandoning the assumptions of stationary relationships among physical and biological variables may be an important step for the understanding of climate-induced biological dynamics.
Non-stationarity was identified with threshold years in the 1990s in the Tsushima area and in the 1980s in the Pacific area as a possible result of the declined variances in the Siberian High and Aleutian Low, which emphasized the important role of the Siberian High in controlling the environment of the Northwest Pacific Ocean (Ma et al., 2021b, 2023). Our study also highlights the importance of the Siberian High pressure index, which has received little attention in previous studies.
4.3 Implication for Pacific saury fishery management in a frequently changing climate
There were no other long-term time series available for fishery-independent or fishery-dependent biomass indices to be supplemented to give more confidence on the results of this study. Therefore, in this study, the catch data and the CPUE data were utilized as proxies for species relative abundance or supplementary indicators to analyze the response of species fishery resources to large-scale climate and regional environmental variations. The variations in species catch are affected by several factors (fishery factors such as the fishing intensity and fishing methods, among others), and the biological characteristics of species (e.g., migration, among others) also influence the catch, except for climate and environment (Yatsu et al., 2021). An expansion in the distribution of potential competitors (especially Japanese sardine) can alter the distribution of Pacific saury with regard to SST (Fuji et al., 2023). There is the potential controversy regarding whether the catch data reflect the abundance of marine species (Cheung et al., 2013). However, the catch data may provide a better description of the actual trends of different species under appropriate conditions (Pauly and Zeller, 2016). The non-stationary effects of climatic drivers on the population dynamics of Pacific saury pose great challenges to the management of Pacific saury fisheries. Management targets for fishing mortality and spawning biomass have been calculated by assuming stationary population processes. However, this stationary assumption may be violated under climate change (Szuwalski and Hollowed, 2016). Non-stationary population processes can introduce bias into the estimates of biomass and target fishing mortalities in stock assessments; therefore, frameworks that incorporate non-stationary effects into management strategies have become more appealing.
Favorable climatic conditions may alleviate the impacts of high fishing effort, while unfavorable climatic conditions may exacerbate the consequences of low fishing effort (Qiu et al., 2010). This suggests that contemporaneous climatic conditions should be considered when developing management strategies. Incorporating non-stationary climatic effects into the assessment and management of Pacific saury requires rapid recognition of the climate regimes and effective climatic drivers. However, it is often difficult to foresee elusive tipping points of these climate regimes and climatic drivers. Our hypothesis that the alterations in effective climatic drivers are driven by variations in the strengths of the Siberian High and Aleutian Low pressure systems would make it possible to predict important climatic drivers under future climate. Here, the strengths of pressure systems are defined by their pressure levels (anomalies), where higher values correspond to the strong phase of high-pressure systems and lower values correspond to the strong phase of low-pressure systems (Shi et al., 2025). Therefore, monitoring the strengths of pressure systems is realizable and recommended. In addition, anthropogenic activities are expected to result in the widespread emergence of novel climates along with increasing ecological surprises by the end of this century (Williams and Jackson, 2007). Intensive investigations into biological responses to novel climates are essential for enhancing the accuracy of population dynamics predictions and facilitating the development of adaptive management strategies in the context of climate change (Rogers et al., 2019; Schartup et al., 2019).
Data availability statement
The raw data supporting the conclusions of this article will be made available by the authors, without undue reservation.
Author contributions
CC: Conceptualization, Data curation, Formal analysis, Investigation, Methodology, Visualization, Writing – review & editing, Writing – original draft. SM: Conceptualization, Data curation, Formal analysis, Funding acquisition, Investigation, Methodology, Project administration, Resources, Software, Supervision, Validation, Visualization, Writing – original draft, Writing – review & editing. YL: Conceptualization, Data curation, Formal analysis, Funding acquisition, Investigation, Methodology, Project administration, Resources, Software, Supervision, Validation, Visualization, Writing – original draft, Writing – review & editing. HT: Writing – review & editing. SL: Methodology, Resources, Supervision, Writing – review & editing. JL: Supervision, Validation, Writing – review & editing. YT: Conceptualization, Data curation, Formal analysis, Funding acquisition, Investigation, Methodology, Project administration, Resources, Software, Supervision, Validation, Visualization, Writing – original draft, Writing – review & editing.
Funding
The author(s) declare that financial support was received for the research and/or publication of this article. This work was supported by the National Key R&D Program of China (No. 2023YFD2401300) and the National Natural Science Foundation of China (NSFC) [grant numbers 42376100, 42206085, 41930534].
Acknowledgments
We appreciate Dr. Suam Kim (Pukyong National University) for valuable discussions, comments, and advice on the manuscript. We appreciate Dr. Yoshiro Watanabe (The University of Tokyo) for his insightful comments on early manuscript.
Conflict of interest
The authors declare that the research was conducted in the absence of any commercial or financial relationships that could be construed as a potential conflict of interest.
The author(s) declared that they were an editorial board member of Frontiers, at the time of submission. This had no impact on the peer review process and the final decision.
Generative AI statement
The author(s) declare that no Generative AI was used in the creation of this manuscript.
Publisher’s note
All claims expressed in this article are solely those of the authors and do not necessarily represent those of their affiliated organizations, or those of the publisher, the editors and the reviewers. Any product that may be evaluated in this article, or claim that may be made by its manufacturer, is not guaranteed or endorsed by the publisher.
Supplementary material
The Supplementary Material for this article can be found online at: https://www.frontiersin.org/articles/10.3389/fmars.2025.1561066/full#supplementary-material
References
Alheit J. and Bakun A. (2010). Population synchronies within and between ocean basins: Apparent teleconnections and implications as to physical–biological linkage mechanisms. J. Mar. Syst. 79, 267–285. doi: 10.1016/j.jmarsys.2008.11.029
Alheit J. and Peck M. A. (2019). Drivers of dynamics of small pelagic fish resources: biology, management and human factors. Mar. Ecol. Prog. Ser. 617-618, 1–6. doi: 10.3354/meps12985
Bakun A. (2006). Wasp-waist populations and marine ecosystem dynamics: navigating the “predator pit” topographies. Prog. Oceanogr. 68, 271–288. doi: 10.1016/j.pocean.2006.02.004
Bretherton C. S., Widmann M., Dymnikov V. P., Wallace J. M., and Bladé I. (1999). The effective number of spatial degrees of freedom of a time-varying field. J. Clim. 12, 1990–2009. doi: 10.1175/1520-0442(1999)012<1990:TENOSD>2.0.CO;2
Casini M., Hjelm J., Molinero J., Lövgren J., Cardinale M., Bartolino V., et al. (2009). Trophic cascades promote threshold-like shifts in pelagic marine ecosystems. Proc. Natl. Acad. Sci. 106, 197–202. doi: 10.1073/pnas.0806649105
Chang Y. J., Lan K. W., Walsh W. A., Hsu J., and Hsieh C. H. (2019). Modelling the impacts of environmental variation on habitat suitability for Pacific saury in the northwestern Pacific Ocean. Fish. Oceanogr. 28, 291–304. doi: 10.1111/fog.12408
Cheung W. W. L., Watson R., and Pauly D. (2013). Signature of ocean warming in global fisheries catch. Nature 497, 365–368. doi: 10.1038/nature12156
Ciannelli L., Chan K., Bailey K. M., and Stenseth N. C. (2004). Nonadditive effects of the environment on the survival of a large marine fish population. Ecology 85, 3418–3427. doi: 10.1890/03-0755
Cury P., Bakun A., Crawford R. J. M., Jarre A., Quiñones R. A., Shannon L. J., et al. (2000). Small pelagics in upwelling systems: patterns of interaction and structural changes in “wasp-waist” ecosystems. ICES J. Mar. Sci. 57, 603–618. doi: 10.1006/jmsc.2000.0712
Damalas D., Sgardeli V., Vasilakopoulos P., Tserpes G., and Maravelias C. (2021). Evidence of climate-driven regime shifts in the aegean sea’s demersal resources: a study spanning six decades. Ecol. Evol. 11, 16951–16971. doi: 10.1002/ece3.8330
Di Lorenzo E., Schneider N., Cobb K. M., Franks P. J. S., Chhak K., Miller A. J., et al. (2008). North Pacific gyre oscillation links ocean climate and ecosystem change. Geophys. Res. Lett. 35, L08607. doi: 10.1029/2007GL032838
Dormann C. F., Elith J., Bacher S., Buchmann C., Carl G., Carre G., et al. (2013). Collinearity: a review of methods to deal with it and a simulation study evaluating their performance. Ecography 36, 27–46. doi: 10.1111/j.1600-0587.2012.07348.x
Erdman C. and Emerson J. W. (2008). A fast bayesian change point analysis for the segmentation of microarray data. Bioinformatics 24, 2143–2148. doi: 10.1093/bioinformatics/btn404
FAO-FIGIS (2021). Fisheries Global Information System (FIGIS). FI institutional websites (Rome: FAO Fisheries and Aquaculture Department). Available at: http://www.fao.org/fishery/statistics/global-production/query/en (Accessed October 12, 2022).
Feng Z., Li N., Chen X., Li Y., Cao J., and Yu W. (2024). Nonstationary response of commercially pelagic species in the Humboldt current ecosystem to climate variability. Rev. Fish. Biol. Fish. 34, 1599–1617. doi: 10.1007/s11160-024-09890-y
Fuji T., Nakayama S. I., Hashimoto M., Miyamoto H., Kamimura Y., Furuichi S., et al. (2023). Biological interactions potentially alter the large-scale distribution pattern of the small pelagic fish, Pacific saury Cololabis saira. Mar. Ecol. Prog. Ser. 704, 99–117. doi: 10.3354/meps14230
Golub G. H., Heath M., and Wahba G. (1979). Generalized cross-validation as a method for choosing a good ridge parameter. Technometrics 21, 215–223. doi: 10.1080/00401706.1979.10489751
Gong D. Y., Wang S. W., and Zhu J. H. (2001). East Asian winter monsoon and Arctic oscillation. Geophys. Res. Lett. 28, 2073–2076. doi: 10.1029/2000gl012311
Hannachi A., Jolliffe I. T., and Stephenson D. B. (2007). Empirical orthogonal functions and related techniques in atmospheric science: a review. Int. J. Climatol. 27, 1119–1152. doi: 10.1002/joc.1499
Hare S. R. and Mantua N. J. (2000). Empirical evidence for north pacific regime shifts in 1977 and 1989. Prog. Oceanogr. 47, 103–145. doi: 10.1016/S0079-6611(00)00033-1
Hou X., Ma S., Tian Y., and Zhang S. (2022). The effects of trans-basin climate variability on skipjack tuna in the northwest Pacific Ocean: causal and nonstationary. Front. Mar. Sci. 9. doi: 10.3389/fmars.2022.895219
Hsu P. C., Li T., Murakami H., and Kitoh A. (2013). Future change of the global monsoon revealed from 19 cmip5 models. J. Geophysical Res.: Atmospheres 118, 1247–1260. doi: 10.1002/jgrd.50145
Hurvich C. M. and Tsai C. L. (1993). A corrected akaike information criterion for vector autoregressive model selection. J. Time Ser. Anal. 14, 271–279. doi: 10.1111/j.1467-9892.1993.tb00144.x
Ichii T., Nishikawa H., Mahapatra K., Okamura H., Igarashi H., Sakai M., et al. (2018). Oceanographic factors affecting interannual recruitment variability of Pacific saury (Cololabis saira) in the central and western north pacific. Fish. Oceanogr. 27, 445–457. doi: 10.1111/fog.12265
Kakehi S., Abo J., Miyamoto H., Fuji T., Watanabe K., Yamashita H., et al. (2020). Forecasting Pacific saury (Cololabis saira) fishing grounds off Japan using a migration model driven by an ocean circulation model. Ecol. Model. 431, 109150. doi: 10.1016/j.ecolmodel.2020.109150
Kakehi S., Hashimoto M., Naya M., Ito S. I., Miyamoto H., and Suyama S. (2022). Reduced body weight of Pacific saury (Cololabis saira) causes delayed initiation of spawning migration. Fish. Oceanogr. 31, 319–332. doi: 10.1111/fog.12579
Kirby R. R. and Beaugrand G. (2009). Trophic amplification of climate warming. Proc. R. Soc. B: Biol. Sci. 276, 4095–4103. doi: 10.1098/rspb.2009.1320
Lan K., Lee M., Zhang C. I., Wang P., Wu L., and Lee K. (2014). Effects of climate variability and climate change on the fishing conditions for grey mullet (Mugil cephalus l.) In the Taiwan strait. Clim. Change 126, 189–202. doi: 10.1007/s10584-014-1208-y
Lee D. Y., Yeh S., Jeong H., and Park H. (2025). Changes in the role of Pacific decadal oscillation on East Asian winter surface temperature. Environ. Res. Lett. 20, 24062. doi: 10.1088/1748-9326/adaf45
Li L., Hollowed A. B., Cokelet E. D., Barbeaux S. J., Bond N. A., Keller A. A., et al. (2019). Subregional differences in groundfish distributional responses to anomalous ocean bottom temperatures in the northeast pacific. Glob. Change Biol. 25, 2560–2575. doi: 10.1111/gcb.14676
Litzow M. A., Ciannelli L., Cunningham C. J., Johnson B., and Puerta P. (2019a). Nonstationary effects of ocean temperature on Pacific salmon productivity. Can. J. Fish. Aquat. Sci. 76, 1923–1928. doi: 10.1139/cjfas-2019-0120
Litzow M. A., Ciannelli L., Puerta P., Wettstein J. J., Rykaczewski R. R., and Opiekun M. (2018). Non-stationary climate-salmon relationships in the Gulf of Alaska. Proc. R. Soc B 285, 20181855. doi: 10.1098/rspb.2018.1855
Litzow M. A., Ciannelli L., Puerta P., Wettstein J. J., Rykaczewski R. R., and Opiekun M. (2019b). Nonstationary environmental and community relationships in the north Pacific Ocean. Ecology 100(8), e02760. doi: 10.1002/ecy.2760
Litzow M. A., Hunsicker M. E., Bond N. A., Burke B. J., Cunningham C. J., Gosselin J. L., et al. (2020a). The changing physical and ecological meanings of north Pacific Ocean climate indices. Proc. Natl. Acad. Sci. 117(14), 7665–7671. doi: 10.1073/pnas.1921266117
Litzow M. A., Malick M. J., Bond N. A., Cunningham C. J., Gosselin J. L., and Ward E. J. (2020b). Quantifying a novel climate through changes in PDO- climate and PDO- salmon relationships. Geophysical Res. Lett. 47, e2020GL087972. doi: 10.1029/2020GL087972
Litzow M. A. and Mueter F. J. (2014). Assessing the ecological importance of climate regime shifts: an approach from the North Pacific Ocean. Prog.Oceanogr 120, 110–119. doi: 10.1016/j.pocean.2013.08.003
Liu S., Liu Y., Fu C., Yan L., Xu Y., Wan R., et al. (2019). Using novel spawning ground indices to analyze the effects of climate change on pacific saury abundance. J. Mar. Syst. 191, 13–23. doi: 10.1016/j.jmarsys.2018.12.007
Liu S., Liu Y., Li J., Cao C., Tian H., Li W., et al. (2022). Effects of oceanographic environment on the distribution and migration of Pacific saury (Cololabis saira) during main fishing season. Sci. Rep. 12, 13585. doi: 10.1038/s41598-022-17786-9
Ma S., Fu C., Li J., Sun P., Liu Y., Ye Z., et al. (2023). Non-stationary effects of multiple drivers on the dynamics of Japanese sardine (Sardinops melanostictus,Clupeidae). Fish. Fish. 24, 40–55. doi: 10.1111/faf.12708
Ma S., Liu D., Tian Y., Fu C., Li J., Ju P., et al. (2021a). Critical transitions and ecological resilience of large marine ecosystems in the northwestern pacific in response to global warming. Glob. Change Biol. 27, 5310–5328. doi: 10.1111/gcb.15815
Ma S., Tian Y., Fu C., Yu H., Li J., Liu Y., et al. (2021b). Climate-induced nonlinearity in pelagic communities and non-stationary relationships with physical drivers in the Kuroshio ecosystem. Fish. Fish. 22, 1–17. doi: 10.1111/faf.12502
Ma S., Tian Y., Li J., Ju P., Sun P., Ye Z., et al. (2022). Incorporating thermal niche to benefit understanding climate-induced biological variability in small pelagic fishes in the Kuroshio ecosystem. Fish. Oceanogr. 31, 172–190. doi: 10.1111/fog.12570
Ma S., Tian Y., Li J., Yu H., Cheng J., Sun P., et al. (2020). Climate variability patterns and their ecological effects on ecosystems in the northwestern north pacific. Front. Mar. Sci. 7. doi: 10.3389/fmars.2020.546882
Ma S., Liu Y., Li J., Fu C., Ye Z., Sun P., et al. (2019). Climate-induced long-term variations in ecosystem structure and atmosphere-ocean-ecosystem processes in the yellow sea and east china sea. Prog. Oceanogr. 175, 183–197. doi: 10.1016/j.pocean.2019.04.008
Mantua N. J. and Hare S. R. (2002). The pacific decadal oscillation. J. Oceanogr. 58, 35–44. doi: 10.1023/A:1015820616384
Miao J. and Wang T. (2020). Decadal variations of the East Asian winter monsoon in recent decades. Atmos. Sci. Lett. 21, e960. doi: 10.1002/asl.960
Miyamoto H., Suyama S., Vijai D., Kidokoro H., Naya M., Fuji T., et al. (2019). Predicting the timing of pacific saury (Cololabis saira) immigration to Japanese fishing grounds: a new approach based on natural tags in otolith annual rings. Fish. Res. 209, 167–177. doi: 10.1016/j.fishres.2018.09.016
Miyamoto H., Vijai D., Kidokoro H., Tadokoro K., Watanabe T., Fuji T., et al. (2020). Geographic variation in feeding of pacific saury Cololabis saira in June and July in the north Pacific Ocean. Fish. Oceanogr. 29, 558–571. doi: 10.1111/fog.12495
Möllmann C., Cormon X., Funk S., Otto S. A., Schmidt J. O., Schwermer H., et al. (2021). Tipping point realized in cod fishery. Sci. Rep. 11, 14259. doi: 10.1038/s41598-021-93843-z
Newman M., Alexander M. A., Ault T. R., Cobb K. M., Deser C., Di Lorenzo E., et al. (2016). The pacific decadal oscillation, revisited. J. Clim. 29, 4399–4427. doi: 10.1175/JCLI-D-15-0508.1
Oozeki Y., Okunishi T., Takasuka A., and Ambe D. (2015). Variability in transport processes of pacific saury cololabis saira larvae leading to their broad dispersal: implications for their ecological role in the western north pacific. Prog. Oceanogr. 138, 448–458. doi: 10.1016/j.pocean.2014.05.011
Overland J., Rodionov S., Minobe S., and Bond N. (2008). North pacific regime shifts: definitions, issues and recent transitions. Prog. Oceanogr. 77, 92–102. doi: 10.1016/j.pocean.2008.03.016
Pauly D. and Zeller D. (2016). Catch reconstructions reveal that global marine fisheries catches are higher than reported and declining. Nat. Commun. 7, 10244. doi: 10.1038/ncomms10244
Puerta P., Ciannelli L., Rykaczewski R. R., Opiekun M., and Litzow M. A. (2019). Do gulf of alaska fish and crustacean populations show synchronous non-stationary responses to climate? Prog. Oceanogr. 175, 161–170. doi: 10.1016/j.pocean.2019.04.002
Pyper B. J. and Peterman R. M. (1998). Comparison of methods to account for autocorrelation in correlation analyses of fish data. Can. J. Fish. Aquat. Sci. 55, 2127–2140. doi: 10.1139/cjfas-55-9-2127
Qiu Y., Lin Z., and Wang Y. (2010). Responses of fish production to fishing and climate variability in the northern south china sea. Prog. Oceanogr. 85 (3–4), 197–212. doi: 10.1016/j.pocean.2010.02.011
Rayner N. A., Parker D. E., Horton E. B., Folland C. K., Alexander L. V., Rowell D. P., et al. (2003). Global analyses of sea surface temperature, sea ice, and night marine air temperature since the late nineteenth century. J. Geophysical Res.: Atmospheres 108, 4407. doi: 10.1029/2002JD002670
R Core Team (2020). R: A language and environment for statistical computing (R Foundation for Statistical Computing). Available at: https://www.R-project.org/.
Reid P. C., Hari R. E., Beaugrand G., Livingstone D. M., Marty C., Straile D., et al. (2016). Global impacts of the 1980s regime shift. Glob. Change Biol. 22, 682–703. doi: 10.1111/gcb.13106
Revelle W. (2022). psych: procedures for personality and psychological research. R package version 2.2.5 (Northwestern University). Available at: https://CRAN.R-project.org/package=psych.
Rodionov S. N. (2004). A sequential algorithm for testing climate regime shifts. Geophys. Res. Lett. 31, L09204. doi: 10.1029/2004GL019448
Rogers L. A., Griffin R., Young T., Fuller E., St Martin K., and Pinsky M. L. (2019). Shifting habitats expose fishing communities to risk under climate change. Nat. Clim. Chang. 9 (7), 512–516. doi: 10.1038/s41558-019-0503-z
Santos A. M. P., Chícharo A., Dos Santos A., Moita T., Oliveira P. B., Peliz Á., et al. (2007). Physical–biological interactions in the life history of small pelagic fish in the western iberia upwelling ecosystem. Prog. Oceanogr. 74, 192–209. doi: 10.1016/j.pocean.2007.04.008
Schartup A. T., Thackray C. P., Qureshi A., Dassuncao C., Gillespie K., Hanke A., et al. (2019). Climate change and overfishing increase neurotoxicant in marine predators. Nature. 572 (7771), 648–650. doi: 10.1038/s41586-019-1468-9
Shi Y., Yan L., Zhang S., Tang F., Yang S., Fan W., et al. (2025). Revealing the effects of environmental and spatio-temporal variables on changes in japanese sardine (sardinops melanostictus) high abundance fishing grounds based on interpretable machine learning approach. Front. Mar. Sci. 11, 1503292. doi: 10.3389/fmars.2024.1503292
Stirnimann L., Conversi A., and Marini S. (2019). Detection of regime shifts in the environment: testing “stars” using synthetic observed time series. Ices J. Mar. Sci. 76, 2286–2296. doi: 10.1093/icesjms/fsz148
Sun C., Kucharski F., Li J., Jin F., Kang I., and Ding R. (2017). Western tropical Pacific multidecadal variability forced by the Atlantic multidecadal oscillation. Nat. Commun. 8, 15998. doi: 10.1038/ncomms15998
Suyama S., Kurita Y., and Ueno Y. (2006). Age structure of pacific saury Cololabis saira based on observations of the hyaline zones in the otolith and length frequency distributions. Fish. Sci. 72, 742–749. doi: 10.1111/j.1444-2906.2006.01213.x
Szuwalski C. S. and Hollowed A. B. (2016). Climate change and non-stationary population processes in fisheries management. Ices J. Mar. Sci. 73, 1297–1305. doi: 10.1093/icesjms/fsv229
Thompson D. W. and Wallace J. M. (1998). The arctic oscillation signature in the wintertime geopotential height and temperature fields. Geophys. Res. Lett. 25, 1297–1300. doi: 10.1029/98gl00950
Thorson J. T., Cheng W., Hermann A. J., Ianelli J. N., Litzow M. A., O’Leary C. A., et al. (2020). Empirical orthogonal function regression: linking population biology to spatial varying environmental conditions using climate projections. Glob. Change Biol. 26, 4638–4649. doi: 10.1111/gcb.15149
Tian Y., Akamine T., and Suda M. (2003). Variations in the abundance of Pacific saury (Cololabis saira) from the northwestern Pacific in relation to oceanic-climate changes. Fisheries Res. 60, 439–454. doi: 10.1016/S0165-7836(02)00143-1
Tian Y., Fu C., Yatsu A., Watanabe Y., Liu Y., Li J., et al. (2023). Long-term variability in the fish assemblage around Japan over the last century and early warning signals of regime shifts. Fish. Fish. 24, 675–694. doi: 10.1111/faf.12754
Tian Y., Kidokoro H., Watanabe T., Igeta Y., Sakaji H., and Ino S. (2012). Response of yellowtail, seriola quinqueradiata, a key large predatory fish in the Japan sea, to sea water temperature over the last century and potential effects of global warming. J. Mar. Syst. 91, 1–10. doi: 10.1016/j.jmarsys.2011.09.002
Tian Y., Uchikawa K., Ueda Y., and Cheng J. (2014). Comparison of fluctuations in fish communities and trophic structures of ecosystems from three currents around Japan: synchronies and differences. Ices J. Mar. Sci. 71, 19–34. doi: 10.1093/icesjms/fst169
Tian Y., Ueno Y., Suda M., and Akamine T. (2002). Climate-ocean variability and the response of Pacific saury (Cololabis saira) in the northwestern Pacific during the last half century. Fisheries Sci. 68, 158–161. doi: 10.2331/fishsci.68.sup1_158
Tian Y., Ueno Y., Suda M., and Akamine T. (2004). Decadal variability in the abundance of Pacific saury and its response to climatic/oceanic regime shifts in the northwestern subtropical Pacific during the last half century. J. Mar. Syst. 52, 235–257. doi: 10.1016/j.jmarsys.2004.04.004
Tu C. Y., Tian Y., and Hsieh C. H. (2015). Effects of climate on temporal variation in the abundance and distribution of the demersal fish assemblage in the Tsushima Warm Current region of the Japan Sea. FISH OCEANOGR. 24, 177–189. doi: 10.1111/fog.2015.24.issue-2
Vasilakopoulos P., Raitsos D. E., Tzanatos E., and Maravelias C. D. (2017). Resilience and regime shifts in a marine biodiversity hotspot. Sci. Rep. 7, 13647. doi: 10.1038/s41598-017-13852-9
Venables W. N. and Ripley B. D. (2002). “Random and mixed effects,” in Modern Applied Statistics with S. Eds. Venables W. N. and Ripley B. D. (Springer New York, New York, NY), 271–300.
Wang L., Ma S., Liu Y., Li J., Liu S., Lin L., et al. (2021). Fluctuations in the abundance of chub mackerel in relation to climatic/oceanic regime shifts in the northwest Pacific Ocean since the 1970s. J. Mar. Syst. 218, 103541. doi: 10.1016/j.jmarsys.2021.103541
Wang L., Ma S., Liu Y., Li J., Sun D., and Tian Y. (2022). Climate-induced variation in a temperature suitability index of chub mackerel in the spawning season and its effect on the abundance. Front. Mar. Sci. 9. doi: 10.3389/fmars.2022.996626
Williams J. W. and Jackson S. T. (2007). Novel climates, no-analog communities, and ecological surprises. Front. Ecol. Environ. 5, 475–482. doi: 10.1890/070037
Wolkovich E. M., Cook B. I., McLauchlan K. K., and Davies T. J. (2014). Temporal ecology in the anthropocene. Ecol. Lett. 17, 1365–1379. doi: 10.1111/ele.12353
Wood S. N. (2006). Low-rank scale-invariant tensor product smooths for generalized additive mixed models. Biometrics 62, 1025–1036. doi: 10.1111/j.1541-0420.2006.00574.x
Wu B., Lin X., and Yu L. (2020). North pacific subtropical mode water is controlled by the atlantic multidecadal variability. Nat. Clim. Change 10, 238–243. doi: 10.1038/s41558-020-0692-5
Wu B. and Wang J. (2002). Winter arctic oscillation, Siberian high and east Asian winter monsoon. Geophys. Res. Lett. 29, 3. doi: 10.1029/2002gl015373
Xing Q., Yu H., Liu Y., Li J., Tian Y., Bakun A., et al. (2022). Application of a fish habitat model considering mesoscale oceanographic features in evaluating climatic impact on distribution and abundance of pacific saury (Cololabis saira). Prog. Oceanogr. 201, 102743. doi: 10.1016/j.pocean.2022.102743
Yasuda I., Sugisaki H., Watanabe Y., Minobe S. S., and Oozeki Y. (1999). Interdecadal variations in Japanese sardine and ocean/climate. Fish. Oceanogr. 8, 18–24. doi: 10.1046/j.1365-2419.1999.00089.x
Yatsu A. (2019). Review of population dynamics and management of small pelagic fishes around the Japanese archipelago. Fish. Sci. 85, 611–639. doi: 10.1007/s12562-019-01305-3
Yatsu A., Chiba S., Yamanaka Y., Ito S., Shimizu Y., Kaeriyama M., et al. (2013). Climate forcing and the Kuroshio/Oyashio ecosystem. ICES J. Mar. Sci. 70, 922–933. doi: 10.1093/icesjms/fst084
Yatsu A., Okamura H., Ichii T., and Watanabe K. (2021). Clarifying the effects of environmental factors and fishing on abundance variability of Pacific saury (Cololabis saira) in the western north Pacific Ocean during 1982–2018. Fish. Oceanogr. 30, 194–204. doi: 10.1111/fog.12513
Yukami R., Ohshimo S., Yoda M., and Hiyama Y. (2009). Estimation of the spawning grounds of chub mackerel Scomber japonicus and spotted mackerel Scomber australasicus in the east China sea based on catch statistics and biometric data. Fish. Sci. 75, 167–174. doi: 10.1007/s12562-008-0015-7
Zeileis A., Kleiber C., Krämer W., and Hornik K. (2003). Testing and dating of structural changes in practice. Comput. Stat. Data Anal. 44, 109–123. doi: 10.1016/S0167-9473(03)00030-6
Zeileis A., Leisch F., Hornik K., and Kleiber C. (2002). Strucchange: an r package for testing for structural change in linear regression models. J. Stat. Software 7, 1–38. doi: 10.18637/jss.v007.i02
Zhang L., Wu L., Lin X., and Wu D. (2010). Modes and mechanisms of sea surface temperature low-frequency variations over the coastal China seas. J. Geophysical Res.: Oceans 115, C08031. doi: 10.1029/2009JC006025
Keywords: climate variability, Pacific saury, northwestern Pacific Ocean, small pelagic fish, non-stationarity
Citation: Cao C, Ma S, Liu Y, Tian H, Liu S, Li J and Tian Y (2025) Non-stationary response of Pacific saury (Cololabis saira) in the northwestern Pacific to climate variability. Front. Mar. Sci. 12:1561066. doi: 10.3389/fmars.2025.1561066
Received: 15 January 2025; Accepted: 20 May 2025;
Published: 19 June 2025.
Edited by:
Hui Zhang, Chinese Academy of Sciences (CAS), ChinaCopyright © 2025 Cao, Ma, Liu, Tian, Liu, Li and Tian. This is an open-access article distributed under the terms of the Creative Commons Attribution License (CC BY). The use, distribution or reproduction in other forums is permitted, provided the original author(s) and the copyright owner(s) are credited and that the original publication in this journal is cited, in accordance with accepted academic practice. No use, distribution or reproduction is permitted which does not comply with these terms.
*Correspondence: Yongjun Tian, eWp0aWFuQG91Yy5lZHUuY24=
†ORCID: Chang Cao, orcid.org/0000-0002-8894-3251
Shuyang Ma, orcid.org/0000-0003-4060-7993
Yang Liu, orcid.org/0000-0001-8548-0223
Hao Tian, orcid.org/0000-0001-5775-8080
Shigang Liu, orcid.org/0000-0001-5303-8166
Jianchao Li, orcid.org/0000-0002-9866-8214
Yongjun Tian, orcid.org/0000-0003-2798-0638