 Kesley Gibson Banks
 Daniel M. Coffey
 Mark R. Fisher2
 Greg W. Stunz
- 1Harte Research Institute, Texas A&M University–Corpus Christi, Corpus Christi, TX, United States
- 2Texas Parks and Wildlife Department, Coastal Fisheries Division, Rockport, TX, United States
Shortfin mako sharks (Isurus oxyrinchus) are apex predators in marine ecosystems, yet the North Atlantic stock has declined drastically. Despite their imperiled status, limited research has focused on the movement and habitat use of mature individuals in the Gulf of Mexico (also known as Gulf of America; hereafter Gulf), a region hypothesized to serve as gestation and parturition grounds. From 2016 to 2021, 21 mako sharks (90% mature or nearing maturity) were satellite-tagged in the northwestern Gulf to evaluate habitat suitability, move persistence, and the environmental drivers influencing these patterns. This study revealed year-round habitat use in the Gulf, particularly in the northwestern Gulf west of the central stem of the Mississippi River delta (~89.1°W), identifying this area as a previously unrecognized important habitat. Mako sharks exhibited resident behavior in productive shelf and shelf-slope waters and at sea surface temperatures (SSTs) between 19.6°C and 26°C, while transiting behavior was observed at SSTs >26°C and in migration corridors, such as the Loop Current, during movements through the Yucatán Channel or Straits of Florida. These findings highlight intra-population variability in movement and emphasize the need to manage these highly migratory species at the ocean-basin scale. Developing spatially explicit models that incorporate regional connectivity and environmental drivers will be essential for improving management strategies and rebuilding efforts for this vulnerable species.
Introduction
Highly migratory species (HMS), like the shortfin mako shark (Isurus oxyrinchus; hereafter mako shark), are often apex predators that serve critical ecological functions within vast marine ecosystems (Block et al., 2011). Managing entities face serious and complex challenges as HMS frequently cross multiple jurisdictional boundaries during their long-distance movements, which also expose individuals to varying natural and anthropogenic pressures (e.g., dynamic environmental conditions, prey resources, fishing effort, and illegal/unreported/unregulated fishing; Rooker et al., 2019). While these movements and their consequences present complex challenges to management, knowledge of these movement patterns and understanding the various sources of mortality is essential for identifying the spatial and temporal scales at which a fishery can be best managed. Failure to recognize or accurately identify the stock structure of an exploited species can lead to changes in biological attributes and productivity, loss of genetic diversity, and overfishing and depletion of less productive stocks (Stevens et al., 2000; Pinsky and Palumbi, 2014). Unfortunately, the management of many HMS fisheries continues to be hindered by large data gaps regarding seasonal movement patterns, stock structure, and uncertainty regarding fisheries-related mortality.
Mako sharks are highly prized in recreational fisheries and as high-value bycatch in directed commercial pelagic longline fisheries (Campana et al., 2016; Queiroz et al., 2019). Like other shark species, mako sharks have low resilience to fishing mortality due to their inherent life history characteristics (e.g., slow growth, late age-at-maturity; Cortés et al., 2010; Natanson et al., 2020). In the Atlantic Ocean, mako sharks are assessed as North Atlantic and South Atlantic stocks by the International Commission for the Conservation of Atlantic Tunas (ICCAT). The 2017 stock assessment determined that the North Atlantic shortfin mako shark stock was overfished and that annual catch levels (3,600 – 4,750 mt) would need to be reduced to 500 mt or less to end overfishing and begin rebuilding the stock (ICCAT, 2017). In response to these assessment findings, the United States (U.S.) National Marine Fisheries Service (NMFS) passed Amendment 11 to the 2006 Consolidated Atlantic Highly Migratory Species Fishery Management Plan. The Amendment, consistent with ICCAT recommendations to end overfishing, established recreational size limits of 71 in (180 cm) fork length (FL) for males and 83 in (211 cm) FL for females and required commercial longline vessels to safely release any mako sharks alive at the time of haulback (NMFS, 2019). Despite these regulations, recently updated projections suggest that reducing annual catch levels to 500 mt would only result in a 52% probability of rebuilding the stock and ending overfishing by 2070 (ICCAT, 2019). This bleak outlook resulted in a retention ban on mako sharks caught in the North Atlantic Ocean (NMFS, 2022a). In 2021, the NMFS announced that there was substantial scientific and commercial evidence to warrant listing mako sharks as threatened or endangered under the Endangered Species Act, initiating a status review of this species (NFMS, 2021); however, it was determined that listing was not warranted (NMFS, 2022b). Despite their declining status, little research has been conducted on this species regarding their movements and habitat use in the Gulf of Mexico (also known as Gulf of America; hereafter Gulf).
Several data deficiencies highlighted in the most recent stock assessment (ICCAT, 2019) continue to hinder mako shark management, including sparse information regarding the species movement ecology and uncertainty surrounding estimates of fishing mortality (comprising at-vessel and post-release mortality; Musyl et al., 2011; Musyl and Gilman, 2019). Specifically, existing knowledge of mako shark distribution patterns, stock boundaries, and fishing mortality is primarily informed by fisheries landings data and conventional tag-recapture studies (Wood et al., 2007; ICCAT, 2017; Mucientes et al., 2023). While these data are informative, they are limited by low recapture rates and are inherently biased by spatiotemporally variable fishing effort and the absence of information between the point of capture and recapture. These are potentially serious limitations to accurate stock assessment – especially if mako sharks are exposed to varying levels of fishing mortality during their migratory movements (Braccini et al., 2016).
Preliminary data from nine satellite-tagged mako sharks (5 males, 4 females) tagged off the U.S. coast of Texas showed wide-reaching dispersal patterns, with two tagged individuals exiting the Gulf (Gibson et al., 2021). Furthermore, while most of these sharks have displayed seasonal core distribution areas along the Gulf shelf edge off Texas, these long-distance seasonal movements have only been observed for mature male mako sharks, suggesting that differences in migratory patterns between sexes may exist. Many of the females tagged off Texas had bite marks consistent with shark mating behavior, supporting the hypothesis of gestation and parturition grounds in the northern Gulf (Natanson et al., 2020). However, the sample size of mature females is limited in the Gulf, but a few mature females have been documented to be present in the western Gulf most of the year (Natanson et al., 2020; Gibson et al., 2021). Although increased sample sizes are needed to refine and corroborate these patterns, these findings have pronounced implications for regional management and suggest the potential for sex- and region-specific variation in fishing mortality (e.g., Mucientes et al., 2009). Accordingly, further investigation of this putative stock sub-structure is clearly warranted.
In addition to information regarding mako shark stock structure and population connectivity, finer-scale movement and habitat use data are also needed for effective fisheries management. This need stems from observations that many HMS can also exhibit extended residence (i.e., weeks to months) to certain oceanographic features characterized by high productivity (e.g., Luo et al., 2015) and habitats with high bathymetric relief, such as continental shelf and slope waters (Rogers et al., 2015). Even if residency to a site is relatively short (i.e., days to weeks), many HMS may also exhibit fidelity to them, returning to specific sites from year to year to exploit seasonal productivity (Block et al., 2011). Preliminary studies have shown these same patterns for mako sharks in the Gulf (Gibson et al., 2021). Such behaviors can make HMS, despite their high mobility, vulnerable to spatiotemporally-explicit activities (e.g., fisheries). In fact, many species, including mako sharks, have already been demonstrated to be highly susceptible to these activities (Campana et al., 2016; Byrne et al., 2017; Queiroz et al., 2019). For example, Mucientes et al. (2025) recently reported a likely nursery area for mako sharks in the eastern South Pacific Ocean that overlaps extensively with a longline fishing hotspot. This spatial overlap suggests that juvenile mako sharks are exposed to elevated fishing pressure in this area, with potential population-level consequences if effective management measures are not implemented. These findings underscore the importance of understanding movement patterns and habitat use across different life history stages to determine how, when, and where mako sharks interact with fisheries to inform conservation and spatial management planning. While several studies have identified important areas for juveniles (Vaudo et al., 2017; Byrne et al., 2019; Garrison, 2023) and potential nursery grounds (Natanson et al., 2020) in the Gulf and western North Atlantic, further research is needed to address knowledge gaps for mature individuals (Gibson et al., 2021), to ensure comprehensive, life stage-specific management approaches.
Using satellite tracking data, we evaluated habitat suitability, move persistence, and the environmental factors influencing these patterns to advance our understanding of mako shark movement ecology in the Gulf. The objectives of this study were to 1) identify core use areas and assess habitat suitability for mako sharks in the Gulf; and 2) determine migration corridors and population connectivity to further our knowledge of North Atlantic mako shark stock structure.
Methods
Shark handling and tagging were conducted in accordance with approved guidelines of Texas A&M University-Corpus Christi (Institutional Animal Care and Use Committee-Animal Use Protocol #08–18 and #2020-04-01), Texas Parks and Wildlife Department Scientific Research Permit #SPR-0303-279, and National Oceanic and Atmospheric Administration Letter of Acknowledgement #SHK-LOA-21-26. Mako sharks were captured via hook and line >40 nautical miles out of Port Aransas, Texas, or from shore along the Padre Island National Seashore. In these rare events, sharks were landed in the surf with their gills remaining submerged in the water. Sharks captured offshore were either secured alongside the vessel or brought onboard via a cradle with a saltwater hose placed in the mouth to irrigate the gills. During the tagging procedure, individuals were sexed, measured [fork length (FL); cm], and externally tagged. Individuals were tagged with a Smart Position Or Temperature tag (SPOT5 or SPOT6; Wildlife Computers, Redmond, WA, United States) for satellite tracking and a conventional dart tag (Floy©, Seattle, WA, United States), which included contact information, a unique identification number, and “reward” for reporting recaptures. SPOT tags use the Argos satellite system to provide geographic locations when the tag is not submerged. For SPOT tag attachment, four small holes were drilled into the distal portion of the leading edge of the dorsal fin, and stainless-steel hardware was used to secure the tag. Prior to deployment, SPOT tags were coated in antifouling paint (InterProtect 2000E and Micron CSC, Interlux, Houston, TX, United States) to prevent excessive biofouling that can inhibit successful communication with satellites. SPOT tags were programmed with a maximum of 70 transmissions per day and had an estimated battery life of ~2 years. All sharks were tagged and subsequently released at their capture location.
Location processing
Argos assigned location estimates to one of seven spatial accuracy classes, each with an associated error estimate. In decreasing order, the location classes (with estimated error) were: 3 (<250 m), 2 (250–500 m), 1 (500–1500 m), and 0 (>1500 m), with unbounded accuracy estimation for location classes A and B. Location estimates assigned to class Z are considered invalid and, therefore, were omitted from further analyses. Prior to analysis, visually discernable erroneous locations (i.e., locations on land or those with implausible pathways over land) were removed. We fit continuous-time state-space models (SSM) to the temporally irregular raw Argos location data using the aniMotum package (Jonsen et al., 2023) in R (R Core Team, 2024). Different process models (e.g., correlated random walk) were fit depending on the objectives of specific analyses (see corresponding sections below). This approach accounted for observation errors in location data and provided location estimates at regular time steps along each track. Given that 84.9% of temporal gaps between raw Argos locations in individual tracks were <24 h, we used a time step of 24 h and a swim speed threshold of 4.47 m s–1 (Vaudo et al., 2017) in the SSM to produce one position per day for each mako shark. The swim speed threshold represents a conservative upper limit of travel for this species (Saraiva et al., 2023) and is intended to identify only extreme outlier raw Argos locations. To reduce spurious SSM-position estimates associated with long detection gaps (Bailey et al., 2008), tracks were segmented when gaps between raw satellite locations were >7 days—a conservative threshold (corresponding to 0.6% of gaps) based on previous mako shark telemetry studies (e.g., Vaudo et al., 2017; Byrne et al., 2019, 2024)—and reassembled after modeling. Tracks (or track segments) with less than 10 transmissions and 5 transmit days in duration were excluded. Erroneous SSM locations interpolated onto land were corrected post-hoc using the pathroutr package in R (London, 2020). One-step-ahead (prediction) residuals were calculated from the SSM fit to evaluate model performance.
Core use areas
Given the focus of this study on the Gulf and the observed migration and return of only two tracked individuals (Sharks 3 and 5), as documented by Gibson et al. (2021), only raw Argos locations within the Gulf boundaries delineated by Felder et al. (2009) were fitted using a correlated random walk SSM (CRW-SSM). Tracks were segmented for the two individuals that migrated from the Gulf to exclude locations outside of this region. Utilization distributions (UDs) were calculated using the CRW-SSM location estimates to quantify the core use areas (50% UD) of individual sharks in the Gulf by applying a movement-based kernel density estimation (MKDE) analysis based on a biased random bridge model (BRB; Benhamou, 2011) with the adehabitatHR package (Calenge, 2006) in R. CRW-SSM location estimates during the first 24 h post-release were excluded to mitigate potential movement bias resulting from the capture and tagging event. The number of overlapping individual core use areas was calculated over 25 km grid cells, corresponding to the mean posterior 95% confidence ellipse (mean latitude [x-coordinate] = 21.6 km, mean longitude [y-coordinate] = 25.5 km) from daily CRW-SSM position estimates, across all tracks and by boreal season. To mitigate potential biases resulting from the inclusion of short tracking periods, we excluded CRW-SSM location estimates for sharks that were tracked for <30 days within a given season and year.
Environmental data
Environmental data were extracted along tagged mako shark tracks to characterize oceanographic conditions the sharks experienced. Variables were selected based on prior habitat suitability and movement studies of HMS in the Gulf (e.g., Hazen et al., 2016; Wells et al., 2018; Byrne et al., 2019), and included both static features (e.g., bathymetry) and dynamic oceanographic conditions (e.g., sea surface temperature [SST]). Bathymetry (m) was extracted from the Shuttle Radar Topography Mission (SRTM; 15 arcsec or 0.004° resolution; Tozer et al., 2019). Slope (°) was calculated for each bathymetric grid cell using 8 neighboring grid cells in the raster package (Hijmans et al., 2023) in R. Remotely sensed daily SST (°C) from the Multi-scale Ultra-high Resolution (MUR) SST Analysis fv04.1 (0.01° resolution), 8-day composite meridional (northward) and zonal (eastward) wind velocity (m s–1) and Ekman upwelling (m s–1) from the Meteorological Operation Satellite Program (MetOp) Advanced Scatterometer (ASCAT; 0.25° resolution), and 8-day and monthly composite surface chlorophyll a concentration (mg m–3) was obtained from Aqua Moderate Resolution Imaging Spectroradiometer (MODIS; 0.05° resolution) using the rerddapXtracto package (Mendelssohn et al., 2024). For grid cells obscured by cloud cover in the 8-day composite chlorophyll a concentration data, monthly composite chlorophyll a concentration values were used. Daily surface zonal and meridional seawater velocity (m s–1), surface salinity (ppt), and sea surface height above geoid (SSH; m) were obtained from the Copernicus Marine Environmental Monitoring Service (CMEMS) Global Ocean Physics Reanalysis (2016-2020; Jean-Michel et al., 2021) and Analysis and Forecast (2021-2022) products at a resolution of 0.083°. Daily eddy kinetic energy (EKE; m2 s–2) was calculated using the zonal (u) and meridional (v) seawater velocity as ½(u2 + v2). Daily surface dissolved oxygen concentrations (mmol m–3) were obtained from the CMEMS Global Ocean Biogeochemistry Hindcast (2016-2020) and Analysis and Forecast (2021-2022) products at a resolution of 0.25°. The posterior 95% confidence ellipse from each daily SSM position estimate was used to calculate a mean value for each environmental variable and the standard deviation (SD) for bathymetry (an index of rugosity) and SST (SSTsd) and SSH (SSHsd) as indices of frontal activity (Brodie et al., 2018).
Habitat suitability
A generalized additive mixed model (GAMM) framework was constructed to estimate mako shark habitat suitability (probability of occurrence) in the Gulf using CRW-SSM location estimates. GAMMs, which are semiparametric, were selected for their ability to model nonlinear relationships between the response (presence-absence) and multiple predictor variables, while also incorporating random effects to account for repeated observations from individual sharks. This modeling approach is particularly well suited to HMS, which often exhibit complex and individual-specific responses to environmental variability (e.g., Willis-Norton et al., 2015; Hazen et al., 2016, 2017, 2021; Wells et al., 2018; Becker et al., 2020; inter alia).
As satellite telemetry data provides the presence of tagged mako sharks but no direct measure of absence, simulated CRWs were used to represent a null model where individual sharks could move in the environment independent of environmental conditions (i.e., pseudo-absences; Barbet-Massin et al., 2012; Hazen et al., 2021). For each individual shark track, 1,000 CRWs were simulated using the aniMotum package based on movement parameters extracted from the actual CRW-SSM location estimates. Simulated CRWs consist of a sequence of random steps, where each location is generated using turning angle and distance distributions derived from a corresponding CRW-SSM track over the same duration. The starting point for each simulated CRW was the tagging location or point of reentry to the Gulf for segmented tracks for Sharks 3 and 5 (sensu Hazen et al., 2016). Whereas the CRW-SSM is constrained by the actual data, when simulating a large number of replicate CRW tracks, a portion of the simulations may reflect unrealistic movement patterns due to the relatively unconstrained nature of the simulation (Willis-Norton et al., 2015; Hazen et al., 2017). Therefore, several quality assurance and control measures were implemented to select appropriate simulated CRW tracks to use as pseudo-absences that are in the same environmental space as the presence data in the GAMM framework (Barbet-Massin et al., 2012; Hazen et al., 2021). First, custom gradient rasters were supplied to CRW track simulations to allow the simulations to more closely approximate the actual tracks by avoiding land and remaining predominantly within the Gulf. Second, a similarity filter based on Hazen et al. (2017) was employed to compare the normalized difference in geodesic distances and bearings from the start and end locations of both the actual CRW-SSM track and each simulated CRW track. Simulated CRW tracks identified as falling within the upper quartile (Q3; i.e., top 25%) of the most dissimilar to their corresponding shark track were subsequently removed. Third, erroneous simulated CRW locations on land were corrected post-hoc using the pathroutr package in R. Lastly, simulated CRW tracks traveling outside of the Gulf were removed to ensure simulated CRW track durations within the Gulf were of equal length to their corresponding shark track. Following these quality assurance and control measures, 11–750 (mean ± SD: 419 ± 303) simulated CRW tracks remained for each corresponding CRW-SSM track to ensure that the pseudo-absences adequately represented the area potentially accessible to the sharks. The lower end of this range reflects long-duration tracks (i.e., >400 days at liberty), which increased the likelihood of simulated tracks traveling outside the Gulf and being excluded—though the number of retained tracks still exceeded our minimum threshold of 10 per individual (e.g., Maxwell et al., 2019; Braun et al., 2023). Each location of the simulated CRW tracks was given the same 95% confidence ellipse distribution as the actual track to calculate a mean (and SD) for each environmental variable.
For each actual CRW-SSM track, a simulated CRW track was randomly selected to create a paired 1:1 presence-(pseudo)absence dataset for GAMM selection to determine which candidate predictor variables to retain in the final model (sensu Barbet-Massin et al., 2012; Hazen et al., 2021; inter alia). CRW-SSM location estimates and paired simulated CRW locations during the first 24 h post-release were excluded to eliminate potential movement bias resulting from the capture and tagging event. Only two tracked individuals (Sharks 3 and 5) were documented migrating from the Gulf, making them the only suitable tracks for modeling monthly occurrences of mako sharks in the region. Consequently, temporal variables such as month were omitted as candidate predictor variables when assessing the probability of mako shark occurrence in the Gulf, relying solely on presence and pseudo-absence data collected within the Gulf. Prior to model selection, slope, chlorophyll a, EKE, rugosity, SSTsd, and SSHsd were log-transformed due to pronounced skewness in their respective distributions. In addition to the environmental variables described above, shark sex and size (FL) were included as candidate biological predictor variables. Collinearity between candidate predictor variables was assessed with absolute Spearman’s rank correlation coefficients (ρ) and variance inflation factors (VIF) in R. Daily SST and surface dissolved oxygen concentration (ρ > 0.93, VIF > 9) and shark sex and size exhibited high collinearity (VIF = 3.7); therefore, each variable was included separately during model selection. Absolute Spearman’s ρ were <0.68, and VIFs were <2.6, indicating low collinearity between the remaining candidate predictor variables.
The presence-(pseudo)absence dataset was modeled using a binomial distribution with a logit link function in the mgcv package (Wood, 2017) in R. Thin plate regression splines were estimated for each candidate predictor variable. To prevent overfitting, each regression spline was automatically penalized from specified maximum degrees of freedom (df = 5) and the degree of smoothing selected by minimizing the restricted maximum likelihood (REML) score (Wood, 2011). Since observations were repeated measures collected from the same individuals, individual sharks were included as a random effect to account for variation among individual responses to environmental variables. Although a correlation structure with an autoregressive process of order 1 (AR1) was initially included to address serial correlation in the time series data, it did not improve model performance or alter the partial residuals, leading to its exclusion from the final model. Model selection was based upon an information-theoretic approach through minimization of the second-order Akaike Information Criterion (AICc; Burnham and Anderson, 2002) using the MuMIn package (Bartoń, 2023). Models with substantial support were selected based on a ΔAICc <2 from the model with the lowest AICc and included in model averaging based on Akaike weights (Burnham and Anderson, 2002). When multiple models met this ΔAICc <2 criteria, significant predictor variables (p < 0.05) with high relative importance (sum of model weights over all models including each explanatory variable) were retained to achieve the most parsimonious final model. The resulting final model was used to evaluate predictive performance, concurvity (when a smooth term can be estimated by another smooth term), and adherence to statistical assumptions of residuals. Residual diagnostics assessed independence, homoscedasticity, and appropriate distributional fit.
The influence of the randomly selected simulated CRW pseudo-absence dataset choice on the final model selection was evaluated (Willis-Norton et al., 2015; Hazen et al., 2016, 2021; Dale et al., 2022). The selected final model was run 60 times, each time with a unique set of randomly selected simulated CRW pseudo-absence tracks. For each iteration, the significance of each predictor variable in the final model was recorded, and the percentage of the 60 model iterations in which each predictor variable was significant was calculated. To assess predictive performance and determine the best simulated CRW pseudo-absence dataset to use with the selected final model, cross-validation was performed using two configurations. First, the presence-(pseudo)absence dataset was randomly divided into five approximately equal-sized partitions or folds, while maintaining the same ratio of presences to pseudo-absences. The model was refit on four selected folds (training dataset), and the resulting model was used to predict the probability of occurrence on the remaining withheld fold as the test (validation) dataset. This process was then repeated five times so that each fold was used as a test dataset to generate a mean (± SD) estimate of area under the receiver operating characteristic curve (AUC) for each model iteration. Second, leave-one-out cross-validation was performed across years and months to assess inter- and intraannual predictive performance, respectively. In this approach, data from each year or month was omitted from the training dataset when refitting the model, and the withheld year or month was used as the test dataset for evaluating model predictions. This process was then repeated six and twelve times, respectively, so that each year (2016-2021) and month was used as a test dataset to generate a mean (± SD) AUC for each model iteration. Although model fitting included data from 2022, there were only two tracks of short duration (0.5 and 3 months) during this year. Therefore, monthly habitat suitability predictions (see below) were not made beyond 2021. AUC is a threshold-independent statistic that represents the relationship between the false-positive ratio (1 - specificity) and the true-positive ratio (sensitivity) and ranges from 0 (no predictive capability) to 1 (perfect predictive capability). A value of 0.5 indicates that model predictive performance is no better than random, and generally, values from 0.7 to 0.8 are considered acceptable, 0.8 to 0.9 are good, and >0.9 represents excellent model performance (Hosmer and Lemeshow, 2000). The simulated CRW pseudo-absence dataset with the highest mean AUC was selected for use in the final presence-(pseudo)absence dataset and the selected final model was then fit to the dataset for the graphical representation of terms, calculation of deviance explained, and habitat suitability mapping. The partial deviance explained by each predictor variable i was calculated as the absolute difference in deviance explained between the final model and a submodel lacking i, divided by the deviance explained by the null model (intercept only). For consistency, and to isolate the effect of removing a single predictor variable i, the smoothing parameters for the remaining terms in each submodel were set equal to their estimates from the final model.
The best-fit model fit with the best-performing set of CRW pseudo-absences was used to predict monthly habitat suitability for mako sharks in the Gulf from 2016 to 2021. Monthly composites for all environmental covariates were extracted from the Gulf and rescaled to conform to the resolution of the coarsest covariate (0.25°) retained in the final model using bilinear interpolation. Standard deviations for bathymetry (rugosity), SST (SSTsd), and SSH (SSHsd) were calculated using the aggregated data from finer-resolution grid cells (0.004°, 0.01°, and 0.083°, respectively) within each 0.25° grid cell. The standard deviation for meridional and zonal wind velocity and Ekman upwelling (0.25° resolution) were calculated using a moving window (weighted matrix of 3 × 3 grid cells) for the neighborhood of focal grid cells in the raster package. Monthly predictions from the fitted GAMM were then averaged across boreal seasons and years to calculate mean seasonal habitat suitability. Interannual variation was calculated using the coefficient of variation (CV) based on the SD of seasonal predictions across years. Intraannual (monthly) variation was calculated using the CV based on the standard deviation across months within each season-year combination, averaged across years. The upper quartile (Q3) of predicted habitat suitability values within 0.25° grid cells across all averaged seasons and years was used to designate areas of highly suitable habitat for mako sharks in the Gulf. Areas of highly suitable habitat within each season were then divided by the total amount of available habitat to provide the proportion of habitat designated as highly suitable habitat in each season.
Move persistence
A time-varying move persistence SSM (MP-SSM) was fit to the raw Argos location data using the aniMotum package as previously described to identify periods of area-restricted and transiting movement behavior along individual tracks. This approach simultaneously estimates locations and move persistence from the irregularly timed and error-prone raw Argos location data rather than reducing movement behavior variability by fitting the move persistence model to CRW-SSM-smoothed location estimates, which reduces location uncertainty and can potentially result in biased estimates of move persistence that can lack contrast. The model calculates a move persistence index (γt) between successive location estimates—a latent behavioral variable that captures the autocorrelation in speed and directionality over time. The move persistence index objectively identifies changes in behavior along a continuum ranging from 0 (low speed and directionality indicative of area-restricted behavior) to 1 (high speed and directionality indicative of transiting behavior) rather than switching between discrete behavioral states (e.g., Jonsen et al., 2005; Patterson et al., 2009). Currently, this model approach can only estimate move persistence from error-prone individual tracks, rather than estimating a single, pooled random variance parameter jointly across multiple tracks fitted simultaneously (Jonsen et al., 2023). Therefore, move persistence estimates were normalized (rescaled to span the interval 0 to 1) collectively across all tracks to better resolve subtle changes in movement behavior and preserve the relative magnitudes of move persistence across individuals. In contrast to the CRW-SSM, the MP-SSM was calibrated using all raw Argos location data, encompassing locations both within and outside the Gulf. This approach aimed to integrate the migratory behavior observed in the two tracked individuals (Sharks 3 and 5), which migrated from the Gulf, into the estimation of move persistence.
To investigate which factors are associated with changes in move persistence, we employed a GAMM framework to model the response of γt to a suite of candidate predictor variables. Similar to habitat suitability models, only mako shark MP-SSM locations within the Gulf were included in GAMM analyses. All biological and environmental variables described above were included as candidate predictor variables. In addition, move persistence may be influenced by the seasonal availability of forage resources or timing of mating and parturition; therefore, month was included as a candidate temporal predictor variable. Month was modeled using a cyclic cubic regression spline, which constrains the start and end points of the smooth term to be the same (Wood, 2017), and automatically penalized from a higher specified maximum degree of freedom (df = 12). Daily SST and surface dissolved oxygen concentration (ρ > 0.92, VIF > 8.1), slope and rugosity (ρ > 0.67, VIF >3.6), and shark sex and size exhibited high collinearity (VIF ≥ 3.9); therefore, each variable was included separately during model selection. Absolute Spearman’s ρ were ≤0.78, and VIFs were <2.8, indicating moderate to low collinearity between the remaining candidate predictor variables.
Move persistence was logit transformed and modeled under a Gaussian distribution with an identity link function, and GAMM construction and model selection were performed as previously described. The final model was used for the evaluation of concurvity, adherence to statistical assumptions of residuals, calculation of deviance explained, and graphical representation of terms. Since AUC measures the overall performance of binary classification models (e.g., presence-absence), the predictive performance of the final Gaussian GAMM was assessed using 5-fold and leave-one-out cross-validation to generate a mean (± SD) estimate of root mean squared error (RMSE). RMSE is the square root of the average squared differences between model-predicted and observed test values, thus estimating the magnitude of the prediction error presented in the same units as the modeled response variable. RMSE values were calculated by applying the inverse logit function to the logit-transformed modeled response variable, thereby converting it back to a continuum ranging from 0 to 1 to aid interpretation. Lower RMSE values indicate better model performance, meaning the predictions are closer to the actual values.
The final model was used to predict monthly move persistence for mako sharks in the Gulf from 2016 to 2021 for comparison with habitat suitability. Monthly composites for all environmental covariates were extracted from the Gulf and rescaled to conform to the resolution of the coarsest covariate (0.25°) retained in the final model, as previously described. Monthly predictions from the fitted GAMM were then averaged across boreal seasons and years, and interannual and intraannual CVs were calculated. The lower (Q1; i.e., bottom 25%) and upper (Q3) quartiles of predicted move persistence values within 0.25° grid cells across all averaged seasons and years were used to designate areas of relatively lower and higher move persistence for mako sharks in the Gulf, and were subsequently divided by the total amount of available habitat.
Results
From 2016 to 2021, 21 makos sharks were tagged with SPOT tags from February to April off the coast of Texas, United States (Table 1). Based on estimates of median length at maturity (L50; Natanson et al., 2020), 14 of the 15 male mako sharks (168–237 cm FL) were mature or nearing maturity (L50 = 182 cm FL), and five of the six tagged females (165–361 cm FL) were mature or nearing maturity (L50 = 280 cm FL). Of the 21 SPOT tags deployed, one tag never reported (Shark 13), and another reported only once, less than an hour after release (Shark 15). These sharks were omitted from further analyses. The remaining 19 tags reported for 10 to 887 days (mean = 270 days; median = 166 days), with 12 mako sharks tracked for >100 days. To allow for dispersion from the tagging site, only tracks exceeding 11 days at liberty were included in analyses (Vaudo et al., 2017), which excluded the only individual (female; Shark 2) tagged from shore and one additional male (Shark 19), resulting in a total sample size of 17 tagged individuals (12 males and 5 females).
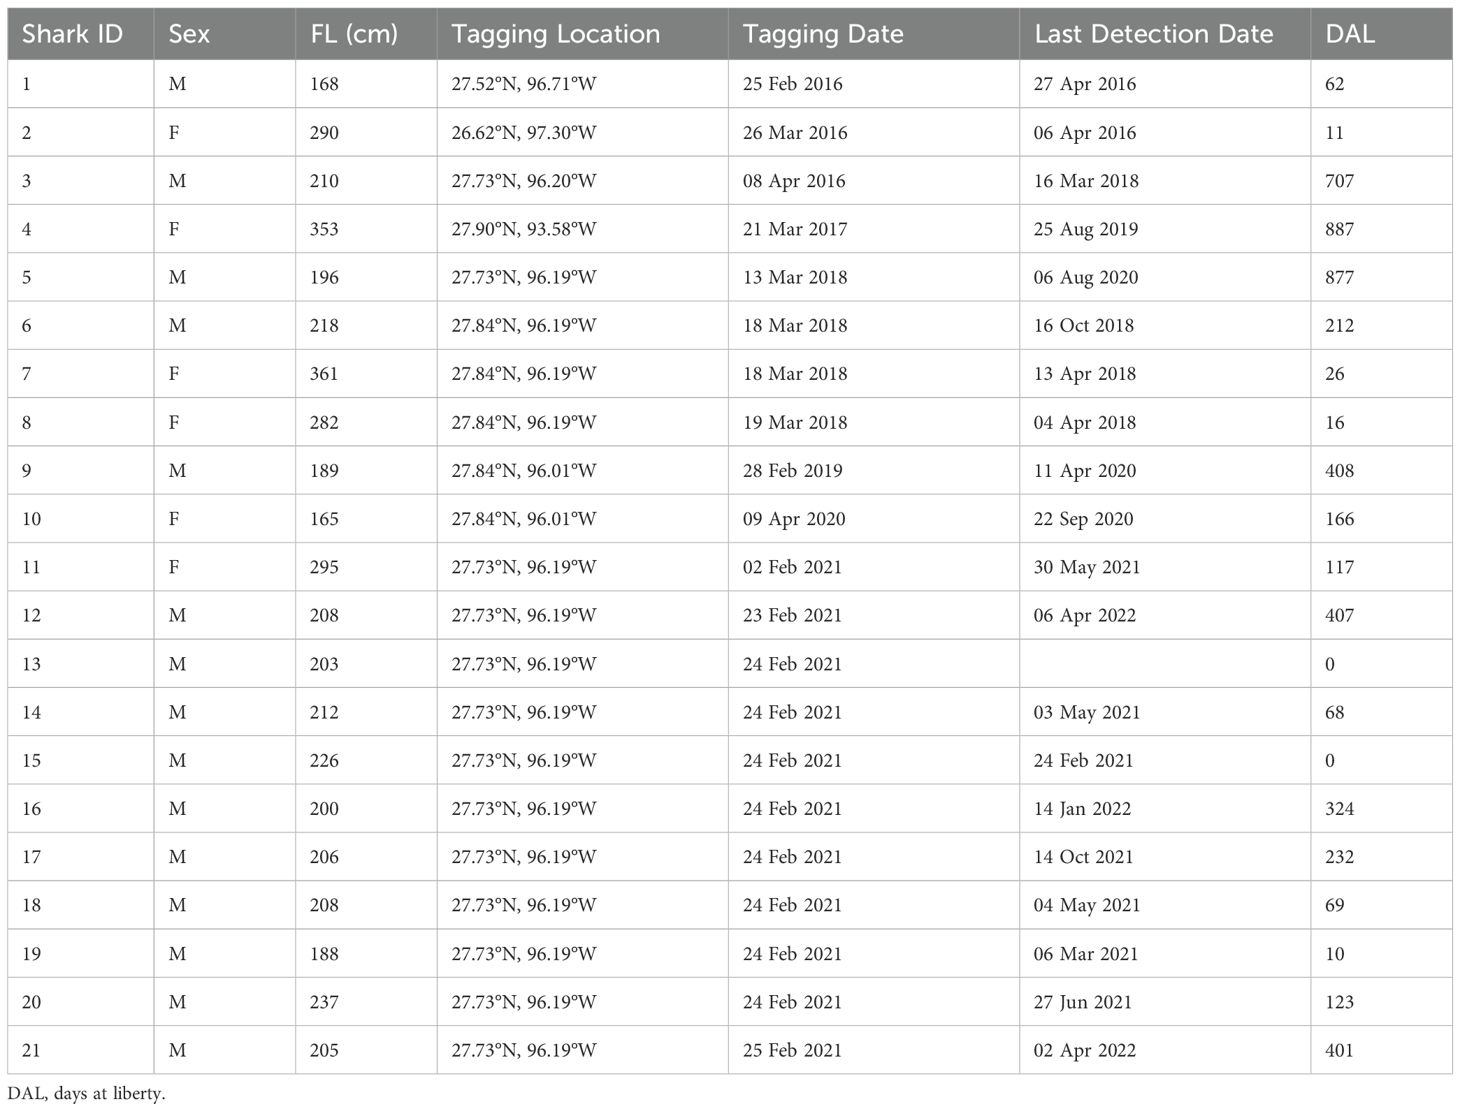
Table 1. Shortfin mako sharks (Isurus oxyrinchus) tagged in the northwestern Gulf of Mexico.
This study further revealed year-round habitat use by mako sharks in the Gulf, particularly in the northwestern region west of the central stem of the Mississippi River delta (~89.1°W; Figure 1A). Fifteen of seventeen mako sharks remained exclusively within the Gulf, and male Sharks 3 and 5 undertook seasonal migrations leaving the Gulf beginning in the late summer-early fall and returning in late fall-early winter each year, as documented by Gibson et al. (2021; Supplementary Figure S1). While only two individuals migrated from the Gulf, the spatial and temporal persistence of this behavior between years may suggest key migration corridors in the Straits of Florida and Yucatán Channel connecting the Gulf to the western North Atlantic Ocean and the Caribbean Sea, respectively (Supplementary Figure S2). Several other mako sharks (Sharks 10–12 and 14) did not leave the western Gulf and moved into the southwestern Gulf over the Tamaulipas-Veracruz shelf and the Bay of Campeche before moving into deeper waters and returning northward toward the Texas shelf.
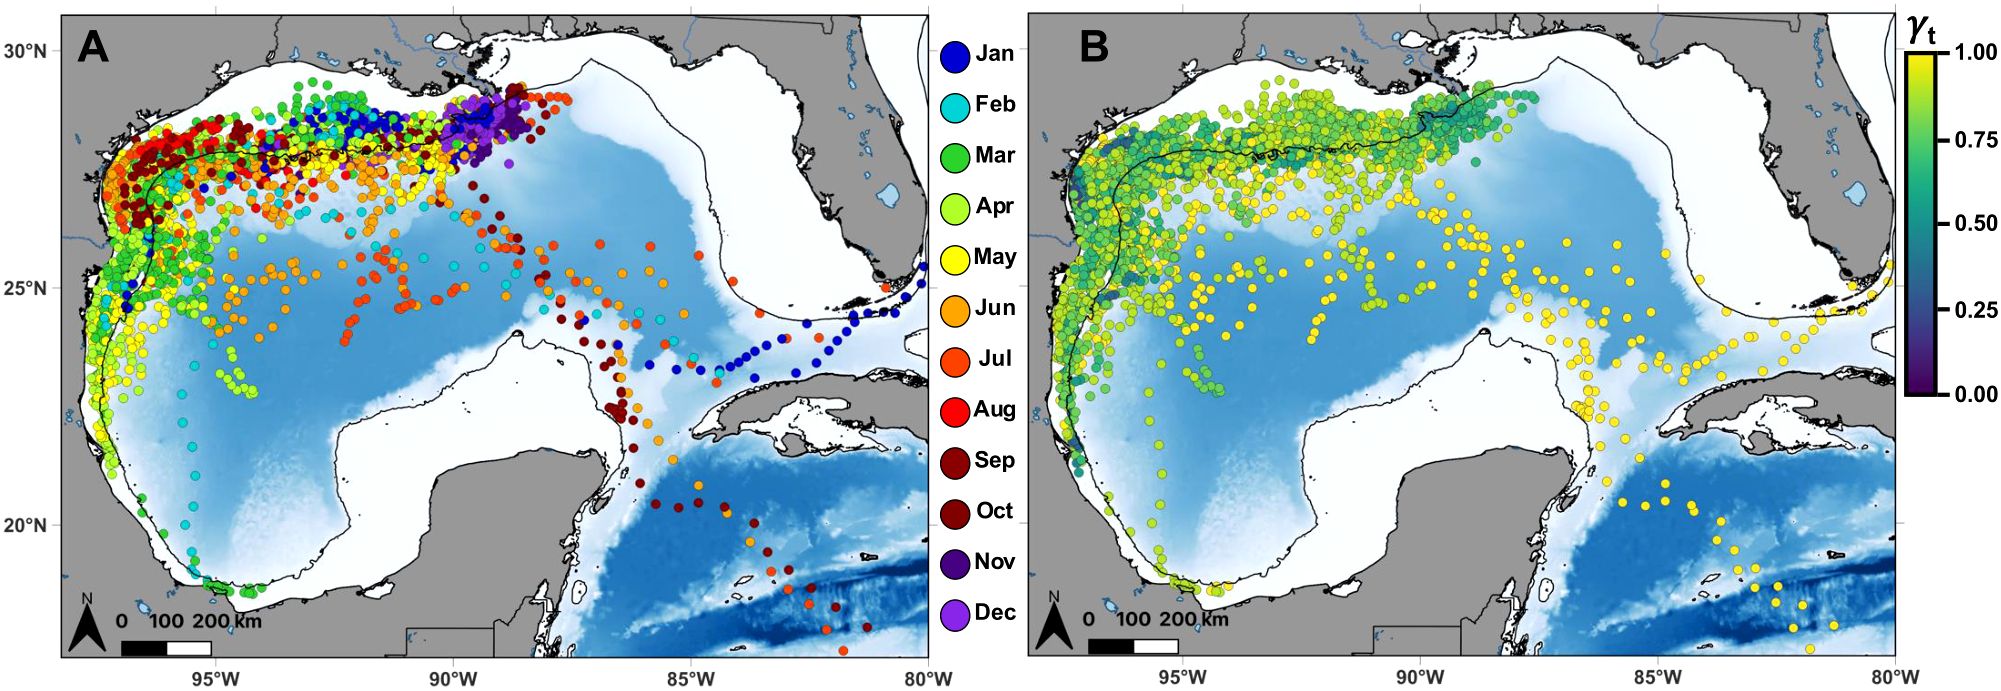
Figure 1. Daily location estimates (circles) from the time-varying move persistence state-space model for all satellite-tagged shortfin mako sharks in the Gulf of Mexico with tracks exceeding 14 days at liberty (n = 17). Each location is colored according to (A) month and its associated (B) move persistence (γt). The move persistence index identifies changes in behavior along a continuum ranging from 0 (low speed and directionality indicative of area-restricted behavior) to 1 (high speed and directionality indicative of transiting behavior). Black lines denote the continental shelf edge contour (i.e., 200 m isobath).
Core use areas
Overlapping core use areas (50% UD) identified a consistently high-use region frequented by multiple individuals (n = 3–11) both on and off the continental shelf along the central and south Texas coast throughout all seasons—winter (December–February), spring (March–May), summer (June–August), and fall (September–November; Figure 2). This high-use region exhibited a northeast-to-southwest orientation, closely aligning with the continental shelf edge contour (i.e., 200 m isobath) in the area. Additionally, a second high-use region with considerable overlapping core use areas was observed both on and off the Louisiana shelf near the central stem of the Mississippi River delta during fall (n = 4) and winter (n = 4), and this area shifted westward on the Louisiana inner shelf during the spring (n = 7) and south of the West Flower Garden Bank off the Louisiana-Texas shelf during the summer (n = 7). This second high-use region had a predominantly east-west orientation, also mirroring the 200 m isobath along the shelf edge. Note that the number of days and individuals in each season is a function of tag deployment duration (i.e., fall and winter consisted of fewer days since most individuals were tagged in the late winter or early spring).
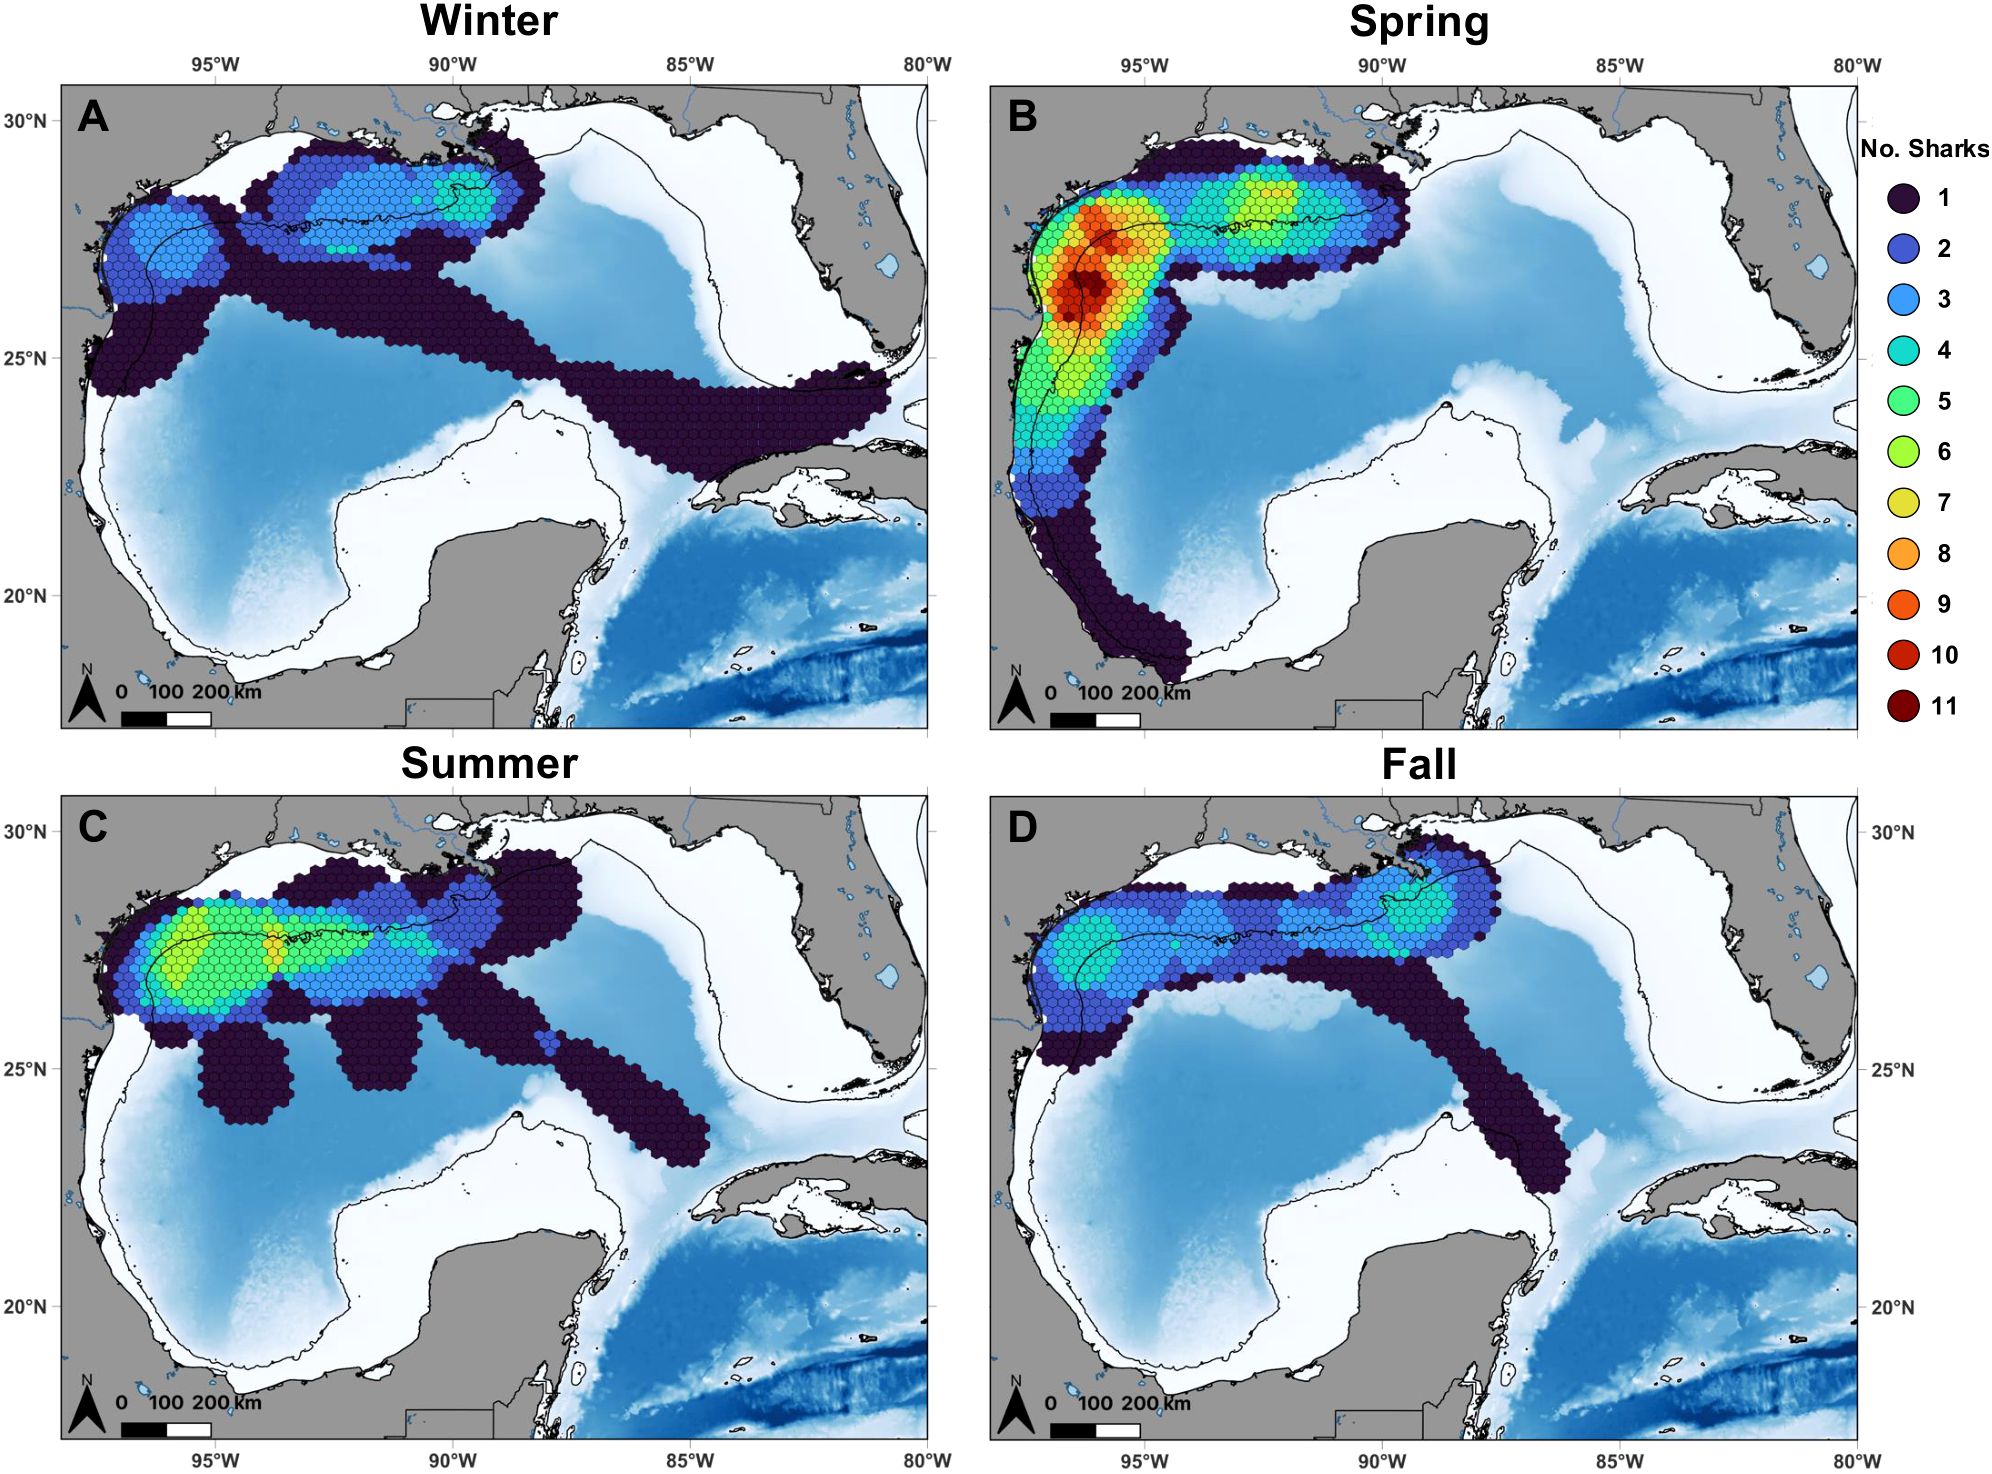
Figure 2. Overlapping core use areas (50% utilization distributions) of individual shortfin mako sharks (color) calculated over 25 km grid cells in the Gulf of Mexico during (A) winter (n = 7), (B) spring (n = 15), (C) summer (n = 8), and (D) fall (n = 6). Note that the number of individuals in each season is a function of tag deployment duration (i.e., most individuals were tagged in the late winter or early spring and sharks that were tracked for <30 days within a given season and year were excluded). Black lines denote the continental shelf edge contour (i.e., 200 m isobath).
Habitat suitability
The final habitat suitability (presence-pseudoabsence) model with the lowest AICc and highest AUC values included all 13 of the environmental covariates included in the model selection and explained 22.78% of deviance (%DE) in the data set (Table 2). SST and surface dissolved oxygen concentrations, which exhibited high collinearity, were both included in the best-fit models (with the lowest AICc) for their respective model selection; however, the model including SST had a lower AICc (ΔAICc = 32.7). Moreover, SST exhibited larger relative variability (range 13.1–32.2°C) within the Gulf compared to surface dissolved oxygen concentrations (range 190.9–290.9 mmol m–3); therefore, the best-fit model including SST was selected for habitat suitability analyses. Sex was included in the best-fit model, which had a ΔAICc <2 compared to the second-best model where sex was excluded. However, sex was non-significant (p > 0.05) and contributed negligibly to predictive performance (ΔAICc = −0.4, ΔAUC <−0.01, Δ%DE <0.01%). Therefore, sex was excluded from the most parsimonious final model. The covariates were robust to changes in CRW choice. Most of the covariates remained significant across 100% of the 60 model runs (Table 2), except for SSHsd (98.33%), zonal wind velocity (96.67%), slope (86.67%), SSTsd (88.33%), chlorophyll a concentration (80%), and Ekman upwelling (78.33%). Five-fold cross-validation yielded a mean (± SD) AUC of 0.80 ± 0.01, while cross-validation by year and month produced mean AUC values of 0.78 ± 0.06 and 0.76 ± 0.09, respectively. These results indicate the model had reasonable discrimination ability with the selected CRW set. The covariates with the strongest associations in the model (based on partial deviance explained) included salinity, bathymetry, SST, and rugosity (Table 2). Pairwise worst-case concurvity between each smooth term (as well as the parametric component) were <0.64, indicating low concurvity.
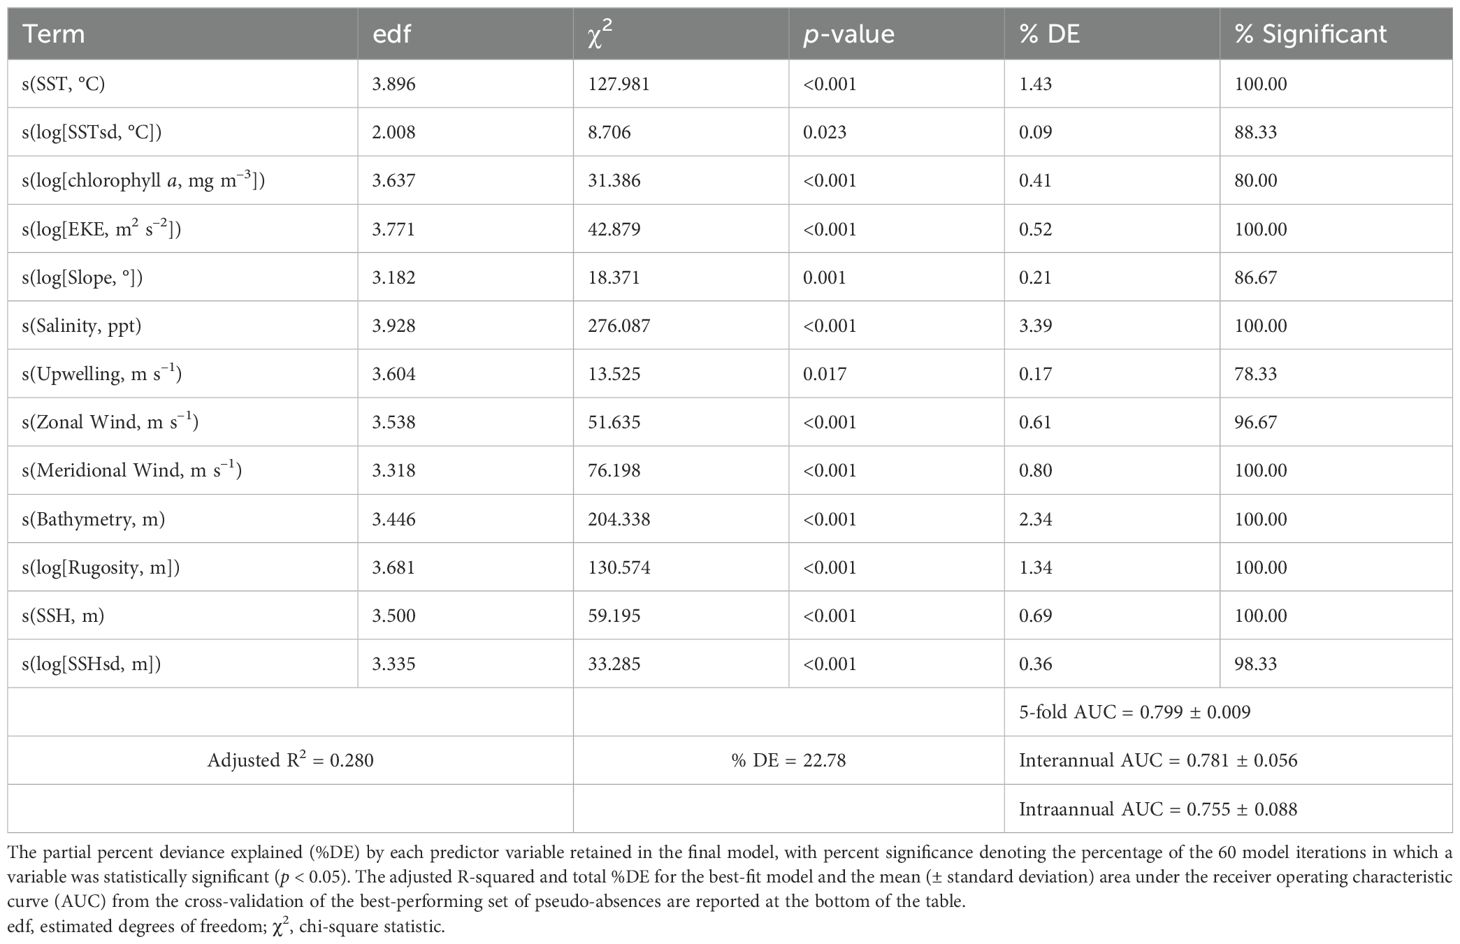
Table 2. Results from the final generalized additive mixed model of shortfin mako shark (Isurus oxyrinchus) habitat suitability (presence-absence) in the Gulf of Mexico.
Mako sharks in the Gulf showed strong associations with SSTs between 17.5 and 24°C, characterized by low variability (SSTsd < 0.2°C; Figure 3). They preferred low to moderate EKE values ranging from 0.013 to 0.135 m2 s–2, neutral SSH centered around 0 m (−0.14 to 0.11 m) with low variability (SSHsd ≤ 0.01 m), euhaline salinities between 32.5 and 36 ppt, and chlorophyll a concentrations above 2.12 mg m–3. Predicted habitat suitability decreased around features of the Loop Current and its associated eddies (characterized by higher EKE, SSH, and SSHsd values), as well as warmer waters (higher SST values) as the season progressed. Habitat suitability was also lower in polyhaline salinity waters (<26 ppt) near the Mississippi River delta and plume. Mako sharks selected areas with bathymetry shallower than 800 m, high rugosity, and slopes ranging from 0.3 to 4.5°; however, relatively low habitat suitability was observed in depths <200 m over the West Florida Shelf and Campeche Bank. They also preferred easterly zonal wind velocities of −5 to 0 m s–1, southerly meridional wind velocities above 1.9 m s–1, and moderate Ekman upwelling rates of 4 × 10⁻⁶ to 1.9 × 10⁻⁵ m s–1, consistent with the preferred wind speed and direction. Additionally, there was a minor preference for negative Ekman upwelling values between −6 × 10⁻⁶ and −1 × 10⁻⁵ m s–1, indicating some preference for downwelling conditions.
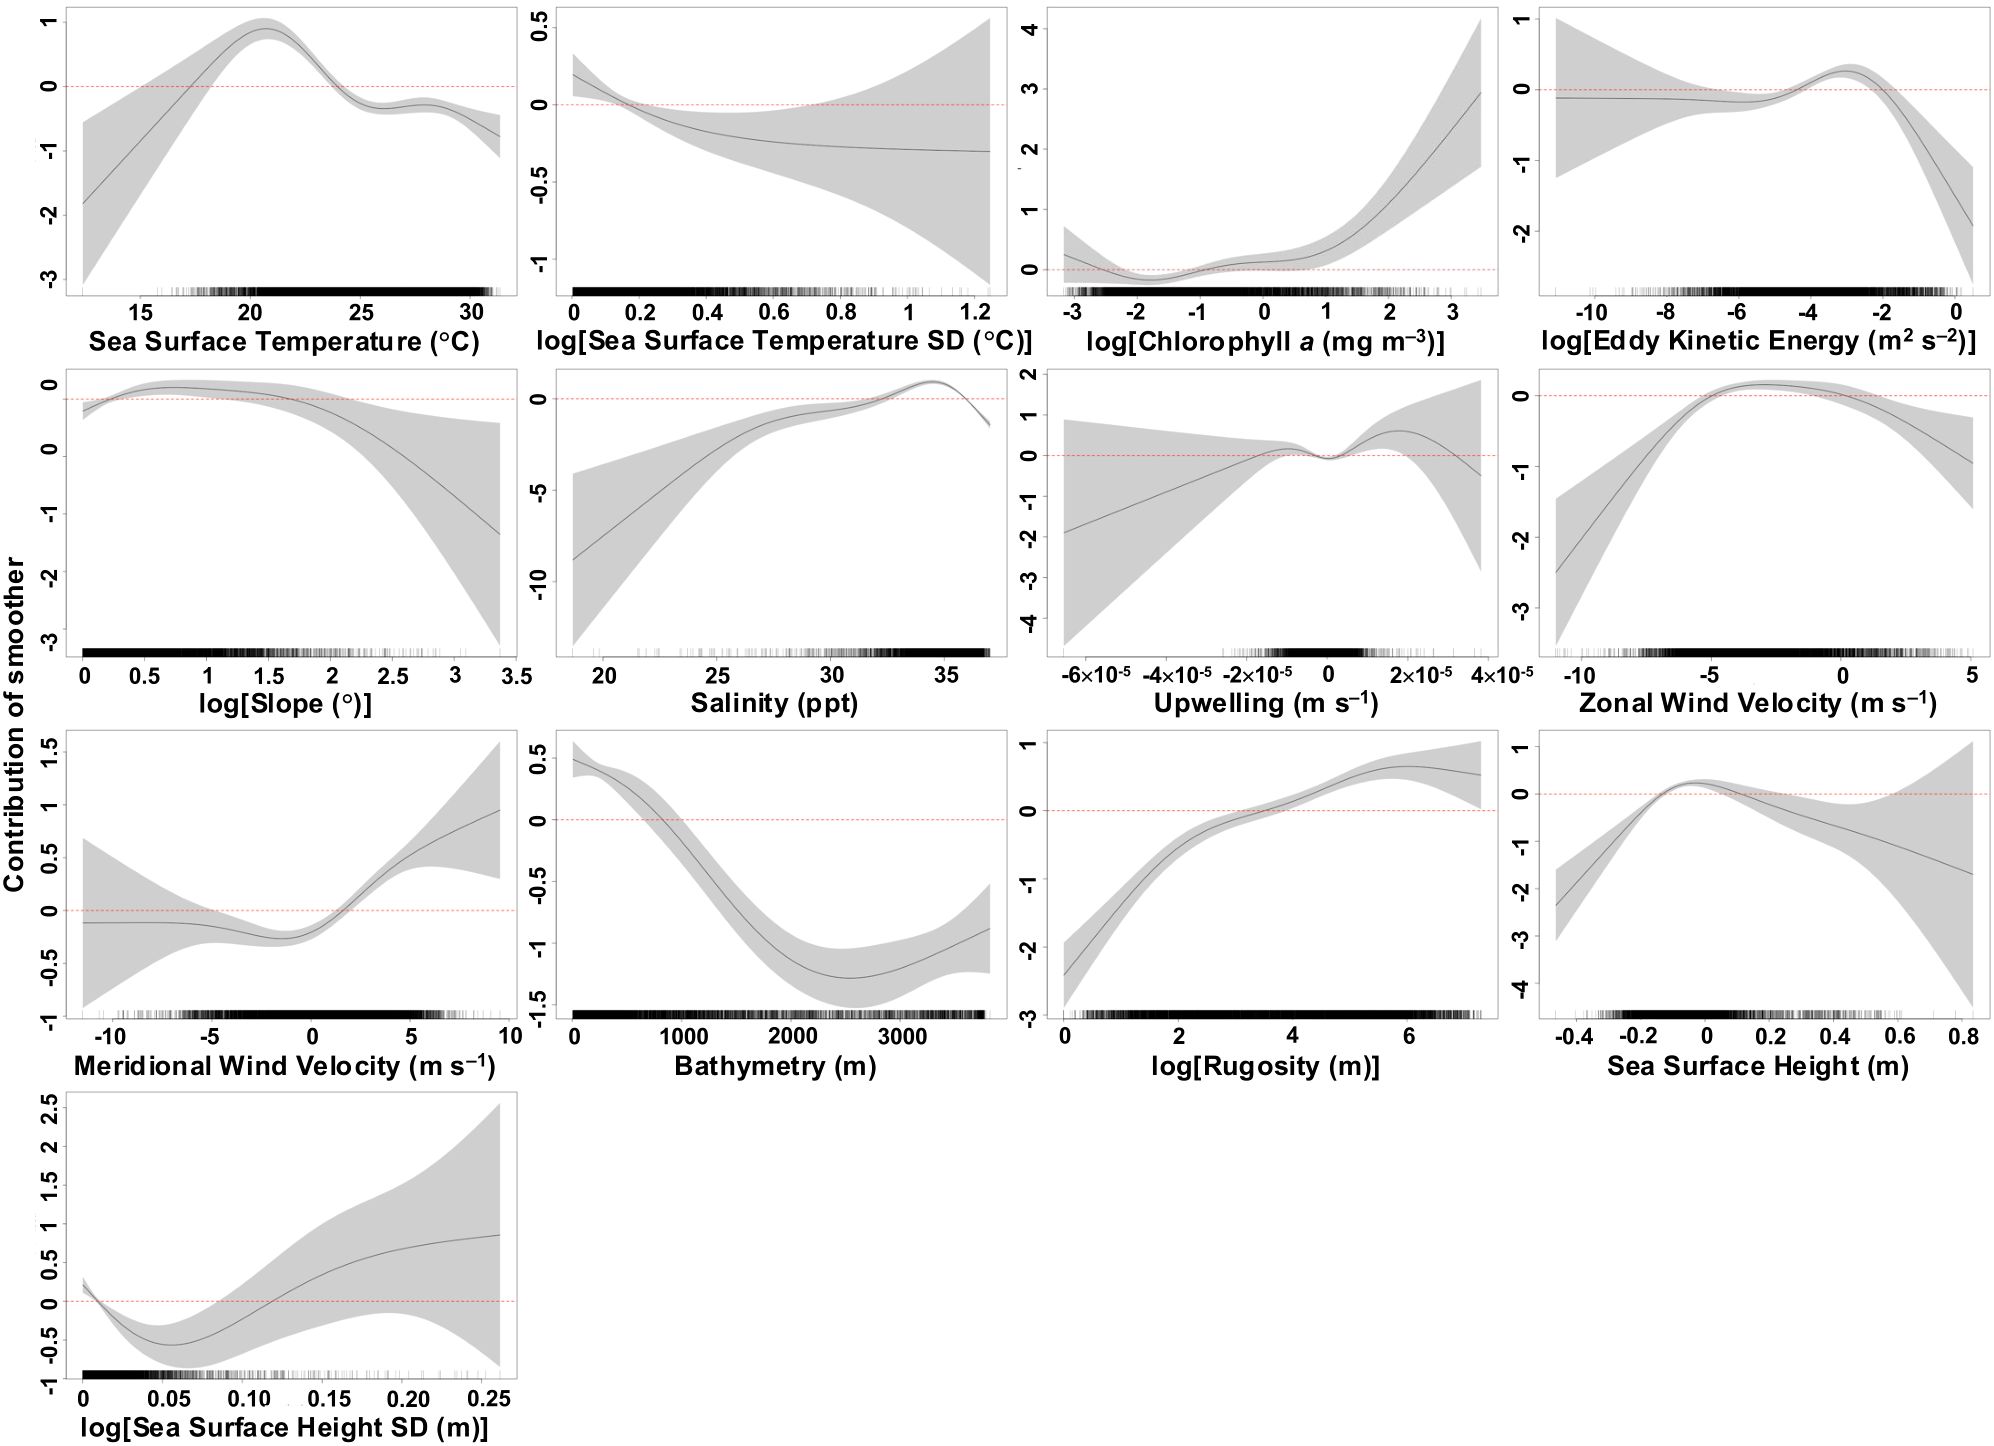
Figure 3. Estimated response curves (black solid line) of component smooth functions on daily probability of occurrence (presence/absence) of shortfin mako sharks from the best-fit generalized additive mixed model. Shaded areas represent 95% confidence limits of uncertainty in the centered smooth. Vertical axes are partial responses (estimated, centered smooth functions) on the scale of the linear predictor. Ticks on x-axis denote values for which there are data from the final presence-(pseudo)absence dataset. Positive values on y-axis (above red dashed line) indicate an increased probability of occurrence (high habitat suitability) of shortfin mako sharks.
The proportion of highly suitable habitat (probability of occurrence ≥ 0.736, Q3) for mako sharks in the Gulf was greatest during winter (0.336) and summer (0.322) compared to spring (0.198) and fall (0.144) and shifted spatially as the seasons progressed (Figure 4). Relative variability in predicted habitat suitability was greater across years than within seasons. Interannual variation, represented by the CV of seasonal predictions across years, was highest east of the Mississippi River delta in spring and summer, and within the Loop Current during fall (Supplementary Figure S3). In contrast, intraannual (monthly) variation, represented by the CV calculated from monthly predictions within each season-year combination, was generally lower throughout most of the Gulf, suggesting persistent seasonal suitability (Supplementary Figure S4). However, variation tended to be highest east of the Mississippi River delta across all seasons, and along nearshore waters of the northern Gulf, where mean predicted habitat suitability was relatively low (Figures 4, Supplementary Figure S4).
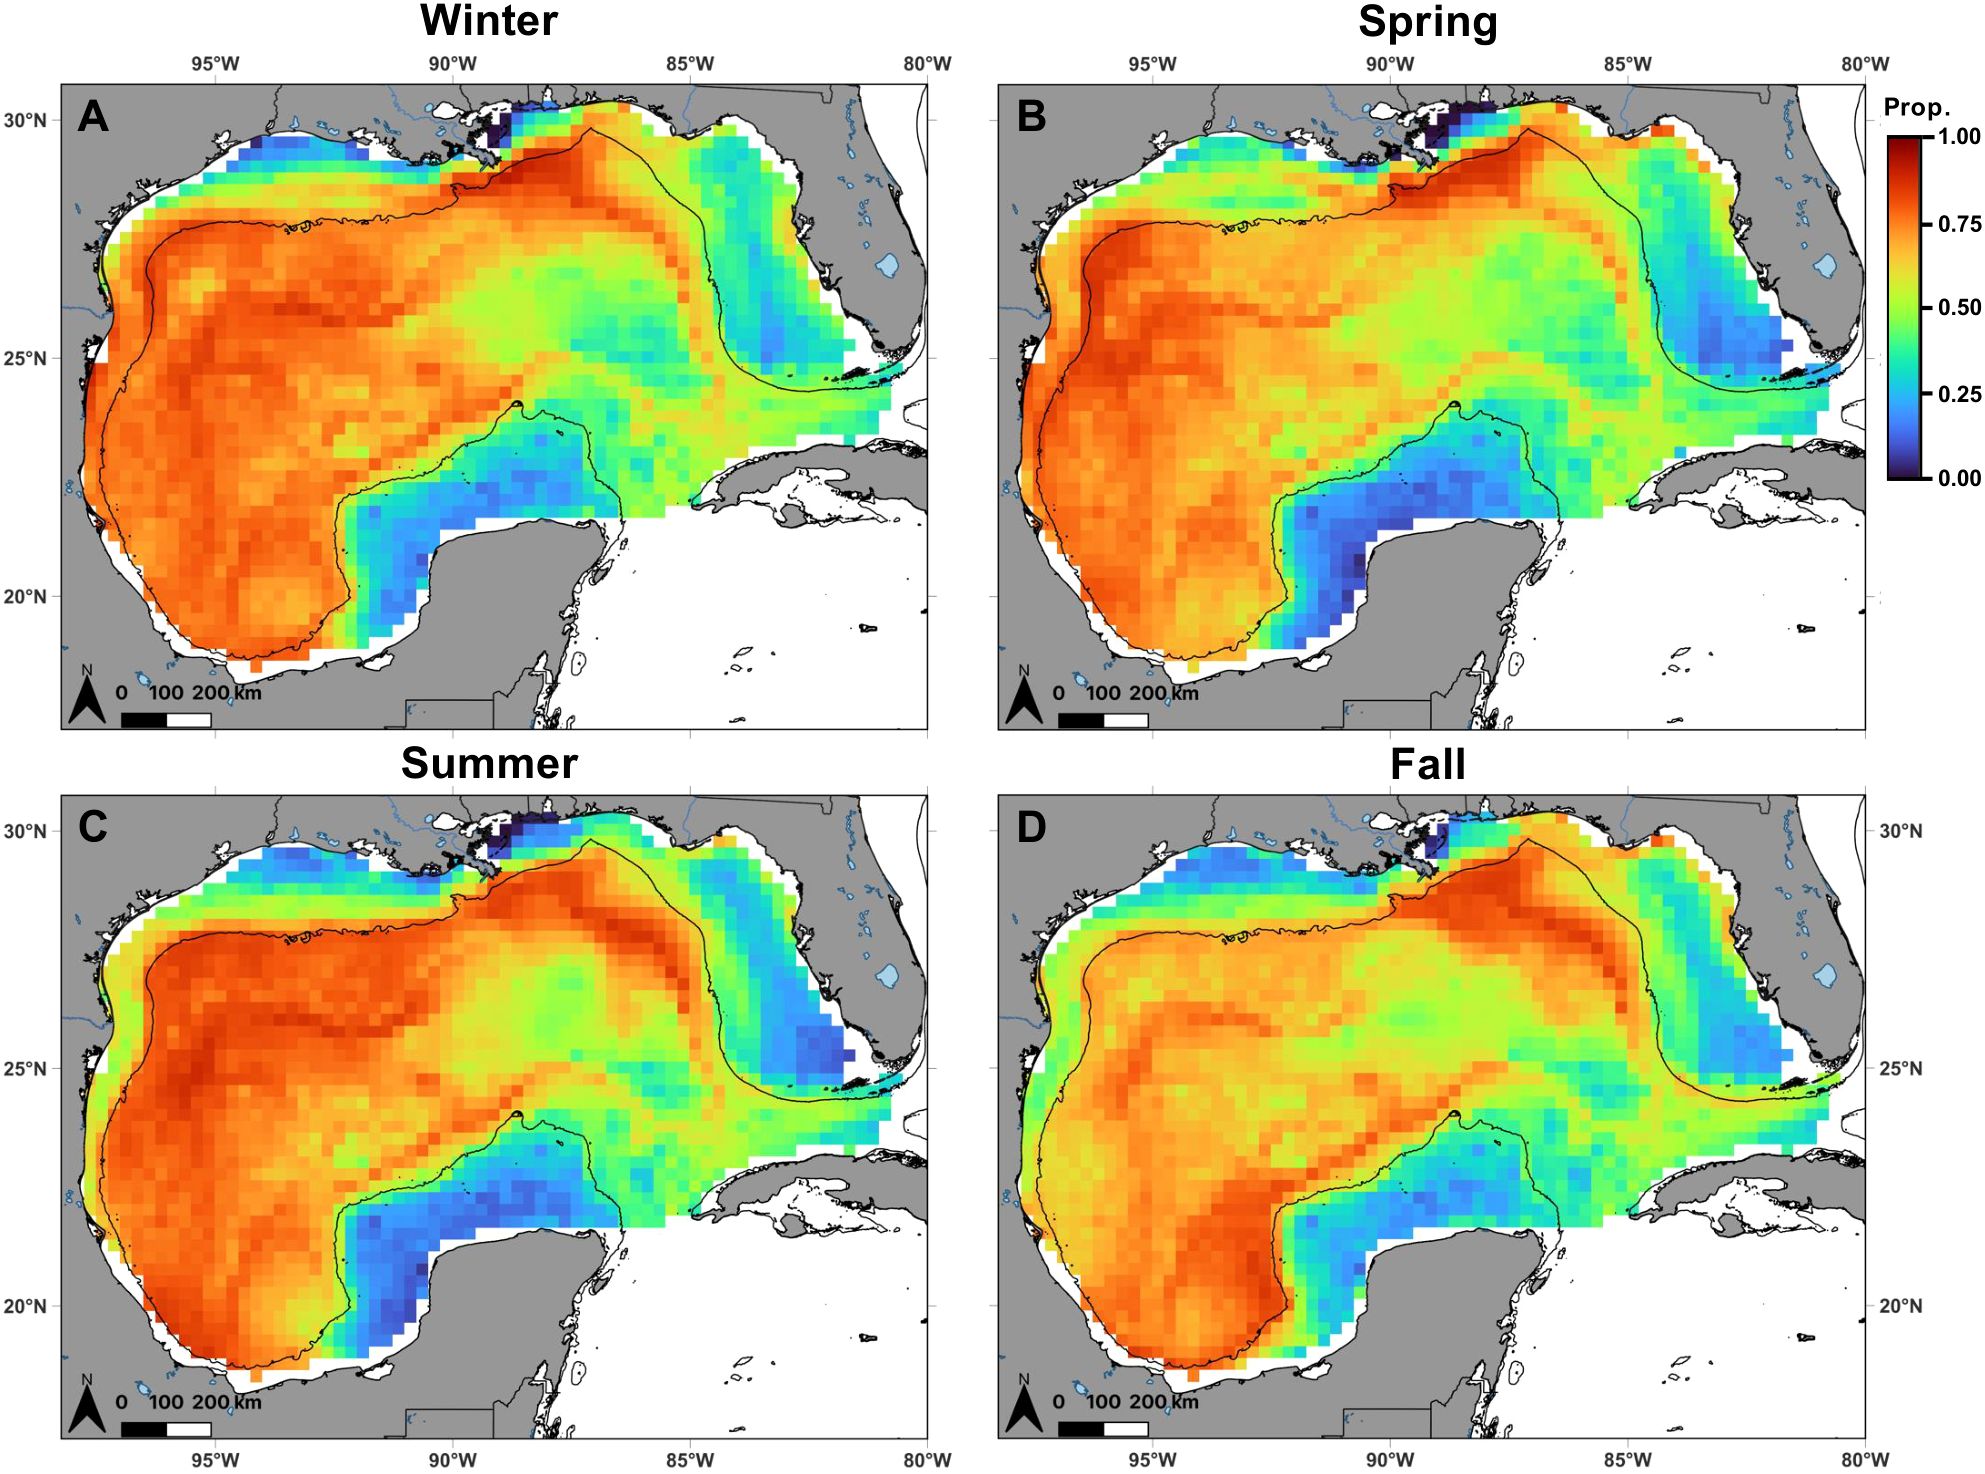
Figure 4. Spatial distribution of shortfin mako shark habitat suitability in the Gulf of Mexico, defined as the probability of occurrence (color) within 0.25° grid cells predicted from the best-fit generalized additive mixed model, during (A) winter (n = 13), (B) spring (n = 17), (C) summer (n = 11), and (D) fall (n = 7). Black lines denote the continental shelf edge contour (i.e., 200 m isobath).
Move persistence
The move persistence model with the lowest AIC included the temporal term month and 7 of the 13 environmental covariates considered in the model selection process and explained 13.33% of deviance in the data set (Table 3), indicating there are additional factors beyond our model explaining the majority of variation in move persistence. SST and surface dissolved oxygen concentrations, which exhibited high collinearity, were both included in the best-fit models (with the lowest AICc) for their respective model selection; however, the model including SST was selected for the previous justification (see Habitat Suitability Results) and direct comparison of move persistence to habitat suitability analyses. Sex was included in the second-best model within a ΔAICc <2 of the best-fit model (with the lowest AICc), which excluded sex. However, sex was non-significant (p > 0.05) and contributed negligibly to predictive performance (ΔAICc = 0.4, ΔRMSE <0.01, Δ%DE = −6.82%). Therefore, sex was excluded from the most parsimonious final model. Month and SST exhibited high pairwise worst-case concurvity (0.90), which is often the case when a smooth of time is included in a model; therefore, SST was selected for inclusion in the most parsimonious model due to its high relative importance in the final habitat suitability model of this study as well as in other mako shark movement studies (Byrne et al., 2019). Low concurvity (<0.42) was observed between the remaining predictor variables. Five-fold cross-validation yielded a mean (± SD) RMSE of 0.13 ± 0.01, while cross-validation by year and month produced mean RMSEs of 0.12 ± 0.03 and 0.14 ± 0.06, respectively. These results indicate relatively accurate and consistent predictions of move persistence, with the average prediction error comprising about 12-14% of the range in move persistence (0 to 1). The covariates with the strongest associations in the model (based on partial deviance explained) included bathymetry and SST (Table 3).
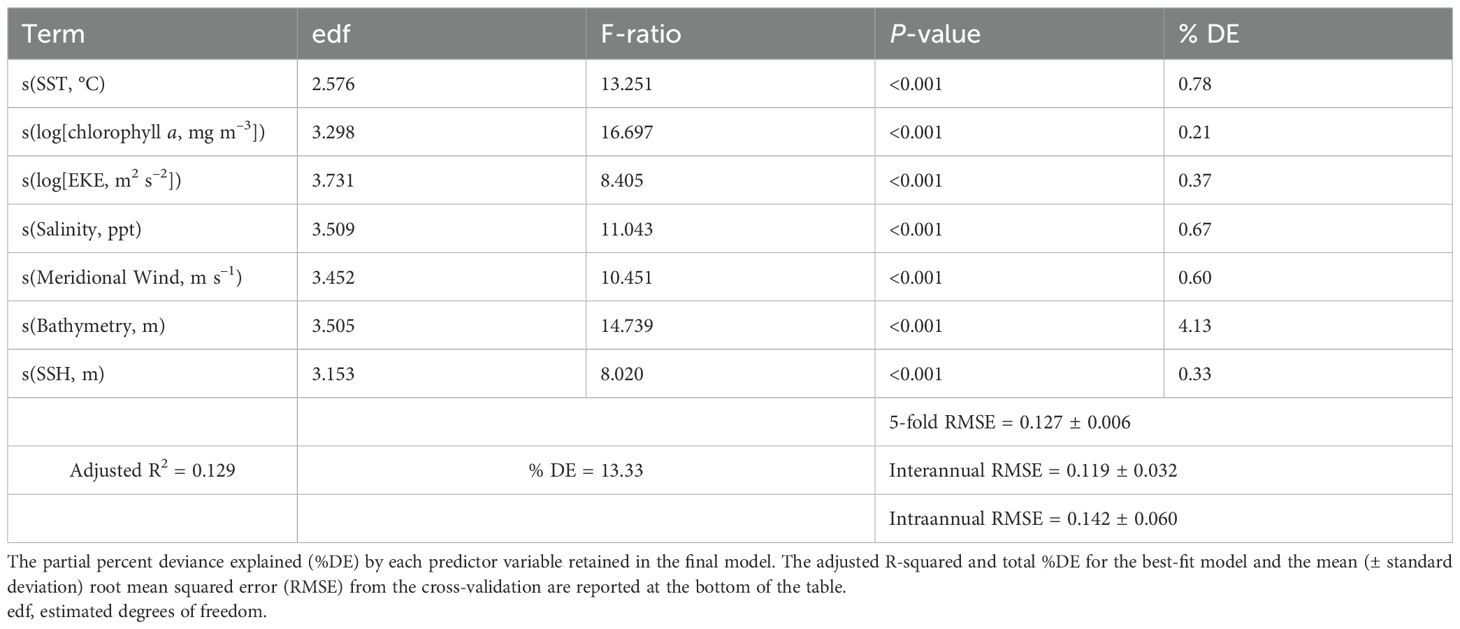
Table 3. Results from the final generalized additive mixed model of shortfin mako shark (Isurus oxyrinchus) move persistence in the Gulf of Mexico.
Mako shark move persistence in the Gulf decreased (lower speed and directionality indicative of area-restricted behavior) with SSTs between 19.6 and 26°C and increased (higher speed and directionality indicative of transiting behavior) at warmer SSTs above 26°C (Figure 5). Move persistence decreased at low EKE values ranging from 0.011 to 0.061 m2 s–2, neutral SSH (−0.1 to 0.6 m), euhaline salinities between 34.5 and 36.2 ppt, and chlorophyll a concentrations between 0.29 and 7.03 mg m–3. Mako sharks increased move persistence at higher EKE and SSH values, in moderate salinities between 28.7 and 34.5 ppt, and in less productive waters with chlorophyll a concentrations below 0.29 mg m–3. Move persistence was lower on continental shelf and slope waters <250 m deep and increased in oceanic waters where the bathymetry was deeper than 1400 m. Move persistence increased in predominantly northerly meridional wind velocities between –4.2 to 1.7 m s–1 and decreased in southerly meridional wind velocities between 1.7 to 7.7 m s–1, indicative of potential upwelling along the western Gulf coast by moving surface waters offshore.
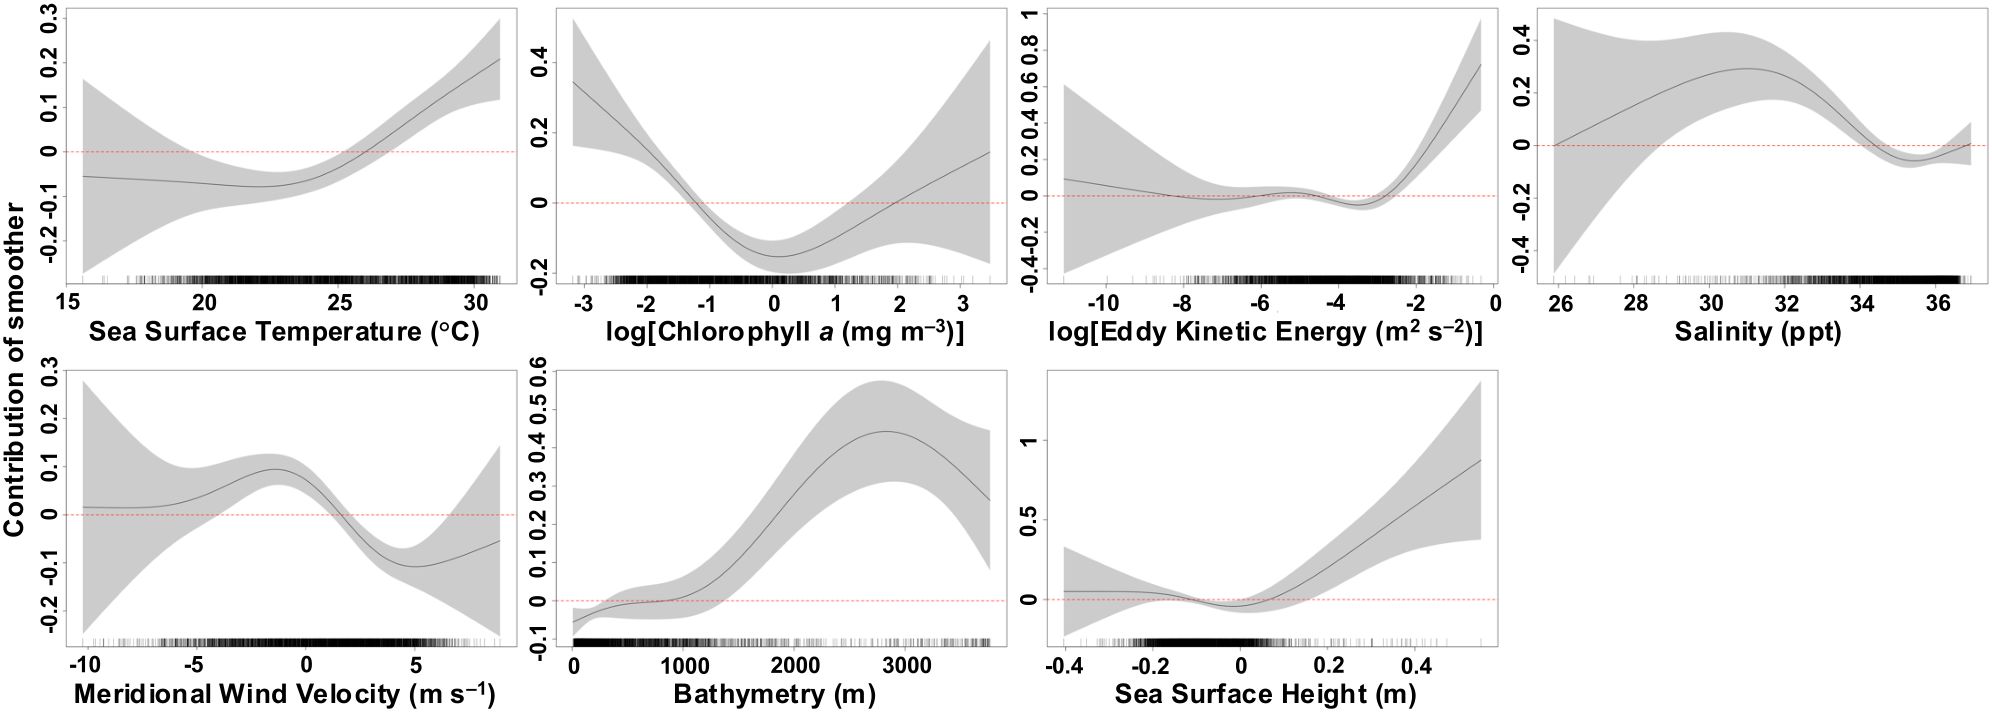
Figure 5. Estimated response curves (black solid line) of component smooth functions on daily move persistence of shortfin mako sharks from the best-fit generalized additive mixed model. Shaded areas represent 95% confidence limits of uncertainty in the centered smooth. Vertical axes are partial responses (estimated, centered smooth functions) on the scale of the linear predictor. Ticks on x-axis denote values for which there are data from the move persistence state-space model dataset. Positive values on y-axis (above red dashed line) indicate increased move persistence (high speed and directionality indicative of transiting behavior) by shortfin mako sharks.
Move persistence in the Gulf varied among individual mako sharks, with mean (± SD) values ranging from 0.66 ± 0.14 (Shark 16) to 0.91 ± 0.07 (Shark 10; Figure 1B). These relatively moderate to high mean move persistence values translated to a predicted range of 0.60–0.92 across seasons from the best-fit model. The proportion of habitat predicted to exhibit lower move persistence (γt ≤0.77, Q1) for mako sharks in the Gulf was highest in winter (0.463) and spring (0.313) compared to fall (0.134) and summer (0.091), with a spatial shift across seasons (Figure 6). Conversely, the proportion of habitat with predicted higher move persistence (γt ≥0.82, Q3) was lowest in winter (0.138) and spring (0.171) relative to fall (0.294) and summer (0.397). Similar to habitat suitability, relative variability in predicted move persistence was greater across years than within seasons. Interannual variation was relatively consistent throughout most of the Gulf across all seasons, except within the Loop Current, where variability was higher (Supplementary Figure S5). In contrast, intraannual variation was generally low across the Gulf, suggesting persistent seasonal move persistence (Supplementary Figure S6). However, intraannual variation tended to be highest within the Loop Current and its associated eddies, where mean predicted move persistence was relatively high, indicative of transiting behavior (Figures 6, Supplementary Figure S6).
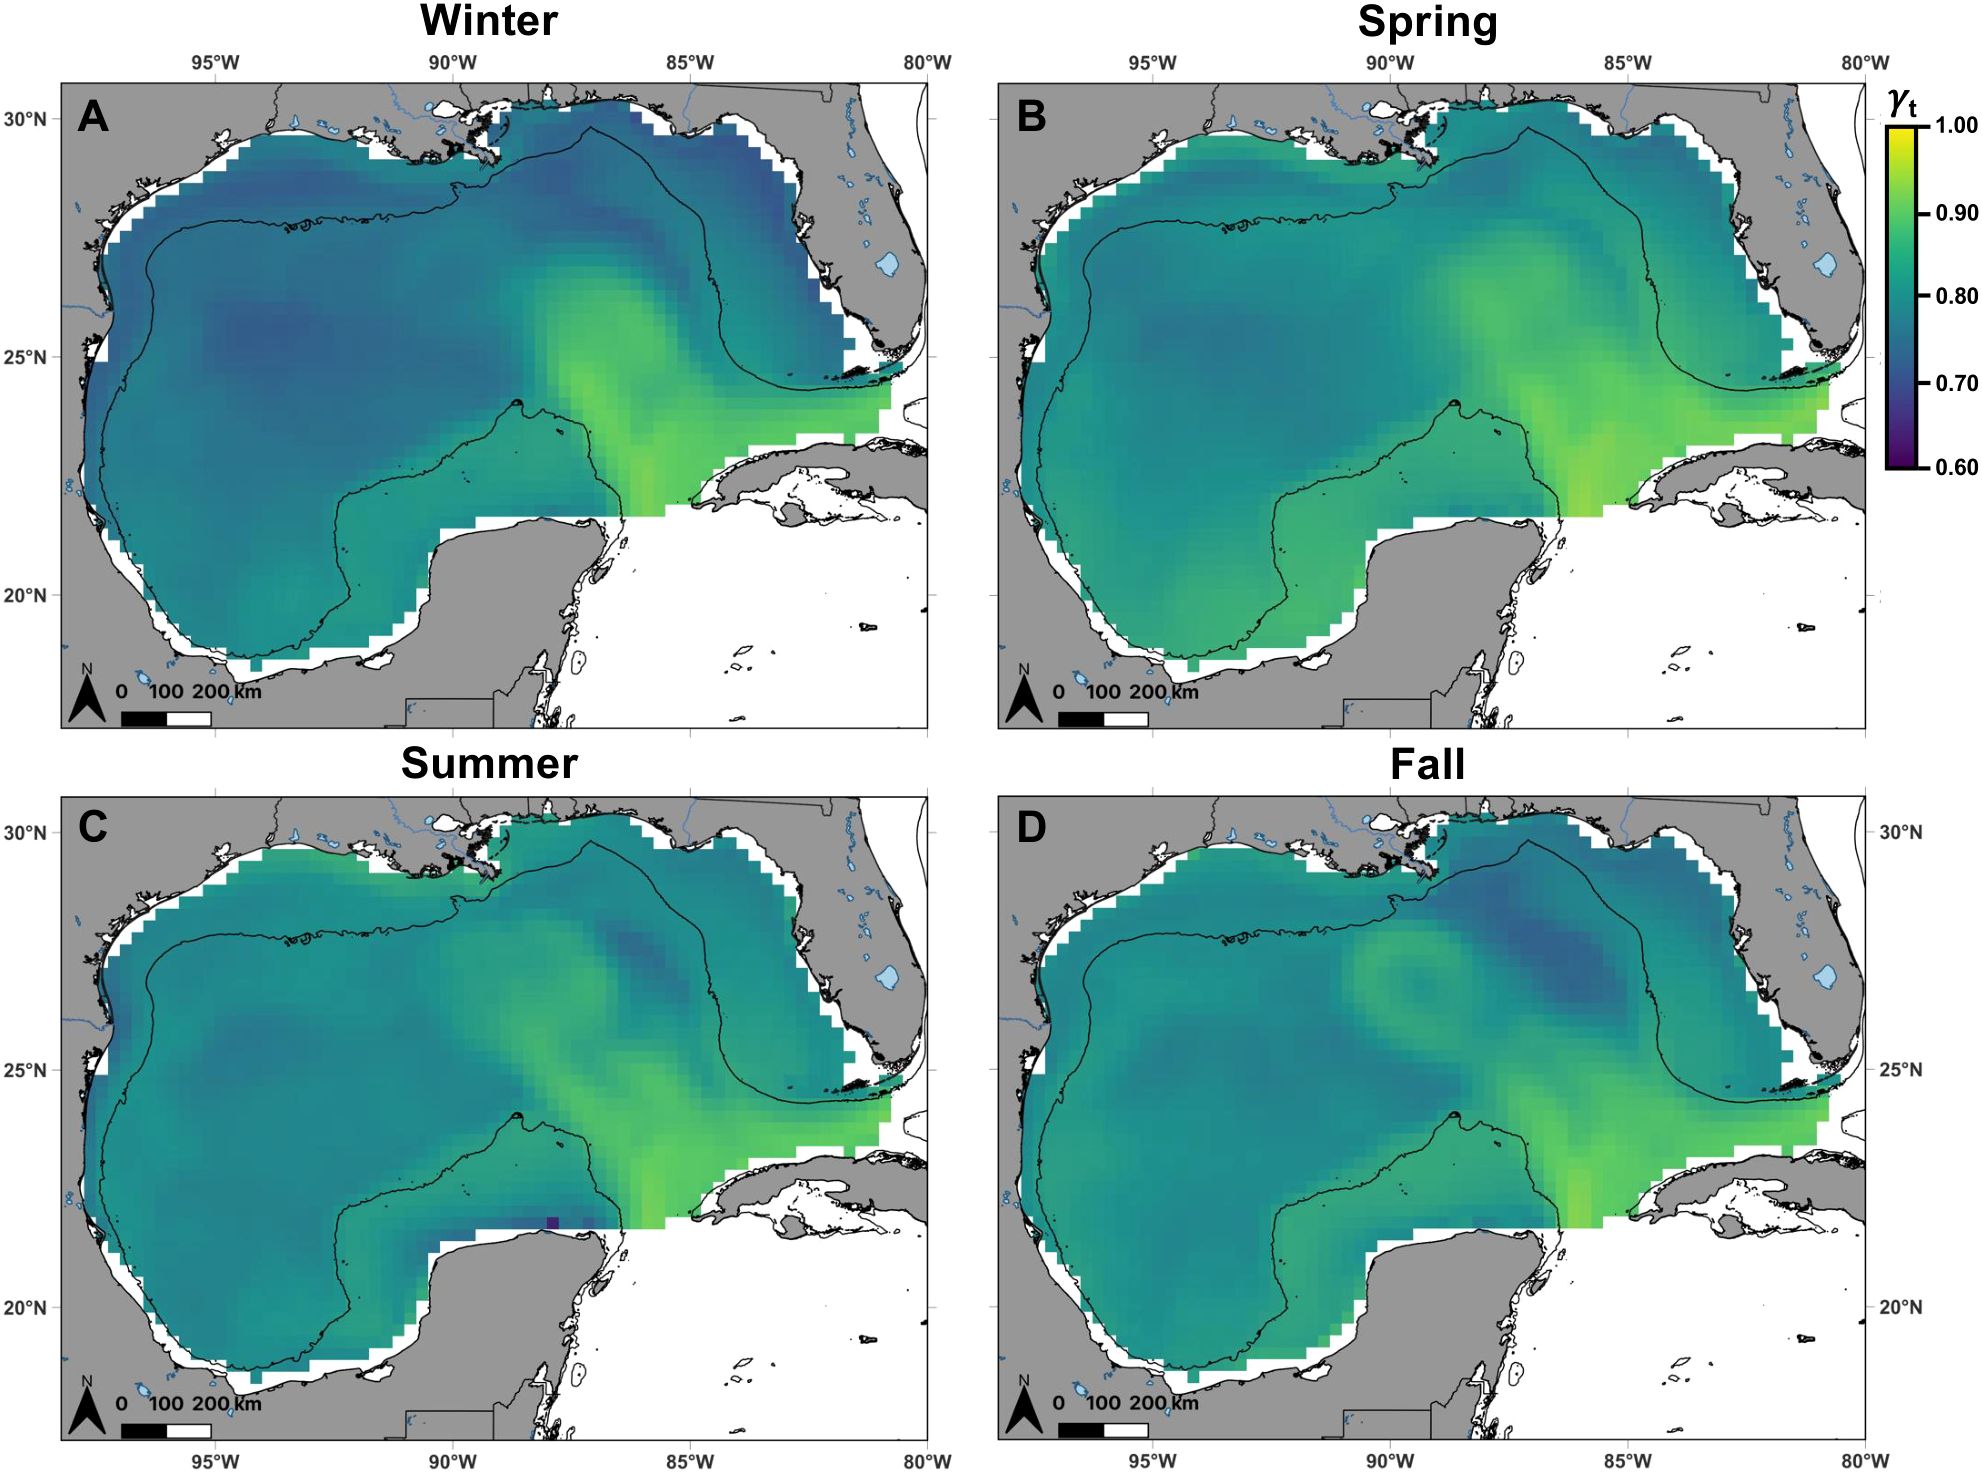
Figure 6. Spatial distribution of shortfin mako shark move persistence (color) in the Gulf of Mexico within 0.25° grid cells predicted from the best-fit generalized additive mixed model, during (A) winter (n = 13), (B) spring (n = 17), (C) summer (n = 11), and (D) fall (n = 7). The move persistence index identifies changes in behavior along a continuum ranging from 0 (low speed and directionality indicative of area-restricted behavior) to 1 (high speed and directionality indicative of transiting behavior). Predicted move persistence of shortfin mako sharks in the Gulf of Mexico ranged from 0.60 to 0.92. Black lines denote the continental shelf edge contour (i.e., 200 m isobath).
Discussion
This study builds upon previous efforts (Gibson et al., 2021) to provide the most comprehensive electronic tracking dataset on mature mako sharks in the Gulf to date. Our results reveal previously undocumented spatial behaviors and highlight regional patterns in habitat use that differ from earlier findings based on smaller sample sizes or different life history stages. Notably, both mature male and female mako sharks exhibited year-round residency in the northwestern Gulf, in contrast to prior observations of broader dispersal (Gibson et al., 2021) and greater use of the Campeche Bank by juveniles (Vaudo et al., 2017; Byrne et al., 2019; Garrison, 2023). These differences suggest potential demographic and geographic variability in movement patterns across the North Atlantic stock, with implications for understanding mako shark ecology and informing life stage-specific management. Furthermore, the regional fidelity observed in this study, combined with the relatively high degree of international exchange between the U.S. Gulf and other nearby countries (e.g., Mexican waters), underscores the need for both national and cooperative international management strategies. These findings can aid the development of spatially-explicit stock assessment models, which commonly produce more precise and biologically realistic estimates than those that do not consider movement (Braccini et al., 2016). Collectively, this study offers essential information for developing future federal and international management plans aimed at promoting the sustainability of this economically and ecologically important living marine resource. In addition, our use of complementary methods—core use areas, habitat suitability, and move persistence—provides a multidimensional perspective on mako shark space use, allowing for a more robust identification of core habitat and movement corridors than any single method alone.
Core use areas
Contrary to findings from our previous study (Gibson et al., 2021), which was based on a more limited sample size, this study revealed that both mature male and female mako sharks remained in the northwestern Gulf year-round. Moreover, the home range (75-95% UD) of 95 mako sharks previously tagged in the U.S. western North Atlantic Ocean and near Isla Mujeres, Mexico, in the Caribbean Sea (Vaudo et al., 2017; Garrison, 2023), displayed minimal distributional overlap with the core use areas (50% UD) identified in this study, which occurred predominantly within the northwestern Gulf (i.e., west of the Mississippi River delta). By contrast, previous tagging studies identified the use of the West Florida Shelf and Campeche Bank, areas not observed in the present study. While the tagging location of all mako sharks in this study (northwestern Gulf) may have biased these results, the long track durations (mean 270 days) revealed demographic-based differences in core use areas and home ranges between mako shark movements tracked in this study and those tagged in the U.S. western North Atlantic and international waters.
Notably, two mature males made extensive large-scale migrations that crossed multiple management jurisdictions, as documented by Gibson et al. (2021), demonstrating the need for cooperative international management to conserve and rebuild the declining North Atlantic stock. These individuals exited the Gulf in the late summer to early fall and returned in late fall to early winter each year. While the timing of these directed migrations showed a consistent pattern, the destination and residency time at each destination varied between individuals. Resident behavior of these two males overlapped with previously reported core use areas of juvenile mako sharks tagged in U.S. western North Atlantic waters and the home ranges of juveniles tagged near Isla Mujeres (Garrison, 2023). Observations of non-migratory individuals (i.e., partial migration; Papastamatiou et al., 2013) and disparate tracks of migratory individuals underscore the complexity of mako shark behavior and habitat use. These findings suggest that the northwestern Gulf, including areas on and off the Louisiana-Texas shelf, may be a previously unidentified important area for mako sharks, supporting a fairly resident population and attracting transiting mako sharks from elsewhere in the western North Atlantic Ocean.
Habitat suitability
Mako sharks exhibited higher habitat suitability in shelf and shelf-slope waters, which has also been observed for mako sharks in the eastern North Pacific Ocean (Block et al., 2011), western North Atlantic Ocean (Byrne et al., 2019), South Australian Bight (Rogers et al., 2015), and the western South Pacific Ocean (Francis et al., 2019). Shelf and shelf-slope waters in the northwestern Gulf may be attractive to mako sharks due to high primary productivity (Dagg et al., 1991), the abundance and diversity of available prey (Murawski et al., 2018), and bathymetric complexity, including shelf-edge banks (Gledhill, 2001; Nash et al., 2013) and oil and gas platforms that aggregate prey and HMS (Snodgrass et al., 2020). Productivity and biomass are highest on the continental shelf and decrease offshore with depth (Pequegnat et al., 1990; Rabalais, 1990; Spies et al., 2016). For example, mesoscale eddies shed from the Loop Current in the eastern Gulf enhance primary and secondary productivity as they migrate westward along the continental shelf edge, eventually shoaling and degrading in the northwest Gulf (Sturges and Leben, 2000; Spies et al., 2016). Additionally, seasonal upwelling (Zavala-Hidalgo et al., 2006) and nutrient-rich freshwater inputs from the Mississippi River flow westward, further enhancing productivity on the Louisiana-Texas shelf (Dinnel and Wiseman, 1986; Nowlin et al., 2005). Moreover, higher habitat suitability was associated with euhaline salinities and near-neutral SSH values, suggesting that mako sharks may be using areas where productivity-enhancing processes—such as freshwater input and mesoscale eddies—have already dispersed or degraded, potentially allowing them to benefit either directly or indirectly from these oceanographic features.
Mako sharks preferred cooler SSTs between 17.5°C and 24°C, reflecting similar patterns observed across their range (Block et al., 2011; Rogers et al., 2015; Francis et al., 2019), including in the western North Atlantic Ocean, where they avoided the warmer waters of the Gulf Stream and Sargasso Sea (Byrne et al., 2019). As SSTs increased, mako sharks were observed to spend less time in the upper 50 m of the water column, likely seeking thermal refugia in deeper waters (Vaudo et al., 2016; Byrne et al., 2024). This temperature-driven vertical habitat use suggests they do not use surface waters and the water column consistently, which may have implications for successful Argos satellite transmissions at higher SSTs.
Predicted habitat suitability was also associated with moderate easterly zonal wind velocities, higher southerly meridional wind velocities, and moderate Ekman upwelling, suggesting a potential link between wind-driven oceanographic processes and habitat preference. In the northern Gulf, surface winds are primarily from the south-southwest during summer and shift to more easterly directions during the remainder of the year (Gutiérrez de Velasco and Winant, 1996; Ohlmann and Niiler, 2005). Easterly winds can induce coastal upwelling along the northern Gulf by driving offshore Ekman transport, allowing deeper, nutrient-rich waters to rise to the surface. Similarly, southerly winds can generate upwelling along the western Gulf coast. These wind-driven upwelling dynamics may enhance primary productivity in shelf and slope waters, contributing to suitable habitat conditions for mako sharks.
Move persistence
Movement behavior in the Gulf varied among individual mako sharks, with relatively moderate to high mean move persistence values, likely reflecting the highly migratory nature of this species and the spatiotemporal resolution of 24-h time steps used in the SSM. Move persistence decreased (lower speed and directionality) at SSTs between 19.6°C and 26°C and increased (higher speed and directionality) at SSTs above 26°C. These patterns corresponded with higher habitat suitability observed at SSTs between 17.5°C and 24°C and the apparent avoidance of warmer waters.
Move persistence increased as mako sharks entered the Loop Current during migrations through the Yucatán Channel or Straits of Florida, coinciding with higher EKE and SSH values. This pattern aligns with habitat suitability analyses, which showed lower probabilities of occurrence in the Loop Current. Conversely, move persistence was lower in continental shelf and slope waters and higher in deep oceanic waters, findings consistent with habitat suitability from this study and prior research on mako shark movement behavior across their range (Rogers et al., 2015; Byrne et al., 2019; Francis et al., 2019).
Mako sharks also exhibited increased move persistence when experiencing moderate salinities (28–34 ppt), suggesting avoidance of nearshore areas with high freshwater input, such as the Mississippi River delta and plume (Fournier et al., 2016). At the Mississippi River mouth, seasonal hypoxia forms in the spring and persists throughout the summer in nearshore waters along the Louisiana-Texas shelf (Rabalais et al., 2002; Bianchi et al., 2010). Therefore, low habitat suitability and increased move persistence in these nearshore areas may reflect avoidance of low-oxygen water. These findings are consistent with observations for scalloped hammerhead sharks (Sphyrna lewini) satellite-tracked in the Gulf (Wells et al., 2018).
Decreased move persistence was observed in areas with higher chlorophyll a concentrations, which may act as a proxy for marine productivity, thereby acting as a reasonable indicator of prey biomass (Benoit-Bird and Au, 2003). While interpreting foraging behavior based on move persistence is challenging without prior knowledge of prey availability (Florko et al., 2023) or feeding success (Bestley et al., 2008), regions where mako sharks spend more time remain critical for habitat protection and conservation (Hays et al., 2019). Similar patterns have been reported for salmon sharks (Lamna ditropis), a close kin of mako sharks, which exhibited slower, more sinuous swimming patterns in areas with high chlorophyll a concentrations in the eastern North Pacific Ocean (Weng et al., 2008). Likewise, seasonal movements of mako sharks in the eastern North Pacific Ocean coincided with changing temperatures and high chlorophyll a concentrations (Block et al., 2011; Nasby-Lucas et al., 2019).
The relatively low proportion of deviance explained (13.33%) by the model highlights the complex nature of mako shark move persistence, which is shaped by a broad array of factors. While key environmental drivers such as SST and bathymetry were associated with meaningful patterns in move persistence, substantial behavioral variability remains unexplained. This is likely due to the influence of other factors, such as prey distribution, social or reproductive behavior, or physiological state, that were not incorporated into the model. Such variability is common in studies of HMS and reflects both the challenges and importance of considering diverse data sources (e.g., prey availability, energetics, or fine-scale tracking) to improve behavioral inference.
Management implications
The use of multiple complimentary approaches—core use areas, habitat suitability, and move persistence—in this study provided a multidimensional perspective on mako shark space use. Core use areas identified regions of concentrated activity based on tracking data, habitat suitability models revealed the environmental conditions driving these patterns and enabled extrapolation beyond observed locations, and move persistence analyses helped differentiate between area-restricted and transiting behaviors. Although each method has inherent limitations, such as dependence on simulated pseudo-absences or sensitivity to model assumptions, their combined application enhances ecological interpretation and increases confidence in identifying biologically important habitats. This integrative framework can inform the design of spatial management tools and is broadly applicable to other HMS, particularly for reducing overlap with anthropogenic threats.
In this study, mako sharks exhibited resident behavior in areas of higher habitat suitability, such as productive shelf and shelf-slope waters, while transiting behavior, indicated by higher move persistence, was observed in less suitable habitats and migration corridors, including regions influenced by the Loop Current. These corridors, essential for connecting key habitats such as feeding and breeding grounds (Chapman et al., 2015), underscore the importance of protecting both core use areas and migration corridors. Together, this dual approach offers a practical framework for enhancing conservation efforts and mitigating risks (Ferreira et al., 2024), such as spatially concentrated fishing pressure, to promote the sustainability of the North Atlantic mako shark stock and other HMS.
The variability observed in mako shark movements has direct implications for conservation planning, cautioning against static spatial management approaches and reinforcing the need for adaptive, flexible management strategies. Approaches that account for environmental variability—such as dynamic spatial management tools (Hazen et al., 2018) and ecosystem-based fisheries management (Huynh et al., 2022; Taylor and Walter, 2024)—are better suited to address the natural complexity of mako shark behavior and mitigate their exposure to anthropogenic risks. For example, dynamic spatial tools such as time-area closures or adaptive fishing effort shifts linked to oceanographic conditions or features could help reduce bycatch risk in both core use areas and key migration corridors, where sharks may be more vulnerable to concentrated fishing pressure (McDonnell et al., 2024). Additionally, future work should evaluate the effects of climate variability and long-term oceanographic change on the distributional range and migratory phenology of mako sharks, particularly to assess whether their movements begin to shift beyond current spatial management zones that have been affording them protection from commercial fishing and bycatch (Hammerschlag et al., 2022). Understanding how climate-driven habitat shifts might affect exposure risk is critical for ensuring that conservation measures remain effective under changing ocean conditions.
Most mako sharks in this study remained in the northwestern Gulf year-round, yet some individuals are capable of undertaking large-scale movements. If mature male and female mako sharks show philopatry to specific areas within national EEZs, such as the U.S. Louisiana-Texas shelf and Mexican Tamaulipas-Veracruz shelf, adopting and enforcing current management recommendations (e.g., retention bans) in these regions may have a disproportionate impact on rebuilding efforts and emphasize the need for national management. Correspondingly, large-scale movements across multiple jurisdictional boundaries, as observed for two mature males, emphasize the need for international cooperative management to conserve this imperiled species. The observed intra-population variability in movement has clear importance in the context of managing HMS at the ocean basin scale, and the development of meaningful, spatially explicit models that rely heavily on rates of exchange among different regions (Sibert and Hampton, 2003). Our study and others suggest migratory variations and potential sex- and size-based segregation within the North Atlantic stock that may warrant consideration in future management strategies (Mucientes et al., 2009; Gibson et al., 2021; but see Byrne et al., 2019 and Natanson et al., 2020). Although sex and size did not emerge as strong predictors of habitat suitability or move persistence in our models, the underrepresentation of female sharks (n = 5 of 17; 29%) and the predominance of mature individuals (n = 15 of 17; 88%) in our dataset may have influenced these results.
Limitations and future directions
This study provides new information on the movement ecology of North Atlantic mako sharks, particularly for mature individuals underrepresented in previous scientific efforts. While it represents the most comprehensive electronic tracking dataset on mature mako sharks in the Gulf to date, several limitations should be considered. Observed habitat use and movements may have been influenced by the design of SPOT tags, which provide Argos locations only when the tag breaks the surface of the water—potentially biasing detections toward surface-oriented behavior. However, 84.9% of temporal gaps between raw Argos locations in individual tracks were less than 24 h, indicating relatively high temporal resolution across most tracks. Additionally, all sharks were tagged in the northwestern Gulf, which may have introduced spatial biases in model predictions due to the limited geographic scope of tagging efforts. As a result, habitat suitability and move persistence estimates for the eastern Gulf—where telemetry coverage was sparse—should be interpreted with caution.
Although few tagged individuals entered the eastern Gulf, absence of use does not necessarily indicate habitat unsuitability. Our models were constructed using environmental variables that vary spatially across the entire Gulf, enabling extrapolation into unvisited areas. These predictions can reveal environmentally suitable regions not used by tagged individuals, potentially due to tagging location bias, population structuring, or individual behavior. Presence-only telemetry datasets may underrepresent the full environmental niche of a species when track sample sizes, durations, or deployment locations are limited (Pinti et al., 2022; Braun et al., 2023). Accordingly, extrapolated predictions should be interpreted with caution, but remain valuable for identifying potential habitat and guiding future research and spatial management (Crear et al., 2021).
Despite these constraints, habitat suitability and move persistence models linked to environmental conditions remain powerful tools for uncovering biologically meaningful patterns when interpreted within the context of their assumptions. Future efforts should prioritize expanding tagging coverage to include a broader range of locations and seasons, as well as achieving a more balanced representation of sexes and life stages. In particular, long-term tracking of young-of-the-year (Nosal et al., 2019) and reproductively mature or gravid females is needed to identify potential mating and parturition areas and determine whether proposed nursery grounds exist within the Gulf (Natanson et al., 2020). Confirming such habitats would support the implementation of targeted protective measures for early life stages, aiding recruitment and recovery (Mucientes et al., 2025). Broader tracking efforts would also facilitate evaluation of potential multiple reproductive stocks, improve management confidence, and contribute to rebuilding efforts for this imperiled species.
Data availability statement
The raw data supporting the conclusions of this article will be made available by the authors, without undue reservation.
Ethics statement
The animal study was approved by Texas A&M University-Corpus Christi’s Institutional Animal Care and Use Committee-Animal Use Committee. The study was conducted in accordance with the local legislation and institutional requirements.
Author contributions
KG: Conceptualization, Data curation, Formal Analysis, Funding acquisition, Investigation, Methodology, Project administration, Supervision, Writing – original draft, Writing – review & editing. DC: Conceptualization, Data curation, Formal Analysis, Funding acquisition, Investigation, Methodology, Project administration, Supervision, Writing – original draft, Writing – review & editing. MF: Writing – original draft, Writing – review & editing. GS: Conceptualization, Funding acquisition, Investigation, Writing – original draft, Writing – review & editing.
Funding
The author(s) declare that financial support was received for the research and/or publication of this article. Funding was provided in part by Texas Parks and Wildlife Department State Wildlife Grant (#CA-0000899), the Harte Research Institute, and the Coastal Conservation Association -Texas.
Acknowledgments
We would like to thank the staff and students of the Center for Sportfish Science and Conservation at the Harte Research Institute for their assistance in the field, Eric Ozolins, Dwade Hickey, Ricky Torres, Captain Chad Banks, Captain “Jx” Yeaney, Captain Fred Mallett, and the crew of the Fisherman’s Wharf for their help in the field. Considerable logistical support was provided by the Harte Research Institute and Texas A&M University-Corpus Christi.
Conflict of interest
The authors declare that the research was conducted in the absence of any commercial or financial relationships that could be construed as a potential conflict of interest.
Generative AI statement
The author(s) declare that no Generative AI was used in the creation of this manuscript.
Publisher’s note
All claims expressed in this article are solely those of the authors and do not necessarily represent those of their affiliated organizations, or those of the publisher, the editors and the reviewers. Any product that may be evaluated in this article, or claim that may be made by its manufacturer, is not guaranteed or endorsed by the publisher.
Supplementary material
The Supplementary Material for this article can be found online at: https://www.frontiersin.org/articles/10.3389/fmars.2025.1562581/full#supplementary-material
References
Bailey H., Shillinger G., Palacios D., Bograd S., Spotila J., Paladino F., et al. (2008). Identifying and comparing phases of movement by leatherback turtles using state-space models. J. Exp. Mar. Biol. Ecol. 356, 128–135. doi: 10.1016/j.jembe.2007.12.020
Barbet-Massin M., Jiguet F., Albert C. H., and Thuiller W. (2012). Selecting pseudo-absences for species distribution models: How, where and how many? Methods Ecol. Evol. 3, 327–338. doi: 10.1111/j.2041-210X.2011.00172.x
Bartoń K. (2023). MuMIn: Multi-Model Inference. R package version 1.47.5. Available online at: https://CRAN.R-project.org/package=MuMIn (Accessed September 4, 2024).
Becker E. A., Carretta J. V., Forney K. A., Barlow J., Brodie S., Hoopes R., et al. (2020). Performance evaluation of cetacean species distribution models developed using generalized additive models and boosted regression trees. Ecol. Evol. 10, 5759–5784. doi: 10.1002/ece3.v10.12
Benhamou S. (2011). Dynamic approach to space and habitat use based on biased random bridges. PloS One 6, e14592. doi: 10.1371/journal.pone.0014592
Benoit-Bird K. J. and Au W. W. L. (2003). Prey dynamics affect foraging by a pelagic predator (Stenella longirostris) over a range of spatial and temporal scales. Behav. Ecol. Sociobiol. 53, 364–373. doi: 10.1007/s00265-003-0585-4
Bestley S., Patterson T. A., Hindell M. A., and Gunn J. S. (2008). Feeding ecology of wild migratory tunas revealed by archival tag records of visceral warming. J. Anim. Ecol. 77, 1223–1233. doi: 10.1111/j.1365-2656.2008.01437.x
Bianchi T. S., DiMarco S. F., Cowan C.OMMAJr. J. H., Hetland R. D., Chapman P., Day J. W., et al. (2010). The science of hypoxia in the Northern Gulf of Mexico: a review. Sci. Total Environ. 408, 1471–1484. doi: 10.1016/j.scitotenv.2009.11.047
Block B. A., Jonsen I. D., Jorgensen S. J., Winship A. J., Schaffer A. S., Bograd S. J., et al. (2011). Tracking apex marine predator movements in a dynamic ocean. Nature 475, 86–90. doi: 10.1038/nature10082
Braccini M., Aires-da-Silva A., and Taylor I. (2016). Incorporating movement in the modelling of shark and ray populations dynamics: approaches and management implications. Rev. Fish Biol. Fish. 26, 13–24. doi: 10.1007/s11160-015-9406-x
Braun C. D., Arostegui M. C., FarChadi N., Alexander M., Afonso P., Allyn A., et al. (2023). Building use-inspired species distribution models: using multiple data types to examine and improve model performance. Ecol. Appl. 33, e2893. doi: 10.1002/eap.v33.6
Brodie S., Jacox M. G., Bograd S. J., Welch H., Dewar H., Scales K. L., et al. (2018). Integrating dynamic subsurface habitat metrics into species distribution models. Front. Mar. Sci. 5, 219. doi: 10.3389/fmars.2018.00219
Burnham K. P. and Anderson D. R. (2002). Model Selection and Multimodel Inference: A Practical Information-Theoretic Approach, 2nd ed (New York, New York: Springer), 496 pp.
Byrne M. E., Cortés E., Vaudo J., Harvey G. M., Sampson M., Wetherbee B. M., et al. (2017). Satellite telemetry reveals higher fishing mortality rates than previously estimated, suggesting overfishing of an apex marine predator. Proc. R. Soc. B 284, 20170658. doi: 10.1098/rspb.2017.0658
Byrne M. E., Dewar H., Vaudo J. J., Wetherbee B. M., and Shivji M. S. (2024). You shall not pass: the pacific oxygen minimum zone creates a boundary to shortfin mako shark distribution in the eastern north Pacific Ocean. Diversity Distrib. 30, e13924. doi: 10.1111/ddi.v30.12
Byrne M. E., Vaudo J. J., Harvey G. M., Johnston M. W., Wetherbee B. M., and Shivji M. S. (2019). Behavioral response of a mobile marine predator to environmental variables differs across ecoregions. Ecography 42, 1569–1578. doi: 10.1111/ecog.2019.v42.i9
Calenge C. (2006). The package “adehabitat” for the R software: a tool for the analysis of space and habitat use by animals. Ecol. Model. 197, 516–519. doi: 10.1016/j.ecolmodel.2006.03.017
Campana S. E., Joyce W., Fowler M., and Showell M. (2016). Discards, hooking, and post-release mortality of porbeagle (Lamna nasus), shortfin mako (Isurus oxyrinchus), and blue shark (Prionace glauca) in the Canadian pelagic longline fishery. ICES J. Mar. Sci. 73, 520–528. doi: 10.1093/icesjms/fsv234
Chapman D. D., Feldheim K. A., Papastamatiou Y. P., and Hueter R. E. (2015). There and back again: a review of residency and return migrations in sharks, with implications for population structure and management. Annu. Rev. Mar. Sci. 7, 547–570. doi: 10.1146/annurev-marine-010814-015730
Cortés E., Arocha F., Beerkircher L., Carvalho F., Domingo A., Heupel M., et al. (2010). Ecological risk assessment of pelagic sharks caught in Atlantic pelagic longline fisheries. Aquat. Living Resour. 23, 25–34. doi: 10.1051/alr/2009044
Crear D. P., Curtis T. H., Durkee S. J., and Carlson J. K. (2021). Highly migratory species predictive spatial modeling (PRiSM): an analytical framework for assessing the performance of spatial fisheries management. Mar. Biol. 168, 148. doi: 10.1007/s00227-021-03951-7
Dagg M., Grimes C., Lohrenz S., McKee B., Twilley R., and Wiseman W. (1991). “Continental shelf food chains of the northern Gulf of Mexico,” in Food Chains, Yields, Models, And Management of Large Marine Ecosystems. Eds. Sherman K., LM A., and BD G. (Westview Press, Boulder, CO), 67–106.
Dale J. J., Brodie S., Carlisle A. B., Castleton M., Hazen E. L., Bograd S. J., et al. (2022). Global habitat loss of a highly migratory predator, the blue marlin (Makaira nigricans). Diversity Distrib. 28, 2020–2034. doi: 10.1111/ddi.13606
Dinnel S. P. and Wiseman W. J. Jr. (1986). Fresh water on the Louisiana and Texas shelf. Continent. Shelf Res. 6, 765–784. doi: 10.1016/0278-4343(86)90036-1
Felder D. L., Camp D. K., and Tunnell J. W. (2009). “An introduction to Gulf of Mexico biodiversity assessment,” in Gulf of Mexico origin, waters, and biota: volume I, biodiversity. Eds. Felder D. L. and Camp D. K. (Texas A&M University Press, College Station, TX), 1–13.
Ferreira L. C., Jenner C., Jenner M., Udyawer V., Radford B., Davenport A., et al. (2024). Predicting suitable habitats for foraging and migration in Eastern Indian Ocean pygmy blue whales from satellite tracking data. Mov. Ecol. 12, 42. doi: 10.1186/s40462-024-00481-x
Florko K. R., Shuert C. R., Cheung W. W., Ferguson S. H., Jonsen I. D., Rosen D. A., et al. (2023). Linking movement and dive data to prey distribution models: new insights in foraging behaviour and potential pitfalls of movement analyses. Mov. Ecol. 11, 17. doi: 10.1186/s40462-023-00377-2
Fournier S., Lee T., and Gierach M. M. (2016). Seasonal and interannual variations of sea surface salinity associated with the Mississippi River plume observed by SMOS and Aquarius. Remote Sens. Environ. 180, 431–439. doi: 10.1016/j.rse.2016.02.050
Francis M. P., Shivji M. S., Duffy C. A., Rogers P. J., Byrne M. E., Wetherbee B. M., et al. (2019). Oceanic nomad or coastal resident? Behavioural switching in the shortfin mako shark (Isurus oxyrinchus). Mar. Biol. 166, 1–16. doi: 10.1007/s00227-018-3453-5
Garrison J. (2023). Home is where the habitat is: Modeling shortfin mako shark habitat suitability via machine learning methods. Master’s thesis (Kingston, Rhode Island: University of Rhode Island), 87 pp.
Gibson K. J., Streich M. K., Topping T. S., and Stunz G. W. (2021). New insights into the seasonal movement patterns of shortfin mako sharks in the Gulf of Mexico. Front. Mar. Sci. 8, 623104. doi: 10.3389/fmars.2021.623104
Gledhill C. T. (2001). Reef fish assemblages on Gulf of Mexico shelf-edge banks. Doctoral dissertation (Mobile, Alabama: University of South Alabama), 193 pp.
Gutiérrez de Velasco G. and Winant C. D. (1996). Seasonal patterns of wind stress and wind stress curl over the Gulf of Mexico. J. Geophys. Res.: Oceans 101, 18127–18140. doi: 10.1029/96JC01442
Hammerschlag N., McDonnell L. H., Rider M. J., Street G. M., Hazen E. L., Natanson L. J., et al. (2022). Ocean warming alters the distributional range, migratory timing, and spatial protections of an apex predator, the tiger shark (Galeocerdo cuvier). Global Change Biology 28 (6), 1990–2005. doi: 10.1111/gcb.16045
Hays G. C., Bailey H., Bograd S. J., Bowen W. D., Campagna C., Carmichael R. H., et al. (2019). Translating marine animal tracking data into conservation policy and management. Trends Ecol. Evol. 34, 459–473. doi: 10.1016/j.tree.2019.01.009
Hazen E. L., Abrahms B., Brodie S., Carroll G., Welch H., and Bograd S. J. (2021). Where did they not go? Considerations for generating pseudo-absences for telemetry-based habitat models. Mov. Ecol. 9, 1–3. doi: 10.1186/s40462-021-00240-2
Hazen E. L., Carlisle A. B., Wilson S. G., Ganong J. E., Castleton M. R., Schallert R. J., et al. (2016). Quantifying overlap between the Deepwater Horizon oil spill and predicted bluefin tuna spawning habitat in the Gulf of Mexico. Sci. Rep. 6, 33824. doi: 10.1038/srep33824
Hazen E. L., Palacios D. M., Forney K. A., Howell E. A., Becker E., Hoover A. L., et al. (2017). WhaleWatch: a dynamic management tool for predicting blue whale density in the California Current. J. Appl. Ecol. 54, 1415–1428. doi: 10.1111/jpe.2017.54.issue-5
Hazen E. L., Scales K. L., Maxwell S. M., Briscoe D. K., Welch H., Bograd S. J., et al. (2018). A dynamic ocean management tool to reduce bycatch and support sustainable fisheries. Sci. Adv. 4, eaar3001. doi: 10.1126/sciadv.aar3001
Hijmans R. J., van Etten J., Sumner M., Cheng J., Baston D., Bevan A., et al. (2023). raster: Geographic Data Analysis and Modeling. R package version 3.6-26. Available online at: https://CRAN.R-project.org/package=raster (Accessed September 4, 2024).
Huynh Q. C., Carruthers T., and Taylor N. G. (2022). EcoTest, a proof of concept for evaluating ecological indicators in multispecies fisheries, with the Atlantic longline fishery case study Vol. 79 (Collective Volume of Scientific Papers ICCAT), 165–177.
ICCAT [International Commission for the Conservation of Atlantic Tunas] (2017). Report of the standing committee on research and statistics (SCRS) (2017 SCRS Report ICCAT).
ICCAT [International Commission for the Conservation of Atlantic Tunas] (2019). Report of the 2019 shortfin mako shark stock assessment update meeting (SCRS Report ICCAT).
Jean-Michel L., Eric G., Romain B. B., Gilles G., Angélique M., Marie D., et al. (2021). The Copernicus global 1/12 oceanic and sea ice GLORYS12 reanalysis. Front. Earth Sci. 9, 698876. doi: 10.3389/feart.2021.698876
Jonsen I. D., Flemming J. M., and Myers R. A. (2005). Robust state–space modeling of animal movement data. Ecology 86, 2874–2880. doi: 10.1890/04-1852
Jonsen I. D., Grecian W. J., Phillips L., Carroll G., McMahon C., Harcourt R. G., et al. (2023). aniMotum, an R package for animal movement data: Rapid quality control, behavioural estimation and simulation. Methods Ecol. Evol. 14, 806–816. doi: 10.1111/2041-210X.14060
London J. M. (2020). pathroutr: An R Package for (Re-)Routing Paths Around Barriers (Version v0.2.1). Available online at: https://zenodo.org/record/5522909.YnPxEy_b1qs (Accessed September 4, 2024).
Luo J., Ault J. S., Shay L. K., Hoolihan J. P., Prince E. D., Brown C. A., et al. (2015). Ocean heat content reveals secrets of fish migrations. PloS One 10, e0141101. doi: 10.1371/journal.pone.0141101
Maxwell S. M., Scales K. L., Bograd S. J., Briscoe D. K., Dewar H., Hazen E. L., et al. (2019). Seasonal spatial segregation in blue sharks (Prionace glauca) by sex and size class in the Northeast Pacific Ocean. Diversity Distrib. 25, 1304–1317. doi: 10.1111/ddi.2019.25.issue-8
McDonnell L. H., Hazen E. L., and Mach K. J. (2024). Characteristics of animal movement and environmental data for dynamic ocean management: Insights and guidance. Conserv. Sci. Pract. 6, e13268. doi: 10.1111/csp2.13268
Mendelssohn R., Auger-Methe M., and Bak-Hosptial S. (2024). rerddapXtracto: Extracts Environmental Data from ‘ERDDAPTM’ Web Services. R package version 1.2.1. Available online at: https://CRAN.R-project.org/package=rerddapXtracto (Accessed September 4, 2024).
Mucientes G. R., Alonso-Fernández A., Vedor M., Sims D. W., and Queiroz N. (2025). Discovery of a potential open ocean nursery for the endangered shortfin makos shark in a global fishing hotspot. Sci. Rep. 15, 2190. doi: 10.1038/s41598-025-85572-4
Mucientes G. R., Fernández-Chacón A., Queiroz N., Sims D. W., and Villegas-Ríos D. (2023). Juvenile survival and movements of two threatened oceanic sharks in the North Atlantic Ocean inferred from tag-recovery data. Ecol. Evol. 13, e10198. doi: 10.1002/ece3.10198
Mucientes G. R., Queiroz N., Sousa L. L., Tarroso P., and Sims D. W. (2009). Sexual segregation of pelagic sharks and the potential threat from fisheries. Biol. Lett. 5, 156–159. doi: 10.1098/rsbl.2008.0761
Murawski S. A., Peebles E. B., Gracia A., Tunnell C.OMMAJr. J. W., and Armenteros M. (2018). Comparative abundance, species composition, and demographics of continental shelf fish assemblages throughout the Gulf of Mexico. Mar. Coast. Fish. 10, 325–346. doi: 10.1002/mcf2.10033
Musyl M. K., Brill R. W., Curran D. S., Fragoso N. M., McNaughton L. M., Nielsen A., et al. (2011). Post release survival, vertical and horizontal movements, and thermal habitats of five species of pelagic sharks in the central Pacific Ocean. Fish. Bull. 109, 341–368.
Musyl M. K. and Gilman E. L. (2019). Meta-analysis of post-release fishing mortality in apex predatory pelagic sharks and white marlin. Fish Fish. 20, 466–500. doi: 10.1111/faf.2019.20.issue-3
Nasby-Lucas N., Dewar H., Sosa-Nishizaki O., Wilson C., Hyde J. R., Vetter R. D., et al. (2019). Movements of electronically tagged shortfin mako sharks (Isurus oxyrinchus) in the eastern North Pacific Ocean. Anim. Biotelemetry 7, 1–26. doi: 10.1186/s40317-019-0174-6
Nash H. L., Furiness S. J., and Tunnell C.OMMAJr. J. W. (2013). What is known about species richness and distribution on the outer-shelf South Texas Banks? Gulf Caribbean Res. 25, 9–18. doi: 10.18785/gcr.2501.02
Natanson L. J., Winton M., Bowlby H., Joyce W., Deacy B., Coelho R., et al. (2020). Updated reproductive parameters for the shortfin mako (Isurus oxyrinchus) in the North Atlantic Ocean with inferences of distribution by sex and reproductive stage. Fish. Bull. 118, 21–36. doi: 10.7755/FB.118.1.3
NMFS [National Marine Fisheries Service] (2019). Atlantic highly migratory species; Shortfin mako shark management measures; Final amendment 11 (Department of Commerce, National Oceanic and Atmospheric Administration. 50 CFR Part 635).
NMFS [National Marine Fisheries Service] (2021). Endangered and Threatened Wildlife; 90-Day Finding on a Petition to List the Shortfin Mako Shark as Threatened or Endangered Under the Endangered Species Act (Department of Commerce, National Oceanic and Atmospheric Administration. 50 CFR 223 and 224).
NMFS [National Marine Fisheries Service] (2022a). Atlantic Highly Migratory Species; Shortfin Mako Shark Retention Limit (Department of Commerce, National Oceanic and Atmospheric Administration. 50 CFR 635).
NMFS [National Marine Fisheries Service] (2022b). Endangered and Threatened Wildlife and Plants; 12-Month Finding on a Petition To List the Shortfin Mako Shark (Isurus oxyrinchus) as Threatened or Endangered Under the Endangered Species Act (Department of Commerce, National Oceanic and Atmospheric Administration).
Nosal A. P., Cartamil D. P., Wegner N. C., Lam C. H., and Hastings P. A. (2019). Movement ecology of young-of-the-year blue sharks Prionace glauca and shortfin makos Isurus oxyrinchus within a putative binational nursery area. Mar. Ecol. Prog. Series 623, 99–115. doi: 10.3354/meps13021
Nowlin W. D., Jochens A. E., DiMarco S. F., Reid R. O., and Howard M. K. (2005). Low-frequency circulation over the Texas-Louisiana continental shelf. Geophys. Monograph American Geophys. Union. 161, 219. doi: 10.1029/JC091iC09p10645
Ohlmann J. C. and Niiler P. P. (2005). Circulation over the continental shelf in the northern Gulf of Mexico. Prog. Oceanogr. 64, 45–81. doi: 10.1016/j.pocean.2005.02.001
Papastamatiou Y. P., Meyer C. G., Carvalho F., Dale J. J., Hutchinson M. R., and Holland K. N. (2013). Telemetry and random-walk models reveal complex patterns of partial migration in a large marine predator. Ecology 94, 2595–2606. doi: 10.1890/12-2014.1
Patterson T. A., Basson M., Bravington M. V., and Gunn J. S. (2009). Classifying movement behaviour in relation to environmental conditions using hidden Markov models. J. Anim. Ecol. 78, 1113–1123. doi: 10.1111/j.1365-2656.2009.01583.x
Pequegnat W. E., Gallaway B. J., and Pequegnat L. H. (1990). Aspects of the ecology of the deep-water fauna of the Gulf of Mexico. Am. Zool. 30, 45–64. doi: 10.1093/icb/30.1.45
Pinsky M. L. and Palumbi S. R. (2014). Meta-analysis reveals lower genetic diversity in overfished populations. Mol. Ecol. 23, 29–39. doi: 10.1111/mec.2013.23.issue-1
Pinti J., Shatley M., Carlisle A., Block B. A., and Oliver M. J. (2022). Using pseudo-absence models to test for environmental selection in marine movement ecology: the importance of sample size and selection strength. Mov. Ecol. 10, 60. doi: 10.1186/s40462-022-00362-1
Queiroz N., Humphries N. E., Couto A., Vedor M., da Costa I., Sequeira A. M. M., et al. (2019). Global spatial risk assessment of sharks under the footprint of fisheries. Nature 572, 461–466. doi: 10.1038/s41586-019-1444-4
Rabalais N. N. (1990). Biological communities of the south Texas continental shelf. Am. Zool. 30, 77–87. doi: 10.1093/icb/30.1.77
Rabalais N. N., Turner R. E., and Wiseman W. J. Jr. (2002). Gulf of Mexico hypoxia, aka “The dead zone. Annu. Rev. Ecol. Syst. 33, 235–263. doi: 10.1146/annurev.ecolsys.33.010802.150513
R Core Team (2024). R: A Language and Environment for Statistical Computing (Vienna, Austria: R Foundation for Statistical Computing). Available at: https://www.R-project.org/ (Accessed September 4, 2024).
Rogers P. J., Huveneers C., Page B., Goldsworthy S. D., Coyne M., Lowther A. D., et al. (2015). Living on the continental shelf edge: habitat use of juvenile shortfin makos Isurus oxyrinchus in the Great Australian Bight, southern Australia. Fish. Oceanogr. 24, 205–218. doi: 10.1111/fog.2015.24.issue-3
Rooker J. R., Dance M. R., Wells R. J. D., Ajemian M. J., Block B. A., Castelton M. R., et al. (2019). Population connectivity of pelagic megafauna in the Cuba-Mexico-United States triangle. Sci. Rep. 9, 1663. doi: 10.1038/s41598-018-38144-8
Saraiva B. M., Macena B. C., Solleliet-Ferreira S., Afonso P., and Fontes J. (2023). First insights into the shortfin mako shark (Isurus oxyrinchus) fine-scale swimming behaviour. R. Soc. Open Sci. 10, 230012. doi: 10.1098/rsos.230012
Sibert J. and Hampton J. (2003). Mobility of tropical tunas and the implications for fisheries management. Mar. Policy 27, 87–95. doi: 10.1016/S0308-597X(02)00057-X
Snodgrass D. J., Orbesen E. S., Walter J. F., Hoolihan J. P., and Brown C. A. (2020). Potential impacts of oil production platforms and their function as fish aggregating devices on the biology of highly migratory fish species. Rev. Fish Biol. Fish. 30, 405–422. doi: 10.1007/s11160-020-09605-z
Spies R. B., Senner S., and Robbins C. S. (2016). An overview of the northern Gulf of Mexico ecosystem. Gulf Mexico Sci. 33, 9. doi: 10.18785/goms.3301.09
Stevens J. D., Bonfil R., Dulvy N. K., and Walker P. A. (2000). The effects of fishing on sharks, rays, and chimaeras (chondrichthyans), and the implications for marine ecosystems. ICES J. Mar. Sci. 57, 476–494. doi: 10.1006/jmsc.2000.0724
Sturges W. and Leben R. (2000). Frequency of ring separations from the Loop Current in the Gulf of Mexico: A revised estimate. J. Phys. Oceanogr. 30, 1814–1819. doi: 10.1175/1520-0485(2000)030<1814:FORSFT>2.0.CO;2
Taylor N. G. and Walter J. F. (2024). Incorporating climate considerations into fisheries assessments and management advice at ICCAT Vol. 81 (Collective Volume of Scientific Papers ICCAT), 1–11.
Tozer B., Sandwell D. T., Smith W. H., Olson C., Beale J. R., and Wessel P. (2019). Global bathymetry and topography at 15 arc sec: SRTM15+. Earth Space Sci. 6, 1847–1864. doi: 10.1029/2019EA000658
Vaudo J. J., Byrne M. E., Wetherbee B. M., Harvey G. M., and Shivji M. S. (2017). Long-term satellite tracking reveals region-specific movements of a large pelagic predator, the shortfin mako shark, in the western North Atlantic Ocean. J. Appl. Ecol. 54, 1765–1775. doi: 10.1111/jpe.2017.54.issue-6
Vaudo J. J., Wetherbee B. M., Wood A. D., Weng K., Howey-Jordan L. A., Harvey G. M., et al. (2016). Vertical movements of shortfin mako sharks Isurus oxyrinchus in the western North Atlantic Ocean are strongly influenced by temperature. Mar. Ecol. Prog. Series 7, 163–175. doi: 10.3354/meps11646
Wells R. J., TinHan T. C., Dance M. A., Drymon J. M., Falterman B., Ajemian M. J., et al. (2018). Movement, behavior, and habitat use of a marine apex predator, the scalloped hammerhead. Front. Mar. Sci. 5, 321. doi: 10.3389/fmars.2018.00321
Weng K. C., Foley D. G., Ganong J. E., Perle C., Shillinger G. L., and Block B. A. (2008). Migration of an upper trophic level predator, the salmon shark Lamna ditropis, between distant ecoregions. Mar. Ecol. Prog. Series 372, 253–264. doi: 10.3354/meps07706
Willis-Norton E., Hazen E. L., Fossette S., Shillinger G., Rykaczewski R. R., Foley D. G., et al. (2015). Climate change impacts on leatherback turtle pelagic habitat in the Southeast Pacific. Deep Sea Res. Part II: Topical Stud. Oceanogr. 113, 260–267. doi: 10.1016/j.dsr2.2013.12.019
Wood S. N. (2011). Fast stable restricted maximum likelihood and marginal likelihood estimation of semiparametric generalized linear models. J. R. Stat. Soc. Ser. B: Stat. Methodol. 73, 3–36. doi: 10.1111/j.1467-9868.2010.00749.x
Wood S. N. (2017). Generalized additive models: an introduction with R, 2nd ed (Boca Raton, Florida: CRC Press), 496 pp.
Wood A. D., Collie J. S., and Kohler N. E. (2007). Estimating the survival of the shortfin mako Isurus oxyrinchus (Rafinesque) in the north-west Atlantic from tag-recapture data. J. Fish Biol. 71, 1679–1695. doi: 10.1111/j.1095-8649.2007.01634.x
Keywords: shortfin mako, sharks, movement, habitat use, Gulf of Mexico
Citation: Gibson Banks K, Coffey DM, Fisher MR and Stunz GW (2025) To stay or go: movement, behavior, and habitat use of shortfin mako sharks (Isurus oxyrinchus) in the Gulf of Mexico. Front. Mar. Sci. 12:1562581. doi: 10.3389/fmars.2025.1562581
Received: 17 January 2025; Accepted: 08 May 2025;
Published: 26 May 2025.
Edited by:
Lance Garrison, National Oceanic and Atmospheric Administration (NOAA), United StatesReviewed by:
Gonzalo Mucientes Sandoval, Spanish National Research Council (CSIC), SpainMitchell J Rider, University of Miami, United States
Copyright © 2025 Gibson Banks, Coffey, Fisher and Stunz. This is an open-access article distributed under the terms of the Creative Commons Attribution License (CC BY). The use, distribution or reproduction in other forums is permitted, provided the original author(s) and the copyright owner(s) are credited and that the original publication in this journal is cited, in accordance with accepted academic practice. No use, distribution or reproduction is permitted which does not comply with these terms.
*Correspondence: Kesley Gibson Banks, a2VzbGV5LmJhbmtzQHRhbXVjYy5lZHU=
†These authors have contributed equally to this work and share first authorship