 Marte Jenssen
 Josipa Matic2
 Nina Therese Solberg
 Kjersti Lian
- 1Department of Marine Biotechnology, Norwegian Institute of Food, Fisheries and Aquaculture Research (Nofima), Tromsø, Norway
- 2Department of Raw Materials and Process Optimization, Norwegian Institute of Food, Fisheries and Aquaculture Research (Nofima), Ås, Norway
- 3Department of Process Technology, Norwegian Institute of Food, Fisheries and Aquaculture Research (Nofima), Stavanger, Norway
With the increasing demand for food and sustainable food processes, using side streams from food production has gained increased attention. After fish filleting, a significant amount of the biomass, such as heads, viscera, backbones, and skins, is left unused or utilized for low-value purposes. This biomass has high contents of valuable proteins and lipids that can be used for higher-value products, such as for human consumption or feed. This study used residual biomass from Italian sea bream and sea bass aquaculture to produce protein hydrolysates. Before hydrolysis, the biomass was pre-processed using an industrial patented dehydration process. Both pre-processed and un-processed biomasses were hydrolyzed, testing four different commercial proteases. The proximate composition of the starting materials was assessed. After hydrolysis, the yield, proximate composition, total amino acid content, and peptide size distribution of the hydrolysates were determined, showing high protein contents above 87% for all hydrolysates. The oil samples obtained after hydrolysis were analyzed for oxidation products. The protein hydrolysates were analyzed for different biological activities including antioxidant activity, anti-diabetes activity, and effect on cell growth and glucose uptake. In addition, the emulsifying properties of the hydrolysates were evaluated. The results indicate variations in chemical composition and biological activity between the hydrolysates. The most prominent differences were yield (on a dry matter basis), which was higher for the hydrolysates produced from un-processed biomass, and molecular weight distribution, which showed that the hydrolysates produced from pre-processed biomass were less hydrolyzed (AMW above 3000 g/mol) compared to hydrolysates from un-processed biomass (AMW below 2600 g/mol). In addition, the antioxidant activity was higher for the hydrolysates from un-processed biomass (22-25 µM TEAC) compared to the hydrolysates from pre-processed biomass (around 15 µM TEAC), assayed at 100 µg/mL. The results of this study are highly relevant for further evaluation and development of pre-processing technology and its effect on the final protein hydrolysate products.
1 Introduction
Aquatic foods are important for future food security (Boyd et al., 2022; Naylor et al., 2021; Tacon and Metian, 2013). In 2020, fisheries and aquaculture reached an all-time high, with a production of 214 million tonnes (including algae), of which aquaculture constituted 122.6 million tonnes (FAO, 2022). Human consumption of aquatic foods has more than doubled since the 1960s, and this upward trend is expected to persist (FAO, 2022). The per capita apparent consumption has increased from 14.3 kg in the 1990s to 20.2 kg in 2020 (FAO, 2022). As aquaculture production and processing expand, there is a corresponding increase in waste and the generation of side streams (Nawaz et al., 2020). Side streams in this regard are the streams, or products, which are not the main product following a production. Fish processing side streams, such as heads, viscera, skin, bones, and scales, can reach up to 70% of the total biomass after fish processing (Ananey-Obiri and Tahergorabi, 2018; Gehring et al., 2009). Historically, most of the side streams have either gone to waste or been used to produce fishmeal (Ananey-Obiri and Tahergorabi, 2018; FAO, 2022; Gehring et al., 2009). The utilization of side streams for food and non-food purposes (e.g., animal feed or biogas) has increased over the years, but there is still work to be done to increase the portion of food-grade biomass allocated for human consumption. One challenge with side stream utilization is maintaining the biomass quality from landing until further processing. Often, the biomass must be transported to different locations for processing, which can lead to quality degradation and increased transport costs. Various techniques exist that address these issues, such as freezing and dehydrating the biomass.
Enzymatic protein hydrolysis is a versatile and adaptable technique that enables the utilization of side streams from the food industry (Gao et al., 2021; Nikoo et al., 2023; Whitaker et al., 2021). Side streams from fisheries and aquaculture are abundant sources of biologically active (bioactive) peptides (Zamora-Sillero et al., 2018). These domains are often inactive within the parent protein and are released and activated through cleavage, for example, by proteolytic enzymes (Rana et al., 2023). Usually, exogenous proteases are used for hydrolysis, and the choice of enzyme can greatly affect the properties of the peptides, such as taste, solubility, and bioactivity (Nikoo et al., 2023; Whitaker et al., 2021). Bioactive peptides can have different physiological functions relevant to human health, such as antihypertensive, antioxidative, antimicrobial, and immunomodulatory effects (Agyei et al., 2016; Korhonen and Pihlanto, 2006). The peptides’ amino acid composition, sequence, and size are decisive for their bioactivities. Most bioactive peptides range from 2 to 20 amino acids, with a molecular mass of 0.4 to 2 kDa (Korhonen and Pihlanto, 2006; Zaky et al., 2021). Some marine bioactive peptides are on the market as functional food ingredients or in other product groups, claiming bioactivities such as antihypertensive, stress relief, and bone and joint health (Hayes and Tiwari, 2015; Sierra Lopera et al., 2018; Whitaker et al., 2021).
In the present study, protein hydrolysates produced from Italian sea bream and sea bass aquaculture side streams were systematically characterized for composition, techno-functional properties, and bioactivity. Italy is a country with a solid history of aquaculture, and the most commonly farmed marine water species are the Gilthead sea bream (Sparus aurata) and the European sea bass (Dicentrarchus labrax) (Zoli et al., 2023), yielding 9.400 and 7.300 tonnes in 2021, respectively. The two species have similar growth cycles and environmental requirements, so their production is often integrated into the same farm (Zoli et al., 2023). Some literature exists on the use of sea bream and sea bass side streams, including nutritional characterization (Munekata et al., 2020; Pateiro et al., 2020), studies of contaminants (de la Fuente et al., 2021), production of antioxidant protein extracts (de la Fuente et al., 2021), stability of hydrolysates during storage (Demirtaş Erol et al., 2017), bioactivity and functional studies of gelatin peptides (Tekle et al., 2022), and chemical and functional characterization of protein hydrolysates (Valcarcel et al., 2020), showing the great potential of this biomass for further product development. There is an increasing consumer demand for processed products such as fish fillets, which in turn is leading to an increase in side streams from fisheries and aquaculture (Siddiqui et al., 2023). One of the objectives of the Horizon 2020-funded EcoeFISHent project (No 101036428) is to address the challenges associated with utilizing side streams from Italian sea bream and sea bass aquaculture. As part of the project, the unsorted biomass is dehydrated in a pre-processing step. This offers several benefits, including reducing degradation and microbial growth, which are common issues related to side-stream utilization. Transport costs are also reduced by lowering the biomass volume and weight, and the cost of man-hours is reduced by eliminating the step of sorting the biomass. The objective of this study was to investigate the impact of pre-processing on the yield and properties of hydrolysates compared to those produced from un-processed biomass. Protein hydrolysates were generated through enzymatic hydrolysis using four different commercial enzymes, and the chemical and functional characteristics of the hydrolysates were investigated. Protein hydrolysates show great potential as protein enrichment ingredients in functional foods or as nutraceutical products, depending on their nutritional value and bioactivity, and offer innovative strategies for side stream utilization.
2 Materials and methods
Pre-processed and un-processed side streams from aquaculture of sea bream and sea bass were hydrolyzed in a setup with four commercial enzymes (Figure 1). The hydrolysates were evaluated for chemical, techno-functional, and biological properties to assess their potential use in applications such as food and feed. The starting biomasses, both pre-processed and un-processed were evaluated for proximate composition, and the obtained oil fractions after hydrolysis were analyzed for oxidation products.
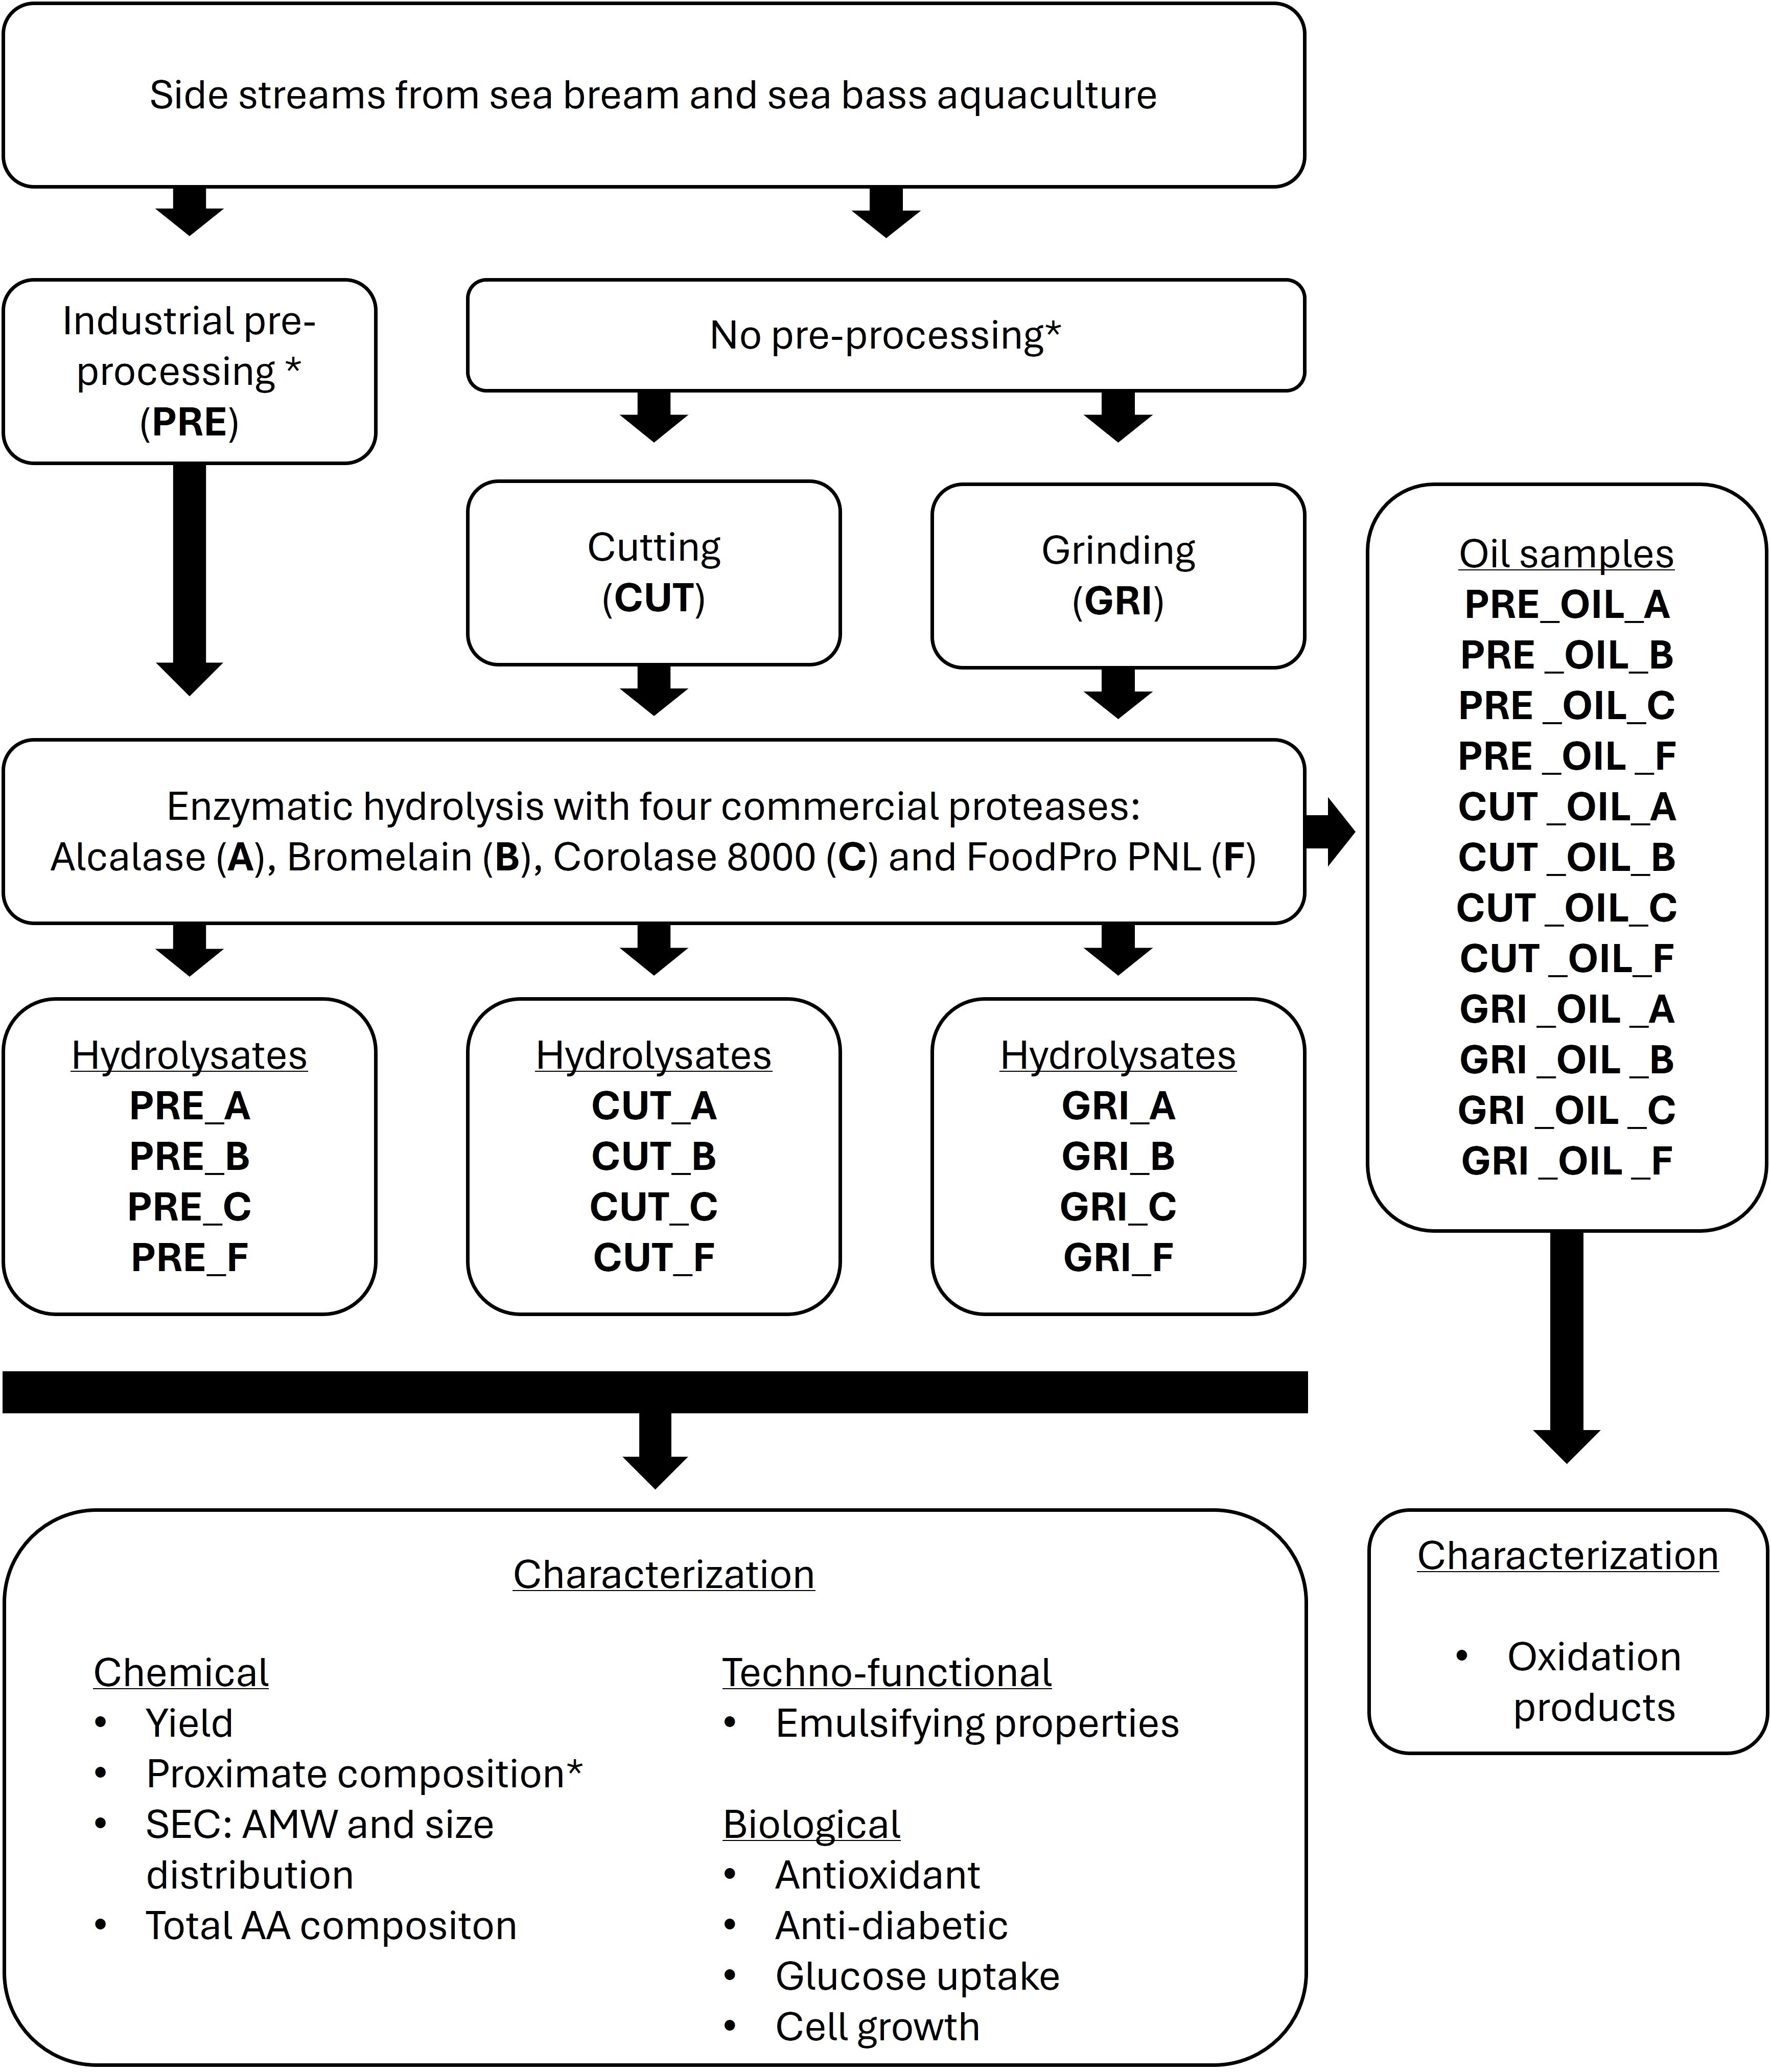
Figure 1. Experimental setup for the hydrolysis and analysis of side streams from sea bream and sea bass aquaculture. The enzymatic hydrolysis was performed using 500 g of starting material (PRE, CUT, GRI). Bold represents abbreviated codes used throughout the article. SEC, Size Exclusion Chromatography; AMW, Average Molecular Weight; AA, Amino Acid. *The pre-processed and un-processed biomasses were also analyzed for proximate composition.
2.1 Materials and chemicals
The un-processed biomass was provided by Aqua De Mâ (Lavagna, Genova, Italy), consisting of side streams from processing, mainly skin, heads, bones, and viscera of sea bream (S. aurata) and sea bass (D. labrax L). Some whole fish, which were damaged or too small for sale, were also included. The biomass was shipped from Aqua De Mâ to Nofima (Tromsø, Norway) at -20°C and kept frozen until further processing. Before hydrolysis, the material was fractioned manually with heads, backs, and skins in the ratio 40%, 50%, and 10%, respectively. Upon arrival, the biomass (approximately 100 kg) was fractioned and weighed, and the amount of the individual fractions formed the basis of the fraction ratio used. Sea bream and sea bass side streams from Aqua De Mâ were processed at Themis S.p.A. (Milano, Italy). Themis S.p.A. uses a patented process of grinding, mixing, and drying the biomass, yielding a mixed slurry with low moisture content (Romano and Romano, 2015). The proportion of the different fractions being processed is not known. The processed material was shipped to Nofima (Tromsø, Norway) at room temperature and stored at -20°C upon arrival until further use. The hydrolysates were produced using the following commercial enzymes: Corolase® 8000 from AB Enzymes GmbH (Darmstadt, Germany), FoodPro® PNL from Danisco (Copenhagen, Denmark), Alcalase from VWR (Radnor Pennsylvania, USA), and Bromelain from Enzymology Research Center, Inc. (Miltona, USA).
Chemicals used for 2,2′-Azino-bis(3-ethylbenzothiazoline-6-sulfonic acid) diammonium salt (ABTS) decolorization assay; ABTS, ammonium persulfate and (±)-6-Hydroxy-2,5,7,8-tetramethylchroman-2-carboxylic acid (Trolox), as well as High-Performance Liquid Chromatography (HPLC) grade acetonitrile, trifluoroacetic acid, monosodium phosphate, and molecular weight standards used for the Size Exclusion Chromatography (SEC) analysis (Supplementary Table 1) were purchased from Sigma-Aldrich (St. Louis, MO, USA). Dipeptidyl peptidase IV (DPP-IV) Inhibitor Screening Assay Kit (ab133081) was purchased from Abcam PLC (Cambridge, UK). The water used for the HPLC mobile phase and sample preparation was purified by deionization and 0.22 µm membrane filtration (MilliporeSigma, Burlington, MA, USA).
2.2 Preparation of fish protein hydrolysates
In total, 12 protein hydrolysates were prepared, as shown in Figure 1. Three different starting materials were used: Pre-processed biomass, un-processed biomass cut into pieces of approximately 5x5cm, and un-processed biomass minced using a grinder (Kilia, TK 20 ltr, Dorfmark, Germany). For the ground biomass, the material was first fractioned with heads, backs, and skins, ground individually, and combined in the ratio described in section 2.1. All three starting materials were hydrolyzed using four different commercial proteases: Alcalase (60°C), Bromelain (55°C), Corolase 8000 (65°C), and FoodPro® PNL (55°C) (hydrolysis temperature in parentheses). The hydrolysates have been given abbreviated codes according to the processing of the biomass and the enzymes used for hydrolysis (Figure 1): Pre-processed biomass (PRE), un-processed and cut (CUT), un-processed and ground (GRI), Alcalase (A), Bromelain (B), Corolase® 8000 (C), and FoodPro® PNL (F). Before hydrolysis, the materials were mixed with water to a final ratio of 1:1 (w/v) and heated to the optimal temperatures of the individual enzymes. All hydrolyses were performed using 500 g of starting material. Once the temperature was reached, the enzymes were added to a concentration of 0.25% (v/w) for the enzymes in liquid preparation (A, C, and F) and w/w for B (powder form). All hydrolyses were performed once for each enzyme for one hour, followed by enzyme inactivation at 90°C for 15 minutes in IKA® LR 1000 Basic reactors (IKA-Werke GmbH & Co. KG, Germany). The mixture was centrifuged for 20 minutes, 8000 rpm at 18°C, using an Avanti JXN-26 centrifuge (Beckman Coulter, Brea, California, USA). After centrifugation, the oil phase was removed and stored at -20°C. The supernatant was separated from the sediment and filtered using Seitz® Depth filter T 2600 (Pall Corporation, New York, USA) to remove excess oil and remaining particles. The liquid hydrolysate was kept overnight in a separating funnel at 10°C, and any remaining oil phase was removed. The liquid phase was frozen at -80°C and lyophilized with a Labconco FreeZone 12 Plus freeze dryer (Labconco Corporation, Kansas City, MO, USA). The lyophilized hydrolysates were stored at -20°C until further analysis.
2.3 Chemical characterization
The mass yield for the hydrolysates was calculated both based on initial biomass wet weight and initial biomass dry weight, using the following equations (Equations 1, 2):
The dry matter (DM) content was determined by drying at 103°C (ISO 6496), and ash by combustion at 550°C (ISO 5984). Nitrogen contents were analyzed using the Kjeldahl method (NS-EN ISO 5983-2), and crude protein was estimated based on N x 6.25. The lipid content of the un-processed biomass was determined by ethyl acetate extraction (NS9402, 1st edition, December 1994), and for the pre-processed biomass, the Bligh & Dyer principle was used (Bligh and Dyer, 1959). The lipid content in the protein hydrolysates was determined by acid hydrolysis using the EC No 152/2009 method. Total amino acid content was determined by HPLC with fluorescence detection, as described previously (Szkudzińska et al., 2017), with minor modifications. The run time was set to 32 minutes with a flow of 0.4 mL/min. DM, ash, nitrogen, and total amino acid content analyses were performed in duplicates, while for lipid content, only one analysis was run per hydrolysate.
The oil samples retrieved after hydrolysis were analyzed for oxidation products. The peroxide values (PV) (primary oxidation products) were determined following the AOCS Official Method Cd 8b-90. The anisidine values (AV) (secondary oxidation products) were determined following the AOCS Official Method Cd 18-90. The analyses were performed in duplicates. The total oxidation value (TOTOX) was calculated based on the following equation (Equation 3):
Peptide size distribution of the protein hydrolysates was determined by SEC, as previously described by (Wubshet et al., 2017). Briefly, the hydrolysates were dissolved in water to a final concentration of 20 mg/mL and filtered using a Millex-HV PVDF 0.45 µm 33 mm filter (Millipore Sigma, Burlington, MA, USA). Filtered samples and standards were injected, and signals were detected with UV at 214 nm. Chromeleon™ Chromatography Data System (CDS) software version 6.8 was used. Molecular weight distributions and average molecular weights were calculated using a calibration curve based on molecular weight standards (Supplementary Table 1). Calculations were performed in MATLAB (R2022b, The Mathworks Inc., Torrance, CA, USA) using the SEC2MWD toolbox (Måge et al., 2024).
2.4 Biological activity characterization
2.4.1 ABTS radical scavenging assay
The antioxidant activity of the protein hydrolysates was assessed using the ABTS radical scavenging assay, as previously described in the literature (Re et al., 1999), with some modifications (Matić et al., 2023). All hydrolysates were assayed at 100 µg/mL in triplicates in an initial screen. A follow-up screen of a selection of six hydrolysates was conducted using a dilution series from 400 to 25 µg/mL, performed using triplicates. Briefly, the ABTS radical (ABTS•+) was prepared by mixing 7 mM aqueous ABTS solution with 2.45 mM aqueous ammonium persulfate (100:1). The mixture was incubated in the dark at room temperature for a minimum of 16 hours. For the assay, ABTS•+ was diluted with assay buffer (5 mM phosphate buffer, pH 7.4) to an absorbance of 0.7 ± 0.05 at λ = 734 nm. Trolox was prepared with a final assay concentration ranging from 0.04 to 0.005 mM. The experiments were performed in 96-well microtiter plates with a final volume of 200 µL per well, containing 10 µL sample (hydrolysate or Trolox) and 190 µL diluted ABTS•+ solution. Control absorbance wells were prepared with 10 µL milliQ (mQ)-water and 190 µL diluted ABTS•+. Background wells were prepared with 10 µL mQ water and 190 µL assay buffer. The plates were incubated with shaking in the dark for 5 minutes before reading at 734 nm. Background absorbance was subtracted from all readings, and decolorization (%) was calculated with the following equation (Equation 4):
Linear regression was used to calculate Trolox-induced decolorization as a function of Trolox concentration. The ABTS radical scavenging assay results are reported as Trolox equivalent antioxidant capacity (TEAC, µM). The decolorization (%) of the samples, and slope (a) and intercept (b) from the linear regression were used for the calculation of the TEAC using the following equation (Equation 5):
2.4.2 DPP-IV inhibition assay
To test for potential activity against type 2 diabetes, the protein hydrolysates were screened in a dipeptidyl peptidase IV (DPP-IV) inhibition assay. The assay was performed using a commercial fluorescence-based screening kit (DPP-IV Inhibitor Screening Assay Kit (ab133081) from Abcam PLC (Cambridge, UK). Hydrolysates were tested in triplicates at final assaying concentrations of 1 and 0.5 mg/mL. Inhibitor samples were prepared by dissolving lyophilized hydrolysates in water to the corresponding concentration and subsequently filtering the samples through a Millex-HV PVDF 0.45 μm filter (MilliporeSigma, Burlington, MA, USA). The assay was performed according to the instructions from the manufacturer, as previously described (Matić et al., 2023). Briefly, the samples are mixed with enzyme solution, substrate solution, and assay buffer to assay the hydrolysates. For the establishment of initial activity, the assay buffer is added instead of an inhibitor solution. In background wells, assay buffer was added instead of inhibitor and enzyme solution. Sitagliptin (100µM final assay concentration) was used as a positive control. The plate was incubated at 37°C for 30 minutes before measuring fluorescence at λexc = 355 nm, λem = 455 nm. The results from the DPP-IV inhibition assay are reported as % inhibition of the enzyme. The background fluorescence was subtracted from the readings, and inhibition (%) was calculated using the following equation (Equation 6):
2.4.3 Cell growth assay
The protein hydrolysates were assayed for their effect on cell growth at two concentrations (50 and 500 µg/mL) in L6 rat myoblasts (CRL-1458, ATCC) and in primary bovine myoblasts isolated from sirloin of newly slaughtered cattle according to a well-established method (Rønning et al., 2013; Veiseth-Kent et al., 2019). L6 cells were cultivated in proliferation media (high-glucose DMEM ATCC 30–2002 [LGC Standards GmbH] with 10% FBS [Sigma-Aldrich], 0.1% penicillin/streptomycin [Life Technologies], and 0.1% Amphotericin B [Sigma-Aldrich]), and 1,000 viable cells were plated per well of a 96-well plate (Corning #3595). Primary bovine myoblasts were cultivated in proliferation media (low glucose DMEM supplemented with GlutaMAX™ and pyruvate [Thermo-Fisher], 2% FBS [Sigma-Aldrich], 2% Ultroser G [Sartorius], 0.5% penicillin/streptomycin [Life Technologies], and 0.5% Amphotericin B [Sigma-Aldrich]). A total of 1,000 viable cells were plated per well in a 96-well plate (Corning #3595) coated with Entactin-Collagen-Laminin (ECL) (Millipore/Sigma-Aldrich). The following day, proliferation media was replaced with either new proliferation media (control) or proliferation media with the addition of hydrolysate, and cells were subsequently monitored for at least 4 days in an Incucyte S3 Live Cell Analysis System (Sartorius). Two images were taken at distinct regions within each well every 4 hours using a 10× magnification objective in the phase-contrast channel, and cell confluence was monitored and quantified using the Incucyte software. All data were related to scanning at 4 hours after media renewal. Obtained data for relative cell growth in each well (average of the 2 images) was exported to GraphPad prism for generation of relative growth proliferation curves. Both cultivation and monitoring of cells were performed in a 37°C and 5% CO2 humidified incubator. The hydrolysates were assayed with three biological replicates each containing three technical replicates (n=9) of L6 cells, and two biological replicates each containing three technical replicates (n=6) of bovine cells. For the control samples, each biological replicate was run with 24 technical replicates. Standard deviations reflect differences between replicate values. The results of the cell growth assay are reported as relative growth of the cells treated with hydrolysate, including a control with no added hydrolysate.
2.4.4 Glucose uptake assay
All the protein hydrolysates were assayed for their effect on glucose uptake on L6 rat myoblasts (CRL-1458, ATCC) by luminescence detection using the Glucose Uptake-Glo™ Assay (J1342, Promega), as previously described (Bjerknes et al., 2024). The hydrolysates were tested at two concentrations, 50 and 500 µg/mL, in technical triplicates (only one biological replicate was performed). Briefly, 5000 cells per well were seeded in a high-glucose medium (high-glucose DMEM ATCC 30–2002 with 10% FBS, 0.1% penicillin/streptomycin, and 0.1% Fungizone) in a white flat bottom 96-well plate. The cells were incubated for 4 days before differentiation was induced using a differentiation medium (high-glucose DMEM ATCC 30–2002, 2% horse serum, 0.1% penicillin/streptomycin, and 0.1% Fungizone). The cells were differentiated for 3 days, changing the medium every day. After differentiation, the cells were placed in a starvation medium (DMEM with no glucose, no phenol red, no glutamine [A1443001 ThermoFisher], 0.1% penicillin/streptomycin, and 0.1% Fungizone). After approximately 18 hours of starvation, the myotubes were treated for one hour with hydrolysates (50 and 500 µg/mL) or insulin (positive control - 0.1 µM). A blank without any treatment was also included. All samples were diluted in starvation medium. Glucose uptake measurements were performed using the Glucose Uptake-Glo™ Assay according to the manufacturer’s instructions. Controls without 2-deoxyglucose (2DG), and with a stop buffer added prior to 2DG, were also included as negative controls. The effect was measured by luminescence. The results of the glucose uptake assay are given as glucose uptake (%) relative to the blank (no treatment, represents 100% glucose uptake).
2.5 Characterization of emulsifying properties
Samples of lyophilized hydrolysate were analyzed for emulsifying properties in triplicates as described by Nguyen and co-authors (Nguyen et al., 2017) with modifications. Samples were sieved through a 400 µm mesh size sieve (Test sieve 6016000400, Serial No. 7264339, Retsch UK Ltd, Derbyshire, UK) prior to analysis. Approximately 0.2 g was mixed with 10 mL 0.1M sodium phosphate buffer and vortexed until fully dissolved. 3 mL of sample solution was mixed with 1 mL canola oil (Eldorado, Until AS, Oslo, Norway) in triplicates and homogenized for 1 minute at 20,500 rpm (Janke & Kunkel ULTRA-TURRAX T25 homogenizer Nr. 496016 IKA, Staufen, Germany) with S25N-10G probe. The sample solution was mixed with 0.3% SDS buffer at a 1:100 ratio (v/v) immediately after homogenization (0 min) and after 60 minutes of incubation at room temperature before absorbance measurement at 500 nm (BioTek Synergy H1, Agilent, Santa Clara, USA). The results of the characterization of emulsifying activity are presented as Emulsifying Activity Index (EAI) and Emulsifying Stability Index (ESI). EAI (at 0 min) and ESI (after a 60 minute incubation) were determined according to Pearce and Kinsella (Pearce and Kinsella, 1978) using the following equations (Equations 7, 8):
where Ao is the absorbance at t = 0 min, φ is the oil volume fraction (0.25), and C is the sample concentration in the solution (g/mL). Dilution is 100 based on the 1:100 dilution with SDS.
where Ao is the absorbance at t = 0 min and is the absorbance after 60 minutes (t) of incubation.
3 Results and discussion
3.1 Chemical properties of starting materials and hydrolysates
3.1.1 Proximate composition of starting materials
The proximate composition of the two starting materials; un-processed and pre-processed biomass, was analyzed (Table 1). As expected, the moisture content was low in the pre-processed biomass (below 2%) since it had undergone a water removal step. For the un-processed biomass, the moisture content was above 60%. On a DM basis, the protein content of the un-processed and processed biomass is comparable, with 38.6% and 42.7%, respectively. The oil content is slightly higher for pre-processed biomass, with 54.2% on a DM basis, compared to the un-processed biomass, with 40.9%. In addition, the ash content is considerably higher in the un-processed biomass when calculated on a DM basis, with 19.0% ash, as compared to pre-processed at 7.5% ash on a DM basis.
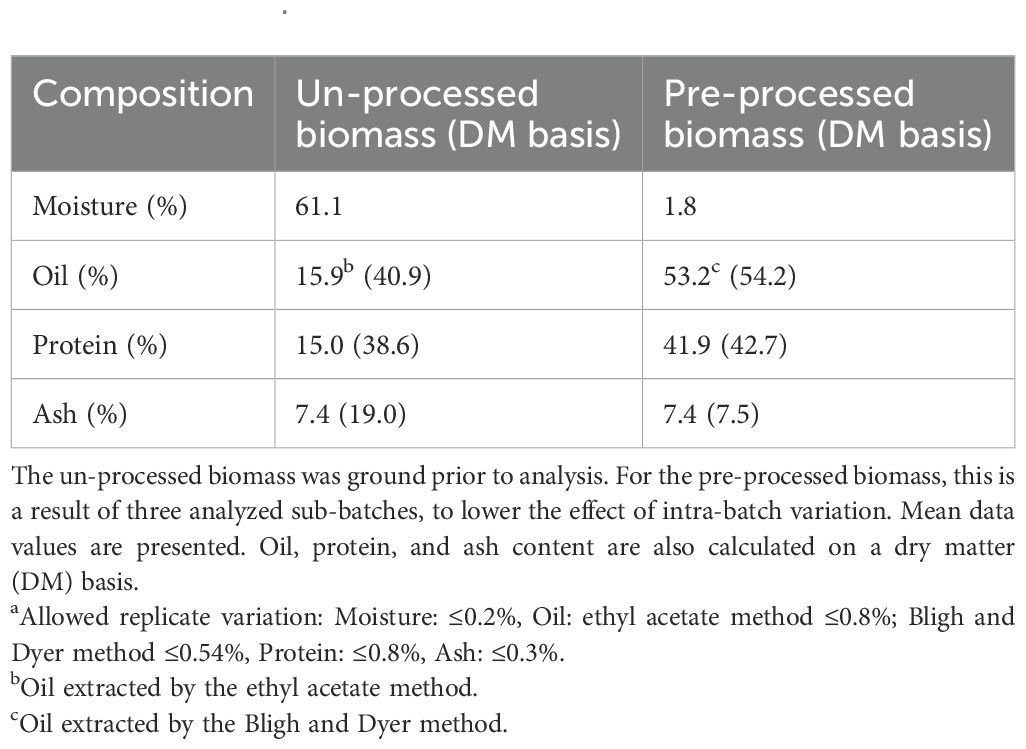
Table 1. Proximate composition of un-processed biomass and pre-processed biomassa.
3.1.2 Yield and chemical characterization of hydrolysates
The protein hydrolysate yields, on wet and dry biomass basis, can be seen in Table 2. The wet weight yields of the hydrolysates varied, ranging from 8.52% (PRE_B) to 5.27% (PRE_A). Since the DM content in the pre-processed biomass is much higher than the un-processed biomass, the yield was expected to be higher for the PRE hydrolysates. The dry weight yield of the hydrolysates from un-processed biomass (CUT and GRI) is higher than the yield from pre-processed biomass (PRE). This could indicate that the hydrolysis process used in these experiments is unsuitable for the pre-processed biomass or that a proportion of the proteins in the material are insoluble. Experiments using harsh hydrolysis conditions have indicated that a proportion of the pre-processed biomass is insoluble/un-hydrolysable (unpublished). Since hydrolysis was only conducted once for each condition, no statistical analyses were performed.
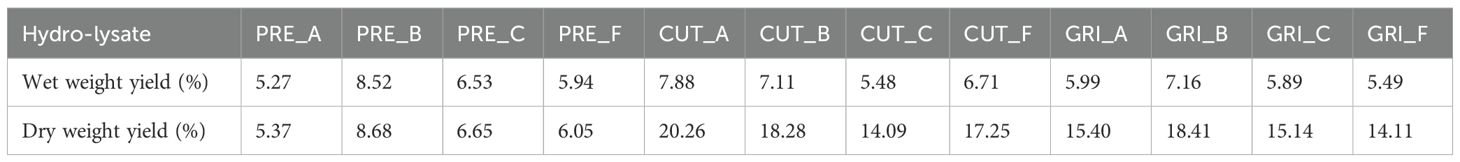
Table 2. Hydrolysate yields, on wet weight and dry matter (DM) basis (n=1).
The hydrolysates were analyzed for proximate compositions (Table 3). The moisture content of the hydrolysates ranged from 5.64 (PRE_F) to 2.43 (CUT_F). In general, the moisture content was higher for the PRE hydrolysates compared to CUT and GRI. Most of the hydrolysates had protein contents higher than 90%, which is the maximum reported protein content due to measurement uncertainties. All hydrolysates had protein contents greater than 87% using nitrogen conversion factor 6.25 and above 78% using conversion factor 5.6 (Supplementary Table 2), as has been suggested previously as a more suitable conversion factor for fish (Mæhre et al., 2018). The ash content varied from 6.15% (CUT_A) to 9.03% (GRI_A). Higher ash contents were observed in the GRI hydrolysates compared to CUT and PRE, which might result from the increased availability of minerals after grinding. High ash content can limit the use of hydrolysates in food applications. The point of grinding the material prior to enzymatic hydrolysis is that all proteins should be readily available for the enzymes, but this can also lead to the release of other substances, such as minerals from the bones. The oil content was below 1.5% for all hydrolysates, which is the lowest reported oil content due to measurement uncertainties. This indicates that the oil separation was successful. Briefly, the results show that all protein hydrolysates have high protein content and low oil content, which is promising from a food and feed perspective.
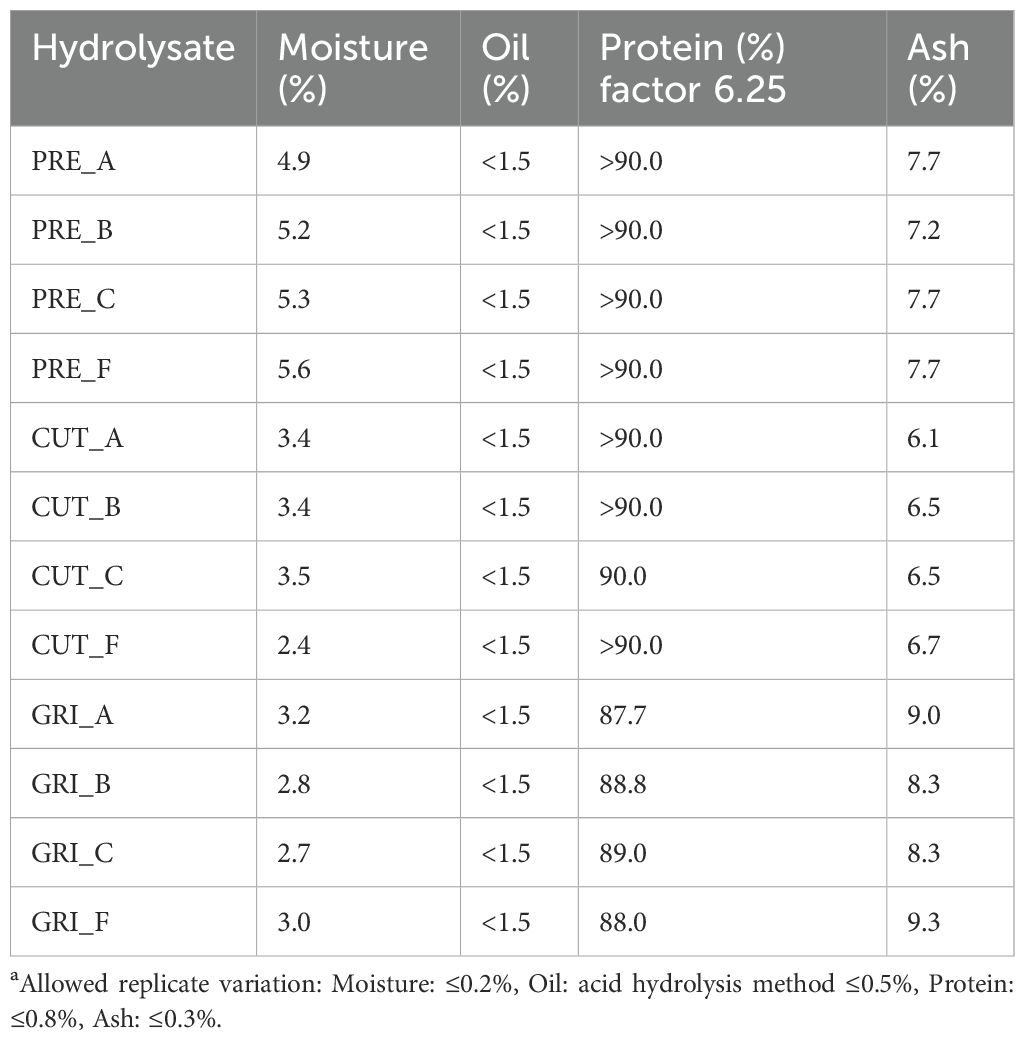
Table 3. Proximate compositions of the protein hydrolysatesa.
The average molecular weight (AMW) and peptide size distribution were analyzed for all hydrolysates using SEC, and a difference between the hydrolysates was observed (Figure 2). The PRE hydrolysates had higher AMW (all above 3300 Da) than the CUT and GRI hydrolysates. The AMWs for the CUT and GRI hydrolysates ranged from 1495–2549 Da, which corresponds well with previous hydrolysis experiments of sea bass and sea bream biomass (Valcarcel et al., 2020). The enzymatic hydrolysis performance and hydrolysate quality depend on several factors, such as pH, hydrolysis time, reaction temperature, the enzyme used, and its concentration (Nikoo et al., 2023; Whitaker et al., 2021). In this study, the pre-processed biomass had high DM content (above 95%). It is, therefore, hypothesized that more forceful hydrolysis conditions are needed to obtain smaller peptides from this biomass, e.g., using higher enzyme concentrations or more water in the process. Similar observations are made considering the peptide size distributions of the different hydrolysates, where the PRE hydrolysates have considerably larger amounts of the largest peptide fraction, corresponding to peptides above 2979 Da. The peptide sizes affect the properties of the hydrolysate, such as bioactivity, solubility, bioavailability, and taste, all of which are highly important if the hydrolysates are aimed for human consumption or feed purposes.
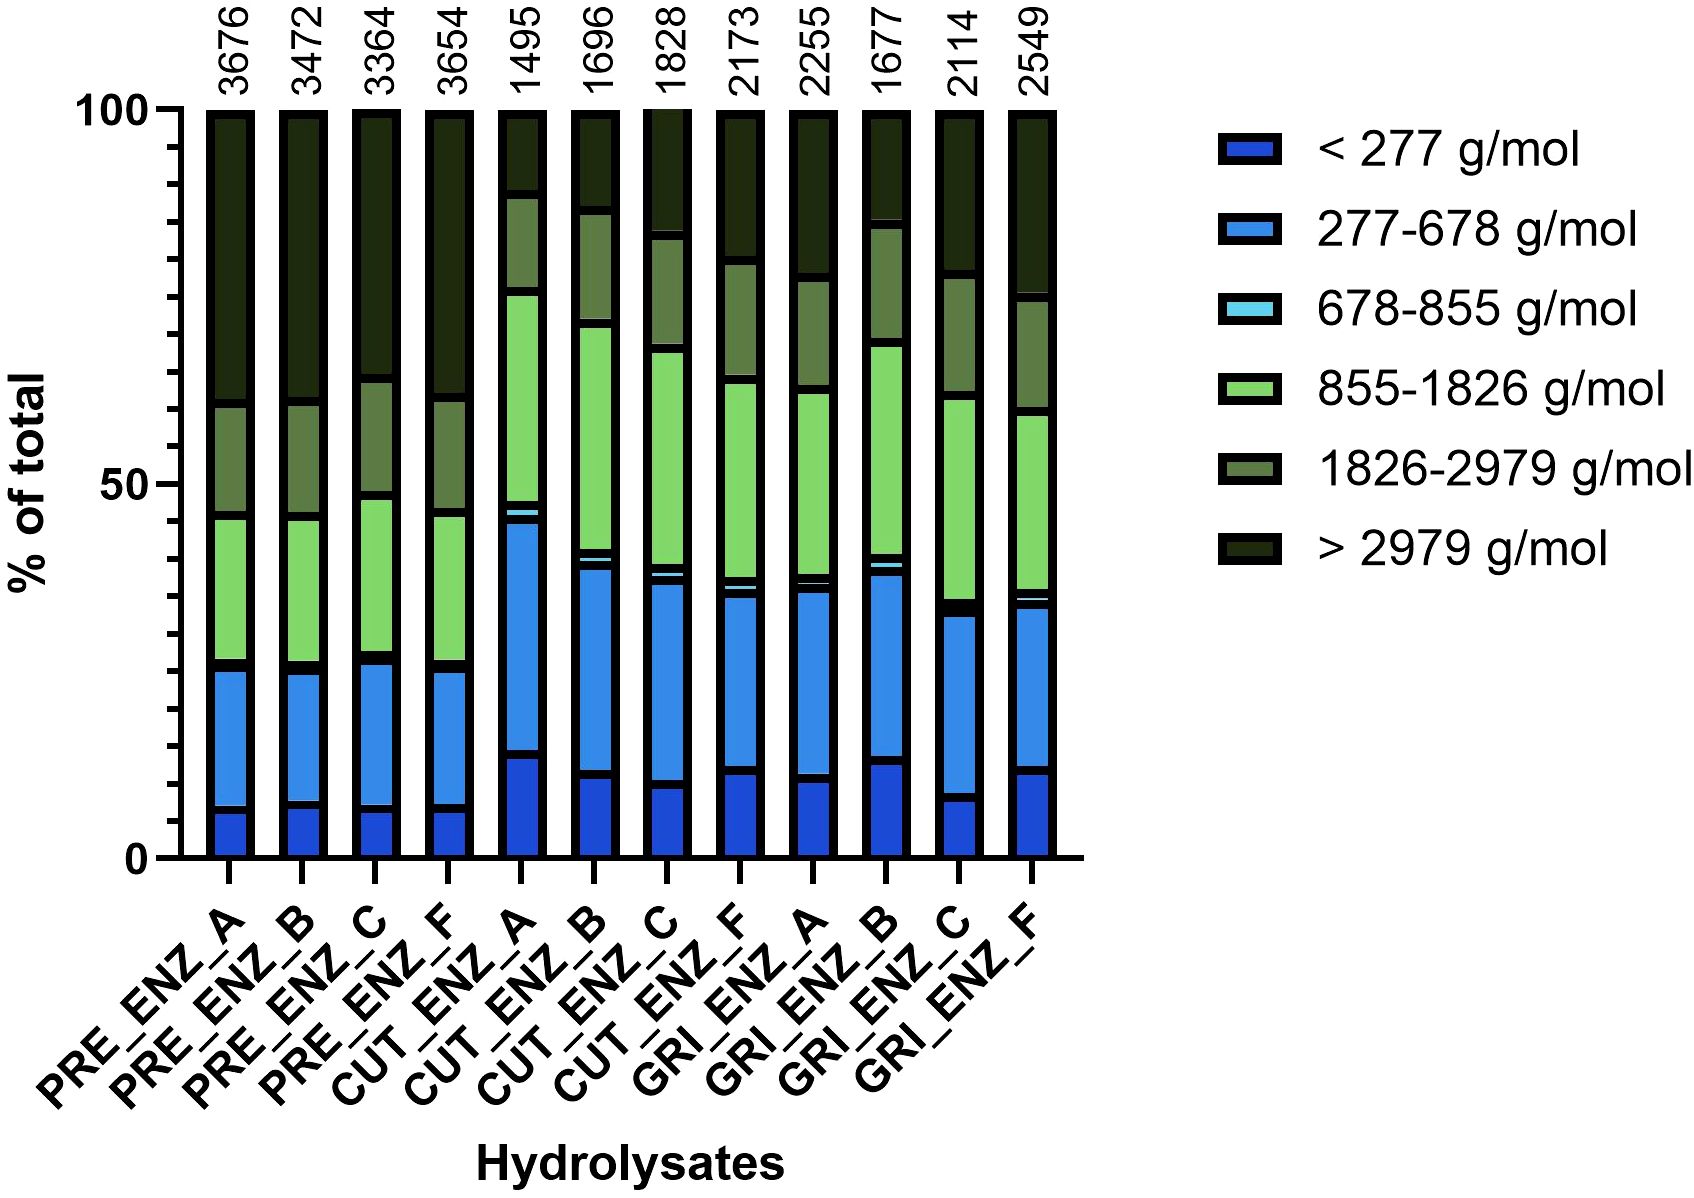
Figure 2. Peptide size distribution of the hydrolysates, measured by HPLC-SEC and divided into size-based fractions. The numbers above the bars represent the calculated average molecular weight of the hydrolysates in Daltons (Da).
3.1.3 Amino acid composition of protein hydrolysates
The total amino acid compositions of all hydrolysates were analyzed (Table 4). The sum of essential amino acids (EAA) was slightly lower for the PRE hydrolysates (around 26 g/100 g) compared to the CUT and GRI hydrolysates (from 30–34 g/100 g). The total sum of amino acids ranged from around 76–81 g/100 g, which is lower than the calculated Kjeldahl protein (using N x 6.25 protein conversion factor). The results are similar when using a lower protein conversion factor of 5.6 (Supplementary Table 2). The sum of total amino acids has been considered to give the most accurate protein content estimate in previous studies (Mæhre et al., 2018). It should, however, be specified that in this analysis, certain amino acids are not accurately assessed due to e.g., complete or partial degradation during preparation (Lian et al., 2024). The amino acids proline, glycine, and hydroxyproline, often found in high amounts in connective tissue due to their high collagen content, are observed in higher amounts in the PRE hydrolysates compared to CUT and GRI. Whether this is due to the pre-processing step or variations in the initial biomass is uncertain since the biomass composition that goes into the pre-processing is unknown. Different fractions of side streams (e.g., heads, skins, and backs) can have significantly different proximate compositions (de la Fuente et al., 2021; Munekata et al., 2020; Pateiro et al., 2020), which will naturally influence the final products, such as protein hydrolysates. The most abundant amino acids found in the hydrolysates were Glu and Gly, which have been observed previously with sea bass and sea bream side streams and hydrolysates (Demirtaş Erol et al., 2017; Munekata et al., 2020; Pateiro et al., 2020; Valcarcel et al., 2020).
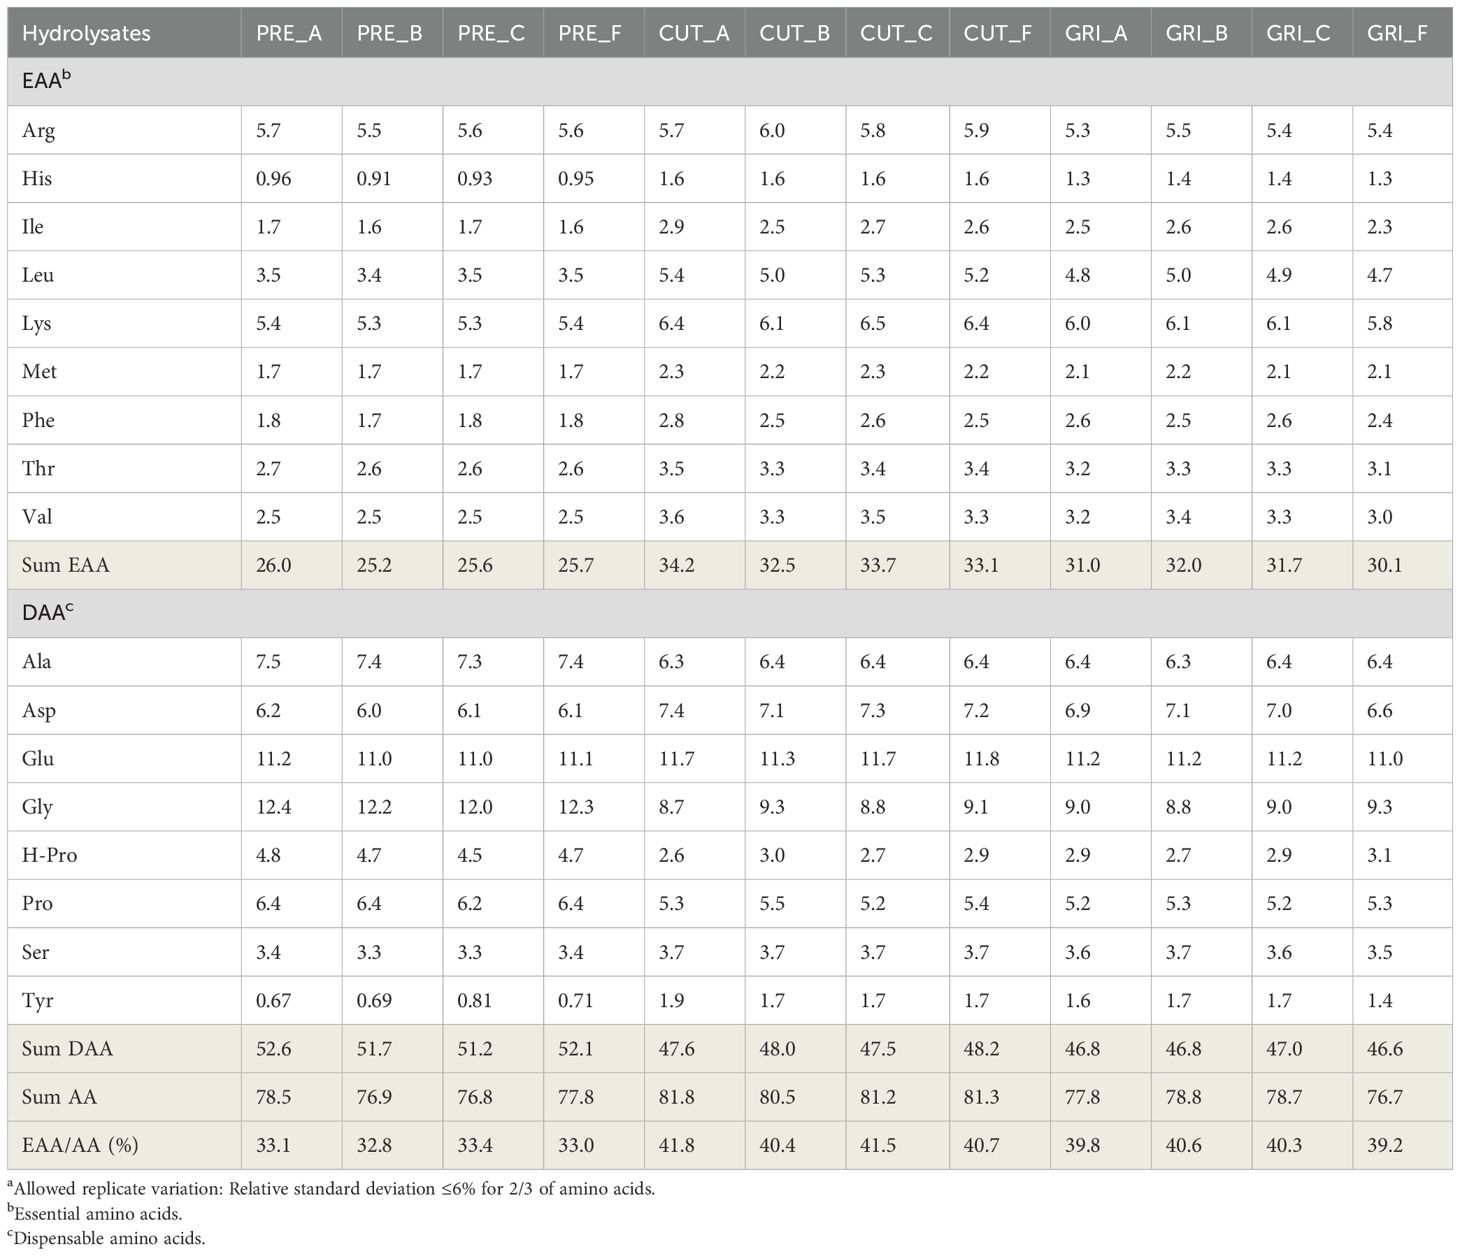
Table 4. Total amino acid composition (g/100g) of the hydrolysatesa.
3.1.4 Oxidation of oil fractions
The oil samples obtained after hydrolysis were analyzed for peroxide value (primary oxidation products) and anisidine value (secondary oxidation products), and the TOTOX was calculated (Table 5). The TOTOX value for the obtained oil fractions ranged from 22 (GRI_OIL_F) to 40.8 (PRE_OIL_F). Only two samples had a TOTOX lower than 26, CUT_OIL_B and GRI_OIL_F. All oil samples had TOTOX values higher than 20, indicating low quality. It should be highlighted that no preventive measures were taken during the hydrolysis and separation processes. After the samples were separated from the liquid hydrolysate, they were stored without added antioxidants or air removal, in plastic tubes at -20°C. The anisidine value was above 20 for all oil samples except for CUT_OIL_F and GRI_OIL_F. The peroxide value was mostly below 5, except for CUT_OIL_F and GRI_OIL_F. The TOTOX values for the PRE-OIL samples were all above 30, while the oil samples from un-processed biomass varied from 22.0 to 33.4. It is believed that different measures, such as nitrogen flushing and the addition of antioxidants could improve oil quality. According to the standard for fish oils (CODEX STAN 329-2017), fish oils should not exceed a TOTOX value of 26. The peroxide value should be below 5, and the anisidine value should be below 20. The oil fraction was not the focus of this study. Still, for further work, assessing the fatty acid composition and potential quality-enhancing measurements would be relevant to evaluate potential utilization for human consumption or feed purposes.
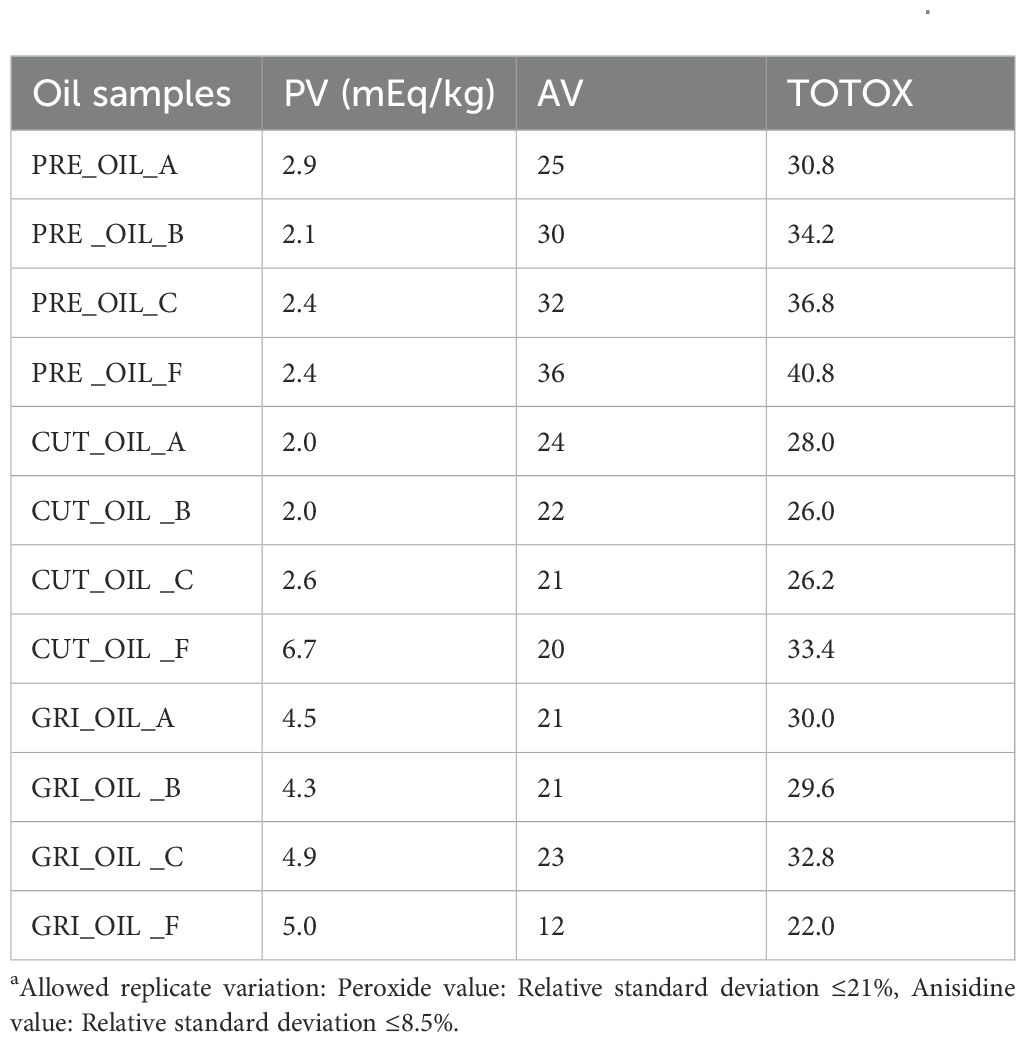
Table 5. Peroxide value (PV), anisidine value (AV), and calculated Total Oxidation Value (TOTOX) of oil fractions obtained after hydrolysisa.
3.1.5 Emulsifying properties of hydrolysates
All the hydrolysates were evaluated for EAI and ESI. The EAI of hydrolysates immediately after emulsion formation was most affected by enzyme type, with enzyme C (Corolase 8000) exhibiting the lowest EAI, especially within the GRI samples (Figure 3). The average EAI was generally higher for the hydrolysates produced with B (Bromelain) and F (FoodPro) than A (Alcalase) and C across all raw materials. ESI upon 60 minutes incubation (Figure 4) revealed that PRE hydrolysates, especially of A and C enzymes, better maintained emulsions than the CUT- and GRI-hydrolysates. Functional properties of hydrolysates including emulsifying properties are influenced by their solubility, surface properties, molecular weight and peptide amino composition, which in return are dependent on raw material source and parameters of enzymatic hydrolysis (Halim et al., 2016). Hydrolysates of low molecular weight can exhibit weakened interfacial layers around emulsion droplets (Saidi and Ben Amar, 2016), while those carrying high proportion of hydroxylated amino acids, such as hydroxyproline (Hyp) and hydroxylysine (Hyl), can contribute to better emulsifying activity and stability due to their ability to interact with both hydrophilic and hydrophobic phases (Elavarasan et al., 2014). The observed enzyme-dependent variation in EAI of hydrolysates could not be accounted for by their amino acid composition or molecular weight (Figure 2; Table 4). However, the higher stability of emulsions in PRE-samples corresponded to the higher molecular weight and higher proportion of hydroxyproline in the PRE samples.
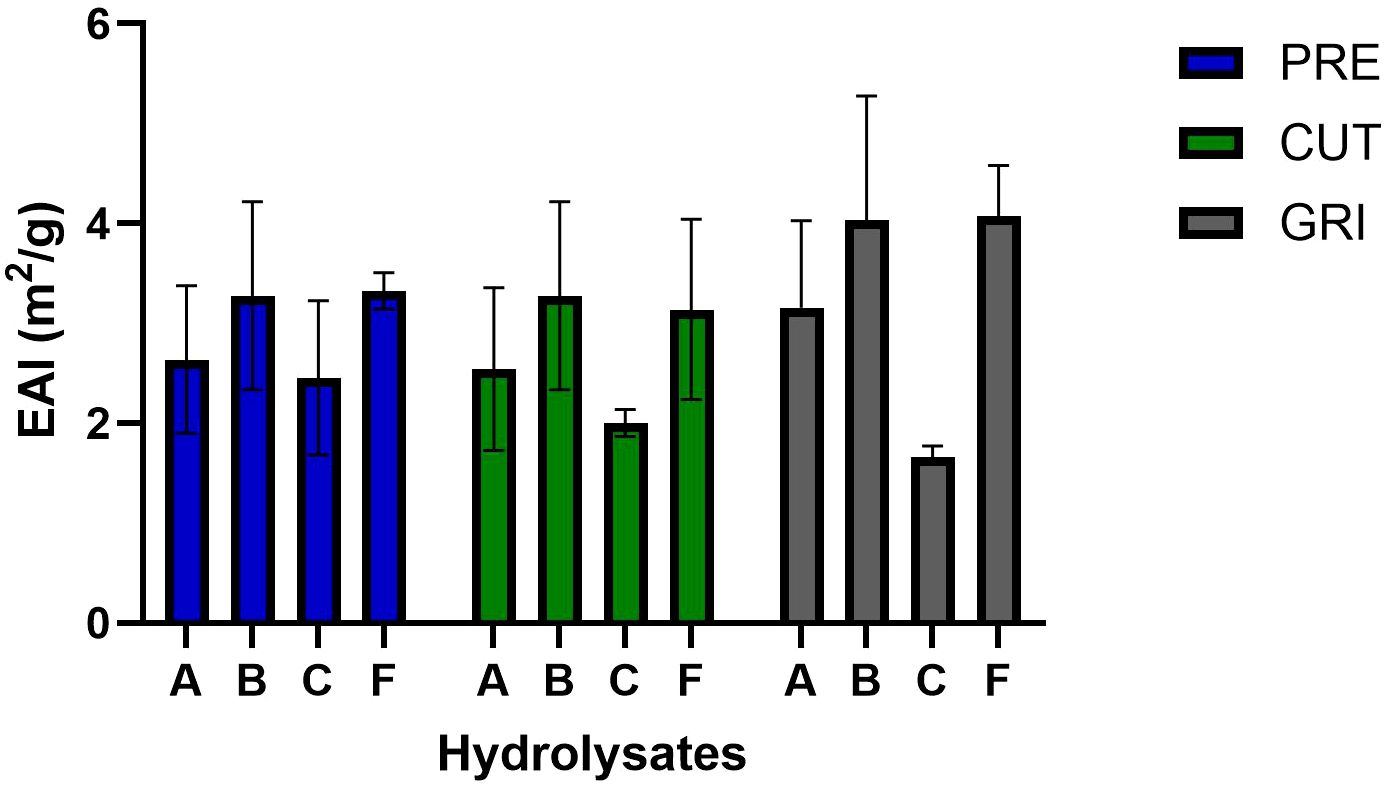
Figure 3. Emulsifying activity index (EAI, m2/g) of the PRE-, CUT- and GRI-hydrolysates produced using different enzymes A-F.
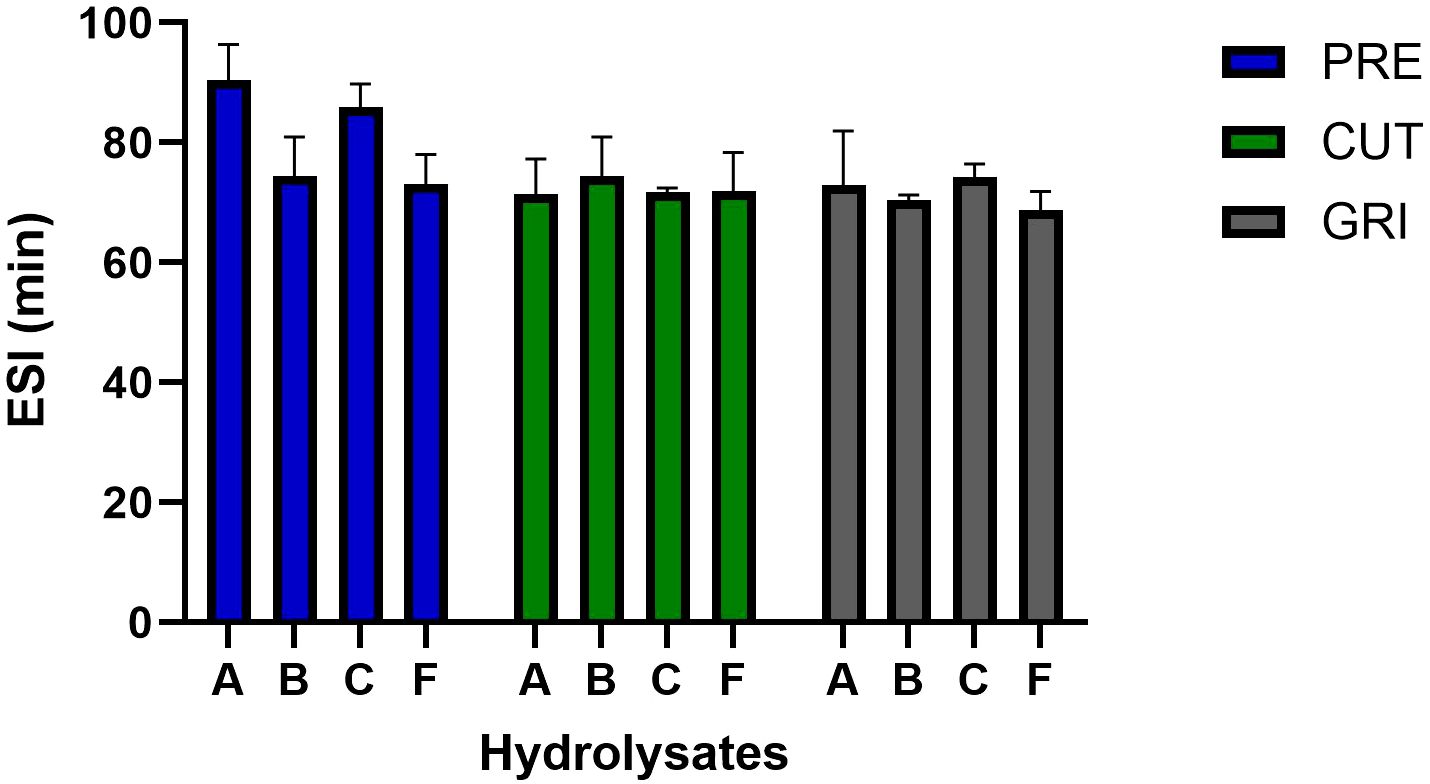
Figure 4. Emulsion stability index (ESI, min) of the PRE-, CUT- and GRI-hydrolysates produced using different enzymes A-F.
3.2 Biological activity properties of hydrolysates
3.2.1 ABTS radical scavenging activity
All hydrolysates were evaluated for antioxidant activity using the ABTS radical scavenging assay. In an initial screen, all hydrolysates were assayed at 100 µg/mL (Figure 5). The PRE hydrolysates had lower antioxidant capacity than the CUT and GRI hydrolysates. All PRE hydrolysates gave a TEAC of around 15 µM at the assayed concentration, compared to around 22-25 µM TEAC for the un-processed hydrolysates, CUT, and GRI. A follow-up screen of a selection of six hydrolysates was conducted using a dilution series from 400 to 25 µg/mL (Figure 6), showing the same trend observed in the initial screen. The hydrolysates produced from un-processed biomass (CUT and GRI) had higher TEAC at all tested concentrations. There could be several reasons for this difference, and the difference in AMW is a reasonable hypothesis. The CUT and GRI hydrolysates all had lower AMW compared to the PRE hydrolysates. Correlations between low AMW and bioactivities have been observed in previous studies (Tekle et al., 2022; Valcarcel et al., 2020).
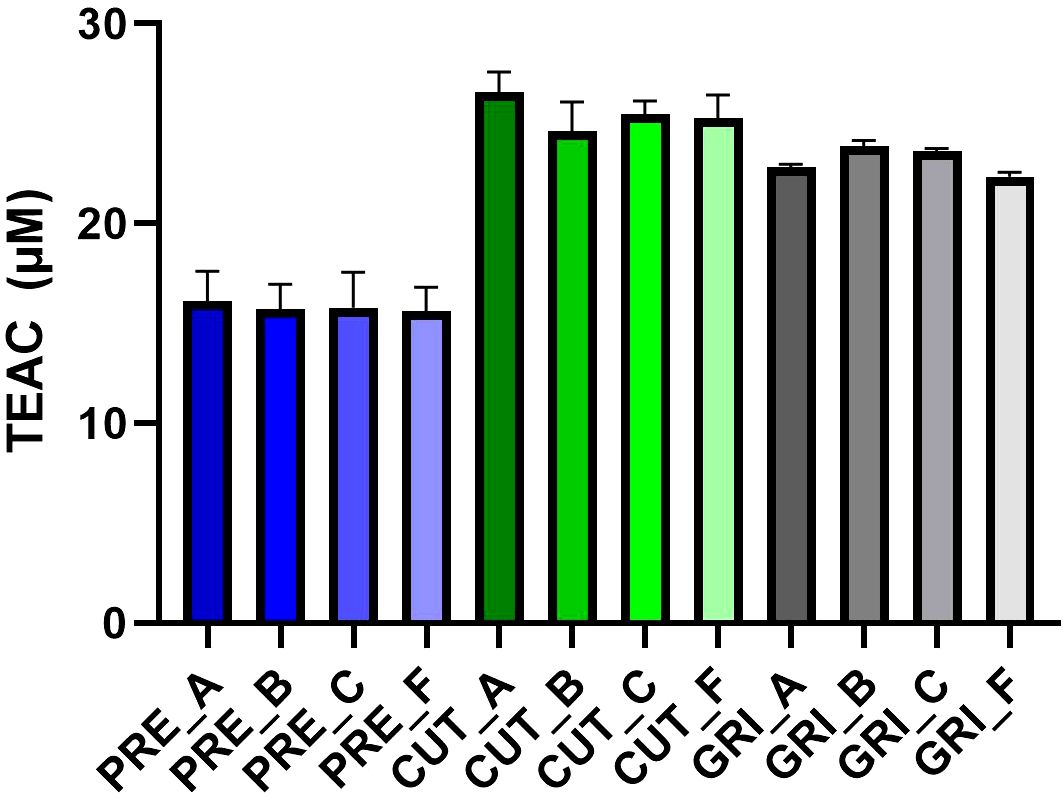
Figure 5. Antioxidant activity of the hydrolysates assayed at 100 µg/mL with the ABTS radical scavenging assay. Results expressed as Trolox Equivalent Antioxidant Capacity (TEAC) (n=3).
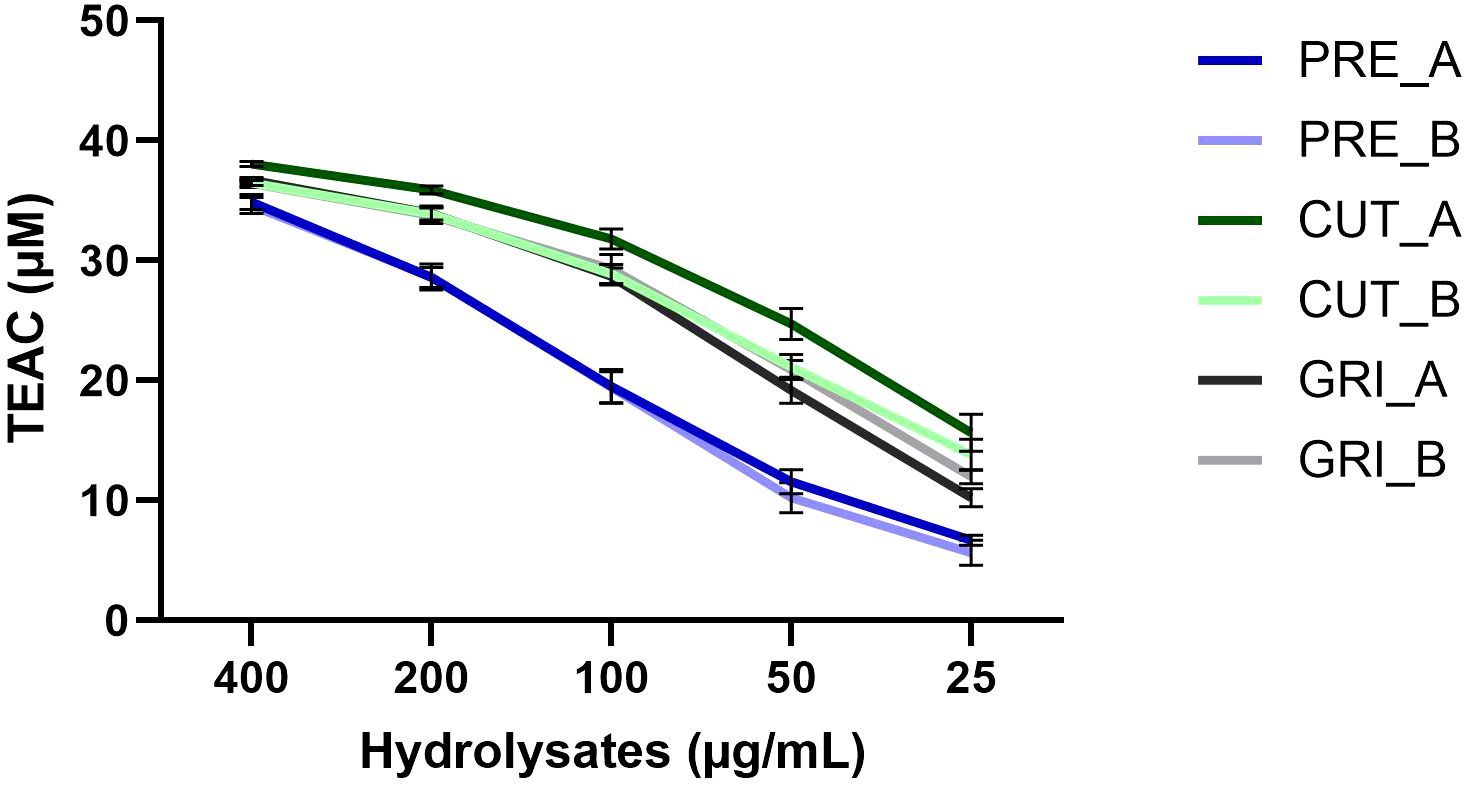
Figure 6. Antioxidant activity of selected hydrolysates assayed at concentrations from 400 - 25 µg/mL with the ABTS radical scavenging assay. Results expressed as Trolox Equivalent Antioxidant Capacity (TEAC) (n=3).
3.2.2 DPP-IV inhibiting activity
DPP-IV is an important serine protease that degrades hormones which are important for maintaining glucose homeostasis and is, therefore, important in the regulation of blood glucose. All hydrolysates were tested for anti-diabetic activity by screening for inhibition of DPP-IV at 1 mg/mL and 0.5 mg/mL. The results are shown in Figure 7. There is a difference in activity between the hydrolysates, but it is not as profound as was observed with the antioxidant activity. The highest inhibitory activity was found for CUT_B, at around 55.5% inhibition at 1 mg/mL, while the lowest inhibition at the same concentration was PRE_C, with 34.6% inhibition. A dose-response activity can be observed for all hydrolysates, with higher inhibition at 1 mg/mL than 0.5 mg/mL. Since the inhibition was not substantial (all below 60%) at such a high concentration (1 mg/mL), no further testing was conducted.
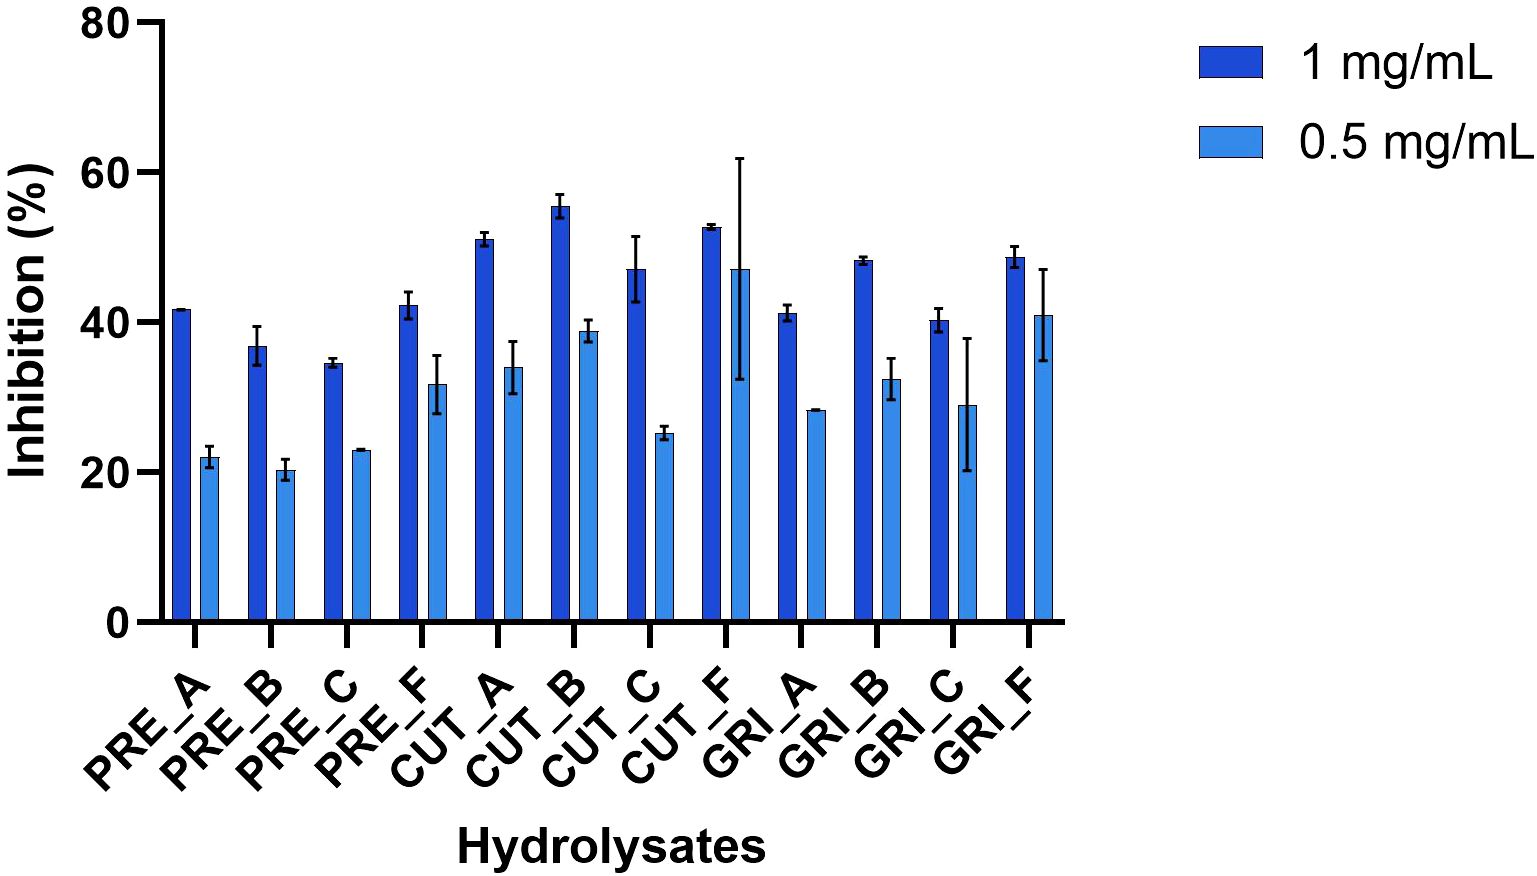
Figure 7. DPP-IV inhibiting activity of the hydrolysates assayed as 1 and 0.5 mg/mL (n=3).
3.2.3 Cell growth assay
All hydrolysates were assayed against L6 cells and primary bovine myoblast cells at two concentrations (500 and 50 µg/mL) to evaluate if the hydrolysates had any positive or negative effect on cell growth. Cell growth was measured by confluence using the Incucyte S3 Live Cell Analysis System. The results in Table 6 show that some of the hydrolysates affect the growth of the cells, compared to the control (cells grown with the same growth conditions without added hydrolysate). For both cell types, GRI_A shows a tendency to enhance cell growth at the two tested concentrations. For the L6 cells, also CUT_A displays a trend of positive cell growth at both concentrations. Also, GRI_B shows a tendency to enhance cell growth at the lowest concentration in L6 cells, while a significant increase in cell growth was observed between 44 and 84 hours with the highest concentration. GRI_F, on the other hand, has a significantly inhibiting effect against the L6 cells after 96 hours at the highest concentration. The relative growth curves of the L6 cells treated with GRI_F and GRI_B compared to the control can be seen in Figure 8. The relative growth curve of GRI_C has been included as a comparison, as an example of sample with no effect on proliferation compared to the control (Figure 8). Against the bovine cells, the highest concentration of GRI_B showed a tendency of inhibiting cell growth. The CUT hydrolysates produced using enzymes A and F both show a tendency to inhibit cell growth at both concentrations against the bovine cells. CUT_F also shows a tendency to inhibit cell growth against the L6 cells at the highest tested concentration. Overall, the hydrolysates showed a more prominent tendency to enhance cell growth in L6 cells, with 11 of the assayed conditions giving a positive trend or significant increase in cell growth. Only 4 of the assayed conditions showed a positive growth trend for the bovine cells, indicating that these 2 cell types respond differently to the various hydrolysates. However, the CUT hydrolysate prepared with the F enzyme tended to negatively affect cell growth in both cell types. In addition, more negative growth trends were observed for the bovine cells compared to the L6. These results show that the hydrolysate processing parameters (e.g., enzyme, pre-treatment) can affect cell growth of different cell types and species differently. However, it should be highlighted that about half of the assayed conditions had no impact on the growth of the cells (25/48), indicating that most of the hydrolysates are compatible with the cells and do not display any major toxicity. All growth curves can be found in the Supplementary Material (Supplementary Figures 1-15).
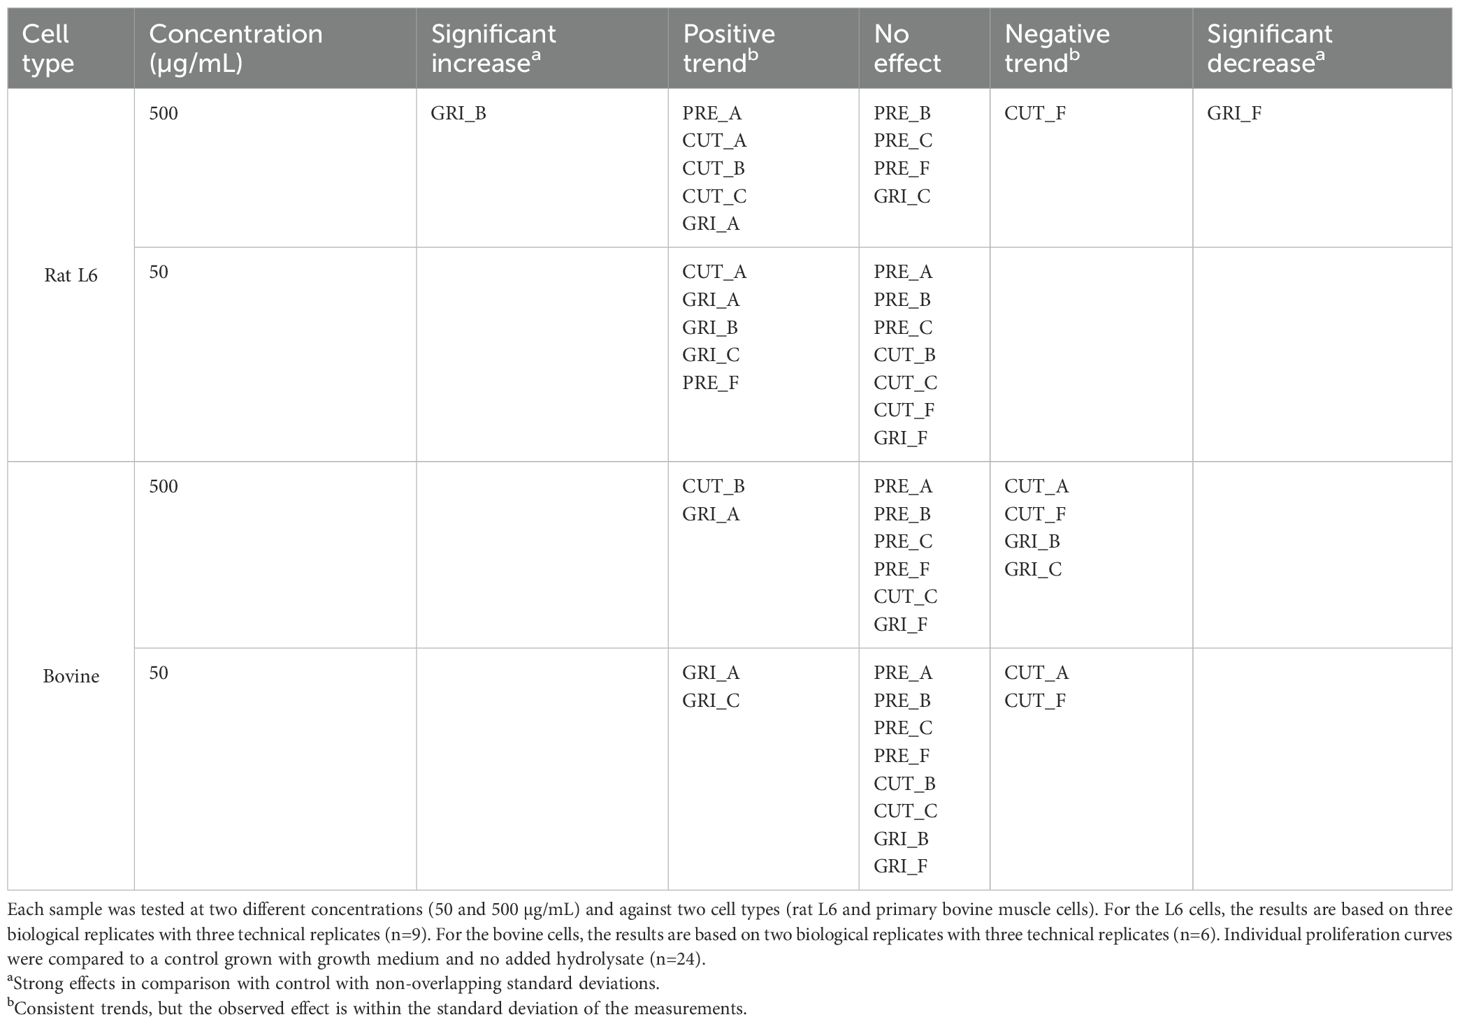
Table 6. Summary of results on the effect of the various protein hydrolysates on cell proliferation measured by confluence.
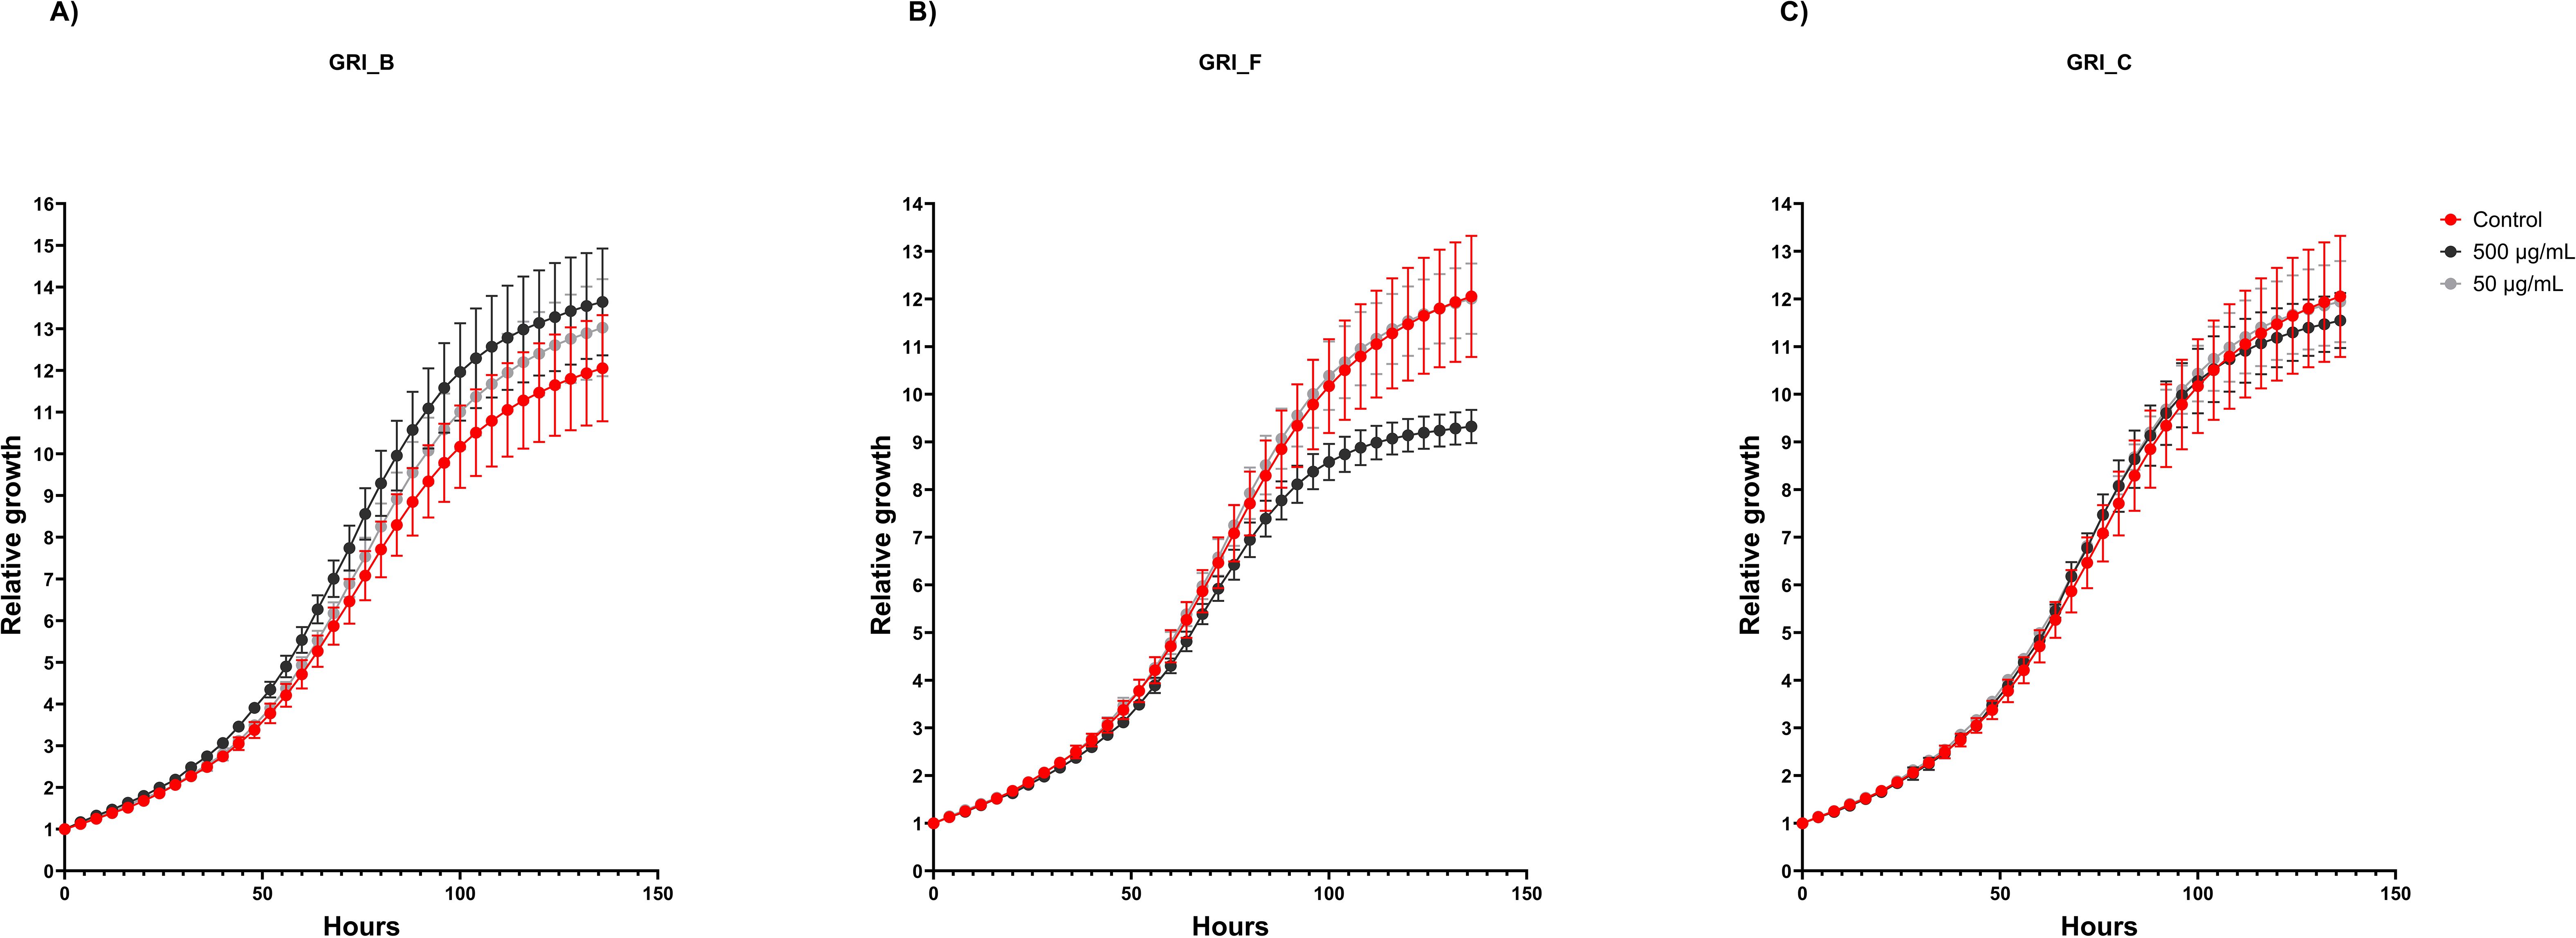
Figure 8. The relative growth curve of L6 cells treated with (A) GRI_B hydrolysate, (B) GRI_F and (C) GRI_C. The hydrolysates were added at 500 and 50 µg/mL and compared to the control without added hydrolysate. The growth is measured by confluence. The graph is made from one biological replicate (with three technical replicates) as a representative sample result.
3.2.4 Glucose uptake assay
Stimulation of muscle glucose uptake is a potential strategy for managing hyperglycemia as it will lower the blood glucose concentrations. All hydrolysates were assayed for potential reduction or increase in glucose uptake by differentiated L6 rat skeletal muscle cells at two concentrations, 500 and 50 µg/mL (three technical replicates, one biological replicate) (Figure 9). The insulin control (0.1 µM) showed 99.88% glucose uptake compared to the blank control. The negative controls without added 2DG and with stop buffer added before 2DG gave 0.67% and 0.70%, respectively. The glucose uptake of the cells treated with the hydrolysates varied from 89.95% to 118.56%. For most hydrolysates, the glucose uptake was slightly higher at 500 µg/mL than at 50 µg/mL. The highest uptake, with an 18% increase compared to the blank control, was observed for the cells treated with PRE_A. Several of the hydrolysates had an increased uptake of 10% or more compared to the blank (PRE_A, PRE_B, PRE_C, CUT_B, GRI_B), at 500 µg/mL, which shows promising potential as blood sugar lowering ingredients. More experiments should be performed to verify any potential increase in glucose uptake. A study by Bjerknes and co-authors gave a significant increase in glucose uptake using low molecular weight peptides (AMW 880 Da) obtained from a salmon hydrolysate (Bjerknes et al., 2024). Here, three PRE-hydrolysates, which all have higher average molecular weight than the CUT and GRI hydrolysates, give good glucose uptake, indicating a different functionality than low peptide size.
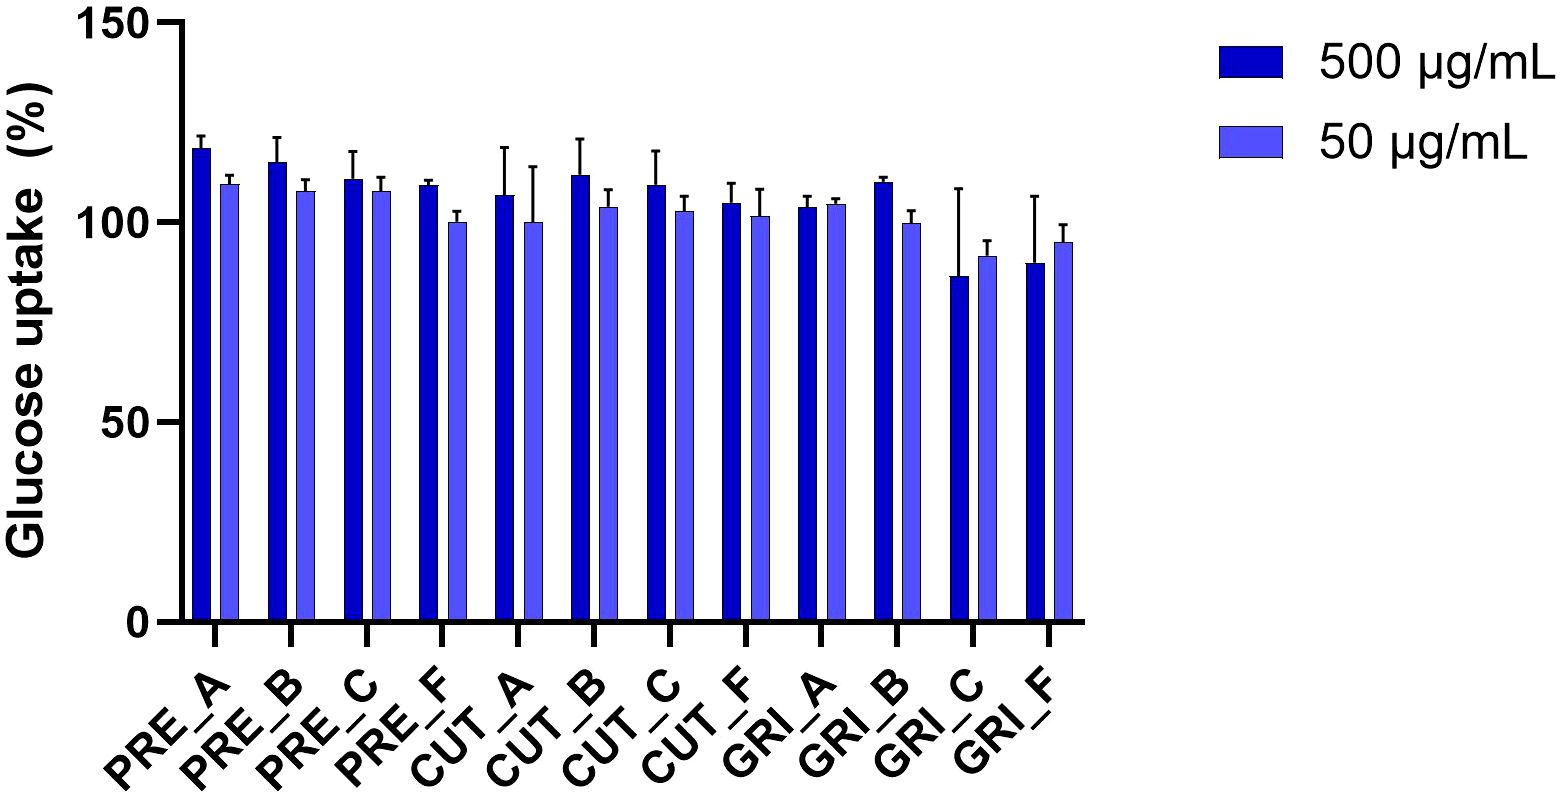
Figure 9. Effects of hydrolysates on glucose uptake in L6 rat skeletal muscle cells. The data is standardized to the blank and presented as % glucose uptake. The experiment was performed using technical triplicates (n=3).
4 Conclusions
In this study, hydrolysates were produced using pre-processed and un-processed side streams from sea bream and sea bass aquaculture. The pre-processing was performed to stabilize the biomass and reduce its volume and weight for storage and transport. It represents a new possibility for stabilizing biomass that is easily decayed, holding promise for increased side stream utilization. The un-processed biomass was ground or cut before hydrolysis to assess if this affected the yield and properties of the hydrolysates. Differences were observed in the composition of the hydrolysates, e.g., the oil content was lower for the hydrolysates of pre-processed biomass, and the ash content was highest for the un-processed biomass ground before hydrolysis. The protein content of the hydrolysates was high, above 87% (N x 6.25) for all the hydrolysates. The AMW was higher for the hydrolysates from pre-processed biomass compared to its un-processed counterparts. Also, the yield of the PRE hydrolysates was low, considering the high DM content of the starting material. The results regarding yield and AMW indicate that the hydrolysis process must be further optimized for this type of material. Regarding the biological activity screening, the largest difference was observed in the antioxidant testing, where the hydrolysates from pre-processed biomass were less active than the hydrolysates from un-processed biomass. Positive results were obtained in the glucose uptake assay, where five of the twelve hydrolysates gave an increased uptake of more than 10% compared to the blank control. Some differences were also observed regarding cell growth and emulsifying properties.
Processing biomass for conservation and improved storage and shipment holds promise for utilizing side streams from the food industry. Still, more information and knowledge are needed on the impact processing can have on biomass and how this will affect further processing and products, such as protein hydrolysates. The results from this study indicate that the peptides produced by hydrolysis of the pre-processed biomass were not hydrolyzed to the same extent as the hydrolysates produced from un-processed biomass. Further studies on hydrolysis conditions and/or other treatments are necessary to bring out the full potential of this biomass. In addition, further research on the contents of environmental pollutants and contaminants, scalability of the process, and inclusion of down-stream processing steps, such as filtration, should be performed to fully evaluate the potential of this biomass and the effect of the pre-processing on the final products. This study shows that protein hydrolysates produced from side streams of sea bass and sea bream aquaculture have potential as food ingredients for, e.g., functional foods and protein enrichment, showing high nutritional value and interesting bioactivities.
Data availability statement
The original contributions presented in the study are included in the article/Supplementary Material. Further inquiries can be directed to the corresponding author.
Ethics statement
Ethical approval was not required for the studies on animals in accordance with the local legislation and institutional requirements because only commercially available established cell lines were used.
Author contributions
MJ: Conceptualization, Data curation, Formal Analysis, Investigation, Methodology, Validation, Visualization, Writing – original draft, Writing – review & editing. JM: Data curation, Formal Analysis, Methodology, Supervision, Writing – original draft. IS: Data curation, Formal Analysis, Investigation, Methodology, Writing – original draft. NS: Data curation, Formal Analysis, Methodology, Supervision, Visualization, Writing – original draft, Writing – review & editing. SW: Conceptualization, Methodology, Supervision, Writing – original draft. KL: Conceptualization, Funding acquisition, Methodology, Project administration, Resources, Supervision, Writing – review & editing.
Funding
The author(s) declare that financial support was received for the research and/or publication of this article. This research was funded by the EcoeFISHent project (“Demonstrable and replicable cluster implementing systemic solutions through multilevel circular value chains for eco-efficient valorization of fishing and fish industries side-streams”) belonging to the EU Horizon 2020 research and innovation program (Grant agreement No 101036428). Funding was also provided through the secondment program at Nofima.
Acknowledgments
The authors would like to thank the EcoeFISHent project partners, particularly Aqua de Mâ, for providing the sea bass and sea bream side streams and Themis S.p.A for pre-treating the biomass.
Conflict of interest
The authors declare that the research was conducted in the absence of any commercial or financial relationships that could be constructed as a potential conflict of interest.
Generative AI statement
The author(s) declare that Generative AI was used in the creation of this manuscript. Grammarly Business (v1.2.127.1581) was used for proofreading and text alterations.
Publisher’s note
All claims expressed in this article are solely those of the authors and do not necessarily represent those of their affiliated organizations, or those of the publisher, the editors and the reviewers. Any product that may be evaluated in this article, or claim that may be made by its manufacturer, is not guaranteed or endorsed by the publisher.
Supplementary material
The Supplementary Material for this article can be found online at: https://www.frontiersin.org/articles/10.3389/fmars.2025.1572015/full#supplementary-material
References
Agyei D., Ongkudon C. M., Wei C. Y., Chan A. S., Danquah M. K. (2016). Bioprocess challenges to the isolation and purification of bioactive peptides. Food Bioproducts Process. 98, 244–256. doi: 10.1016/j.fbp.2016.02.003
Ananey-Obiri D., Tahergorabi R. (2018). Development and Characterization of Fish-Based Superfoods. Rijeka: IntechOpen. doi: 10.5772/intechopen.73588
Bjerknes C., Wubshet S. G., Rønning S. B., Afseth N. K., Currie C., Framroze B., et al. (2024). Glucoregulatory properties of a protein hydrolysate from Atlantic salmon (Salmo salar): preliminary characterization and evaluation of DPP-IV inhibition and direct glucose uptake in vitro. Marine Drugs 22, 151. Available at: https://www.mdpi.com/1660-3397/22/4/151 (Accessed January 1, 2024).
Bligh E. G., Dyer W. J. (1959). A rapid method of total lipid extraction and purification. Can. J. Biochem. Physiol. 37, 911–917. doi: 10.1139/o59-099
Boyd C. E., McNevin A. A., Davis R. P. (2022). The contribution of fisheries and aquaculture to the global protein supply. Food Secur. 14, 805–827. doi: 10.1007/s12571-021-01246-9
de la Fuente B., Pallarés N., Barba F. J., Berrada H. (2021). An integrated approach for the valorization of sea bass (Dicentrarchus labrax) side streams: evaluation of contaminants and development of antioxidant protein extracts by pressurized liquid extraction. Foods 10, 1–19. doi: 10.3390/foods10030546
Demirtaş Erol N., Erdem Ö., Çaklı Ş. (2017). Stability of fish protein hydrolysate from heads of gilthead sea bream (Sparus aurata), european sea bass (Dicentrarchus labrax) and rainbow trout (Oncorhyncus mykiss) during storage. Ege J. Fisheries Aquat. Sci. 34, 327–336. doi: 10.12714/egejfas.2017.34.3.12
Elavarasan K., Naveen Kumar V., Shamasundar B. A. (2014). Antioxidant and functional properties of fish protein hydrolysates from fresh water carp (atla catla) as influenced by the nature of enzyme. J. Food Process. Preservation 38, 1207–1214. doi: 10.1111/jfpp.12081
FAO (2022). 2022 The State of World Fisheries and Aquaculture: Towards Blue Transformation, (1020-5489). Available online at: https://www.fao.org/3/cc0461en/cc0461en.pdf (Accessed August 10, 2023).
Gao R., Yu Q., Shen Y., Chu Q., Chen G., Fen S., et al. (2021). Production, bioactive properties, and potential applications of fish protein hydrolysates: Developments and challenges. Trends Food Sci. Technol. 110, 687–699. doi: 10.1016/j.tifs.2021.02.031
Gehring C., Davenport M., Jaczynski J. (2009). Functional and nutritional quality of protein and lipid recovered from fish processing by-products and underutilized aquatic species using isoelectric solubilization/precipitation. Curr. Nutr. Food Sci. 5, 17–39. doi: 10.2174/157340109787314703
Halim N. R. A., Yusof H. M., Sarbon N. M. (2016). Functional and bioactive properties of fish protein hydolysates and peptides: A comprehensive review. Trends Food Sci. Technol. 51, 24–33. doi: 10.1016/j.tifs.2016.02.007
Hayes M., Tiwari B. K. (2015). Bioactive carbohydrates and peptides in foods: an overview of sources, downstream processing steps and associated bioactivities. Int. J. Mol. Sci. 16, 22485–22508. Available at: https://www.mdpi.com/1422-0067/16/9/22485 (Accessed September 2, 2024).
Korhonen H., Pihlanto A. (2006). Bioactive peptides: Production and functionality. Int. Dairy J. 16, 945–960. doi: 10.1016/j.idairyj.2005.10.012
Lian K., Maribu I., Rode T. M., Jenssen M., Vang B., Solstad R. G. (2024). More sustainable use of aquaculture cleaner fish: collagen-rich protein hydrolysates from lumpfish (Cyclopterus lumpus) – effects of biomass, pretreatment, and enzyme choice. Front. Sustain. Food Syst. 8. doi: 10.3389/fsufs.2024.1346548
Mæhre H. K., Dalheim L., Edvinsen G. K., Elvevoll E. O., Jensen I.-J. (2018). Protein determination—Method matters. Foods 7, 5. Available at: https://www.mdpi.com/2304-8158/7/1/5 (Accessed June 13, 2024).
Måge I., Matić J., Dankel K. R. (2024). SEC2MWD: A MATLAB toolbox for derivation of molecular weight distributions from size exclusion chromatography. SoftwareX 25, 101602. doi: 10.1016/j.softx.2023.101602
Matić J., Bøgwald I., Tengstrand E., Rønning S. B., Afseth N. K., Wubshet S. G. (2023). Calanus finmarchicus as a novel source of health-promoting bioactive peptides: Enzymatic protein hydrolysis, characterization, and in vitro bioactivity. Biocatalysis Agric. Biotechnol. 52, 102820. doi: 10.1016/j.bcab.2023.102820
Munekata P. E. S., Pateiro M., Domínguez R., Zhou J., Barba F. J., Lorenzo J. M. (2020). Nutritional characterization of sea bass processing by-products. Biomolecules 10, 232. Available at: https://www.mdpi.com/2218-273X/10/2/232 (Accessed June 20, 2024).
Nawaz A., Li E., Irshad S., Xiong Z., Xiong H., Shahbaz H. M., et al. (2020). Valorization of fisheries by-products: Challenges and technical concerns to food industry. Trends Food Sci. Technol. 99, 34–43. doi: 10.1016/j.tifs.2020.02.022
Naylor R. L., Kishore A., Sumaila U. R., Issifu I., Hunter B. P., Belton B., et al. (2021). Blue food demand across geographic and temporal scales. Nat. Commun. 12, 5413. doi: 10.1038/s41467-021-25516-4
Nguyen E., Jones O., Kim Y. H. B., San Martin-Gonzalez F., Liceaga A. M. (2017). Impact of microwave-assisted enzymatic hydrolysis on functional and antioxidant properties of rainbow trout Oncorhynchus mykiss by-products. Fisheries Sci. 83, 317–331. doi: 10.1007/s12562-017-1067-3
Nikoo M., Regenstein J. M., Yasemi M. (2023). Protein hydrolysates from fishery processing by-products: production, characteristics, food applications, and challenges. Foods 12, 4470. Available at: https://www.mdpi.com/2304-8158/12/24/4470 (Accessed September 2, 2024).
Pateiro M., Munekata P. E. S., Domínguez R., Wang M., Barba F. J., Bermúdez R., et al. (2020). Nutritional Profiling and the Value of Processing By-Products from Gilthead Sea Bream (Sparus aurata). Marine Drugs 18, 101. Available at: https://www.mdpi.com/1660-3397/18/2/101 (Accessed June 20, 2024).
Pearce K. N., Kinsella J. E. (1978). Emulsifying properties of proteins: evaluation of a turbidimetric technique. J. Agric. Food Chem. 26, 716–723. doi: 10.1021/jf60217a041
Rana S., Singh A., Surasani V. K. R., Kapoor S., Desai A., Kumar S. (2023). Fish processing waste: a novel source of non-conventional functional proteins. Int. J. Food Sci. Technol. 58, 2637–2644. doi: 10.1111/ijfs.16104
Re R., Pellegrini N., Proteggente A., Pannala A., Yang M., Rice-Evans C (1999). Antioxidant activity applying an improved ABTS radical cation decolorization assay. Free Radical Biol. Med. 26, 1231–1237. doi: 10.1016/S0891-5849(98)00315-3
Romano M., Romano M. (2015). Method for transforming waste and system for performing said method. Available online at: https://patentscope.wipo.int/search/en/detail.jsf?docId=WO2015181769 (Accessed January 8, 2025).
Rønning S. B., Pedersen M. E., Andersen P. V., Hollung K. (2013). The combination of glycosaminoglycans and fibrous proteins improves cell proliferation and early differentiation of bovine primary skeletal muscle cells. Differentiation 86, 13–22. doi: 10.1016/j.diff.2013.06.006
Saidi S., Ben Amar R. (2016). Valorisation of tuna processing waste biomass for recovery of functional and antioxidant peptides using enzymatic hydrolysis and membrane fractionation process. Environ. Sci. Pollut. Res. Int. 23, 21070–21085. doi: 10.1007/s11356-016-7334-5
Siddiqui S. A., Schulte H., Pleissner D., Schönfelder S., Kvangarsnes K., Dauksas E., et al. (2023). Transformation of seafood side-streams and residuals into valuable products. Foods 12, 422. Available at: https://www.mdpi.com/2304-8158/12/2/422 (Accessed September 2, 2024).
Sierra Lopera M., Sepúlveda Rincón C., Vasquez P., Figueroa O., Zapata Montoya J. (2018). Byproducts of aquaculture processes: Development and prospective uses. Review. Rev. Vitae 25, 128–140. doi: 10.17533/udea.vitae.v25n3a03
Szkudzińska K., Smutniak I., Rubaj J., Korol W., Bielecka G. (2017). Method validation for determination of amino acids in feed by UPLC. Accreditation Qual. Assurance 22, 247–252. doi: 10.1007/s00769-017-1281-9
Tacon A. G. J., Metian M. (2013). Fish matters: importance of aquatic foods in human nutrition and global food supply. Rev. Fisheries Sci. 21, 22–38. doi: 10.1080/10641262.2012.753405
Tekle S., Bozkurt F., Akman P. K., Sagdic O. (2022). Bioactive and Functional properties of gelatin peptide fractions obtained from sea bass (Dicentrarchus labrax) skin. Food Sci. Technol. 42, 1–11. doi: 10.1590/fst.60221
Valcarcel J., Sanz N., Vázquez J. A. (2020). Optimization of the Enzymatic Protein Hydrolysis of By-Products from Seabream (Sparus aurata) and Seabass (Dicentrarchus labrax), Chemical and Functional Characterization. Foods 9, 1–15. doi: 10.3390/foods9101503
Veiseth-Kent E., Høst V., Pedersen M. E. (2019). “Preparation of proliferated bovine primary skeletal muscle cells for bottom-up proteomics by LC-MSMS analysis,” in Myogenesis: Methods and Protocols. Ed. Rønning S. B. (Springer, New York), 255–266. doi: 10.1007/978-1-4939-8897-6_15
Whitaker R. D., Altintzoglou T., Lian K., Fernandez E. N. (2021). Marine bioactive peptides in supplements and functional foods - A commercial perspective. Curr. Pharm. Des. 27, 1353–1364. doi: 10.2174/1381612824999201105164000
Wubshet S. G., Måge I., Böcker U., Lindberg D., Knutsen S. H., Rieder A., et al. (2017). FTIR as a rapid tool for monitoring molecular weight distribution during enzymatic protein hydrolysis of food processing by-products [10.1039/C7AY00865A. Analytical Methods 9, 4247–4254. doi: 10.1039/C7AY00865A
Zaky A. A., Simal-Gandara J., Eun J. B., Shim J. H., Abd El-Aty A. M. (2021). Bioactivities, applications, safety, and health benefits of bioactive peptides from food and by-products: A review. Front. Nutr. 8. doi: 10.3389/fnut.2021.815640
Zamora-Sillero J., Gharsallaoui A., Prentice C. (2018). Peptides from fish by-product protein hydrolysates and its functional properties: an overview. Marine Biotechnol. 20, 118–130. doi: 10.1007/s10126-018-9799-3
Keywords: protein hydrolysates, enzymatic hydrolysis, processing, aquaculture, side stream utilization, sea bream, sea bass
Citation: Jenssen M, Matic J, Sone I, Solberg NT, Wubshet S and Lian K (2025) Protein hydrolysates from Italian sea bream and sea bass aquaculture side streams – chemical, biological, and techno-functional characterization. Front. Mar. Sci. 12:1572015. doi: 10.3389/fmars.2025.1572015
Received: 06 February 2025; Accepted: 14 April 2025;
Published: 06 May 2025.
Edited by:
Lei Du, East China University of Science and Technology, ChinaReviewed by:
Miroslava Rossenova Atanassova, Møreforsking AS, NorwayLee Sin Chang, USCI UNIVERSITY, Malaysia
Copyright © 2025 Jenssen, Matic, Sone, Solberg, Wubshet and Lian. This is an open-access article distributed under the terms of the Creative Commons Attribution License (CC BY). The use, distribution or reproduction in other forums is permitted, provided the original author(s) and the copyright owner(s) are credited and that the original publication in this journal is cited, in accordance with accepted academic practice. No use, distribution or reproduction is permitted which does not comply with these terms.
*Correspondence: Marte Jenssen, bWFydGUuamVuc3NlbkBub2ZpbWEubm8=