 Yuzhou Huang1,2*†
 Shuo Yu1,2†
 Zhenming Zheng1,2
 Xi Xiao3
 Zuhao Zhu1,2Liangchao Deng1,2
 Huihua Wei1,2Jiani Liang4Shuilan Chen4Marianne Holmer5
- 1Key Laboratory of Tropical Marine Ecosystem and Bioresource, Fourth Institute of Oceanography, Ministry of Natural Resources, Beihai, China
- 2Guangxi Key Laboratory of Beibu Gulf Marine Resources, Environment and Sustainable Development, Fourth Institute of Oceanography, Ministry of Natural Resources, Beihai, China
- 3Ocean College, Zhejiang University, Zhoushan, Zhejiang, China
- 4College of Marine Science, Beibu Gulf University, Qinzhou, China
- 5Department of Biology, University of Southern Denmark, Odense, Denmark
Seagrass beds are significant sinks for microplastics. However, the degradation of seagrass beds poses significant challenges, and evidence regarding its impacts on microplastic sinks remains scarce. In this study, sediment cores were collected to investigate microplastic stock and composition, microplastic carbon, and organic carbon stock in Zostera japonica seagrass bed and adjacent degraded area in a lagoon Swan Lake, China. The microplastic stock in seagrass bed (84.5 ± 18.5 million particles ha-1) was found significantly higher than degraded area (51.8 ± 0.6 million particles ha-1), resulting in release of 38.7% of buried microplastics reactivated in water column. Similarly, 30.0% of the microplastic carbon stock and 66.1% of the total organic carbon stock were eroded due to seagrass degradation. The carbon stocks derived from microplastics were estimated at 0.19 ± 0.10 kg C ha-1 in the seagrass bed and 0.13 ± 0.11 kg C ha-1 in the degraded area, contributing minimally to the total organic carbon stock (0.0023% and 0.0026%, respectively). Notably, seagrass degradation within a single year may trigger rapid erosion of organic carbon and microplastics buried for over 20 years in Swan Lake. A linear relationship was observed between sediment microplastic carbon and total organic carbon contents (Organic carbon = 1990 + 35100 × Microplastic carbon, R² = 0.26, p < 0.001). Microplastics in the sediments were predominantly fiber (48.1%), black (40.7%), 250–500 µm (47.0%) microplastics in degraded area, while plate (26.7%), blue and transparent, each contributing 26.7% and 125–250 µm (38.2%) in seagrass bed. Seagrass bed degradation may not only reduce the stock of microplastics in the sediments but also alter their composition. This study initially quantified the contribution of microplastics to organic carbon stocks in seagrass bed sediments and underscored the urgent need for seagrass conservation to mitigate climate change and prevent the remobilization of historically buried microplastics.
1 Introduction
The issue of plastic pollution has become a global crisis, with mass production reaching 414 million tons in 2023 alone (Plastics Europe, 2024). Globally, the annual flux of unmanaged plastic waste from land to marine environments has been estimated at 0.1–3.8 million tons (Zhang et al., 2023). Even more concerning, plastics in the environment undergo fragmentation due to solar radiation, biological processes, and physical forces, breaking down into smaller particles known as microplastics (diameter < 5 mm) (Thompson et al., 2004; GESAMP, 2015). Microplastics may pose substantial risks to marine life, including physical harm and introducing chemical toxicity through added substances such as plasticizers, flame retardants, and stabilizers (Hermabessiere et al., 2017; Amelia et al., 2021). Microplastics are ubiquitous, widely documented in lakes, rivers and coastal zones (Bao et al., 2024), even reaching the most remote and pristine locations, such as the Mariana Trench and polar region (Mishra et al., 2021; Peng et al., 2018).
Seagrass beds are critical blue carbon ecosystems in coastal zones, playing a vital role in carbon sequestration (Duarte et al., 2013). Recent studies also highlighted their importance as significant sinks for microplastics. In the Mediterranean Sea, microplastics ranging from 68 to 3,819 particles kg-1 were detected in the surface sediment layers of seagrass beds (Dahl et al., 2021a). Microplastic abundance was detected at 142 ± 140 particles kg-1 in the tropical estuarine small-bodied seagrass beds in Brazil (Souza et al., 2024). Along the southeast coast of India, higher abundance of microplastics were observed in the sediments of submerged seagrass beds (14–45 particles kg-1) compared to unvegetated areas (4–9 particles kg-1) (Esmeralda and Patterson, 2025). Similarly, microplastics were found to accumulate 1.3–2.9 times more in seagrass beds than bare flat in the South China Sea (Huang et al., 2020, 2021). In northern China, microplastic abundance in the sediments of seagrass beds ranged from 159 to 440 particles kg-1 across Changdao island, Shuangdao bay, Sanggou bay and Huiquan bay (Zhao et al., 2022). Seagrass beds can capture organic matter and microplastics in sediments by increasing seabed friction, attenuating waves, and reducing the momentum of suspended particles (Huang et al., 2020; Risandi et al., 2023). Microplastics were also found tangling with natural lignocellulosic fibers with up to 1470 plastic particles kg-1 of plant material in seagrass beds (Sanchez-Vidal et al., 2021).
However, seagrass beds are facing severe degradation with 7% yr-1 globally due to factors such as fishing activities, eutrophication, and coastal development (Waycott et al., 2009; Dahl et al., 2022; Xiao et al., 2020). With seagrass declining, their capacity to sequester and store organic carbon weakens by reducing input of autogenous and exogenous organic matters, lower stability of carbon storage and direct erosion (Dahl et al., 2021b; Ren et al., 2024). The global seagrass loss may induce 63–297 Tg C yr-1 emission of carbon assuming the released carbon was oxidized (Fourqurean et al., 2012). Microplastics are exogenous particles that closely resemble organic matter (Huang et al., 2021), but the impact of seagrass decline on microplastic accumulation remains unknown. Microplastics may be released from sediments during seagrass degradation, and be reactivated in the environment and posing further ecological risks.
The role of microplastics in the Earth’s carbon biogeochemical cycles has drawn attention in recent years, as the primary constituent of microplastics is carbon (Huang and Xia, 2024). Microplastics were estimated to account for 0.1–5% of total particulate organic carbon in the oceanic water column between depths of 30 m and 2000 m (Zhao et al., 2025). By 2035, 14 PG carbon embedded in accumulated plastics in the Earth could rival the amount of global blue carbon stocks (Stubbins et al., 2021). Microplastics due to their small size may erroneously be accounted for part of the organic carbon pool. Microplastic carbon was estimated to contribute 0.001 – 1.197% of sediment organic carbon stocks in the mangrove of Hong Kong, China (Chen and Lee, 2021). However, the contribution of microplastic accumulation in organic carbon stocks in degraded and healthy seagrass beds has yet to be explored.
Swan Lake is a hot spot for temperate seagrass research in the northern China, which is a shallow semi-enclosed lagoon with 0–2 m water depth. This lagoon occupied 212.4 ha seagrass beds in 2022, dominating by Zostera marina and Z. japonica. Z. japonica mainly inhabits in the intertidal zone, while Z. marina is distributed in the subtidal area (Liang et al., 2023). However, degradation of Z. japonica seagrass beds in the east of Swan Lake was observed in 2023 through field surveys and satellite imagery. Therefore, seagrass bed degradation in the lagoon of Swan Lake, China, may induce the joint remobilization of historically buried microplastics and organic carbon. The specific hypotheses proposed are 1) seagrass bed degradation may reduce the storage of microplastics and organic carbon, leading to release of these particles back into the environment; 2) microplastic loss may contribute only minimally to total organic carbon stocks; and 3) degradation of seagrass beds may significantly alter the distribution of microplastic morphologies in sediments.
2 Materials and methods
2.1 Field work
Seagrass sites (122.580578° E, 37.351943° N) and adjacent degraded sites (122.580104° E, 37.352133° N) were set up in the east of Swan Lake. During fieldwork, the healthy seagrass sites were covered by dense Z. japonica, whereas the degraded area had an extremely sparse distribution of seagrass (Figure 1). According to satellite images, the degraded area was covered by seagrass from 2016 to 2022 but had largely vanished by 2023 (Figure 2). The distance between two sampling sites is ~ 40 m and degraded sites are ~ 20 m from the edge of the seagrass beds. On September 26, 2023, a 25 cm × 25 cm quadrat was randomly placed to collect the seagrass aboveground biomass and measure the shoot density and height. Sediment core to a depth of 14 cm were collected within the quadrat using a stainless-steel corer (length: 80 cm and diameter: 5.9 cm) and a piston. Sediment cores were sectioned at 2 cm intervals in the field. Sediment cores were collected in three replicates at each site, with distance ~ 5 m among replicates.
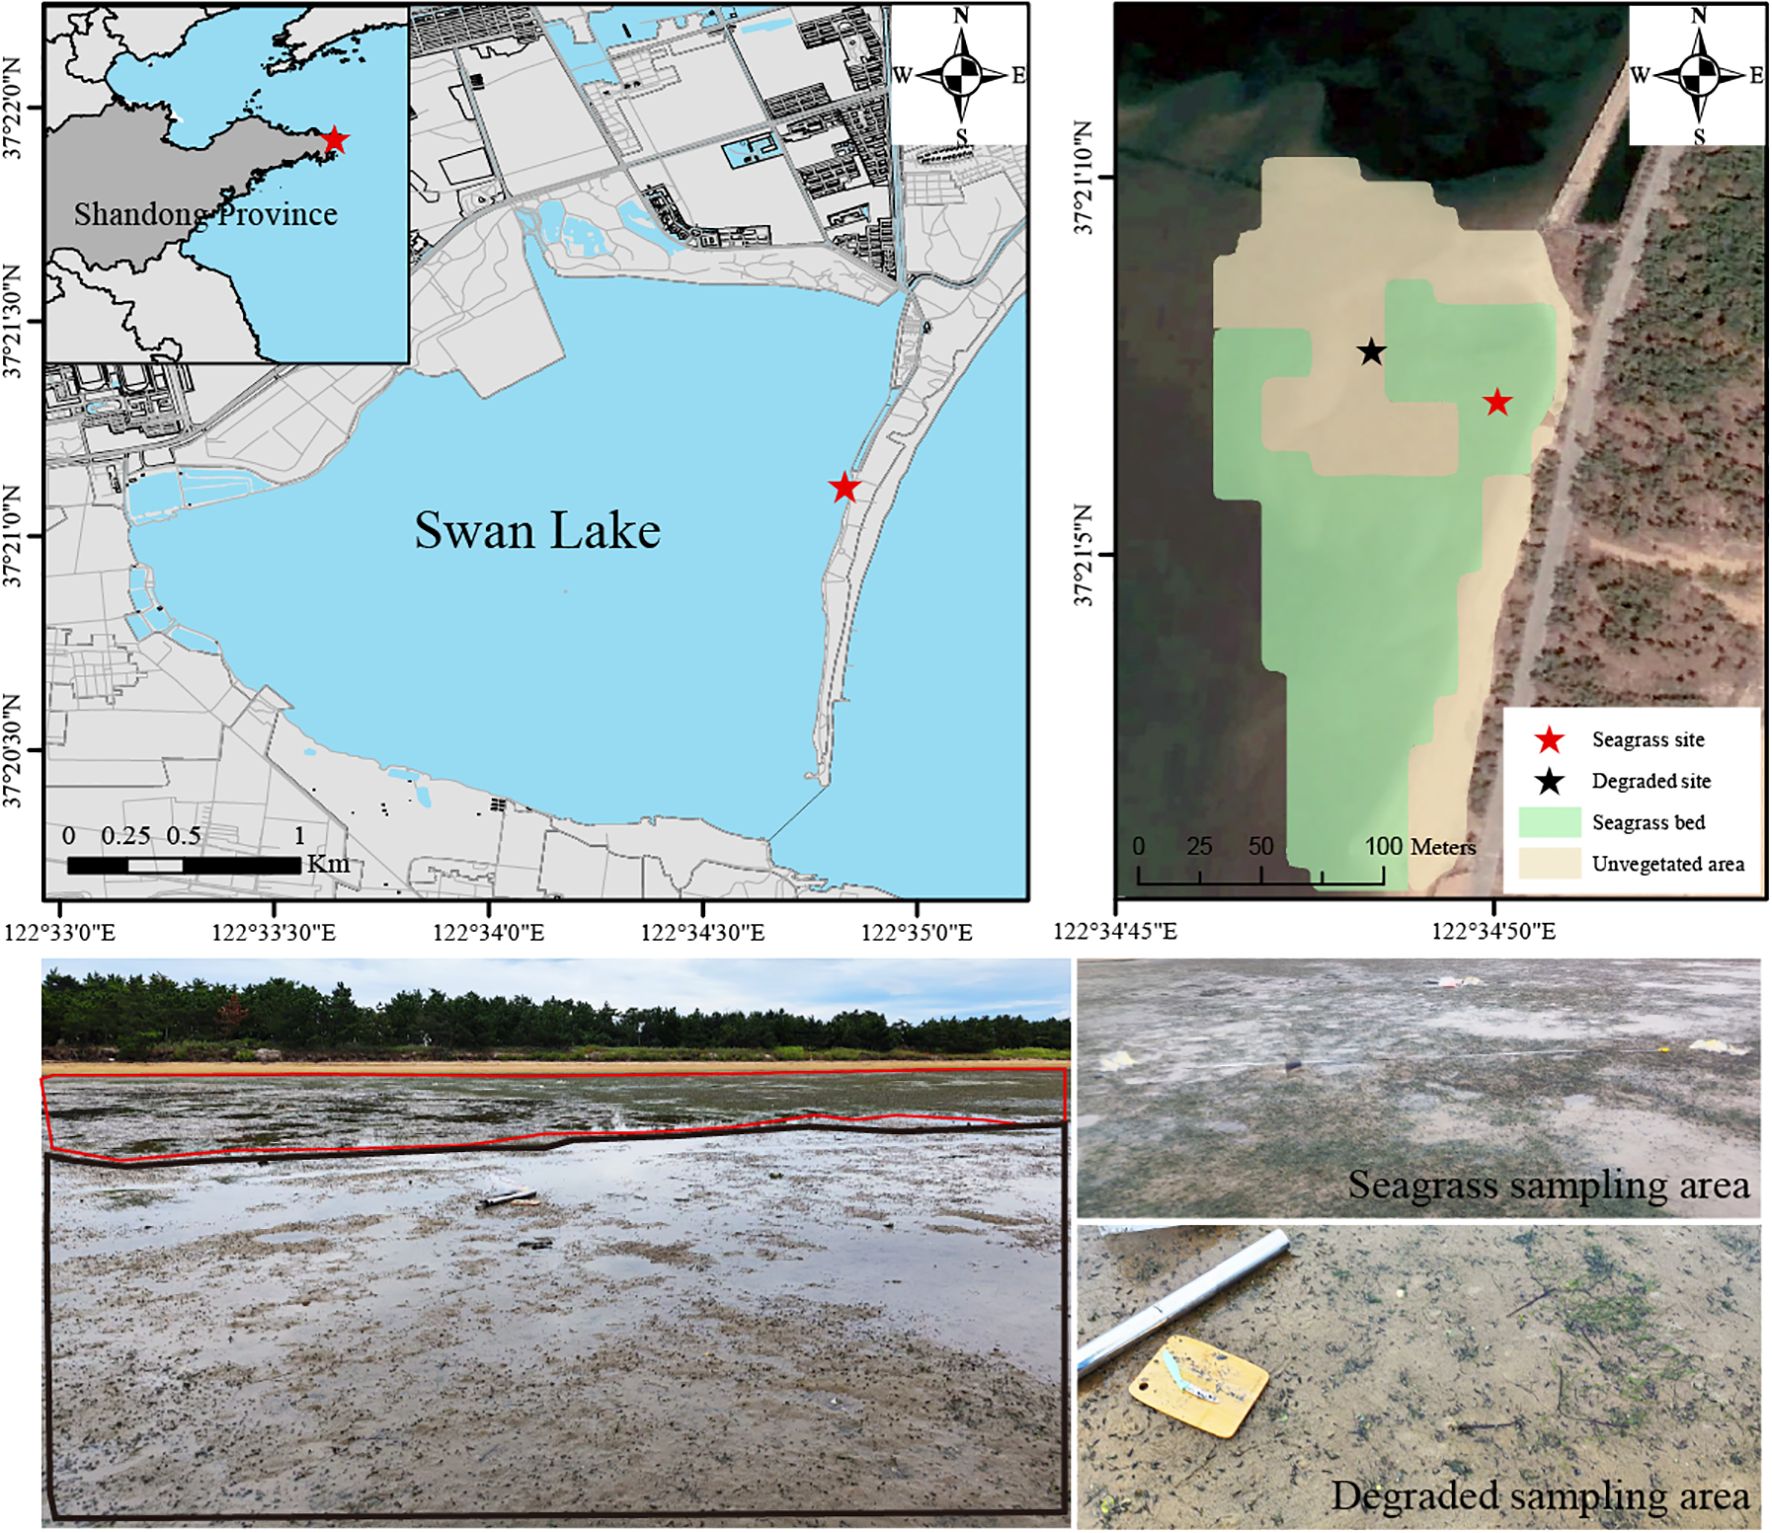
Figure 1. Map of sampling sites in the Zostera japonica seagrass bed and degraded area in Swan Lake, Shandong Province, China.
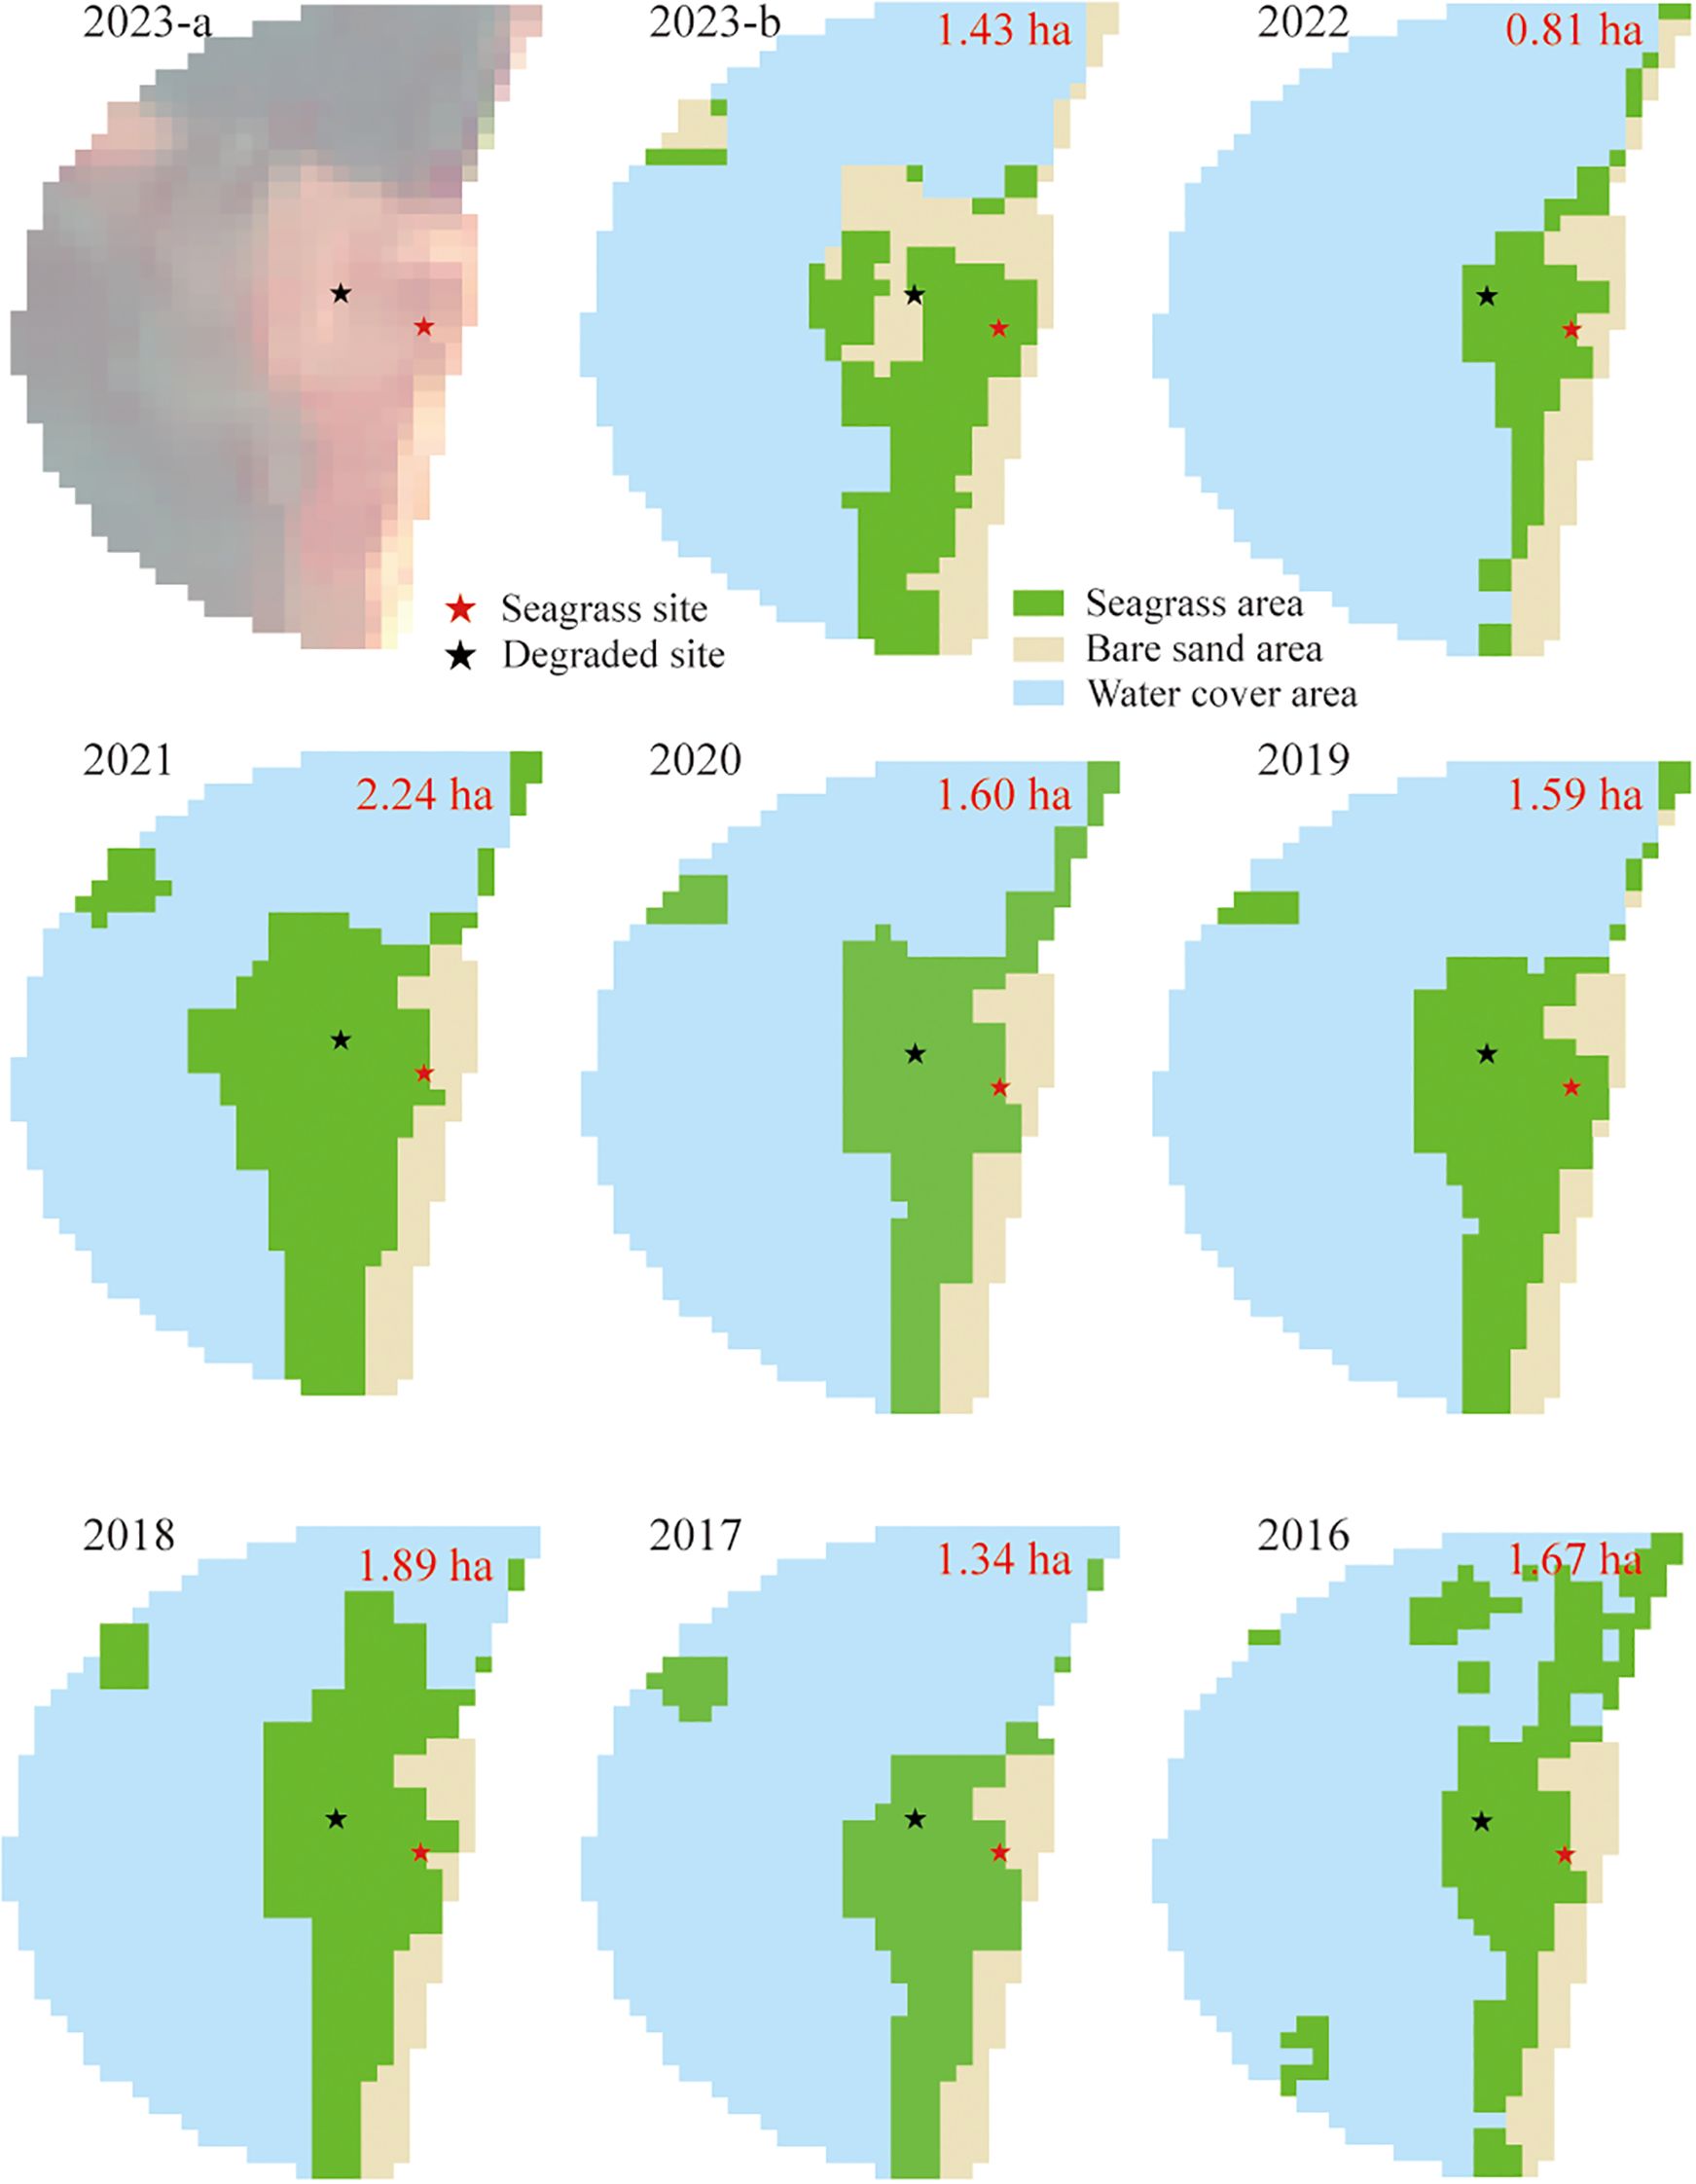
Figure 2. Satellite image of studied seagrass beds in false color (near infrared, red and green bands) in 2023 (2023-a) and dynamic change of seagrass bed distribution from 2016 to 2023. The green and yellow colors represent the extent of seagrass beds and bare flats, respectively. The red numbers indicate the annual area of seagrass beds.
2.2 Extraction and identification of microplastics
The procedure for microplastic extraction was modified from the method described by Coppock et al (Coppock et al., 2017), using sediment microplastic isolation (SMI) units (Figure 3). Approximately 50 g of dried sediment sample from each core slice was placed in a beaker with a ZnCl2 solution (1.69 g cm-3) and stirred with a glass rod to thoroughly disperse the sediment. The ball valve of SMI unit was opened to prefill it with ZnCl2 solution. The sediment mixture was then gently added into the long tube of SMI, allowing lighter microplastic to separate from sand. The SMI was fully rotated for one minute and allowed to settle at least 3 hours until clear. The supernatant was then carefully transferred into a clean beaker. This process was repeated by refilling the SMI unit with fresh ZnCl2 solution to ensure comprehensive extraction and transfer into the same beaker. To remove floating organic materials, 20 ml of 30% H2O2 was added to the beaker and allowed to react in 60°C oven for 12 hours. Afterward, the supernatant was filtered using a nylon membrane (pore size: 10 µm, Delvstlab Co., Ltd., Haining, China), which was subsequently stored in a filter preservation box.
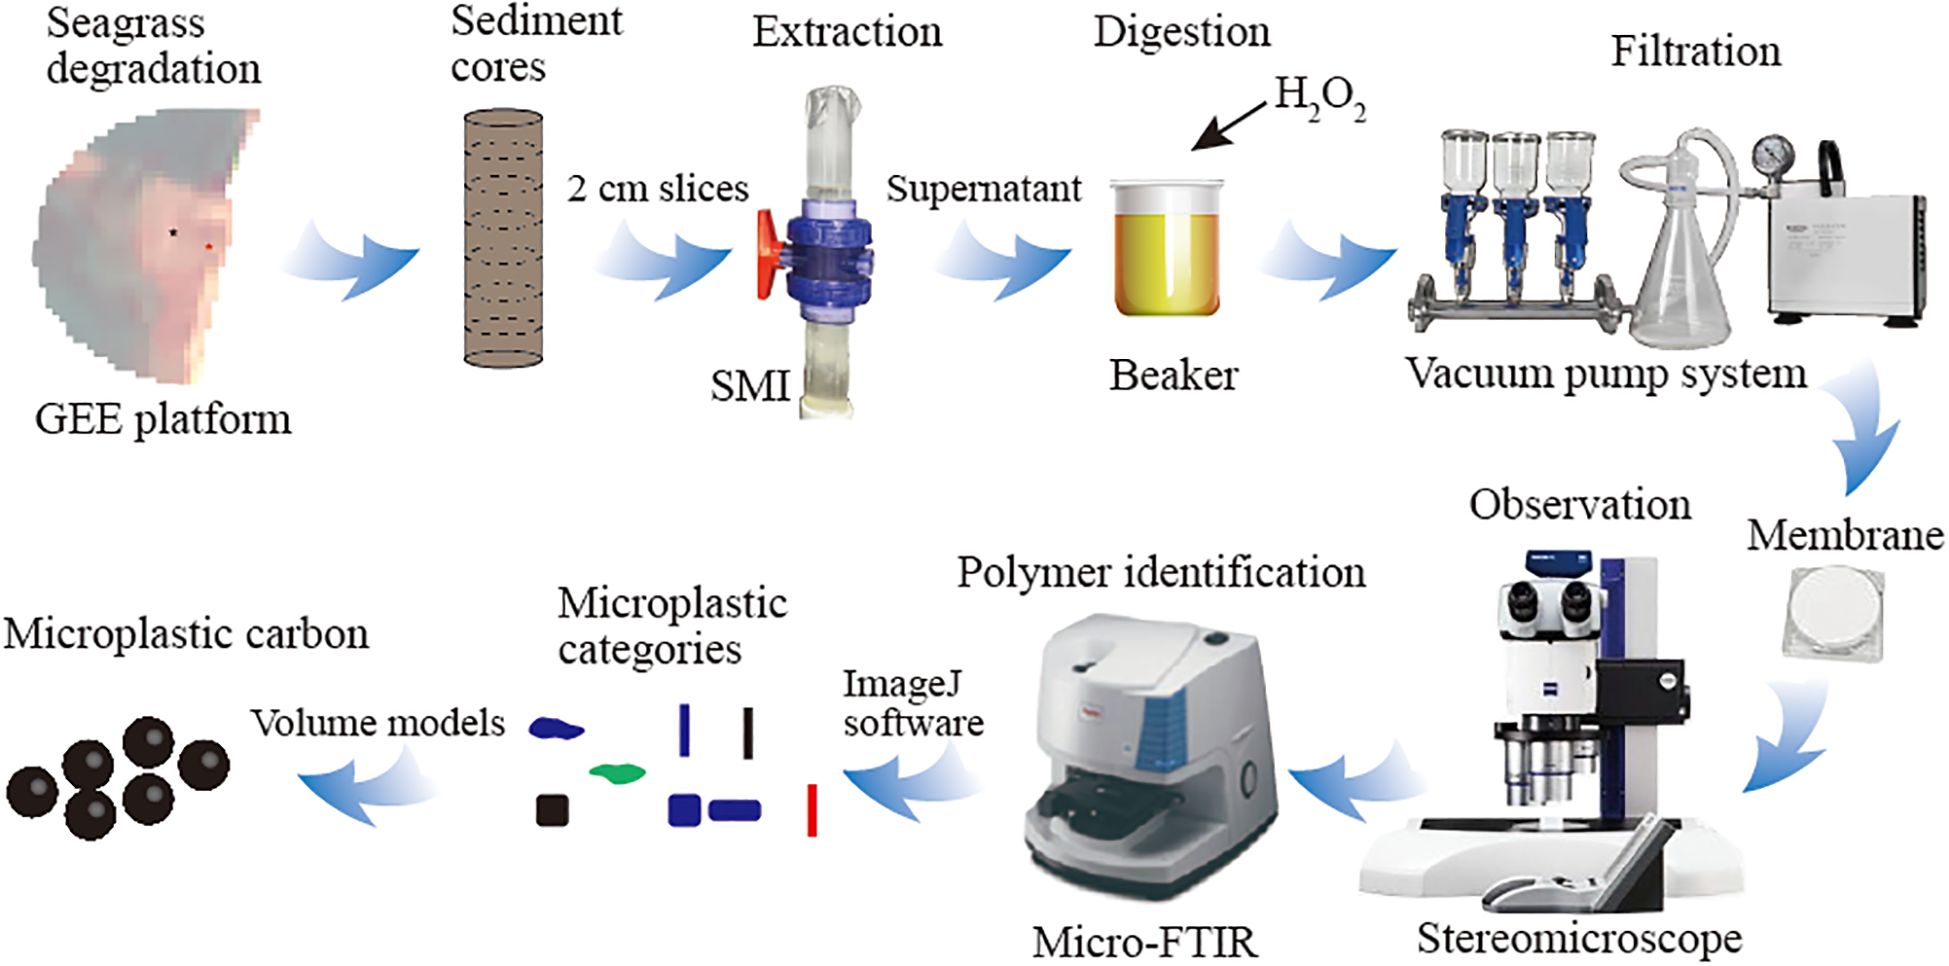
Figure 3. Schematic overview of microplastic analysis and methodological workflow.
Stereomicroscope (ZEISS SteREO Discovery V20, Carl Zeiss, Germany) was used to examine particles on the membranes and all the particles were record by pictures. micro-Fourier Transform Infrared Spectrometer (Micro-FTIR, Shimadzu, IRTracer 100 and AIM 9000, Japan) was employed to determine the polymer composition of representative microplastics from natural particles. A total of 43 particles across all sampling sites underwent Micro-FTIR analysis. The pictures of confirmed microplastics were applied in ImageJ software (http://imagej.nih.gov) to measure: area, fit ellipse (major and minor axis), fiber and thread length, fiber and thread diameter, max and min Feret diameter, thickness (only soft film and rigid flat shapes available).
Microplastics were classified into six shape categories: thread, fiber, fragment, film, flat and pellet. Colors were grouped into black, white, blue, red, transparent, tan, green, and purple. The size of microplastics was categorized into six classes based on their length or maximum Feret diameter: 125–250 µm, 250–500 µm, 500–1000 µm, 1,000–2,000 µm and 1,000–5,000 µm. The abundance of microplastics in each size class were normalized by the width of the respective size class (Cozar et al., 2014).
Both negative and positive controls were applied during microplastic extraction and identification. Negative controls were conducting the microplastic extraction and identification procedures without adding sediment samples for three times. Only one natural blue fiber made from cotton (identified by Micro-FTIR) was found. For positive controls, clean sand samples were spiked with known microplastics and processed using the same extraction protocol described above. The recovery efficiency was 90.9 ± 2.8%. Throughout the analysis, Milli-Q water was used for cleaning all equipment. Additionally, aluminum foil was used to cover containers and samples to minimize the risk of microplastic contamination.
2.3 Sediment characteristics
Wet sediments samples were weighed before drying in the oven at 65°C for 48 hours to constant weight. The dried sediments were reweighed to calculate water content and dry bulk density according to sample volume. Dried sediments were finely ground and subjected to oxidation using potassium dichromate, followed by measurement with a spectrophotometer (585 nm). The standard curve used for quantification are provided in the Supplementary File (Supplementary Figure S1). Grain size distribution of ungrounded sediments of two cores from seagrass and degraded sites was measured using a laser particle size analyzer (Sync Microtrac MRB, USA), which included percentile of D10, D25, D50, D75 and D90 particle sizes, as well as the silt content. The sorting coefficient of sediments (So) is calculated by dividing D75 by D25.
2.4 Microplastic carbon and organic carbon stocks
According to the polymer identified by Micro-FTIR, the density and carbon content of each polymer were determined and summarized (Supplementary Table S1). Thread and fiber plastic shapes are assumed to be cylinders, whereas fragment and pellet shapes are considered ellipsoids, and film and flat plastics to follow a prism shape. Different volume models were applied to calculate the microplastic volume, mass and carbon (Equations 1–3). The density (ρ) and polymer carbon content of each shape were calculated by weighted average of shape and polymer type.
Microplastic (particles ha-1), microplastic carbon (kg ha-1) and organic carbon (Mg C ha-1) stocks were calculated as Equation 4. The Hi is 2 cm interval. The is dried density of the i layer. is the abundance of microplastic (particles kg-1) or microplastic carbon (%) or organic carbon (%) in the sediments.
2.5 Remote sensing image processing
The annual change and areal extent of seagrass beds in the study region were quantified based on Sentinel-2 satellite images from August 1 to October 31 for the years 2016 to 2023. Only cloud-free images during low tide with beach exposed were selected for analysis. Buffer zones with a 200-meter radius were generated around the identified seagrass sampling locations. The landward areas were masked and removed to focus on the exposed intertidal zones. Normalized Difference Vegetation Index (NDVI) and Normalized Difference Water Index (NDWI) were calculated and added as new bands to the Sentinel-2 imagery. Feature of three classes that seagrass, bare flats and water were created based on true-color and false-color composites images. Supervised classification was performed using a Support Vector Machine (SVM) algorithm, and classification accuracy was evaluated using overall accuracy and the kappa coefficient (Supplementary Table S2).
2.6 Data and statistical analysis
Data analysis and visualization were carried out using R software package 3.5.1 (Team, 2018) and sampling maps were obtained using ArcGIS 10.5 software (ESRI, California, USA). Remote sensing images were processed in Google Earth Engine (GEE) platform. Data is presented as mean ± standard error. One and two-way ANOVA was used when approved by homogeneity and normality of variance condition (Levene test and Shapiro-Wilk test). Otherwise, non-parametric (Kruskal-Wallis for one way and Scheirer–Ray–Hare for two-way analysis) test was used for statistical analysis. The relationship between microplastic carbon and sediment organic carbon was analyzed using linear regression, where microplastic carbon outliers were removed using the boxplot method. When p < 0.05, the value was considered statistically significant and p < 0.01 indicated highly significance.
3 Results
3.1 Microplastic and organic carbon stocks between seagrass beds and degraded area
Microplastic stock within 14 cm depth in seagrass beds (84.5 ± 18.5 million particles ha-1) was found significantly higher than in degraded area (51.8 ± 0.6 million particles ha-1) (P < 0.05). Similarly, the sedimentary carbon stock within 14 cm depth in seagrass beds (9.82 ± 1.49 Mg C ha-1) was notably higher than in degraded area (3.33 ± 0.08 Mg C ha-1). For the corresponding microplastic stock in mass unit and microplastic carbon stock, there was no significant differences between seagrass beds and degraded area (p > 0.05), which was 0.27 ± 0.14 kg ha-1 and 0.19 ± 0.10 kg C ha-1 in seagrass beds and 0.18 ± 0.14 kg ha-1 and 0.13 ± 0.11 kg C ha-1 in degraded area, respectively (Figure 4). The microplastic carbon stocks only account for a small fraction of organic carbon stocks with 0.0023% and 0.0026% in seagrass beds and degraded area, respectively.
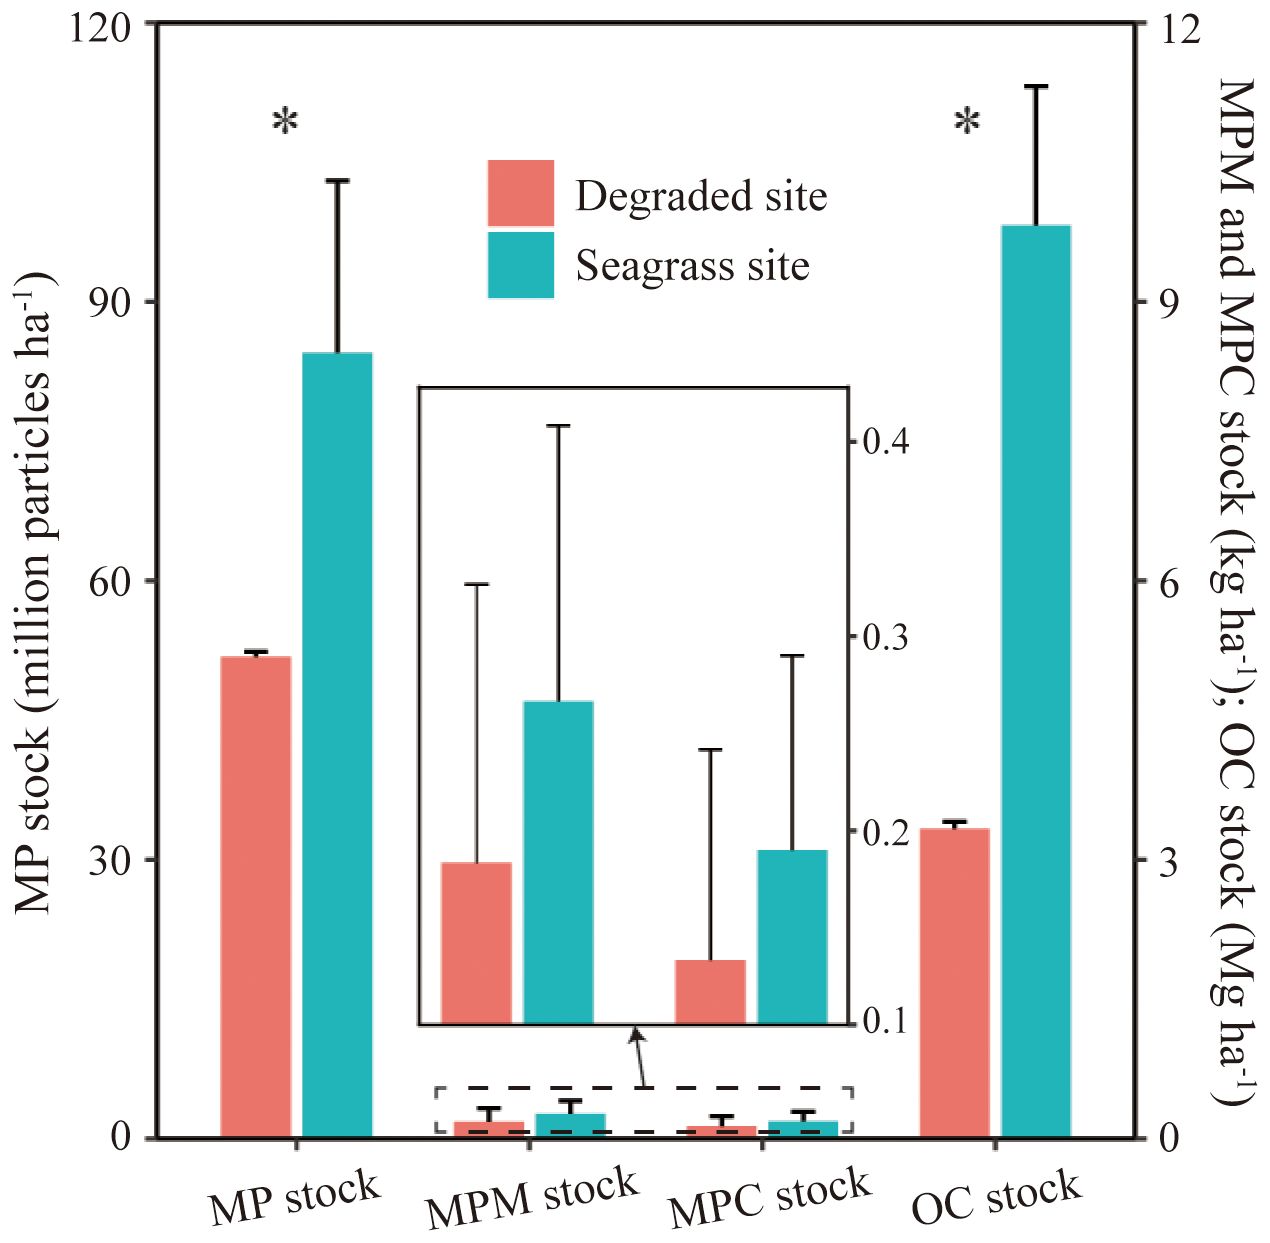
Figure 4. Stocks of microplastics (MP), microplastics in mass unit (MPM), microplastic carbon (MPC) and organic carbon (OC) in the sediments to 14 cm. *indicate statistic significance between seagrass and degraded sites (Kruskal-Wallis test p < 0.05). Data shows mean ± SE (n=3).
In September 2023, the density of the Z. japonica seagrass bed was 2624.0 ± 184.5 shoots m-², with an average height of 13.7 ± 1.3 cm and an aboveground biomass of 34.4 ± 3.8 g DW m-². From 2016 to 2023, the classification of remote sensing imagery revealed highly fluctuations in seagrass beds (Figure 2). The area increased between 2016 and 2018, followed by a decline, then peaked at 2.24 hectares in 2021 before decreasing again. Notably, the degraded sites retained seagrass presence over the past seven years but almost disappeared entirely by 2023. The disappearance of seagrass in degraded area resulted in a 32.7 million particles ha-1 (38.7%) reduction in microplastic stock compared to vegetated areas (Figure 4). The mass of microplastic stocks in seagrass bed was 0.84 kg ha-1 higher than degraded area. Additionally, organic carbon stock decreased by 6.49 Mg C ha-1 (66.1%), while microplastic carbon only decreased by 0.06 kg C ha-1 (30.0%).
3.2 Vertical change of microplastics in related with organic carbon content
The vertical distribution of microplastics varied greatly. The average microplastic abundance at seagrass sites was higher than that at degraded sites, except at 6–8 cm slice. From 6 cm downward, microplastic abundance in degraded sites was closer to seagrass sites compared to 2–6 cm (Figure 5). Notably, no microplastics were detected in the top 6 cm of sediment at one of the cores (D3) from the degraded sites (Figure 5). Microplastic abundance at seagrass sites ranged from 17.0 to 50.1 particles kg-1, while at degraded sites, it varied between 10.6 and 33.1 particles kg-1. Similarly, microplastic carbon content was consistently higher at seagrass sites compared to degraded sites, except at 6–8 cm slice. Microplastic carbon ranged between 0.003 and 0.134 µg g-1 at seagrass sites, and from 0.001 to 0.324 µg g-1 at degraded sites. For organic carbon content, seagrass sites consistently displayed higher values (0.31–0.49%) compared to degraded sites (0.09–0.24%). However, starting at 6 cm depth, organic carbon content in degraded sites showed an increasing trend, approaching that of seagrass sites.
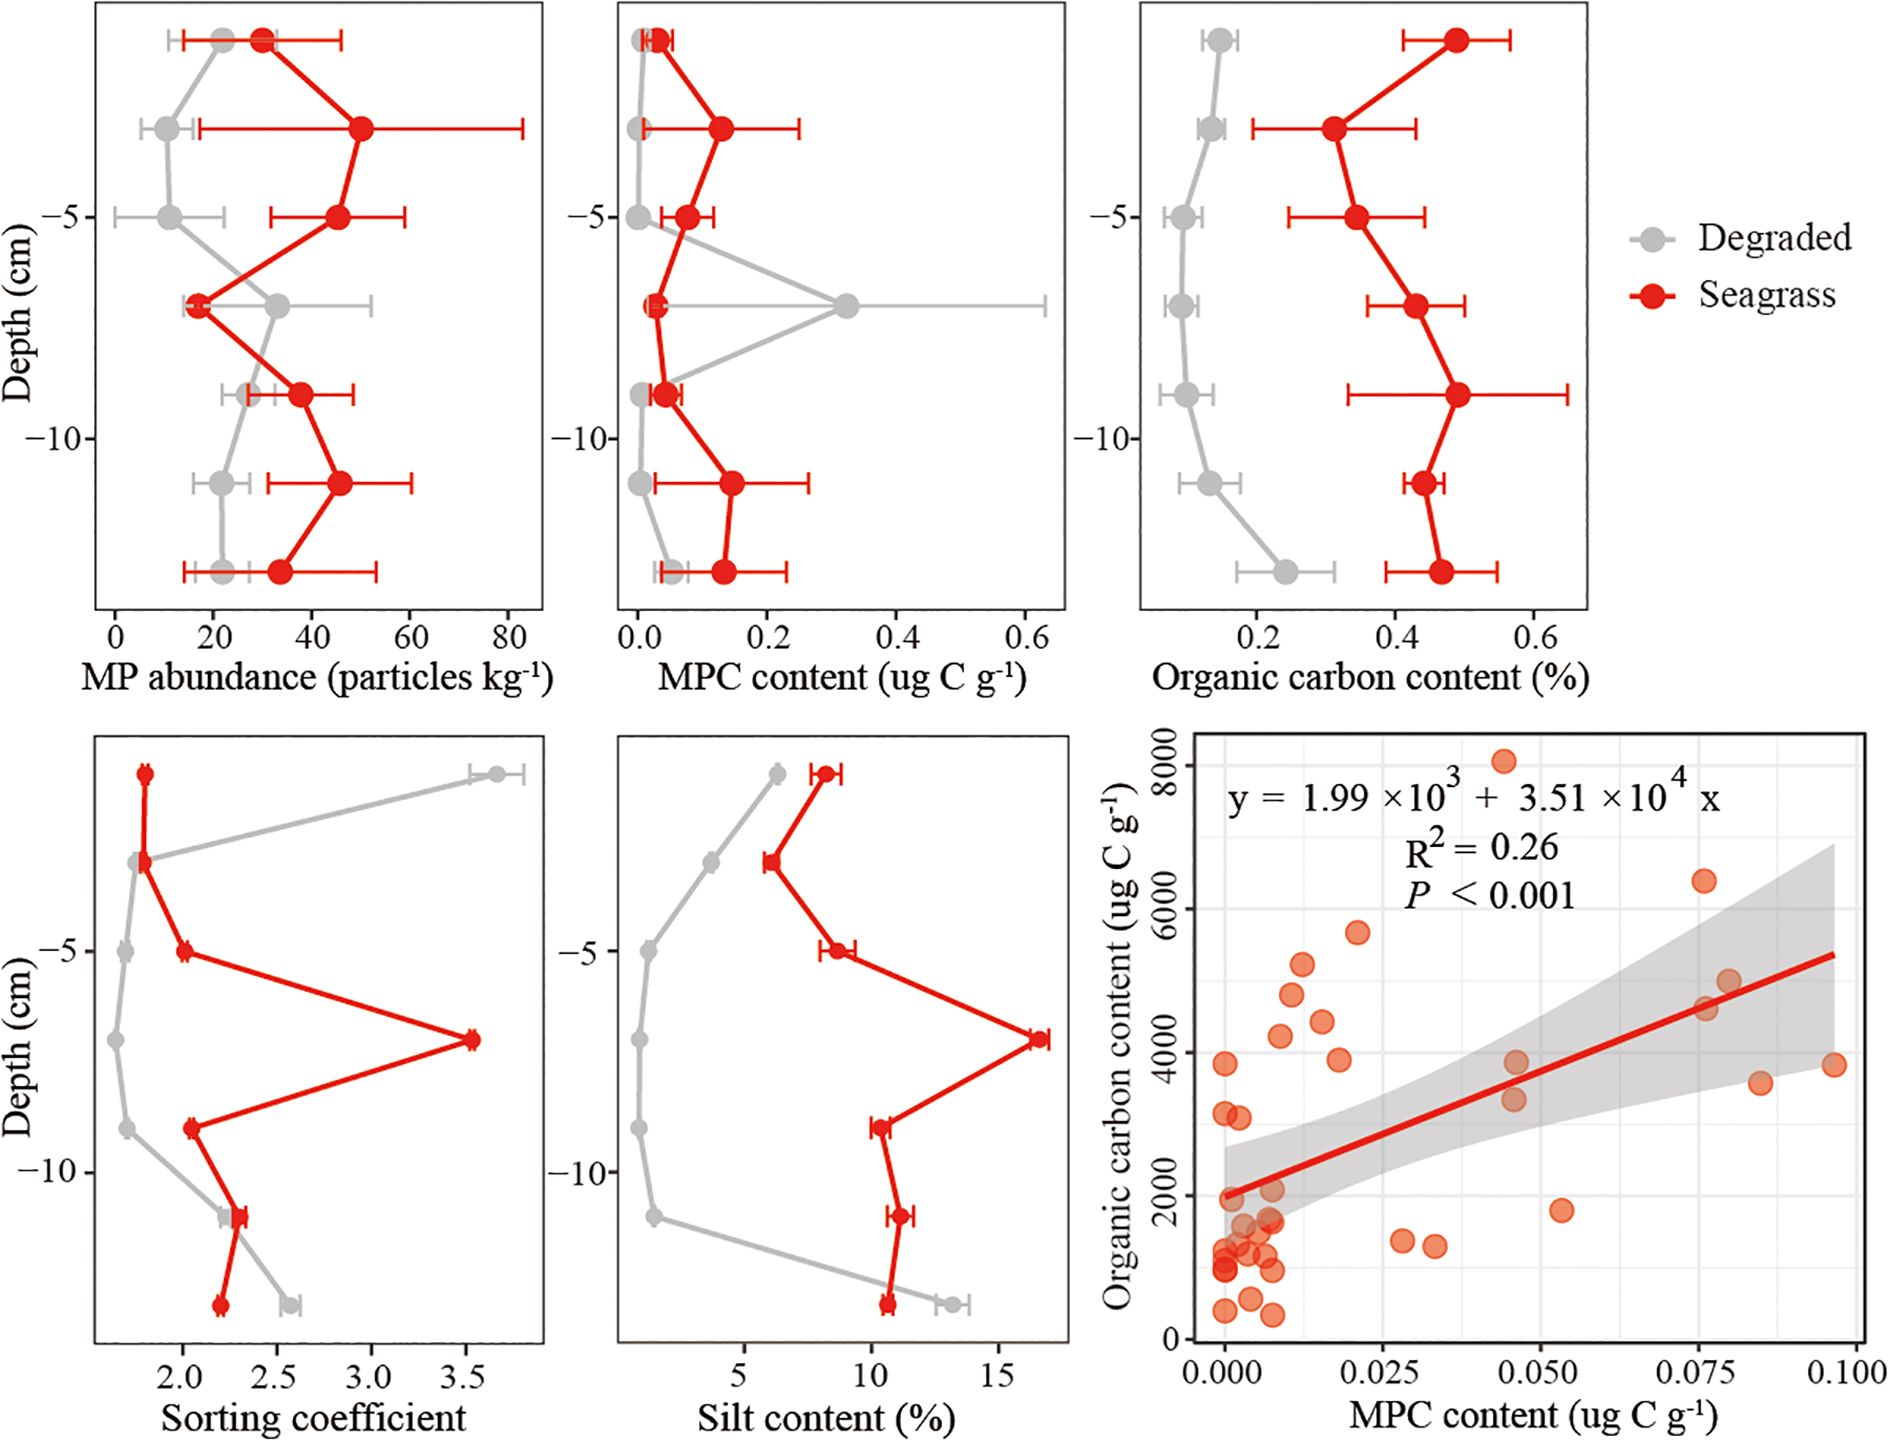
Figure 5. Vertical change of microplastic (MP) abundance, microplastic carbon (MPC) content, organic carbon content, sorting coefficient and silt content along the cores in seagrass and degraded sites (mean ± SE). Linear regression between organic carbon and microplastic carbon content at all sites (y = 1.99 × 10³ + 3.51 × 10⁴ x, R2 = 0.26, p < 0.001).
Dry bulk density at seagrass sites was slightly lower than that at degraded sites, with values ranging from 1.58 to 1.70 g cm-3 in seagrass sites and 1.61 to 1.94 cm-3 in degraded sites (Table 1). In contrast, the value of silt content between the seagrass and degraded sites were similar in the upper 0–4 cm, and separated in the middle and mixing after 10 cm. The vertical trends of sorting coefficient were similar with silt content. A significant positive correlation was observed between microplastic carbon and sediment organic carbon, with a linear regression relationship (Organic carbon = 1990 + 35100× Microplastic carbon, R2 = 0.26, p < 0.001) (Figure 5).
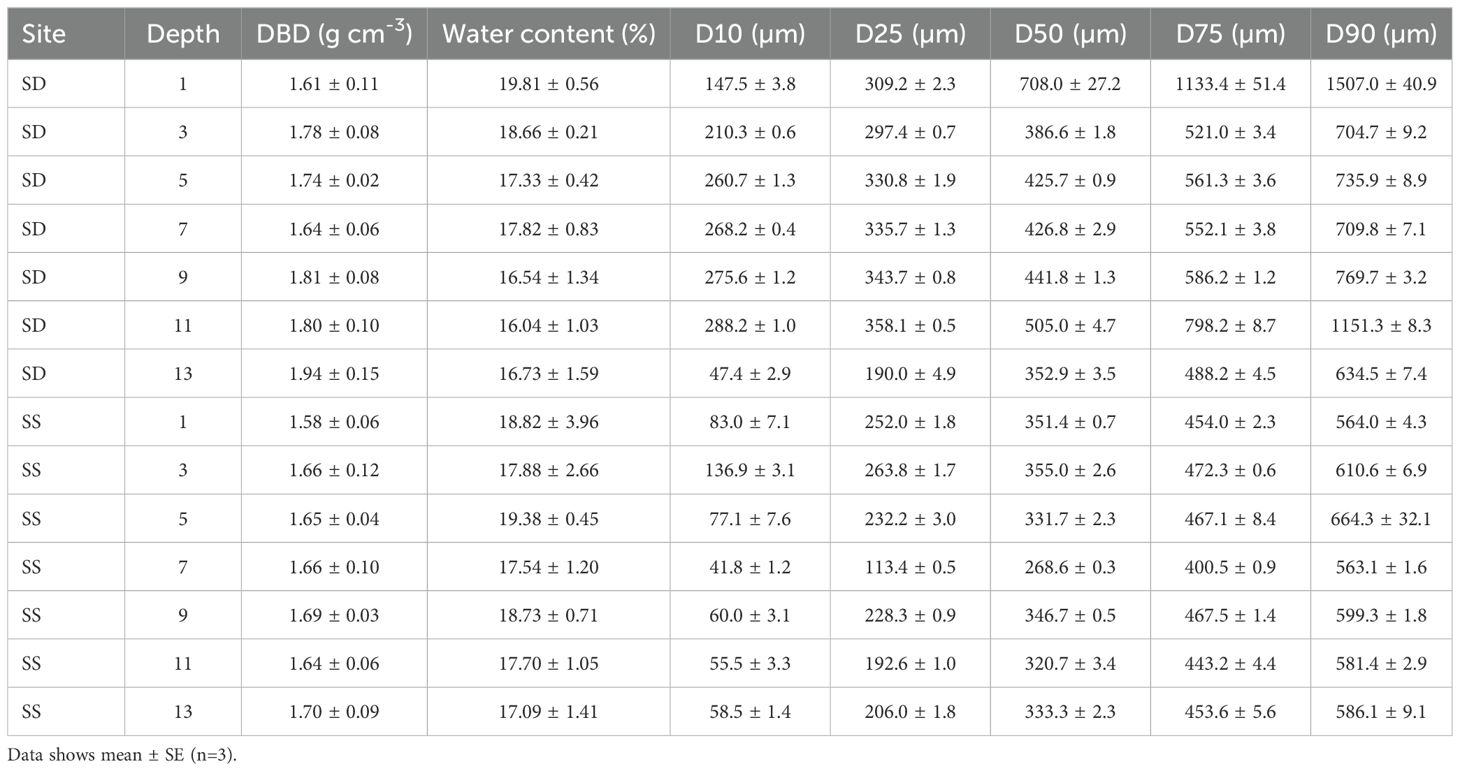
Table 1. Characteristics of each sediment layer in seagrass (SS) and degraded (SD) sites in Swan Lake including dry bulk density (DBD), water content, particle size corresponding to the cumulative frequency of 10% (D10), 25% (D25), 50% (D50), 75% (D75) and 90% (D90).
3.3 Characteristics of microplastics and sediments
In this study, nine types of microplastic polymers were identified, with polypropylene (PP) being the dominant type, accounting for 44%. Polyester and polyvinyl alcohol (PVA) each comprised 12%, while polyethylene (PE) and polyvinyl chloride (PVC) accounted for 8%, respectively. The percentage of shape, color and size of microplastics between seagrass and degraded sites were not statistically significant (p > 0.05). In terms of microplastic shape, it varied significantly (p < 0.01) among 6 different shape types. Seagrass sites were dominated by rigid plate microparticles (26.7%), followed by thread (24.4%), fiber (22.2%), and fragment (17.8%) shapes (Figure 6). Pellet shaped microplastics were only found at seagrass sites. In contrast, degraded sites were dominated by fiber (48.1%), followed by plate (25.9%) and fragment (14.8%). Regarding color, it varied significantly (p < 0.01) among 8 different color types. Microplastics at seagrass sites were primarily blue and transparent, each contributing 26.7%, followed by black (20.0%). At degraded sites, black was predominant (40.7%), followed by blue (25.9%), transparent (11.1%), and green (11.1%) microplastics (Figure 6). For particle size, it varied significantly (p < 0.01) among 5 different size classes. Microplastics at seagrass sites were concentrated in the 125–250 µm range (38.2%), followed closely by the 250–500 µm range (30.6%). In contrast, microplastics at degraded sites were primarily in the 250–500 µm range (47.0%), followed by the 125–250 µm range (31.3%) (Figure 6).
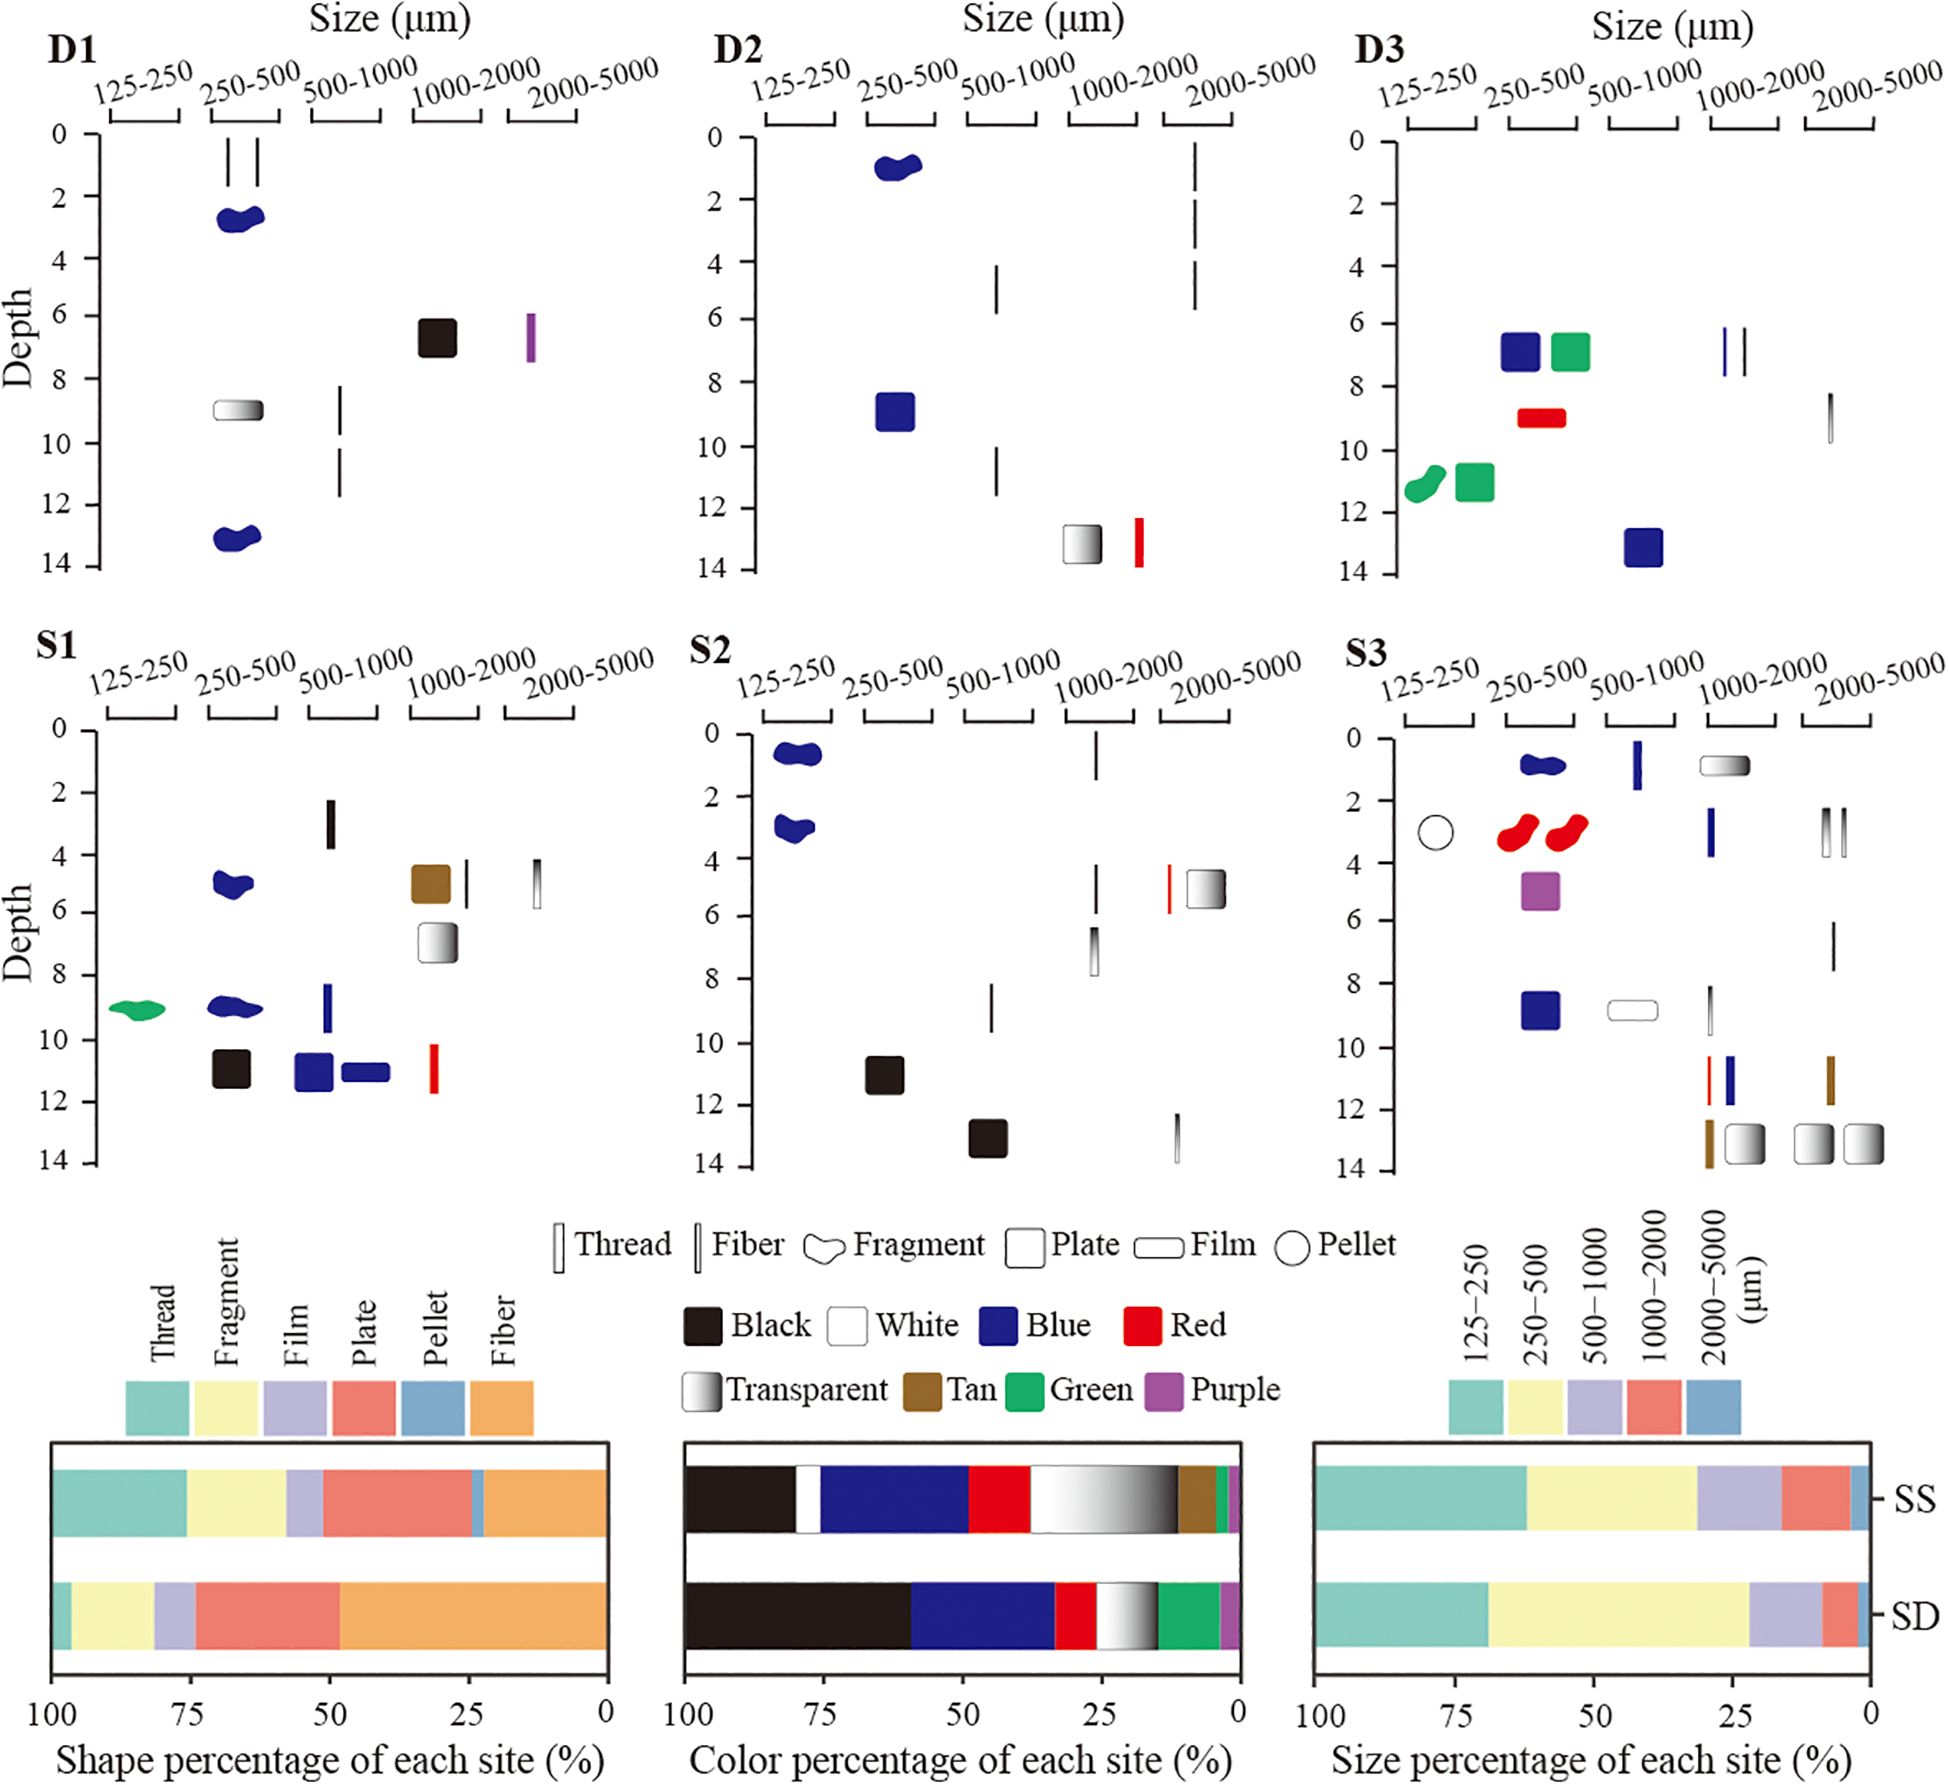
Figure 6. Microplastic morphology in cores from degraded (D1–D3) and seagrass sites (S1–S3) (upper and middle panels). Shape, color, and size percentages of microplastics in seagrass (SS) and degraded (SD) sites in Swan Lake (lower panel).
4 Discussion
4.1 Impact of seagrass degradation on microplastic and carbon stocks
Our study showed that seagrass bed buried higher microplastic stocks (84.5 ± 18.5 million particles ha-1) within the top 14 cm of sediments than degraded area (51.8 ± 0.6 million particles ha-1), resulting in a 38.7% loss of microplastic stocks. Continued seagrass loss without restoration may lead to the formation of complete unvegetated bare flats, further intensifying the release of microplastics from sediments. Evidences showed that 30–310% higher microplastics were buried in the sediments of seagrass beds compared to bare flats along the coast of South China Sea, China (Huang et al., 2020, 2021). Similarly, seagrass beds along the coast of Shandong Province exhibited 30–102% higher microplastic abundance compared to bare flats (Zhao et al., 2022). Seagrass beds along the southeast coast of India retained up to 600% more microplastics than adjacent unvegetated areas, highlighting their strong particle-trapping capacity (Esmeralda and Patterson, 2025). However, only 2.9% higher microplastics was found in small-bodied seagrass beds in western Australia (Wright et al., 2023), which was also influenced by lower seagrass canopy structures and density (Wright et al., 2023; Cozzolino et al., 2020).
Similarly, the loss of organic carbon was also observed, leading to a carbon stock reduction of 6.49 Mg C ha-1 (66.1%) within the top 14 cm of sediments. Disturbances of seagrass beds were also reported that result in carbon stock losses ranging from 2.2 to 11.7 Mg C ha-1 in Kenya and Southeast Australia (Githaiga et al., 2019; Carnell et al., 2020), accounting for over 50% of the seagrass sediment organic carbon stock (Dahl et al., 2021b). Carbon stock with a 72% decline were reported in degraded seagrass beds and a 35% reduction persisting even after recovery in the southeastern Jervis bay, Australia (Macreadie et al., 2015). Seagrass bed degradation leads to the oxidation of buried organic matter, sediment erosion, and reduced sediment stabilization due to the absence of seagrass roots, all contributing to organic carbon loss (Dahl et al., 2021b; Yamuza-Magdaleno et al., 2024). In addition, trapping capacity of exogenous organic matters, which may account for over 60% of total carbon stocks (Röhr et al., 2016), may also be reduced due to absence of seagrass canopy (Huang et al., 2021). These processes may not only result in releasing of stored organic carbon but also allow microplastics to be resuspended in the water column.
Seagrass bed degradation also reduced microplastic carbon storage, with a decrease of 0.06 kg C ha-1. Reactive microplastics may release dissolved organic carbon into the water column, with an estimated 23,600 tons leached annually from ocean plastics globally, serving as a carbon source for microbial communities (Huang and Xia, 2024). Moreover, the escaped microplastics are more likely to undergo mineralization under solar radiation in the water column compare to dark and anoxia sediments (Kida et al., 2022; Royer et al., 2018). After a 212-day incubation, the emissions of CH4 from microplastics were estimated at 5.8 nmol g-1 d-1 in the water column under solar radiation exposure (Royer et al., 2018). However, the contribution of microplastic carbon to total sediment organic carbon remains negligible, at only 0.0023% and 0.0026% in seagrass and degraded sites, respectively. Evidences on microplastic carbon’s role in seagrass beds are particularly scarce, while similar microplastic carbon was estimated to contribute 0.0001–0.0057% of total organic carbon content in the mangrove forests of Fujian, Guangdong, Guangxi, Hainan (Yu et al., 2023) and 0.001 – 1.197% in Hong Kong, China (Chen and Lee, 2021). The contributions of microplastics found in seagrass beds and mangrove forests in China are comparable to the 0.1–0.6% reported in Swiss floodplain soils (Scheurer and Bigalke, 2018; Rillig, 2018). Although the current fraction of microplastic carbon in seagrass bed sediments is negligible, it may increase in the future due to the continued rise in plastic production (Stubbins et al., 2021). Additionally, only 10.6 to 50.1 particles kg-1 of microplastics was observed in the seagrass beds of this study, which is much lower than those found in most seagrass beds globally (Souza et al., 2024). The highest microplastic abundance in the sediments of seagrass beds up to 37,000 particles kg-1 was reported in Mare Island, Indonesia (Ramili and Umasangaji, 2022). Secondly, 17,137 particles kg-1 of microplastics was found in the seagrass beds of an atoll, Belize, Central America (Radford et al., 2024). In seagrass beds heavily polluted by microplastics, the carbon derived from microplastics may play important role in sedimentary organic carbon. While microplastic is unique pollutant disguised as natural organic matter (Rillig, 2018), high abundance of microplastics may distort total organic carbon measurement, underscoring the need for caution of carbon stock estimates in the future.
Microplastics are ubiquitous in marine environments, characterized by their small size and vivid colors, making them susceptible to ingestion by marine organisms, including seabirds, sea turtles, fish, bivalves, and even zooplankton (Wieczorek et al., 2019; Monclús et al., 2022; White et al., 2018; Lyu et al., 2024; Zhu et al., 2023). The ingestion of microplastics can lead to gastrointestinal tract injuries, immune responses, obstruction and starvation (Amelia et al., 2021). In addition, the additives in plastics, including plasticizers and flame retardants, pose significant chemical risks, which exhibit neurotoxicity, carcinogenicity, and endocrine-disrupting properties (Wang et al., 2020; Ramanayaka et al., 2024). For example, invertebrate communities colonizing seagrass leaves have been found to ingest artificial fibers dyed with industrial chemicals known to be carcinogenic to vertebrates (Remy et al., 2015). Thus, reactive microplastics may pose significant threats to marine organisms inhabiting seagrass beds in Swan Lake. Only microplastics buried in deeper sediment layer are likely to pose reduced ecological risks. However, global seagrass beds have experienced rapid degradation at a rate of 7% per year since 1990, driven by human activities, nutrient input, coastal development, and climate change (Waycott et al., 2009; Xiao et al., 2020). For instance, European seagrass beds have lost a total of 35,684 ha compared to 122,582 ha recorded in 1869 (de los Santos et al., 2019). This ongoing global degradation not only threatens the stability of historically buried blue carbon but may also lead to the release of sequestered microplastics, contributing to greenhouse gas emissions and ecotoxicological risks (Royer et al., 2018; Remy et al., 2015). These findings further highlight the urgent need to protect and restore seagrass ecosystems to mitigate climate change and prevent the remobilization of legacy microplastics.
4.2 Rapid erosion of microplastics and organic carbon due to seagrass degradation
According to the history satellite images, the seagrass degradation may have occurred in the year of 2023 (Figure 2). The seagrass bed distribution varied greatly from 2016 to 2023, particular the edge of seagrass bed. Fluctuations in seagrass distribution were also observed across the whole Swan Lake, showing an overall decreasing trend (Liang et al., 2023). The Z. japonica seagrass bed degradation in Swan Lake may be attributed to direct freshwater discharge, nutrient loading and global warming (Liang et al., 2023; Xiao et al., 2020). Along depth profile, the average abundance of microplastic and organic carbon were found to be higher in seagrass beds compared to degraded sites. And from 6 cm downward 14 cm, the trends of both microplastic and organic carbon at degraded sites were close to seagrass sites. It may suggest that water flow in this region may have strongly influenced the sediments in degraded area, but relatively less effects on healthy seagrass beds. Moreover, newly degraded seagrass may continue contribute organic carbon through debris and roots in the deeper sediments. Referring a documented sedimentation rate of 0.58 cm yr-1 in the same region (Gao and Jia, 2004), Z. japonica seagrass bed declined within single one year in 2023 may lead to erosion of organic carbon and microplastics that buried over 20 years.
Seagrass degradation may enhance local hydrodynamic forces, while seagrass beds through their root systems and canopies mitigate hydrodynamic forces and significantly reduce soil carbon loss (Salinas et al., 2020). Furthermore, the large average grain size was observed at both seagrass and degraded sites (Table 1), which suggest exposed environment in study region. Only shear velocities exceeding 0.2 m s-1, sediment erosion was triggered in seagrass degraded area (Salinas et al., 2020). Both silt content and sorting coefficient varied greatly between seagrass and degraded sites in this study (Figure 5). Larger sorting coefficient indicates higher depositional energy of the hydrodynamic regime (Kreitsberg et al., 2021). Clay and silt are particularly susceptible to suspension and transport under higher shear velocities (Salinas et al., 2020). Much higher differences of organic carbon content between seagrass and degraded sites were observed in exposed area (11.7 times) than sheltered area (3.5 times) in northwest of Sweden (Moksnes et al., 2021). However, only 2.9 and 1.6 times of organic carbon and microplastics, respectively, were observed between seagrass and degraded sites in this study. It may also indicate that the degradation in study region was not severe, which only happened within one year.
Organic carbon and microplastic carbon may be eroded simultaneously during seagrass degradation. A significant relationship was observed between microplastic carbon and total organic carbon contents (Organic carbon = 1990 + 35100 × Microplastic carbon, R2 = 0.26, p < 0.01) in this study, suggesting their potential as mutual indicators in sediments. Similarly, a strong correlation coefficient (Pearson, R = 0.86, p < 0.01) between microplastics and organic matter was reported across seagrass beds, mangrove forests and bare flats in the South China Sea (Huang et al., 2021). Due to similarity of microplastic particles and organic matters, they were found sharing similar fates during transport and deposition (Huang et al., 2020).
4.3 Morphological characteristics of microplastics following seagrass bed degradation
This study identified polypropylene (PP) as the predominant polymer type in microplastics, accounting for 44% of the total. Polypropylene was reported as the most abundant polymer type found in the sediments globally (Kannankai et al., 2022), which corresponds to its status as one of the most widely produced plastics worldwide (Geyer et al., 2017).
Significant differences were observed among different shapes (p < 0.05). At the seagrass sites, rigid plate shaped microplastics accounted for the highest proportion (26.7%), whereas fibers dominated at the degraded sites (48.1%). Fibers, characterized by their thin and elongated structure (diameter: 16.2 ± 1.3 μm, length: 1772.3 ± 229.2 μm) in this study, are prone to entangling with sand grains, which may hinder their passage through sediment pores (Waldschläger and Schüttrumpf, 2020). Compared to other particle types, fibers have a larger surface area to volume ratio, making them heavier due to faster biofouling (Chubarenko et al., 2016) and thus remain in the sediments under enhanced hydrodynamic forces. Over 70% of microplastics found in the seafloor sediments were fibers (Kane et al., 2020), which sink due to biofouling and are transported by gravity current (Shamskhany et al., 2021). The predominance of fibers is often attributed to their origins, including the washing of synthetic textiles and the degradation of fishing nets (Kane et al., 2020).
Significant differences were observed among different size classes (p < 0.05). Majority of microplastics at seagrass sites fell within the smaller size range of 125–250 µm (38.2%), whereas degraded sites were dominated by microplastics sized 250–500 µm (47.0%). The transport of microplastics is strongly influenced by particle size, as smaller particles require lower critical shear velocities for mobilization (Shamskhany et al., 2021), making them more prone to erosion and loss. Microplastic size class less than 125 µm was commonly observed in the sediments of seagrass beds in the South of China Sea and western Australia (Huang et al., 2020, 2021; Wright et al., 2023). However, no microplastic particles smaller than 125 µm were detected at any site of this study. Again, this highlights the relatively strong hydrodynamic conditions in the study area and the critical role of seagrass beds in protecting sediment stability.
This study identified a variety of microplastic colors including black, white, blue, red, transparent, tan, green, and purple, with blue and transparent dominating at the seagrass site (26.7% each), followed by black (20.0%). In contrast, black microplastics predominated at the degraded site (40.7%), followed by blue (25.9%). These differences may primarily be associated with variation in microplastic shapes (Figure 6), as the degraded site was dominated by fiber, which are predominantly black. The predominance of black, blue, and transparent microplastics is consistent with findings from the seagrass beds in the South of China Sea and western Australia (Wright et al., 2023; Huang et al., 2021). The color of microplastics is also an important characteristic, influencing ingestion by marine organisms due to their resemblance to natural prey (Wright et al., 2013) (Huang et al., 2020). Fish and invertebrates have been shown to preferentially ingest black, blue and transparent microplastics globally (Porter et al., 2023; Thiele et al., 2021). Seagrass beds are known for their high biodiversity and role as nurseries and shelters for marine organisms (Unsworth and Jones, 2024). The release of microplastics from degraded seagrass beds may increase the risk of microplastic ingestion by marine organisms, particularly in surface sediments or water columns.
5 Conclusion
This study demonstrates that seagrass degradation in Swan Lake leads to rapid release of historically buried microplastics and organic carbon into the water column, with 38.7% of microplastics, 30.0% of microplastic carbon, and 66.1% of total organic carbon stocks being remobilized. Microplastic carbon and total organic carbon may share a similar fate during mobilization in seagrass bed. However, microplastic carbon accounts for only a minor fraction of the total organic carbon in Z. japonica seagrass bed in Swan Lake. The focus on a single site limits the extrapolation of these findings to regions with different climatic conditions and seagrass species. Moreover, the short-term observation constrains our understanding of the mechanisms linking seagrass degradation to microplastic resuspension. Therefore, broader investigations across diverse geographic regions, seagrass species, and gradients of microplastic contamination are urgently needed to better quantify the role of microplastics in carbon cycling and to expand our knowledge of seagrass beds in both climate change and microplastic pollution mitigation.
Data availability statement
The original contributions presented in the study are included in the article/Supplementary Material. Further inquiries can be directed to the corresponding author.
Author contributions
YH: Investigation, Conceptualization, Funding acquisition, Writing – review & editing, Visualization, Data curation, Writing – original draft, Methodology, Formal analysis. SY: Conceptualization, Writing – original draft, Investigation, Funding acquisition, Methodology, Writing – review & editing. ZMZ: Writing – review & editing, Writing – original draft, Investigation, Resources. XX: Writing – review & editing, Writing – original draft. ZHZ: Writing – original draft, Methodology, Writing – review & editing. LD: Writing – review & editing, Investigation, Writing – original draft. HW: Writing – original draft, Writing – review & editing, Methodology. JL: Writing – original draft, Writing – review & editing, Investigation. SC: Writing – review & editing, Investigation, Writing – original draft. MH: Conceptualization, Writing – review & editing, Writing – original draft.
Funding
The author(s) declare that financial support was received for the research and/or publication of this article. This study was supported by the Science & Technology Fundamental Resources Investigation Program (Grant number 2023FY100804), the Scientific Research Fund of the Fourth Institute of Oceanography, MNR (Grant number JKF202307), the National Key R&D Program of China (Grant number 2023YFE0113101) and the Guangxi Natural Science Foundation (Grant number 2023GXNSFAA026466).
Conflict of interest
The authors declare that the research was conducted in the absence of any commercial or financial relationships that could be construed as a potential conflict of interest.
Generative AI statement
The author(s) declare that no Generative AI was used in the creation of this manuscript.
Publisher’s note
All claims expressed in this article are solely those of the authors and do not necessarily represent those of their affiliated organizations, or those of the publisher, the editors and the reviewers. Any product that may be evaluated in this article, or claim that may be made by its manufacturer, is not guaranteed or endorsed by the publisher.
Supplementary material
The Supplementary Material for this article can be found online at: https://www.frontiersin.org/articles/10.3389/fmars.2025.1593776/full#supplementary-material
References
Amelia T. S. M., Khalik W. M. A. W. M., Ong M. C., Shao Y. T., Pan H.-J., and Bhubalan K. (2021). Marine microplastics as vectors of major ocean pollutants and its hazards to the marine ecosystem and humans. Prog. Earth Planet. Sci. 8, 12. doi: 10.1186/s40645-020-00405-4
Bao L.-J., Mai L., Liu L.-Y., Sun X.-F., and Zeng E. Y. (2024). Microplastics on the planet: current knowledge and challenges. Environ. Sci. Technol. Lett. 11, 1262–1271. doi: 10.1021/acs.estlett.4c00603
Carnell P. E., Ierodiaconou D., Atwood T. B., and Macreadie P. I. (2020). Overgrazing of seagrass by sea urchins diminishes blue carbon stocks. Ecosystems 23, 1437–1448. doi: 10.1007/s10021-020-00479-7
Chen Z. and Lee S. Y. (2021). Contribution of microplastics to carbon storage in coastal wetland sediments. Environ. Sci. Technol. Lett. 8, 1045–1050. doi: 10.1021/acs.estlett.1c00784
Chubarenko I., Bagaev A., Zobkov M., and Esiukova E. (2016). On some physical and dynamical properties of microplastic particles in marine environment. Marine Pollut. Bull. 108, 105–112. doi: 10.1016/j.marpolbul.2016.04.048
Coppock R. L., Cole M., Lindeque P. K., Queirós A. M., and Galloway T. S. (2017). A small-scale, portable method for extracting microplastics from marine sediments. Environ. Pollut. 230, 829–837. doi: 10.1016/j.envpol.2017.07.017
Cozar A., Echevarria F., Ignacio Gonzalez-Gordillo J., Irigoien X., Ubeda B., Hernandez-Leon S., et al. (2014). Plastic debris in the open ocean. Proc. Natl. Acad. Sci. United States America 111, 10239–10244. doi: 10.1073/pnas.1314705111
Cozzolino L., Nicastro K. R., Zardi G. I., and De Los Santos C. B. (2020). Species-specific plastic accumulation in the sediment and canopy of coastal vegetated habitats. Sci. Total Environ. 723, 138018. doi: 10.1016/j.scitotenv.2020.138018
Dahl M., Bergman S., Bjork M., Diaz-Almela E., Granberg M., Gullstrom M., et al. (2021a). A temporal record of microplastic pollution in Mediterranean seagrass soils. Environ. Pollut. 273, 116451. doi: 10.1016/j.envpol.2021.116451
Dahl M., Björk M., and Gullström M. (2021b). Effects of seagrass overgrazing on sediment erosion and carbon sink capacity: Current understanding and future priorities. Limnol. Oceanogr. Lett. 6, 309–319. doi: 10.1002/lol2.10211
Dahl M., Ismail R., Braun S., Masqué P., Lavery P. S., Gullström M., et al. (2022). Impacts of land-use change and urban development on carbon sequestration in tropical seagrass meadow sediments. Marine Environ. Res. 176, 105608. doi: 10.1016/j.marenvres.2022.105608
de los Santos C. B., Krause-Jensen D., Alcoverro T., Marbà N., Duarte C. M., Van Katwijk M. M., et al. (2019). Recent trend reversal for declining European seagrass meadows. Nat. Commun. 10, 3356. doi: 10.1038/s41467-019-11340-4
Duarte C. M., Losada I. J., Hendriks I. E., Mazarrasa I., and Marba N. (2013). The role of coastal plant communities for climate change mitigation and adaptation. Nat. Climate Change 3, 961–968. doi: 10.1038/nclimate1970
Esmeralda V. G. and Patterson J. (2025). Accumulation of microplastics in relation to the sediment grain size distribution in seagrass meadows in the coastal areas of Tuticorin, southeast coast of India. Marine Pollut. Bull. 212, 117557. doi: 10.1016/j.marpolbul.2025.117557
Fourqurean J. W., Duarte C. M., Kennedy H., Marbà N., Holmer M., Mateo M. A., et al. (2012). Seagrass ecosystems as a globally significant carbon stock. Nat. Geosci. 5, 505–509. doi: 10.1038/ngeo1477
Gao S. and Jia J.-J. (2004). Sediment and carbon accumulation in a small tidal basin: Yuehu, Shandong Peninsula, China. Region. Environ. Change 4, 63–69. doi: 10.1007/s10113-003-0064-5
GESAMP (2015). Sources, fate and effects of microplastics in the marine environment: A global assessment (London, United Kingdom: IMO/FAO/UNESCO-IOC/UNIDO/WMO/IAEA/UN/UNEP/UNDP Joint Group of Experts on the Scientific Aspects of Marine Environmental Protection).
Geyer R., Jambeck J. R., and Law K. L. (2017). Production, use, and fate of all plastics ever made. Sci. Adv. 3, e1700782. doi: 10.1126/sciadv.1700782
Githaiga M., Frouws A., Kairo J. G., and Huxham M. (2019). Seagrass removal leads to rapid changes in fauna and loss of carbon. Front. Ecol. Evol. 7. doi: 10.3389/fevo.2019.00062
Hermabessiere L., Dehaut A., Paul-Pont I., Lacroix C., Jezequel R., Soudant P., et al. (2017). Occurrence and effects of plastic additives on marine environments and organisms: A review. Chemosphere 182, 781–793. doi: 10.1016/j.chemosphere.2017.05.096
Huang W. and Xia X. (2024). Element cycling with micro(nano)plastics. Science 385, 933–935. doi: 10.1126/science.adk9505
Huang Y., Xiao X., Effiong K., Xu C., Su Z., Hu J., et al. (2021). New insights into the microplastic enrichment in the blue carbon ecosystem: Evidence from seagrass meadows and mangrove forests in coastal South China Sea. Environ. Sci. Technol. 55, 4804–4812. doi: 10.1021/acs.est.0c07289
Huang Y., Xiao X., Xu C., Perianen Y. D., Hu J., and Holmer M. (2020). Seagrass beds acting as a trap of microplastics - Emerging hotspot in the coastal region? Environ. Pollut. 257, 113450. doi: 10.1016/j.envpol.2019.113450
Kane I. A., Clare M. A., Miramontes E., Wogelius R., Rothwell J. J., Garreau P., et al. (2020). Seafloor microplastic hotspots controlled by deep-sea circulation. Science 368, 1140–1145. doi: 10.1126/science.aba5899
Kannankai M. P., Babu A. J., Radhakrishnan A., Alex R. K., Borah A., and Devipriya S. P. (2022). Machine learning aided meta-analysis of microplastic polymer composition in global marine environment. J. Hazard. Mater. 440, 129801. doi: 10.1016/j.jhazmat.2022.129801
Kida M., Ziembowicz S., and Koszelnik P. (2022). CH4 and CO2 Emissions from the decomposition of microplastics in the bottom sediment—Preliminary studies. Environments 9, 91. doi: 10.3390/environments9070091
Kreitsberg R., Raudna-Kristoffersen M., Heinlaan M., Ward R., Visnapuu M., Kisand V., et al. (2021). Seagrass beds reveal high abundance of microplastic in sediments: A case study in the Baltic Sea. Marine Pollut. Bull. 168, 112417. doi: 10.1016/j.marpolbul.2021.112417
Liang H., Wang L., Wang S., Sun D., Li J., Xu Y., et al. (2023). Remote sensing detection of seagrass distribution in a marine lagoon (Swan Lake), China. Opt. Expr. 31, 27677–27695. doi: 10.1364/OE.498901
Lyu Z., Chen X., Wei T., Wang D., Zhao P., Sanganyado E., et al. (2024). Microplastics and arsenic speciation in edible bivalves from the coast of China: Distribution, bioavailability, and human health risk. Marine Pollut. Bull. 207, 116861. doi: 10.1016/j.marpolbul.2024.116861
Macreadie P. I., Trevathan-Tackett S. M., Skilbeck C. G., Sanderman J., Curlevski N., Jacobsen G., et al. (2015). Losses and recovery of organic carbon from a seagrass ecosystem following disturbance. Proc. R. Soc. B: Biol. Sci. 282, 20151537. doi: 10.1098/rspb.2015.1537
Mishra A. K., Singh J., and Mishra P. P. (2021). Microplastics in polar regions: An early warning to the world’s pristine ecosystem. Sci. Total Environ. 784, 147149. doi: 10.1016/j.scitotenv.2021.147149
Moksnes P.-O., Röhr M. E., Holmer M., Eklöf J. S., Eriander L., Infantes E., et al. (2021). Major impacts and societal costs of seagrass loss on sediment carbon and nitrogen stocks. Ecosphere 12, e03658. doi: 10.1002/ecs2.v12.7
Monclús L., Mccann Smith E., Ciesielski T. M., Wagner M., and Jaspers V. L. B. (2022). Microplastic ingestion induces size-specific effects in Japanese Quail. Environ. Sci. Technol. 56, 15902–15911. doi: 10.1021/acs.est.2c03878
Peng X., Chen M., Chen S., Dasgupta S., Xu H., Ta K., et al. (2018). Microplastics contaminate the deepest part of the world’s ocean. Geochem. Perspect. Lett. 9, 1–5. doi: 10.7185/geochemlet.1829
Porter A., Godbold J. A., Lewis C. N., Savage G., Solan M., and Galloway T. S. (2023). Microplastic burden in marine benthic invertebrates depends on species traits and feeding ecology within biogeographical provinces. Nat. Commun. 14, 8023. doi: 10.1038/s41467-023-43788-w
Radford F., Horton A. A., Felgate S., Lichtschlag A., Hunt J., Andrade V., et al. (2024). Factors influencing microplastic abundances in the sediments of a seagrass-dominated tropical atoll. Environ. Pollut. 357, 124483. doi: 10.1016/j.envpol.2024.124483
Ramanayaka S., Zhang H., and Semple K. T. (2024). Environmental fate of microplastics and common polymer additives in non-biodegradable plastic mulch applied agricultural soils. Environ. Pollut. 363, 125249. doi: 10.1016/j.envpol.2024.125249
Ramili Y. and Umasangaji H. (2022). An assessment of microplastics (MPs) sedimentary accumulation in seagrass meadows of Mare Island conservation area, North Maluku, Indonesia. Omni-Akuatika 18, 48–61. doi: 10.20884/1.oa.2022.18.1.921
Remy F., Collard F., Gilbert B., Compère P., Eppe G., and Lepoint G. (2015). When microplastic is not plastic: The ingestion of artificial cellulose fibers by macrofauna living in seagrass macrophytodetritus. Environ. Sci. Technol. 49, 11158–11166. doi: 10.1021/acs.est.5b02005
Ren Y., Liu S., Luo H., Jiang Z., Liang J., Wu Y., et al. (2024). Seagrass decline weakens sediment organic carbon stability. Sci. Total Environ. 937, 173523. doi: 10.1016/j.scitotenv.2024.173523
Rillig M. C. (2018). Microplastic disguising as soil carbon storage. Environ. Sci. Technol. 52, 6079–6080. doi: 10.1021/acs.est.8b02338
Risandi J., Rifai H., Lukman K. M., Sondak C. F. A., Hernawan U. E., Quevedo J. M. D., et al. (2023). Hydrodynamics across seagrass meadows and its impacts on Indonesian coastal ecosystems: A review. Front. Earth Sci. 11, 1034827. doi: 10.3389/feart.2023.1034827
Röhr E., Boström C., Canal-Vergés P., and Holmer M. (2016). Blue carbon stocks in Baltic Sea eelgrass (Zostera marina) meadows. Biogeosciences 13, 6139–6153. doi: 10.5194/bg-2016-131
Royer S.-J., Ferrón S., Wilson S. T., and Karl D. M. (2018). Production of methane and ethylene from plastic in the environment. PloS One 13, e0200574. doi: 10.1371/journal.pone.0200574
Salinas C., Duarte C. M., Lavery P. S., Masque P., Arias-Ortiz A., Leon J. X., et al. (2020). Seagrass losses since mid-20th century fuelled CO2 emissions from soil carbon stocks. Global Change Biol. 26, 4772–4784. doi: 10.1111/gcb.15204
Sanchez-Vidal A., Canals M., De Haan W. P., Romero J., and Veny M. (2021). Seagrasses provide a novel ecosystem service by trapping marine plastics. Sci. Rep. 11, 254. doi: 10.1038/s41598-020-79370-3
Scheurer M. and Bigalke M. (2018). Microplastics in Swiss floodplain soils. Environ. Sci. Technol. 52, 3591–3598. doi: 10.1021/acs.est.7b06003
Shamskhany A., Li Z., Patel P., and Karimpour S. (2021). Evidence of microplastic size impact on mobility and transport in the marine environment: A review and synthesis of recent research. Front. Marine Sci. 8. doi: 10.3389/fmars.2021.760649
Souza A. M. C., Ferreira G. V. B., De Los Santos C. B., Fredou F. L., and Magalhaes K. M. (2024). Anthropogenic microparticles accumulation in small-bodied seagrass meadows: The case of tropical estuarine species in Brazil. Marine Pollut. Bull. 207, 116799. doi: 10.1016/j.marpolbul.2024.116799
Stubbins A., Law K. L., Munoz S. E., Bianchi T. S., and Zhu L. (2021). Plastics in the earth system. Science 373, 51–55. doi: 10.1126/science.abb0354
Team, R. C (2018). R: A Language and environment for statistical computing (Vienna, Austria: R Foundation for Statistical Computing).
Thiele C. J., Hudson M. D., Russell A. E., Saluveer M., and Sidaoui-Haddad G. (2021). Microplastics in fish and fishmeal: an emerging environmental challenge? Sci. Rep. 11, 2045. doi: 10.1038/s41598-021-81499-8
Thompson R. C., Olsen Y., Mitchell R. P., Davis A., Rowland S. J., John A. W. G., et al. (2004). Lost at sea: Where is all the plastic? Science 304, 838. doi: 10.1126/science.1094559
Unsworth R. K. F. and Jones B. L. H. (2024). Map and protect seagrass for biodiversity. Science 384, 394–394. doi: 10.1126/science.adp0937
Waldschläger K. and Schüttrumpf H. (2020). Infiltration behavior of microplastic particles with different densities, sizes, and shapes—From glass spheres to natural sediments. Environ. Sci. Technol. 54, 9366–9373. doi: 10.1021/acs.est.0c01722
Wang W., Ge J., and Yu X. (2020). Bioavailability and toxicity of microplastics to fish species: A review. Ecotoxicol. Environ. Saf. 189, 109913. doi: 10.1016/j.ecoenv.2019.109913
Waycott M., Duarte C. M., Carruthers T. J. B., Orth R. J., Dennison W. C., Olyarnik S., et al. (2009). Accelerating loss of seagrasses across the globe threatens coastal ecosystems. Proc. Natl. Acad. Sci. 106, 12377–12381. doi: 10.1073/pnas.0905620106
White E. M., Clark S., Manire C. A., Crawford B., Wang S., Locklin J., et al. (2018). Ingested micronizing plastic particle compositions and size distributions within stranded post-hatchling sea turtles. Environ. Sci. Technol. 52, 10307–10316. doi: 10.1021/acs.est.8b02776
Wieczorek A. M., Croot P. L., Lombard F., Sheahan J. N., and Doyle T. K. (2019). Microplastic ingestion by gelatinous zooplankton may lower efficiency of the biological pump. Environ. Sci. Technol. 53, 5387–5395. doi: 10.1021/acs.est.8b07174
Wright J., Hovey R. K., Paterson H., Stead J., and Cundy A. (2023). Microplastic accumulation in Halophila ovalis beds in the Swan-Canning Estuary, Western Australia. Marine Pollut. Bull. 187, 114480. doi: 10.1016/j.marpolbul.2022.114480
Wright S. L., Thompson R. C., and Galloway T. S. (2013). The physical impacts of microplastics on marine organisms: A review. Environ. Pollut. 178, 483–492. doi: 10.1016/j.envpol.2013.02.031
Xiao X., Huang Y., and Holmer M. (2020). Current trends in seagrass research in China, (2010-2019). Aquat. Bot. 166, 103266. doi: 10.1016/j.aquabot.2020.103266
Yamuza-Magdaleno A., Jiménez-Ramos R., Casal-Porras I., Brun F. G., and Egea L. G. (2024). Long-term sediment organic carbon remineralization in different seagrass and macroalgae habitats: implication for blue carbon storage. Front. Marine Sci. 11. doi: 10.3389/fmars.2024.1370768
Yu L., Li R., Chai M., and Li B. (2023). Vertical distribution, accumulation, and characteristics of microplastics in mangrove sediment in China. Sci. Total Environ. 856, 159256. doi: 10.1016/j.scitotenv.2022.159256
Zhang Y., Wu P., Xu R., Wang X., Lei L., Schartup A. T., et al. (2023). Plastic waste discharge to the global ocean constrained by seawater observations. Nat. Commun. 14, 1372. doi: 10.1038/s41467-023-37108-5
Zhao S., Kvale K. F., Zhu L., Zettler E. R., Egger M., Mincer T. J., et al. (2025). The distribution of subsurface microplastics in the ocean. Nature 641, 51–61. doi: 10.1038/s41586-025-08818-1
Zhao L., Ru S., He J., Zhang Z., Song X., Wang D., et al. (2022). Eelgrass (Zostera marina) and its epiphytic bacteria facilitate the sinking of microplastics in the seawater. Environ. Pollut. 292, 118337. doi: 10.1016/j.envpol.2021.118337
Keywords: microplastics, seagrass, carbon, sediment, degradation
Citation: Huang Y, Yu S, Zheng Z, Xiao X, Zhu Z, Deng L, Wei H, Liang J, Chen S and Holmer M (2025) Dual mobilization of buried microplastics and organic carbon driven by seagrass degradation: a case study from Swan Lake, China. Front. Mar. Sci. 12:1593776. doi: 10.3389/fmars.2025.1593776
Received: 14 March 2025; Accepted: 12 May 2025;
Published: 29 May 2025.
Edited by:
Lingshi Yin, Hunan Agricultural University, ChinaReviewed by:
Gulnihal Ozbay, Delaware State University, United StatesMoharana Choudhury, Voice of Environment (VoE), India
Copyright © 2025 Huang, Yu, Zheng, Xiao, Zhu, Deng, Wei, Liang, Chen and Holmer. This is an open-access article distributed under the terms of the Creative Commons Attribution License (CC BY). The use, distribution or reproduction in other forums is permitted, provided the original author(s) and the copyright owner(s) are credited and that the original publication in this journal is cited, in accordance with accepted academic practice. No use, distribution or reproduction is permitted which does not comply with these terms.
*Correspondence: Yuzhou Huang, aHVhbmd5dXpob3VANGlvLm9yZy5jbg==
†These authors have contributed equally to this work