 Igor A. Dmitrenko1*
 Sergei A. Kirillov1
 David G. Babb1
 Tonya Burgers2
 Qiang Wang3
 Sergey Danilov3
 Dorthe Dahl-Jensen1,4
- 1Centre for Earth Observation Science, University of Manitoba, Winnipeg, MB, Canada
- 2Arctic Aquatic Research Division, Freshwater Institute, Fisheries and Oceans Canada, Winnipeg, MB, Canada
- 3Climate Dynamics, Alfred Wegener Institute Helmholtz Centre for Polar and Marine Research, Bremerhaven, Germany
- 4Niels Bohr Institute, University of Copenhagen, Copenhagen, Denmark
The Canadian Arctic Archipelago (CAA) serves as a major conduit between the Arctic Ocean and the North Atlantic. The Nansen Sound fiord system, which encapsulates Nansen Sound, Greely Fiord, Eureka Sound and several surrounding fiords, forms the northernmost oceanographic passageway through the CAA. Due to hostile ice conditions, the area has been understudied since the original oceanographic surveys were conducted in the 1960s and 1970s. The historic data highlighted a very weak signal of the relatively fresh Pacific-derived water (PW). Here, we present new oceanographic observations, including PW tracers, and contrast them against the historic data. Salinity profiles taken in 2024 show significant freshening as compared to 1976. This freshening is attributed to enhanced presence of PW in the area. We suggest that changes in the Arctic Oscillation impact the export gateways of PW from the Arctic Ocean, with the recent switch to a positive phase enhancing the outflow of cool and less saline PW through the CAA. Overall, this provides a first glimpse into variability of the freshwater flow through the straits of the northern CAA.
1 Introduction
The Canadian Arctic Archipelago (CAA) is comprised of a series of narrow channels and passageways that collectively form a conduit connecting the Arctic Ocean (AO) to Baffin Bay and the North Atlantic. Inflow, modification and outflow of the waters passing through the CAA are of great interest for the purposes of understanding oceanographic conditions, changes and variability, with a particular interest in the advection of freshwater (Zhang et al., 2021). The primary source of freshwater in the CAA is the relatively fresh Pacific-modified polar water (hereinafter Pacific water – PW; Carmack et al., 2016) that enters the AO through the Bering Strait (Figure 1a). PW subsequently follows one of two major pathways, a transpolar branch crossing the AO toward Fram Strait, and an Alaskan branch that flows along the continental slope of the Beaufort Sea (Figure 1a; Jones, 2001; Rudels, 2012; Woodgate, 2013). The magnitude of PW flowing through each pathway and the location of the transpolar branch is controlled by the large-scale atmospheric circulation (Steele et al., 2004; Karcher et al., 2012; Hu and Myers, 2013; Haine et al., 2015; Aksenov et al., 2016; Dmitrenko et al., 2018; Kelly et al., 2020; Wang et al., 2021; Wang and Danilov, 2022), which varies on decadal and multidecadal timescales and therefore drives variability in the distribution of PW throughout the AO. This is expected to drive variability in the advection and storage of freshwater in the CAA, though due to limited in situ studies this variability is poorly understood.
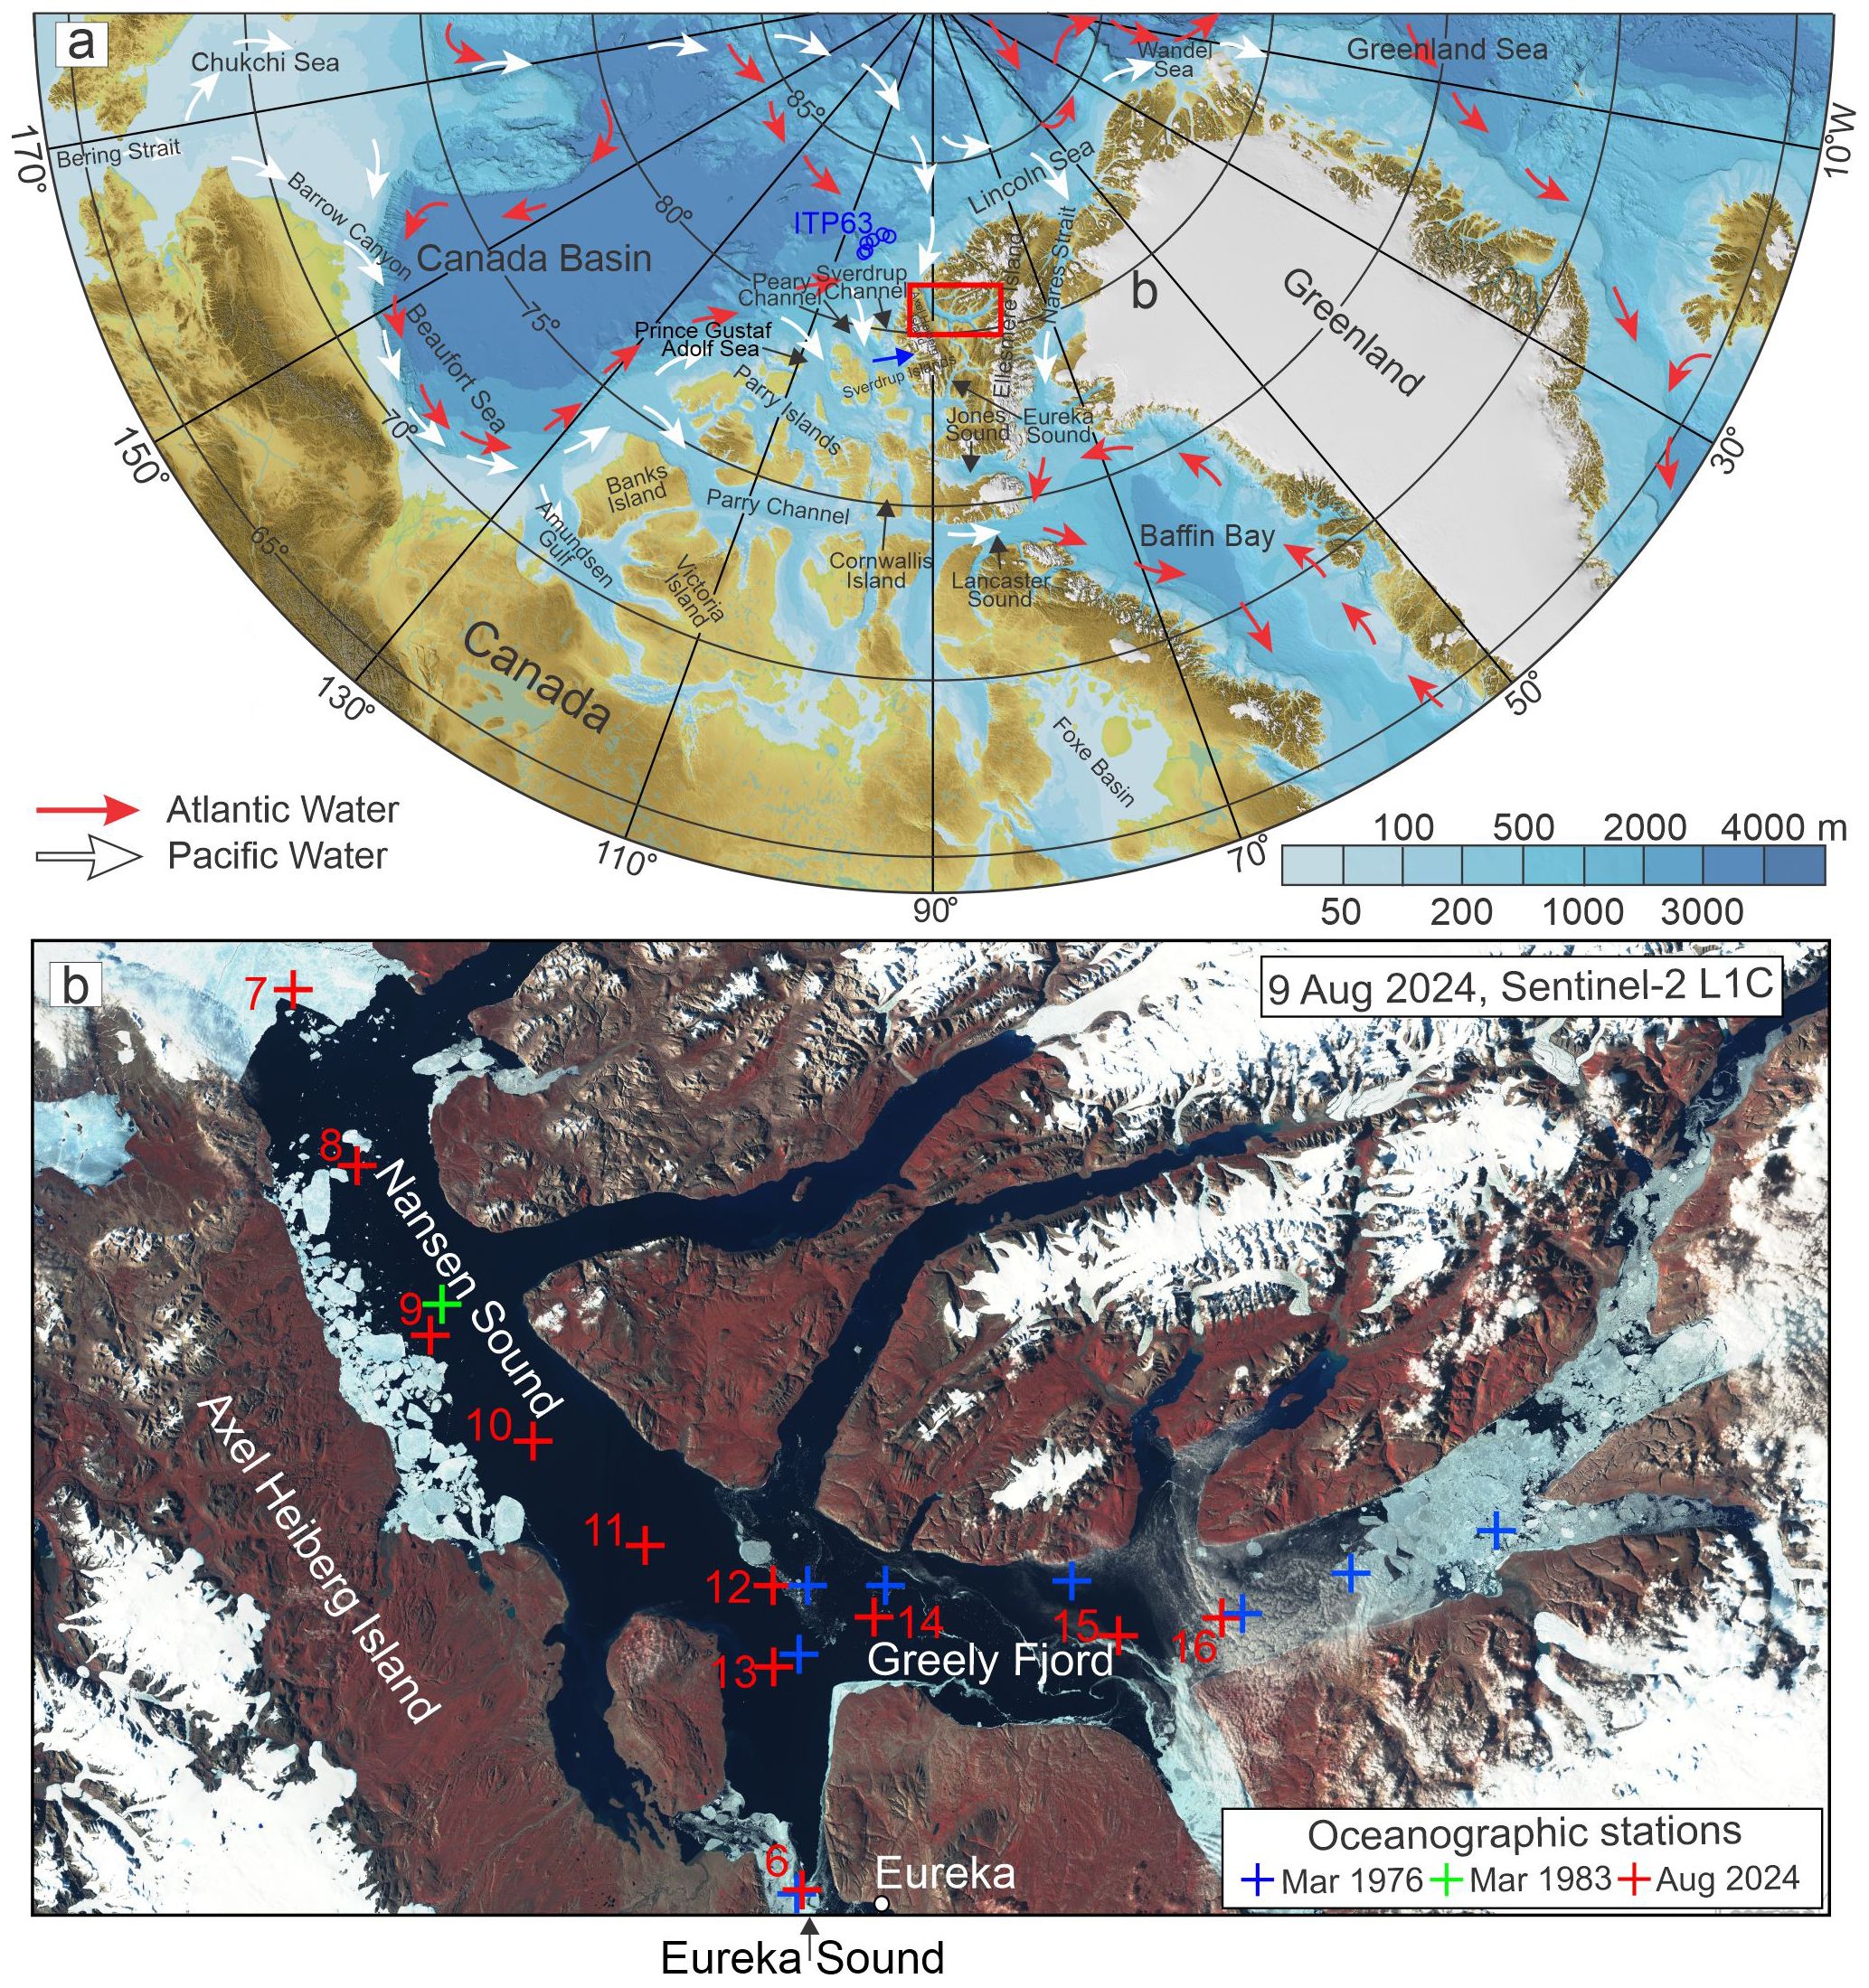
Figure 1. (a) Bathymetric chart of the western AO. The schematic circulation of PW (white arrows) and AW (red arrows) in the AO and adjoining CAA follows Jones (2001); Rudels (2012), and Woodgate (2013). Blue dots depict CTD profiles taken by the ITP #63 over the lower continental slope of the CAA in May-June 2012. Blue arrow highlights Iceberg Bay in Axel Heiberg Island. Red rectangle denotes the area of Nansen Sound and Greely Fjord enlarged in (b). (b) Sentinel-2 satellite image from 9 August 2024 shows Nansen Sound and Greely Fjord with oceanographic stations occupied in August 2024 (red crosses). Blue and green crosses identify CTD stations taken in March 1976 and 1983, respectively.
The northernmost passageway through the CAA is comprised of Nansen Sound, Greely Fiord, Eureka Sound and the surrounding fiords, which we collectively refer to as the Nansen Sound Fiord system (NSFS; Figure 1). Due to its northern geography and near year-round ice cover, this area has been dramatically understudied relative to the rest of the Canadian Arctic. The original oceanographic surveys were conducted from 1963–1972 as part of operation “Hazen-Tanquary”, under the framework of the Defence Research Board of Canada (Hattersley-Smith, 1968; Fissel et al., 1983). Unfortunately, most of this data was not published and is unavailable. Additional oceanographic data was collected in the mid-1970s by the Frozen Sea Research Group of the Institute of Ocean Sciences (e.g., Frozen Sea Research Group, 1976) and therefore provide a baseline of the oceanographic conditions in the NSFS. Since these surveys there has been very little work done in the area, which is now part of the Tuvaijuittuq Marine Protected Area (DFO, 2020) and part of the broadly defined Last Ice Area (Fol et al., 2025). As a result, it is not well understood how the oceanography of this area has responded to climatically driven changes that have occurred both upstream and locally during the past half-century. Here, we present data from a new oceanographic survey of this area completed during August 2024 and contrast it against the available historic observations. This comparison highlights changes and variability of the oceanography in the northern CAA indicating a noticeable freshening in the area. Using biogeochemical tracers we attributed this freshening to an increased volume of PW in the NSFS. We assign this to changes in the large-scale atmospheric circulation over the Arctic that impacts the circulation patterns of PW in the AO.
2 Data and methods
In August 2024, 11 conductivity-temperature-depth (CTD) profiles were collected in the NSFS from the Canadian Coast Guard icebreaker Des Groseilliers (Figures 1, 2; Supplementary Figures S1–S3; Dmitrenko and Babb, 2025). The CTD observations were carried out with a Sea-Bird Scientific SBE-19plus CTD that was calibrated prior to the expedition and was accurate to ±0.005°C and ±0.0005 S m–1. Throughout the manuscript, we used practical salinity calculated directly from the conductivity and temperature of seawater as defined by Practical Salinity Scale 1978 (Lewis, 1980). All CTD casts were taken through the full water column or to a maximum depth of 520 m. The CTD was outfitted with a Wet Labs ECO fluorometer for measuring Colored Dissolved Organic Matter (CDOM) fluorescence for EX/EM = 370/460 nm, and a Sea-Bird Scientific SUNA V2 Optical Nitrate Sensor that measured nitrate based on the absorption characteristics of nitrate in the UV light spectrum. The CDOM sensor sensitivity is 0.09 parts per billion (ppb). The nitrate profiling was accurate to ±2 mmol m–3 (mmol m–3 = millimoles of nitrate per cubic meter of water) or ± 10% of reading. Both the CDOM and Nitrate sensors were calibrated prior to the expedition, however, the resulting measurements were not post-calibrated against discrete samples. In what follows, we limited our analysis based on CDOM and nitrate data (Figure 3) only to PW qualitative tracing. Throughout the paper we contrast the 2024 observations against historic observations occupied in August 1962 along Nansen Sound and Greeley Fiord (Supplementary Figure S1A; Ford and Hattersley-Smith, 1965), in March-April 1976 in Greely Fjord and Eureka Sound (Figures 1b, 2; Frozen Sea Research Group, 1976) and in March 1983 (two stations over the mouth of Nansen Sound and one station ~85 km from the mouth; Figures 1b, 2a, b; Supplementary Figure S3; CIOOS Pacific Data Catalogue, 2025).
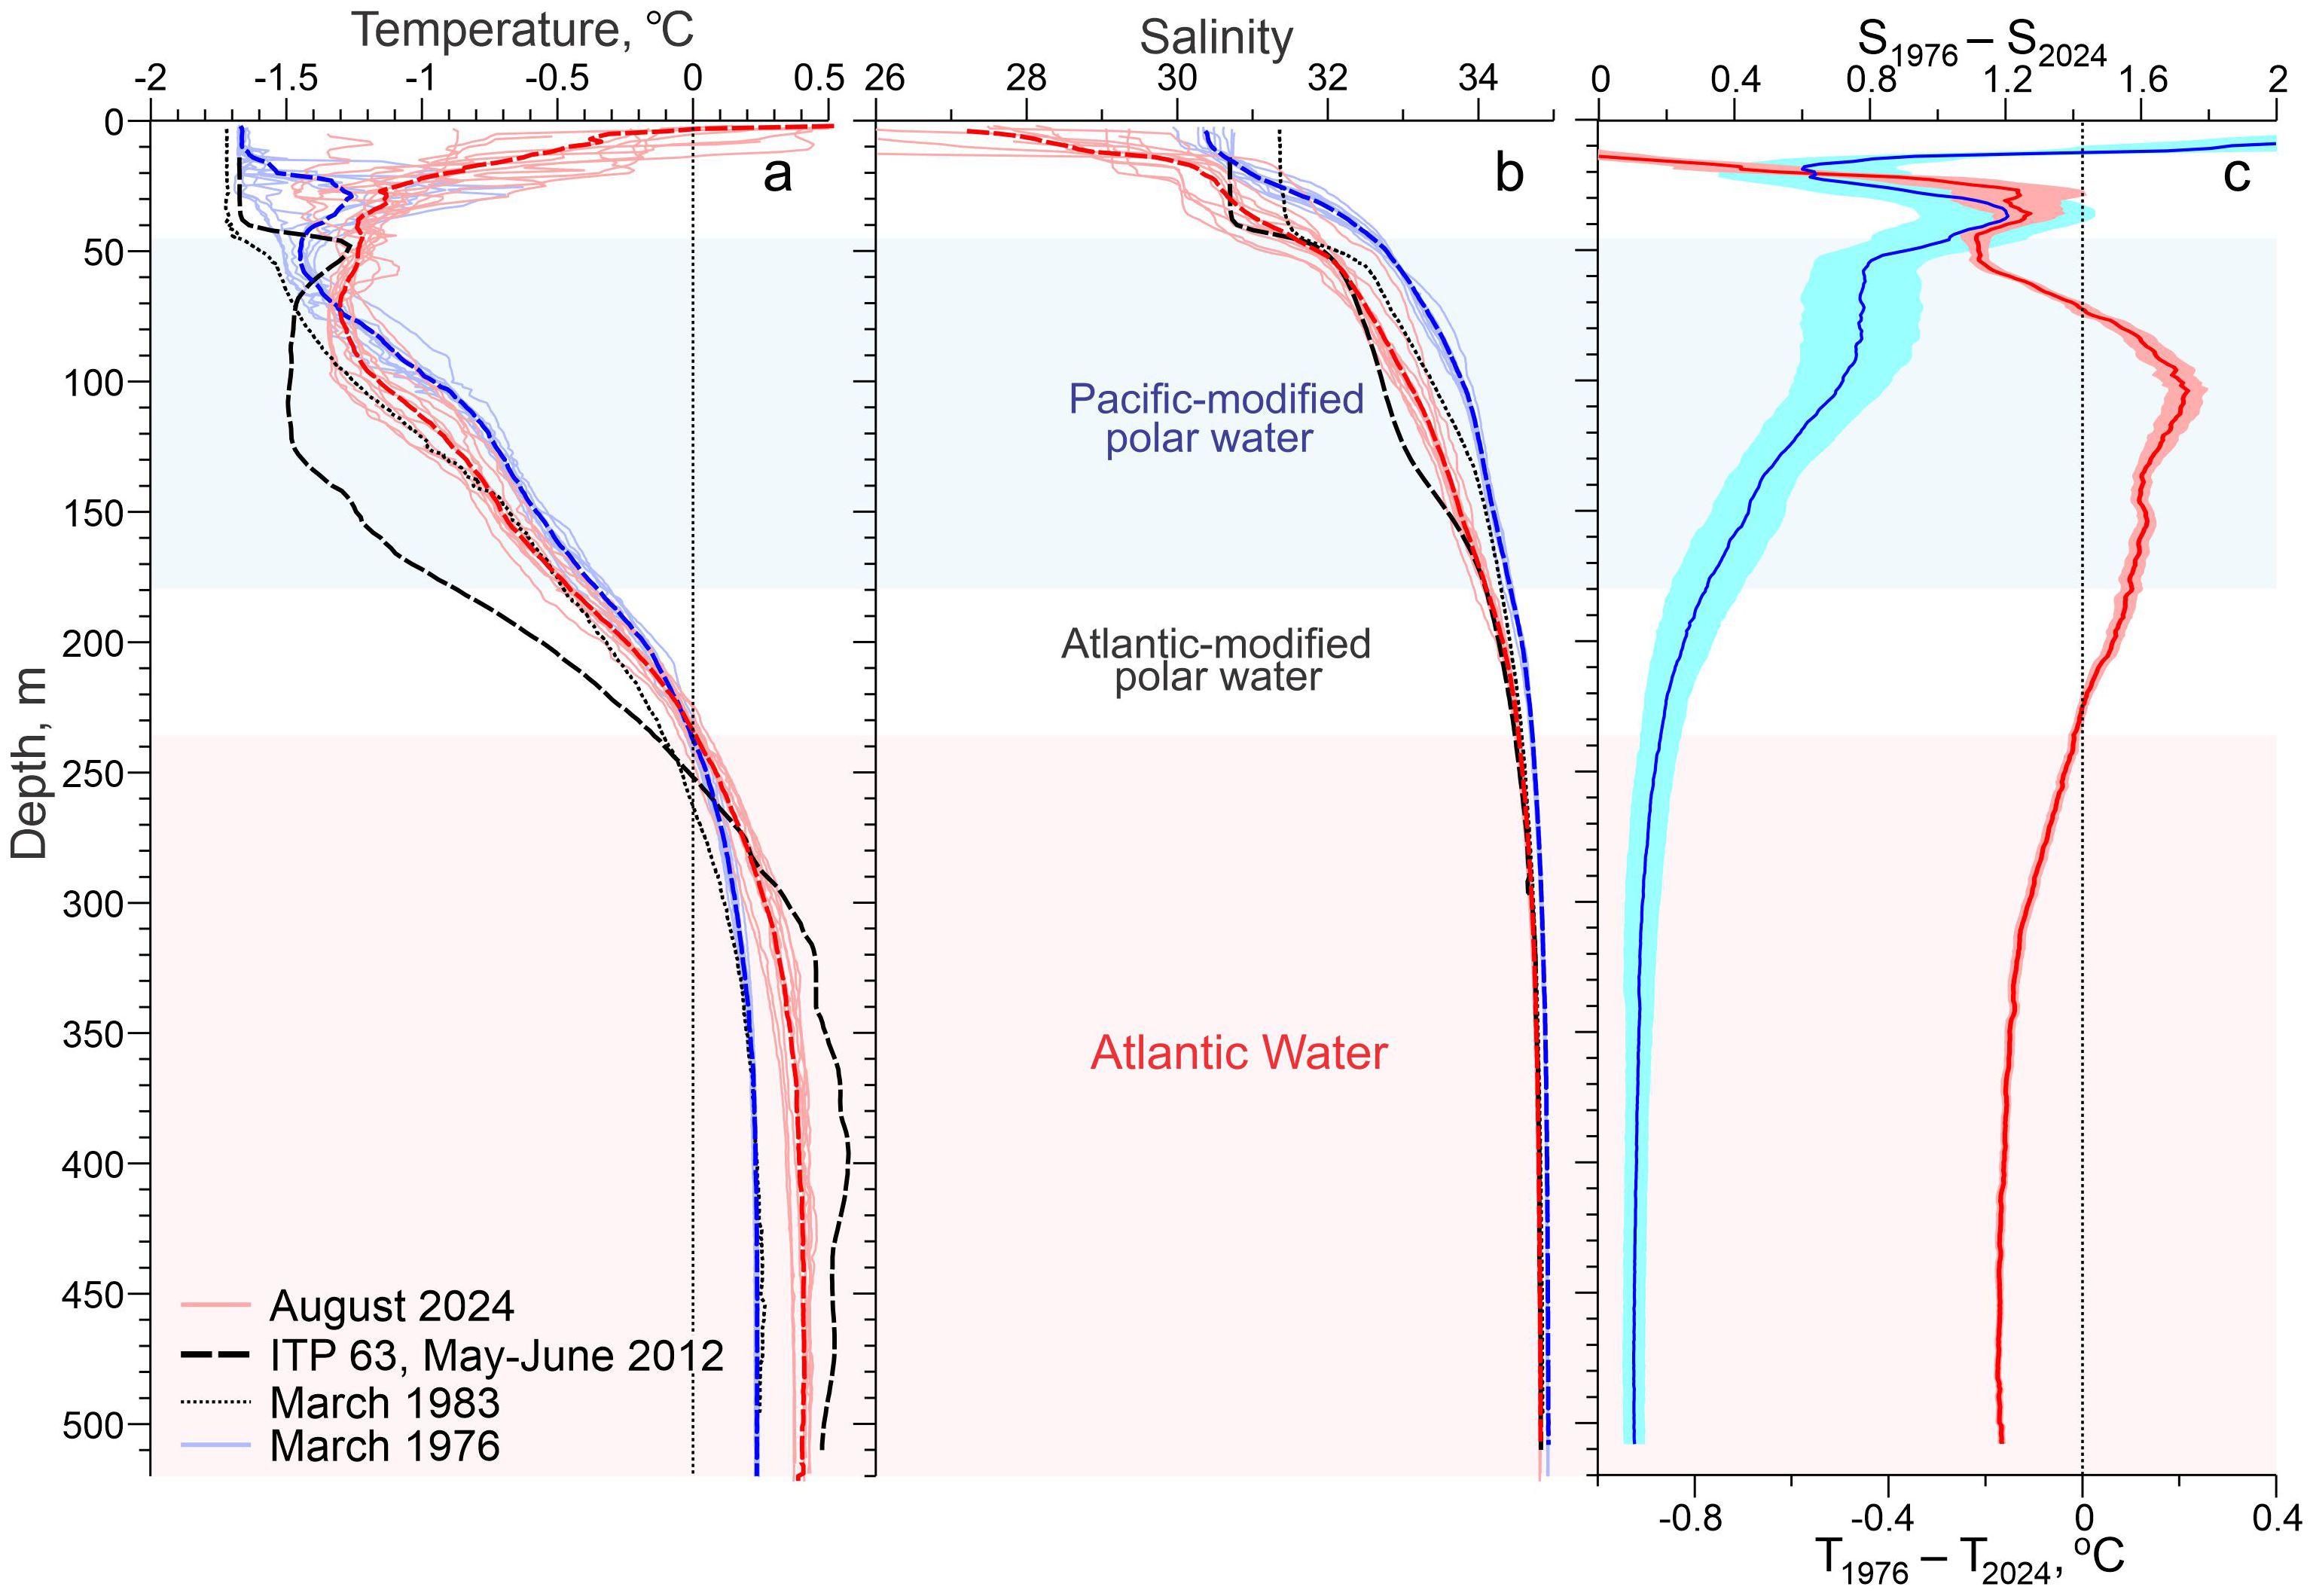
Figure 2. Pink solid lines show all vertical profiles of (a) in situ temperature (°C) and (b) practical salinity taken in the NSFS in August 2024 with their mean displayed by dashed red line. Dashed black line show mean CTD profile taken by the ITP #63 over the lower continental slope of the CAA from May to June 2012. Dotted black line depicts CTD profile taken in Nansen Sound in March 1983. Purple solid lines show CTD profiles taken in Greely Fjord and Eureka Sound in March 1976 with their mean displayed by dashed purple line. (c) Salinity (blue line) and temperature (red line) differences between mean salinity and temperature profiles for 1976 and 2024. Dark blue and pink shading depicts ± one standard deviation of the mean. Blue and pink shading highlights PW and AW, respectively.
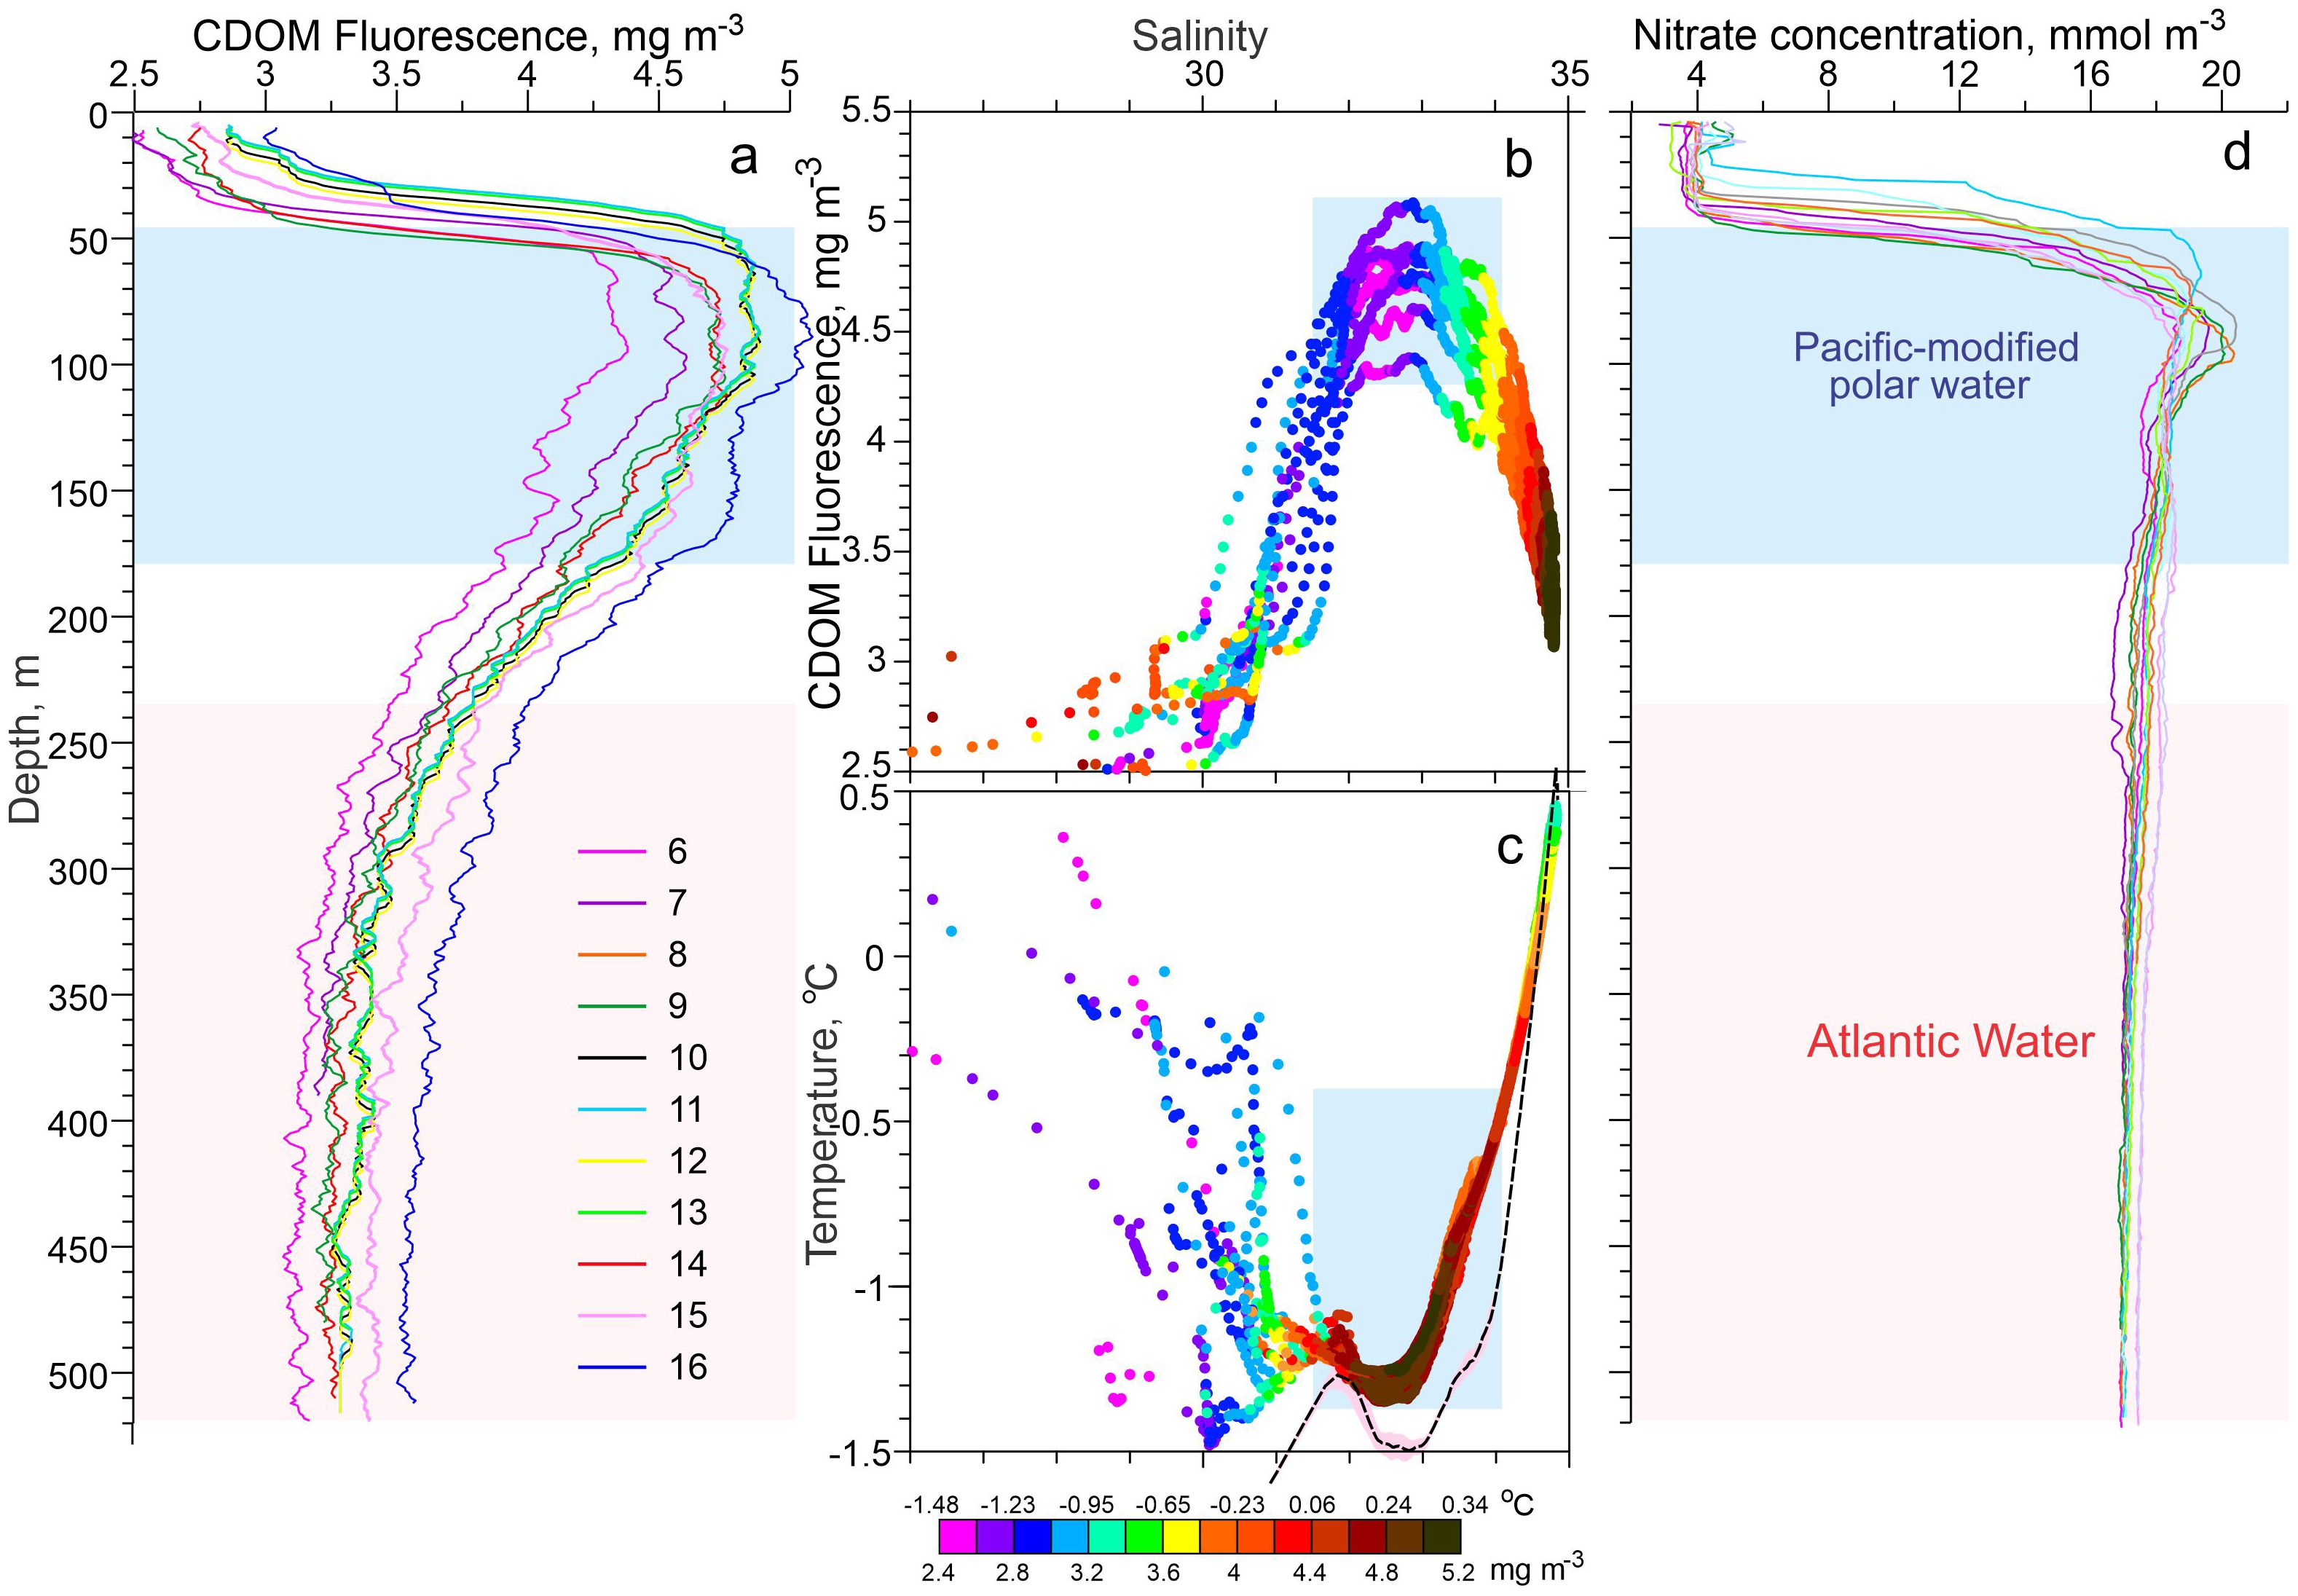
Figure 3. Color solid lines show all vertical profiles of (a) CDOM fluorescence (mg m–3) and (d) nitrate concentration (mmol m–3) taken in the NSFS in August 2024. (b, c) Property-property scatterplots of (b) CDOM fluorescence, practical salinity, and in situ water temperature (in color) and (c) in situ water temperature, practical salinity, and CDOM fluorescence (in color) for all CTD profiles taken in 2024. (c) Black dashed line shows in situ mean TS diagram for the lower continental slope of the CAA derived from the ITP #63 ± one standard deviation depicted by pink shading.
Three additional sets of complementary CTD profiles are used to provide context for the water masses we observed in the NSFS. (i) We adopted 26 CTD profiles from Iceberg Bay in Axel Heiberg Island occupied in April-May 2022 (Figure 1a; Supplementary Figure S2; Dmitrenko et al., 2023) to assess oceanographic conditions on the western side of Axel Heiberg Island. (ii) CTD profiles collected by Ice Tethered Profilers (ITP; Toole et al., 2011) over the lower continental slope of the northern CAA (~ 82°N, 102°W) are used to represent the ambient water masses. We specifically use the mean of CTD profiles #1500–1700 from ITP #63 occupied from May to June 2012 (Figures 1a, 2a, b; Supplementary Figures S2, S3; Toole and Krishfield, 2016). (iii) Finally, 18 CTD profiles collected over the CAA shelf ~60 km offshore from Ellesmere and Axel Heiberg islands between 82°W and 97°W, and 1 profile in the Prince Gustaf Adolf Sea at ~ 109.5°W all collected in March 1983 (CIOOS Pacific Data Catalogue, 2025) reveal the upstream conditions over the northern CAA shelf (Supplementary Figure S3).
Mean sea-level pressure (SLP) was derived from ERA5 atmospheric reanalysis (Hersbach et al., 2020) for periods with positive (1988–1994 and 2011–2021) and negative (1976–1982 and 1961–1971) phases of the Arctic Oscillation index (AOi; Figure 4a; Supplementary Figure S4). The horizontal resolution of ERA5 is 31 km. Monthly mean values of the AOi were obtained from the National Centers for Environmental Information (2025).
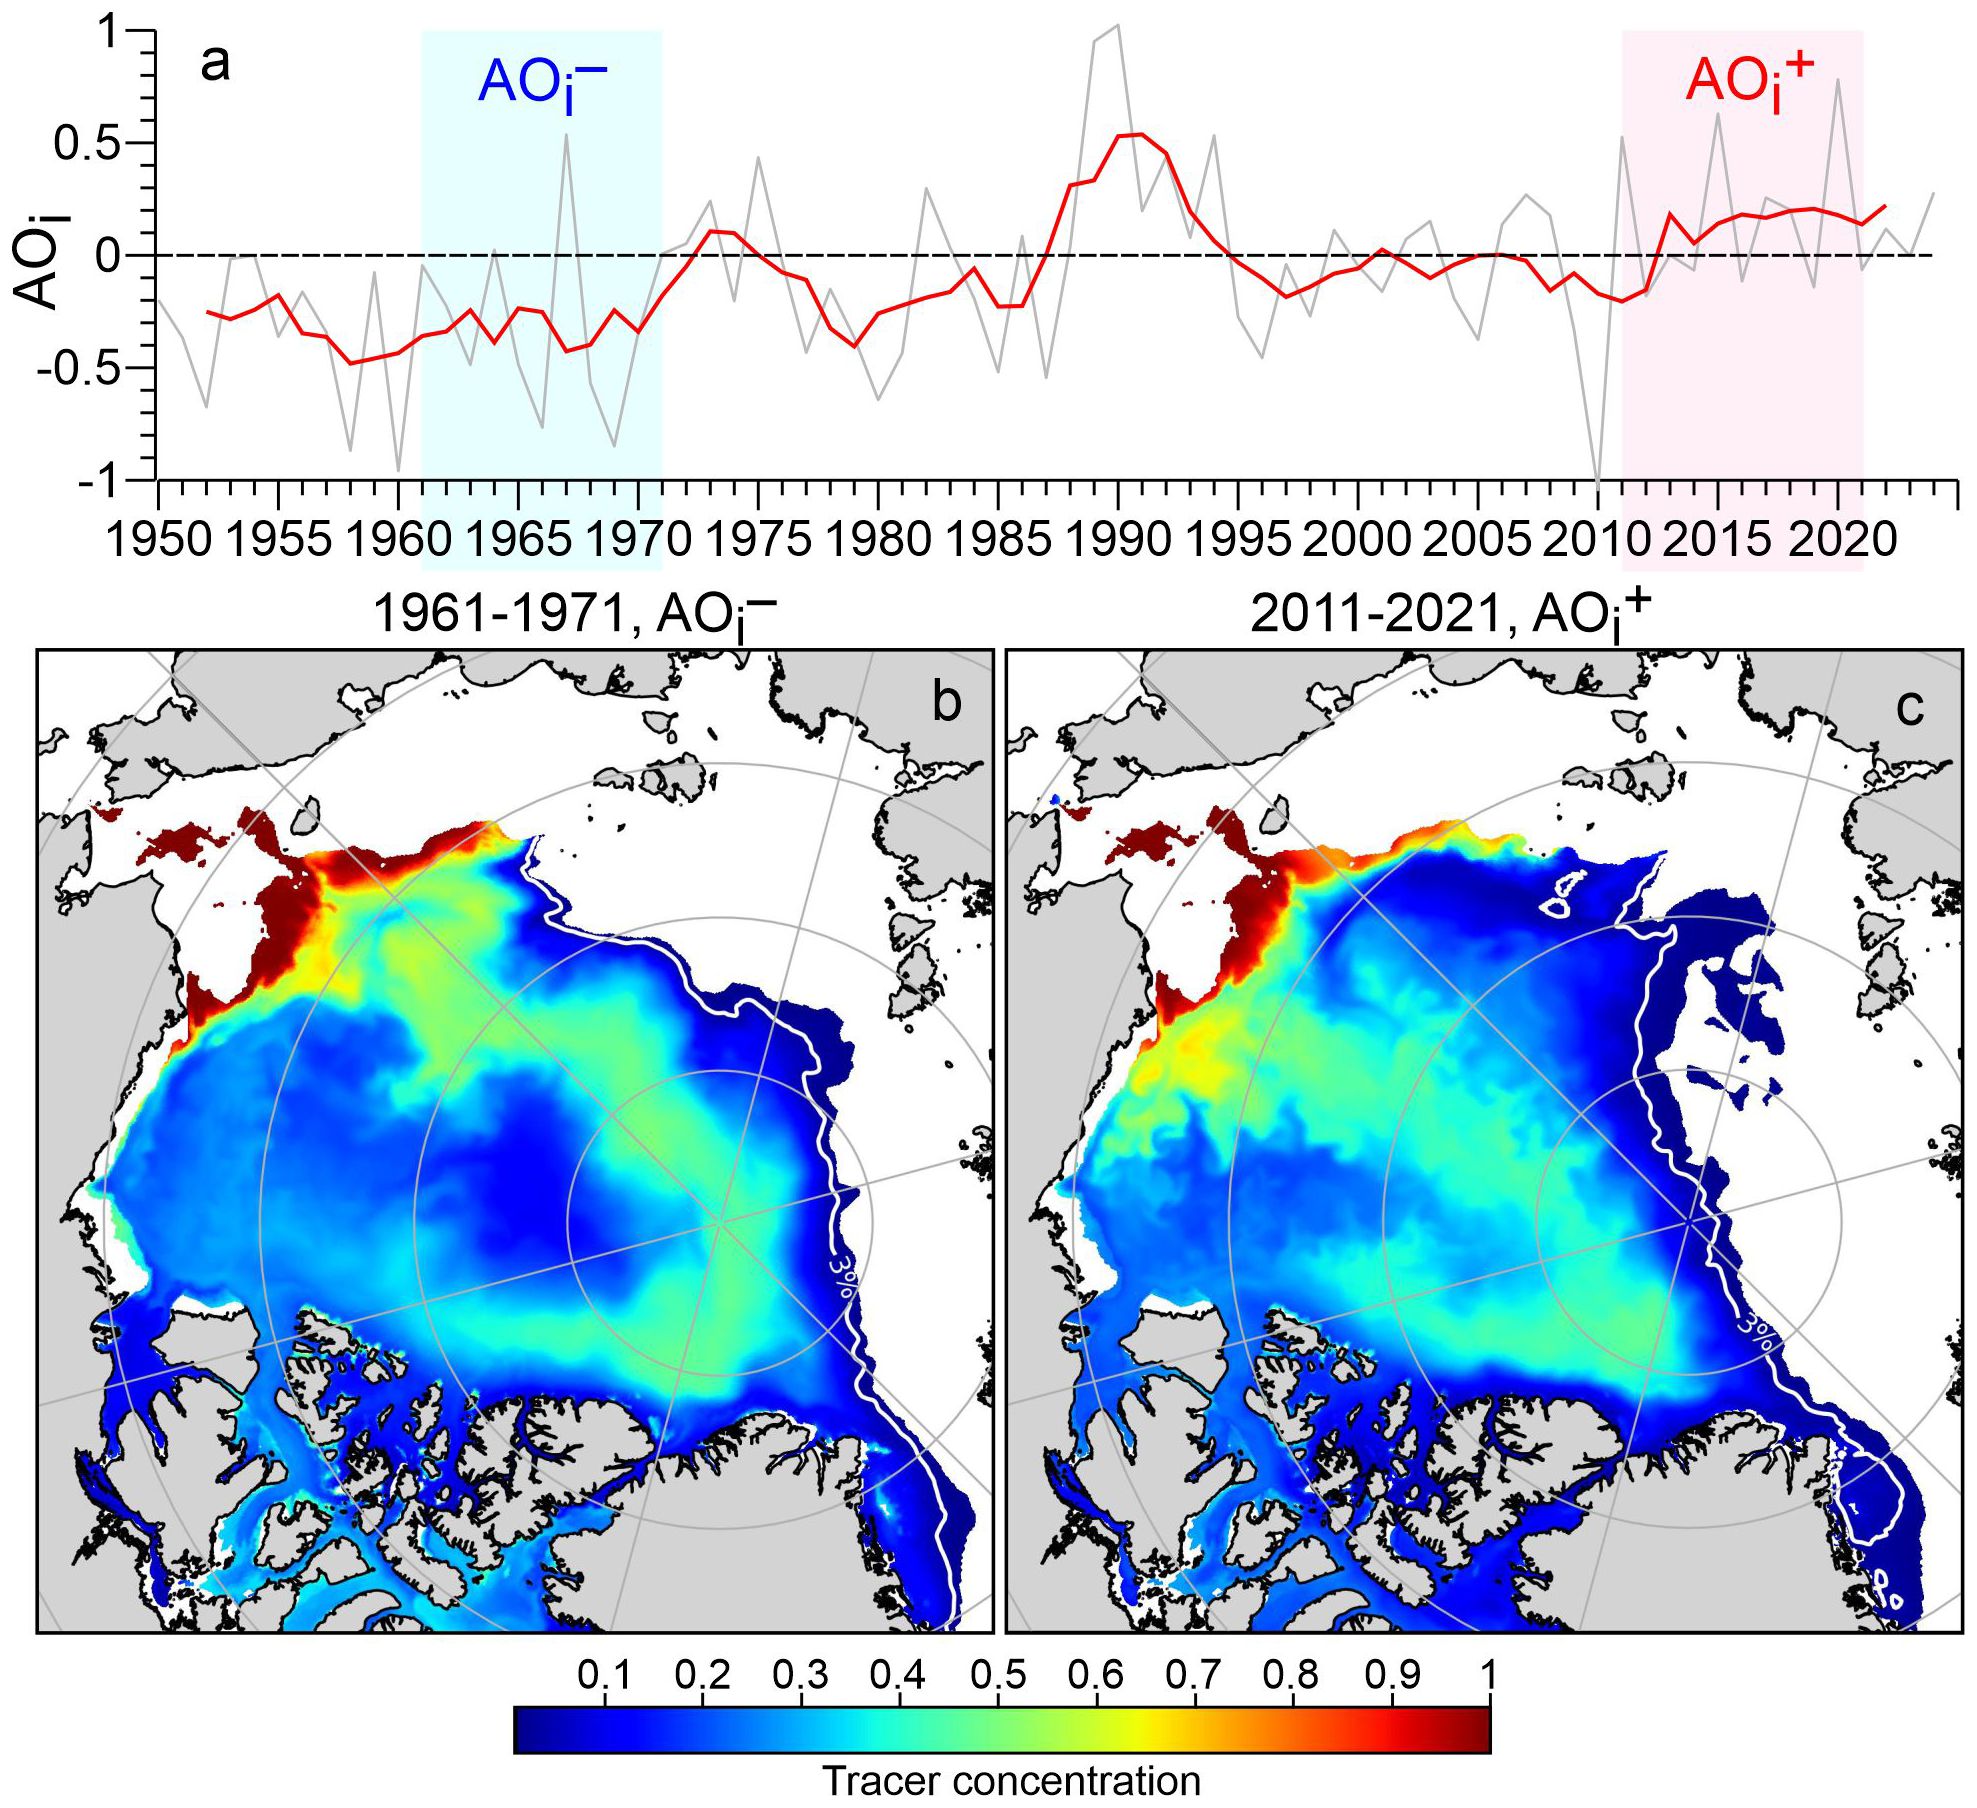
Figure 4. (a) Annual mean AOi anomaly relative to the long-term mean with its 5-year running mean (gray and red lines, respectively). (b, c) Simulated subsurface (50–180 m) mean value of the Bering Strait passive tracer concentration in the last model year for (b) 1961–1971 (negative AOi) and (c) 2011–2021 (positive AOi).
For examining the PW pathways in the AO under different atmospheric forcing, we use the global Finite volumE Sea-ice Ocean Model (FESOM, 2025; Danilov et al., 2017). The model is based on unstructured meshes, which allows the use of variable horizontal resolution. The setup used here has a horizontal resolution of 6 km in the AO, 4 km in the Bering Strait, 2.5 km in the CAA, nominal half degree at the equator and one degree elsewhere. In the NSFS, a 1 km resolution was used. The vertical grid spacing is 2.5 m in the upper 30 m, 5 m for 30–100 m depth and then coarsened with depth – with 76 levels in total. The model was initialized from a rest state and temperature and salinity from PHC3 climatology (Steele et al., 2001). The model was run separately for the periods of 1961–1971 and 2011–2021 with negative and positive AOi, respectively (Figure 4a), following a 3-year spin-up for each simulation. The initial ice conditions for spin-ups are shown in Supplementary Figure S5. We added a passive dye in the Bering Strait after the spin-up period. The tracer was initialized to zero globally and restored to value one in the Bering Strait through the simulations. It experiences the same advection and mixing as temperature and salinity in the simulations. The model was forced by the atmospheric fields from the JRA55-do reanalysis dataset (Tsujino et al., 2018). For spin-ups we used the actual years of JRA55 reanalysis.
3 Results
In August 2024, the water column across the NSFS showed four distinct layers, which are consistent across the entire study area (Figure 2; Supplementary Figure S1). These layers, from top to bottom are described below:
i. 0–45 m: The layer immediately below the sea surface down to ~45 m depth comprises the subsurface halocline conditioned by snow, sea-ice and glacier meltwater influx and solar radiative heating during summer (Figures 2a, b). The subsurface halocline is characterized by a relatively strong vertical salinity gradient with salinity increasing with depth by ~0.07 m–1. Water temperature gradually decreases with depth from ~0°C below the sea surface to –1.2°С at 45 m depth. The exception to this is station 7, which was colder, a feature that we attribute to its position near the ice-covered area at the mouth of Nansen Sound (Figures 1b, 2a).
ii. 45–180 m: A layer with a weaker vertical salinity gradient (0.019 m–1) with salinity increasing from 31.5 at 45 m to 34.1 at 180 m depth underlays the subsurface halocline (Figure 2b). We refer to this layer as PW following its similarity to the Pacific-derived water layer in the adjoining Canada Basin (e.g., Steele et al., 2004; Shimada et al., 2005). In the upper part of this layer, temperature decreases to –1.35°С at 65–75 m depth (Figure 2a), with cooler temperatures observed closer to the mouth of Nansen Sound (Supplementary Figure S1B). The temperature then gradually increases with depth to –0.4°С at 180 m (Figure 2a; Supplementary Figure S1B) indicating the transition to relatively warm Atlantic water (AW).
iii. 180–235 m: Below PW (>180 m depth), temperatures increased steadily through the Atlantic-modified polar water with salinity from 34.1 to 34.5 (Figures 2a,b). The temperatures eventually exceeded 0°C (the commonly accepted upper boundary of the AW) at ~235 m depth, indicating the presence of AW (Figure 2a).
iv. >235 m: AW occupies depths exceeding 235 m. The thermohaline characteristics of AW are spatially uniform over the entire study area (Figures 2a, b). The temperature increases with depth from 0°C at ~235 m to 0.4°C at ~500–520 m depth (Figure 2a). The salinity of AW ranges from 34.5 to 34.8 (Figure 2b). The thermohaline stratification of the deeper portion of the AW layer >400 m depth is weak (Figures 2a, b).
CTD data from March 1976 show higher salinity compared to August 2024 (Figure 2c). The upper ~15 m has the greatest salinity difference, which is largely due to the seasonal features. Freshwater from ice melt and glacial discharge accumulates during summer. In contrast, brine enriched water gains during winter as the ice grows (Figures 2b, c). From ~20 to 45 m depth, salinity in March 1976 exceeds that recorded in August 2024 by up to 1.2 ± 0.25 (Figure 2c), but this can still be explained by seasonal meltwater fluxes. At 45 m depth, salinity in March 1976 already exceeds 32.5 compared to 31.5 in August 2024. The water layer from 60 m to 85 m depth also shows larger salinity relative to August 2024 of ~0.8 ± 0.2 (Figure 2c). This water layer coincides with the temperature minimum observed in August 2024 (Figure 2a; Supplementary Figure S1B). For depths exceeding 100 m, salinity difference between 1976 and 2024 gradually decreases through the Pacific-, Atlantic-modified and AW layers from 0.8 at ~100 m to 0.1 at 450 m depth (Figure 2c). The difference of 0.1 below 450 m depth is likely attributed to lower accuracy of salinity measurements taken in 1976. In terms of temperature, PW in 2024 is ~0.2°C cooler compared to 1976, while the temperature of AW in 2024 is ~0.15°C warmer (Figure 2a). Three stations occupied in Nansen Sound in March 1983 also show saltier PW, however, the magnitude of the salinity deviation is about 0.3–0.4 lower as compared to 1976 (Figure 2b; Supplementary Figure S3B).
Similar to the comparison with data from 1976, CTD data from 1962 also show larger salinity relative to 2024. In August 1962, a salinity of 30 observed at 3–12 m depth is compared to 27.2–28.9 in 2024. Salinities 31 at 21–26 m, 32 at 46–48 m, 33 at 70–78 m, and 34 at 108–132 m depth are compared to 30.4–30.6, 31.6–31.7, 32.5–32.6, and 33.2–33.5 in 2024, respectively (Figure 2b; Supplementary Figure S1A). Overall, for the PW layer between 45–180 m depth, the mean salinity difference between 1962 and 2024 is ~0.5.
4 Discussion
Below we discuss the potential origin of the negative salinity deviation recorded in the NSFS in 2024. We use tracers (CDOM and nitrate) to attribute this lower salinity to a larger fraction of PW. We also put our results into the context of how the PW pathways in the AO shift in response to changes in the large-scale atmospheric circulation.
Winter-to-summer CTD profiles show that seasonal variability impacts the subsurface water layer down to ~50 m depth (Figure 2c). The solar radiative heating and meltwater flux generate seasonal warming and freshening. However, the underlying PW layer remains isolated from the surface due to salinity (density) stratification re-establishing during summer.
We suggest that the lower salinity in 2024 is attributed to inflow of Pacific winter water (PWW). In the adjoining Canada Basin, the upper halocline water with temperatures down to −1.5°С at salinities of ~32–33 (dashed black lines in Figures 2a, b; Supplementary Figures S2, S3), originating from the Chukchi Sea shelf, is usually comprised by PWW (Timmermans et al., 2017). This water is the most common winter product formed during freezing and brine rejection in the Bering and Chukchi Seas (Weingartner et al., 1998; Pickart, 2004). The 32–33 salinity matches the range of the lower salinity recorded in 2024 at 50−105 m depth (Figures 2b, c) assuming that it is explained by injection of PWW. In 1976, this salinity was observed at ~30−60 m, which is likely too shallow to be attributed to PWW.
Our suggestion on the Pacific origin of the lower salinity is confirmed by the PW tracers. CDOM in the Arctic originates predominantly from two sources: (i) terrigenous organic matter primarily attributed to the Eurasian and American continental runoff water (Amon et al., 2003; Stedmon et al., 2011), and (ii) subsurface interactions with organic-rich sediments on the Arctic shelves (Guéguen et al., 2007; Stedmon et al., 2011, 2021). In Figures 3b, c and Supplementary Figure S1C we observe a subsurface maximum in CDOM fluorescence at intermediate salinities between 32 and 33.5, with temperatures near the freezing point. This is consistent with previously documented salinity-CDOM relationships in the Canada Basin, where the CDOM maximum originates from interaction with shelf sediments in the Chukchi Sea during the formation of PWW (Guéguen et al., 2007; Stedmon et al., 2021). The CDOM maximum also corresponds to the depth range of subsurface salinity anomalies in Figure 2c at ~50−105 m.
Further evidence to support the Pacific-origin of the lower salinity is provided by a peak in nitrate concentrations at the same intermediate salinity range as the CDOM maximum (Figure 3d). Similar to CDOM, these high nitrate concentrations result from the interaction of shelf waters with bottom sediments during transport of PW across the Bering and Chukchi shelves (Jones and Anderson, 1986; Cooper et al., 1997). Moreover, the Pacific inflow through Bering Strait itself carries a higher nitrate concentration (Mordy et al., 2020; Zhou et al., 2021). The depth range of the nitrate maximum at ~50−105 m with concentrations from ~18 to >20 mmol m–3 (Figure 3d; Supplementary Figure S1D) consistent with the depth range of salinity deviation in Figure 2c.
Note, however, that CDOM and nitrate cannot be fully treated as conservative tracers. CDOM of the surface layer can be from high primary production (Hill et al., 2013) and may have been slowly mixed downward to the upper portion of the Pacific-derived water layer. Moreover, water below the sub-surface halocline can experience significant nitrate regeneration primarily driven by the breakdown of sinking organic matter and the activity of microbial communities (Granger et al., 2018). However, the combination of tracers used in Figure 3 allow to reduce uncertainty attributed to local biogeochemical processes.
Although the Pacific origin of the subsurface salinity deviation in Figure 2c is obvious, PW in the NSFS does not show the full thermohaline structure usually associated with PW of the Canada Basin. There Pacific summer water (PSW) is usually assigned to temperatures above −1.2°C for salinities between 31 and 32 (Steele et al., 2004), and PWW is defined by salinities between 32 and 33 with temperatures as cold as −1.45°C (Shimada et al., 2005). Here we broadly classified PW as T<–1.3°C and 31.5<S<34.1 (Figures 2, 3), with this range of salinity also corresponding to the CDOM maximum of ~4.25−5 mmol m–3 at 45−180 m depth centered at salinity ~32.8 (Figures 3a, b). The 2024 data show an insignificant amount of PSW (31<S<32 at 37–53 m depth), while the fraction of PWW is excessively thick, warm and saltier indicating interaction with underlying AW (Figures 2a, b, 3c). This structure resembles that observed in Iceberg Bay in 2022 (Supplementary Figure S2), and over the shelf of Ellesmere and Axel Heiberg islands in 1983 (Supplementary Figure S3). In contrast, CTD profile taken in the Prince Gustaf Adolf Sea resembles that of the Canada Basin (Supplementary Figure S3). Overall, this suggests variable modification of PW “en route” to the CAA presumably over the Arctic shelf of the northern CAA.
What is the reason for changes in PW properties over time in the CAA? The PW freshening revealed in the NSFS in 2024 could be linked to increasing volume transport and freshening of the Pacific inflow to the Arctic Ocean from 1990-2019 (Woodgate and Peralta-Ferriz, 2021). This may suggest a role of the Bering Strait for maintaining downstream freshening of PW as recorded in the NSFS. However, Woodgate and Peralta-Ferriz (2021) also reported that this freshening was accompanied by warming. In contrast, in the NSFS the major portion of PW in 2024 was found to be fresher and cooler relative to the 1970s (Figure 2).
We speculate that enhanced invasion of PW in the NSFS seems to be the reason for transformation of the subsurface water properties. The alternation of the PW pathways in the AO can enhance the PW inflow to the CAA. In general, it is conditioned by the large-scale atmospheric circulation over the AO described by the AOi (Figure 4a, Supplementary Figure S4). The AOi’s positive and negative phases are defined by negative and positive anomalies of atmospheric pressure over the Arctic (Figure 4a; Supplementary Figure S4). In general, AOi− conditions a stronger Transpolar Drift that is typically located over the Lomonosov Ridge and advects waters from the Laptev Sea to Fram Strait (Haine et al., 2015). AOi+ strengthens the cyclonic circulation in the Eurasian and Makarov Basins and shifts the Transpolar Drift toward the Canada Basin (Karcher et al., 2012; Timmermans and Marshall, 2020). For idealised atmospheric forcing, using FESOM, Wang et al. (2021) simulated positive and negative freshwater anomalies over the CAA for AOi+ and AOi−, respectively. PW tracer simulations show that for AOi+ the Transpolar branch of the PW flow is displaced toward the Canada Basin (Wang et al., 2021). We also note that the expansion of the cyclonic circulation mode and the shift of the Transpolar Drift toward the Canada Basin in the 2010s were driven by both the positive AOi and Arctic sea ice decline (Wang et al., 2024).
We use FESOM to simulate the response of the Transpolar branch of the PW flow to AOi− conditions in 1961–1971 foregoing observations of 1960s and 1970s, and AOi+ in 2011–2021 preceding our observations in 2024 (Figure 4; Supplementary Figures S4B, D, F). The SLP difference between these two periods was not as large as between AOi+ in 1988–1993 and AOi− in 1976–1981 (Figure 4a; Supplementary Figure S4). However, our simulations captured a similar pattern as revealed by Wang et al. (2021) with a shift of the Transpolar branch to the Canada Basin for AOi+ (Figures 4b, c). It seems that changes in the large-scale atmospheric circulation impact the export gateways of PW from the AO, and the recent switch to a positive phase of AOi (Figure 4a) preconditions an enhanced outflow of cool and less saline PW through the northern CAA.
We also speculate that it is the Transpolar branch of the PW flow that supplies the northern CAA with PW. Simulations show that the Beaufort Sea is fed by the Alaska Coastal current, whereas the northern CAA is fed by the Transpolar current (e.g., Hu and Myers, 2013). The thermohaline modifications of the PWW in the northern CAA compared to that of the Canada Basin (Supplementary Figures S3, S4) and Beaufort Sea (von Appen and Pickart, 2012; Dmitrenko et al., 2016) suggest vertical mixing of PWW with underlying AW. This seems to occur over the shelf and upper continental slope of the northern CAA where the mixing rate is enhanced as suggested by Melling et al. (1984) and Dmitrenko et al. (2023). Longer transit time with the Transpolar branch also contributes to the PW modifications such as the disappearance of the temperature maximum associated with PSW.
Finally, we note that the synoptic, seasonal, interannual, and decadal variability of temperature and salinity in the Arctic Ocean is significant (e.g., Polyakov et al., 2003). This provides uncertainty for interpreting changes observed in 2024 in the context of historic observations.
5 Conclusions
Our data indicate significant freshening of the AO outflow through the straits of the northern CAA between the initial oceanographic survey conducted in 1976 and a recent survey conducted in 2024. This freshening is attributed to changes in the AOi, which in turn influences the pathway of cool, less saline PW water from the AO into the CAA. Simulations show that a positive AOi (cyclonic circulation over the AO) during the period prior to the recent survey shifted the transpolar branch of PW toward the Canada Basin and CAA, thereby promoting PW outflow into the CAA. The opposite situation occurred ahead of the initial survey, with anticyclonic circulation limiting PW outflow into the CAA. Overall, this provides a first glimpse into variability of the CAA oceanography over the last half-century, specifically indicating significant variability of the freshwater flow through the straits of the northern CAA over the inter-decadal time scale.
Data availability statement
The datasets presented in this study can be found in online repositories. The names of the repository/repositories and accession number(s) can be found below: Mendeley Data, V2. https://doi.org/10.17632/695mbhfdsd.2.
Author contributions
ID: Methodology, Supervision, Investigation, Writing – original draft, Conceptualization, Visualization, Formal analysis, Data curation. SK: Conceptualization, Investigation, Methodology, Visualization, Validation, Formal analysis, Writing – review & editing. DB: Data curation, Writing – review & editing. TB: Methodology, Writing – review & editing. QW: Software, Conceptualization, Writing – original draft, Methodology. SD: Conceptualization, Project administration, Writing – review & editing. DD-J: Writing – review & editing, Project administration, Supervision, Funding acquisition.
Funding
The author(s) declare that financial support was received for the research and/or publication of this article. Funding for this work was provided by the Canada Excellence Research Chairs program led by Dorthe Dahl-Jensen.
Acknowledgments
We gratefully acknowledge the Canadian Coast Guard for opportunity to conduct oceanographic observations aboard Des Groseilliers in August 2024. The model simulations were performed at the North-German Supercomputing Alliance.
Conflict of interest
The authors declare that the research was conducted in the absence of any commercial or financial relationships that could be construed as a potential conflict of interest.
The author(s) declared that they were an editorial board member of Frontiers, at the time of submission. This had no impact on the peer review process and the final decision.
Generative AI statement
The author(s) declare that no Generative AI was used in the creation of this manuscript.
Publisher’s note
All claims expressed in this article are solely those of the authors and do not necessarily represent those of their affiliated organizations, or those of the publisher, the editors and the reviewers. Any product that may be evaluated in this article, or claim that may be made by its manufacturer, is not guaranteed or endorsed by the publisher.
Supplementary material
The Supplementary Material for this article can be found online at: https://www.frontiersin.org/articles/10.3389/fmars.2025.1602485/full#supplementary-material.
References
Aksenov Y., Karcher M., Proshutinsky A., Gerdes R., de Cuevas R. B., Golubeva E., et al. (2016). Arctic pathways of Pacific Water: Arctic Ocean Model Intercomparison experiments. J. Geophysical Research: Oceans 121, 27–59. doi: 10.1002/2015JC011299
Amon R. M. W., Budéus G., and Meon B. (2003). Dissolved organic carbon distribution and origin in the Nordic Seas: Exchanges with the Arctic Ocean and the North Atlantic. J. Geophysical Research: Oceans 108, 3221. doi: 10.1029/2002JC001594
Carmack E. C., Yamamoto-Kawai M., Haine T. W. N., Bacon S., Bluhm B. A., Lique C., et al. (2016). Freshwater and its role in the Arctic marine system: sources, disposition, storage, export, and physical and biogeochemical consequences in the Arctic and global oceans. J. Geophysical Research: Biogeosciences 121, 675–717. doi: 10.1002/2015JG003140
CIOOS Pacific Data Catalogue (2025). IOS CTD profile data. Available online at: https://data.cioospacific.ca/erddap/tabledap/IOS_CTD_Profiles.html (Accessed March 5, 2025).
Cooper L. W., Whitledge T. E., Grebmeier J. M., and Weingartner T. (1997). The nutrient, salinity, and stable oxygen isotope composition of Bering and Chukchi Seas waters in and near the Bering Strait. J. Geophysical Research: Oceans 102, 12,563–12,573. doi: 10.1029/97JC00015
Danilov S., Sidorenko D., Wang Q., and Jung T. (2017). The finite-volumE sea ice–ocean model (FESOM2). Geoscientific Model. Dev. 10, 765–789. doi: 10.5194/gmd-10-765-2017
DFO (2020). Identification of ecological significance, knowledge gaps and conservation objectives for the tuvaijuittuq marine protected area (Winnipeg, Manitoba: DFO Canadian Science Advisory Secretariat Science Response). Available online at: https://publications.gc.ca/collections/collection_2021/mpo-dfo/fs70-7/Fs70-7-2020-056-eng.pdf.
Dmitrenko I. and Babb D. (2025). Oceanographic observations in the northern Canadian Arctic Archipelago in August 2024, Mendeley Data, V2. doi: 10.17632/695mbhfdsd.2
Dmitrenko I. A., Kirillov S. A., Forest A., Gratton Y., Volkov D. L., Williams W. J., et al. (2016). Shelfbreak current over the Canadian Beaufort Sea continental slope: Wind-driven events in January 2005. J. Geophysical Research: Oceans 121, 2447–2468. doi: 10.1002/2015JC011514
Dmitrenko I. A., Kirillov S. A., Myers P. G., Forest A., Tremblay B., Lukovich J. V., et al. (2018). Wind-forced depth-dependent currents over the eastern Beaufort Sea continental slope: implications for Pacific water transport. Elementa: Sci. Anthropocene 6, 66. doi: 10.1525/elementa.321
Dmitrenko I. A., Kirillov S. A., Rudels B., Geilfus N.-X., Ehn J., Babb D. G., et al. (2023). Modification of Pacific water in the northern Canadian Arctic. Front. Mar. Sci. 10. doi: 10.3389/fmars.2023.1181800
FESOM (2025). Finite-element/volume sea ice-ocean model. Available online at: https://fesom.de/ (Accessed March 11, 2025).
Fissel D. B., Cuypers L., Lemon D. D., Birch J. R., Cornford A. B., Lake R. A., et al. (1983). Arctic data compilation and appraisal. Volume 6. Queen elizabeth islands: physical oceanography - temperature, salinity, currents and water levels Vol. 5 (Sidney, B.C.: Canadian Data Report on Hydrography and Ocean Science, Dept. of Fisheries and Oceans), 214. Available online at: https://publications.gc.ca/collections/collection_2015/mpo-dfo/Fs97-16-5-6-eng.pdf.
Fol M., Tremblay B., Pfirman S., Newton R., Howell S., and Lemieux J.-F. (2025). Revisiting the Last Ice Area projections from a high-resolution Global Earth System Model. Commun. Earth Environ. 6, 46. doi: 10.1038/s43247-025-02034-5
Ford L. and Hattersley-Smith G. (1965). On the oceanography of the Nansen sound fiord system. Arctic 18, 149–204. doi: 10.14430/arctic3465
Frozen Sea Research Group (1976). Oceanographic data report. D’Iberville Fiord, Greely Fiord, Eureka Sound. Ellesmere Island, N.W.T. March 1976 (Patricia Bay, Victoria, B.C.: Pacific Marine Science Report, Institute of Ocean Sciences). Available online at: https://waves-vagues.dfo-mpo.gc.ca/library-bibliotheque/54847.pdf.
Granger J., Sigman D. M., Gagnon J., Tremblay J. E., and Mucci A. (2018). On the properties of the Arctic halocline and deep water masses of the Canada Basin from nitrate isotope ratios. J. Geophysical Research: Oceans 123, 5443–5458. doi: 10.1029/2018JC014110
Guéguen C., Guo L., Yamamoto-Kawai M., and Tanaka N. (2007). Colored dissolved organic matter dynamics across the shelf-basin interface in the western Arctic Ocean. J. Geophysical Research: Oceans 112, C05038. doi: 10.1029/2006JC003584
Haine T. W. N., Curry B., Gerdes R., Hansen E., Karcher M., Lee C., et al. (2015). Arctic freshwater export: Status, mechanisms, and prospects. Global Planetary Change 125, 13–35. doi: 10.1016/j.gloplacha.2014.11.013
Hattersley-Smith G. (1968). Canadian operation “Hazen-tanquary. Polar Rec. 14, 194–197. doi: 10.1017/S0032247400056655
Hersbach H., Bell B., Berrisford P., Hirahara S., Horányi A., Muñoz-Sabater J., et al. (2020). The ERA5 global reanalysis. Q. J. R. Meteorological Soc. 146, 1999–2049. doi: 10.1002/qj.3803
Hill V. J., Matrai P., Olson E., Suttle S., Steele M., Codispoti L., et al. (2013). Synthesis of integrated primary production in the Arctic Ocean: II. In situ and remotely sensed estimates. Prog. Oceanography 110, 107–125. doi: 10.1016/j.pocean.2012.11.005
Hu X. and Myers P. G. (2013). A Lagrangian view of Pacific water inflow pathways in the Arctic Ocean during model spin-up. Ocean Model. 71, 66–80. doi: 10.1016/j.ocemod.2013.06.007
Jones E. P. (2001). Circulation in the arctic ocean. Polar Res. 20, 139–146. doi: 10.1111/j.1751-8369.2001.tb00049.x
Jones E. P. and Anderson L. G. (1986). On the origin of the chemical properties of the Arctic Ocean halocline. J. Geophysical Research: Oceans 91, 10,759–10,767. doi: 10.1029/JC091iC09p10759
Karcher M., Smith J. N., Kauker F., Gerdes R., and Smethie J. W.M. (2012). Recent changes in Arctic Ocean circulation revealed by iodine-129 observations and modeling. J. Geophysical Research: Oceans 117, C08007. doi: 10.1029/2011JC007513
Kelly S. J., Popova E., Aksenov Y., Marsh R., and Yool A. (2020). They came from the Pacific: How changing Arctic currents could contribute to an ecological regime shift in the Atlantic Ocean. Earth’s Future 8, e2019EF001394. doi: 10.1029/2019EF001394
Lewis E. L. (1980). The practical salinity scale 1978 and its antecedents. IEEE J. Oceanic Eng. OE-5, 13–18. doi: 10.1109/JOE.1980.1145448
Melling H., Lake R. A., Topham D. R., and Fissel D. B. (1984). Oceanic thermal structure in the western Canadian Arctic. Continental Shelf Res. 3, 233–258. doi: 10.1016/0278-4343(84)90010-4
Mordy C. W., Bell S., Cokelet E. D., Ladd C., Lebon G., Proctor P., et al. (2020). Seasonal and interannual variability of nitrate in the eastern Chukchi Sea: transport and winter replenishment. Deep Sea Res. Part II 177, 104807. doi: 10.1016/j.dsr2.2020.104807
National Centers for Environmental Information (2025). Monthly mean Arctic Oscillation index. Available online at: https://www.cpc.ncep.noaa.gov/products/precip/CWlink/daily_ao_index/monthly.ao.index.b50.current.ascii.table (Accessed March 5, 2025).
Pickart R. S. (2004). Shelfbreak circulation in the Alaskan Beaufort Sea: mean structure and variability. J. Geophysical Research: Oceans 109, C0424. doi: 10.1029/2003JC001912
Polyakov I., Walsh D., Dmitrenko I., Colony R. L., and Timokhov L. A. (2003). Arctic Ocean variability derived from historical observations. Geophysical Res. Lett. 30, 1298. doi: 10.1029/2002GL016441
Rudels B. (2012). Arctic Ocean circulation and variability – advection and external forcing encounter constraints and local processes. Ocean Sci. 8, 261–286. doi: 10.5194/os-8-261-2012
Shimada K., Itoh M., Nishino S., McLaughlin F., Carmack E., and Proshutinsky A. (2005). Halocline structure in the Canada basin of the Arctic Ocean. Geophysical Res. Lett. 32, L03605. doi: 10.1029/2004GL021358
Stedmon C. A., Amon R. M. W., Bauch D., Bracher A., Gonçalves-Araujo R., Hoppmann M., et al. (2021). Insights into water mass origins in the central Arctic Ocean from in-situ dissolved organic matter fluorescence. J. Geophysical Research: Oceans 126, e2021JC017407. doi: 10.1029/2021JC017407
Stedmon C. A., Amon R. M. W., Rinehart A. J., and Walker S. A. (2011). The supply and characteristics of colored dissolved organic matter (CDOM) in the Arctic Ocean: Pan Arctic trends and differences. Mar. Chem. 124, 108–118. doi: 10.1016/j.marchem.2010.12.007
Steele M., Morison J., Ermold W., Rigor I., Ortmeyer M., and Shimada K. (2004). Circulation of summer Pacific halocline water in the Arctic Ocean. J. Geophysical Research: Oceans 109, C02027. doi: 10.1029/2003JC002009
Steele M., Morley R., and Ermold W. (2001). PHC: A global ocean hydrography with a high-quality Arctic Ocean. J. Climate 14, 2079–2087. doi: 10.1175/1520-0442(2001)014<2079:PAGOHW>2.0.CO;2
Timmermans M.-L. and Marshall J. (2020). Understanding Arctic Ocean circulation: A review of ocean dynamics in a changing climate. J. Geophysical Research: Oceans 125, e2018JC014378. doi: 10.1029/2018JC014378
Timmermans M.-L., Marshall J., Proshutinsky A., and Scott J. (2017). Seasonally derived components of the Canada Basin halocline. Geophysical Res. Lett. 44, 5008–5015. doi: 10.1002/2017GL073042
Toole J. M. and Krishfield R. (2016). Oceanographic profile observations collected from station ITP-63 by Woods Hole Oceanographic Institution (WHOI) in the Arctic Ocean from 2012-04–22 to 2013-10-18 (NCEI Accession 0157186), Woods Hole Oceanographic Institution Ice-Tethered Profiler Program. NOAA National Centers for Environmental Information (2016). doi: 10.7289/v5mw2f7x
Toole J. M., Krishfield R. A., Timmermans M.-L., and Proshutinsky A. (2011). The ice-tethered profiler: Argo of the Arctic. Oceanography 24, 126–135. doi: 10.5670/oceanog.2011.64
Tsujino H., Urakawa S., Nakano H., Small R. J., Kim W. M., Yeager S. G., et al. (2018). JRA-55 based surface dataset for driving ocean–sea-ice models (JRA55-do). Ocean Modeling 130, 79–139. doi: 10.1016/j.ocemod.2018.07.002
von Appen W.-J. and Pickart R. S. (2012). Two configurations of the Western Arctic Shelfbreak current in summer. J. Phys. Oceanography 42, 329–351. doi: 10.1175/JPO-D-11-026.1
Wang Q. and Danilov S. (2022). A synthesis of the upper arctic ocean circulation during 2000–2019: understanding the roles of wind forcing and sea ice decline. Front. Mar. Sci. 9. doi: 10.3389/fmars.2022.863204
Wang Q., Danilov S., Sidorenko. D., and Wang X. (2021). Circulation pathways and exports of arctic river runoff influenced by atmospheric circulation regimes. Front. Mar. Sci. 8. doi: 10.3389/fmars.2021.707593
Wang Q., Shu Q., and Wang F. (2024). Recent emergence of Arctic atlantification dominated by climate warming. Sci. Adv. 10, eadq5235. doi: 10.1126/sciadv.adq5235
Weingartner T., Cavalieri D., Aagaard K., and Sasaki Y. (1998). Circulation, dense water formation, and outflow on the northeast Chukchi shelf. J. Geophysical Research: Oceans 103, 7647–7661. doi: 10.1029/98JC00374
Woodgate R. (2013). Arctic Ocean circulation: going around at the top of the world. Nat. Educ. Knowledge 4, 8.
Woodgate R. and Peralta-Ferriz C. (2021). Warming and freshening of the pacific inflow to the arctic from 1990–2019 implying dramatic shoaling in pacific winter water ventilation of the arctic water column. Geophysical Res. Lett. 48, e2021GL092528. doi: 10.1029/2021GL092528
Zhang J., Weijer W., Steele M., Cheng W., Verma T., and Veneziani M. (2021). Labrador Sea freshening linked to Beaufort Gyre freshwater release. Nat. Commun. 12, 1229. doi: 10.1038/s41467-021-21470-3
Keywords: Canadian Arctic Archipelago (CAA), Pacific-modified polar water, Pacific water tracers, Pacific water pathways, multidecadal variability
Citation: Dmitrenko IA, Kirillov SA, Babb DG, Burgers T, Wang Q, Danilov S and Dahl-Jensen D (2025) Following a half-century oceanographic data gap in the northern Canadian Arctic Archipelago: multidecadal variability of the Pacific water throughflow. Front. Mar. Sci. 12:1602485. doi: 10.3389/fmars.2025.1602485
Received: 29 March 2025; Accepted: 10 July 2025;
Published: 29 July 2025.
Edited by:
Youyu Lu, Bedford Institute of Oceanography (BIO), CanadaReviewed by:
Tien Anh Tran, Seoul National University, Republic of KoreaMargot Debyser, Woods Hole Oceanographic Institution, United States
Copyright © 2025 Dmitrenko, Kirillov, Babb, Burgers, Wang, Danilov and Dahl-Jensen. This is an open-access article distributed under the terms of the Creative Commons Attribution License (CC BY). The use, distribution or reproduction in other forums is permitted, provided the original author(s) and the copyright owner(s) are credited and that the original publication in this journal is cited, in accordance with accepted academic practice. No use, distribution or reproduction is permitted which does not comply with these terms.
*Correspondence: Igor A. Dmitrenko, aWdvci5kbWl0cmVua29AdW1hbml0b2JhLmNh