 Hailey G. Bond1*
 Meagan E. Wengrove1
 Chris E. Blenkinsopp2
 Paul M. Bayle3George M. Kaminsky4Jonathan C. Allan5David R. Michalsen6
 Kayla S. Ostrow1Hans Rod Moritz7
- 1Department of Civil and Construction Engineering, Oregon State University, Corvallis, OR, United States
- 2Department of Architecture and Civil Engineering, University of Bath, Bath, United Kingdom
- 3Department of Hydraulic Engineering, Delft University of Technology, Delft, Netherlands
- 4Washington State Department of Ecology, Olympia, WA, United States
- 5Oregon State Department of Geology and Mineral Industries, Newport, OR, United States
- 6Seattle District, U.S. Army Corps of Engineers, Seattle, WA, United States
- 7Portland District, U.S. Army Corps of Engineers, Portland, OR, United States
Chronic coastal erosion is a recurring issue that threatens the built environment and the stability of public beaches. Dynamic cobble berm revetments, which replicate natural composite beaches, are a possible option for nature-based erosion mitigation on high-energy coastlines. Dynamic cobble berm revetments are composed of a sandy foreshore and an engineered cobble berm, which evolves over time while dissipating wave energy. While dynamic cobble berm revetment projects have been constructed over the past two decades, there remains a lack of engineering guidance for many aspects of their design. In this study, we summarize the current state of the practice for the design of dynamic cobble berm revetments. We first present a review of tools that have been used for dynamic cobble berm revetment design, including their basic assumptions and potential limitations. Following, we summarize the design and performance of five dynamic cobble berm revetment projects on the outer coast of the Pacific Northwest, USA, as case studies. Based on the findings of the first two sections, an informal survey of local practitioners, and the knowledge of the author group, we propose a design process for dynamic cobble berm revetments. The design process is not prescriptive, rather, it is intended to give engineers a framework to apply existing tools until the body of dynamic revetment research can support a more prescriptive design guidance. Finally, we evaluate our confidence in the suggestions and tools in the design process, so that engineers and other practitioners can understand the limitations of the current state of the practice.
1 Introduction
Coastal erosion and associated ecosystem degradation worldwide is expected to increase in severity with sea level rise and increased storminess (e.g., Luijendijk et al., 2018; Mentaschi et al., 2018; Vitousek et al., 2017). Given the need to enhance coastal resilience while preserving ecosystem services, there is significant interest in infrastructure that makes use of natural processes and has ecosystem benefits in addition to providing coastal protection (Bridges et al., 2021). Composite beaches occur around the world, including (but not limited to) the United Kingdom (Blenkinsopp et al., 2022), New Zealand (Jennings and Shulmeister, 2002), Europe (Casamayor et al., 2022), Canada (LeRoux et al., 2024), and the United States (Allan et al., 2005). Observations of natural composite beaches have shown that they are relatively stable, with little erosion observed in the backshore (Allan et al., 2005). Recently, there has been a focus on mimicking these composite beaches as a nature-based solution to mitigate coastal erosion, especially in the high-energy Pacific Northwest (PNW) coast of the United States.
Composite beaches typically have a gently-sloping sandy foreshore backed by a steep cobble berm (Jennings and Shulmeister, 2002). On composite beaches, the sandy foreshore and cobble berm are visually well separated, in contrast to mixed-grain beaches. In the PNW, the sandy foreshores of a composite beaches are dissipative, with slopes typically around 25H:1V or flatter, while the backshore cobble berms have slopes typically around 7H:1V – 4H:1V (Allan et al., 2005). Although the cobble portion of a composite beach evolves under wave collision, the cobbles are naturally maintained along the backshore by swash processes. Swash uprush is stronger than swash backwash, so cobbles have a tendency for landward transport, deposition, and accumulation on the backshore berm (Masselink and Li, 2001; Austin and Masselink, 2006a).
The engineered analogue to a composite beach is known as a dynamic cobble berm revetment. Other names for dynamic cobble berm revetments include “cobble berms”, “engineered cobble berms”, or “dynamic revetments,” depending on the audience and location. We will use the term “dynamic revetment” in this manuscript for simplicity, and will share our suggestions for naming practices in Section 5. Both laboratory studies and field studies have shown that dynamic revetments can be effective for erosion mitigation (Allan et al., 2004, 2023; Allan and Gabel, 2016; Bayle et al., 2023, 2021; Komar and Allan, 2009; Weiner et al., 2019; Bayle et al., 2020; Blenkinsopp et al., 2022; Foss et al., 2023). Dynamic revetments are typically placed along high-energy coastlines where composite beaches naturally exist and beach nourishment is not a viable solution to coastal erosion. Dynamic revetments have been constructed around the world, including the PNW (see Section 5), California (ESA, 2016; Winters et al., 2020), Canada, New Zealand, the Netherlands, and the United Kingdom (see Bayle et al., 2020 for a partial review). Observations have shown that dynamic revetments typically lose negligible volumes of cobble offshore (Allan et al., 2006; Bayle et al., 2020; Foss et al., 2023), may build elevation at the crest (Ahrens, 1990; Foss et al., 2023), are resilient to sea level rise when designed with accommodation space (Bayle et al., 2020) and sufficient volume. Additionally, studies of constructed projects in the PNW have shown that the placement of dynamic revetments can significantly reduce erosion rates (Allan and Gabel, 2016; Weiner et al., 2019). While it is expected that the profile of dynamic revetments will be reshaped by waves, the initial design of dynamic revetments often looks like the schematic and pictures in Figure 1. Typical design parameters may include the front slope of the cobble, design toe and crest elevations, a crest width, and a design cobble volume. The size and gradation of rock is also typically specified.
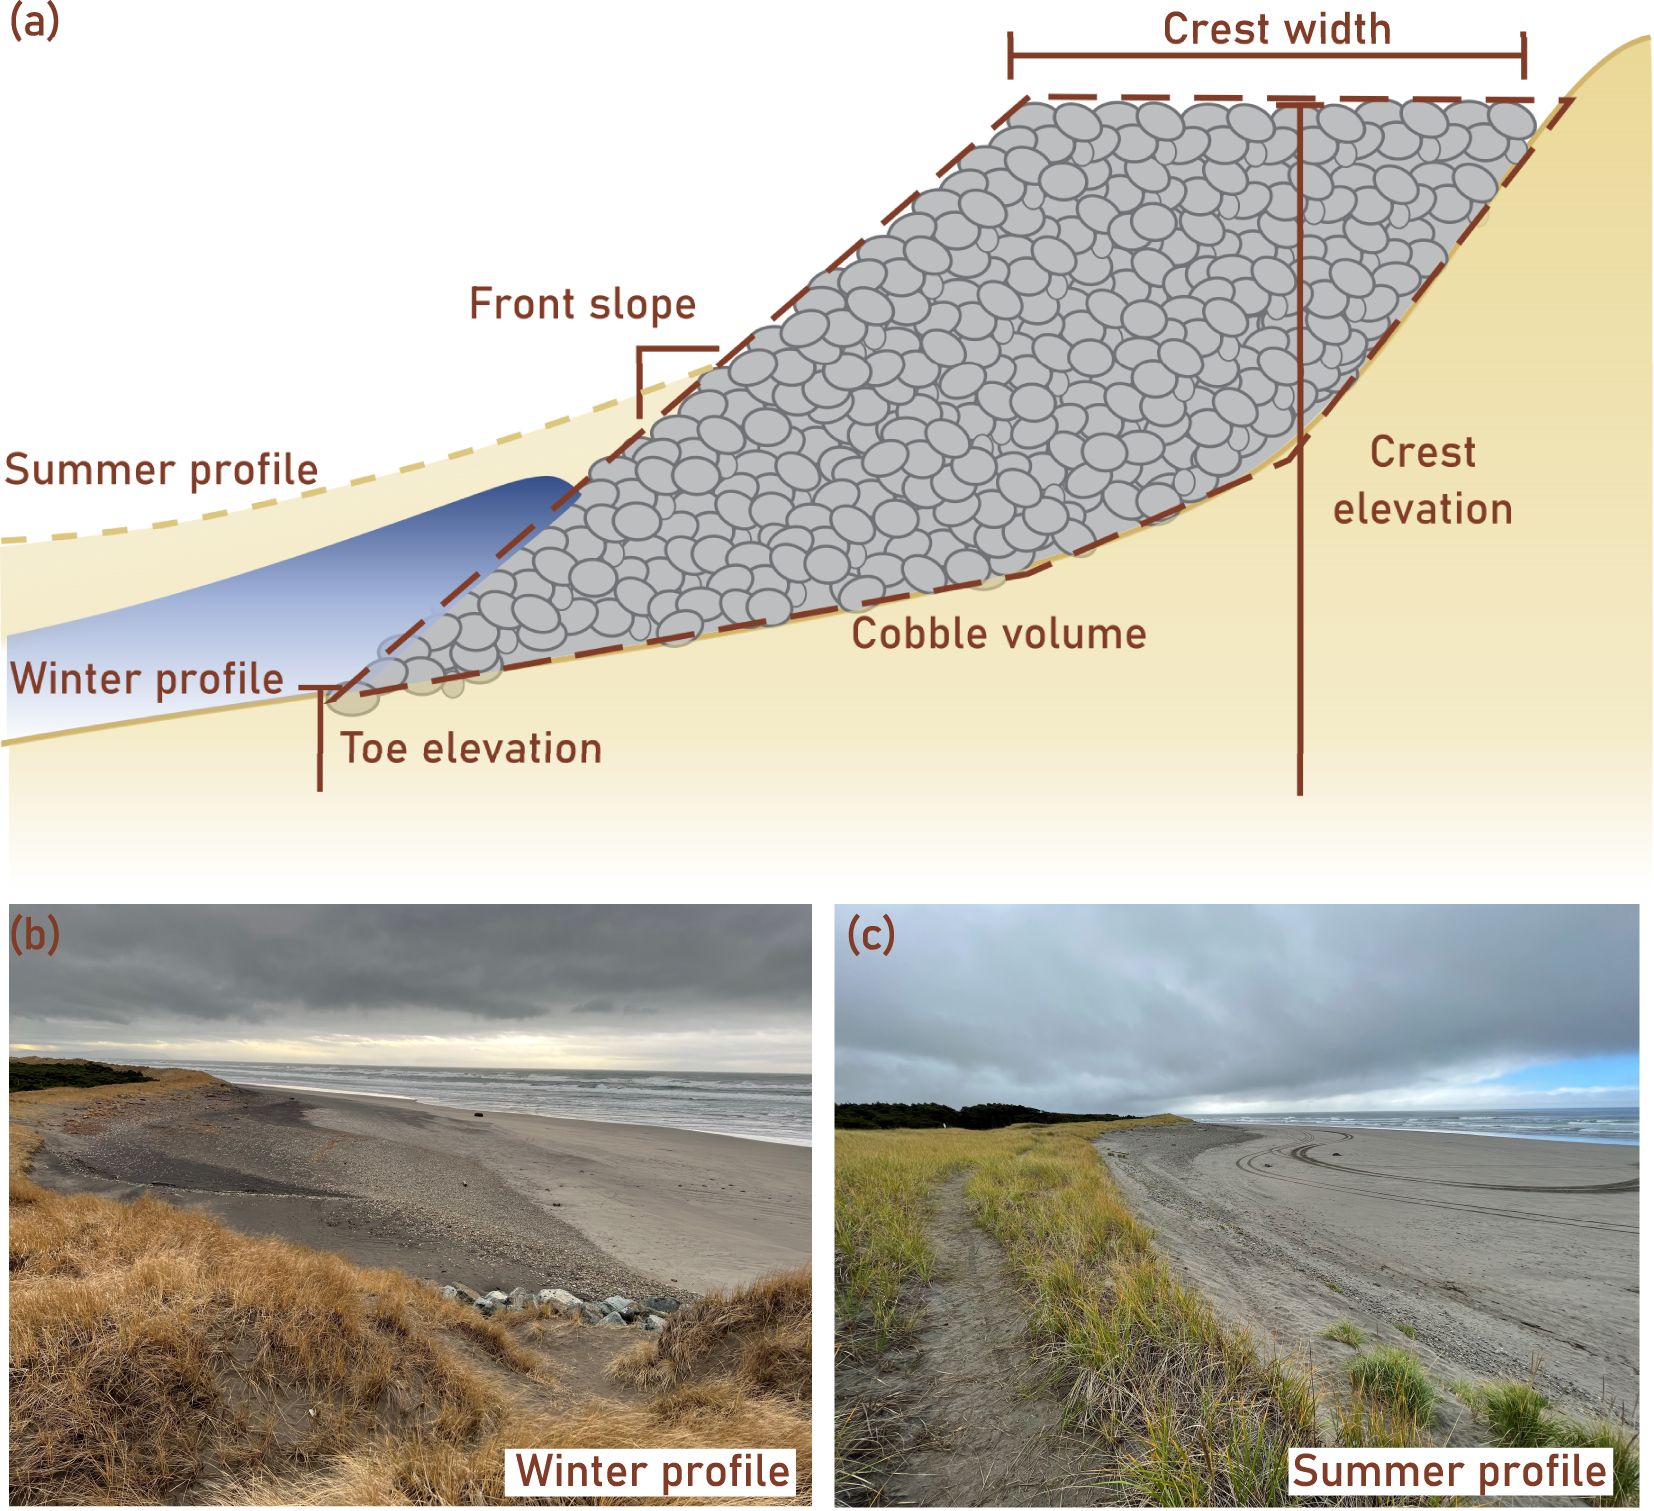
Figure 1. (a) Schematic of a typical dynamic cobble berm revetment cross-section under wave collision, with important design parameters identified. (b, c) Photos from the Mouth of the Columbia River: South Jetty project (See Section 3.2 for more details) of a dynamic revetment during the winter and summer, respectively.
Although dynamic revetment projects have been constructed, reporting of systematic and long-term monitoring of existing projects is generally lacking. Furthermore, while some preliminary guidelines for dynamic revetment design have been proposed in recent studies (Allan et al., 2005; Bayle et al., 2020, 2021; Foss et al., 2023), there remains no holistic engineering guidance for design, construction, and maintenance of dynamic revetments. The combination of these lacking resources may reduce the implementation of dynamic revetments for coastal protection by coastal property owners, local governments, and permitting agencies.
Despite hesitation regarding the implementation of dynamic revetments, there are reasons they may be a good choice for coastal protection. Dynamic revetments can be used instead of riprap and seawalls, both of which can lead to beach narrowing (Ruggiero and McDougal, 2001; Griggs, 2005). They are typically considered “soft” or “nature-based” structures, and their dynamic nature is anticipated to mitigate some of the adverse effects of static structures. In some locations, dynamic revetments replicate nearby natural beach types, and may be a preferred option because they fit in with their surroundings (Allan et al., 2005). In contrast to hard structures, which are always a “hold-the-line” solution, dynamic revetments can be used for a range of purposes, from protecting fixed infrastructure (US Army Corps of Engineers Portland District, 2013) as an interim solution while planning for other coastal management options (Blue Coast Engineering LLC, 2021), or to simply slow the erosion rate. Dynamic revetments are also often less expensive than alternatives such as riprap revetments and seawalls (Allan et al., 2005), and can be used to protect short stretches of coastline when regional-scale coastal erosion mitigation is financially or logistically impossible (Bond, 2021).
In this review, we summarize the best available science for engineers, coastal geomorphologists, and other practitioners who may participate in the design, construction, and implementation of dynamic revetments. We also aim to accurately summarize the potential benefits, drawbacks, and uncertainties of dynamic revetment implementation. There are many open scientific and engineering questions about the performance of these structures and no previous engineering guidance; therefore, our intention is to give engineers a framework to apply existing information rather than a prescriptive design process. The sections of the manuscript are connected, but self-contained, so readers can focus on the sections most relevant for their needs. In Section 2, we cover the state of the existing tools for dynamic revetment design, including potentially applicable tools from fields such as gravel beach research and traditional coastal infrastructure design methods. In Section 3, we review five projects in the PNW and present their design process, maintenance plan, and performance since construction. In Section 4, based on the information summarized in this paper and on the results of an informal practitioner survey, we propose a general and non-prescriptive design process for dynamic revetments and evaluate our confidence in the tools available for each proposed step of the design. The design process includes suggestions for both the initial design and the implementation of an adaptive management framework (i.e., a maintenance program that adapts to changes in the feature being managed). Finally, we conclude by suggesting persistent gaps in knowledge for dynamic cobble berm revetments as a nature-based coastal erosion mitigation measure. It should be noted that while we focus on projects implemented in the PNW in this manuscript because of contrasting design priorities and outcomes despite similar forcing conditions, the information and design process are applicable to other high-energy (defined here as a Dean number > 20) (Wright and Short, 1984), open-coast (defined here as non-estuarine and non-lacustrine), macro- and mesotidal beaches. The concepts discussed in this manuscript are also applicable to lower-energy systems, and have already been applied there (Johannessen, 2001; Boehlert et al., 2012; Coven et al., 2015); however, appropriate alterations to the design process and recommendations may be necessary.
2 Existing design tools
The design of dynamic revetments has important differences from traditional coastal structures. Dynamic revetments are expected to evolve over time; therefore, engineers must design the initial shape of the revetment while also anticipating the changes that will take place as the structure evolves. Some of the parameters that engineers may need to design dynamic revetments are the following: cobble size, cobble shape, cobble gradation, crest height, slope, toe elevation, and cobble volume. However, few studies have examined these parameters on dynamic revetments. In this section, we discuss the available design tools and guidance for both the initial design parameters and for prediction of the dynamic evolution of the revetment. Some of these tools come from specific dynamic revetment studies, but many of them are from other fields, including the study of traditional static revetments and gravel beaches. All equations are defined in the Supplementary Material (Supplementary Section 2).
To decide which tools to include in this review, we first included all tools that have been used in the design of each of the five projects presented in Section 3. These tools were not all specific to dynamic revetments, but we confirmed that each of the tools were relevant. Tools were only considered relevant if they involved dynamic cobble or gravel movement and interaction with swash. In addition, we used Google Scholar to search for papers using the search terms “composite beach,” “dynamic revetment,”, and “cobble berm.” From the peer-reviewed publications that resulted, we removed any that did not fit the Jennings and Shulmeister (2002) definition of a composite beach, and included all of the remaining papers that provided any engineering recommendations relevant for dynamic revetments as defined in this study. Non peer-reviewed articles were included as needed if the information was crucial and could not be found elsewhere.
2.1 Design parameters
2.1.1 Cobble specifications
There are several possible tools for specifying cobble size, including laboratory and field studies. However, cobble sourcing and cost may also play a role in the determination of the cobble size and shape used for a particular project.
Several studies and manuals (e.g., CIRIA, 2007; van der Meer and Pilarczyk, 1986) define different stability regimes for berms made purely of rock or cobble (i.e., without sand) based on a ratio of the mobilizing force (wave height) to stabilizing force (grain size). A stability number of 1 indicates that the rock never moves, and a stability number of 500 indicates that the rock moves regularly. By choosing a range of stability numbers appropriate for the project, a D50 of cobble could be chosen for the given wave climate. However, it should be noted that these equations and stability numbers are empirical, were developed for berm breakwaters, and may have limitations when applied to dynamic revetments.
Another strategy for choosing cobble size is proposed in Lorang (2000), which incorporates stone properties and runup characteristics to determine the critical threshold mass and minimum stable stone size. Their equations were tested on field data from several boulder beaches in New South Wales, Australia with a D50 of 388 mm (Oak, 1984, 1986) and provided adequate agreement (within a factor of 2-3) for waves less than 2 m in height, and had good agreement (within a factor of 2) for waves higher than 4.25 m. For dynamic revetments, where cobble is expected to be mobile, the equations could be used to provide an upper limit for cobble size based on the threshold of motion and minimum stable mass.
In Oregon, Allan et al. (2005) analyzed natural composite beaches to develop design recommendations for dynamic revetments. They found that mean grain sizes existing on naturally occurring composite beaches ranged from 30 mm – 128 mm, and therefore recommended using particles with a mean grain size of 64 mm for the construction of dynamic revetments in the PNW.
Several studies have also provided suggestions on the specifications of the cobble needed to create a successful dynamic revetment. Bayle et al. (2020) used well sorted, rounded cobbles with a D50 of 63 mm and a D85/D15 ratio of 1.32 in their laboratory experiment and observed erosion of sand beneath the revetment. Foss et al. (2023) suggested that the sand erosion observed by Bayle et al. (2020) was a result of the well sorted cobble not forming a filter layer of small gravel beneath the structure. Foss et al. (2023) suggested, therefore, that using poorly sorted angular or subangular material (such as a D85/D15 ratio of 3.79 in their experiment) will preserve more sand beneath the structure through the formation of a filter layer, which has been observed in the field on a poorly-sorted subangular dynamic revetment by Bayle et al. (2021). Foss et al. (2023) also found that poorly sorted angular or subangular material led to a higher crest elevation than the well sorted, rounded material used in Bayle et al. (2020).
Angular cobble placed on the beach should be expected to round over time; however, the rate at which angular cobbles will round is site-specific, rock-type specific, and uncertain. Based on observations of the rounding of basaltic jetty haul road material from angular to subangular after 2 years at the South Jetty of the Columbia River, angular cobbles at the South Jetty dynamic revetment were expected to become rounded in 2–5 years (US Army Corps of Engineers Portland District, 2013; Allan and Gabel, 2016). However, that estimate was not evaluated for the cobble making up the dynamic revetment.
Another consideration for cobble characteristics is source and cost. Allan et al. (2005) evaluated options for cobble sourcing and found that cobble-sized material was not typical for quarries; rock was typically either crushed and screened to smaller sizes (less than 76 mm) or kept as riprap-sized rocks. There were some quarries that produced unscreened (pit-run or quarry-run) material that may be suitable; however, the presence of fines within the material should be taken into account. In Oregon, Allan et al. (2005) identified that most coastal project sites were within 30 miles of a quarry capable of producing suitable cobble if angular cobble was acceptable. However, sources for rounded rock were more difficult to identify, and had additional logistical concerns. Difficulties in the acquisition of rounded cobble can also lead to higher unit costs, so angular cobble may be a more cost-effective material.
2.1.2 Runup and crest height
The expected wave runup may be used to set the crest height of the revetment. Until recently, there have been no runup equations specifically for composite beaches. However, some runup equations have features that could make them applicable for composite beaches. For instance, van Gent (1999, 2001) used a scale laboratory experiment to study the runup on dikes with shallow foreshores. van Gent (1999, 2001) used an effective surf similarity parameter and the spectral wave period to account for the change in the wave spectra as it transformed over a shallow foreshore, allowing them to predict runup on the steep slope. The results of van Gent (1999, 2001) were incorporated into the runup equations in van der Meer (2002) and the EurOtop manual (van der Meer et al., 2018).
While the van Gent (1999, 2001) equations accounted for the characteristic gently sloping foreshores and steeply sloped berms of composite beaches, the equations were developed using numerical and laboratory modeling, and were not designed for composite beaches. To improve predictions of runup on composite beaches, Blenkinsopp et al. (2022) used field and laboratory observations to develop empirical runup equations specific to composite beaches and dynamic cobble berm revetments. The developed equation related the runup height to the length of the surf zone, the depth of water at the toe of the berm, and the slope of the berm. The Blenkinsopp et al. (2022) equation was tested in the berm inundation regime, where the swash zone was entirely located on the cobble berm.
Instead of trying to predict the runup height on a specific berm geometry, Allan et al. (2005) studied 13 composite beaches in Oregon to assess their properties. They found that crest heights ranged between 5.7 – 7.1 m. They also completed a total water level (TWL) analysis using a runup equation developed for sandy beaches by Ruggiero et al. (2001) (a precursor to Stockdon et al. (2006)). They determined that the TWL exceeded 6 m 5% of the time and 7 m 1% of the time, and therefore recommended a crest height of 7 m in Oregon. However, this crest height may be an overestimation, as runup equations for sandy beaches may overestimate runup on composite beaches (Ellenson et al., 2023).
Conlin et al. (2025) tested many runup equations on data from a composite beach site on the Oregon coast and found that the best-performing existing equations were the equations of Medellín et al. (2016) and a modified version of Poate et al. (2016). Based on their field data, Conlin et al. (2025) also created a new runup equation based on wave height, beach slope, and wave period that showed improvement over all existing runup equations. They suggest that the discrepancy between their equation and the equation of Blenkinsopp et al. (2022) may be related to the runup regime: the observations of Conlin et al. (2025) were collected during both berm collision (when the swash zone spans the sandy foreshore and the cobble berm) and berm inundation.
In some cases, infilling of cobble voids with smaller particles and sand is a factor that may need to be accounted for in predictions of runup and profile evolution. In a scale laboratory experiment, van Gent et al. (2009) found that sand within the pores of gravel caused a less dynamic response than the same structure without sand infilling. The structure with sand infilling developed a lower crest, but experienced less erosion below the still water line. Zaalberg (2019) also used OpenFOAM to investigate the effect of sand infilling on runup, based on the sand infilling observed in the Maasvlakte II port in the Netherlands. Zaalberg (2019) introduced a dimensionless pore number to account for the amount of sand infilling and used it to modify the friction reduction factor from EurOtop (van der Meer et al., 2018). They found that sand infilling decreased the amount of water that infiltrated into the structure and caused an increase in overtopping discharge, indicating a higher R2% runup elevation. Everts et al. (2002) noticed a similar result in their field data. They observed that more cobble accretion seemed to occur during the winter because sand had washed out of the cobbles and increased seepage flow into the berm, decreasing swash backwash velocity and thus decreasing downslope cobble transport.
2.1.3 Slope
While the front slope of a dynamic revetment is expected to change over time, choosing an initial slope may be relevant for design. van der Meer (1988) tested a range of stability numbers on gravel and cobble beaches in a scale laboratory experiment and measured the profile after 3,000 waves. They found that for stability numbers less than 15-20, the initial slope had an influence on the final profile. For stability numbers greater than 15-20, the initial slope had no influence on the profile. However, the tests consisted of scale laboratory experiments without sand, so the results may not be applicable to dynamic revetments.
van der Meer and Pilarczyk (1986) studied beaches with stability numbers between 3 and 200, which they define as “dynamically stable rock slopes” or “gravel beaches.” They used scale laboratory testing to develop a model that predicted the evolution of a pure gravel slope based on the wave height, wave period, number of waves, and D50 of the rock.
Powell (1993) also developed an equation for the equilibrium slope of shingle beaches based on a 1:40 scale laboratory experiment. The equation is based on the wave steepness, grading of the sediment, and the relationship between wave height and D50.
In Oregon, Allan et al. (2005) evaluated characteristics of 13 composite beaches to develop design recommendations for dynamic revetments. They found that slopes ranged between 8H:1V and 4H:1V, and recommended a design slope of 5H:1V.
2.1.4 Toe elevation
Toe elevation is also likely a component of engineering design. However, to our knowledge, there are no existing tools or literature outside of existing project designs (see Section 3) that provide suggestions on toe elevation. Suggested methods for the determination of the toe elevation based on existing project designs will be covered in Section 4.
2.1.5 Cobble volume
Cobble volume may be a result of the chosen crest height, crest width, toe position and front slope; however, some authors have also investigated the volume required for dynamic revetment stability. Gravel berm behavior was investigated by Ahrens (1990) and Ward and Ahrens (1992) using a scale laboratory study of a gravel beach in front of a bulkhead. They determined that the performance of the revetment was based on its volume. They separated profile responses into three categories: safe (when the berm had enough volume for the crest to build up in a way that neither stone nor water would be carried over the bulkhead), failure (when waves directly impacted the bulkhead), and intermediate (when some overtopping of water and stone occurred). They also introduced the concept of “critical mass,” or the quantity of stone required to protect a unit length of vertical bulkhead for a given water depth at the toe and given wave conditions. A cobble volume greater than the critical mass allowed the revetment profile to evolve in a way that prevented overtopping and met the “safe” condition. They found that the critical mass was based on the water depth, zeroth moment wave height, and period of peak energy density. Ahrens (1990) and Ward and Ahrens (1992) introduced equations to calculate the geometric properties of a gravel berm that meets the critical mass requirement for a safe revetment. Ahrens (1990) and Ward and Ahrens (1992) also proposed a dimensionless parameter that uses the cobble volume and the wave conditions to calculate a revetment response parameter that predicts the performance of the revetment based on water depth, wave height, and wave period. However, the Ahrens equations do not include any impact of grain size, and the tests were done without sand, so the results may have limited applicability.
2.2 Dynamic evolution
A challenge of engineered dynamic revetments is that unlike traditional structures, they are expected to evolve over time. The prediction of the evolution of dynamic revetments is an active area of study, with several laboratory and field experiments making detailed measurements of the evolution of dynamic revetments under different wave conditions. Here, literature on the observation and prediction of alongshore transport and berm evolution is presented.
2.2.1 Alongshore transport
The alongshore transport of the cobbles that make up a dynamic revetment is an important factor in determining the longevity of the structure and its maintenance needs. There have been several studies observing the transport of gravel, cobbles, and pebbles; however, predictions of alongshore transport of cobble on composite beaches for engineering purposes are limited.
While observations of cobble transport remain subject to site-specific factors, there are observations of the direction and magnitude of cobble transport on beaches on the US West Coast. In some studies, there was a strong trend in the direction of cobble transport, leading to net transport rates over the duration of experiments. For example, on the dynamic revetment in North Cove, Washington (see Section 3.2), Bayle et al. (2021) observed transport rates of up to 13 m/day (for the smallest tagged pebbles) in the direction of the dominant alongshore current over their 2-week experiment. At Cape Lookout, Oregon, Allan et al. (2006) observed northward transport of cobbles, which they concluded was driven by southeasterly waves. Dickson et al. (2011) also observed unidirectional transport of cobbles, with net transport rates from 2-2.5 m/day. However, in California, Young et al. (2023) found the transport direction of their cobbles seemed random. Everts et al. (2002) (also in California) concluded that there was no net cobble transport at their site based on evidence like a lack of buildup of cobble at coastal barriers. Young et al. (2023) also noted that cobble transport distance was dependent on location due to engineered structures like riprap or geomorphology conditions like cusps. On composite beaches, the movement of gravel over relatively impermeable sand has been shown to lead to rapid formation and erosion of cusp features (Pitman et al., 2024).
The relation between cobble shape, size and distance traveled is not clear based on observations. Several studies (Allan et al., 2006; Grottoli et al., 2015; Young et al., 2023) found that transport distance was related to cobble size. Young et al. (2023) and Grottoli et al. (2015) also found that transport distance was slightly related to cobble shape. However, Bayle et al. (2021) saw no relation between cobble transport distance, size, and shape. These discrepancies could be related to site conditions, as for example, Grottoli et al. (2015) found that larger cobbles moved less than other cobble sizes at their low-energy site, while Allan et al. (2006) found that larger cobbles moved more than other cobble sizes at their high-energy site.
Kamphuis (1991) used a laboratory experiment to develop an empirical equation for alongshore sediment transport on sandy beaches based on wave steepness, beach slope, grain size, and wave angle. They tested their equation on a collection of previous field data from a number of sites (Kamphuis et al., 1986) and found that the laboratory equation correctly predicted transport rates. However, they also acknowledged that their equation overpredicted gravel transport, likely because it assumed every grain moved under every wave and did not incorporate critical mobility.
Van Wellen et al. (2000) also created an equation for alongshore transport on coarse-grained beaches. The equation accounted for transport in the swash zone and incorporated critical mobility for the coarse grains. However, the authors acknowledged that there were few datasets of alongshore transport, and thus they recommended that their equation be tested with other datasets.
van Rijn (2014) used a process-based model to predict alongshore transport rates on sand and gravel beaches. Based on the results of the model, a simple equation was created. The equation was based on the sediment properties, wave height and direction at breaking, and the beach slope. A swell correction factor was included to account for swell waves, which, according to the model, transport 50% more sediment.
Kamphuis’s equation (Kamphuis, 1991) used both lab and field datasets. van Rijn (2014) and Van Wellen et al. (2000) both suggested that their equations were improvements over the Kamphuis (1991) equation. The equations of Van Wellen et al. (2000) and van Rijn (2014) have also been calibrated and tested on shingle beaches. However, none of these equations have been tested on a composite beach. As Kamphuis (1991) suggests that significant sediment transport of cobble occurs in the swash zone, these equations derived for shingle beaches may need alteration to account for the time in which swash is not impacting the cobble part of the composite beach.
In summary, studies in different environments have indicated a range of factors that might impact the alongshore distance traveled by cobbles. In some studies, size and shape were shown to have an impact, and in others, size and shape were uncorrelated to the alongshore distance traveled. Equations for alongshore transport on gravel beaches have been developed; however, they have never been tested on composite beaches, so their applicability is unknown.
2.2.2 Cross-shore transport and berm evolution
As dynamic revetments are intended to be dynamic structures, the cobble in the structure can move on a wave-by-wave basis. In a large-scale laboratory experiment of a dynamic revetment, Bayle et al. (2020) found that the net volume changes were approximately an order of magnitude less than the gross volume changes, i.e., there was lots of cobble movement, but relatively little change in the overall shape of the revetment. A similar ratio was measured in the field by Bayle et al. (2023). Transport up the face of natural cobble berms and dynamic revetments has been observed in both field and laboratory studies (Allan et al., 2006; Almeida et al., 2015; Bayle et al., 2020; Foss et al., 2023). For example, Bayle et al. (2020) found that 70% of their instrumented cobbles ended the experiment landward of their starting position.
While cobble movement can be significant, the cobble that makes up a dynamic revetment generally remains as a coherent berm. Minimal offshore transport has been observed in the laboratory (Bayle et al., 2020; Foss et al., 2023) and the field (Allan et al., 2006; Bayle et al., 2021). In the laboratory, Bayle et al. (2020) and Foss et al. (2023) measured the percentage of the placed cobble that remained as part of the dynamic revetment. For Bayle et al. (2020), who used well sorted, rounded cobble, 90% of the original cobble volume was retained, with another 9% in a mixed sand-cobble layer adjacent to the cobble toe. For Foss et al. (2023), who used poorly sorted, angular cobble and the same wave and water level conditions as Bayle et al. (2020), 97% of the original cobble volume was retained.
While dynamic revetments tend to remain coherent, their profile shape and slope can have significant variation. Bayle et al. (2020) and Foss et al. (2023) both observed significant changes in slope and the overall profile shape throughout their experiments, although the profile evolved differently due to the different cobble used. Prediction of the profile evolution remains difficult. van der Meer (1988) developed a model based on laboratory testing to predict the morphological development of a gravel beach. Foss et al. (2023) tested van der Meer’s model of the evolution of berm slope. They found that the horizontal wave excursion and the distance between the shoreline and the crest of the revetment agreed with van der Meer (1988), but the van der Meer (1988) model could not accurately predict the crest height, possibly due to the differently sorted gravel. In addition to lab testing, Bayle et al. (2021) made observations of morphological change in the field. They found that morphological change mainly occurred at high tide: the water level at the toe of the revetment was identified as the key parameter controlling the wave height at the toe of the revetment, while offshore wave height had only a secondary effect. However, this could be related to offshore shoals near the site. Additionally, Bayle et al. (2021) proposed a conceptual model for berm evolution that incorporated observations of the sand interface within the berm. The conceptual model has not yet been validated and needs testing at other sites.
In the laboratory, while both the poorly sorted, angular cobble and well sorted, rounded cobble experienced rollover transport onto the cobble crest, only the poorly sorted, angular cobble experienced a noticeable increase in crest height (Bayle et al., 2020; Foss et al., 2023). Bayle et al. (2020) noted that well sorted material has been predicted to have a lower crest elevation by van der Meer (1988) and Powell (1990), and observed that the rounded cobbles were easily transported and unable to form a stable crest. In contrast, the poorly sorted, angular cobble developed a peaked crest higher than the constructed crest height. Foss et al. (2023) attributed this result to the interlocking nature of the poorly sorted angular cobbles. Bayle et al., 2020) also attributed the lack of crest growth in their experiment to erosion of sand beneath the revetment, which caused the revetment to sink even as cobbles rolled onto the revetment crest. Foss et al. (2023) did not observe significant erosion of the sand beneath their revetment, which they attributed to the formation of a filter layer below the revetment by the smallest gravels in the cobble gradation.
While dynamic revetments have been shown to reduce erosion when compared to a no-revetment case, dynamic revetments themselves have also been seen to experience retreat. In Bayle et al. (2020), the authors observed that with rising water levels, the revetment retreated landward. This indicates that under some conditions, dynamic revetments may not fix the shoreline in place; rather, they should be expected to retreat in an erosive environment, albeit at a slower rate than sand.
In summary, dynamic revetments should be expected to change on a wave-by-wave basis. However, laboratory experiments and field observations suggest that the offshore transport of cobbles is limited, and that in the absence of significant alongshore transport, the dynamic revetment will naturally remain as a coherent structure even under extreme conditions. Laboratory experiments have shown that well sorted, rounded cobble allows for the erosion of sand beneath the revetment, preventing the growth of the crest. In contrast, poorly sorted, angular cobble reduced the sinking of the revetment and allowed the growth of a peaked crest. While more research is needed, there are indications that the interaction between the sand and cobble may be important to the morphologic change of the revetment. Finally, dynamic revetments have been shown to reduce erosion when compared to cases without a revetment; however, they may still require accommodation space for landward retreat.
3 Existing PNW projects
In this section, we present projects from the same region to highlight the variation between the projects, despite their relatively similar forcing conditions. These projects are all located in the PNW, a region where offshore winter significant wave heights can reach 10 m (Allan et al., 2018), and where the tide range is approximately 2.6 m (diurnal range, NOAA Station #9439040). However, different project priorities, design processes, and funding availability led to five relatively different designs.
We compare examples of design goals, processes, and project performance for five case studies within the PNW. Case studies are presented in the order they were constructed. The project site and goals, the design process, and the monitoring, maintenance and performance are described for each site. The project locations, the site plan, and a photo of the completed structure are given in Figure 2. The as-built survey and the most recent survey are compared for each project in Figure 3, and all design parameters for each site are compared in Table 1.
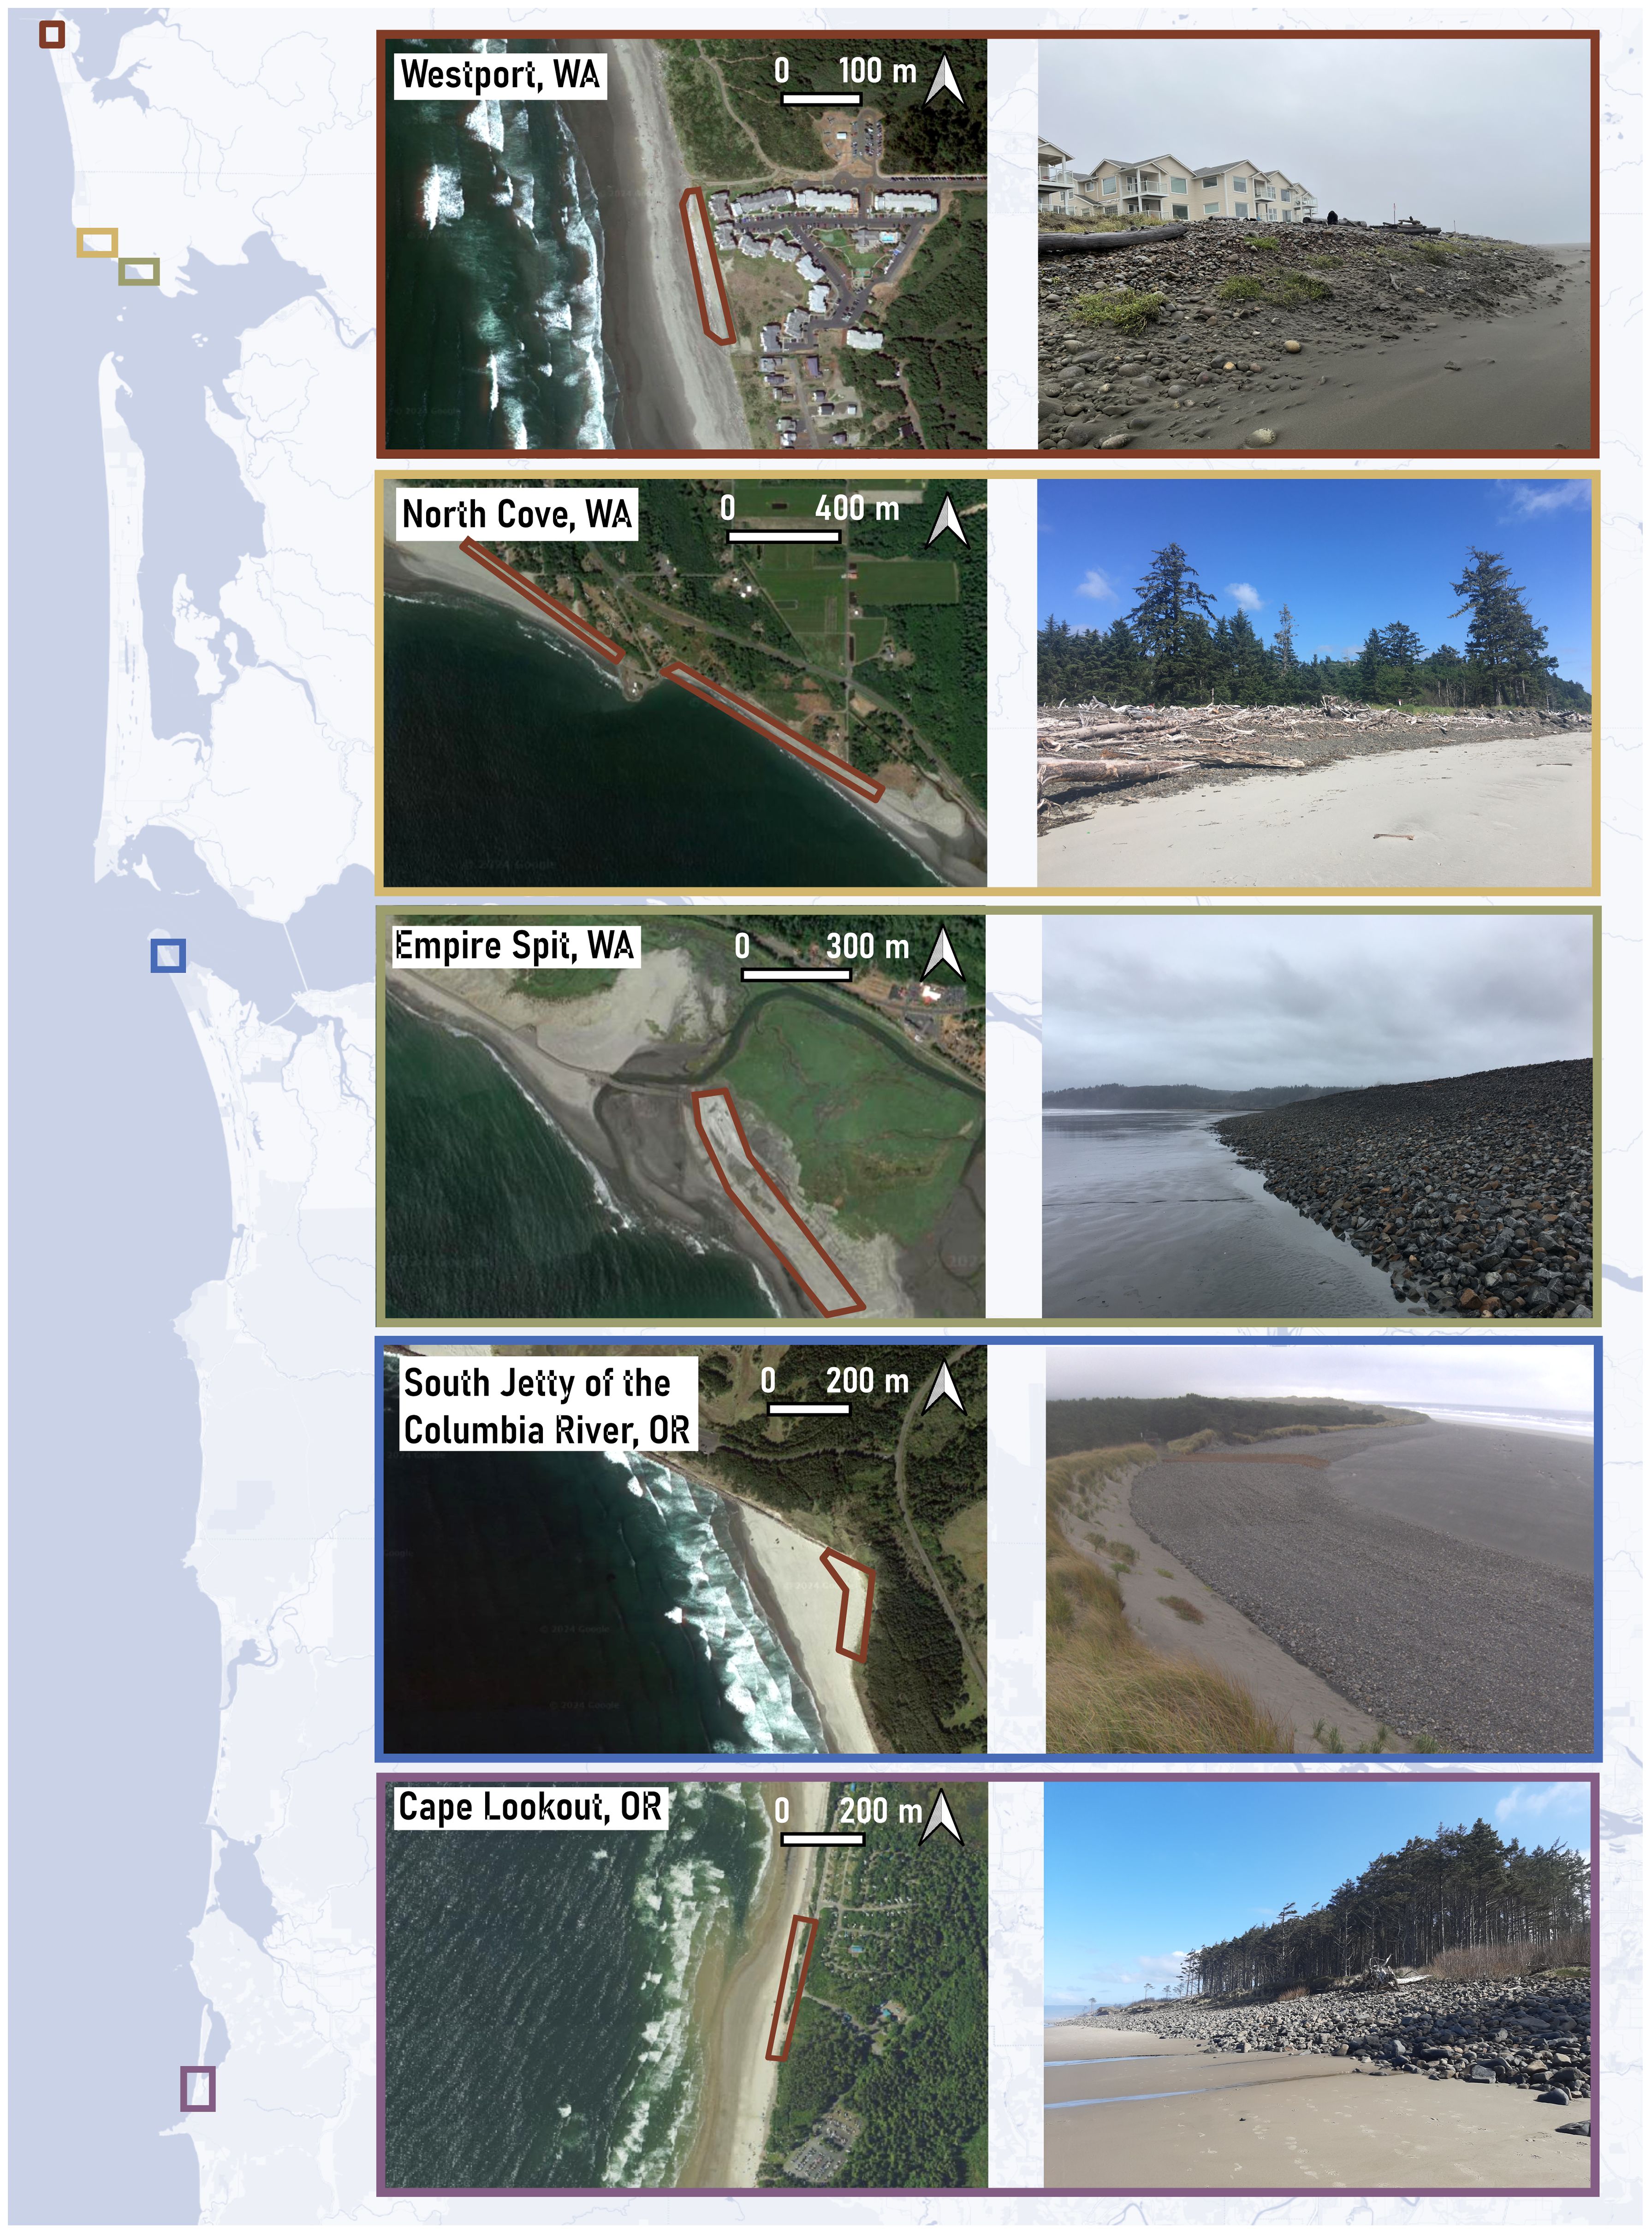
Figure 2. A map of the southern Washington and northern Oregon coasts, with colored boxes indicating dynamic revetment projects (left). Corresponding-colored boxes contain satellite imagery (middle) and a site photo (right). The approximate extent of the dynamic revetment is outlined in red on the satellite photo.
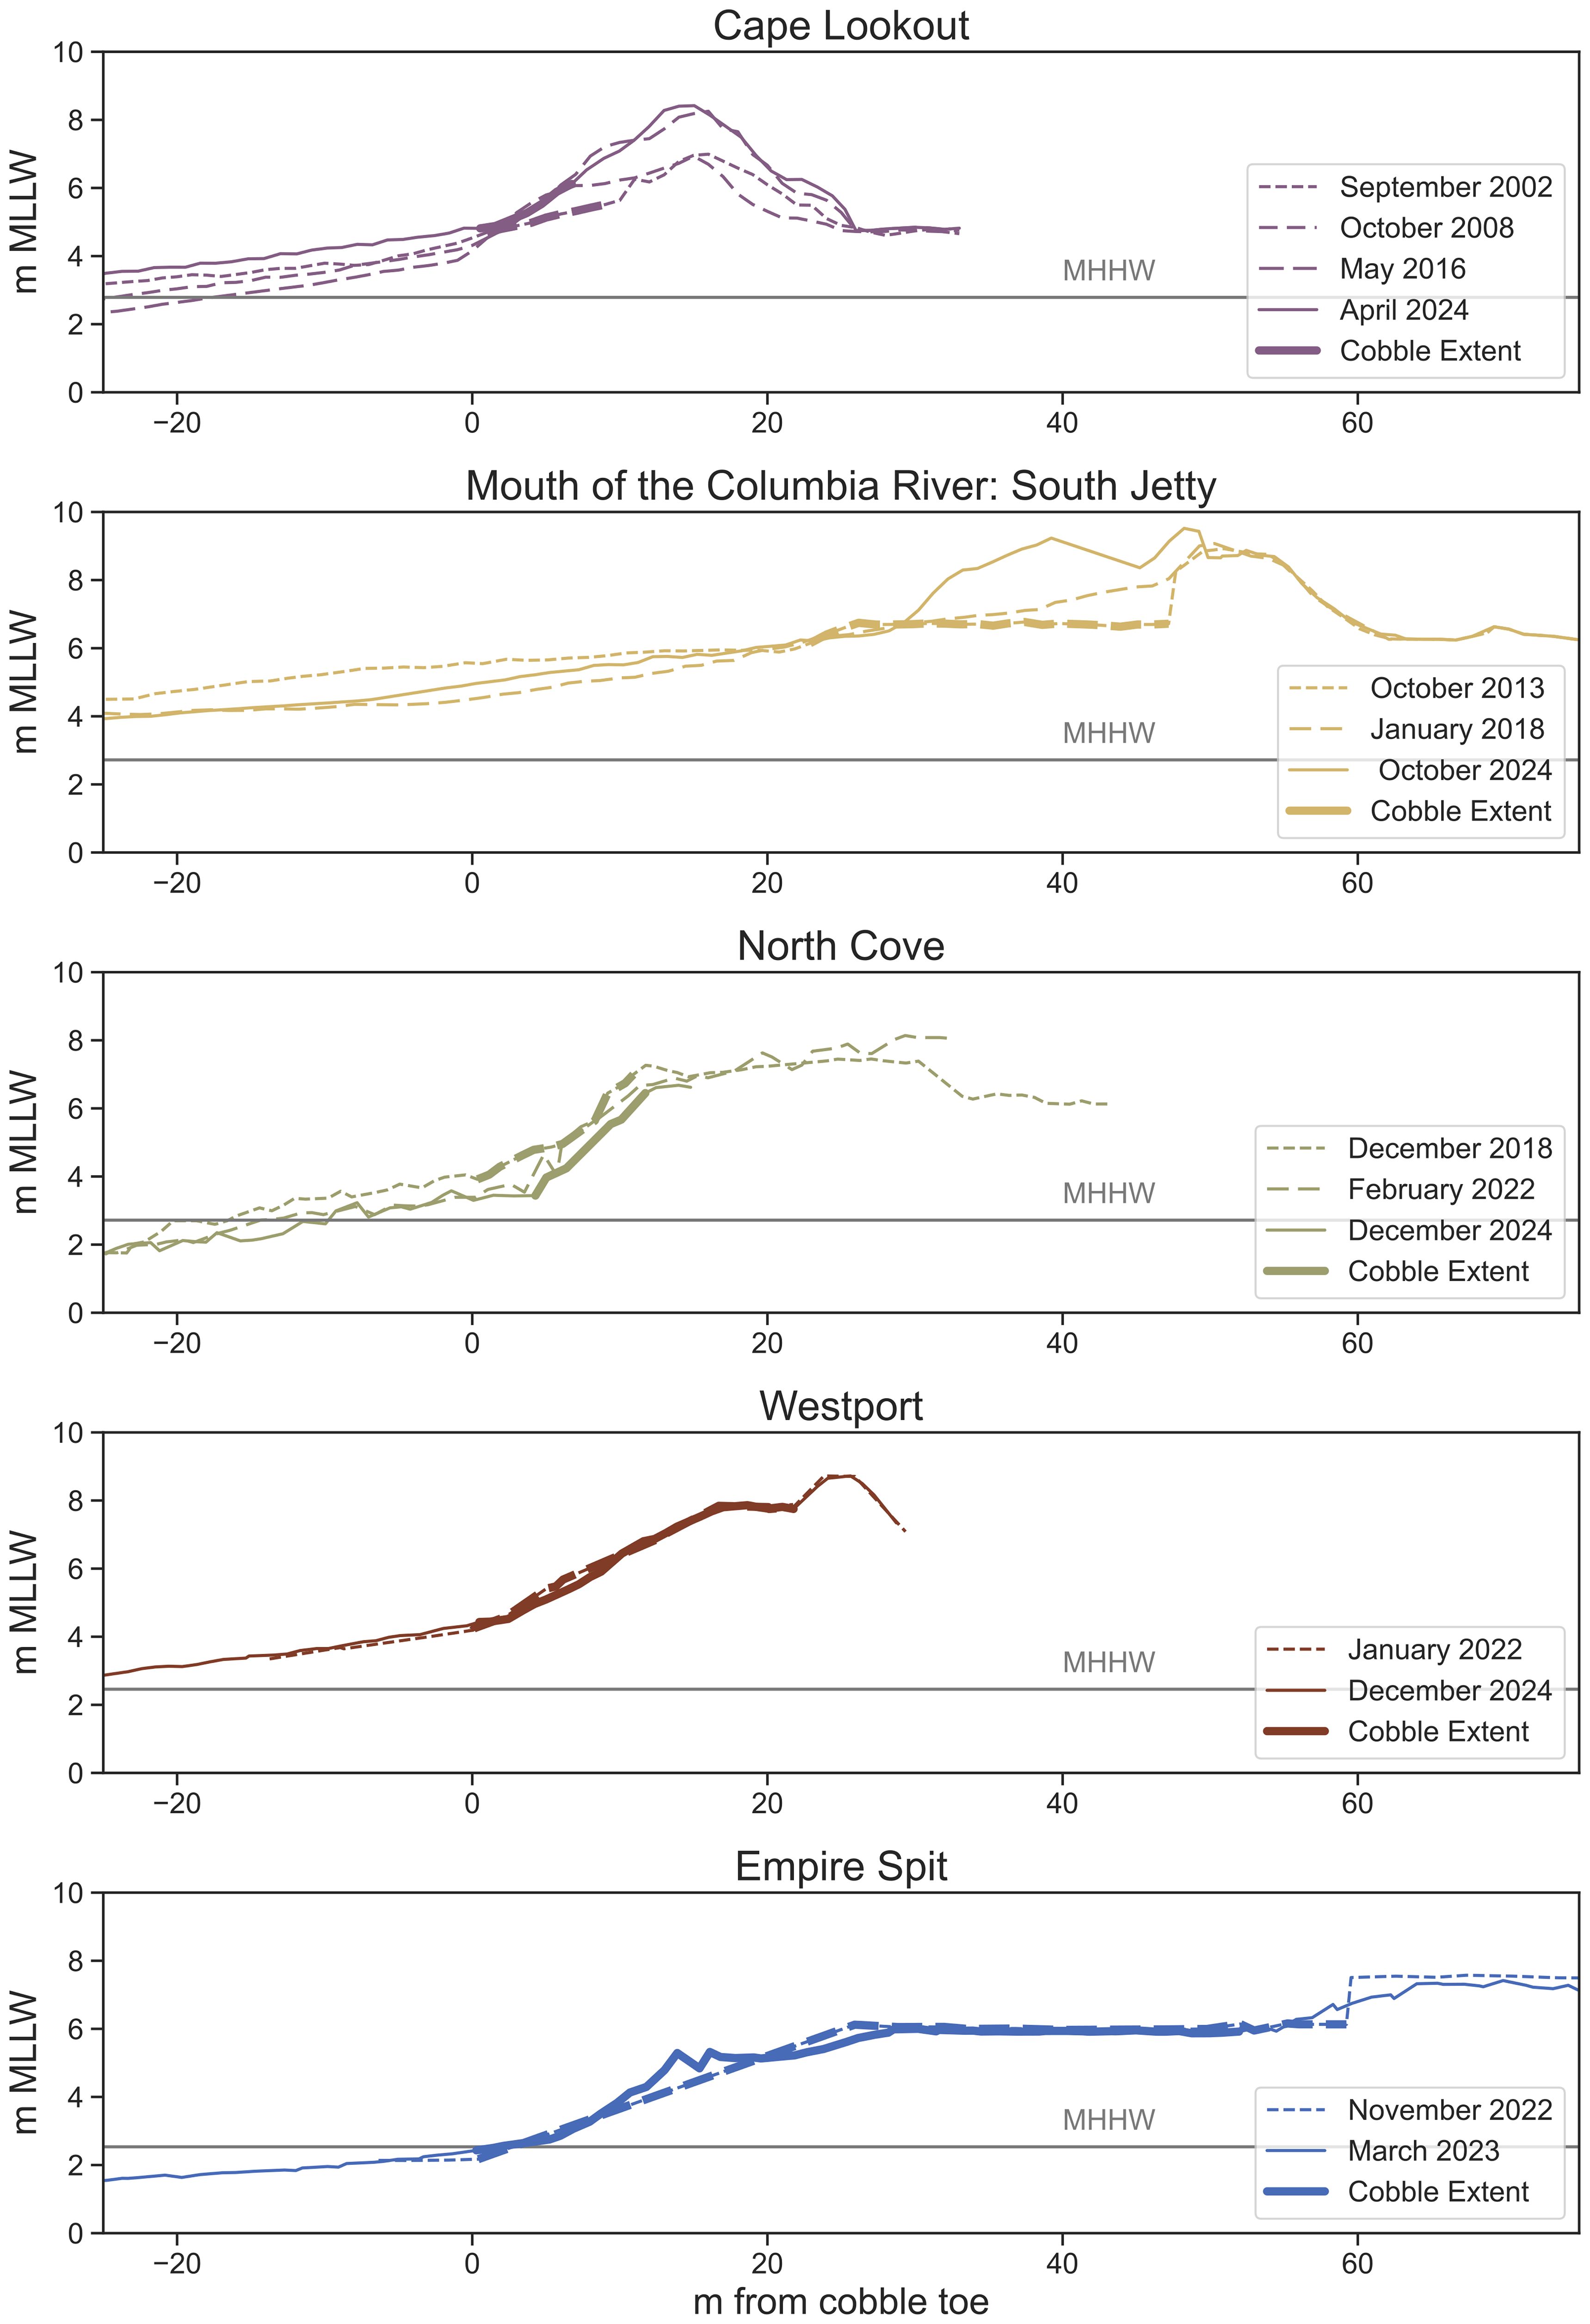
Figure 3. Topographic surveys of initial dynamic revetment profiles (dashed lines), intermediate profiles (dashed lines, Cape Lookout, South Jetty, and North Cove) and most recently available topographic data (solid lines). The toe of the initial dynamic revetment is set at x = 0 m. The extent of cobble is represented with thicker lines for the initial and final surveys (dashed, solid). Where data on the cobble extent were not available (Cape Lookout, South Jetty, North Cove, and Empire Spit), it was approximated visually from the profile shape or from knowledge of the as-built state. For the South Jetty 2013 survey, the cobble toe was buried. By 2022, the majority of the South Jetty revetment was buried by aeolian deposits. Where available, data as close as possible to the projects’ winter profile was used to enable the visualization of long-term change. The mean higher high water elevation (MHHW) is marked with a horizontal gray line.
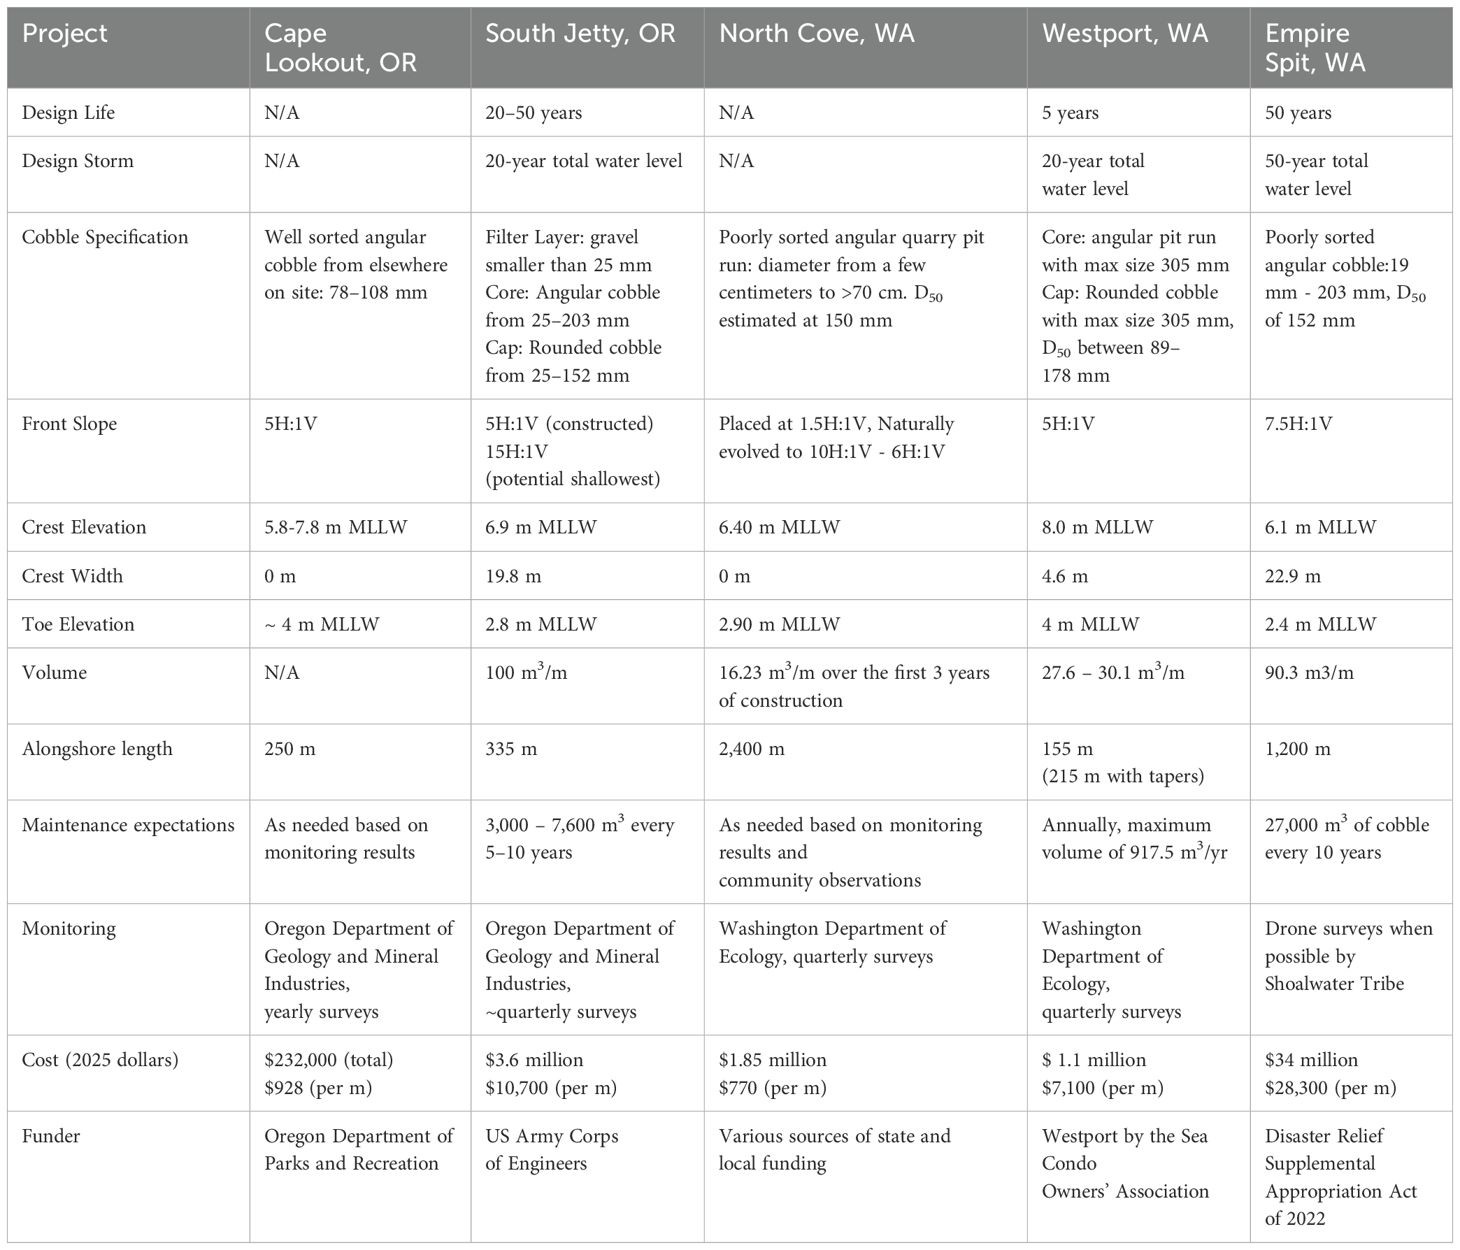
Table 1. Comparison of design parameters between existing PNW dynamic revetment projects.
3.1 Cape Lookout
3.1.1 Project site and goals
Cape Lookout State Park is located at the south end of the 15-km Netarts littoral cell, which is bounded on both the north and south by basaltic headlands. Beginning during the El Niño of 1982-83, the park, including a low-lying campground, has experienced chronic erosion and flooding. To protect the shoreline while keeping it in a natural state, an experimental dynamic revetment backed by an artificial dune was constructed in 2000. A dynamic revetment was the preferred structure because it was compatible with the existing setting of the park, which already included a natural cobble berm, and complied with Oregon’s restrictions on hard structures. The project was led and funded by the Oregon Parks and Recreation Department (OPRD). The cost of the project was $125,000 ($232,000 in 2025) The expected cost of a dynamic revetment was much less than the estimated cost for a riprap revetment ($500,000). For construction of the project, cobble from elsewhere on Netarts Spit was added to increase the volume of the naturally existing cobble berm.
3.1.2 Project design
The project design was based on the morphology of the natural cobble beaches found along the Oregon coast (Allan et al., 2005), and on the cobble beach that already existed in the park (Allan et al., 2004). Slopes of between 5H:1V and 4H:1V were observed nearby and recommended for the design. The crest height was set following a total water level analysis based on Ruggiero et al. (2001). The total water level for an extreme event was expected to be approximately 9-10.5 m mean lower low water (MLLW), therefore the design crest elevation for the dynamic revetment was 8–9 m MLLW. Rather than construct the dynamic revetment to this height, the crest height was lowered to 5.8-7.8 m MLLW and the combined with an artificial dune with a crest elevation between 7–10 m MLLW. The toe elevation was approximately 4 m MLLW. The dynamic revetment did not have a wide crest. The alongshore extent of the project was approximately 250 m. The cobble source was the natural cobble beach along Netarts Spit from areas where sufficient cobble volumes already existed. The cobble was well sorted, with grain sizes ranging from 78–108 mm. The volume of cobble placed was not consistent alongshore, and was placed as a layer on the pre-existing profile to approximately reach the desired slope and crest height.
3.1.3 Monitoring, maintenance, and performance
Monitoring at the site has been undertaken by the Oregon Department of Geology and Mineral Industries (DOGAMI) as a part of their coast-wide monitoring program. Monitoring has observed that, while the structure has reduced shoreline retreat and overtopping, the dynamic revetment has not been sufficient to protect the artificial dunes from erosion (Komar and Allan, 2009).
Monitoring results in 2008 indicated that approximately 5,000 m3 of material had been lost from the structure due to alongshore transport. Erosion had also occurred north of the existing dynamic revetment, exposing a septic drain field. In response, Oregon State Parks added a new section of dynamic revetment north of the existing structure that was 226 m long with a 2H:1V front slope and a crest height of approximately 3 m above the dune toe, leading to a volume of approximately 9 m3/m (total volume of 2,000 m3). Oregon State Parks also moved approximately 3,500 m3 of cobble from where it had moved northward back to the original structure (Komar and Allan, 2009). However, this volume was less than the recommended maintenance volume of 5,000 m3.
At the time of publication, the Cape Lookout dynamic revetment has been in place for nearly 25 years and is considered an overall success, as it has mitigated erosion to the campground behind the berm. However, while the dynamic revetment has reduced erosion in comparison to nearby dunes, portions of the structure are beginning to fail due to lack of adequate maintenance. Options are currently being explored for significant maintenance of the structure to allow for continued protection of the campground.
3.2 Mouth of the Columbia River - South Jetty
3.2.1 Project site and goals
The dynamic revetment at the South Jetty of the Columbia River, Oregon was intended to protect the jetty root (i.e., the connection between the jetty and the shoreline) and the adjacent spit from breaching by reducing runup, overtopping, and impacts on the foredune and backshore area. The project lifecycle was expected to be between 20–50 years (US Army Corps of Engineers Portland District, 2013). The project was led by the US Army Corps of Engineers, Portland District, with funding from the US Army Corps of Engineers under Coastal Navigation Operations and Maintenance funding. The total project cost was $2.6 million ($3.6 million in 2025).
The project was rigorously designed using both beach nourishment and traditional revetment design methods. The expected total water level for the design storms was used in conjunction with the available literature to design the crest height, width, toe elevation, and front slope. Three layers of cobble were selected to balance aesthetics and stability.
3.2.2 Design
The dynamic revetment was designed to prevent runup from reaching the existing dune during a 10-year storm, and for the revetment to survive a 20-year storm without reducing its operational capability. Based on observations of natural composite beaches like Ecola State Park, Oregon, the expected equilibrium slope of the dynamic revetment was 5H:1V. However, the revetment was conservatively designed to accommodate a slope of 15H:1V without compromising the function of the dynamic revetment (US Army Corps of Engineers Portland District, 2013).
To determine the crest height and width, runup was calculated using van Gent (1999, 2001) with a 5H:1V slope (the expected equilibrium slope) and a 15H:1V slope (the shallowest potential slope). TWLs were expected to be between 6.0 – 8.7 m MLLW for the 5H:1V slope. Therefore, the crest height was set at 6.9 m MLLW and a wide crest was implemented to ensure that any water that overtopped the crest would not impact the backing dune. The crest width was set at 19.8 m to enable the slope to equilibrate to 15H:1V if necessary (US Army Corps of Engineers Portland District, 2013).
The revetment toe elevation was set at 2.8 m MLLW, which was the intersection between the sloped dynamic revetment and the expected winter profile of the sand (US Army Corps of Engineers Portland District, 2013). Based on the design slope, crest elevation, and crest width, the resulting design cobble volume was 100 m3/m. The structure extended for 335 m alongshore, leading to a total cobble volume of approximately 30,000 m3.
The Rock Manual (CIRIA, 2007) was used to choose grain sizes for the cobble. Stability numbers between 10-100 (corresponding to dynamic rock slopes and gravel beaches) were selected, which led to cobble sizes between 10–203 mm with a D50 of 76–102 mm. The revetment was made up of 3 layers. The first layer was a bedding filter layer made of 25 mm and smaller gravel to separate the sand and cobble. The core of the cobble was made of angular cobbles between 25–203 mm. The cap of the revetment was made of sub-rounded to rounded cobble between 25–152 mm. During the revetment’s summer construction, sand was excavated down to the typical winter sand levels to place the cobble in its expected winter equilibrium profile (US Army Corps of Engineers Portland District, 2013).
3.2.3 Maintenance
Monitoring has been carried out by DOGAMI using a combination of backpack GPS and lidar. Their observations show that the non-sacrificial areas of the berm (i.e., the areas not next to the jetty root) have remained stable (Allan et al., 2023). However, there has also been wind-blown sand accretion into the dynamic revetment, leading to up to 1.5 m of deposition on top of the berm. Observations have also shown that, while cobble have been observed up to 180 m seaward and several kilometers south of the original cobble placement, most cobble has remained high on the beach. Alongshore transport of cobble has also led to the formation of a small cobble berm at the toe of the foredune south of the original cobble placement area. Monitoring data suggests that more frequent top-ups of cobble may be necessary to maintain the original structure due to the amount of alongshore transport (Allan et al., 2023).
The cobble at the north end of the revetment (nearest to the root of the jetty) was expected to be a sacrificial area and erode faster than the rest of the revetment as the cobble moved south alongshore. The expected alongshore transport of cobble was estimated based on Kamphuis (1991) and the existing alongshore sediment transport rate for fine sand at the site, leading to an expected alongshore transport rate of 306–765 m3/yr. Therefore, maintenance was expected to be approximately 3000–7600 m3 of cobble every 10 years, which represents 10-25% of the original placement volume (US Army Corps of Engineers Portland District, 2013).
After monitoring results in 2016 showed a loss of material adjacent to the jetty root, the first maintenance of about 5,000 m3 of cobble (17% of original placement volume) took place in 2021 (8 years after initial construction). The added cobble was placed in the sacrificial area near the jetty root, with the cobble expected to be transported alongshore to the rest of the revetment.
There were a few key takeaways from the project. First, the alongshore transport at the site was significant, and as expected, led to volume loss and the need for renourishment. Second, for this project, the sand was excavated, and the toe was placed at the expected winter profile. If excavation is not desired, it would likely be necessary to either design the revetment with enough cobble volume so that it will equilibrate to the desired profile during the winter, or to simply construct the revetment during the winter. Third, it was ensured that there were no fines, such as clay and silt, in the cobble matrix. Additionally, driving heavy machinery over the bedding layer was avoided to ensure that the bedding layer did not immediately become embedded into the sand.
3.3 North Cove
3.3.1 Project site and goals
North Cove is located on the northern edge of the Willapa Bay inlet in Washington. The town was established in 1884 along the landward side of a large spit, Cape Shoalwater, that reached more than 4 km southward from the present shoreline into the mouth of Willapa Bay (Kaminsky et al., 2010; Talebi et al., 2017). In 1911, the spit began retreating northward, a trend that continued through the 1970s at interdecadal-scale rates as high as 40–50 m/yr while averaging approximately 30 m/yr, and at rates averaging approximately 20 m/yr or less since then (Kaminsky et al., 2010). In December 2016, the community began to experiment with the placement of pit run quarry materials along erosion scarps, and with successful abatement of erosion during storms, were able to obtain state funding to initiate incremental construction of a dynamic revetment along 2.4 km of the North Cove shoreline in November 2018, adaptively implementing conceptual designs of the Pacific Conservation District. The site is scientifically monitored by the Washington State Department of Ecology and regularly altered by community members who experiment with different strategies for erosion control.
The ongoing project has been led by the Pacific Conservation District, with funding from numerous sources, including several sources of state funding, local organization funding (including the Grayland Cranberry Association, the Pacific County Marine Resources Council, and the Pacific Conservation District), private funding from homeowners, and locally raised funds (including the David Cottrell Memorial Fund and local bake sales and shirt sales). To date, the project has cost $1.5 million dollars (approximately $1.85 in 2025).
3.3.2 Project design
The Pacific Conservation District developed conceptual design plans for a dynamic revetment with the goal of placing the minimum volume of material to enable wave dissipation and prevent further bank erosion. They specified three variations of cobble treatments along the North Cove shoreline, each including a 1.5H:1V wedge of cobble placed against the backshore erosion scarp. The elevation of the top of the cobble wedge was specified to reach, at maximum, the scarp top, which varied from 0.9-6.1 m above the toe and was approximately 6.4 m MLLW. Where additional elevation was required to reduce overtopping, the plans specified a 0.6 – 1.5 m debris berm composed of sand, large wood and native vegetation to be placed above and landward of the scarp top.
The dynamic revetment was progressively built over 3 years, adding new material to vulnerable sections as needed and as funding allowed. On average, a cross-sectional volume of approximately 12.5 m3/m of material was typically placed along the backshore, while a more robust section with relatively high wave energy received approximately 16.2 m3/m (Bayle et al., 2021). In total, approximately 35,550 m3 of pit run cobble material was placed between 2018 and 2022. Where the revetment was highly exposed and active during winter, waves reshaped and naturally formed an 18 m wide revetment with a slope varying from 10H:1V to 6H:1V under different wave forcing (Bayle et al., 2021).
The cobble used to build the structure was typically angular, poorly sorted pit run cobble with a size of 254 mm or less; however, one of the three conceptual designs from the Pacific Conservation District allowed for boulder-sized material to be placed at the bottom half of the cobble wedge where scarp retreat threatened existing infrastructure.
3.3.3 Monitoring, maintenance, and performance
Monitoring on the dynamic revetment is undertaken by the Washington State Department of Ecology, which conducts quarterly beach profiles and topographic surface mapping of the site, annual cobble tracking using RFID technology, and supplemental winter storm surveys (Weiner et al., 2019).
Maintenance on the dynamic revetment was expected to take place when needed as materials and funds allowed. Maintenance has typically focused on areas with erosion hotspots, or areas that have lost significant cobble. The community at North Cove has experimented with different maintenance strategies. For example, the community has used a ‘feeder bluff’, in which they constructed a cobble stockpile on the southern side of the artificial headland in the middle of the site so that alongshore transport would move the cobbles along the shoreline. The community has also tested cobble ‘wave trippers’, where cobble replenishment takes place just above the high tide line (Drummond et al., 2021). This seaward cobble mound was intended to dissipate typical winter waves across the swash zone at high tide, enhance sediment deposition on both sides, and replenish the revetment as cobbles are transported landward from the ‘wave tripper’. Community members have also experimented with the addition of local materials such as logs, cranberry vines, and cranberry root mats to the revetment crest to stabilize the shoreline. At the time of publication, the community (led by the Pacific Conservation District) has plans to update and implement an engineered design for the dynamic revetment in North Cove as funding allows.
3.4 Westport
3.4.1 Project site and goals
The dynamic revetment at the Westport by the Sea condominiums in Westport, Washington was constructed in 2022. Chronic erosion has been observed at the site since 1997 (Ruggiero et al., 2013), leading to the loss of the foredune in the winter of 2015-2016. Several years of emergency placement of sand, coir matting, and large woody debris was undertaken, followed by dune construction. The condo owners also decided to move forward with the construction of a dynamic revetment for additional protection. The goal of the dynamic revetment was to provide a temporary measure to reduce chronic erosion at the site until a more permanent solution could be found. Therefore, the dynamic revetment at Westport was designed with a 5-year design life. The engineers (Blue Coast Engineering LLC) used several existing dynamic revetments, including projects in North Cove, Washington, the South Jetty of the Columbia River, Oregon, and Cape Lookout, Oregon as references (Blue Coast Engineering LLC, 2021). The project was initiated by the Westport by the Sea Condo Owners’ Association. The cost was shared between all owners according to their percentage ownership of the property, and was funded by special assessments. The project cost was $1 million ($1.1 million in 2025).
3.4.2 Design
The design condition chosen for the project was the 20-year total water level. A joint probability distribution was calculated for the 20-year total water level, considering a 10-year return period storm surge, a 2-year return period wave setup, the highest astronomical tide, and the height exceeded by 2% of runup (R2%). The R2% was calculated using van Gent (1999, 2001) assuming revetment slopes between 7H:1V and 5H:1V and a revetment toe elevation of 4.0 m MLLW. The design crest height was chosen to be approximately at the maximum total water level expected for the 20-year return period event, 8.0 m MLLW.
The front slope was determined by the expected equilibrium slope under the design conditions. Engineers calculated the expected equilibrium slope based on Powell’s equilibrium slope method for gravel beach nourishment (Powell, 1993), which resulted in values between 6.5H:1V – 5H:1V. As a 5H:1V slope had also been recommended by Allan et al. (2005), it was chosen for the design.
The crest width was 4.6 m, approximately twice the annual rate of shoreline retreat at the site. Based on the crest height, width, and front slope, the volume of the revetment was between 27.6 – 30.1 m3/m over an alongshore extent of 155 m, leading to a total cobble volume of approximately 4500 m3. To avoid impacts on neighboring properties, the dynamic revetment included a 30 m taper into the existing berm on each end, with gradually decreasing crest width and height, leading to a total alongshore extent of 215 m. A dune cap with an elevation of 8.6-8.9 m MLLW was also added behind the dynamic revetment to add elevation to the crest.
The cobble specifications were chosen to balance stability, porosity, and aesthetic appeal. The core of the revetment was constructed with pit run cobble (maximum size of 305 mm), with a cap of rounded river rock (maximum grain size of 305 mm, with a D50 between 89–178 mm).
3.4.3 Monitoring, maintenance, and performance
The design engineers and condominium association used an existing beach monitoring program led by the Washington Department of Ecology to provide monitoring. Between the construction of the dynamic revetment in January 2022 and June 2023, 565.8 m3 (~13%) of material was lost from the dynamic revetment (Washington State Department of Ecology, 2023). The majority of material lost was between 4.0-6.4 m MLLW. There were two areas where the rounded river rock had eroded to expose the pit run material beneath: one on the northern half of the revetment, and one on the southern half.
Maintenance was planned for the revetment on an as-needed basis, with a potential for maintenance as often as annually. Maintenance expectations were set based on the background sand erosion of 5.0 – 15.1 m3/m (60.2 m3/m/year maximum), and the assumption that erosion volumes would be reduced by an order of magnitude for cobble as opposed to sand. Therefore, the revetment was expected to lose 76.5 - 229.4 m3 of material per year, up to a maximum of 917.5 m3/yr. The maximum estimated erosion volume of 917.5 m3/year represented 20% of the total cobble placement volume.
The first round of maintenance took place in November 2023, just under two years after construction. 243.8 m3 of rounded cobble and 49.9 m3 of pit run cobble was added on the northern half of the revetment, and 138.5 m3 of rounded cobble was added on the southern half of the revetment, for a total of 432.1 m3 of cobble (10% of original placement volume) (George Prigmore, personal communication). The intent of the maintenance was to return the dynamic revetment to its original as-built state by filling in areas that had experienced erosion (Linda Dunk, personal communication).
3.5 Empire Spit
3.5.1 Project site and goals
The Shoalwater Bay Tribal Reservation is located on the northern shoreline of Willapa Bay. Willapa Bay is a natural inlet (i.e., not stabilized by jetties), and experiences significant channel migration. Extreme water levels coincident with winter storms have historically inundated the series of barrier islands fronting the Tokeland Peninsula, known as Graveyard Spit and Empire Spit, resulting in coastal storm damage to Tribal lands and infrastructure.
When higher-than-anticipated erosion rates were observed on the northern 1.2 km of the artificial sand berm previously constructed at the Empire Spit, a dynamic revetment fronting the artificial sand berm was recommended as part of the adaptive management plan. The addition of a dynamic revetment was expected to extend the longevity of the project between nourishments, reduce the project life cycle costs, and help maintain critical shorebird habitat in the area. The dynamic revetment designed for Empire Spit is also intended to protect the barrier spit, the backing marsh, and the Shoalwater Tribal Reservation from erosion and flooding. The design life of the dynamic revetment is 50 years, with nourishment expected every 10 years. Alongshore movement of cobble is expected due to the oblique wave angle and tidal currents into and out of Willapa Bay. The project was led by the US Army Corps of Engineers (USACE), Seattle District, with funding from the Disaster Relief Supplemental Appropriation Act of 2022 (PL 117-43). The total cost for the project, including dredging and nourishment of the backing sand berm, was $32.4 million ($34 million in 2025).
3.5.2 Project design
The revetment volume was determined using equations from Ward and Ahrens (1992). A 50-year return period (or 2% annual exceedance probability) water level was used, with a toe elevation at mean high water, or 2.4 m MLLW, which led to a calculated critical cobble volume of 90.3 m3/m. Over 1.2 km of shoreline, this resulted in a total volume of 109,000 m3 of angular quarry spalls.
The geometry of the dynamic revetment was selected by numerically modeling its response to a range of storms with XBeach-G (McCall et al., 2019). The phase lag () and friction factor (fs) were calibrated using profiles from the nearby North Cove site, with optimal values of and . Several storms with return periods between 2 to 100 years were simulated based on historical data. The crest height of the dynamic revetment was set at 6.1 m MLLW and the crest width was set at 22.9 m. The seaward slope was graded at 7.5H:1V. Using XBeach-G, it was determined that this configuration would prevent overtopping of the backing sand berm, which had a crest height of 7.6 m MLLW, for all tested scenarios.
The specified material was poorly sorted angular cobble ranging from 19 mm to 203 mm, with a D50 of 152 mm. For cost-effectiveness, the cobble size that was selected matched a standard gradation used by the Washington and Oregon Departments of Transportation, ensuring that quarries were familiar with the desired cobble gradation. All material was placed on the existing grade, with the expectation that finer gravel would naturally form a filter layer between the sand and cobble through wave action as observed in the field and laboratory (Bayle et al., 2021; Foss et al., 2023).
3.5.3 Monitoring, maintenance, and performance
USACE has completed occasional monitoring. Additionally, drone monitoring has also been undertaken by the Shoalwater Bay Indian Tribe. Since construction, the 7.5H:1V slope has steepened and formed a berm seaward of the original graded revetment crest (Figure 3). Monitoring surveys following the first winter storm season show the dynamic revetment has formed an equilibrium slope of 3H:1V. The dynamic revetment has also recruited a significant volume of large woody debris on the crest of the structure and been covered by a thin layer of sand from aeolian transport.
Maintenance is expected to be necessary due to the alongshore transport of cobbles. An alongshore transport rate was empirically calculated using van Rijn (2014). To account for the percentage of time the cobble is exposed to the swash zone, an empirical parameter based on the tide level was added to the equation. This parameter was set at 0.5, indicating that the tide was expected be greater than the mean tide level approximately 50% of the time, a conservative assumption. Based on the modeled nearshore wave heights and shoreline orientation, an annual transport rate was expected to be 1,022 m3/year. However, due to uncertainty, the project has planned for additional cobbles to be used in the maintenance process, with nourishments of approximately 27,000 m3 of cobble expected every 10 years, representing 25% of the original placement volume.
3.6 Comparison
Although constructed for relatively similar environments, different project goals, constraints, design lives, and design processes led to a variety of dynamic revetment designs. While crest heights and front slopes are generally similar across designs, revetment volumes, alongshore lengths, and maintenance expectations varied widely. Figure 3 compares the as-built profiles of each project with their most recent survey, and Table 1 summarizes all design parameters.
4 Discussion and proposed design process
Dynamic revetments remain challenging to design because their performance depends on natural processes that are not fully understood. Here, we suggest a design process for dynamic revetments based on the current state of knowledge. The design process incorporates results from an informal survey (See Supplementary Section 1), design tools suggested by literature, and lessons learned from existing projects. The suggested design process acknowledges the research gaps and the limitations of current tools using an assessment of confidence for each suggested design step and tool. The design process is shown below (Figure 4), and each step is discussed in the following sections.
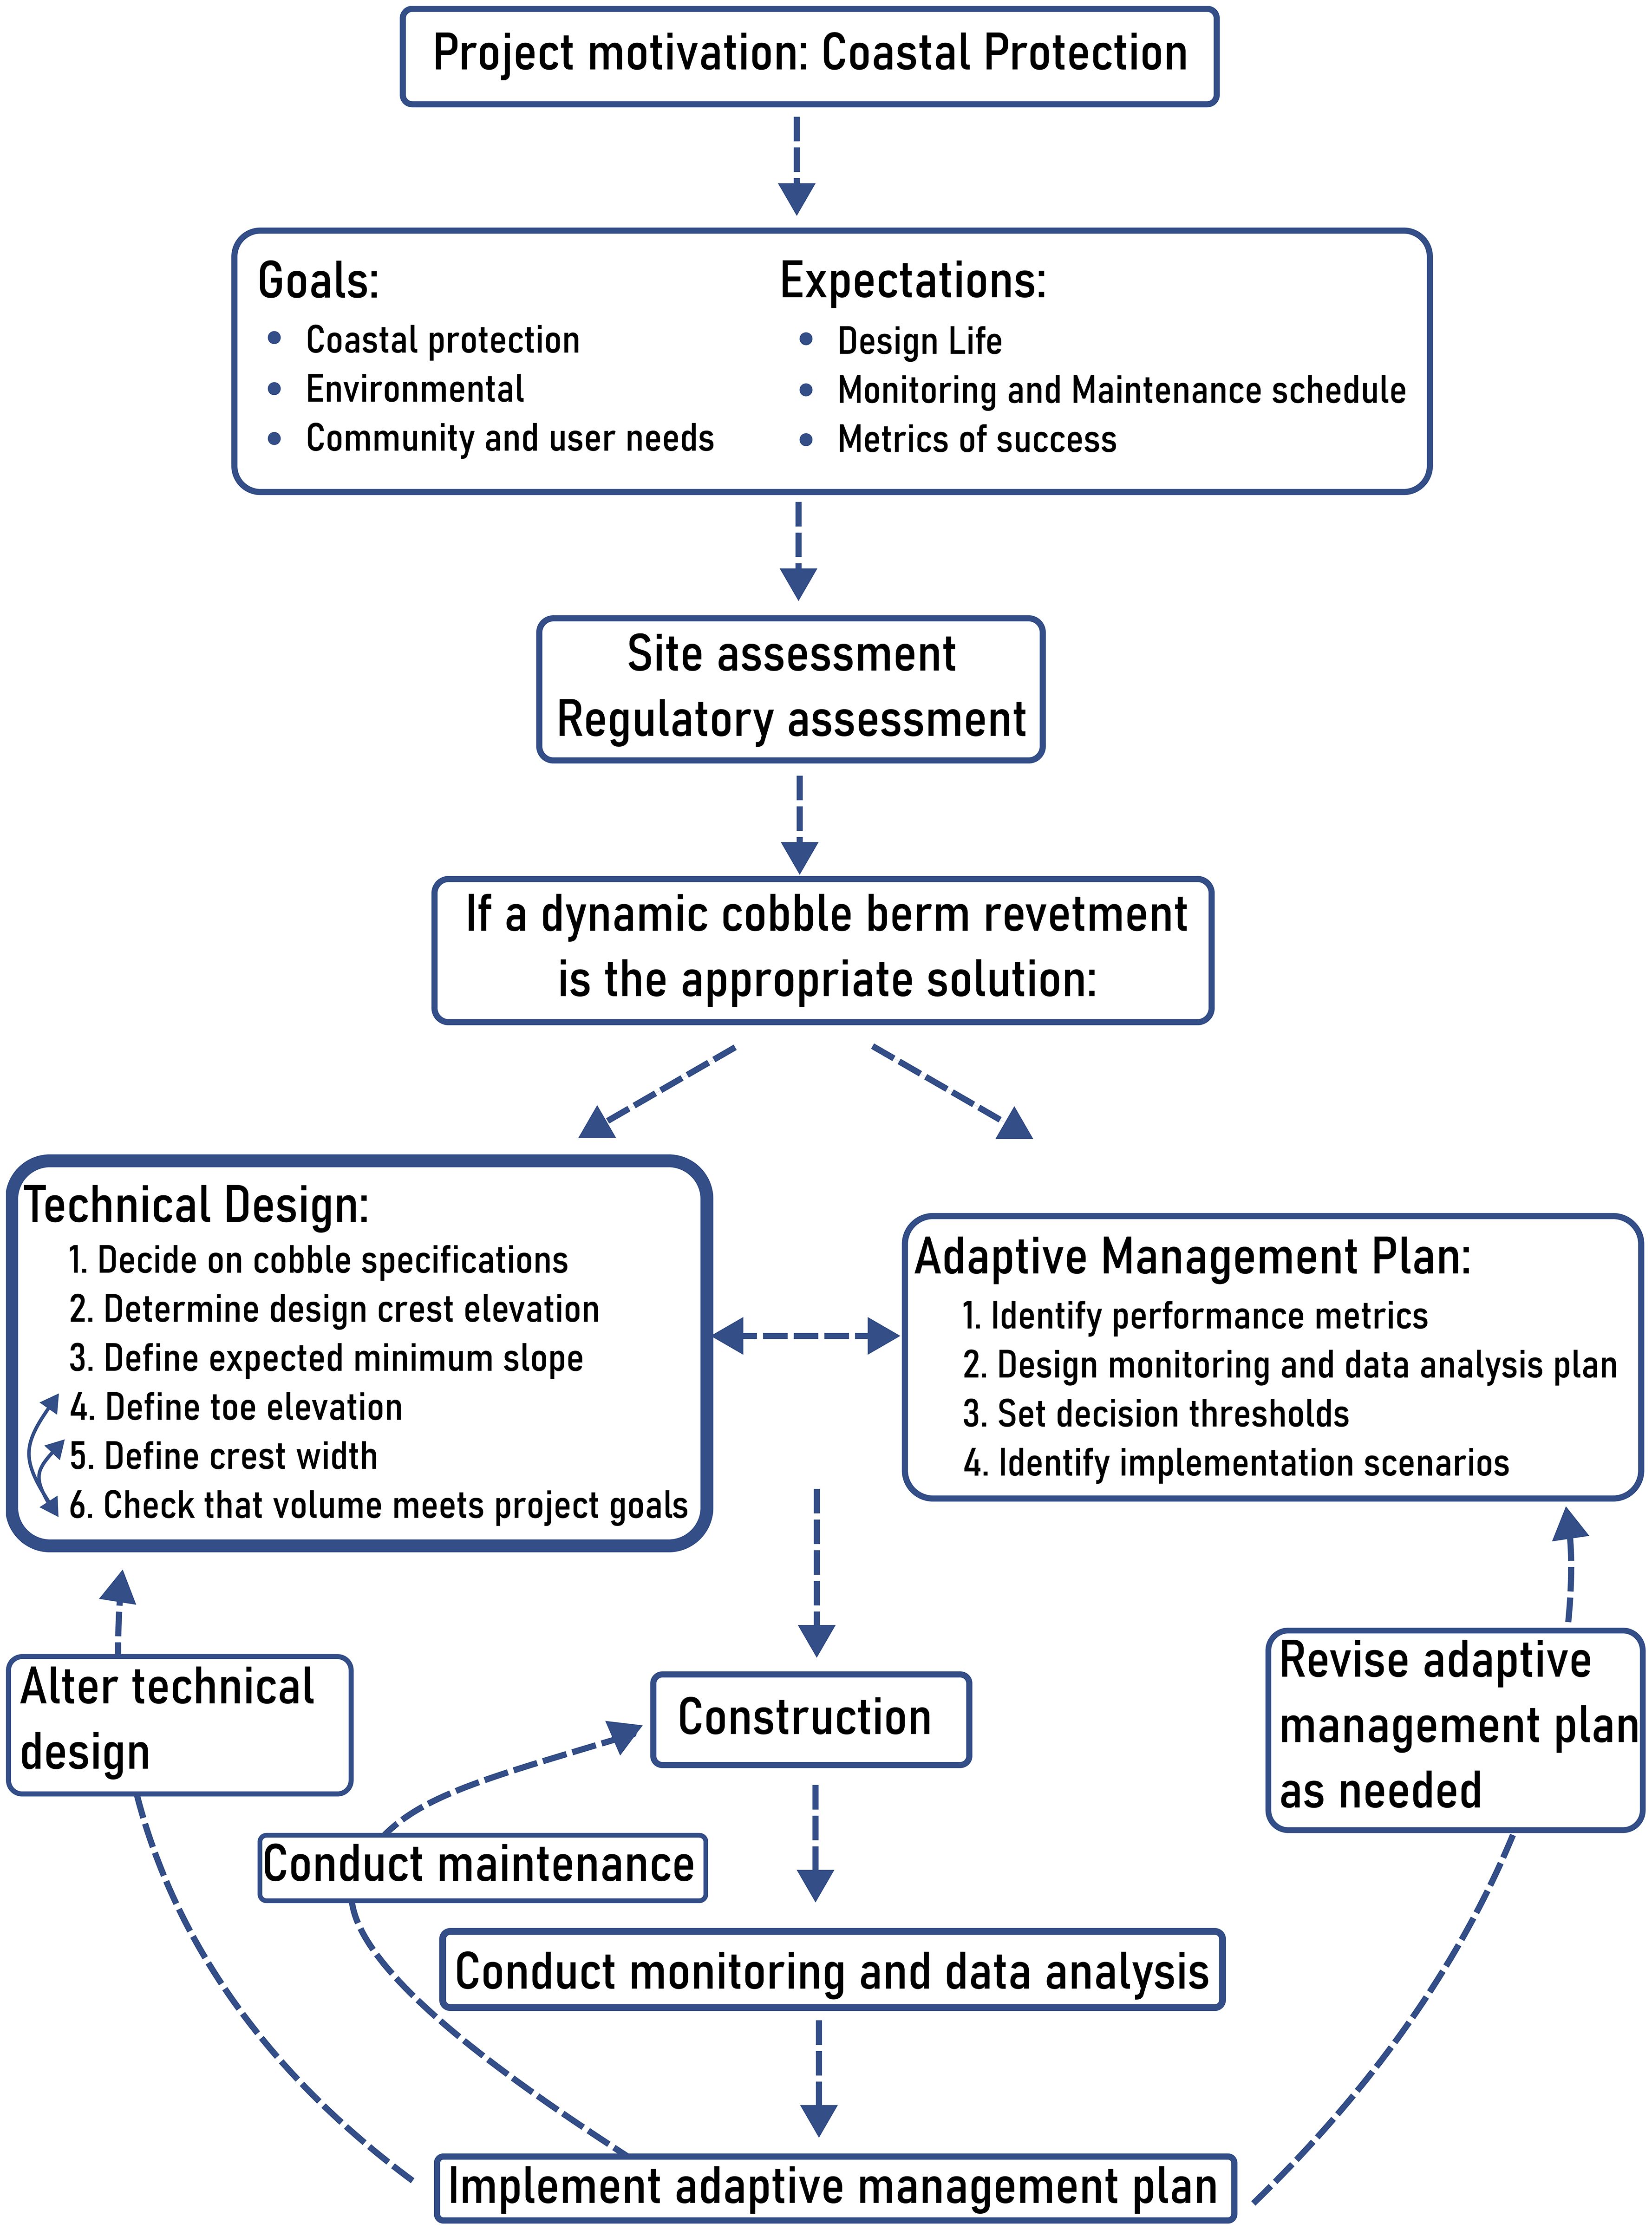
Figure 4. Flowchart of proposed design process for dynamic revetments. Existing design tools and respective assigned confidence in the tool are outlined in Table 2 for the elements in the Technical Design box (bolded).
To ensure that the design process incorporated community concerns, we informally surveyed practitioners about their opinions on dynamic revetments. Respondents included coastal engineers, coastal geomorphologists, policymakers, and community members. Respondents were mainly from the PNW and California, but other places including the UK, Canada and the East Coast of the United States were also represented. The survey covered practitioners’ main concerns about dynamic revetment implementation and performance. Engineers were also asked specifically for their opinions on the most useful and the most needed tools for design. Results of the survey are included in the Discussion in parentheses as the percentages of respondents that mentioned a given topic for any question. For more information on the survey, see Section 1 of the Supplement.
4.1 Identification of project goals and expectations
Dynamic revetments are versatile structures that can be adapted to serve many types of project goals. When beginning a potential dynamic revetment project, we suggest clarifying the project motivation, such as the need for coastal protection at the site. Next, we suggest identifying goals for the project related to coastal protection, the environment, and related to community and user needs. Coastal protection goals are typically associated with engineered coastal protection – for dynamic revetments, this may include slowing shoreline erosion (identified as a measure of success for a dynamic revetment by 88% of survey respondents), the reduction of overtopping (29%), or the retention of sand on the foreshore (41%). Environmental goals for a dynamic revetment may include limiting ecosystem disturbance (identified as a concern by 47% of respondents), avoiding the disruption of sediment transport near the structure (33%), or being a more ecologically friendly option than riprap. Community goals might include meeting funding requirements (considered a barrier to implementation by 16%), preserving beach access and recreation opportunities (considered a metric of success by 7% and 15%), and involving the community in the design process (public perception was considered a barrier to implementation by 26%). Community engagement is considered crucial for all natural and nature-based coastal protection solutions, including dynamic revetments (see Dillard et al., 2021).
Dynamic revetments generally lack standard design guidelines. Therefore, it is important to clearly set expectations for the project to ensure that the community has realistic expectations of success. First, expectations for the design life (including design wave and water level conditions) should be set. Design life can vary widely based on project goals (e.g., a design life of 5 years in Westport, Washington vs. a design life of 50 years at Empire Spit, Washington). Second, monitoring and maintenance schedule expectations should be set so the community recognizes that their structure will require regular maintenance and possibly adaptive modification. Third, expectations for the performance of a successful dynamic revetment should be established. Most people expect that a dynamic revetment will be made of cobble or gravel and that it will evolve over time (71% and 62%, respectively); however, it may still be important to prepare the community for the fact that the structure’s appearance will likely change over time. It should be clear exactly what is meant by the term “dynamic revetment”. Some explanation of the terminology might be needed: we suggest calling these structures “dynamic cobble berm revetments” when specificity is needed, “dynamic revetments” (agreed with by 60%), or “cobble berms” (suggested as an alternative by 17%). The choice of name may be dependent on the audience, for example, “dynamic cobble berm revetment” may be the appropriate name to specify to scientists that the structure replicates a composite beach; however, for a community group with hesitation about traditional revetments, “cobble berm” may be a more appropriate choice. And finally, the metrics of success for the project should also be defined. For example, in some projects, erosion reduction, rather than complete erosion prevention may be the goal. In others, the dynamic revetment may be intended as a temporary erosion prevention measure while other long-term options are explored.
An assessment of both regulatory requirements and site suitability may be necessary to determine if a dynamic revetment is a suitable solution to the coastal protection need. Permits may be needed from different agencies ranging from national agencies to local government. The permits likely need to cover the placement of cobble on the beach, even if it may evolve over time, and monitoring and maintenance. In addition, an assessment of whether a site is appropriate for a dynamic revetment may also be important. For example, a dynamic revetment placed in front of a single-family home may not be successful, as the alongshore length may be too short to be effective. Dynamic revetments may also not be suitable for beaches that do not have naturally existing rocky material, as they might impact the character of the beach beyond what a community is willing to accept. If existing uses of the beach (both recreational and ecosystem services) will be significantly impacted by cobble placement, a dynamic revetment may not be the appropriate solution. Existing conditions at the site may also be incompatible with a dynamic revetment, for example, a high alongshore transport rate and limited maintenance ability may not be conducive to the success of a dynamic revetment project. Each community considering a dynamic revetment should identify whether the placement of a dynamic revetment is appropriate for their spectrum of priorities and if the impacts of a dynamic revetment can be acceptably addressed by other aspects of the project.
Finally, before beginning the technical design, it is important to identify if dynamic revetments meet the identified project goals. Survey respondents were concerned that dynamic revetments could have negative impacts on the environment (47%), that adding cobbles might change the character of the beach (42%), that sediment transport might be disrupted (33%), or that a dynamic revetment might simply not be appropriate for the situation (17%). These concerns cannot yet be directly addressed through scientific studies, so comparisons to existing projects, engineering judgement, and attention to community concerns should be used.
4.2 Technical design process
Based on the project goals, the geometric parameters of the dynamic revetment can be designed. We propose the following design process, which incorporates the important parameters identified by survey respondents: cobble size (76%), crest height (29%), revetment slope (48%), toe elevation (29%), crest width (14%), and revetment volume (67%). This design process summarizes how these elements can be combined and adjusted to design the geometric parameters of a dynamic revetment. However, many of the suggested steps do not currently have tools developed specifically for dynamic revetments. We provide an assessment of existing tools in Table 2 with an estimate of their applicability to dynamic revetment projects. For all these steps, local case studies are a valuable resource; in fact, engineers identify local case studies as the most useful existing tool for design (82% of respondents). The final parameters may vary widely based on project goals and site specifics. Additionally, if there are design constraints such as a limited design footprint or limited accommodation space for the structure, the order of these steps may change.
1. Determine cobble size and shape. Cobble size and shape will likely be dictated by local supply and cost; however, we suggest that the D50 should be in the range of a definition of a cobble (64–256 mm) for high-energy, open coast beaches. In addition, regardless of environment, the largest cobbles should be expected to move under the hydrodynamic conditions at the site. We suggest that the cobble should be poorly sorted to enable the formation of a filter layer by the smaller cobble sizes. D85/D15 may be a useful metric in establishing the sorting. Angular cobble may be preferred for the structural and cost advantages; however, the use of rounded cobble may be considered to achieve other project goals (e.g., matching aesthetics with the existing site).
2. Determine the design crest elevation. We suggest basing the design elevation on the expected runup for a design storm that meets the project goals. We suggest adding the expected runup to an appropriate storm water level, for example, the 25 year return period water level (Westport, Section 3.4) or the 50 year return period water level (Empire Spit, Section 3.5). The design water level could be determined by evaluating the total water levels for a range of storms and completing a probabilistic analysis of those events.
3. Define an expected minimum slope. The slope of the structure should be expected to change over time in response to wave conditions. There are currently no tools that have been proven to accurately predict the slope of the cobble portion of a composite beach. However, laboratory experiments on gravel beaches (van der Meer and Pilarczyk, 1986; Powell, 1993) or a review of naturally occurring composite beaches in the area (Allan et al., 2005) could help make an estimation of the expected minimum slope for the site. The expected slope does not need to be the slope that is constructed; however, the cobble volume (see Step 6) should be sufficient for the slope to evolve to the expected minimum slope while maintaining the necessary crest height and width. Additionally, building a structure that is significantly different than the expected slope may have unexpected impacts on the site as the slope adjusts.
4. Define the expected toe elevation. This decision may be based on available space at the site, policy considerations, or other factors. If horizontal space is not a concern, we suggest reviewing typical toe elevations during the winter at nearby composite beaches. In the absence of literature about toe elevation, we suggest that the toe elevation should be no lower than mean high water (MHW). This suggestion is based on the authors’ observations of natural composite beach and successful dynamic revetment projects.
5. Define a crest width. The crest width could be set with the intention of providing space for waves to infiltrate, thus preventing overtopping. Alternatively, the crest width could be set to meet the project’s cobble volume requirements and design life (see Step 6).
6. Check that the volume indicated by the selected crest elevation, design slope, and crest width meets project objectives. Desired cobble volumes could be estimated by comparing with cobble volumes present at nearby composite beaches, or by using Ahrens (1990). If the cobble volume is lower or higher than desired, the crest elevation, crest width, and toe elevation can be altered to achieve the desired volume. The cobble volume could also be adjusted to account for anticipated alongshore losses over time depending on the project maintenance schedule. Existing projects in the PNW (especially projects in North Cove, Washington and the South Jetty of the Columbia River, Oregon) have shown that alongshore losses can represent a significant portion of the original cobble volume.
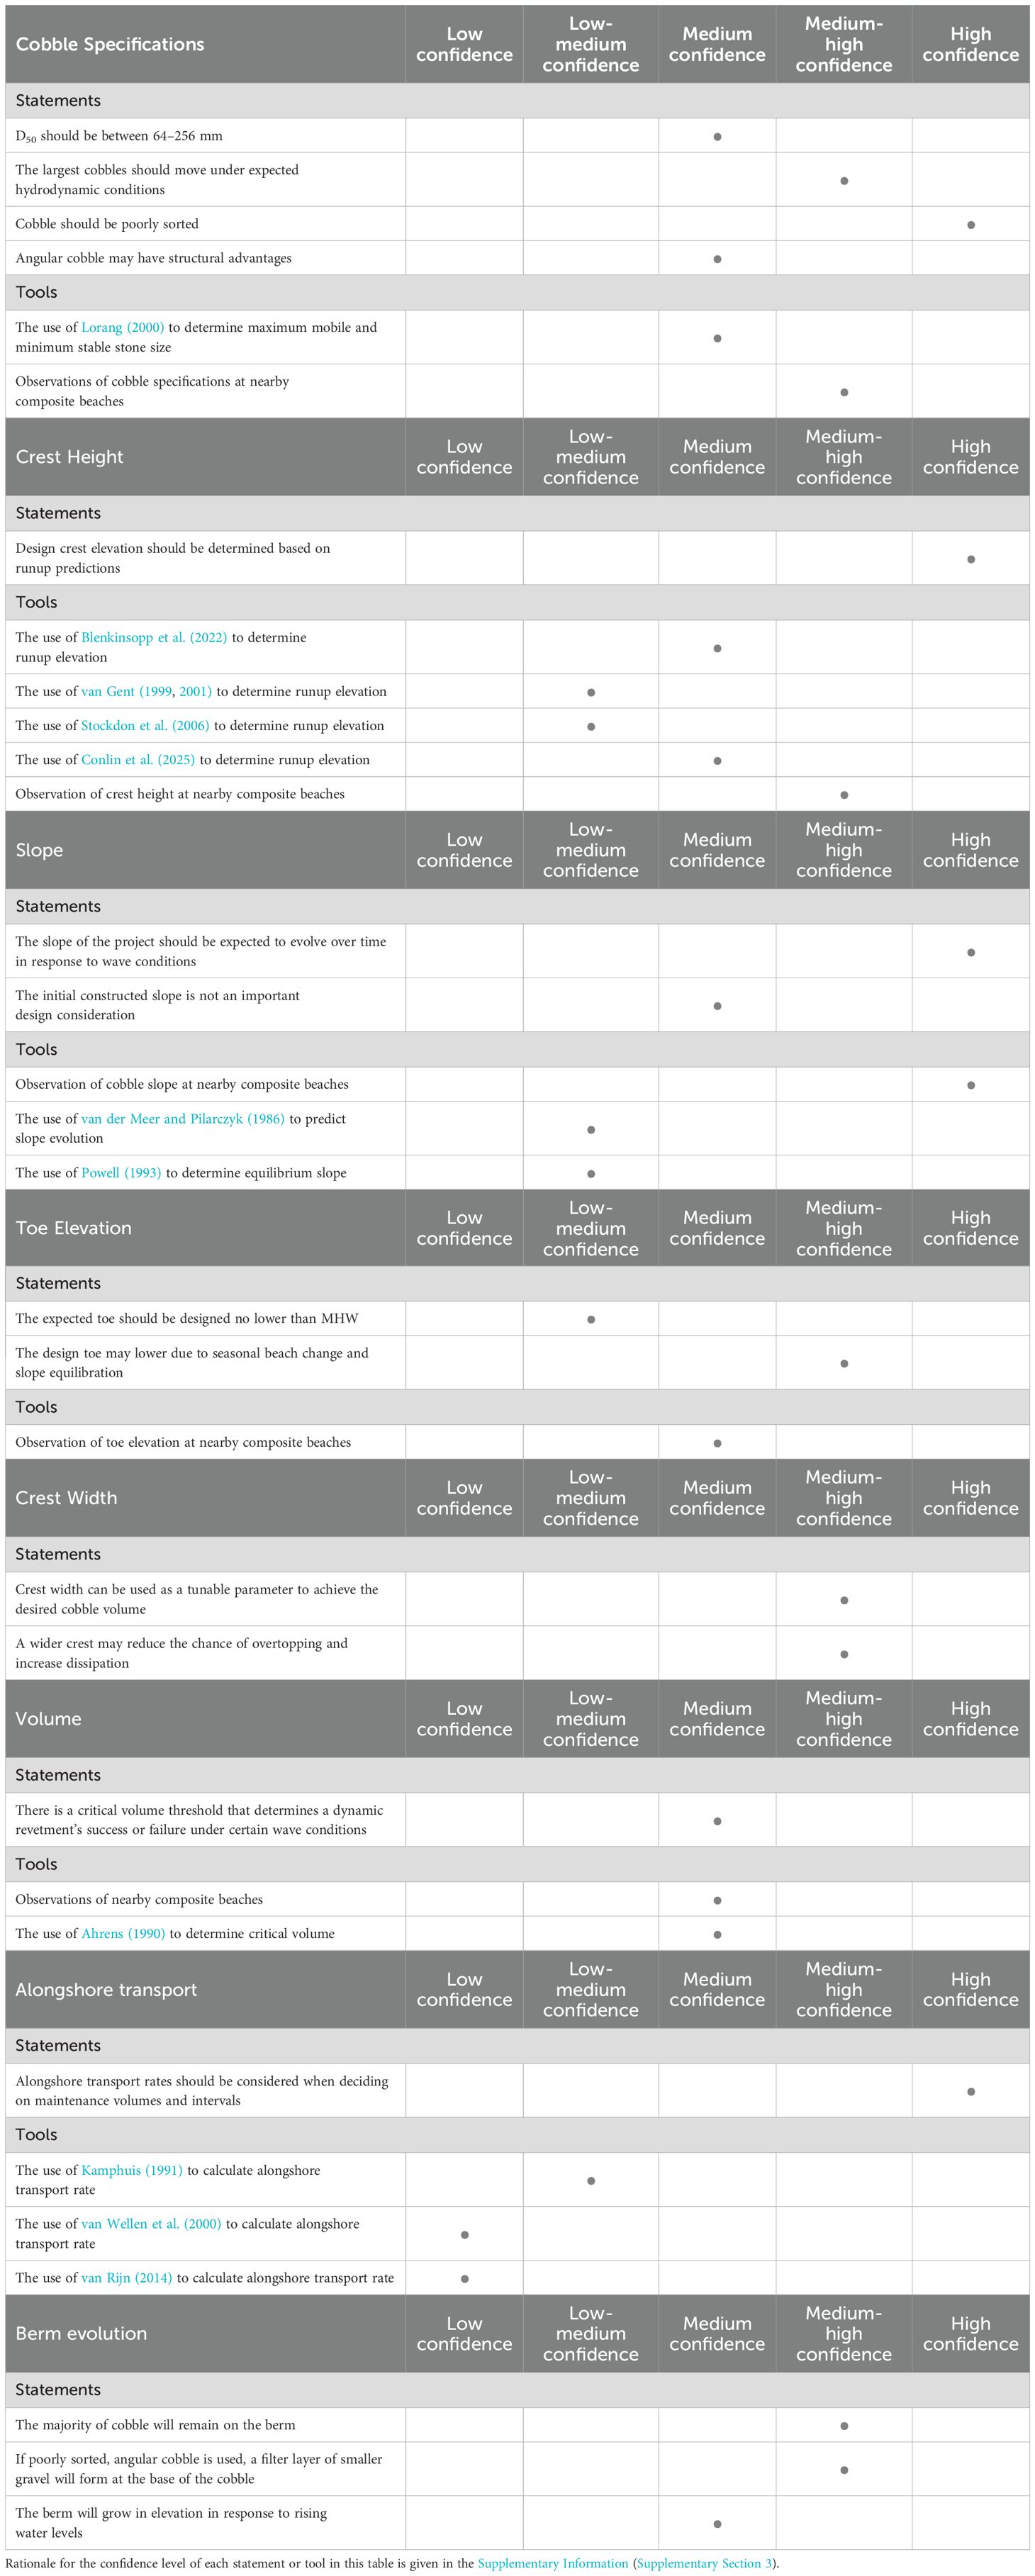
Table 2. Assessment of confidence and applicability of different suggestions and tools discussed in the Design Process and Existing Tools section.
4.3 Adaptive management plan
For natural and nature-based features, the development of an adaptive management plan is an essential part of design (de Looff et al., 2021). Survey respondents suggested that the most important elements of an adaptive management plan are monitoring (74%) and maintenance (63%). Additional needs for adaptive management are permitting adaptability (8%), funding (13%), and continued access to materials (5%). Suggestions on adaptive management for natural and nature-based projects are given in de Looff et al. (2021). Here, we adapt several of those steps to dynamic revetment projects. We suggest that the adaptive management plan and the dynamic revetment design be developed in tandem and before construction takes place. Additionally, the needed funds and permits for the project will depend on both the engineering design and the adaptive management plan. For example, a dynamic revetment that is anticipated to receive annual maintenance may not require as large of an initial cobble volume as a revetment designed to go up to 5 years between maintenance cycles. The costs and needed permits for these two different maintenance plans could also vary. The four steps of an adaptive management plan for dynamic revetments are:
1. Identify performance metrics for objectives and uncertainties to be monitored over time. Here, the goals and expectations for the project should be adapted into measurable thresholds. For example, if an engineering goal is to reduce erosion, the shoreline position and erosion rates could be useful monitoring metrics. In addition to monitoring whether the coastal protection goal is met, the revetment properties (volume, cobble transport, shape) may be monitored to determine if the dynamic revetment can continue to meet the coastal protection goal. Beach monitoring may also be necessary to identify whether the dynamic revetment is meeting its other goals. Beach monitoring could include monitoring of the sand volume in front of and to either side of the dynamic revetment, species counts, or recreational use surveys.
2. Develop monitoring and data analysis plan based on performance goals. Parts of the plan may include identifying existing monitoring in the area, who will be responsible for the monitoring, and the spatial and temporal requirements for the monitoring objectives. In this step, funding and sourcing for cobbles throughout the maintenance phase of the project should also be identified. This step could also include an evaluation of the ability and desire of the client to pay for maintenance and monitoring. Some monitoring options include:
● Annual or seasonal volume change assessment of combined cobble/sand (suggested by 19% of respondents) with remote sensing (suggested by 12%) or topographic surveys (23%).
● Event-based monitoring (suggested by 12%), which could include surveys after king tides or storms.
● Monitoring of cobble transport (suggested by 4%) with RFID or visually.
● Surf zone and swash monitoring to measure wave runup and wave direction and energy conditions.
Assessing the volume change of the dynamic revetment on time scales relevant for the structure in question may be the most important method listed here for adaptive management. Other monitoring strategies will improve site understanding, but may not actively influence adaptive management strategies. The frequency and method of monitoring should be driven by the monitoring goals. Suggestions for monitoring frequency from the survey included seasonal, biannually, or annually. The details of the monitoring plan may also be driven by permitting requirements. It should also be noted that despite the essential need for monitoring to adaptively manage NNBFs, permit-imposed, client-funded monitoring of projects can be insufficient. A monitoring plan should also establish protocols for data management and sharing, including a plan for processing, analyzing, and publishing data collected by the monitoring team.
3. Set decision thresholds (suggested by 23%). Decision thresholds are predetermined numerical thresholds at which certain maintenance actions will take place. Decision thresholds could include a percentage of volume lost on either the beach or the dynamic revetment, a specified distance of shoreline retreat, or an increase in occurrence of overtopping events (Figure 5).
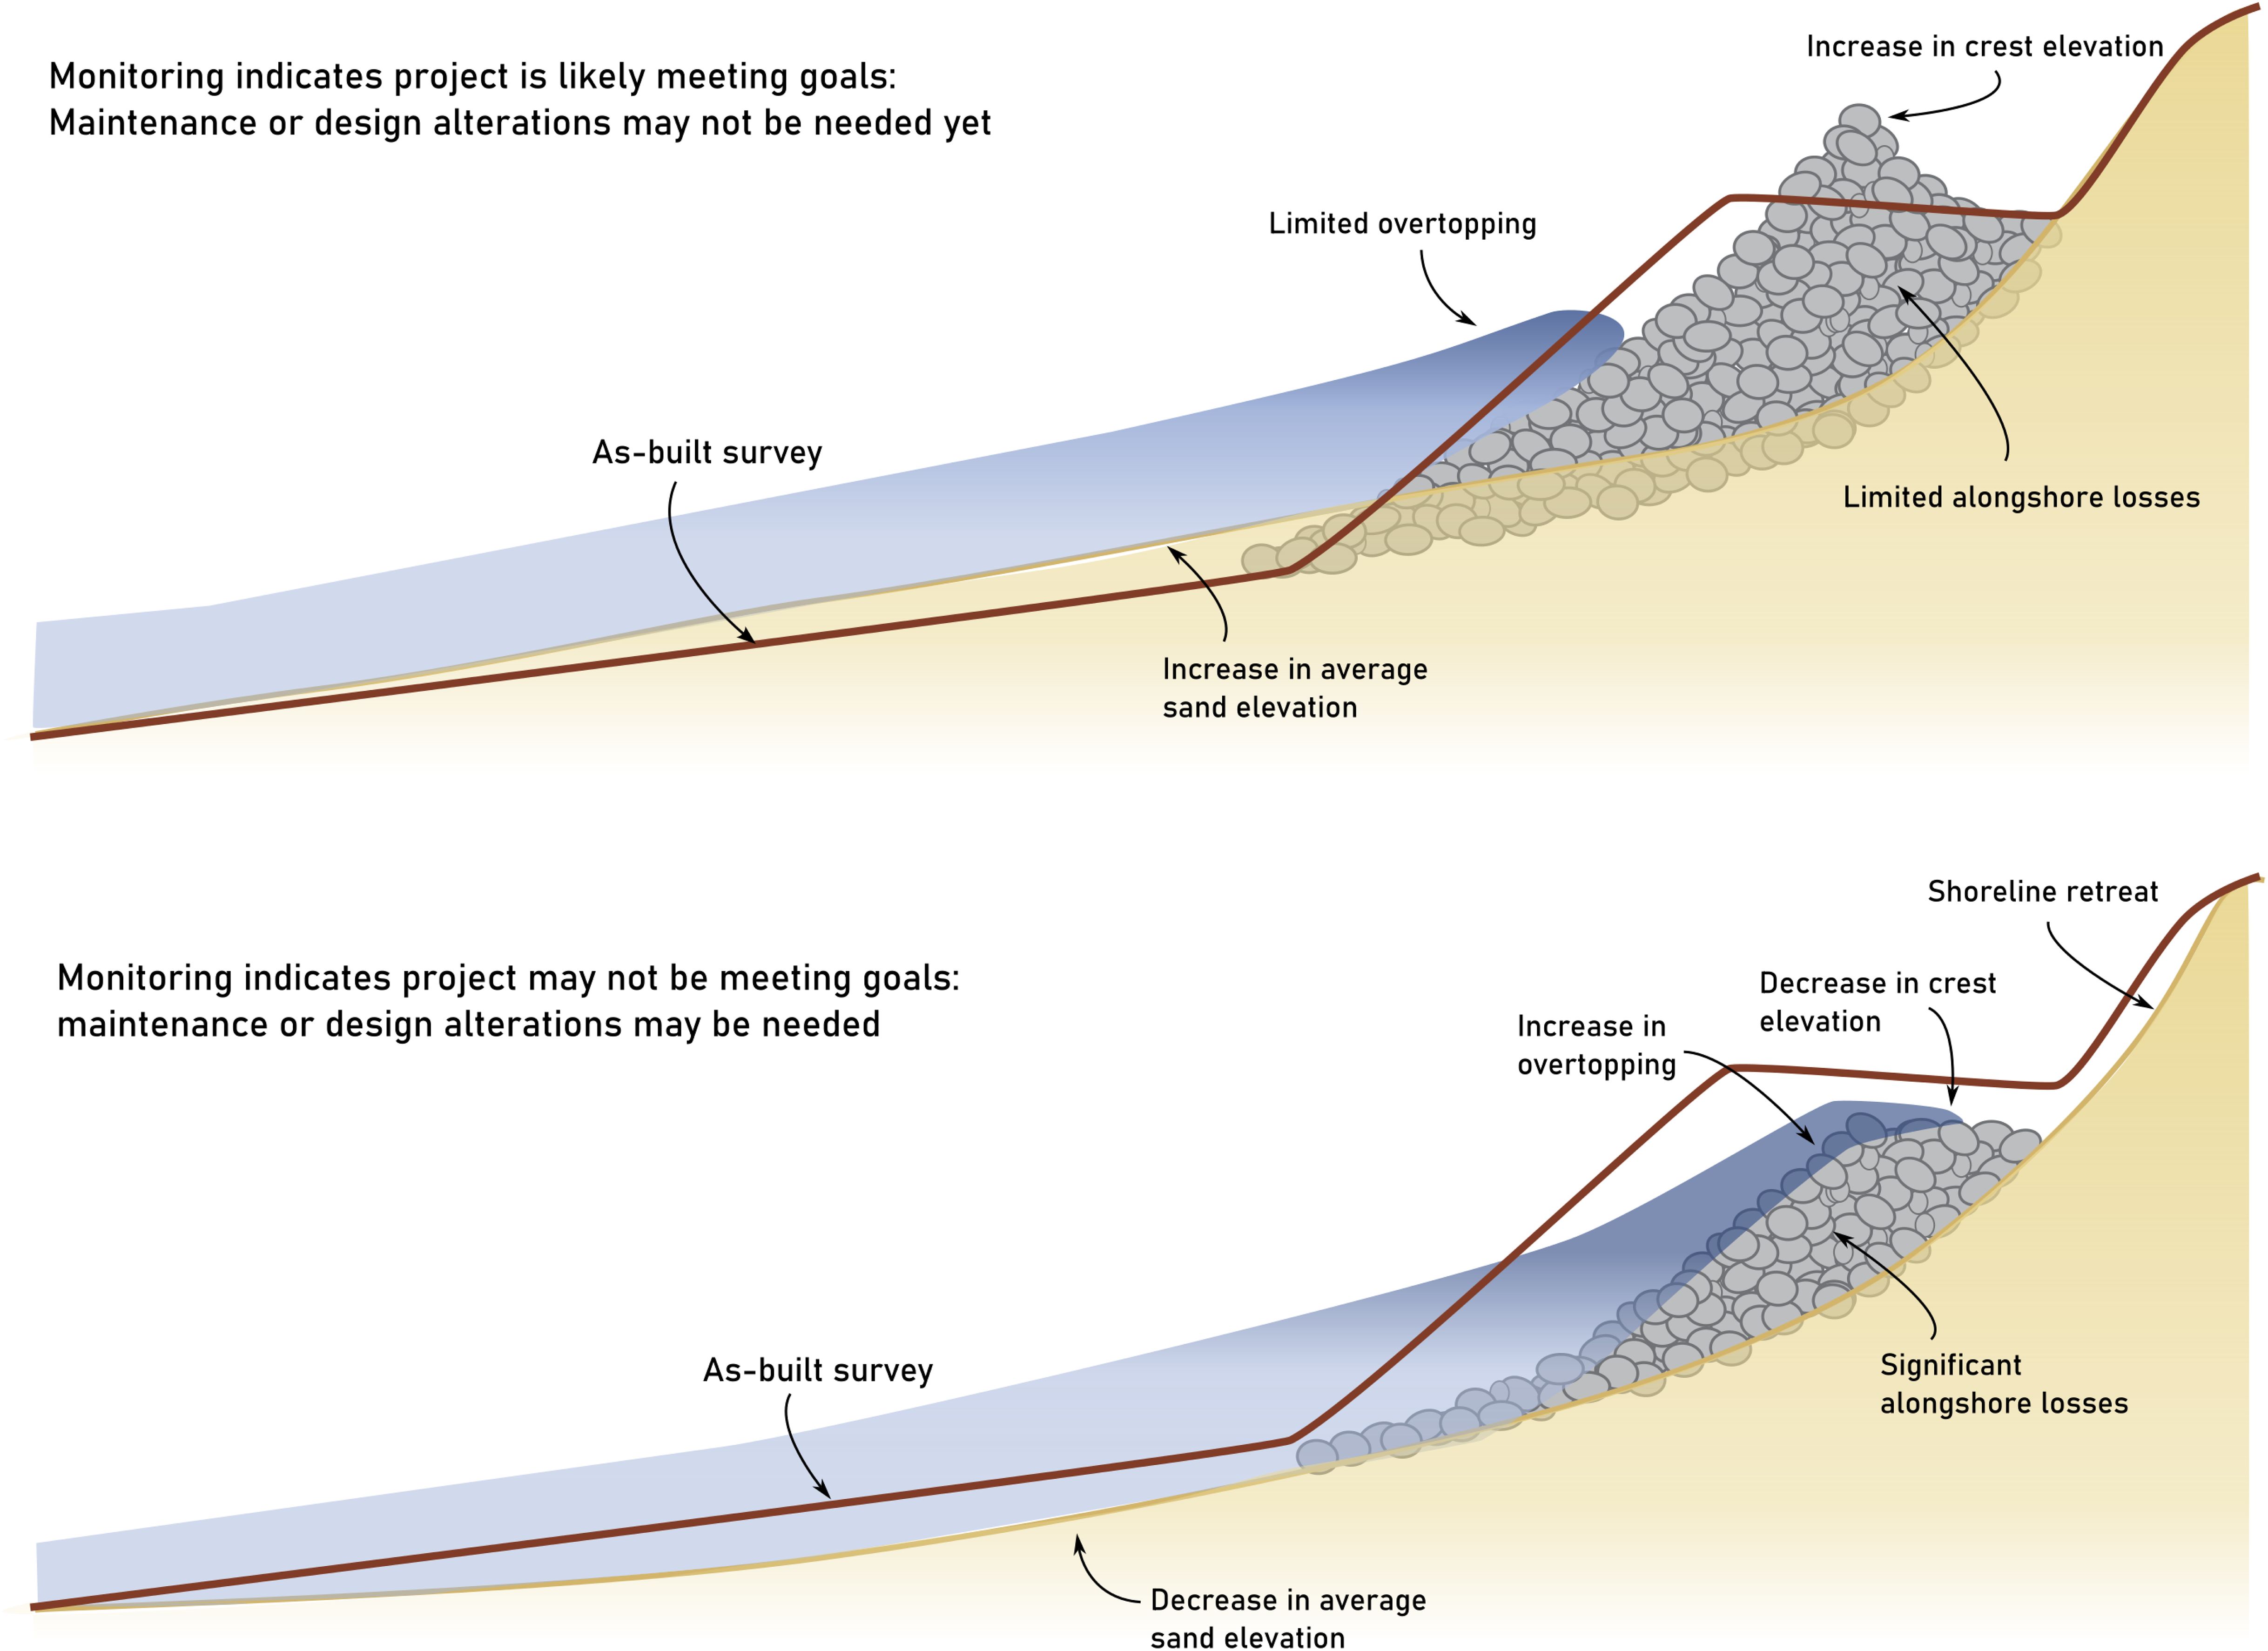
Figure 5. Illustration of potential scenarios that could trigger adaptive action.
4. Identify possible adaptive actions and scenarios for implementation over time. Adaptive actions for dynamic revetments have generally included maintenance by the addition of cobble to the revetment, but could also include design modifications based on monitoring results. Maintenance could be done by spreading cobble over the revetment, by targeting a certain area on the revetment that needs more cobble, or by using a feeder location if applicable to the site. This step should identify a range of possible scenarios of project evolution and corresponding adaptive actions so that maintenance expectations are set. We suggest that the scenarios should include the expected alongshore cobble transport at the site (while there are no alongshore transport equations developed for composite beaches, possible alternatives and confidence in them are given in Table 2). The expected alongshore transport can be combined with the desired maintenance intervals determined by the client to establish a most likely maintenance scenario. This step should also identify a material location and funding necessary for maintenance. Other potential scenarios for adaptive actions should also be considered here (e.g., overwash or loss of complementary features), to determine what the course of action might be if the dynamic revetment does not perform as anticipated or the design environmental conditions change. It should be noted that there are very few examples of adaptive management of dynamic revetments, therefore, more research and examples are needed to provide certainty for the creation and implementation of adaptive management plans.
4.4 Construction
Dynamic revetment construction is often considered to be simpler than the construction of traditional revetments as less care needs to be taken with cobble placement than with placement of traditional revetment stones. However, there are some specific construction challenges that can impact the construction of dynamic revetments. Construction methods will likely be site-specific and project dependent; however, we present a few considerations here based on the results of the survey and the review of existing projects.
1. The source of cobbles can be a main constraint on the design of a dynamic revetment (mentioned by 45% of survey respondents). Identifying a cobble source that is cost-effective for the project can be a determining factor for the cobble size and shape used. In addition, there must be a cobble source identified for maintenance of the project.
2. If the dynamic revetment is constructed during the summer, consideration must also be given to the development of the winter profile in the sand. In one project (South Jetty) the choice was made to excavate the sand to place the cobble toe at the expected winter profile. In others (Empire Spit, Westport), the cobble was placed onto the sand with no excavation and expected to evolve as the sand evolved to its winter profile.
3. In one project (South Jetty), a filter layer was placed below the cobble to prevent erosion of the sand underneath the dynamic revetment. In other projects (Westport, Empire Spit), a filter layer was expected to form naturally. Based on field (Bayle et al., 2021) and lab (Foss et al., 2023) studies that showed the formation of a natural filter layer, we suggest that a constructed filter layer is not necessary, provided that the poorly sorted materials used in construction provides a sufficient particle size gradation to include fine gravel.
Finally, after construction, the adaptive management plan can be carried out. An as-built survey conducted immediately upon completion of construction is an important baseline for documenting how the project evolves over time. In addition, we encourage the publication of findings from the monitoring plan in the form of journal articles or monitoring reports so that they increase the overall knowledge about dynamic revetments and advance the state of the practice.
4.5 Limitations and future work
As identified in the practitioner survey, there is still a general lack of knowledge about dynamic revetments and their performance. To provide readers with a realistic assessment of the applicability of all the suggestions put forward in the design process, we have rated our confidence in every technical suggestion in this suggested design process. Statements (e.g., “Cobble D50 should be between 64–256 mm”) and suggested design tools (e.g., the use of Blenkinsopp et al. (2022) for determining runup or the use of Lorang (2000) for determining cobble size) are rated on a scale of low confidence to high confidence in their applicability to dynamic revetment design (Table 2). The ratings are based on the information in the practitioner survey, existing design tools, and existing projects presented in this manuscript, as well as the authors’ experience. The confidence ratings are intended to provide a realistic assessment of which aspects of dynamic revetment design and performance are well understood, and which are not. The rationale for each rating can be found in the Supplementary Materials (Supplementary Section 3).
The levels of confidence for the hypotheses and tools presented in Table 2 highlight the need for more research on dynamic revetments and composite beaches. First, the natural processes of the system need to be better understood. Studies on gravel beaches have observed (e.g., Almeida et al., 2015; Austin and Masselink, 2006b) and modeled (McCall et al., 2019) swash processes on a porous bed. However, these results have not been applied to composite beaches, where sand is present. The location and development of the sand-cobble interface may be an important element in better understanding and modeling swash processes (van Gent et al., 2009; McCall et al., 2019; Zaalberg, 2019); however, measurements of the sand-cobble interface are challenging. Some studies have made observations of the sand-cobble interface (Bayle et al., 2020, 2021), but more observations are needed to understand the development of the sand-cobble interface under hydrodynamic and aeolian forcing. More testing on the impact of the geometric properties of the dynamic revetment (e.g., cobble volume, front slope, crest width, toe elevation, etc.) on cobble motion and berm development is also needed before the response of the cobble berm to different wave and water level conditions can be predicted.
The lack of performance predictions is hampering implementation of dynamic revetments as a method of erosion control, as noted by 28% of survey respondents. To improve performance expectations, more reliable predictive tools are needed. The predictive tools could be either empirical equations tested for composite beaches (such as Blenkinsopp et al. (2022) for wave runup) or could be morphological models (McCall et al., 2019). We generally ranked empirical predictive equations as lower confidence than observations of nearby composite beaches, because the majority of these empirical tools were not developed specifically for composite beaches. Studies examining the application of these tools to composite beaches and the development of new tools will increase confidence in empirical predictions of dynamic revetment behavior and assist engineers in designing each element of the technical design and adaptive management plan.
The survey also indicated that more research is needed to understand the impacts of dynamic revetments. For example, the ecological impacts of dynamic revetments on their surroundings, including vegetation and animals, especially threatened species is poorly understood. To address this gap, measurements of species richness and diversity are needed on naturally occurring composite beaches and dynamic revetments. Additionally, the ecology of areas where dynamic revetments have been installed should be studied in comparison to areas with no intervention (see Cowen et al., 2015 for an ecological comparison between a dynamic revetment and an nearby unprotected shoreline, and Toft et al., 2023 and Des Roches et al., 2024 for similar studies on shoreline restoration). Additionally, it should be noted that dynamic revetments and other nature-based shoreline protection measures may cause positive ecological impacts by increasing the intertidal habitat (Cowen et al., 2015; Bozzeda et al., 2025). Finally, another point raised by several survey respondents is the potential for impacts to recreation and beach access due to dynamic revetment construction. For example, at the Mouth of the Columbia River: South Jetty project, anecdotal reports from razor clammers have indicated that cobbles from the dynamic revetment are impacting the clam guns used to harvest clams. However, impacts to recreation have not been systematically quantified.
Furthermore, there are no studies yet on the impacts of dynamic revetments in comparison to traditional structures such as riprap or seawalls, or in comparison to other nature-based solutions such as beach nourishment or dune construction. As such, practitioners must use their own judgement in deciding if a dynamic revetment is the best project alternative. However, lessons learned from previous projects can provide some guidance. In two projects presented in Section 3 (Westport, Section 3.4 and Empire Spit, Section 3.5), dynamic revetments have been successfully implemented after the failure of dune construction at the sites. At the South Jetty of the Columbia River (Section 3.2), a dynamic revetment was chosen over both riprap and sand fill options by a Value Engineering panel. Finally, in Cape Lookout, a riprap revetment was estimated to be four times the cost of the dynamic revetment that was placed at the site (Section 3.1). In addition to lessons learned from previous projects, there is also evidence that, while generally effective at protecting the backshore, riprap and seawalls can also cause erosion on the beach (Pilkey et al., 1988; Kraus and McDougal, 1996). The known negative effects of traditional structures may motivate practitioners to explore dynamic revetments as a nature-based alternative.
Lastly, the scope of this design process is limited to dynamic revetments (i.e., artificial composite beaches) on high-energy outer coastlines. We hope that others will test, add to, and refine these recommendations and help fill the outlined gaps in knowledge. We also encourage the cautious application of the proposed design process to other environments (e.g. estuaries) where other design guidance is unavailable.
5 Summary
In this manuscript, we summarized the state of the practice for dynamic cobble berm revetment design and construction. We summarized existing tools for the design and implementation of dynamic cobble berm revetments on high energy outer coastlines and assessed their applicability. There are a variety of tools that could justifiably be applied for dynamic revetment design, but many of the tools come from other bodies of literature, such as gravel and shingle beaches, riprap design, and dissipative sandy beaches. There were few tools developed specifically for natural composite beaches or dynamic revetments.
We reviewed 5 existing dynamic cobble berm revetment projects in the PNW, and summarized their design approach, maintenance plan, and performance. We focused on the PNW because there is a high interest in dynamic cobble berm revetments, and a high concentration of existing dynamic cobble berm revetment projects in the PNW. The existing PNW projects have similarities and differences that are mainly related to their design goals (e.g., prevention vs. reduction of erosion), site, and funding availability. Each constructed project also used a different design process and set of engineering tools, leading to slightly different project designs.
Based on the existing tools, existing projects, and results from an informal survey, we proposed a design process for dynamic cobble berm revetments (Figure 4). The design process suggests considerations for project planning and expectation setting based on previous literature. It also suggests a technical design process for determining the important design parameters of a dynamic revetment based on synthesis of information from existing dynamic revetment design reports. We evaluated our confidence in each of the steps of the technical design process to give a realistic overview of the limitations of the current state of the practice (Table 2). Finally, we use existing literature and suggestions from the survey to suggest an adaptive management plan, including potential indicators of needed maintenance (Figure 5).
In the future, the state of the practice of dynamic cobble berm revetments will continue to evolve by learning from an increasing number of existing projects and longer term or more in-depth evaluation of those projects over time. Herein, we identified the need for the development of predictive tools and numerical models that will assist in dynamic revetment design, and several research gaps where current tools for prediction of dynamic revetment performance are lacking. Overall, we hope that the reader recognizes the importance of understanding the present uncertainties and need for continued efforts toward adapting and optimizing the design of dynamic cobble berm revetments as a nature-based coastal protection measure.
Author contributions
HB: Conceptualization, Writing – original draft, Writing – review & editing. MW: Conceptualization, Supervision, Writing – review & editing. CB: Conceptualization, Writing – review & editing. PB: Conceptualization, Writing – review & editing. GK: Conceptualization, Writing – review & editing. JA: Conceptualization, Writing – review & editing. DM: Writing – review & editing. KO: Writing – review & editing. HM: Writing – review & editing.
Funding
The author(s) declare that financial support was received for the research and/or publication of this article. H.G. Bond, M. Wengrove, and K.S. Ostrow were funded by the US Army Corps of Engineers (W912HZ2120045). H.G. Bond was additionally funded by Oregon Sea Grant (NA22OAR4170102). C. Blenkinsopp was supported by a Royal Academy of Engineering Leverhulme Trust Research Fellowship.
Acknowledgments
The authors gratefully acknowledge all the survey respondents, who provided us with important insight into current views on dynamic cobble berm revetments. We would also like to thank the reviewers for their thoughtful comments and suggestions. We would like to dedicate this paper to David Cottrell, whose keen observational eye and dedication to learning from nature has served his community of North Cove, Washington and pushed the state of the practice of dynamic revetments forward. More information about David’s contributions to our knowledge of dynamic revetments can be found here: https://www.theguardian.com/environment/2022/oct/08/coastal-erosion-washington-climate-crisis-solution.
Conflict of interest
The authors declare that the research was conducted in the absence of any commercial or financial relationships that could be construed as a potential conflict of interest.
Correction note
This article has been corrected with minor changes. These changes do not impact the scientific content of the article.
Generative AI statement
The author(s) declare that no Generative AI was used in the creation of this manuscript.
Publisher’s note
All claims expressed in this article are solely those of the authors and do not necessarily represent those of their affiliated organizations, or those of the publisher, the editors and the reviewers. Any product that may be evaluated in this article, or claim that may be made by its manufacturer, is not guaranteed or endorsed by the publisher.
Supplementary material
The Supplementary Material for this article can be found online at: https://www.frontiersin.org/articles/10.3389/fmars.2025.1603318/full#supplementary-material
References
Boehlert G., Nelson W., Allan J., Harris E., Stephensen S., Politano V., et al. (2012). Hatfield Marine Science Center Dynamic Revetment Project DSL permit #45455-FP: Monitoring Report February, 2012. Newport, Oregon, USA: Hatfield Marine Science Center, Oregon State University.
Allan J. C. and Gabel L. L. (2016). Open file report O-16-07: monitoring the response and efficacy of a dynamic revetment (Coastal Field Office, Newport, OR, USA: Columbia River South Jetty, Clatsop County, Oregon). Available online at: https://pubs.oregon.gov/dogami/ofr/O-16-07.pdf.
Allan J. C., Gabel L. L., and Brien F. O. (2018). BEACH AND SHORELINE DYNAMICS IN THE CANNON BEACH LITTORAL CELL : IMPLICATIONS FOR DUNE MANAGEMENT. (Oregon Department of Geology and Mineral Industries).
Allan J. C., Gabel L., and O’Brien F. (2023). Monitoring the response and efficacy of a dynamic revetment constructed adjacent to the Columbia River South Jetty, Clatsop County, Oregon: 2013-2022. World Scientific 933–947. doi: 10.1142/9789811275135_0088
Allan J. C., Geitgey R., and Hart R. (2005). Dynamic revetments for coastal erosion in Oregon. Available online at: http://library.state.or.us/repository/2011/201107141045174/index.pdf (Accessed 2021).
Allan J. C., Hart R., and Tranquili J. V. (2006). The use of Passive Integrated Transponder (PIT) tags to trace cobble transport in a mixed sand-and-gravel beach on the high-energy Oregon coast, USA. Mar. Geol. 232, 63–86. doi: 10.1016/j.margeo.2006.07.005
Allan J. C., Komar P. D., and Hart R. (2004). “A Dynamic Revetment and Reinforced Dune as “Natural” Forms of Shore Protection in an Oregon State Park,” in Coastal Structures 2003 (American Society of Civil Engineers, Reston, VA), 1048–1060. doi: 10.1061/40733(147)86
Almeida L. P., Masselink G., Russell P. E., and Davidson. M. A. (2015). Observations of gravel beach dynamics during high energy wave conditions using a laser scanner. Geomorphology 228, 15–27. doi: 10.1016/j.geomorph.2014.08.019
Austin M. J. and Masselink G. (2006a). Observations of morphological change and sediment transport on a steep gravel beach. Mar. Geol. 229, 59–77. doi: 10.1016/j.margeo.2006.02.003
Austin M. J. and Masselink G. (2006b). Swash-groundwater interaction on a steep gravel beach. Continental Shelf Res. 26, 2503–2519. doi: 10.1016/j.csr.2006.07.031
Bayle P. M., Blenkinsopp C. E., Conley D., Masselink G., Beuzen T., and Almar R.. (2020). Performance of a dynamic cobble berm revetment for coastal protection, under increasing water level. Coast. Eng. 159, 103712. doi: 10.1016/j.coastaleng.2020.103712
Bayle P. M., Kaminsky G. M., Blenkinsopp C. E., Weiner H. M., and Cottrell D. (2021). Behaviour and performance of a dynamic cobble berm revetment during a spring tidal cycle in North Cove, Washington State, USA. Coast. Eng. 167, 103898. doi: 10.1016/j.coastaleng.2021.103898
Bayle P. M., Blenkinsopp C. E., Martins K., Kaminsky G. M., Weiner H. M., and Cottrell D. (2023). Swash-by-swash morphology change on a dynamic cobble berm revetment: High-resolution cross-shore measurements. Coast. Eng. 184. doi: 10.1016/j.coastaleng.2023.104341
Blenkinsopp C. E., Bayle P. M., Martins K., Foss O. W., Almeida L.-P., Kaminsky G. M., et al. (2022). Wave runup on composite beaches and dynamic cobble berm revetments. Coast. Eng. 176, 104148. doi: 10.1016/j.coastaleng.2022.104148
Bond H. (2021). Guidebook on Erosion Control Practices of the Oregon coast. Oregon Department of Land Conservation and Development.
Bozzeda F., Fanini L., Costantini F., Mikac B., and Colangelo M. A. (2025). Estuarine, Coastal and Shelf Science Disentangling the effects of sandy beach management on intertidal macrobenthic fauna : A path analysis approach. Estuarine Coast. Shelf Sci. Oregon Department of Land Conservation and Development 319, 109254. doi: 10.1016/j.ecss.2025.109254
Bridges T., et al. (2021). International guidelines on natural and nature-based features for flood risk management. Available online at: https://hdl.handle.net/11681/41946 (Accessed April 18, 2022).
Casamayor M., Alonso I., Valiente N. G., and Sánchez-García M. J. (2022). Seasonal response of a composite beach in relation to wave climate. Geomorphology 408. doi: 10.1016/j.geomorph.2022.108245
Conlin M. P., Wilson G., Bond H., Ardag D., and Arnowil C. (2025). Predicting wave runup on composite beaches. Coastal Engineering, 199. doi: 10.1016/j.coastaleng.2025.104743
Cowen R., Nelson W., Allan J., Arbuckle S., Laboratory H., and Folger C. (2015). Hatfield Marine Science Center Dynamic Revetment Project DSL permit 45455-FP Monitoring Report February, Newport, Oregon, USA; Hatfield Marine Science Center, Oregon State University, Vol. 2014. 1–51.
de Looff H., Welp T., Snider N., Wilmink R., Bridges T. S., King J. K., et al. (2021). “Chapter 7: Adaptive Management., International Guidelines on Natural and Nature-Based Features for Flood Risk Management,”. Ed. Bridges T. S., et al (U.S. Army Engineer Research and Development Center, Vicksburg, MS).
Des Roches S., Accola K. L., Faulkner H. S., Morgan J. R., Perla B. S., Metler M., et al. (2024). Shoreline restoration including armor removal and log placement affect ecosystem recovery through time. Restoration Ecology 32, 1–14. doi: 10.1111/rec.14097
Dickson M. E., Kench P. S., and Kantor M. S. (2011). Longshore transport of cobbles on a mixed sand and gravel beach, southern Hawke Bay, New Zealand. Mar. Geol. 287, 31–42. doi: 10.1016/j.margeo.2011.06.009
Dillard M., et al. (2021). “Chapter 3: Engaging Communities and Stakeholders in Implementing NNBF,” in International Guidelines on Natural and Nature-Based Features for Flood Risk Management. Ed. Bridges T. S., et al (Vicksburg, Mississippi, USA: U.S. Army Engineer Research and Development Center).
Drummond H., et al. (2021). Integrating nature-based engineering designs and adaptive management strategies for a resilient coast in North Cove, WA. Available online at: https://wacoastalnetwork.com/wp-content/uploads/2021/10/Drummond_ASBPA2021_Poster_NorthCove.pdf (Accessed September 23, 2024).
Ellenson A., Revell D., Jamieson M., and Blakesley S. (2023). Influence of living shoreline elements on wave run up elevations. Shore Beach 91, 30–37. doi: 10.34237/10091224
Everts C. H., Eldon C. D., and Moore J. (2002). Performance of cobble berms in Southern California. Shore Beach 70, 5–14.
Foss O., Blenkinsopp C. E., Bayle P. M., Martins K., Schimmels S., and Almeida L. P. (2023). Comparison of dynamic cobble berm revetments with differing gravel characteristics. Coast. Eng. 183, 104312. doi: 10.1016/j.coastaleng.2023.104312
Grottoli E., Bertoni D., Ciavola P., and Pozzebon A. (2015). Short term displacements of marked pebbles in the swash zone: Focus on particle shape and size. Mar. Geol. 367, 143–158. doi: 10.1016/j.margeo.2015.06.006
Jennings R. and Shulmeister J. (2002). A field based classification scheme for gravel beaches. Mar. Geol. 186, 211–228. doi: 10.1016/S0025-3227(02)00314-6
Johannessen J. W. (2001). Soft Shore Protection as an Alternative to Bulkheads — Projects And Monitoring Driftwood Beach, Blakely Island.
Kaminsky G. M., Ruggiero P., Buijsman M. C., McCandless D., and Gelfenbaum G. (2010). Historical evolution of the Columbia River littoral cell. Mar. Geol. 273, 96–126. doi: 10.1016/j.margeo.2010.02.006
Kamphuis J. W. (1991). Alongshore sediment transport rate. J. Waterway Port Coast. Ocean Eng. 117, 624–640. doi: 10.1061/(ASCE)0733-950X(1991)117:6(624
Kamphuis J. W., Davies M. H., Nairn R. B., and Sayao O. J. (1986). Calculation of littoral sand transport rate. Coast. Eng., 1–21. doi: 10.1016/0378-3839(86)90036-0
Komar P. D. and Allan J. C. (2009). Design with nature” strategies for shore protection : The construction of a cobble berm and artificial dune in an Oregon state park Vol. 4254 (Puget Sound Shorelines and the Impacts of Armoring : Proceedings of a State of the Science Workshop), 117–126. Available online at: http://pubs.usgs.gov/sir/2010/5254/pdf/sir20105254_chap12.pdf (Accessed 2021).
Kraus N. C. and McDougal W. G. (1996). The effects of seawalls on the beach : part I, an updated literature review. J. Coast. Res. 12, 691–701. Available at: https://www.jstor.org/stable/4298517
LeRoux N. K., Pavlovskii I., O’Sullivan A. M., Mulligan R. P., Bonnington A. C., Kurylyk B. L., et al. (2024). Morphodynamics of a composite sand-cobble beach in response to extratropical cyclone Fiona and seasonal wave variability. Sci. Total Environ. 916. doi: 10.1016/j.scitotenv.2024.170077
Lorang M. S. (2000). Predicting threshold entrainment mass for a boulder beach. J. Coast. Res. 16, 432–445. Available online at: https://www.jstor.org/stable/4300052 (Accessed February 19, 2024).
Luijendijk A., Hagenaars G., Ranasinghe R., Baart F., Donchyts G., Aarninkhof S., et al. (2018). The state of the world’s beaches. Sci. Rep. 8, 1–11. doi: 10.1038/s41598-018-24630-6
Masselink G. and Li L. (2001). The role of swash infiltration in determining the beachface gradient: A numerical study. Mar. Geol. 176, 139–156. doi: 10.1016/S0025-3227(01)00161-X
McCall R., Rijper H., and Blenkinsopp C. E. (2019). Towards the development of a morphological model for composite sand-gravel beaches, 1889–1900. Proceedings of the Coastal Sediments. doi: 10.1142/9789811204487_0163
Medellín G., Brinkkemper J. A., Torres-Freyermuth A., Appendini C. M., Mendoza E. T., Salles P., et al. (2016). Run-up parameterization and beach vulnerability assessment on a barrier island: A downscaling approach. Natural Hazards Earth System Sci. 16, 167–180. doi: 10.5194/nhess-16-167-2016
Mentaschi L., Vousdoukas M. I., Pekel J.-F., Voukouvalas E., and Feyen L. (2018). Global long-term observations of coastal erosion and accretion. Sci. Rep. 8, 1–11. doi: 10.1038/s41598-018-30904-w
Oak H. L. (1984). The boulder beach: A fundamentally distinct sedimentary assemblage. Ann. Assoc. Am. Geographers 74, 71–82. doi: 10.1111/j.1467-8306.1984.tb01435.x
Oak H. L. (1986). Process inference from coastal-protection structures to boulder beaches. Geografiska Annalar 68, 25–31. doi: 10.1080/04353676.1986.11880156
Pitman S. J., Coco G., Hart D. E., and Shulmeister J. (2024). Observations of beach cusp morphodynamics on a composite beach. Geomorphology 447, 109026. doi: 10.1016/j.geomorph.2023.109026
Poate T. G., McCall R. T., and Masselink G. (2016). A new parameterisation for runup on gravel beaches. Coast. Eng. 117, 176–190. doi: 10.1016/j.coastaleng.2016.08.003
Powell K. A. (1990). ‘Predicting short term profile response for shingle beaches’, Report SR 219. Available online at: https://eprints.hrwallingford.com/263/ (Accessed September 19, 2023).
Powell K. A. (1993). ‘Dissimilar sediments; model tests of replenished beaches using widely graded sediments’, (SR350). Available online at: https://eprints.hrwallingford.com/342/ (Accessed April 12, 2024).
Ruggiero P. and McDougal W. G. (2001). Wave runup, extreme water levels and the erosion of properties backing beaches. J. Coast. Res. 17, 407–419.
Ruggiero P., Kratzmann M. G., Himmelstoss E. A., Reid D., Allan J., and Kaminsky G. (2013). National assessment of shoreline change: Historical shoreline change along the Pacific Northwest coast, U. S. Geological Survey Open-File Report OF 2012-1007. Reston, Virginia: U.S. Geological Survey. doi: 10.3133/ofr20121007
Ruggiero P. and McDougal W. G. (2001). An analytic model for the prediction of wave setup, longshore currents, and sediment transport on beaches with seawalls. Coast. Eng. 43, 161–182. doi: 10.1016/S0378-3839(01)00012-6
Stockdon H. F., Holman R. A., Howd P. A., and Sallenger A. H. (2006). Empirical parameterization of setup, swash, and runup. Coast. Eng. 53, 573–588. doi: 10.1016/j.coastaleng.2005.12.005
Talebi B., Kaminsky G. M., Ruggiero P., Levkowitz M., McGrath J., Serafin K., et al. (2017). Assessment of coastal erosion and future projections for north Cove, Pacific county. Available online at: https://apps.ecology.wa.gov/publications/documents/1706010.pdf (Accessed September 23, 2024).
Toft J. D., Accola K. L., Des Roches S., Kobelt J. N., Faulkner H. S., Morgan J. R., et al. (2023). Coastal landforms and fetch influence shoreline restoration effectiveness. Front. Mar. Sci., 1–12. doi: 10.3389/fmars.2023.1199749
US Army Corps of Engineers Portland District (2013). Mouth of the Columbia River South Jetty dune stabilization: Fort Stevens, Oregon Design Documentation Report.
van der Meer J. W. (1988). Rock slopes and gravel beaches under wave attack Vol. 396) (Delft, the Netherlands: Delft Hydraul. Lab.). Available online at: https://repository.tudelft.nl/record/uuid:67e5692c-0905-4ddd-8487-37fdda9af6b4 (Accessed September 19, 2024).
van der Meer J. W. (2002). Technical report wave run-up and wave overtopping at dikes (Delft, The Netherlands: Technical Advisory Committee on Flood Defence), 43. Available online at: https://repository.tudelft.nl/record/uuid:d3cb82f1-8e0b-4d85-ae06-542651472f49 (Accessed October 16, 2023).
van der Meer J. W., et al. (2018). ‘EurOtop’, Report. Available online at: www.overtopping-manual.com (Accessed February 19, 2024).
van der Meer J. W. and Pilarczyk K. W. (1986). Dynamic stability of rock slopes and gravel beaches. Coast. Eng, 1713–1726. doi: 10.1061/9780872626003.125
van Gent M. R. A. (1999). Physical model investigations on coastal structures with shallow foreshores - 2D model tests on the Petten Sea-defence. Available online at: https://repository.tudelft.nl/record/uuid:b5cf782d-e0e5-400e-9850-867dc4655548.
van Gent M. R. A. (2001). Wave runup on dikes with shallow foreshores. J. Waterway Port Coast. Ocean Eng. 127, 254–262. doi: 10.1061/40549(276)159
van Gent M. R. A., Muttray M., and van der Werf I. (2009). Dynamic cobble beaches as sea defence. Proceedings on the Third International Conference on the Application of Physical Modelling to Port and Coastal Protection. doi: 10.1142/9789814282475_0081
van Rijn L. C. (2014). A simple general expression for longshore transport of sand, gravel and shingle. Coast. Eng. 90, 23–39. doi: 10.1016/j.coastaleng.2014.04.008
Van Wellen E., Chadwick A. J., and Mason T. (2000). A review and assessment of longshore sediment transport equations for coarse-grained beaches. Coast. Eng. 40, 243–275. doi: 10.1016/S0378-3839(00)00031-4
Vitousek S., Barnard P. L., and Limber P. (2017). Can beaches survive climate change? J. Geophysical Research: Earth Surface 122, 1060–1067. doi: 10.1002/2017JF004308
Weiner H. M., Kaminsky G. M., Hacking A., and McCandless D. (2019). North cove dynamic revetment monitoring : winter 2018-2019. Available online at: https://apps.ecology.wa.gov/publications/SummaryPages/1906008.html (Accessed April 21, 2022).
Winters M. A., Leslie B., Sloane E. B., and Gallien T.W. (2020). Observations and preliminary vulnerability assessment of a hybrid dune-based living shoreline. J. Mar. Sci. Eng. 8, 1–18. doi: 10.3390/jmse8110920
Wright L. D. and Short A. D. (1984). MORPHODYNAMIC VARIABILITY OF SURF ZONES AND BEACHES: A SYNTHESIS. Mar. Geol., 93–118. doi: 10.1016/0025-3227(84)90008-2
Young A. P., Matsumoto H., Spydell M. S., and Dickson M. E. (2023). Cobble tracking observations at torrey pines state beach, CA, USA. J. Geophysical Research: Earth Surface 128. doi: 10.1029/2023JF007199
Keywords: dynamic cobble berm revetment, composite beach, natural and nature-based feature, nature-based solution, coastal erosion
Citation: Bond HG, Wengrove ME, Blenkinsopp CE, Bayle PM, Kaminsky GM, Allan JC, Michalsen DR, Ostrow KS and Moritz HR (2025) Dynamic cobble berm revetments: the state of the practice and a proposed design process. Front. Mar. Sci. 12:1603318. doi: 10.3389/fmars.2025.1603318
Received: 31 March 2025; Accepted: 30 June 2025;
Published: 25 July 2025; Corrected: 11 August 2025.
Edited by:
Jiarui Lei, National University of Singapore, SingaporeReviewed by:
Andrés Payo, British Geological Survey, United KingdomGuilherme Vieira da Silva, Griffith University, Australia
Copyright © 2025 Bond, Wengrove, Blenkinsopp, Bayle, Kaminsky, Allan, Michalsen, Ostrow and Moritz. This is an open-access article distributed under the terms of the Creative Commons Attribution License (CC BY). The use, distribution or reproduction in other forums is permitted, provided the original author(s) and the copyright owner(s) are credited and that the original publication in this journal is cited, in accordance with accepted academic practice. No use, distribution or reproduction is permitted which does not comply with these terms.
*Correspondence: Hailey G. Bond, Ym9uZGhAb3JlZ29uc3RhdGUuZWR1