 Muhammad Shafeeque1†
 Abdul Azeez Saleem1
 Akurathi V. S. Chaitanya1
 C. P. Abdulla2
 Salim Lateef1
 Jiya Albert1*
- 1Applied Research Center for Environment and Marine Studies, King Fahd University of Petroleum & Minerals, Dhahran, Saudi Arabia
- 2Environmental Science Center, Qatar University, Doha, Qatar
Introduction: The Arabian Gulf (Gulf) is a dynamic marine ecosystem in which phytoplankton productivity, indicated by Chlorophyll-a (Chl-a), is strongly affected by environmental and climatic variables. Understanding the spatiotemporal variability of Chl-a and its driving environmental factors is critical for assessing primary productivity and ecosystem dynamics of the Gulf.
Methods: This study investigated the long-term Chl-a variability and its dynamic response to environmental variables in the Gulf using two decades (2003 to 2023) of Chl-a data from merged multi-sensor Ocean Colour Climate Change Initiative. We adopted an integrated approach that includes climatology, multivariate statistical analysis, interannual variability and trend analysis to evaluate Chl-a variability and identify its dominant drivers.
Results: Seasonal climatology exhibited a marked winter bloom driven by convective mixing and nutrient replenishment, followed by a summer decline due to strong stratification. Box average analysis using correlogram and principal component analysis for selected regions revealed distinct regional patterns, with the northern and central Gulf showing higher variability. The results further highlighted sea surface temperature (SST), sea surface salinity, photosynthetically available radiation and wind speed as primary drivers of Chl-a variability in the Gulf. The interannual variability of Chl-a peaks along the central eastern Gulf in winter and central western Gulf during summer, highlighting regional heterogeneity in phytoplankton dynamics. Long-term spatial trend analysis of Chl-a, net primary productivity (NPP) and SST indicated overall decreasing trend in Chl-a and NPP, particularly along the north and eastern coasts of the Gulf; and warming SST in the northern and central Gulf.
Discussion: The results indicate the requirement of further research on the complex interplay between physical and biogeochemical factors, and anthropogenic influences on Chl-a distribution, which can help future monitoring and predictive ecosystem models for the Gulf under changing climate conditions.
1 Introduction
Chlorophyll-a (Chl-a) is a crucial parameter in the marine ecosystems which serves as a vital pigment and proxy in photosynthetic organisms, particularly in phytoplankton. They can be used to monitor the abundance and primary productivity in the aquatic environments, making it an essential indicator of ecosystem health and functions (McClain, 2009; Boyce et al., 2014; Al-Naimi et al., 2017; Dunstan et al., 2018; Kraemer et al., 2022). The advent of ocean color remote sensing has revolutionized the ability to measure Chl-a, providing unprecedented global coverage into its spatial and temporal distributions. These observations offer valuable information on phytoplankton dynamics, primary productivity, and overall health of the ecosystem, contributing significantly to the study of climate change impacts, oceanic biogeochemical processes, harmful algal blooms and the effects of environmental stressors on marine ecosystems (Shah et al., 2019; Lotliker et al., 2020; Shafeeque et al., 2021a; Madhusoodhanan et al., 2025). Globally, understanding long-term Chl-a variability is crucial for monitoring marine primary productivity and assessing the impacts of climate change on ocean ecosystems (Kashani et al., 2025). Several studies have examined long-term changes in ocean color and phytoplankton dynamics across open oceans and large marginal seas, revealing strong links to surface temperature, winds, ocean stratification, and circulation shifts (Piontkovski and Queste, 2016; Shafeeque et al., 2017; Vinaya Kumari et al., 2021; Chinta et al., 2024). However, the Arabian Gulf (hereafter referred to as ‘Gulf’, Figure 1a) remains one of the least explored regions in this context, with the exception of a few number of studies (Nezlin et al., 2010; Moradi and Kabiri, 2015; Moradi, 2020; Moradi and Moradi, 2020; Al Shehhi and Kaya, 2021; Asgari and Soleimany, 2023; Bordbar et al., 2024; Yang et al., 2024), despite its ecological sensitivity and extreme environmental conditions. This study contributes to filling that gap by providing a holistic assessment of Chl-a variability in the Gulf over more than two decades, and the region-specific responses to environmental forcing.
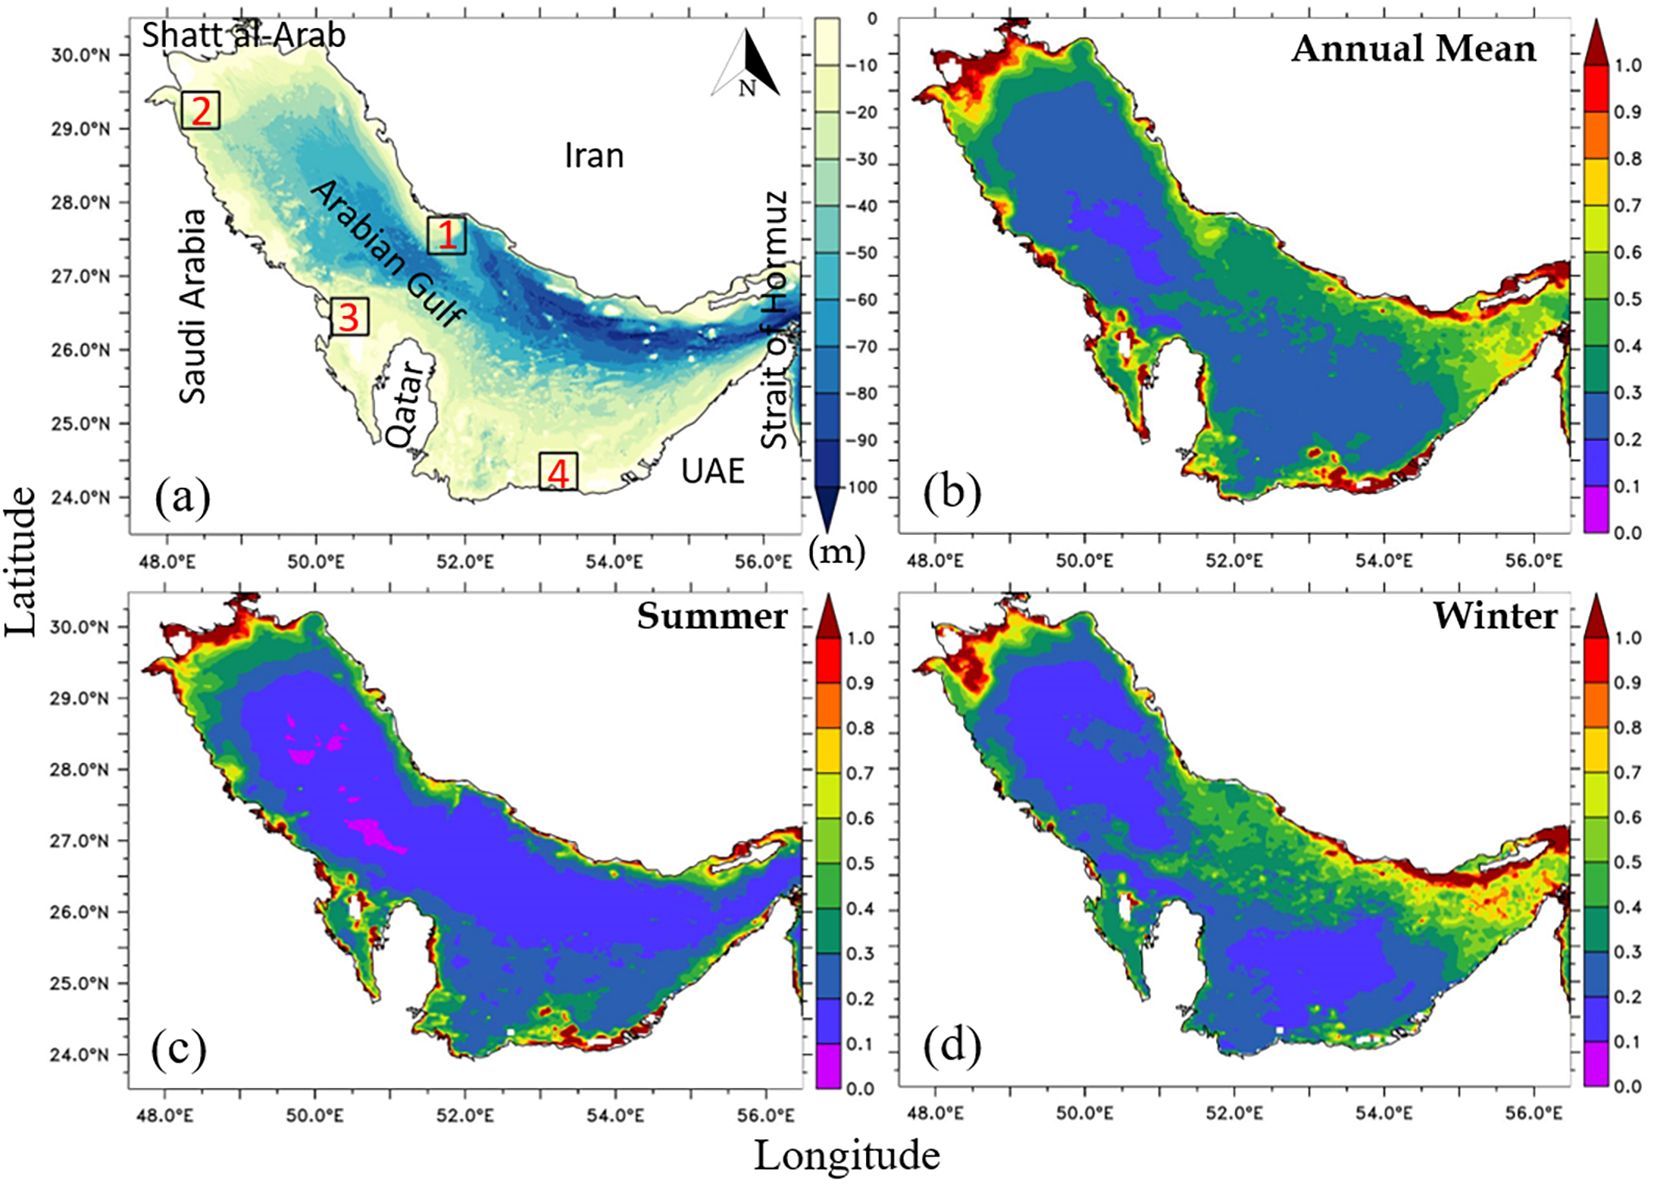
Figure 1. Study region (a) Bathymetry map of Arabian Gulf from Gridded Bathymetry Data (GEBCO) with selected boxes, Standard deviation of Chl-a for (b) Annual Mean (c) Summer and (d) Winter.
The Gulf is one of the very important marine environments in the world with unique features. It encompasses an area of approximately 2,33,100 km2, stretching 1,000 km in length with a width varying from 56 km at the Strait of Hormuz to 338 km at its widest point. The distinctive features include its shallow average depth of 36 m, with a maximum depth of 110 m in the Strait of Hormuz, and its asymmetric bathymetry characterized by a deep trough along the Iran coast and a shallow bank area (depth < 20 m) in the southwestern region (Kämpf and Sadrinasab, 2006). The Gulf is not only a busy shipping route but also an economically crucial region, renowned for its rich petroleum resources (Reynolds, 1993). Its environmental characteristics are equally remarkable, featuring a hot desert climate, intense evaporation rates which exceed the combined freshwater input from precipitation and river discharge, and extreme salinity levels (Al-Ansari et al., 2022; Elobaid et al., 2022). These factors contribute to the predominant oligotrophic nature of the Gulf, making it a unique ecosystem. Gulf’s climate is further influenced by various wind patterns, including the northwesterly Shamal winds, northeasterly/ easterly Nashi winds, and southeasterly/ southerly Kaus winds, all of which play significant roles in shaping sea surface dynamics (Rao et al., 2001, Rao et al., 2003; Yu et al., 2016; Moradi and Moradi, 2020; Aboobacker et al., 2021; Langodan et al., 2023). The general circulation pattern is cyclonic, bounded by the Iranian coastal current flowing northwestward along the northern side from the Strait of Hormuz at speeds exceeding 10 cm/s, and a southeastward current in the southern part. Interestingly, this current flows against the prevailing northwesterly winds, primarily driven by the pressure gradient force, adding another layer of complexity to the oceanographic characteristics of the Gulf (Mussa et al., 2024).
The Gulf is also one of the most biologically and geologically distinct marine environments in the world, making it an exceptional region for studying Chl-a variability. Its unique characteristics, including its semi-enclosed nature, extreme salinity levels, high-temperature variations, and limited freshwater inflow, create a natural laboratory for investigating marine ecosystem processes. Despite its significance, studies on Chl-a within the Gulf are relatively less than other regions of the world, highlighting the need for more comprehensive research in this area. Previous studies have demonstrated significant spatial and temporal variations in Chl-a concentrations within the Gulf. For instance, Nezlin et al. (2010) reported that Chl-a levels in the Gulf are significantly influenced by local meteorological and oceanographic factors, including vertical stratification, precipitation, and aeolian dust transport. Moradi (2020) found that the Chl-a pattern was heterogeneous in both time and spatial scale with a decreasing trend, whereas SST pattern is more homogenous. More recent studies have continued to shed light on the factors regulating Chl-a distribution in the region. Bordbar et al. (2024) reported that the SST and Chl-a are anti-correlated in the Gulf except in the southern Gulf. Al-Thani et al. (2023) focused on the Exclusive Economic Zone of Qatar, evaluating the physical parameters that control Chl-a distribution and analyzed spatiotemporal variability. Additionally, studies have utilized in-situ observations to analyze Chl-a concentrations, discussing local seasonal variations and the impact of anthropogenic activities on Chl-a levels in the Gulf (Al-Yamani et al., 2006; Rajendran et al., 2022; Mussa et al., 2024).
Given the strategic importance as a global oil hub and its proximity to densely populated coastal regions, a detailed understanding of the patterns and drivers of Chl-a distribution is essential in the Gulf for predicting and mitigating the impacts of human activities on marine ecosystems. Despite its ecological and economic importance, long-term studies on Chl-a dynamics in the Gulf remain limited in both temporal and spatial scales. This study addresses that gap by investigating the long-term spatiotemporal variability of Chl-a in the Gulf over two decades (2003–2023) using high-resolution satellite ocean color data from the Ocean Colour- Climate Change Initiative (OC-CCI). The objective is to study the distribution of Chl-a in the Gulf and its relationship with key environmental drivers, including sea surface temperature (SST), sea surface salinity (SAL), sea level anomaly (SLA), wind speed (WSP), current speed (CSP), and photosynthetically available radiation (PAR). The structure of this paper is organized as follows: the current section 1 provides an introduction with a literature review, background and objectives of the study, section 2 outlines the materials and methods employed in the study, section 3 presents results and discussion and section 4 summarizes the key findings and conclusions of the research.
2 Data and methodology
2.1 Data
The Chl-a data used in this study were obtained from OC-CCI database, one of fourteen CCI projects by the European Space Agency (https://www.oceancolour.org). This dataset provides consistent, stable, long-term error-characterized and merged time series of global ocean color data products from multi-sensor data archives by integrating remote sensing reflectance (Rrs) values using selected algorithms (Brewin et al., 2015; Sathyendranath et al., 2019). The dataset features a fine spatial resolution of 0.04°×0.04°, enabling precise global mapping of Chl-a concentration. For this study, monthly Chl-a composites (Version 6.0, Sathyendranath et al., 2023) specific to the Gulf were extracted, utilizing the extensive temporal range of the dataset, which spans from January 2003 to December 2023. This extended coverage supports the analysis of both historical and recent trends with better validation, offering valuable insights into the long-term dynamics and recent changes in Chl-a concentrations in the region (Jackson et al., 2022). Although the OC-CCI dataset spans from September 1997 onward, we restricted our analysis to the post-2003 period due to known quality issues in the earlier segment of the dataset. During the initial phase (up to April 2002), SeaWiFS was the single contributing sensor, resulting in a relatively sparse sampling frequency and increased noise in the data, including isolated anomalies and spikes (Sathyendranath et al., 2019). From mid-2002 onward, the inclusion of additional sensors such as MODIS-Aqua and MERIS led to a substantial improvement in temporal coverage and data quality, with a manifold increase in the number of observations per day. This multi-sensor merging enhances the robustness of the product by minimizing gaps and random noise while maintaining a stable long-term signal that is essential for climate related studies. Moreover, previous studies on both the Global Ocean and the Gulf have verified that OC-CCI products are more consistent than other available ocean color satellite products with proper validation of in-situ measurements (Belo Couto et al., 2016; Al-Naimi et al., 2017; Moradi, 2021). Moreover, version 6.0 of the OC-CCI uses blended chlorophyll algorithm, which improves performance in Case-2 waters compared to earlier versions that were mostly focused in open-ocean waters (Jackson et al., 2022).
The SST data of Operational SST and Ice Analysis (OSTIA) with 0.05°×0.05° spatial resolution were obtained from the Marine Data Store (MDS) of Copernicus Marine Environment Monitoring Service (CMEMS). OSTIA data provide daily gap-free maps of foundation SST and ice concentration using in-situ and satellite data from both infrared and microwave radiometers (Good et al., 2020). The OSTIA system is run by the Met Office of the United Kingdom and delivered by the French Institute for Ocean Science (IFREMER). It uses satellite data provided by the Group for High Resolution (GHRSST) project together with in-situ observations to determine the SST (https://data.marine.copernicus.eu/product/SST_GLO_SST_L4_REP_OBSERVATIONS_010_011).
Global analyzed sea surface salinity data were accessed from CMEMS’ Multi Observation Global Ocean Sea Surface Salinity and Sea Surface Density (https://data.marine.copernicus.eu/product/MULTIOBS_GLO_PHY_S_SURFACE_MYNRT_015_013). This product consists of daily global gap-free Level-4 (L4) analyses of the SAL and sea surface density at 0.125°×0.125° of resolution, obtained through a multivariate optimal interpolation algorithm that combines sea surface salinity images from multiple satellite sources as NASA’s Soil Moisture Active Passive (SMAP) and ESA’s Soil Moisture Ocean Salinity (SMOS) satellites (Nardelli et al., 2016; Sammartino et al., 2022).
SLA, surface geostrophic northward sea water velocity and surface geostrophic eastward sea water velocity data were obtained from MDS-CMEMS (https://doi.org/10.48670/moi-00148). The data are generated by the processing system combining data from multi-satellite altimetry missions that include all altimeter Copernicus missions (Sentinel-6A, Sentinel-3A/B) and other collaborative or opportunity missions (e.g. Jason-3, Saral/AltiKa, Cryosat-2, OSTM/Jason-2, Jason-1, Topex/Poseidon, Envisat, GFO, ERS-1/2, Haiyang-2A/B). All normal geophysical and environmental corrections have been applied to the data, including sensor errors and tidal impacts, as well as dynamic atmospheric correction. With a horizontal resolution of 0.125°×0.125°, the dataset supports detailed spatial analyses of global sea level changes. Additionally, it offers temporal resolutions ranging from daily to monthly, providing continuous monitoring of sea level anomalies from 1993 to the present. Total CSP was calculated using northward and eastward velocity components.
The wind data used to estimate wind speed and direction were sourced from the ERA5 reanalysis dataset, the fifth-generation global climate and weather reanalysis produced by the European Centre for Medium-Range Weather Forecasts (ECMWF). ERA5 wind components at a height of 10m above the surface of the Earth with spatial resolution 0.25°×0.25° were obtained from the Climate Data Store of Copernicus Climate Change Service (Hersbach et al., 2023; https://cds.climate.copernicus.eu). ERA5 provides extensive temporal coverage from 1940 to the present, making it an invaluable resource for climate and atmospheric research. As the successor to the ERA-Interim reanalysis, ERA5 offers enhanced accuracy and higher resolution of atmospheric variables. By blending model outputs with a wide range of observational data, ERA5 delivers a globally complete and consistent dataset. ERA5 also supports multiple temporal resolutions, from hourly to monthly, encompassing a broad spectrum of atmospheric, ocean-wave, and land-surface variables, making it a comprehensive dataset for both historical and real-time analysis.
PAR is defined as the quantum energy flux from the Sun from 0.4 µm to 0.7 µm that is absorbed, transferred and stored within ecosystems. PAR data from SeaWiFS and Aqua-MODIS with spatial resolution of 0.04°×0.04° were achieved from NASA Goddard Space Flight Center, Ocean Ecology Laboratory, Ocean Biology Processing Group (http://oceancolor.gsfc.nasa.gov). For ocean color applications, PAR is a common input used in modeling marine primary productivity. Net primary productivity (NPP) is a measure of the rate at which phytoplankton convert carbon dioxide into organic matter (Westberry et al., 2023). NPP data with spatial resolution 0.083°×0.083° used in this study was computed from satellite-derived Chl-a, SST and PAR data mostly from SeaWiFS, MODIS and VIIRS satellites using the Vertically Generalized Production Model (VGPM, Behrenfeld and Falkowski, 1997), available at ocean productivity website (https://orca.science.oregonstate.edu/1080.by.2160.monthly.hdf.vgpm.m.chl.m.sst.php).
2.2 Methods
The standard deviation (SD) of Chl-a in the Gulf provides critical insights into the temporal and spatial fluctuations of phytoplankton biomass. The results were presented across three different temporal scales: annual mean, summer and winter. This SD analysis aided in identifying regions of high Chl-a variability, which could then be used to define study areas (0.5o×0.5o boxes) for further investigation to understand the relationship between the distribution of Chl-a and environmental factors. This analysis aligns with previous studies on Chl-a variability in semi-enclosed seas, where nutrient dynamics, physical forcing, and climatic variability strongly regulate phytoplankton distributions (Gregg and Casey, 2004; Behrenfeld et al., 2006). A high Chl-a SD value implies regions where phytoplankton blooms are strongly influenced by any of the seasonal shifts, such as winds, stratification, and nutrient availability mostly from river discharge. In contrast, regions with consistently low SD indicate lower or stable Chl-a throughout the year, often found in deeper or more oligotrophic waters. We have also performed spatial correlation between Chl-a and major environmental variables to confirm the selection of specific regions and thereby to investigate the relationship between Chl-a and other environmental variables. To calculate the spatial correlation, we used data from 2003–2023 and regridded all datasets to a common spatial resolution of 0.04°×0.04°.
Time-series analysis of Chl-a was carried out for the selected boxes on a monthly, seasonal and annual timescales along with a trendline. We applied the modified Mann-Kendall trend test (Hamed and Rao, 1998) to evaluate long-term trends in Chl-a concentration. This method adjusts the variance of the Mann-Kendall statistic to account for autocorrelation in the time series, providing a more reliable assessment of trend significance. The trend calculated for NPP data were normalized to the range of –1 to +1 to ensure comparability with other variables, as this scaling transforms the data to a dimensionless interval where –1 represents the minimum observed value and +1 represents the maximum, preventing its larger magnitude from biasing the analysis.
Empirical Orthogonal Function (EOF) analysis were performed spatially and temporally in the Gulf domain (Longitude: 48–56oE; Latitude: 24–32oN) for the period 2003 to 2023. EOF is a robust statistical method used to identify patterns and extract significant features from complex datasets. The dominant spatial patterns of variabilities are presented as different modes of EOF and the temporal variability has shown as time series of principal components. Here, the eigenvalue corresponding to kth EOF gives a measure of the explained variance by , where k = 1,2,3,…., p. The following Equations 1-3 are used to calculate the major terms in this analysis. The complete theory of EOF analysis is available at Hannachi (2004).
The explained variance is often presented in percentage as:
The kth principal component is the projection of the anomaly field X′ on to the kth EOF , i.e.:
where t, s represent the temporal and spatial dimensions. The leading EOFs were analyzed to reveal significant spatial patterns of Chl-a distribution, while the corresponding principal components provided insights into temporal changes. We removed the season and trend from the data for this analysis.
Mutivariate analyses such as correlogram and Principal Component Analysis (PCA) were also done to quantify the relationship between Chl-a and other environmental variables by identifying the key Chl-a patterns of spatial variability (Jackson, 1991; Jolliffe, 2002). These analyses were also aimed to reveal the dominant factor for Chl-a variability at selected locations. Generally, these are useful for reducing the dimensionality of large number of data into a smaller number of orthogonal factors called Principal Components (PCs). PCs represent the major part of the overall data variance along with the correlation amongst the variables without losing much information (Vega et al., 1998; Helena et al., 2000; Lins et al., 2018). In simple terms, these methods break the complex data into a few main patterns, showing where the highest changes occur in the Gulf and how they evolve over months and years. A two-tailed student’s t-test was applied to assess whether the correlation coefficients (r) between Chl-a and other environmental parameters were statistically significant (Kreyszig, 1970). Interannual variability of Chl-a and other associated variables was also analyzed by removing the seasonal cycle from each variable.
3 Results and discussion
3.1 Monthly climatology of Chl-a, SST, SLA, wind and surface currents
The monthly climatology spatial maps of Chl-a concentration provide an overview of the spatiotemporal distribution of phytoplankton biomass in the Gulf in different months (Supplementary Figure S1). Strong seasonal and spatial discrepancy in the distribution of Chl-a was clearly observed in the climatology map, with clear distinctions between coastal and offshore waters. Elevated Chl-a values (>2 mg/m3) were predominantly observed in coastal regions, particularly near the north and northwestern coasts throughout the year. In contrast, the eastern coasts and offshore regions of the Gulf exhibit lower Chl-a. The map also revealed marked seasonal variability in Chl-a concentration all over the Gulf. During winter (December–March), higher Chl-a exhibited (>2 mg/m3) along the central (Iran coast) and southeastern coast adjacent to the Strait of Hormuz and moderate Chl-a values along north and western coasts. During summer (June–September), nutrient availability in the surface layer is limited due to the high SST (>35°C) and strong stratification (Polikarpov et al., 2016). As a result, Chl-a concentrations were generally lower (<2 mg/m3) during this period. In contrast with the winter, higher Chl-a (~3 mg/m3) was exhibited along the central (Saudi and Qatar coast) and southwestern coasts (U.A.E.) of the Gulf during summer (Supplementary Figure S1). The transitional periods of Spring (April–May) and Autumn (October–November) months exhibit moderate to lower Chl-a levels (~1 mg/m3), reflecting the gradual shifts in environmental conditions. The observed patterns of monthly climatology provide insights into the modulation of Chl-a in the Gulf and its response to seasonal changes.
The monthly climatology maps of SST overlaid with winds (Supplementary Figure S2) and SLA overlaid with surface currents (Supplementary Figure S3) provide valuable insights into major physical processes driving Chl-a variability in the Gulf. The SST climatology maps reveal pronounced seasonal variability, with temperature ranging from approximately 17°C in winter to 35°C in summer. The superimposed wind vectors highlighted the role of atmospheric forcing in modulating SST and, consequently, Chl-a concentration. During winter, cooler SST (17–25°C) dominated the Gulf waters, with the lowest SST observed in the northwestern region maybe due to the enhanced vertical mixing. In contrast, summer was characterized by extreme SST (29–35°C), with the highest values observed in the southern and central Gulf (Supplementary Figure S2). During this period, strong thermal stratification limits vertical mixing, reducing the upward transport of nutrients to the surface layer. The transitional periods (spring and autumn) exhibited moderate SST (21–29°C), reflecting the gradual warming in spring and cooling in autumn. Wind patterns during these periods are less intense and more variable and hence influence the mixing and nutrient dynamics. These transitional seasons were marked by moderate Chl-a levels, since these seasons are in between the winter bloom and summer stratification phases.
The SLA climatology maps, overlaid with surface currents, provided further insights into the circulation patterns and their influence on nutrient transport and Chl-a distribution in the Gulf (Supplementary Figure S3). SLA reflects changes in sea surface height due to variations in SST, salinity, and wind forcing, while surface currents play a critical role in redistributing nutrients and phytoplankton blooms. During winter, positive SLA (up to 10 cm) were observed in the southern Gulf, indicating higher sea levels due to cooler, denser water and wind-driven convergence (Al-Subhi and Abdulla, 2021). In summer, SLA varies from 3–8 cm with the presence of strong cyclonic eddies along central and southeastern coasts. During the transitional periods (spring and autumn), SLA ranges varied from –1 to 10 cm, reflecting the gradual transition between winter and summer conditions. Surface currents during these periods were weaker, with moderate flows regulating nutrient distribution. The interaction between SLA and circulation patterns during these seasons creates a dynamic environment for phytoplankton, with moderate nutrient availability and transitional Chl-a levels. The overall counterclockwise current pattern plays a critical role in explaining the observed distribution and transport of the algal blooms in the Gulf. The current enters the Gulf through the Strait of Hormuz, flows northwestward along the eastern Gulf, and then loops back southward along the western Gulf before exiting through the Strait (Mussa et al., 2024). The climatology analyses (Supplementary Figures S1–S3) highlight the overall distribution of Chl-a with unique oceanographic and environmental characteristics of the Gulf, which strongly influence Chl-a dynamics. The observed patterns in SST, winds, SLA, and surface currents provide insights into the complex relationship between physical processes and phytoplankton dynamics. In order to select specific locations for further analyze the spatiotemporal variability of Chl-a and its major environmental drivers, we performed SD of Chl-a and spatial correlation between Chl-a and major environmental variables.
3.2 Standard Deviation and Spatial Correlation analysis
We analyzed the SD of monthly Chl-a concentrations to identify regions with high seasonal or interannual fluctuations. The annual mean SD Chl-a map represents the mean spatial variability, providing the total variability of annual Chl-a concentration during the study period (Figure 1b). Higher SD was exhibited along the coastal areas, particularly in the northern Gulf near the Shatt al-Arab is mainly attributed to the nutrient-rich river discharge (Nezlin et al., 2010; Al-Naimi et al., 2017; Al-Thani et al., 2023). On the other hand, offshore regions experience relatively lower SD, reflecting a more stable environment with less pronounced productivity and seasonal changes. The summer SD highlights spatial variations in Chl-a during warm months when the Gulf experiences high SST and intensified stratification (Figure 1c). Phytoplankton productivity during this period is often limited by nutrient availability, as thermal stratification restricts the upward transport of nutrients from deeper waters (Doney, 2006; Al-Thani et al., 2023). However, localized high SD values in certain coastal and shallow regions, particularly along northern Gulf indicate wind-induced mixing, sediment resuspension, or nutrient input from riverine sources. Mesoscale features such as eddies and upwelling events may also contribute to localized Chl-a variability during this period (Thoppil and Hogan, 2010a, Thoppil and Hogan, 2010b). In contrast, the winter SD reveals Chl-a variability during the cooler months (Figure 1d), a period typically associated with enhanced vertical mixing and nutrient replenishment in the Gulf (Al-Thani et al., 2023). The presence of high SD values along the southeastern coast towards the Strait of Hormuz in winter suggested that phytoplankton biomass is highly responsive to seasonal environmental changes, particularly nutrient availability driven by convective mixing and wind-driven turbulence. Northern coastal regions exhibited greater variability due to fluctuations in salinity and nutrient influx influenced by freshwater discharge. These high-variability zones provided insights for selecting specific regions to further explore the relationships between Chl-a and environmental drivers in the Gulf.
The spatial correlation between Chl-a and SST revealed a clear regional gradient. There were moderate negative correlations along the entire eastern and northern coasts, as well as offshore regions (Figure 2). In contrast, moderate to strong positive correlations were exhibited along western and southern coastal areas. This spatial variation highlights how SST control on Chl-a is regionally dependent within the Gulf. SAL demonstrated moderate to strong positive correlations throughout the basin, particularly in the northern half of the Gulf. However, some weak negative correlations were also found near the southern and western coasts. WSP displayed positive correlations in the eastern and central Gulf, especially along the Iranian coasts. Conversely, weak to moderate negative correlations were evident along the western and southern coast. The correlation with SLA was generally weak or no correlation across the Gulf, though some negative patches appear in the eastern and northern coastal regions; whereas positive patches along the western and southern coasts. Similar to SLA, CSP also showed weak scattered positive and negative correlations. Notably, the correlation between Chl-a and PAR was strongly negative throughout most of the Gulf, while narrow patches of moderate negative correlation was found along the westren and southern coasts. Based on the SD map and spatial correlation map, four representative zones (0.5o×0.5o boxes), with consistently high SD and correlation values were selected for further analyses.
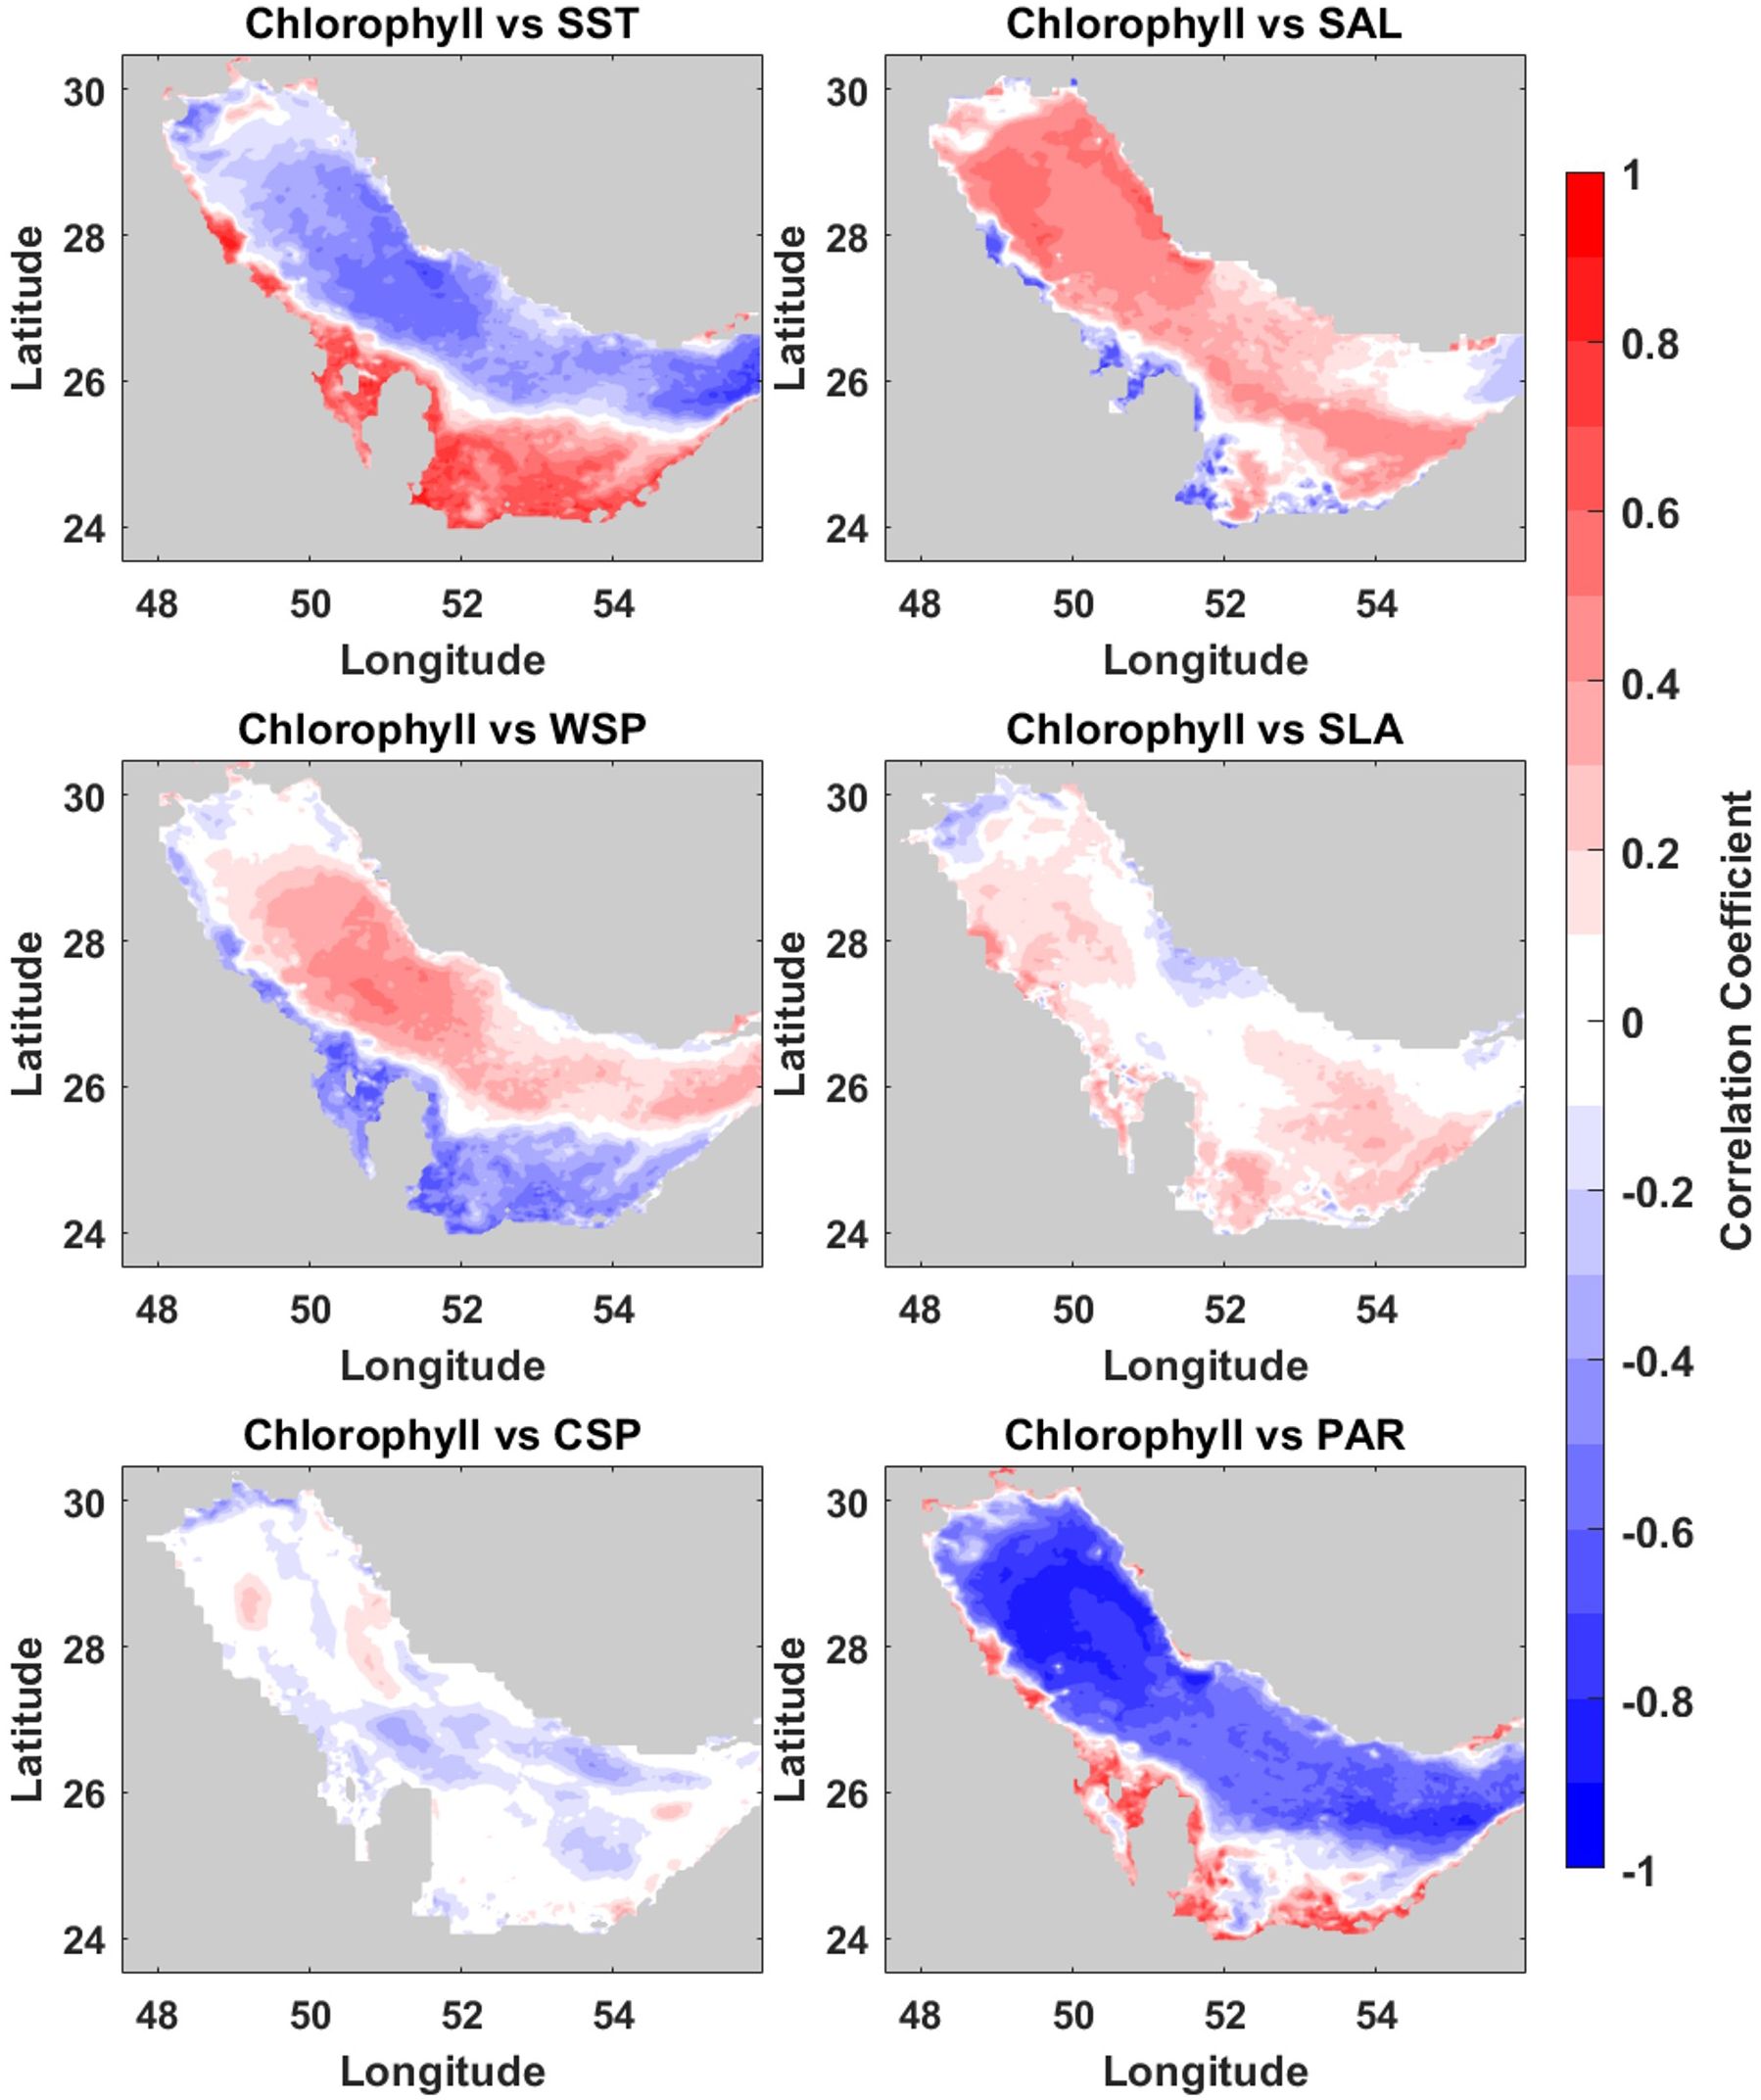
Figure 2. Spatial correlation between chlorophyll-a (Chl-a) and sea level anomaly (SLA), sea surcace temperature (SST), salinity (SAL), wind speed (WSP), current speed (CSP) and photosynthetically available radiation (PAR).
3.3 Spatiotemporal variability of Chl-a: time series analysis
The detailed analysis of long-term Chl-a over the four selected regions in the Gulf provides more insights into spatial and temporal variability, seasonal dynamics, and long-term trends. Even though all the boxes displayed decreasing trend, each region exhibited distinct characteristics both in spatial and temporal scales (Figure 3). Box 1 (central-eastern Gulf, along Iran coast) exhibited significant declining trend, with a total decrease of –0.31 mg/m³ and values ranging from 3.3 to 0.7 mg/m³ throughout the study period. Seasonal patterns were evident, with winter peaks of 2.3 mg/m³ and summer lows below <1 mg/m³. Interestingly two peaks during 2005–2006 and 2008–2009 were identified at this region with the values of Chl-a >3 mg/m3. Box 2 (northwestern Gulf, Kuwait coast) was also experienced a significant decline with a total reduction of –0.66 mg/m³. However, highest Chl-a variability (from 8 to 1.5 mg/m³) was displayed at this region during the study period. Winter peaks of 4.3 mg/m³ reflect strong productivity, while summer lows below 1.8 mg/m³ pointed to seasonal nutrient limitations.
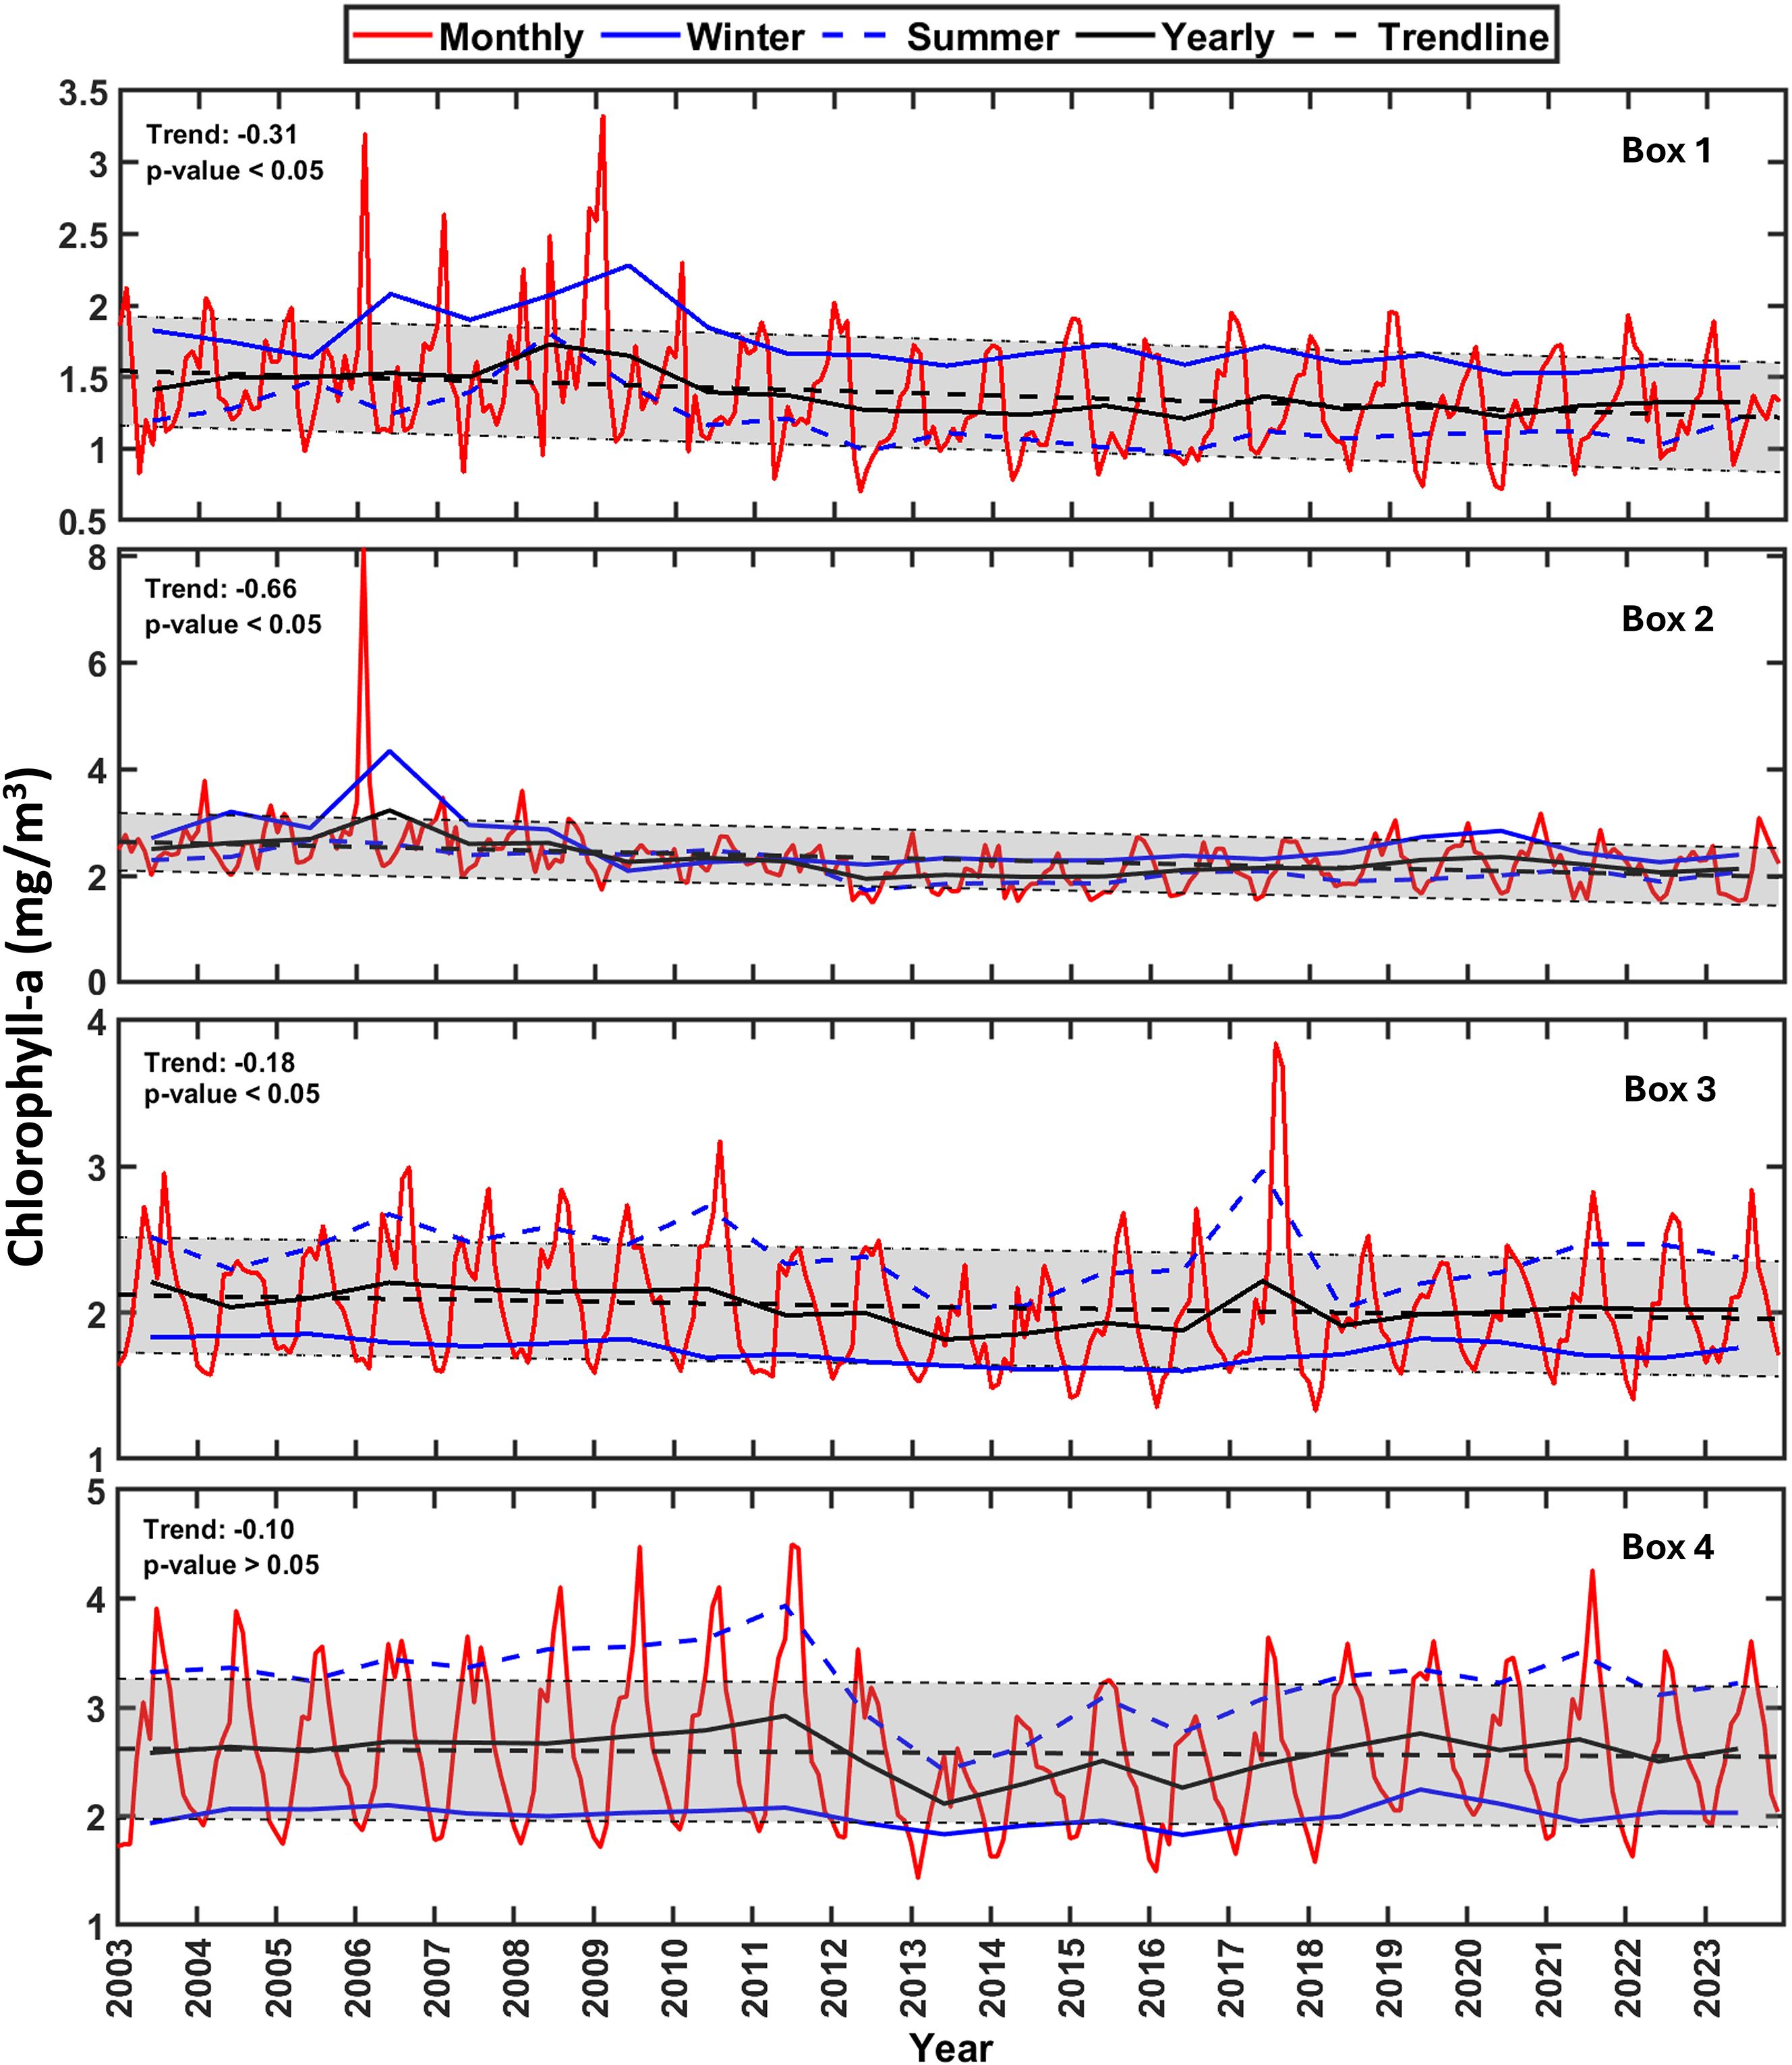
Figure 3. Time series plot of Chl-a for selected regions (boxes 1– 4) during 2003– 2023. Monthly (red), winter (blue), summer (dashed blue), yearly (black) and trend (dashed black) Chlorophyll-a varability are represented with different lines and colors. The shaded area shows standared deviation.
Interestingly, unlike from boxes 1 and 2, the declining trend in both Chl-a and seasonal peaks were weak for the remaining boxes (3 and 4); in which box 4 showed non-significant correlation. In contrast, winter dominance of higher Chl-a observed along the eastern and northern Gulf (boxes 1and 2), seasonal shift in Chl-a maximum from winter to summer were observed for boxes 3 and 4 (western and southern Gulf). Box 3 (central western coast of the Gulf, along the Saudi Arabia) illustrated a decreasing trend, with Chl-a values vary from 3.8 mg/m³ to 1.3 mg/m³ and net variability of –0.18 mg/m³. Summer peaks reach up to 3 mg/m³, while winter lows remain above 1.6 mg/m³. Finally, Box 4 (Southern Gulf, UAE coast) showed a decrease in Chl-a concentration, ranging from 4.5 to 1.4 mg/m³ and a total decrease of –0.1 mg/m³. Summer peaks were reached up to 4 mg/m³, while average winter Chl-a showed <2 mg/m³. In summary, time series analysis reveals an overall decreasing trend with clear regional contrasts in both seasonal and long-term Chl-a. The eastern and northern coasts (boxes 1 and 2) show severe decline and winter dominants, while western and southern coasts (boxes 3 and 4) exhibited comparatively moderate/ weak waning in Chl-a with summer peaks. The overall decreasing Chl-a trend in the time series analysis is also consistent with recent studies (Moradi, 2020; Yang et al., 2024). The seasonal dominance patterns along the eastern and western regions of the Gulf are shaped by the interaction of physical and regional factors. Winter dominance is primarily driven by nutrient mixing and favorable temperature, while summer dominance is linked to sustained nutrient inputs and higher light availability in coastal regions (Moradi and Kabiri, 2015). These findings underscore the importance of localized environmental controls, which are further examined in the following sections.
The time series analysis of Chl-a reveals discrete peaks and declines across various boxes in the Gulf, corresponding to different periods. Previous studies confirmed the indirect influence of large-scale climatic oscillations such as El Niño-Southern Oscillation (ENSO), Indian Ocean Dipole (IOD), Atlantic Multi-decadal Oscillation (AMO) and North Atlantic Oscillation (NAO) on phytoplankton dynamics in the Gulf through changes in SST, winds, mixing, nutrient supply, and precipitation patterns (Nezlin et al., 2007; Nezlin et al., 2010, Al Senafi, 2022; Hamdeno et al., 2022). Notably, box 1 exhibits significant peaks during 2008 to 2009, highlight the influence of episodic algal blooms or extreme weather events, which suggest further investigation to understand their ecological impacts (Richlen et al., 2010). Nezlin et al. (2010) observed that the bloom occurrence in 2008 was associated with variability in NAO phases. Al Senafi (2022) showed that ENSO, IOD and AMO significantly influence the SST and circulation, thereby affecting marine productivity in the Gulf. Moreover, recent work has also highlighted the impact of marine heatwaves on Chl-a, and ENSO/ IOD variability in the region (Hamdeno et al., 2022; Shaltout and Eladawy, 2024). Long-term warming trends further amplify these dynamics, contributing to stronger stratification and reduced nutrient replenishment (Roxy et al., 2016; Al Senafi, 2022). Overall, while this study does not directly focus on extreme events, past literatures indicate that climate oscillations can modulate Chl-a variability in the Gulf through indirect pathways, emphasizing the importance of future targeted analyses of ecosystem responses to these events.
We applied Correlogram, PCA and EOF analyses to explore how Chl-a varies over space and time and to identify dominant patterns deriving this variability in the Gulf. Correlogram and PCA helps to quantify the relationship between Chl-a and environmental factors and identify the most influencing environmental drivers. EOF, in turn, decomposes the Chl-a dataset into spatial modes that capture the most significant variance, while the corresponding time series (principal components) extracts temporal evolution associated with these modes. Together, these approaches allow us to distinguish large-scale, recurring patterns such as seasonal cycles, localized or interannual variations, making the complex dynamics of Chl-a easier to interpret. The insights from these analyses are detailed in the following two subsections.
3.4 Statistical multivariate analyses: correlogram and PCA
Correlogram and PCA were performed by including PAR as another forcing factor along with the variables used in the previous analysis as causative factors for Chl-a modulation. The correlation analysis of Chl-a with SLA, SST, SAL, WSP, CSP, and PAR (Figure 4) across four spatial boxes (Figure 1) in the Gulf revealed complex, region-specific relationships, highlighting strong spatial differences in the environmental drivers of phytoplankton dynamics. All variables showed significant relationship with Chl-a except CSP in box 1. Here, a negative correlation between SST and Chl-a was evident, with a strong correlation (r= –0.50), which may suppress phytoplankton growth due to high SST. A notable positive correlation between Chl-a and WSP (0.46) emphasized the role of wind-driven mixing in enhancing nutrient availability, which supports phytoplankton growth. A moderate positive correlation with SAL (0.42) suggested that higher salinity waters in this box may coincide with nutrient-rich conditions, potentially influenced by regional circulation patterns or saline water influxes. Further, the strong negative correlation between Chl-a and PAR (–0.60) underscored the influence of photoinhibition in this region, where excessive light exposure inhibits phytoplankton productivity (Behrenfeld et al., 2001).
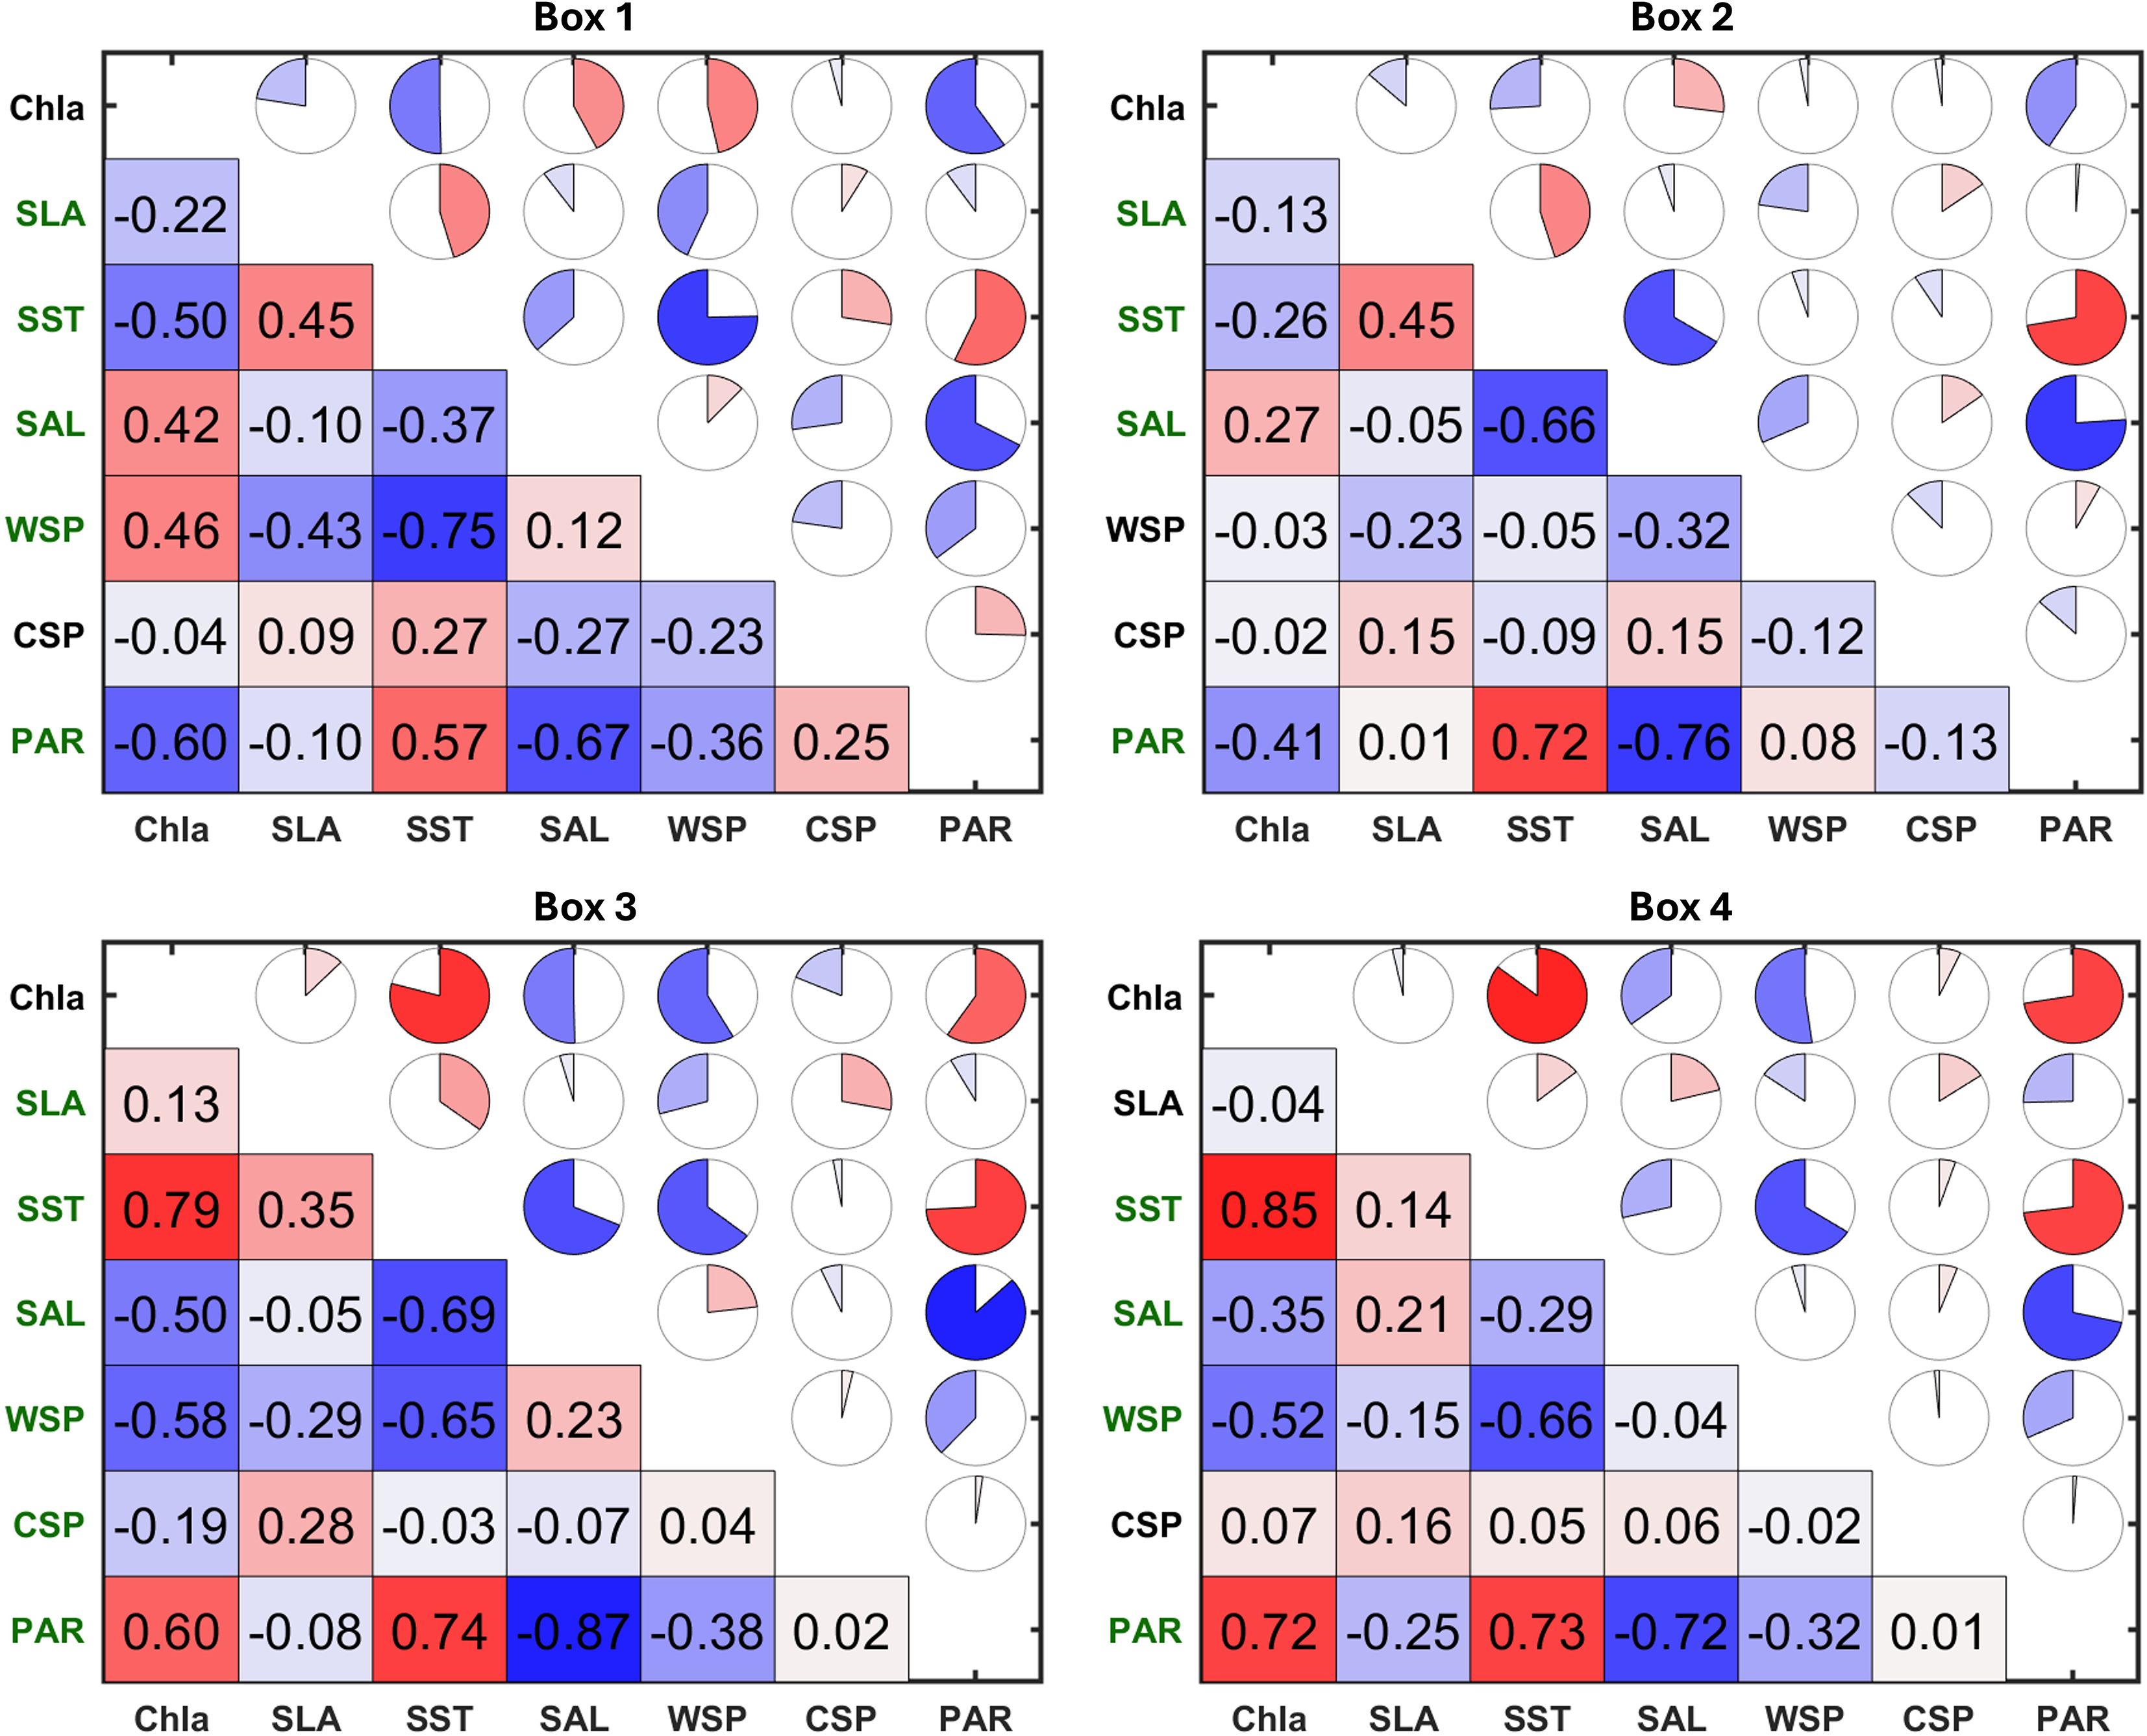
Figure 4. Correlogram between chlorophyll-a (Chl-a), sea level anomaly (SLA), sea surcace temperature (SST), salinity (SAL), wind speed (WSP), current speed (CSP) and photosynthetically available radiation (PAR) for selected regions (boxes 1– 4). The variables show significant correlations with Chl-a are presented in green colour.
In box 2, Chl-a exhibited a very weak non-significant negative and positive correlation with SLA (–0.13), WSP (–0.03), and CSP (0.02) respectively (Figure 4). So, these variables have a limited role in nutrient dynamics and phytoplankton growth in this region. A weak negative correlation with SST (–0.26) highlighted the minimal impact of thermal stratification in reducing phytoplankton productivity. Notably, the negative correlation with PAR (–0.41) indicated severe photoinhibition similar to previous location (box 1), where high light levels hinder photosynthesis, particularly in nutrient-limited conditions (Behrenfeld et al., 2001; Falkowski and Raven, 2013). In box 3, all variables had a significant correlation with Chl-a. SLA, SST and PAR exhibited weak to strong positive correlation with Chl-a (r = 0.13, 0.79 and 0.60) respectively, which indicated their roles in promoting phytoplankton growth. However, the strong negative correlation with SAL (–0.50) suggested that lower salinity conditions, possibly caused by freshwater inputs, may limit phytoplankton productivity by increasing stratification. A strong negative correlation with WSP (–0.58) may lead to the disruption of phytoplankton stability in the water column due to excessive wind-driven mixing, thence diluting localized Chl-a concentrations. Whereas, a strong positive correlation with PAR supports photosynthesis in this region with high light availability. Finally, box 4 revealed a very strong positive correlation between Chl-a and SST (0.85), indicating that seasonal warming supports phytoplankton growth in this area, likely by enhancing nutrient cycling and biological processes. A moderate negative correlation with WSP (–0.52) implied that wind-induced turbulence may dilute phytoplankton concentrations. Interestingly, PAR showed strongest positive correlation (0.72), suggesting that in this region, light availability supports photosynthesis without significant photoinhibition.
While correlation analysis identifies pairwise relationships, PCA provides a broader multivariate perspective by revealing dominant environmental regimes that drive Chl-a variability. We considered the first two dominant principal components (PC1 and PC2), which explain most of the variance (>60%) in Chl-a and highlight the strongest environmental controls in the Gulf. The key insights obtained from the PCA (Figure 5) are as follows. The analysis showed that high SST and PAR were associated with opposite phases and lower Chl-a for boxes 1 and 2. This indicated that enhanced surface warming and photoinhibition reduce phytoplankton growth in these regions. For instance, the dominant drivers in box 1 include a negative relationship of Chl-a with SST and PAR and a positive influence of wind (WSP). Here, enhanced Chl-a was promoted by strong wind-induced upwelling with relatively cooler surface conditions (Al-Yamani et al., 2020; Ismail and Al Shehhi, 2022). Similarly, in box 2, the negative correlations with SST and PAR, combined with the positive contributions from salinity (SAL) and WSP, underscore a regime where upwelling and nutrient enrichment through river discharge play critical roles in driving Chl-a variability (Ershadifar et al., 2020; Ismail and Al Shehhi, 2022). Similar to the correlogram analysis, the PCA also indicated a shift in environmental drivers in boxes 3 and 4 (Figure 5). In these regions, SST, SAL and WSP emerge as major drivers, pointing to a stratification‐dominated regime where thermal conditions and elevated water levels enhance phytoplankton productivity. Here, PAR also exhibits a positive influence, implying that ample light in conjunction with warmer, more stratified waters supports augmented phytoplankton biomass. Furthermore, the negative associations with SAL and WSP in these boxes indicate that lower salinity and reduced wind mixing favor phytoplankton bloom formation, likely by minimizing dilution and promoting water column stability.
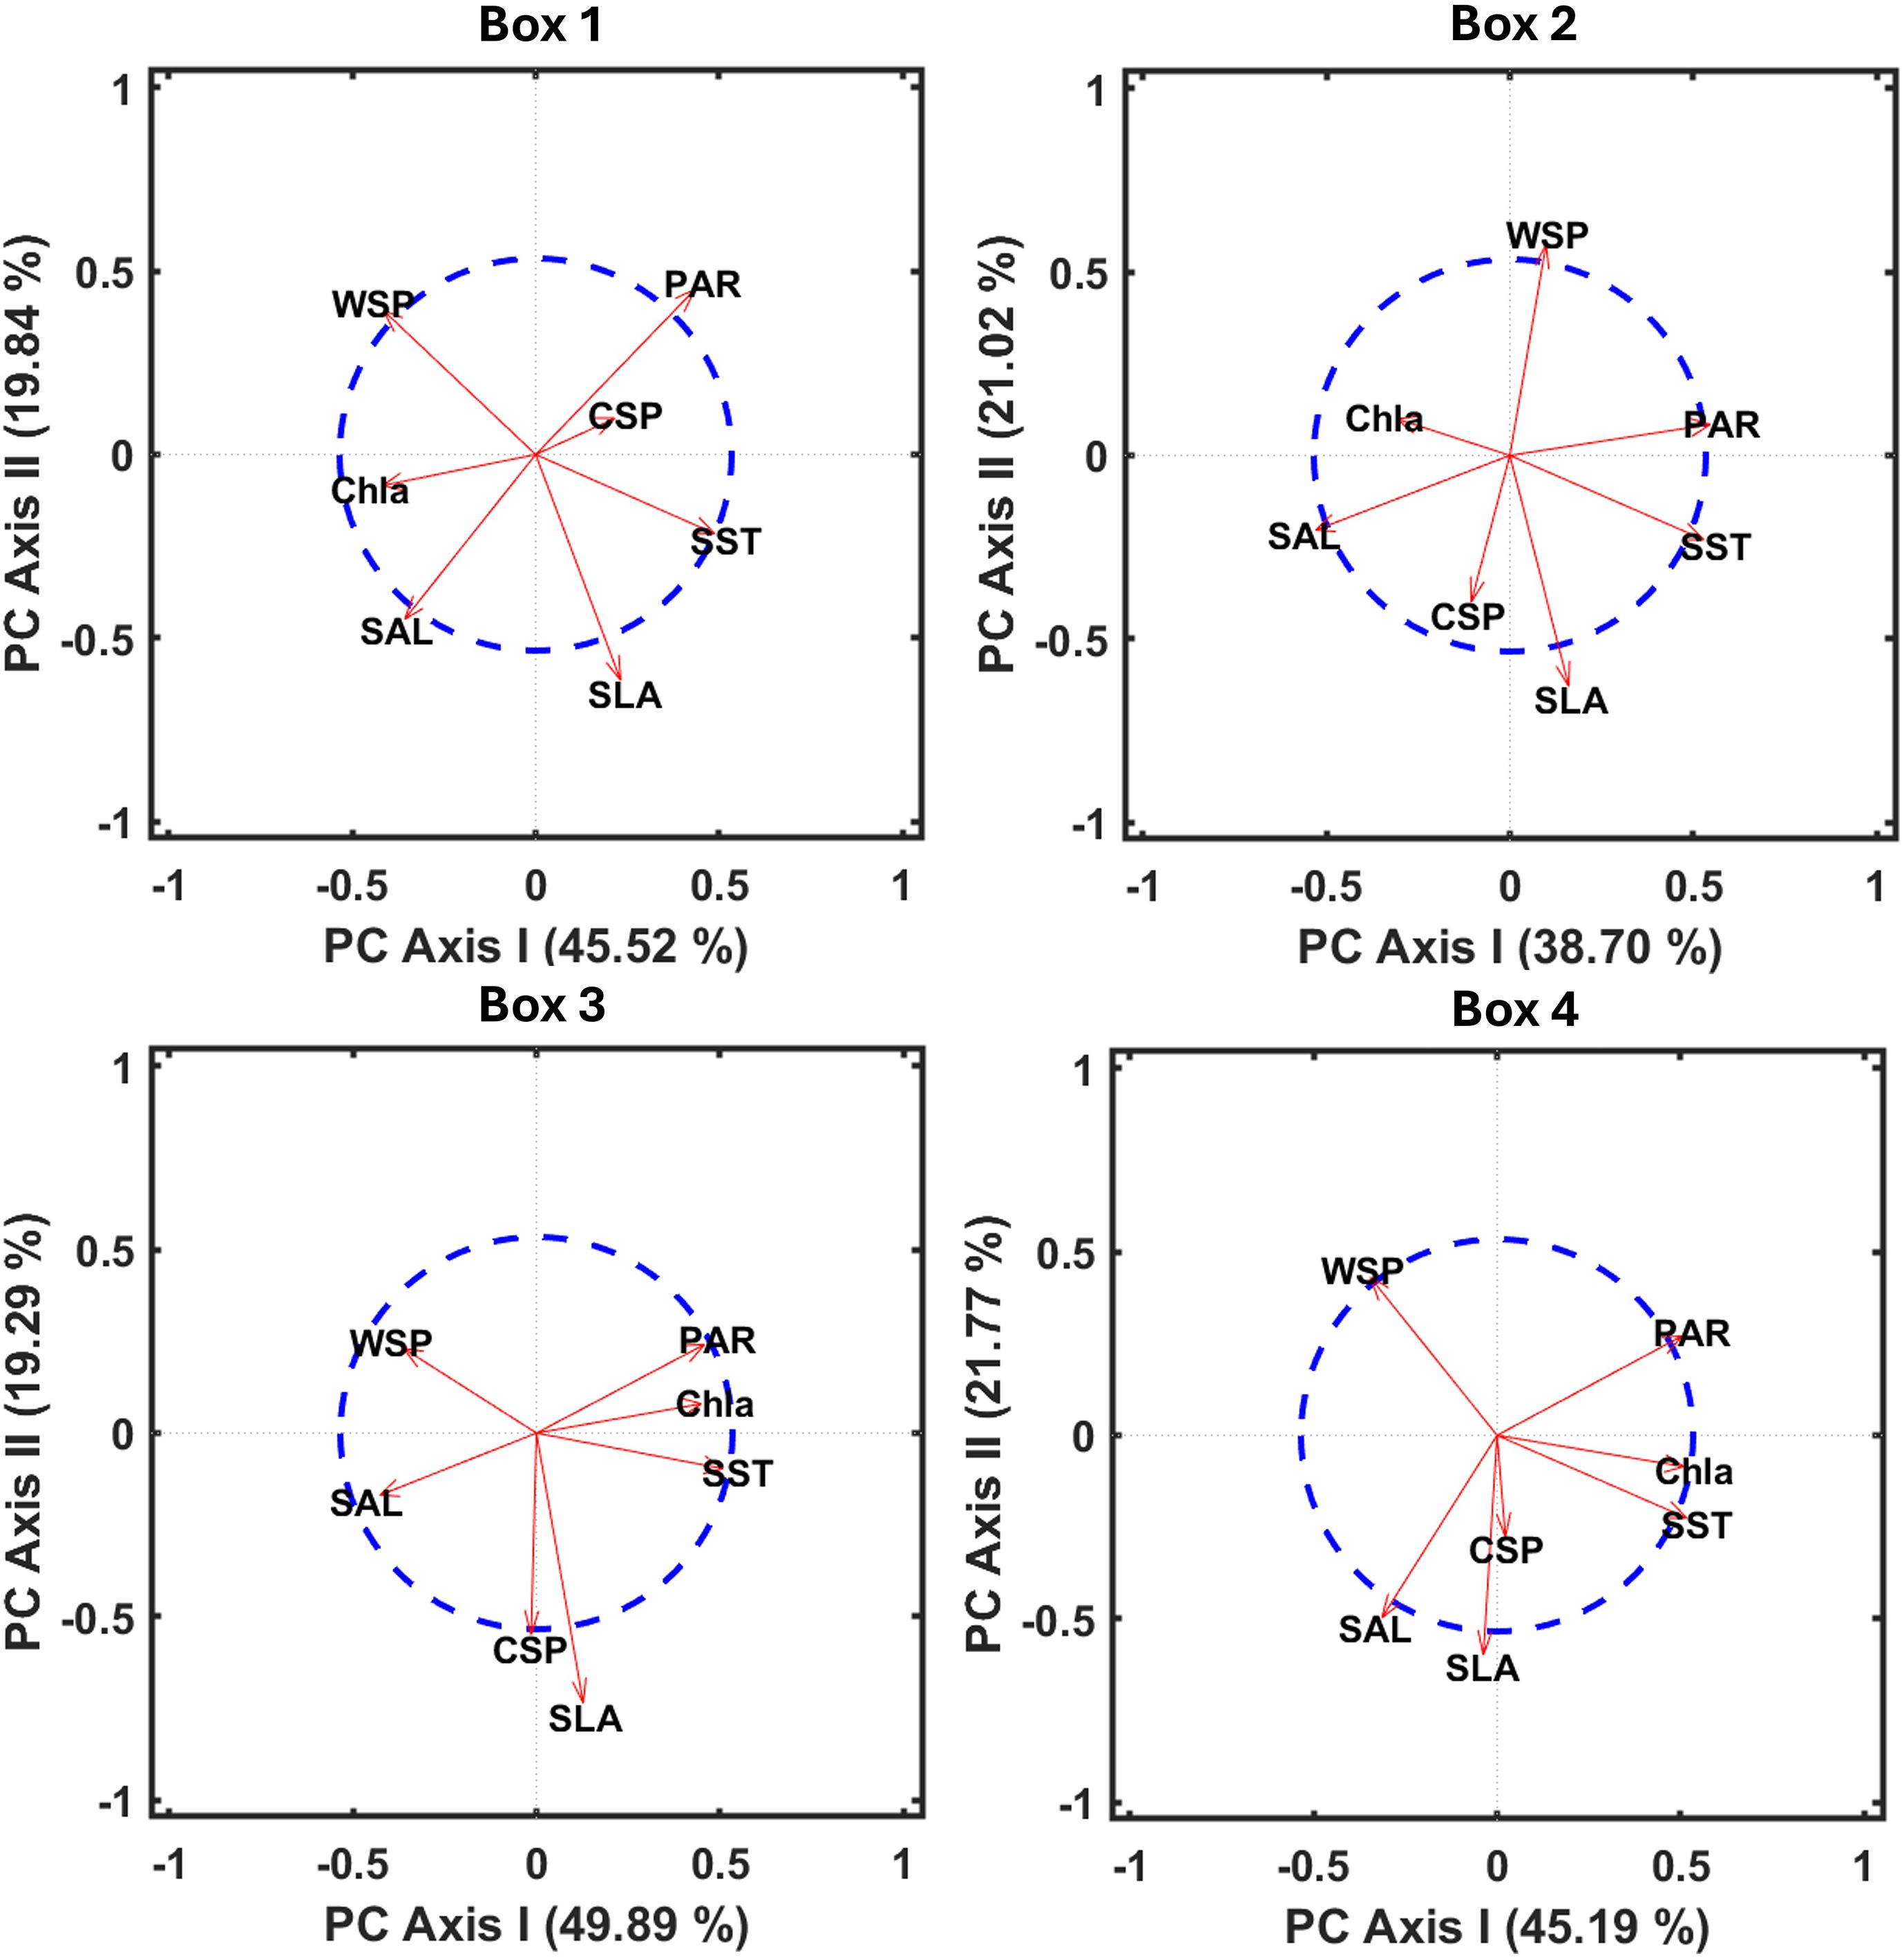
Figure 5. Principal component analysis (PCA) biplots for chlorophyll-a and the environmental parameters for selected regions (boxes 1– 4). The figure is based on the first two PCA (PC 1 and PC 2) which cover more than 60% of the variance.
The correlogram and PCA analyses further highlights the complex and regionally variable relationship between Chl-a and environmental parameters in the Gulf. The results further confirm the crucial interplay of physical and biological factors governing phytoplankton productivity in this ecologically and economically vital region. It underlines the importance of analyzing the spatial heterogeneity of major environmental drivers when studying marine ecosystems. The distinct correlation patterns across the four selected boxes indicated that local environmental conditions such as hydrodynamics, light and nutrient availability, or temperature gradients significantly influence the relationships between Chl-a and the selected variables. SST, SAL, WSP and PAR emerge as key factors influencing nutrient dynamics and phytoplankton productivity, with varying impacts across different regions. SST often showed a significant correlation with Chl-a, though the direction (positive or negative) varies across boxes, reflecting potential regional influences of temperature on phytoplankton dynamics. While SST is a strong positive driver for the regions along the southern and western Gulf (boxes 3 and 4), it negatively impacts Chl-a in the eastern and northern regions (boxes 1 and 2). The weak or moderate positive correlation of SLA and SAL with Chl-a, indicating that changes in sea level anomaly and salinity slightly influence nutrient availability or vertical mixing. PAR generally exhibits moderate or strong positive (negative) correlations with Chl-a in western and southern (eastern and northern) boxes, suggesting light availability may (not) be the primary limiting factor in these regions. The consistent negative correlations with PAR, particularly in boxes 1 and 2, highlight the persistent role of photoinhibition in limiting phytoplankton growth under high light conditions, a well-documented phenomenon common in shallow or clear waters with high solar insolation (Behrenfeld et al., 2001). Additionally, correlation between current speed and Chl-a were weaker in most boxes, indicating less direct influence. Beyond the pairwise relationship from correlogram analysis, PCA further confirmed and highlights how multiple factors interact to form distinct environmental regimes and complements the findings by decomposing the variance in Chl-a into key multivariate components. It also demonstrates that while individual parameters have distinct pairwise correlations with Chl-a, their combined effects vary regionally. These findings are essential for refining ecological models and developing effective management strategies in the Gulf, particularly in the context of ongoing environmental changes (Al-Yamani et al., 2020). The overall results of the correlogram and PCA are summarized in Table 1.
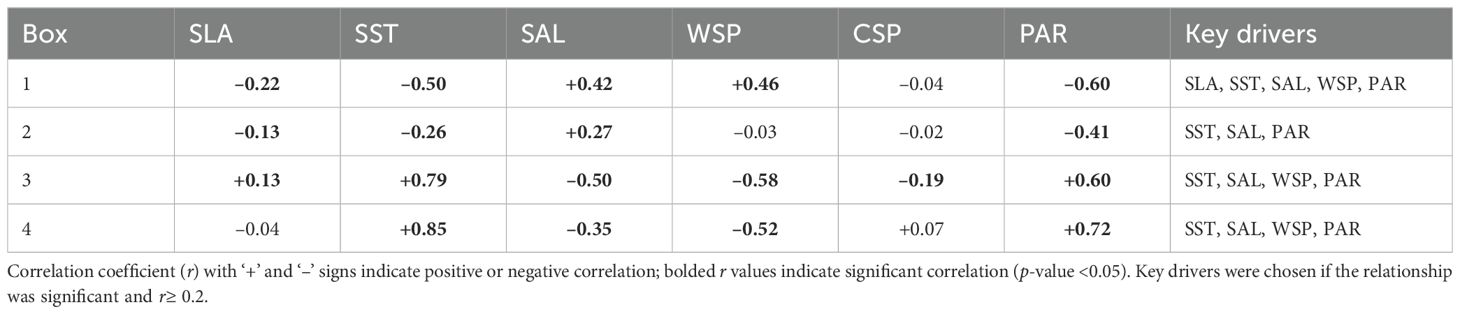
Table 1. Summary of the correlogram and PCA analyses results showing relationship of environmental parameters with Chl-a.
3.5 Dominant spatiotemporal patterns of Chl-a: EOF analysis
EOF decomposition was applied to Chl-a in the Gulf to identify the primary modes of variability and their potential driving mechanisms. The results exhibited four dominant modes: each captures distinct patterns of variability and contributes to understand the Chl-a dynamics in the region (Figure 6). The first mode of EOF accounted for 47% of the total variance, making it the dominant pattern of Chl-a variability. The spatial plot indicated a homogeneous distribution across the Gulf, with stronger variability observed along the northern and eastern coastal regions, particularly near the strait of Hormuz and along the Iran coast (Figure 6a). The corresponding temporal series showed sharp peaks during 2008–2009 (Figure 6b), indicating the influence of extreme climate anomalies apart from episodic algal bloom events (Chinta et al., 2024). These climatic events impact the Indian Ocean monsoon system and oceanic productivity in adjacent regions, including the Gulf (Al-Yamani et al., 2004; Shafeeque et al., 2021a; Seelanki et al., 2022). Other contributing processes may include seasonal upwelling, mesoscale eddies and anthropogenic nutrient inputs, which enhance nutrient availability and drive Chl-a fluctuations (Kämpf and Sadrinasab, 2006; Thoppil and Hogan, 2010a; Ismail and Al Shehhi, 2022). The second EOF mode explained 35% of the variance and is characterized by a localized pattern, with strong positive loadings near the northern Gulf, particularly along the Kuwait and Iraq coasts (Figure 6a). Temporal evolution suggested a distinct seasonal cycle, indicating that this mode is strongly influenced by regional hydrodynamic processes. A key driver of this pattern is likely the river discharges, especially from the Shatt al-Arab river, which injects freshwater and nutrients into the Gulf, stimulating phytoplankton blooms (Abaychi et al., 1988; Sheppard et al., 2010). Additionally, wind-driven circulation and coastal currents play a role in shaping this variability by modulating nutrient transport and stratification dynamics (Mussa et al., 2024).
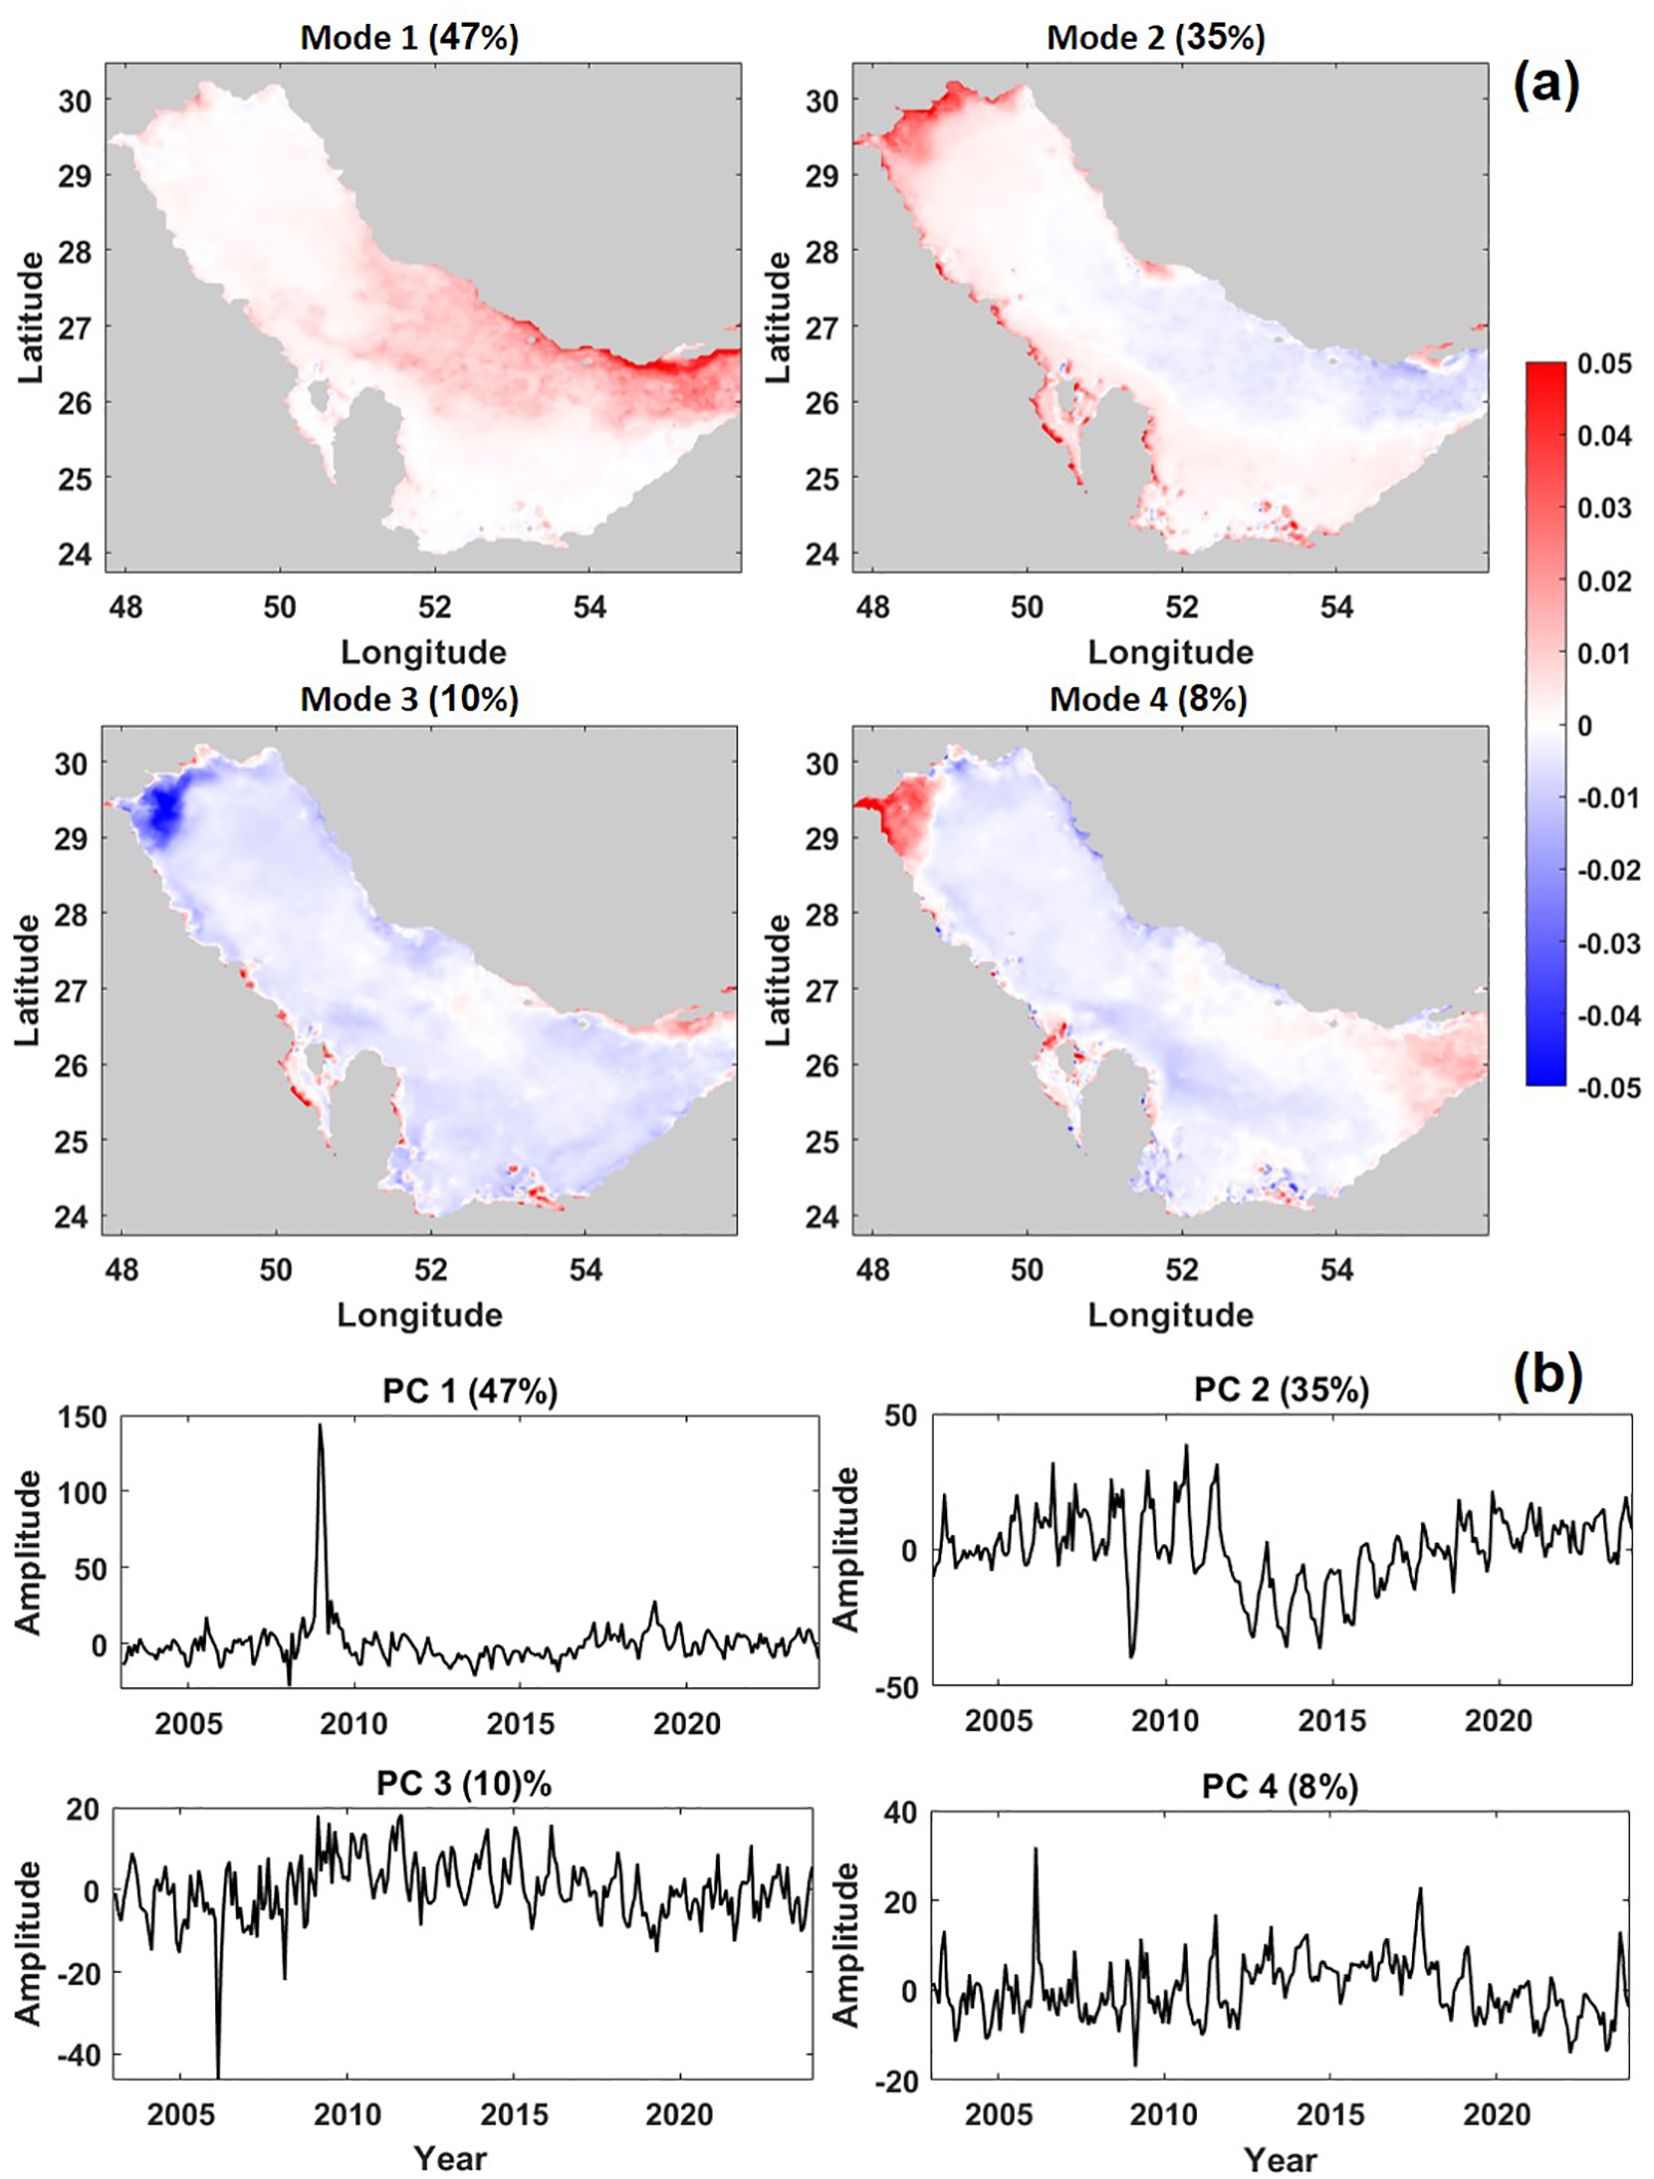
Figure 6. EOF analysis: (a) Spatial maps for first four dominant modes (b) Time series for first four principal components.
The third EOF mode captured 10% of the variance, which highlights Chl-a variability mainly along the central and southeastern Gulf. The time series indicates interannual variability, possibly linked to fluctuations in wind-driven mixing and atmospheric dust deposition (Nezlin et al., 2010; Asgari and Soleimany, 2023). The interplay between wind mixing and nutrient availability appears to be a key factor in driving this mode. The fourth EOF mode accounts for 8% of the variance and exhibits a more localized pattern along the northwest (Kuwait coast) and near to the Strait of Hormuz (north U.A.E. coast) of the Gulf. The associated time series suggests short-term fluctuations (Figure 6b), indicating that this mode is influenced by regional oceanographic processes rather than long-term climatic patterns. Additionally, extreme weather events, such as dust storms and cyclones, may contribute to the observed variability by altering light penetration and nutrient fluxes (Nezlin et al., 2010; Jish Prakash et al., 2015; Madhusoodhanan et al., 2024). Overall, the EOF results reveal that Chl-a dynamics in the Gulf are not uniformly driven by seasonal processes, but controlled by a combination of large-scale climatic influences, regional hydrodynamic processes, and localized oceanographic phenomena. These modes offer valuable baselines for long-term monitoring and ecosystem forecasting. The dominance of the first two Modes (82%) highlights the predominant role of climatic and seasonal forcing, whereas the other modes capture more localized and transient processes. This analysis strengthens the importance of understanding multiple scales of variability to improve predictions of phytoplankton dynamics and ecosystem responses in this ecologically and economically significant region.
3.6 Interannual variability in Chl-a and dominant environmental variables
The interannual variability of Chl-a in the Gulf was briefly revealed in the time series (section 3.3) and EOF analyses (section 3.5), which indicated that Chl-a concentrations have undergone significant fluctuations during the study period. Based on the correlogram and PCA results presented in Table 1, we selected two regions (boxes 1 and 3) representing the eastern and western coasts of the Gulf to further explore interannual changes in Chl-a along with dominant environmental factors (SST, SAL, SLA, WSP and PAR). The time series of these variables are plotted for the period 2003 to 2023 (Figure 7). Moreover, a lag correlation analysis for these boxes was also done and presented as supplementary figures (Supplementary Figures S4, S5). Prolonged high values of Chl-a concentration were recorded in box 1 (along the Iran Coast) from 2006 to 2009 (Figure 7a). The years 2008 and 2009 showed the highest Chl-a anomaly (1.5 mg/m³), indicating an intense phytoplankton bloom; conversely, the lowest Chl-a occurred in 2010, 2013 and 2020, indicating a period of markedly reduced biological productivity. The central-eastern coast of the Gulf, particularly along the Iran coast is characterized by frequent upwelling events that significantly influence Chl-a variability (Ismail and Al Shehhi, 2022). Upwelling brings nutrient-rich deep waters to the surface, supporting phytoplankton blooms and leading to higher Chl-a concentration (Moradi and Kabiri, 2015; Shafeeque et al., 2021b). The period of lower Chl-a could be attributed to weaker winds and higher SST, limiting vertical mixing and reducing nutrient availability. Recent studies have highlighted the increasing frequency of marine heatwaves over this region, which can disrupt upwelling and reduce phytoplankton productivity (Chaidez et al., 2017; Hamdeno et al., 2022; Kashkooli et al., 2022; Shaltout and Eladawy, 2024). Salinity in this region is influenced by the influx of nutrient-rich waters from upwelling and the exchange with the Indian Ocean through the Strait of Hormuz (Lorenz et al., 2020; Ghaemi et al., 2021). Earlier studies have emphasized the role of salinity gradients in shaping phytoplankton communities in upwelling zones (Wabnitz et al., 2018; Ben-Hasan and Christensen, 2019; Alnafissa et al., 2021). The lag correlation analysis for box 1 highlights the temporal shifts in the relationship between Chl-a and environmental parameters, reflecting the influence of seasonal progression, mixing processes, and hydrodynamic conditions. SST exhibited strong negative correlation (–0.62) at lag +1 month, consistent with nutrient depletion during periods of sustained warming (Supplementary Figure S4). SAL exhibited positive correlations (+0.45) peaking at lag +1 month. Wind speed showed maximum correlation (+0.46) at a lag 0, highlighting the direct impact of wind-driven nutrient entrainment on Chl-a production. CSP had moderate positive correlations at long negative lags (+0.30 at –6 months). PAR displayed strong negative correlations near lag 0 (–0.60), likely reflecting that the immediate impact of irradiance on Chl-a. Overall, these results underscore that Chl-a variability in box 1 is shaped by cumulative warming and light availability months in advance, coupled with immediate influences of wind-driven mixing and dynamic changes in salinity and current regimes.
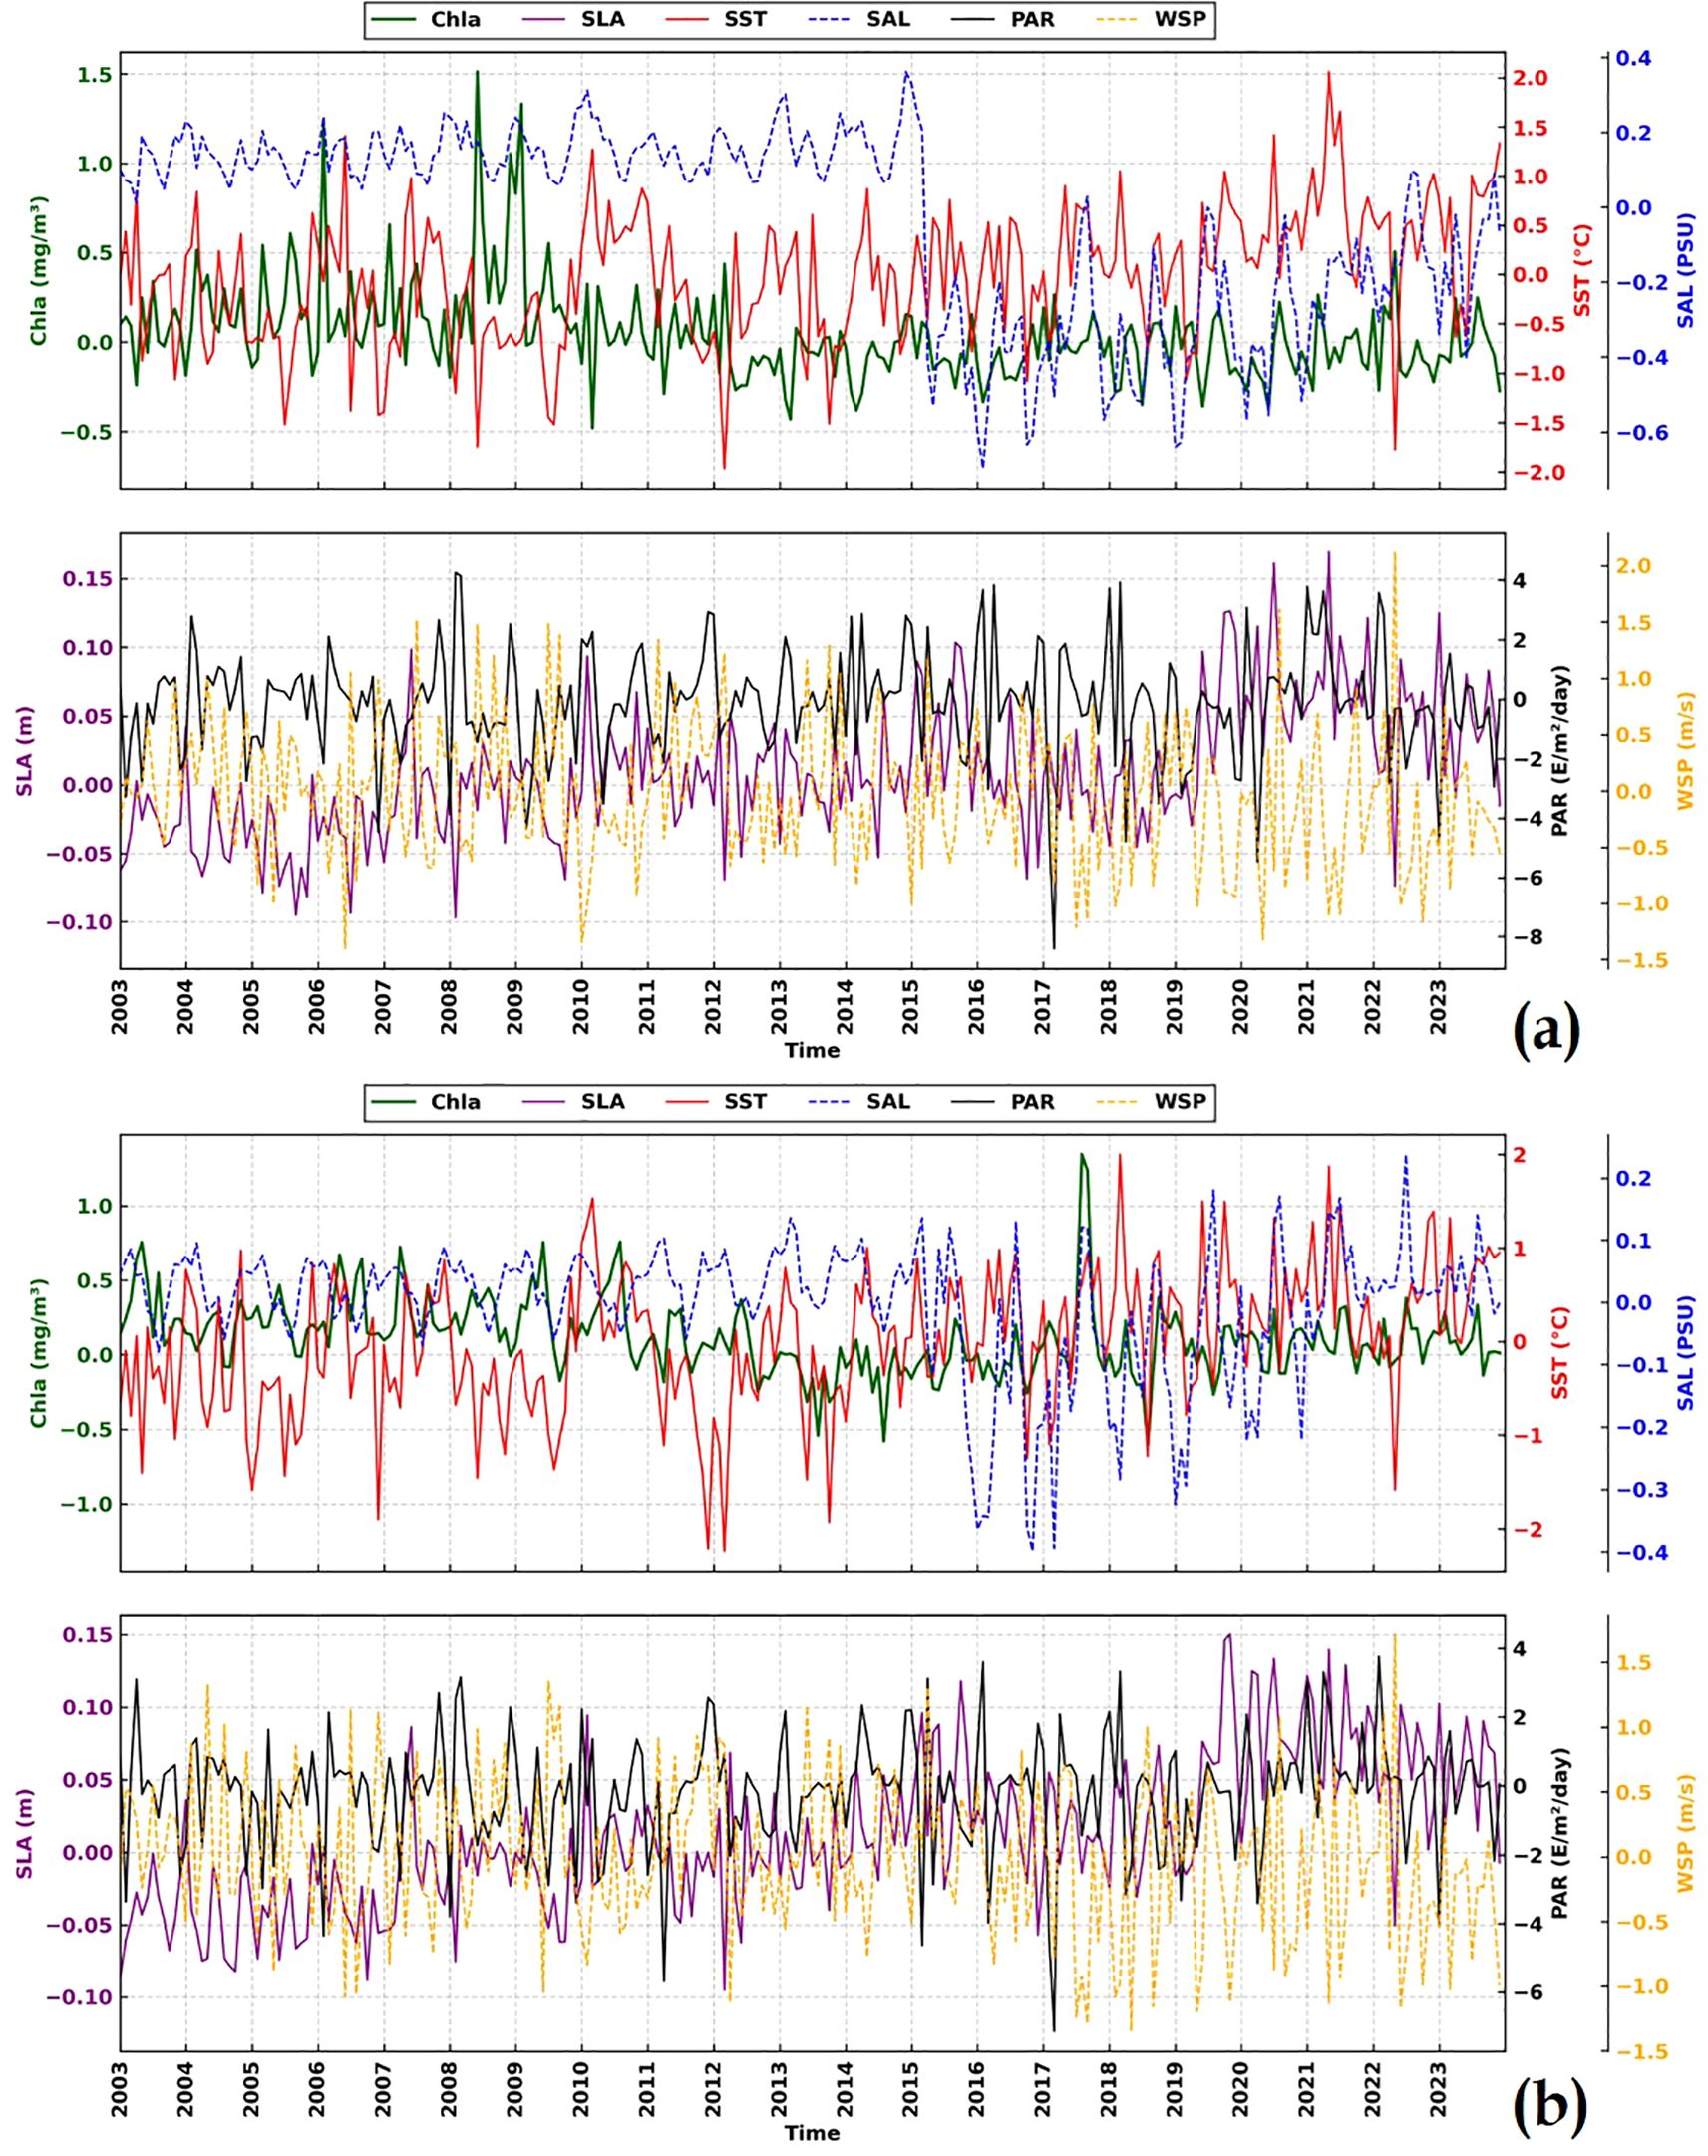
Figure 7. Interannual variability of chlorophyll-a (Chl-a), sea level anomaly (SLA), sea surcace temperature (SST), salinity (SAL), wind speed (WSP), current speed (CSP) and photosynthetically available radiation (PAR) from 2003–2023 for (a) box 1 and (b) box 3.
Unlike box 1, peak Chl-a values in box 3 (Saudi Coast) mostly occurred during summer months, with highest Chl-a (3.9 mg/m³) was recorded in August 2017 (Figure 7b). The seasonal peak during summer is associated with intensified thermal stratification, coupled with wind-driven mixing that redistributes nutrients in the upper water column (Reynolds, 1993; Doney, 2006). The year 2017 marked the highest Chl-a concentration, potentially influenced by anomalous weather conditions, including stronger than usual Shamal winds and regional upwelling events (Al Senafi and Anis, 2020). The dominance of SST as the key driver was evident, as this region follows a summer Chl-a peak rather than a winter peak (Figure 7b). Salinity in this region is normally high due to limited freshwater input and high evaporation rates. However, localized reductions in salinity can enhance nutrient availability and support phytoplankton growth (Lattemann and Höpner, 2008). Recent research has highlighted the role of salinity gradients in shaping phytoplankton communities (Al-Thani et al., 2023). In box 3, SST showed its highest correlation (+0.79) with Chl-a without any lag (Supplementary Figure S5). However, at a lag of –6 months, the same correlation also existed with opposite direction (–0.79). Salinity peaked at a lag of –1 to –2 months, exhibiting a strong negative correlation of –0.72. Wind speed and CSP presented their maximum correlations (–0.58 and –0.19, respectively) with 0 lags. PAR displayed a high positive correlation (+0.76) at a lag of –2 months. Despite a lag or lead of a few months, box 3 also revealed more or less similar correlation pattern to the results of correlogram analysis.
The interannual patterns across the two selected regions highlight the disparity in the role of environmental drivers in Chl-a variability. A key distinction between the regions was the seasonality of peak Chl-a concentration. Box 1 exhibited winter-dominated Chl-a peaks, reflecting SST-driven mixing and enhanced nutrient supply during colder months. Box 3 followed a summer peak, suggesting a different nutrient cycling mechanism, possibly linked to temperature-induced stratification dynamics. These findings align with prior sections and studies also indicated that winter blooms in the Gulf are primarily regulated by nutrient enrichment via convective mixing and riverine input, while summer productivity in the western Gulf is influenced by local wind-driven upwelling and water column stability (Wiggert et al., 2005; Thoppil and Hogan, 2010a, 2010b). While interannual variability is controlled by oceanographic and atmospheric forcing, potential impacts of climate change and human activities cannot be ignored. Warming trends in the Gulf intensify stratification, reduce nutrient replenishment, and shifting phytoplankton community structures (Al-Yamani et al., 2004; Wabnitz et al., 2018). Major climatic events have influenced productivity, reinforcing the role of global climate variability in regional ocean dynamics (Doney, 2006; Park et al., 2018; Shafeeque et al., 2021b; Hamdeno et al., 2022; Kashani et al., 2025). The lag correlation analysis of Chl-a with environmental variables further revealed complex distinct temporal patterns shaped by seasonal dynamics, hydrodynamic conditions, and mixing processes. Overall, these patterns demonstrate that Chl-a dynamics in the Gulf are governed by a combination of cumulative seasonal warming and light availability, modulated by lagged effects of mixing, circulation, and salinity changes which need to be further explored in the future work. The varying timing and magnitude of these relationships across boxes further confirmed the spatial heterogeneity of phytoplankton responses to environmental forcing in this highly dynamic marine ecosystem. In addition to the seasonal and interannual variability of Chl-a with contributions from environmental factors, we analyzed the spatial trends of NPP along with Chl-a and SST to enhance our findings in the following section.
3.7 Long-term spatial trend in Chl-a, NPP and SST
A two-decade (2003– 2023) cumulative spatial trend for Chl-a, NPP and SST in the Gulf was calculated and presented in Figure 8. The result showed an overall decrease in Chl-a and NPP trend (Figure 8a) in the Gulf, with small patches of increasing trend along the coasts of western and southern Gulf. Whereas SST showed a warming trend in the northern and central Gulf. The declining trend in Chl-a and NPP is due to the high SST and stratification, which limit nutrient availability in the surface layer (Polikarpov et al., 2016; Al-Shehhi et al., 2021). The oligotrophic nature of these regions makes them particularly sensitive to changes in environmental conditions, such as reduced vertical mixing and nutrient upwelling (Reynolds, 1993; Thoppil and Hogan, 2010a). The declining Chl-a trend was also aligned with the observed decreasing trend in NPP (Figure 8b). This decline is likely driven by the combined effects of warming SST, reduced nutrient availability, and increased stratification (Reynolds, 1993; Behrenfeld et al., 2006; Polikarpov et al., 2016). Recent studies have also linked these trends to the intensification of climate change impacts, such as more frequent marine heatwaves and reduced oxygen levels (Chaidez et al., 2017; Wabnitz et al., 2018; Shaltout and Eladawy, 2024). Continued warming and increasing frequency of marine heatwaves may further weaken offshore productivity, with potential implications for carbon cycling and ecosystem resilience (Wabnitz et al., 2018; Kashkooli et al., 2022).
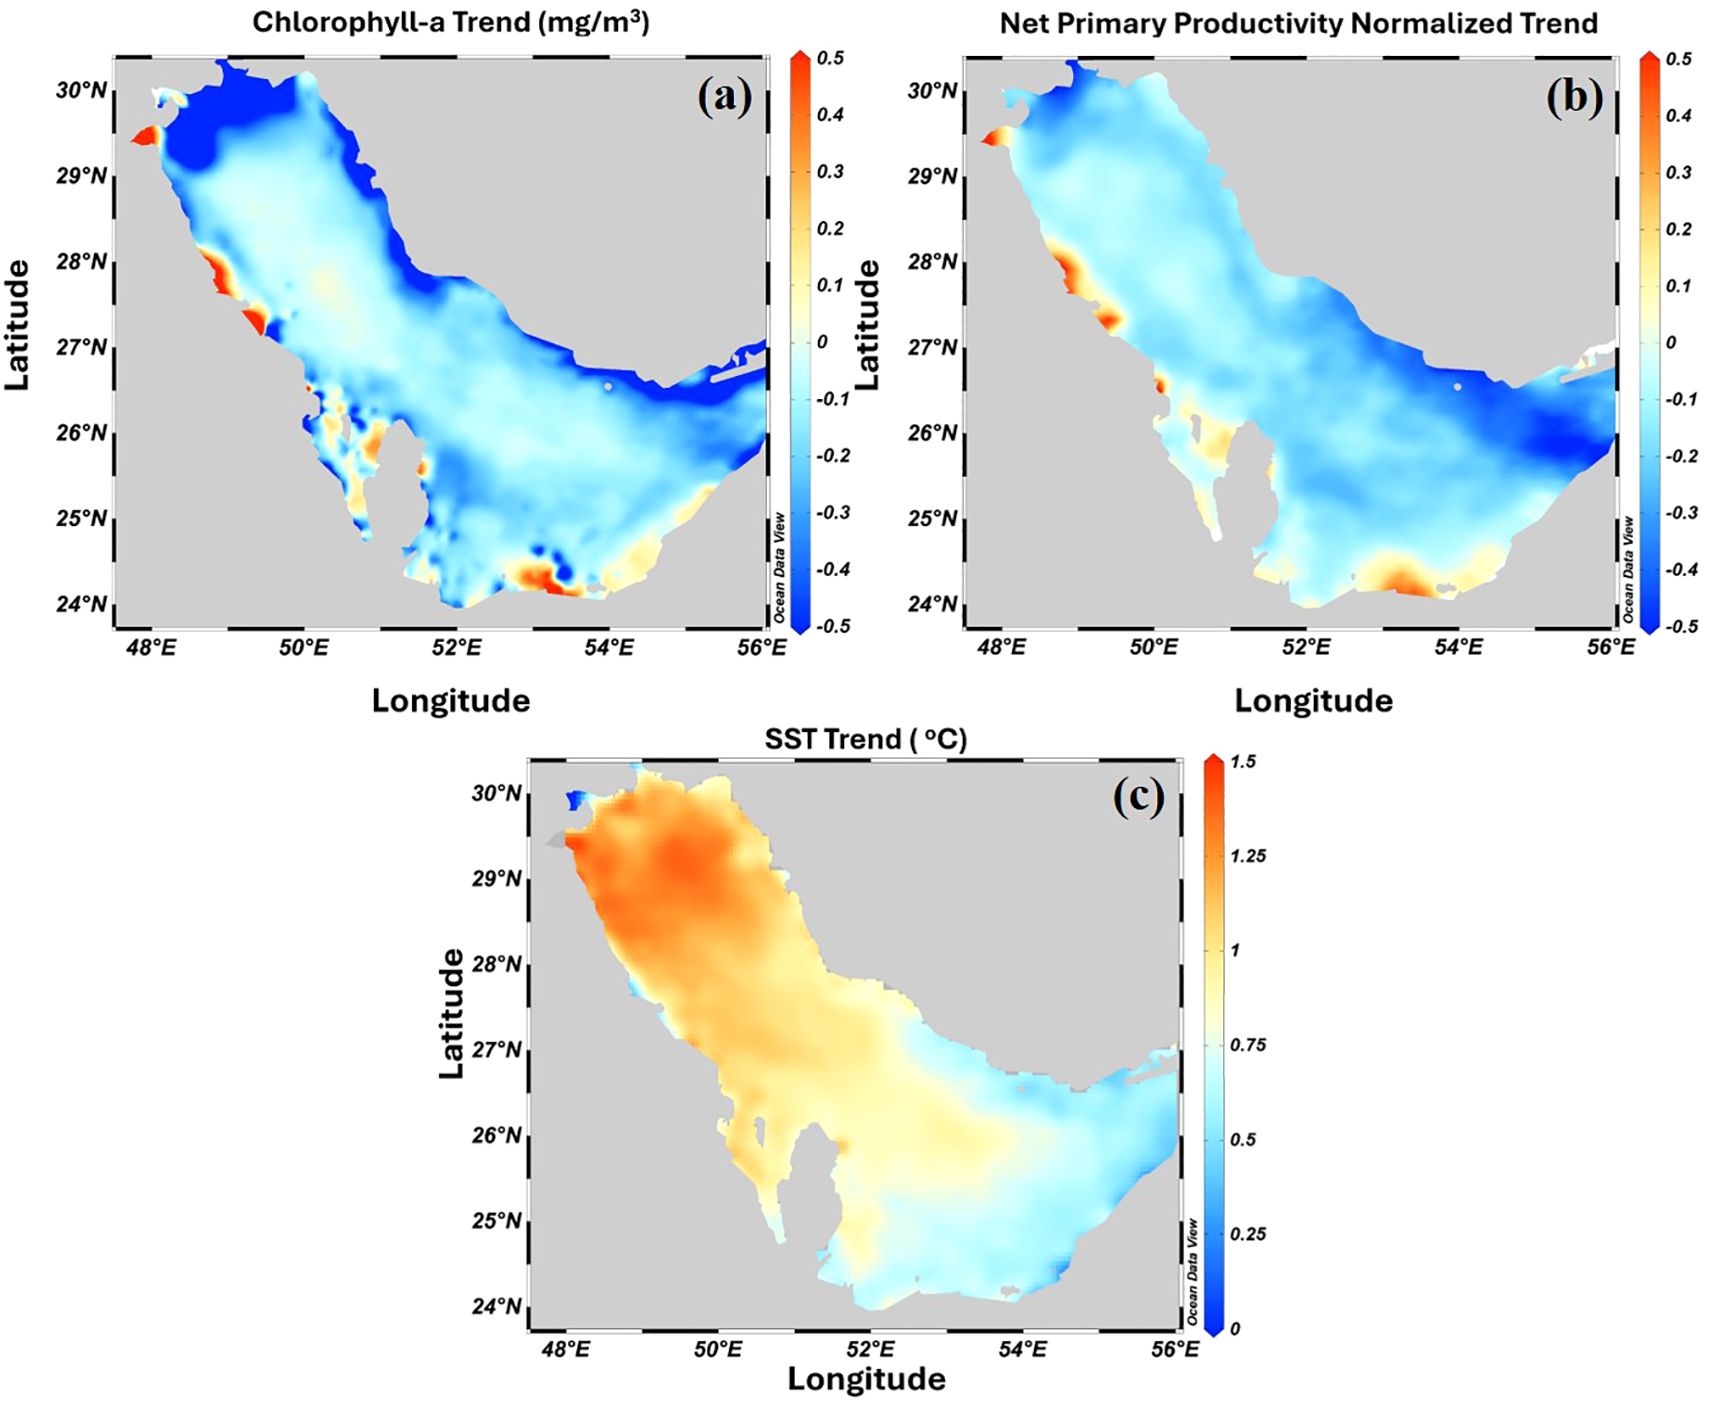
Figure 8. Spatial map of cumulative trend during 2003–2023 for ) (a) Chlorophyll-a and (b) Net primary productivity (normalized to –1 to +1) and (c) Sea Surface Temperature (SST).
The observed long-term trends in Chl-a, NPP and SST have significant implications for the marine ecosystem of the Gulf. Coastal regions with decreasing Chl-a and NPP trend could negatively impact pelagic species and commercial fisheries that rely on open-water resources (Mieszkowska et al., 2009; Gamito et al., 2015; Wabnitz et al., 2018). High SST and stratification reduce vertical mixing and nutrient supply to the surface layer (Chaidez et al., 2017). The Gulf experiences a more pronounced SST shift due to its shallow depths and limited water circulation, which result in faster and more intense heating. The SST trend across the Gulf exhibited significant escalation over the past two decades which leads to extensive implications. The escalating SST levels, ranging from 0.5°C in the Strait of Hormuz to 1.5°C in the Northern Gulf, underscore the severity of this thermal shift (Figure 8c). The central Gulf also experienced a ~0.5oC SST increase during the past two decades. These changes are pronounced in the Gulf as observed in the previous sections, where dominant environmental factors vary regionally. Human activities, such as coastal development, desalination and oil exploration also impact the marine ecosystem. Desalination is the primary source of freshwater in the region, discharges highly saline and chemically altered brine back into the coastal waters. This can alter the salinity and nutrient dynamics and eventually enhance Chl-a and NPP in the coastal areas (Peterson et al., 2003; Purnama et al., 2003; Lattemann and Höpner, 2008). In parallel, large-scale coastal development, land reclamation, industrial expansion, dredging activities, overfishing, and other population-driven stressors have reshaped nearshore habitats of the Gulf and modified circulation patterns, further impacting water quality and primary productivity (Burt, 2014; Naser, 2014; Al-Thani et al., 2023). Further, these activities can also lead to eutrophication and harmful algal blooms, which may disrupt ecosystem balance (Glibert et al., 2014; Madhusoodhanan et al., 2025). Understanding such dynamics is crucial for sustainable marine management, particularly in light of rapid coastal development and climate-driven changes. The ecological impacts of rising SST in the Gulf are manifold. Elevated SST can disrupt marine ecosystems, leading to coral bleaching, changes in species distribution, and alterations in food webs (Riegl et al., 2011; Cavalcante et al., 2016; Harrison et al., 2017). This, in turn, can have cascading effects on biodiversity and fisheries productivity, threatening the livelihoods of communities reliant on marine resources. Moreover, the socioeconomic consequences of escalating SST in the Gulf are significant. Fisheries, tourism, and other industries dependent on the marine environment may suffer due to declining fish stocks, damaged coral reefs, and reduced attractiveness of coastal destinations. The cumulative impacts of the anthropogenic pressures add to the natural variability driven by climate and oceanographic factors, making it difficult to separate human-induced signals from natural ones. Nonetheless, integrating such drivers into the interpretation of Chl-a trends is essential for a more holistic understanding of ecosystem changes in this semi-enclosed and heavily developed marine basin.
3.8 Uncertainties in satellite-derived Chl-a and the use of OC-CCI data
Global satellite-derived surface Chl-a data have become an essential tool for studying ecosystem and biogeochemical processes. However, the potential offered by these data sets can be fulfilled only if their uncertainties are quantified, and indeed, this assessment is considered an integral part of any ocean color mission (McClain et al., 2004; Mélin, 2009). Even though the ocean color datasets have been extensively validated, certain limitations remain, particularly in optically complex Case-2 waters such as the Gulf waters. Shallow depth, high turbidity, and elevated concentration of optically active substances can reduce algorithm accuracy and lead to greater uncertainties in nearshore Chl-a retrievals. The lack of long-term in-situ measurements further limits validation at finer spatial and temporal scales. The global distribution of random uncertainty in satellite-derived Chl-a varies significantly by region, with higher values typically observed in coastal and turbid waters due to challenges in atmospheric correction and the separating water-leaving radiance from atmospheric signals. While the general global patterns of Chl-a are relatively consistent across different satellite products, regional uncertainty differences remain substantial, highlighting the need for region-specific approaches to uncertainty assessment.
Nevertheless, global ocean color products, including the OC-CCI dataset used in this study, have been undergoing continuous improvements in merging techniques, atmospheric correction, and algorithm refinements (Sathyendranath et al., 2019). The OC-CCI dataset, in particular, has been shown in both global and Gulf-specific studies to provide consistent and reliable estimates, outperforming earlier satellite products in terms of stability and cross-sensor consistency (Belo Couto et al., 2016; Al-Naimi et al., 2017; Moradi, 2021). Uncertainty in OC-CCI Chl-a data arises from factors such as sensor noise, optical classification limits, differences in atmospheric correction and algorithm performance across various water types and missions, and spatiotemporal scale mismatches (Mélin et al., 2016; Brewin et al., 2017; IOCCG, 2019). To address this, OC-CCI provides per-pixel uncertainty estimates based on an improved optical classification scheme and blending algorithms. The development of a new, improved optical classification scheme based on a larger dataset of satellite-derived spectra, and the use of class membership to assess the performance of multiple algorithms within each water class and to blend algorithms have further enhanced the assignment of uncertainties, and improved the quality of the final product, especially for Chl-a (Jackson et al., 2022). These developments make OC-CCI a robust resource for long-term Chl-a studies, while the acknowledged limitations highlight the need for complementary in-situ observations and tailored regional algorithms. Moreover, the use of latest version (Version 6.0) in this study also ensures improvements to the algorithm blending and error correction to provide more reliable results.
4 Conclusions
In this study, we conducted a comprehensive analysis of the spatiotemporal variability of Chl-a, regional patterns with causative environmental factors and long-term trends in the Gulf using OC-CCI Chl-a data and other environmental variables for the period 2003 to 2023. We followed an integrated approach using climatology, statistical multivariate, interannual and trend analyses to assess the variability and identify the dominant drivers of Chl-a variability. Our analyses revealed strong seasonal and interannual modulation, with a marked Chl-a peak in winter, followed by a minimum during summer, and low to moderate levels during the transitional months. Chl-a was higher all along the coast compared with offshore waters, particularly along the eastern coastal waters. The results also showed winter-driven blooms in the northern and eastern Gulf and summer-driven productivity in the western Gulf. This seasonal and regional variability highlighted the substantial role of environmental factors on Chl-a. The PCA and correlogram analysis further verified these findings, highlighting strong relationships between Chl-a and key environmental parameters, particularly SST, SAL, PAR and wind speed, with regional distinctions. The analysis of long-term spatial trend between Chl-a, NPP and SST indicated an overall decreasing trend in Chl-a and NPP, specifically along the north and eastern coasts of the Gulf; and warming SST in the northern and central Gulf. The interannual variability and lag correlations revealed consistent patterns between Chl-a concentration and key environmental drivers, often marked by moderate to strong correlation coefficients with a lead or lag of a few months. These temporal shifts suggest that the response of phytoplankton biomass to environmental forcing is not always immediate but rather influenced by delayed or cumulative effects across seasonal to interannual timescales. Given the ecological and economic significance of the Gulf, these results have important implications for fisheries management, climate adaptation strategies, and ecosystem resilience assessments. Future studies should integrate high-resolution biophysical models with in-situ and satellite measurements to better capture the subsurface processes and predict the impacts of environmental changes on the marine food web. Long-term monitoring and predictive modeling will be essential for the sustainable management of the Gulf’s marine resources under changing climate conditions.
Data availability statement
Publicly available datasets were analyzed in this study. This data can be found here:https://data.marine.copernicus.eu/products, https://www.oceancolour.org, http://oceancolor.gsfc.nasa.gov.
Author contributions
MS: Conceptualization, Data curation, Writing – original draft, Writing – review & editing, Formal analysis, Methodology. AS: Writing – review & editing, Methodology, Data curation. AC: Methodology, Writing – review & editing. CA: Data curation, Writing – review & editing. SL: Writing – review & editing. JA: Funding acquisition, Supervision, Writing – review & editing.
Funding
The author(s) declare that no financial support was received for the research and/or publication of this article.
Acknowledgments
The authors would like to thank the Director, Applied Research Center for Environment and Marine Studies, King Fahd University of Petroleum & Minerals, Dhahran, Saudi Arabia, for providing the research facilities essential for this study. Authors thank faculty and support staffs for their invaluable contributions. We are extremely grateful to the reviewers for their valuable comments and suggestions. Authors also gratefully acknowledge Ocean Colour Climate Change Initiative project of European Space Agency for the use of Chl-a dataset and other environmental variables accessed from CMEMS, Copernicus Climate Change Service and NASA Goddard Space Flight Center.
Conflict of interest
The authors declare that the research was conducted in the absence of any commercial or financial relationships that could be construed as a potential conflict of interest.
Generative AI statement
The author(s) declare that no Generative AI was used in the creation of this manuscript.
Any alternative text (alt text) provided alongside figures in this article has been generated by Frontiers with the support of artificial intelligence and reasonable efforts have been made to ensure accuracy, including review by the authors wherever possible. If you identify any issues, please contact us.
Publisher’s note
All claims expressed in this article are solely those of the authors and do not necessarily represent those of their affiliated organizations, or those of the publisher, the editors and the reviewers. Any product that may be evaluated in this article, or claim that may be made by its manufacturer, is not guaranteed or endorsed by the publisher.
Supplementary material
The Supplementary Material for this article can be found online at: https://www.frontiersin.org/articles/10.3389/fmars.2025.1619821/full#supplementary-material
References
Abaychi J. K., Darmoian S. A., and DouAbul A. A. Z. (1988). The Shatt Al-Arab River: a nutrient salt and organic matter source to the Arabian Gulf. Hydrobiologia 166, 217–224. doi: 10.1007/BF00008131
Aboobacker V. M., Samiksha S. V., Veerasingam S., Al-Ansari E. M., and Vethamony P. (2021). Role of shamal and easterly winds on the wave characteristics off Qatar, central Arabian Gulf. Ocean Eng. 236, 109457. doi: 10.1016/j.oceaneng.2021.109457
Al-Ansari E. M. A. S., Husrevoglu Y. S., Yigiterhan O., Youssef N., Al-Maslamani I. A., Abdel-Moati M. A., et al. (2022). Seasonal variability of hydrography off the east coast of Qatar, central Arabian Gulf. Arab. J. Geosci. 15, 1659. doi: 10.1007/s12517-022-10927-4
Alnafissa M., Kotb A., Alamri Y., Alagsam F., and Alhashim J. (2021). The impact of climatic and environmental changes on the sustainable yield of the Saudi’s capture fisheries. J. King Saud Univ. 33, 101458. doi: 10.1016/j.jksus.2021.101458
Al-Naimi N., Raitsos D. E., Ben-Hamadou R., and Soliman Y. (2017). Evaluation of satellite retrievals of chlorophyll-a in the Arabian Gulf. Remote Sens. 9, 301. doi: 10.3390/rs9030301
Al Senafi F. (2022). Atmosphere-ocean coupled variability in the arabian/persian gulf. Front. Mar. Sci. 9, 809355. doi: 10.3389/fmars.2022.809355
Al Senafi F. and Anis A. (2020). Wind-driven flow dynamics off the Northwestern Arabian Gulf Coast. Estuar. Coast. Shelf Sci. 233, 106511. doi: 10.1016/j.ecss.2019.106511
Al Shehhi M. R. and Kaya A. (2021). Time series and neural network to forecast water quality parameters using satellite data. Cont. Shelf Res. 231, 104612. doi: 10.1016/j.csr.2021.104612
Al-Shehhi M. R., Nelson D., Farzanah R., Alshihi R., and Salehi-Ashtiani K. (2021). Characterizing algal blooms in a shallow & a deep channel. Ocean Coast. Manage. 213, 105840. doi: 10.1016/j.ocecoaman.2021.105840
Al-Subhi A. M. and Abdulla C. P. (2021). Sea-level variability in the Arabian Gulf in comparison with global oceans. Remote Sens. 13, 4524. doi: 10.3390/rs13224524
Al-Thani J. A., Soliman Y., Al-Maslamani I. A., Yigiterhan O., and Al-Ansari E. M. A. S. (2023). Physical drivers of chlorophyll and nutrients variability in the Southern-Central Arabian Gulf. Estuar. Coast. Shelf Sci. 283, 108260. doi: 10.1016/j.ecss.2023.108260
Al-Yamani F. Y., Bishop J., Ramadhan E., Al-Husaini M., and Al-Ghadban A. N. (2004). Oceanographic atlas of Kuwait’s waters. (Kuwait: Kuwait Institute for Scientific Research).
Al-Yamani F. Y., Polikarpov I., and Saburova M. (2020). Marine life mortalities and harmful algal blooms in the Northern Arabian Gulf. Aquat. Ecosyst. Health Manage. 23, 196–209. doi: 10.1080/14634988.2020.1798157
Al-Yamani F., Rao D. V. S., Mharzi A., Ismail W., and Al-Rifaie K. (2006). Primary production off Kuwait, an arid zone environment, Arabian Gulf. Int. J. Ocean. Oceanogr. 1, 67–85.
Asgari H. M. and Soleimany A. (2023). Long-term study of desert dust deposition effects on phytoplankton biomass in the Persian Gulf using Google Earth Engine. Mar. pollut. Bull. 195, 115564. doi: 10.1016/j.marpolbul.2023.115564
Behrenfeld M. J. and Falkowski P. G. (1997). Photosynthetic rates derived from satellite-based chlorophyll concentration. Limnol. Oceanogr. 42, 1–20. doi: 10.4319/lo.1997.42.1.0001
Behrenfeld M. J., O’Malley R. T., Siegel D. A., McClain C. R., Sarmiento J. L., Feldman G. C., et al. (2006). Climate-driven trends in contemporary ocean productivity. Nature 444, 752–755. doi: 10.1038/nature05317
Behrenfeld M. J., Randerson J. T., McClain C. R., Feldman G. C., Los S. O., Tucker C. J., et al. (2001). Biospheric primary production during an ENSO transition. Sci. (80-. ). 291, 2594–2597. doi: 10.1126/science.1055071
Belo Couto A., Brotas V., Mélin F., Groom S., and Sathyendranath S. (2016). Inter-comparison of OC-CCI chlorophyll-a estimates with precursor data sets. Int. J. Remote Sens. 37, 4337–4355. doi: 10.1080/01431161.2016.1209313
Ben-Hasan A. and Christensen V. (2019). Vulnerability of the marine ecosystem to climate change impacts in the Arabian Gulf—an urgent need for more research. Glob. Ecol. Conserv. 17, e00556. doi: 10.1016/j.gecco.2019.e00556
Bordbar M. H., Nasrolahi A., Lorenz M., Moghaddam S., and Burchard H. (2024). The Persian Gulf and Oman Sea: climate variability and trends inferred from satellite observations. Estuar. Coast. Shelf Sci. 296, 108588. doi: 10.1016/j.ecss.2023.108588
Boyce D. G., Dowd M., Lewis M. R., and Worm B. (2014). Estimating global chlorophyll changes over the past century. Prog. Oceanogr. 122, 163–173. doi: 10.1016/j.pocean.2014.01.004
Brewin R. J. W., Ciavatta S., Sathyendranath S., Jackson T., Tilstone G., Curran K., et al. (2017). Uncertainty in ocean-color estimates of chlorophyll for phytoplankton groups. Front. Mar. Sci. 4, 104. doi: 10.3389/fmars.2017.00104
Brewin R. J. W., Sathyendranath S., Müller D., Brockmann C., Deschamps P.-Y., Devred E., et al. (2015). The Ocean Colour Climate Change Initiative: III. A round-robin comparison on in-water bio-optical algorithms. Remote Sens. Environ. 162, 271–294. doi: 10.1016/j.rse.2013.09.016
Burt J. A. (2014). The environmental costs of coastal urbanization in the Arabian Gulf. City 18, 760–770. doi: 10.1080/13604813.2014.962889
Cavalcante G. H., Feary D. A., and Burt J. A. (2016). The influence of extreme winds on coastal oceanography and its implications for coral population connectivity in the southern Arabian Gulf. Mar. pollut. Bull. 105, 489–497. doi: 10.1016/j.marpolbul.2015.10.031
Chaidez V., Dreano D., Agusti S., Duarte C. M., and Hoteit I. (2017). Decadal trends in Red Sea maximum surface temperature. Sci. Rep. 7, 8144. doi: 10.1038/s41598-017-08146-z
Chinta V., Kalhoro M. A., Liang Z., Tahir M., Song G., and Zhang W. (2024). Decadal climate variability of chlorophyll-a in response to different oceanic factors in the Western Indian ocean: the sea of Oman. Clim. Dyn. 62, 8675–8690. doi: 10.1007/s00382-024-07354-4
Dunstan P. K., Foster S. D., King E., Risbey J., O’Kane T. J., Monselesan D., et al. (2018). Global patterns of change and variation in sea surface temperature and chlorophyll a. Sci. Rep. 8, 14624. doi: 10.1038/s41598-018-33057-y
Elobaid E. A., Al-Ansari E. M. A. S., Yigiterhan O., Aboobacker V. M., and Vethamony P. (2022). Spatial variability of summer hydrography in the central Arabian Gulf. Oceanologia 64, 75–87. doi: 10.1016/j.oceano.2021.09.003
Ershadifar H., Koochaknejad E., Ghazilou A., Kor K., Negarestan H., and Baskaleh G. (2020). Response of phytoplankton assemblages to variations in environmental parameters in a subtropical bay (Chabahar Bay, Iran): Harmful algal blooms and coastal hypoxia. Reg. Stud. Mar. Sci. 39, 101421. doi: 10.1016/j.rsma.2020.101421
Gamito R., Costa M. J., and Cabral H. N. (2015). Fisheries in a warming ocean: trends in fish catches in the large marine ecosystems of the world. Reg. Environ. Change 15, 57–65. doi: 10.1007/s10113-014-0615-y
Ghaemi M., Abtahi B., and Gholamipour S. (2021). Spatial distribution of nutrients and chlorophyll a across the Persian Gulf and the Gulf of Oman. Ocean Coast. Manage. 201, 105476. doi: 10.1016/j.ocecoaman.2020.105476
Glibert P. M., Icarus Allen J., Artioli Y., Beusen A., Bouwman L., Harle J., et al. (2014). Vulnerability of coastal ecosystems to changes in harmful algal bloom distribution in response to climate change: projections based on model analysis. Glob. Change Biol. 20, 3845–3858. doi: 10.1111/gcb.12662
Good S., Fiedler E., Mao C., Martin M. J., Maycock A., Reid R., et al. (2020). The current configuration of the OSTIA system for operational production of foundation sea surface temperature and ice concentration analyses. Remote Sens. 12, 720. doi: 10.3390/rs12040720
Gregg W. W. and Casey N. W. (2004). Global and regional evaluation of the SeaWiFS chlorophyll data set. Remote Sens. Environ. 93, 463–479. doi: 10.1016/j.rse.2003.12.012
Hamdeno M., Nagy H., Ibrahim O., and Mohamed B. (2022). Responses of satellite chlorophyll-a to the extreme sea surface temperatures over the Arabian and Omani Gulf. Remote Sens. 14, 4653. doi: 10.3390/rs14184653
Hamed K. H. and Rao A. R. (1998). A modified Mann-Kendall trend test for autocorrelated data. J. Hydrol. 204, 182–196. doi: 10.1016/S0022-1694(97)00125-X
Harrison P. J., Piontkovski S., and Al-Hashmi K. (2017). Understanding how physical-biological coupling influences harmful algal blooms, low oxygen and fish kills in the Sea of Oman and the Western Arabian Sea. Mar. pollut. Bull. 114, 25–34. doi: 10.1016/j.marpolbul.2016.11.008
Helena B., Pardo R., Vega M., Barrado E., Fernandez J. M., and Fernandez L. (2000). Temporal evolution of groundwater composition in an alluvial aquifer (Pisuerga River, Spain) by principal component analysis. Water Res. 34, 807–816. doi: 10.1016/S0043-1354(99)00225-0
Hersbach H., Bell B., Berrisford P., Biavati G., Horányi A., Muñoz Sabater J., et al. (2023). ERA5 monthly averaged data on pressure levels from 1940 to present. Copernicus Climate Change Service (C3S) Climate Data Store (CDS) 10. doi: 10.24381/cds.adbb2d47
IOCCG (2019). Uncertainties in ocean colour remote sensing. Ed. Mélin F. (Dartmouth, Canada: IOCCG Rep. Ser. No. 18, Int. Ocean Colour Coord. Group, Dartmouth), 5–42.
Ismail K. A. and Al Shehhi M. R. (2022). Upwelling and nutrient dynamics in the Arabian Gulf and sea of Oman. PloS One 17, e0276260. doi: 10.1371/journal.pone.0276260
Jackson T., Sathyendranath S., Groom S., and Calton B. (2022). Product user guide for v6.0 dataset, Ocean Colour Climate Change Initiative – phase 3. 6.1, ESA/ESRIN. ESA. (United Kingdom: Plymouth Marine Laboratory) 54.
Jish Prakash P., Stenchikov G., Kalenderski S., Osipov S., and Bangalath H. (2015). The impact of dust storms on the Arabian Peninsula and the Red Sea. Atmos. Chem. Phys. 15, 199–222. doi: 10.5194/acp-15-199-2015
Jolliffe I. T. (2002). Principal component analysis for special types of data. (New York: Springer).
Kämpf J. and Sadrinasab M. (2006). The circulation of the Persian Gulf: a numerical study. Ocean Sci. 2, 27–41. doi: 10.5194/os-2-27-2006
Kashani I., Panhwar S. K., and Kachhi K. K. (2025). Climate change and its effects on the marine food web with a concentration on the pelagic fishery in the northern Arabian Sea. Oceanologia 67, 67111. doi: 10.5697/USFE4011
Kashkooli O. B., Karimian S., and Modarres R. (2022). Spatiotemporal variability of the Persian Gulf and Oman Sea marine heatwaves during 1982–2020. Mar. pollut. Bull. 184, 114174. doi: 10.1016/j.marpolbul.2022.114174
Kraemer B. M., Kakouei K., Munteanu C., Thayne M. W., and Adrian R. (2022). Worldwide moderate-resolution mapping of lake surface chl-a reveals variable responses to global change, (1997–2020) PloS Water 1, e0000051. doi: 10.1371/journal.pwat.0000051
Kreyszig E. (1970). Introductory mathematical statistics: principles and methods. (Wiley, New York) 470.
Langodan S., Cavaleri L., Benetazzo A., Bertotti L., Dasari H. P., and Hoteit I. (2023). The peculiar wind and wave climatology of the Arabian Gulf. Ocean Eng. 290, 116158. doi: 10.1016/j.oceaneng.2023.116158
Lattemann S. and Höpner T. (2008). Environmental impact and impact assessment of seawater desalination. Desalination 220, 1–15. doi: 10.1016/j.desal.2007.03.009
Lins R. C., Martinez J.-M., Motta Marques D., da Cirilo J. A., Medeiros P. R. P., and Fragoso Júnior C. R. (2018). A multivariate analysis framework to detect key environmental factors affecting spatiotemporal variability of chlorophyll-a in a tropical productive estuarine-lagoon system. Remote Sens. 10, 853. doi: 10.3390/rs10060853
Lorenz M., Klingbeil K., and Burchard H. (2020). Numerical study of the exchange flow of the Persian Gulf using an extended total exchange flow analysis framework. J. Geophys. Res. Ocean. 125, e2019JC015527. doi: 10.1029/2019JC015527
Lotliker A. A., Baliarsingh S. K., Sahu K. C., and Kumar T. S. (2020). Long-term chlorophyll-a dynamics in tropical coastal waters of the western Bay of Bengal. Environ. Sci. pollut. Res. 27, 6411–6419. doi: 10.1007/s11356-019-07403-0
Madhusoodhanan R., Al-Said T., Sarkar A., Fernandes L., Ahmed A., Yamamoto T., et al. (2024). Aeolian dust and hydro-biological characteristics: Decoding dust storm impacts on phytoplankton in the northern Arabian Gulf. Sci. Total Environ. 911, 168583. doi: 10.1016/j.scitotenv.2023.168583
Madhusoodhanan R., Al-Yamani F., Al-Said T., Saburova M., Al-Kandari M., Yamamoto T., et al. (2025). Environmental triggers and ecological implications of a harmful algal bloom in the northern Arabian/Persian Gulf: Insights into the driving forces and consequences. Sci. Total Environ. 960, 178254. doi: 10.1016/j.scitotenv.2024.178254
McClain C. R. (2009). A decade of satellite ocean color observations. Ann. Rev. Mar. Sci. 1, 19–42. doi: 10.1146/annurev.marine.010908.163650
McClain C. R., Feldman G. C., and Hooker S. B. (2004). An overview of the SeaWiFS project and strategies for producing a climate research quality global ocean bio-optical time series. Deep Sea Res. Part II Top. Stud. Oceanogr. 51, 5–42. doi: 10.1016/j.dsr2.2003.11.001
Mélin F. (2009). Global distribution of the random uncertainty associated with satellite-derived Chl a. IEEE Geosci. Remote Sens. Lett. 7, 220–224. doi: 10.1109/LGRS.2009.2031825
Mélin F., Sclep G., Jackson T., and Sathyendranath S. (2016). Uncertainty estimates of remote sensing reflectance derived from comparison of ocean color satellite data sets. Remote Sens. Environ. 177, 107–124. doi: 10.1016/j.rse.2016.02.014
Mieszkowska N., Genner M. J., Hawkins S. J., and Sims D. W. (2009). Effects of climate change and commercial fishing on Atlantic cod Gadus morhua. Adv. Mar. Biol. 56, 213–273. doi: 10.1016/S0065-2881(09)56003-8
Moradi M. (2020). Trend analysis and variations of sea surface temperature and chlorophyll-a in the Persian Gulf. Mar. pollut. Bull. 156, 111267. doi: 10.1016/j.marpolbul.2020.111267
Moradi M. (2021). Evaluation of merged multi-sensor ocean-color chlorophyll products in the Northern Persian Gulf. Cont. Shelf Res. 221, 104415. doi: 10.1016/j.csr.2021.104415
Moradi M. and Kabiri K. (2015). Spatio-temporal variability of SST and Chlorophyll-a from MODIS data in the Persian Gulf. Mar. pollut. Bull. 98, 14–25. doi: 10.1016/j.marpolbul.2015.07.018
Moradi M. and Moradi N. (2020). Correlation between concentrations of chlorophyll-a and satellite derived climatic factors in the Persian Gulf. Mar. pollut. Bull. 161, 111728. doi: 10.1016/j.marpolbul.2020.111728
Mussa A. A., Aboobacker V. M., Abdulla C. P., Hasna V. M., Al-Ansari E. M. A. S., and Vethamony P. (2024). A climatological overview of surface currents in the Arabian Gulf with special reference to the Exclusive Economic Zone of Qatar. Int. J. Climatol. 44, 4677–4693. doi: 10.1002/joc.8603
Nardelli B. B., Droghei R., and Santoleri R. (2016). Multi-dimensional interpolation of SMOS sea surface salinity with surface temperature and in situ salinity data. Remote Sens. Environ. 180, 392–402. doi: 10.1016/j.rse.2015.12.052
Naser H. A. (2014). “Marine ecosystem diversity in the Arabian Gulf: threats and conservation,” in Biodiversity-The dynamic balance of the planet. (UK: IntechOpen Limited).
Nezlin N. P., Polikarpov I. G., and Al-Yamani F. (2007). Satellite-measured chlorophyll distribution in the arabian gulf: spatial, seasonal and inter-annual variability. Int. J. Oceans Oceanogr. 2, 139.
Nezlin N. P., Polikarpov I. G., Al-Yamani F. Y., Rao D. V. S., and Ignatov A. M. (2010). Satellite monitoring of climatic factors regulating phytoplankton variability in the Arabian (Persian) Gulf. J. Mar. Syst. 82, 47–60. doi: 10.1016/j.jmarsys.2010.03.003
Park J.-Y., Dunne J. P., and Stock C. A. (2018). Ocean chlorophyll as a precursor of ENSO: an earth system modeling study. Geophys. Res. Lett. 45, 1939–1947. doi: 10.1002/2017GL076077
Peterson C. H., Rice S. D., Short J. W., Esler D., Bodkin J. L., Ballachey B. E., et al. (2003). Long-term ecosystem response to the Exxon Valdez oil spill. Sci. (80-. ). 302, 2082–2086. doi: 10.1126/science.1084282
Piontkovski S. A. and Queste B. Y. (2016). Decadal changes of the Western Arabian sea ecosystem. Int. Aquat. Res. 8, 49–64. doi: 10.1007/s40071-016-0124-3
Polikarpov I., Saburova M., and Al-Yamani F. (2016). Diversity and distribution of winter phytoplankton in the Arabian Gulf and the Sea of Oman. Cont. Shelf Res. 119, 85–99. doi: 10.1016/j.csr.2016.03.009
Purnama A., Al-Barwani H. H., and Al-Lawatia M. (2003). Modeling dispersion of brine waste discharges from a coastal desalination plant. Desalination 155, 41–47. doi: 10.1016/S0011-9164(03)00237-6
Rajendran S., Al-Naimi N., Al Khayat J. A., Sorino C. F., Sadooni F. N., and Al Kuwari H. A. S. (2022). Chlorophyll-a concentrations in the Arabian Gulf waters of arid region: A case study from the northern coast of Qatar. Reg. Stud. Mar. Sci. 56, 102680. doi: 10.1016/j.rsma.2022.102680
Rao P. G., Al-Sulaiti M., and Al-Mulla A. H. (2001). Winter shamals in Qatar, arabian gulf. Weather 56, 444–451. doi: 10.1002/j.1477-8696.2001.tb06528.x
Rao P. G., Hatwar H. R., Al-Sulaiti M. H., and Al-Mulla A. H. (2003). Summer shamals over the Arabian Gulf. weather 58, 471–478. doi: 10.1002/wea.6080581207
Reynolds R. M. (1993). Physical oceanography of the Gulf, Strait of Hormuz, and the Gulf of Oman—Results from the Mt Mitchell expedition. Mar. pollut. Bull. 27, 35–59. doi: 10.1016/0025-326X(93)90007-7
Richlen M. L., Morton S. L., Jamali E. A., Rajan A., and Anderson D. M. (2010). The catastrophic 2008–2009 red tide in the Arabian gulf region, with observations on the identification and phylogeny of the fish-killing dinoflagellate Cochlodinium polykrikoides. Harmful Algae 9, 163–172. doi: 10.1016/j.hal.2009.08.013
Riegl B. M., Purkis S. J., Al-Cibahy A. S., Abdel-Moati M. A., and Hoegh-Guldberg O. (2011). Present limits to heat-adaptability in corals and population-level responses to climate extremes. PloS One 6, e24802. doi: 10.1371/journal.pone.0024802
Roxy M. K., Modi A., Murtugudde R., Valsala V., Panickal S., Prasanna Kumar S., et al. (2016). A reduction in marine primary productivity driven by rapid warming over the tropical Indian Ocean. Geophy.l Res. Let. 43, 826–833. doi: 10.1002/2015GL066979
Sammartino M., Aronica S., Santoleri R., and Buongiorno Nardelli B. (2022). Retrieving Mediterranean sea surface salinity distribution and interannual trends from multi-sensor satellite and in situ data. Remote Sens. 14, 2502. doi: 10.3390/rs14102502
Sathyendranath S., Brewin R. J. W., Brockmann C., Brotas V., Calton B., Chuprin A., et al. (2019). An ocean-colour time series for use in climate studies: the experience of the ocean-colour climate change initiative (OC-CCI). Sensors 19, 4285. doi: 10.3390/s19194285
Sathyendranath S., Jackson T., Brockmann C., Brotas V., Calton B., Chuprin A., et al. (2023). ESA Ocean Colour Climate Change Initiative (Ocean_Colour_cci): Monthly climatology of global ocean colour data products at 4km resolution, Version 6.0. NERC EDS Centre for Environmental Data Analysis. Available online at: https://catalogue.ceda.ac.uk/uuid/690fdf8f229c4d04a2aa68de67beb733.
Seelanki V., Nigam T., and Pant V. (2022). Unravelling the roles of Indian Ocean Dipole and El-Niño on winter primary productivity over the Arabian Sea. Deep Sea Res. Part I Oceanogr. Res. Pap. 190, 103913. doi: 10.1016/j.dsr.2022.103913
Shafeeque M., Balchand A. N., Shah P., George G., BR S., Varghese E., et al. (2021a). Spatio-temporal variability of chlorophyll-a in response to coastal upwelling and mesoscale eddies in the South Eastern Arabian Sea. Int. J. Remote Sens. 42, 4836–4863. doi: 10.1080/01431161.2021.1899329
Shafeeque M., George G., Akash S., Smitha B. R., and Shah P. (2021b). Interannual variability of chlorophyll-a and impact of extreme climatic events in the South Eastern Arabian Sea. Reg. Stud. Mar. Sci. 48, 101986. doi: 10.1016/j.rsma.2021.101986
Shafeeque M., Sathyendranath S., George G., Balchand A. N., and Platt T. (2017). Comparison of seasonal cycles of phytoplankton chlorophyll, aerosols, winds and sea-surface temperature off Somalia. Front. Mar. Sci. 4, 386. doi: 10.3389/fmars.2017.00386
Shah P., Sajeev R., Thara K. J., George G., Shafeeque M., Akash S., et al. (2019). A holistic approach to upwelling and downwelling along the south-west coast of India. Mar. Geod. 42, 64–84. doi: 10.1080/01490419.2018.1553805
Shaltout M. and Eladawy A. (2024). Unveiling marine heatwave dynamics in the Persian/Arabian Gulf and the Gulf of Oman: A spatio-temporal analysis and future projections. Deep Sea Res. Part II Top. Stud. Oceanogr. 218, 105435. doi: 10.1016/j.dsr2.2024.105435
Sheppard C., Al-Husiani M., Al-Jamali F., Al-Yamani F., Baldwin R., Bishop J., et al. (2010). The Gulf: a young sea in decline. Mar. pollut. Bull. 60, 13–38. doi: 10.1016/j.marpolbul.2009.10.017
Thoppil P. G. and Hogan P. J. (2010a). A modeling study of circulation and eddies in the Persian Gulf. J. Phys. Oceanogr. 40, 2122–2134. doi: 10.1175/2010JPO4227.1
Thoppil P. G. and Hogan P. J. (2010b). Persian Gulf response to a wintertime shamal wind event. Deep Sea Res. Part I Oceanogr. Res. Pap. 57, 946–955. doi: 10.1016/j.dsr.2010.03.002
Vega M., Pardo R., Barrado E., and Debán L. (1998). Assessment of seasonal and polluting effects on the quality of river water by exploratory data analysis. Water Res. 32, 3581–3592. doi: 10.1016/S0043-1354(98)00138-9
Vinaya Kumari P., Jayappa K. S., Thomas S., and Gupta A. (2021). Decadal variations of sea surface temperature in the eastern Arabian Sea and its impacts on the net primary productivity. Spat. Inf. Res. 29, 137–148. doi: 10.1007/s41324-020-00340-y
Wabnitz C. C. C., Lam V. W. Y., Reygondeau G., Teh L. C. L., Al-Abdulrazzak D., Khalfallah M., et al. (2018). Climate change impacts on marine biodiversity, fisheries and society in the Arabian Gulf. PloS One 13, e0194537. doi: 10.1371/journal.pone.0194537
Westberry T. K., Silsbe G. M., and Behrenfeld M. J. (2023). Gross and net primary production in the global ocean: An ocean color remote sensing perspective. Earth-Science Rev. 237, 104322. doi: 10.1016/j.earscirev.2023.104322
Wiggert J. D., Hood R. R., Banse K., and Kindle J. C. (2005). Monsoon-driven biogeochemical processes in the Arabian Sea. Prog. Oceanogr. 65, 176–213. doi: 10.1016/j.pocean.2005.03.008
Yang M., Khan F. A., Fang H., Maúre E., de R., Ishizaka J., et al. (2024). Two-decade variability and trend of chlorophyll-a in the Arabian Sea and Persian Gulf based on reconstructed satellite data. Front. Mar. Sci. 11, 1520775. doi: 10.3389/fmars.2024.1520775
Keywords: climatology, OC-CCI, long-term trend, primary productivity, remote sensing, marine ecosystem, multivariate analysis, SST
Citation: Shafeeque M, Saleem AA, Chaitanya AVS, Abdulla CP, Lateef S and Albert J (2025) Chlorophyll-a modulation in the Arabian Gulf using two decades of merged ocean-color data. Front. Mar. Sci. 12:1619821. doi: 10.3389/fmars.2025.1619821
Received: 28 April 2025; Accepted: 06 November 2025; Revised: 01 October 2025;
Published: 01 December 2025.
Edited by:
Johannes Karstensen, Helmholtz Association of German Research Centres (HZ), GermanyReviewed by:
Maryam Alshehhi, Khalifa University, United Arab EmiratesBayoumy Mohamed, University of Liège, Belgium
Copyright © 2025 Shafeeque, Saleem, Chaitanya, Abdulla, Lateef and Albert. This is an open-access article distributed under the terms of the Creative Commons Attribution License (CC BY). The use, distribution or reproduction in other forums is permitted, provided the original author(s) and the copyright owner(s) are credited and that the original publication in this journal is cited, in accordance with accepted academic practice. No use, distribution or reproduction is permitted which does not comply with these terms.
*Correspondence: Jiya Albert, aml5YS5iZXJ0QGtmdXBtLmVkdS5zYQ==
†ORCID: Muhammad Shafeeque, orcid.org/0000-0002-9280-3585