 Robert Mars
 Bennet Krebs1
 Oliver Zielinski
- 1Departmend Marine Observations, Leibniz Institute for Baltic Sea Research (LG), Warnemünde, Germany
- 2Department Operations and Service, Sea-Bird Scientific, Bellevue, WA, United States
Biofouling, the unwanted accumulation of marine organisms on submerged structures, significantly compromises the quality of scientific data acquisition. A promising approach to mitigate biofouling on marine sensors is the use of UVC-based antifouling systems. However, existing systems often suffer from low efficiency, leading to high power consumption. This study presents a highly energy-efficient UVC-based antifouling system with a twentyfold increase in energy efficiency compared to previous commercial designs. The system was tested on moored CTDs and fluorometers in the southern Baltic Sea at a depth of 2 meters. Conductivity readings remained within the manufacturer’s specifications for 237 days, demonstrating the effectiveness of the approach in maintaining sensor performance. Based on in-situ measurements in coastal southern Baltic Sea water this study presents a formula to estimate UVC intensity in distances up to 50 cm in order to optimize the settings of UVC-based antifouling systems.
1 Introduction
1.1 Motivation
Monitoring physical, biological and chemical parameters (such as conductivity, temperature, pressure, oxygen, chlorophyll a, turbidity) is an important part in understanding marine ecosystems and changes within them. Results are often compared to measurements of previous years and effect international policies (HELCOM, 2023). In this sense the sampling of the parameters needs to be of high quality with a margin of error (Bailey, 2019) over a certain time scale to be useful for scientific utilization. Sensors are therefore calibrated, and the measured values are validated in several steps (Hartman et al., 2023).
As stated in current research (Bailey, 2019; Hassoun et al., 2024) there is a big need to enhance sampling in the uppermost 10 m of the water column of the coastal oceans. A common approach to acquire time series in the oceans at one specific location is the use of instrumented moorings. These are deployed with sensors at specific depths and measure at certain intervals.
All artificial structures deployed in the marine environment over time will be affected by biofouling as unwanted growth of marine organisms. The growth progresses in four steps: (1) creation of a conditioning film with basic organic compounds, (2) biofilm formation with bacterial species, (3) micro-fouling settlement and (4) macro-fouling with marine invertebrates (Vuong et al., 2023). Biofouling is not only extremely harmful in economics and environment terms (Pagoropoulos et al., 2018) but also in terms of scientific data acquisition. Especially conductivity sensors and optical instruments (e.g. sensors for oxygen, chlorophyll a and turbidity) are vulnerable to biofouling. Macro-fouling of barnacles, algae or mussels lead to changes in the geometry of the conductivity cell and therefore to biased readings. The organic matter growing within the sampling volume of optical sensors increases the error in measurements, since they are not measuring the surrounding water anymore or induce false readings through their own optical properties.
Common practices to prevent biofouling are based on biocides such as Tributyltin (TBT) and heavy metals. However, their use has major drawbacks on the environment and marine life (Delgado et al., 2021). With more data being collected in biologically active coastal areas in the upcoming years it is important to develop low-pollution, energy-efficient, and minimally invasive antifouling technologies to ensure sustainable ocean observing practices.
1.2 Ultraviolet light
The approach of utilizing ultraviolet(UV) radiation in water treatment and the disinfection of surfaces has found its way into in engineered systems since the 1980s (Qualls and Johnson, 1985). In recent systems UV-LEDs supersede formerly used mercury-based lamps (Bueley et al., 2014; Salters and Piola, 2017; Torkzadeh and Cates, 2021). UV light is sub-ranged into UVA (380–315 nm), UVB(315–280 nm) and UVC(280–100 nm). The wavelengths of UV radiation used within these applications belong to the UVC sub-range. UVC includes the absorption peak of DNA around 260–265 nm and leads to mutations or cell death of microorganisms (Kowalski, 2009). UVC can therefore be applied to inactivate unicellular organisms that create the biofilm, which is the base for subsequent micro and macro-fouling (Vuong et al., 2023). By this the physical, chemical and possibly poisonous cleaning of subsurface structures can be prevented or at least delayed.
Reducing macro algal concentration in water needs high doses of UVC, a 15 W UVC lamp reduced algal concentration to a level of 2.5% after 8 hours of illumination (Chen and Bridgeman, 2017). However bacteria that forms biofilms need significantly less radiation to be deactivated, for example 15 mJ/cm² is reported as maximum needed for Escherichia coli (Hijnen et al., 2006).
For UVC to prevent biofouling the irradiance must be sufficient to prevent the creation of a biofilm. This means the energy emitted onto a certain area within a certain duration must be high enough to inactivate all microorganisms. An irradiance of 0.001 W/m² (0.1 µW/cm²) at 278 nm wavelength was found to keep an area free of fouling in a free-flowing environment (Salters and Piola, 2017). Laboratory experiments with surfaces under a continuous irradiance of 102 µW/cm² at a wavelength of 254 nm show that after 288 hours about 3 µm of biofilm existed compared to the 28 µm of the control surface (Torkzadeh and Cates, 2021). Another 10-month trial has shown the ability to protect a conductivity and a turbidity sensor in with 48 µW/cm² and 93 µW/cm² respectively at 50% duty cycle (activity fraction) (Bueley et al., 2014). In Northeast Pacific and Northwest Atlantic duty cycles down to 5% show to be effective (MacKenzie et al., 2019). Current research in the Baltic Sea proposed 10% duty cycle for useful results in combination with optical windows (Hoeher et al., 2023). UV-LEDs with a peak-wavelength of 280 nm effectively protected the sensors, enabling to measure similar values as sensors with conventional protection. Some open ends exist in this encouraging field study, that should be addressed. E.g (Bueley et al., 2014). used values for absorption and scattering that have an error greater than 25% below 300 nm wavelength to model the fluence (i.e. radiant energy per area) of UVC radiation in water (Smith and Baker, 1981). In addition, the fluence was only validated in air, not in natural sea water.
Herein we present a novel focusing design of a UVC-based antifouling solution, enabling long-term high-quality data to be measured, extend cleaning intervals and minimize the need for data correction. This is field proven with data from a Seabird-Electronics SBE-37 Microcat CTD and a Wetlabs FLNTU fluorometer being deployed with UVC protection in the Baltic Sea. Furthermore, we present the calculation of the in-situ attenuation coefficients of Baltic Sea water for 275 nm UVC light based on measurements thus providing irradiance estimates under real conditions.
Even though UVC radiation cannot fully prevent biofouling it can be applied to limit the effect on instrumentation to acquire long-term high-quality data over the time of the deployment. Since UVC LEDs are energy demanding and moored stations have limited energy storage, it is essential to find a good balance between delivering sufficient UVC irradiance to inhibit biofouling and minimizing energy consumption. In addition, the season (temperature, nutrients, sun state), the depth, and the wavelength needs to be taken into considerations. We will discuss these aspects thriving to provide practical guidelines for best practices for a wide range of marine environments.
2 Materials and equipment
2.1 Location of instruments
The Leibniz-Institute for Baltic Sea Research Warnemünde (IOW) operates a network of three offshore platforms to sample the hydrography and meteorology of the German Baltic Sea: Darss Sill (54° 42.0’ N, 012° 42.0’ E, 21 m water depth), Arkona Basin (54° 53.0’ N, 013° 52.0’ E, 45 m water depth) and Oderbank (54° 4.6’ N, 014° 09.6’ E, 15 m water depth) (Krüger, 2000). These stations have a 24 V battery system for electrical energy that is being recharged by wind power generators and solar panels. This makes it especially important in wintertime to save as much electrical energy as possible. The mean power draw for all devices installed is about 25 W including sampling devices, industrial PC and data telemetry by mobile and satellite. Parameters sampled for hydrography are temperature, conductivity, pressure, oxygen, chlorophyll a, turbidity, current and waves. Meteorologic parameters sampled are air temperature, air pressure, humidity, global radiation, wind speed and wind direction. With the exception of 4.3 the experiments in this study were located at the station Arkona Basin. The dynamics and mixing in the Arkona Basin has been investigated intensively (Lass and Mohrholz, 2003; Burchard et al., 2005).
In order to evaluate antifouling technologies a region with high productivity is needed. Former nutrient input to the Baltic Sea, having its maximum in the 1980s, increased the net ecosystem production by a factor of 2.5 compared to the 1920s – 1930s (Schneider et al., 2015). The growth behavior of biomass in the coastal western Baltic Sea area changes with huge interannual variability in taxa and abundance and a trend towards longer growing seasons (Wasmund et al., 2019). Besides that the primary production increased fourfold in the 1997–2006 period compared to 1947–1956 period (Gustafsson et al., 2012). This productivity is expected to remain at that level if there is no further reduction of phosphorus input. In the 2016–2023 period mean temperature in 2 m water depth was 10.68°C, varying between 1.43°C and 23.77°C. Maximum global radiation in that period was 921 W/m² (Figure 1). The high productivity and its availability of long-term operated platforms, therefore makes the Baltic Sea a well-suited environment for evaluating antifouling technologies.
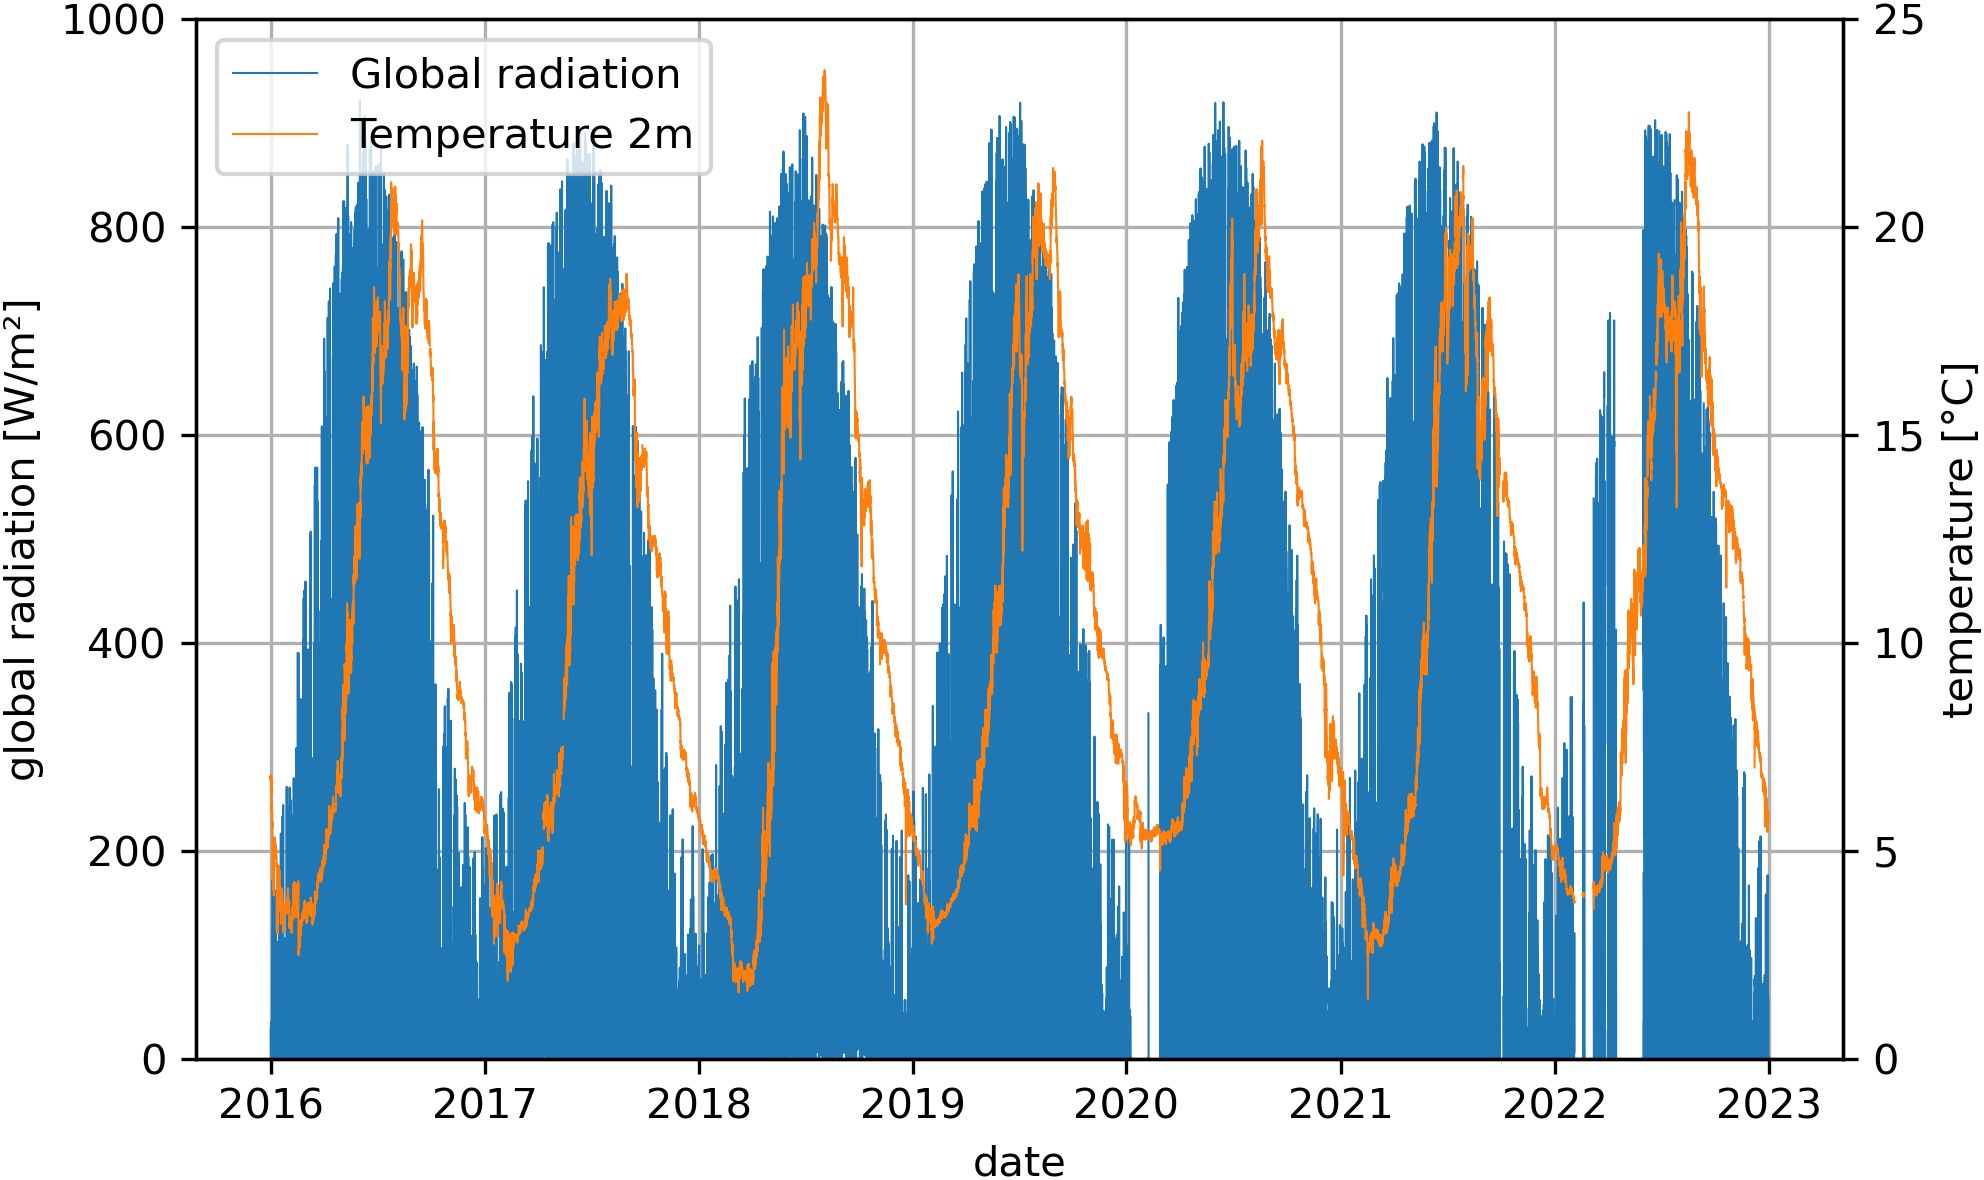
Figure 1. Water temperature in 2m water depth and global radiation measured 10m above sea level at the station Arkona Basin.
2.2 Used instrumentation
Devices used to sample these parameters were Sea-Bird Scientific SBE37-IM, Sea-Bird Scientific SBE37-IMP-ODO, Wetlabs ECO FLNTU and Nortek AWAC (Table 1). SBE37 devices typically use toxic TBT cells to prevent biofouling while ECO FLNTU devices use a mechanical wiper to clear the optical window. Nortek provides antifouling patches for ADCPs. Due to its toxicity TBT was banned internationally to be used in antifouling paints in 2008 (IMO, 2001) which also indicates its massive drawbacks. Barnacles can settle and grow on mechanical wipers like the ones in Wetlabs ECO FLNTU devices. These barnacles will scratch the optical window and data becomes unreliable (Figure 2C). ECO FLNTU fluorometers use wavelengths of 470 nm and 695 nm for chlorophyll excitation and detection. Laboratory tests with a UVC-LED radiating 270 nm light with a spectrum half width of 10 nm showed no influence to the chlorophyll or turbidity sampling. Given that SBE37 and ECO FLNTU instruments lack low-pollution, energy-efficient and minimally invasive antifouling measures these instruments were chosen to develop a suitable antifouling solution.
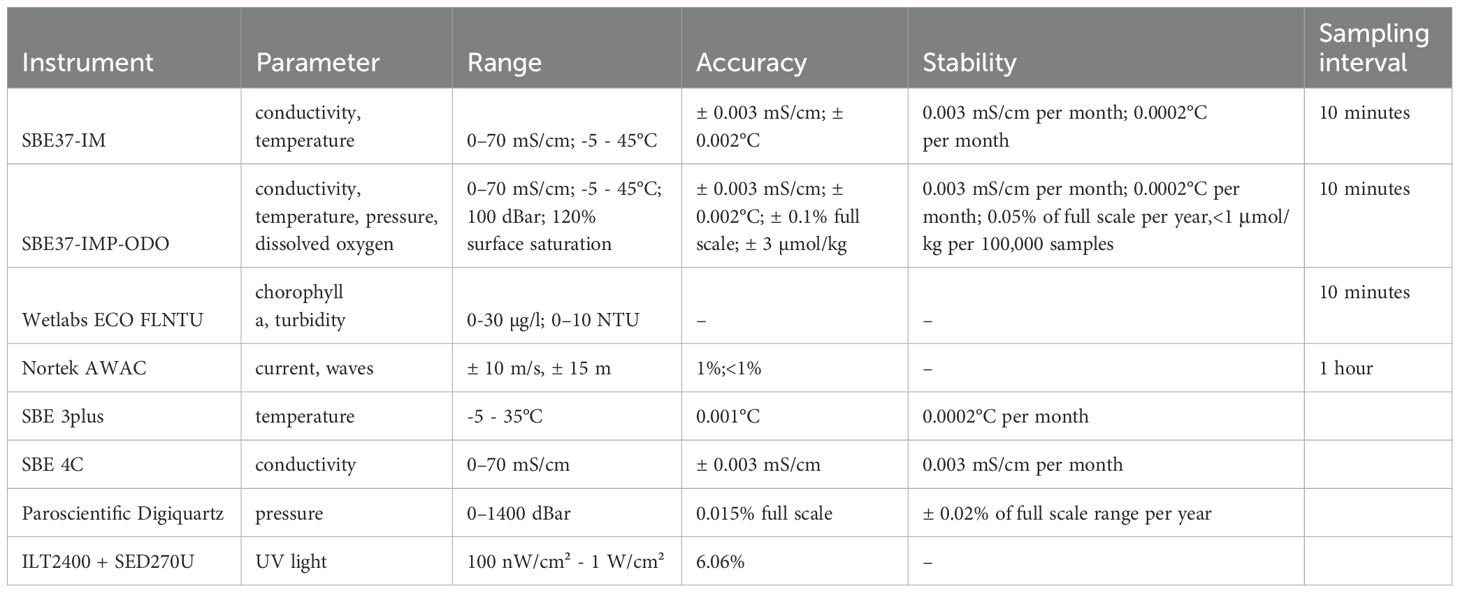
Table 1. Overview of sensor systems used in this work.
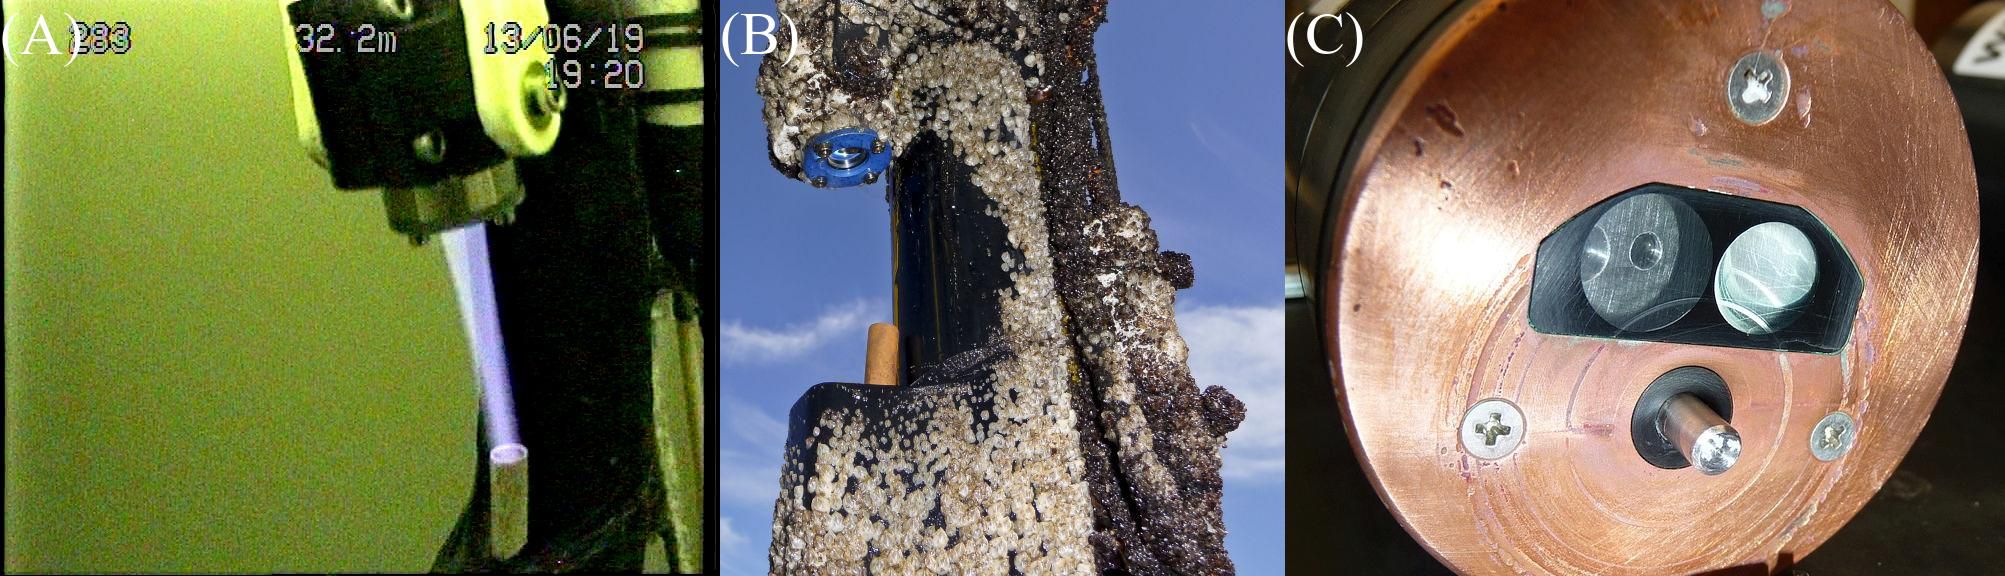
Figure 2. An installation of a SBE37 instrument with UVC emitter mounted. The beam focuses the inlet of conductivity cell with a copper tube. (A) shows the setup at time of installation. The area being kept free of biofouling after 10 weeks in coastal Baltic Sea water is visible in (B) together with barnacles settled on the rest of the instrument. (C) shows the surface of the ECO FLNTU sensor from 2 m depth recovered in April 2017 after cleaning. Note the scratches on the optical window and copper surface resulting from barnacles on the wiper.
Reference measurements were conducted with a Seabird-Electronics SBE 911plus CTD system with double SBE 3plus temperature sensor, double SBE 4C conductivity sensor, Digiquartz pressure sensor and ECO FLNTU. The CTD was operated on RV “Elisabeth Mann Borgese” (length 56.6 m, draught 3.65 m) by a winch with an active heave compensation system, eliminating the looping effect. The reference CTD cast was operated close to the moored instruments (150 m distance) at almost the same time as the programmed sampling. Although care has been taken for high correlation in space and time between the reference measurement and the moored instruments it is impossible to sample the exactly same water due to the distance needed for safe operation. Also sampling at 9 different depths at the same time with a profiling instrument is not possible. The vessel has an additional effect of mixing depending on the directions of current, waves and wind that effects sampling close to the surface. These are error sources that need to be taken into account. A possibility to tackle these errors is to match the samples of the SBE37 with the corresponding temperature value in the SBE911 profile or to compare reference SBE911 profile with SBE37 data one sample (10 minutes) before or after. This could be a way to handle the difficulties with having reference measurements that did not come from the exactly same spot and time.
The sensors are regularly calibrated in the DAkkS accredited IOW calibration lab, guaranteeing an uncertainty of 0.0086 mS/cm in the range from 1.9 mS/cm to 65 mS/cm and 3.5 mK in the range of -2°C to 35°C (DAkkS, 2023).
To measure UVC irradiance we used the ILT2400 Hand-Held Light Meter from International Light Technologies which is accredited according to ISO 17025 together with an SED270U Detector. This underwater detector has a sampling bandwidth of 230–280 nm with a 275 nm peak. The calibration of the UVC detector and the ILT2400 gives the total uncertainty as ±6% of the measured intensity.
3 Methods
3.1 UVC emitter
The main idea of developing the focused UVC emitter (herein called UVC emitter) was to enable month-long use in battery-powered systems while still providing the required irradiance for the antifouling effect. Thus, the power consumption of the emitter needs to be minimized. We achieved this goal by a two-fold approach: Optimizing the electrical components and focusing the UVC radiation to the area where it is needed the most.
The mechanical setup of the UVC emitter is presented in Figure 3A. Almost parallel rays are achieved by a combination of a plano-convex lens being located on top of the UVC-LED (4), a bi-convex lens (9) and another plano-convex lens having contact to water on the plano-side (10). The optical setup is modeled using LambdaSpect FX64 software. Figure 4A shows the optical setup with the result of the ray-tracing model in Figure 4B. Mechanical design files are available as Supplementary Material. Due to its high transmissivity at 275 nm lenses are fabricated out of fused silica. The optical layout was done having a 275 nm LED with a viewing angle of 110° (LEUVA66H70HF00, LG Innotek, 6 V, 350 mA, 100mW radiant flux ). This type of LED has an efficiency of . Efficiency is calculated by
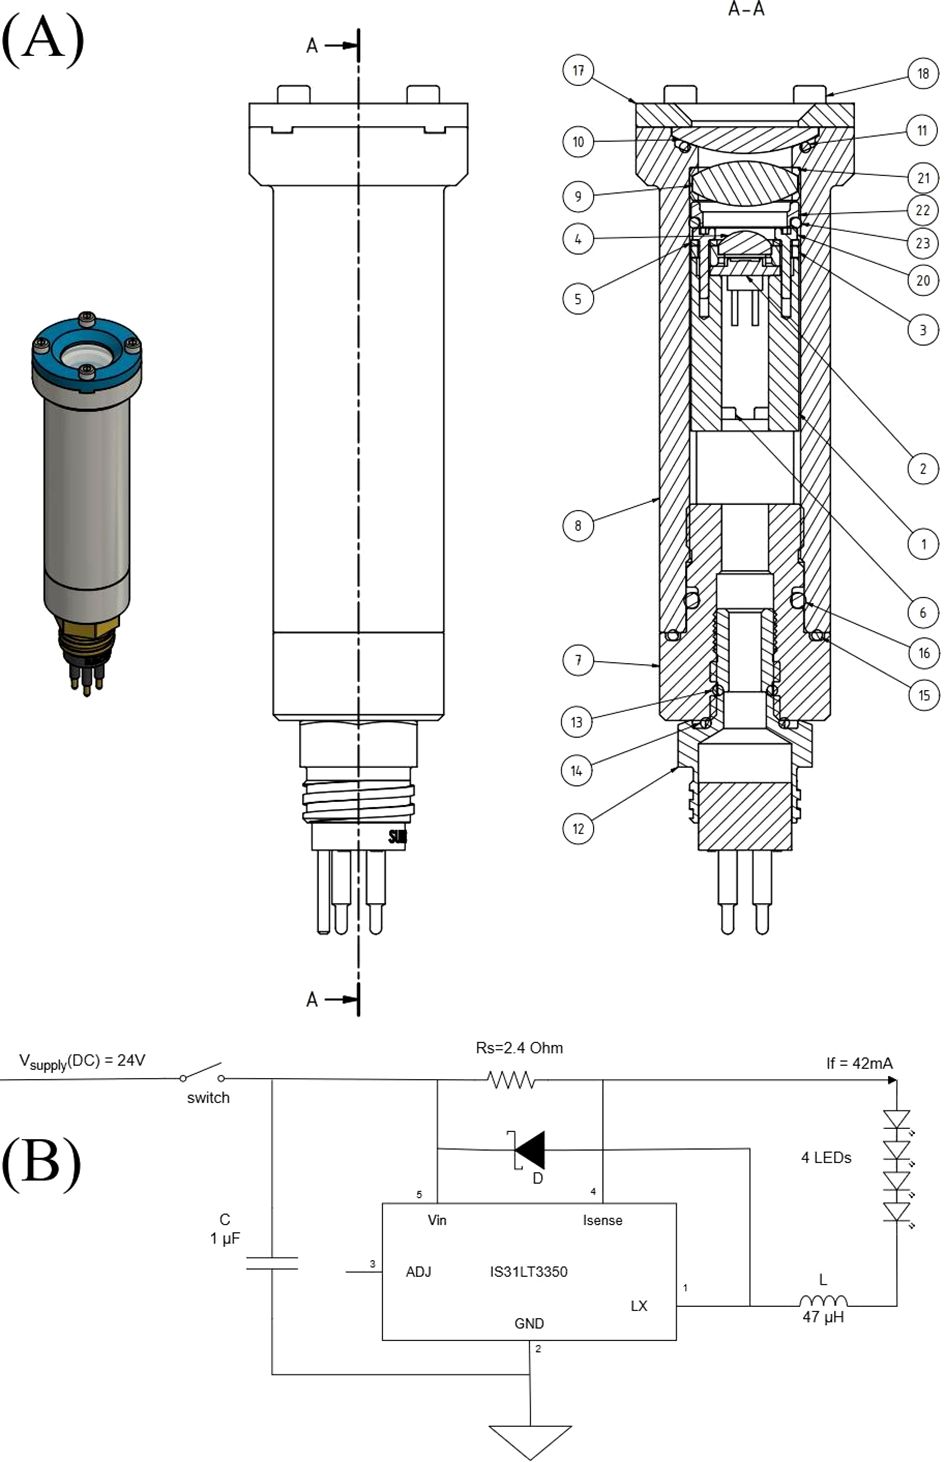
Figure 3. Schematic view of the focused UVC emitter. A LED (2) and three fused silica lenses (4, 9, 10) are mounted in a titanium housing with a wet pluggable connector (A). The schematic diagram of the electronic assembly is shown in (B).
LED and lenses are housed in a titanium housing with a wet-pluggable connector.
Continuous mode buck converters that transform a high DC voltage to a lower DC voltage are known to be very energy efficient as LED drivers. Buck converters need to have at least an inductor and a capacitor as external elements as energy storage and are able to reach an energy efficiency greater than 90% (Ferdous et al., 2024).
To reduce voltage difference between supply input and LED output, we arranged 4 LEDs in a series connection and chose the operating point so that the forward voltage is close to 24 V. An external resistor of 2.4 Ω is used to set the current of the buck converter (IS31LT3350, Lumissil Microsystems) to 42 mA. Since the LED has a linear characteristic of forward current to radiant flux, 42 mA results in 12 mW. The schematic diagram of the electronic assembly is presented in Figure 3B. A duty cycle of 50% was selected, consisting of 7.5 minute “on” and “off” periods which is consistent with a former studies (Bueley et al., 2014).
The efficiency of four LEDs in series in the chosen operating point is
According to the UVC emitter presented in (Bueley et al., 2014) (AML cabled UV, 12 V, 120 mA, 3 mW radiant flux) efficiency of the here presented system is 20 times larger, the same radiant flux can be emitted using only 5% of the electrical energy. The IOW remotely operated vehicle was able to take a picture of the focused beam of the UVC emitter (Figure 2A). The antifouling effect of the emitter being installed on a SBE37 after 10 weeks in coastal Baltic Sea water is clearly visible with areas being kept free of biofouling (Figure 2B).
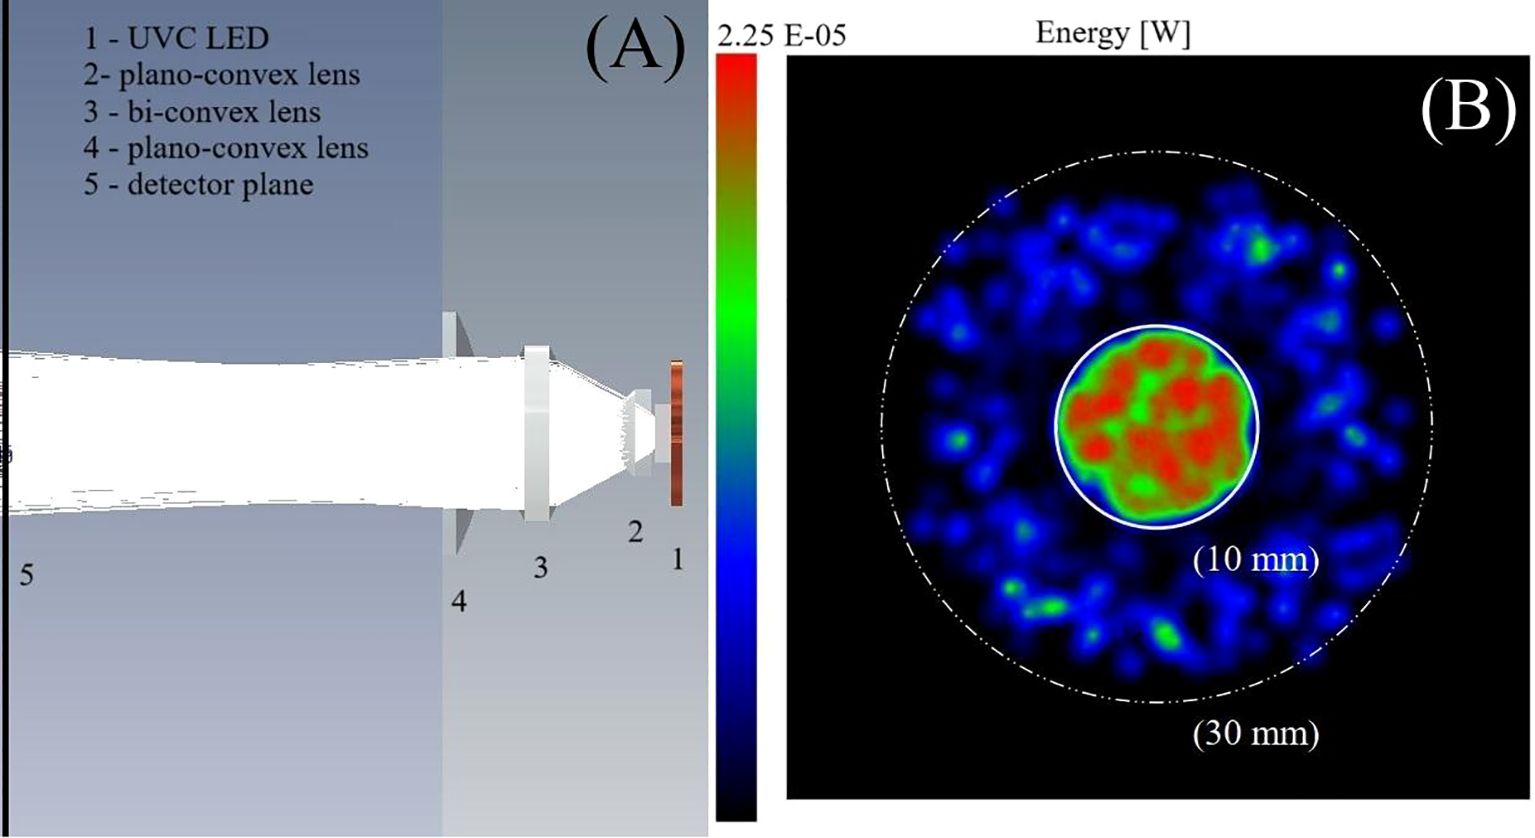
Figure 4. The optical setup with UVC LED on the right, lenses in the middle and detector on the left-hand side and modeled rays is presented in (A). The distribution of rays on the detector plane in a distance of 100 mm from the LED is shown in (B). Note the focus of rays in the inner 10 mm circle and only scarce appearance of rays outside that inner circle.
3.2 Setup for testing irradiation with lens-free UVC emitter
For these measurements a simplified, lens-free UVC-LED housing, herein called lens-free emitter, was used. The LED (Bolb SMD3535) was sealed in by an UVC grade fused silica window (EKSMA optics 210-1203E), with 95% UVC transmissivity. Without any focusing optics this UVC-LED features a near-isotropic intensity distribution within a 120°forward cone, which for our purposes can be approximated as a point source.
As all radiation traveling though seawater, UVC is subject to attenuation by absorption and scattering by both the medium, i.e. water, and particles suspended within it. While UVC does suffer stronger absorption in water than visible light, it does still penetrate quite deep compared to other parts of the electromagnetic spectrum (Su and Yeh, 1996; Wozniak and Dera, 2007). For pure water a measured absorption coefficient of around for 270 nm radiation has been reported (Mason et al., 2016).
The influence of scattering on particles depends strongly on the size, density and composition of the particles itself (Cantwell and Hofmann, 2011). For our purposes the exponential attenuation law (Equation 1) (derived from the Beer-Lambert law) describes the resulting radiation intensity by these combined processes aptly. Additionally, the intensity of radiation from a point source will be reduces with distance in accordance with the inverse-square law (Equation 2). Combining Equations 1, 2 results in Equation 3.
with intensity I [W/cm²], initial intensity [W/cm²], attenuation coefficient µ [m-¹], distance d [m]
Equation 3 should give us a good approximation for the resulting Intensity I and thus irradiance for a target area at the distance d, given the attenuation coefficient µ for the seawater and the initial Intensity for an arbitrary distance defined by .
Conversely one can find the attenuation coefficient µ for a given seawater with a measurement series as done in 4.3.
Once the attenuation coefficient µ for a specific water is known, Equation 3 can be rearranged to Equation 4.
Given the attenuation coefficient µ, the required UVC irradiance on a target necessary to prevent bio-fouling and the distance between the LED and the target d one can calculate the needed initial intensity at the UVC LED . However, this only describes the “worst case” situation, namely an isotropic, unfocused radiation source. One can decrease the necessary irradiance by using optics to focus the radiation to a smaller area (as seen in Figures 2A, 4) at the cost of irradiated area.
A cage was used to mount the detector, lens-free emitter and battery pack (Figure 5). The detector was connected to the ILT2400 Hand-Held Light Meter with a 25m cable. The cage was mounted to the shipboard SBE 911plus CTD and was lowered to the desired depth. After each sampling the position of the detector was adjusted, according to the marker tapes. The distance between topside of the detector and window of the lens-free emitter was used for calculation of the transmittance. The distance measurements were done with a ruler. An error of ±0.3 cm is assumed. Each sample point was integrated over 1–2 minutes. An ECO FLNTU sensor connected to the CTD measured the turbidity in parallel.
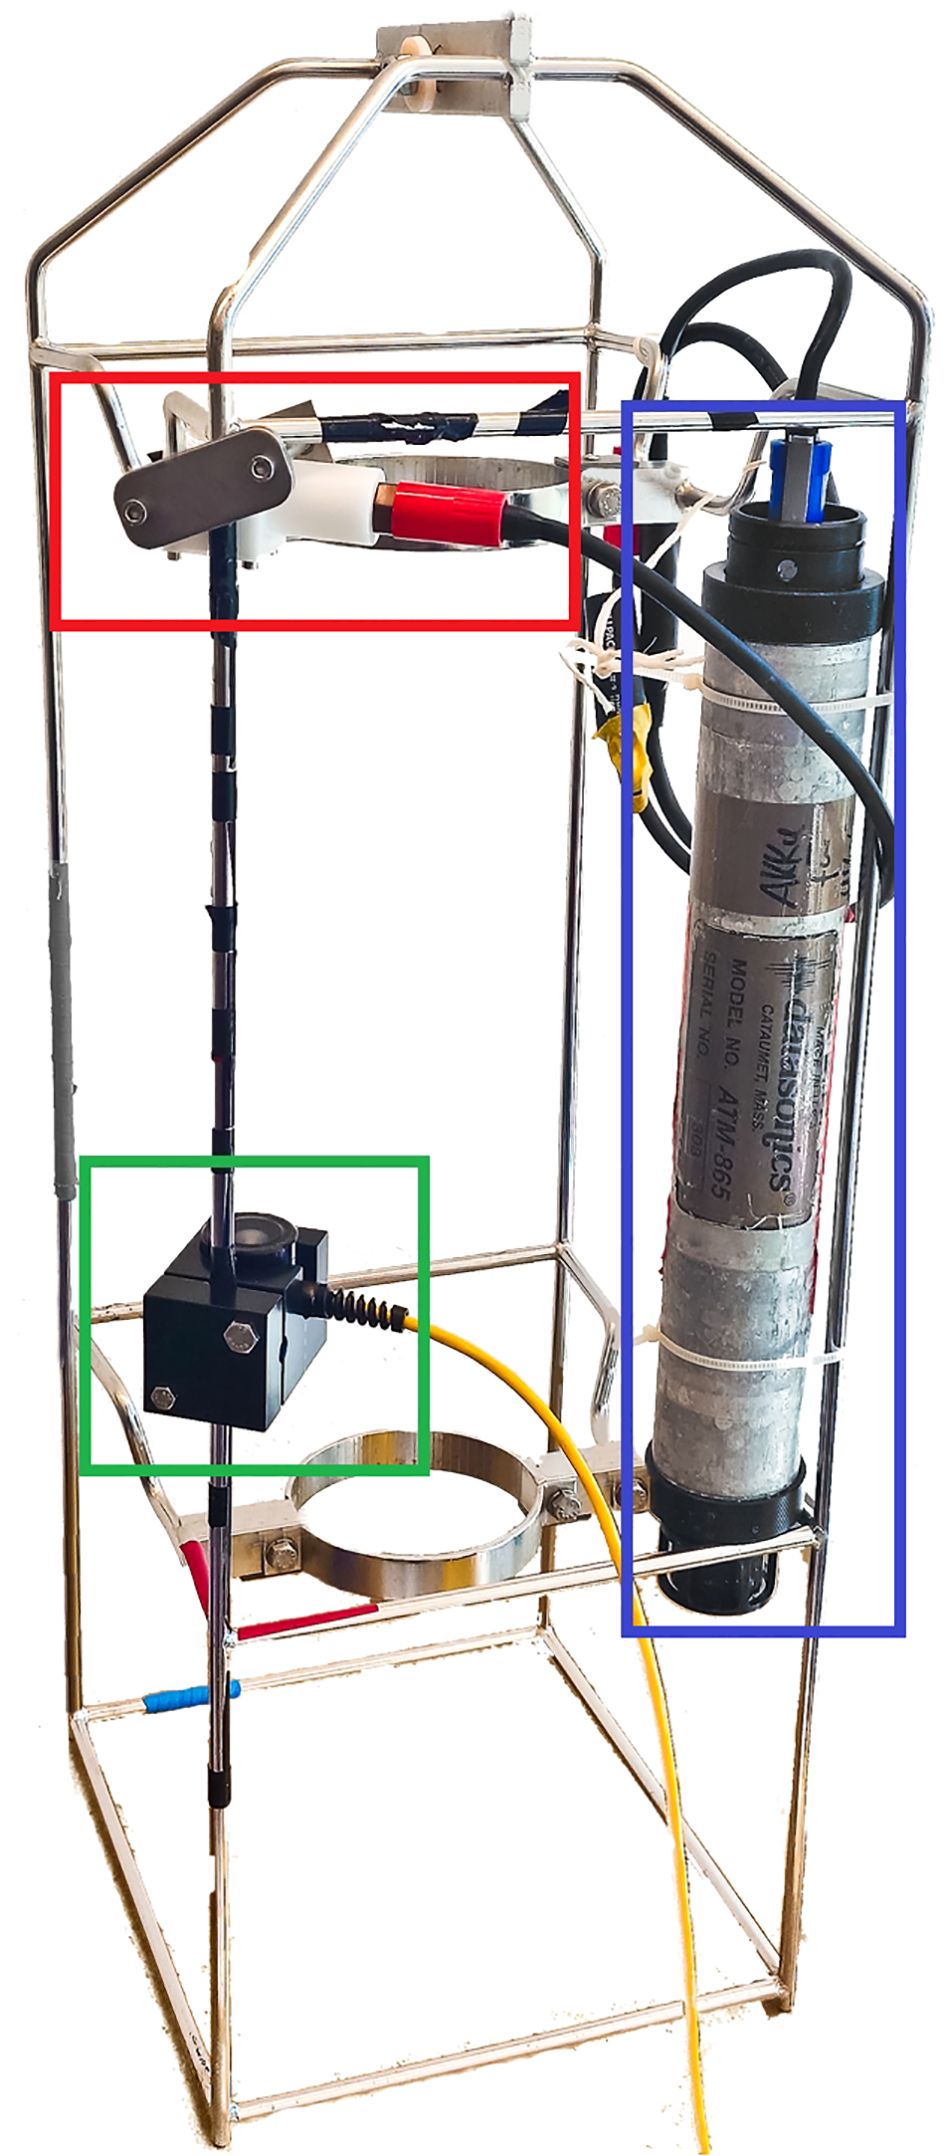
Figure 5. The cage houses the lens-free UVC emitter (red box), detector (green box) and battery pack with on/off switch (blue box). For testing purposes, the cage is mounted on the CTD rosette.
4 Results
4.1 Conductivity
The first set of conductivity data from 155 days in coastal Baltic Sea water in 2018 serves as an example of standard deployments (Figure 6). The SBE37 was moored at 2m water depth with a used TBT-cell and copper tubes but without UVC emitter. Two reference measurements from the first day of deployment were within the accuracy specification of the instrument. The other two measurements from the first day had greater differences. There was no corresponding water mass with the same temperature in the reference profile. Additionally, a match between the SBE911 profile and SBE37 data one sample (10 minutes) before or after was checked. The comparison with a sample 10 minutes later or earlier significantly reduced the difference, but they were still out of specification. The average deviation on day 32 was twice the sum of accuracy and stability over that time (-0.0129 mS/cm vs. ± 0.006 mS/cm) and became even 89-fold at day 96/98 (-1.0699 mS/cm vs. ± 0.012 mS/cm). The deviation stayed almost constant for the next two months (-1.0699 mS/cm vs -0.9998 mS/cm) and the root mean square error (RMSE) between SBE37 samples and reference SBE911 at day 155 was 0.9998 mS/cm (Table 2).
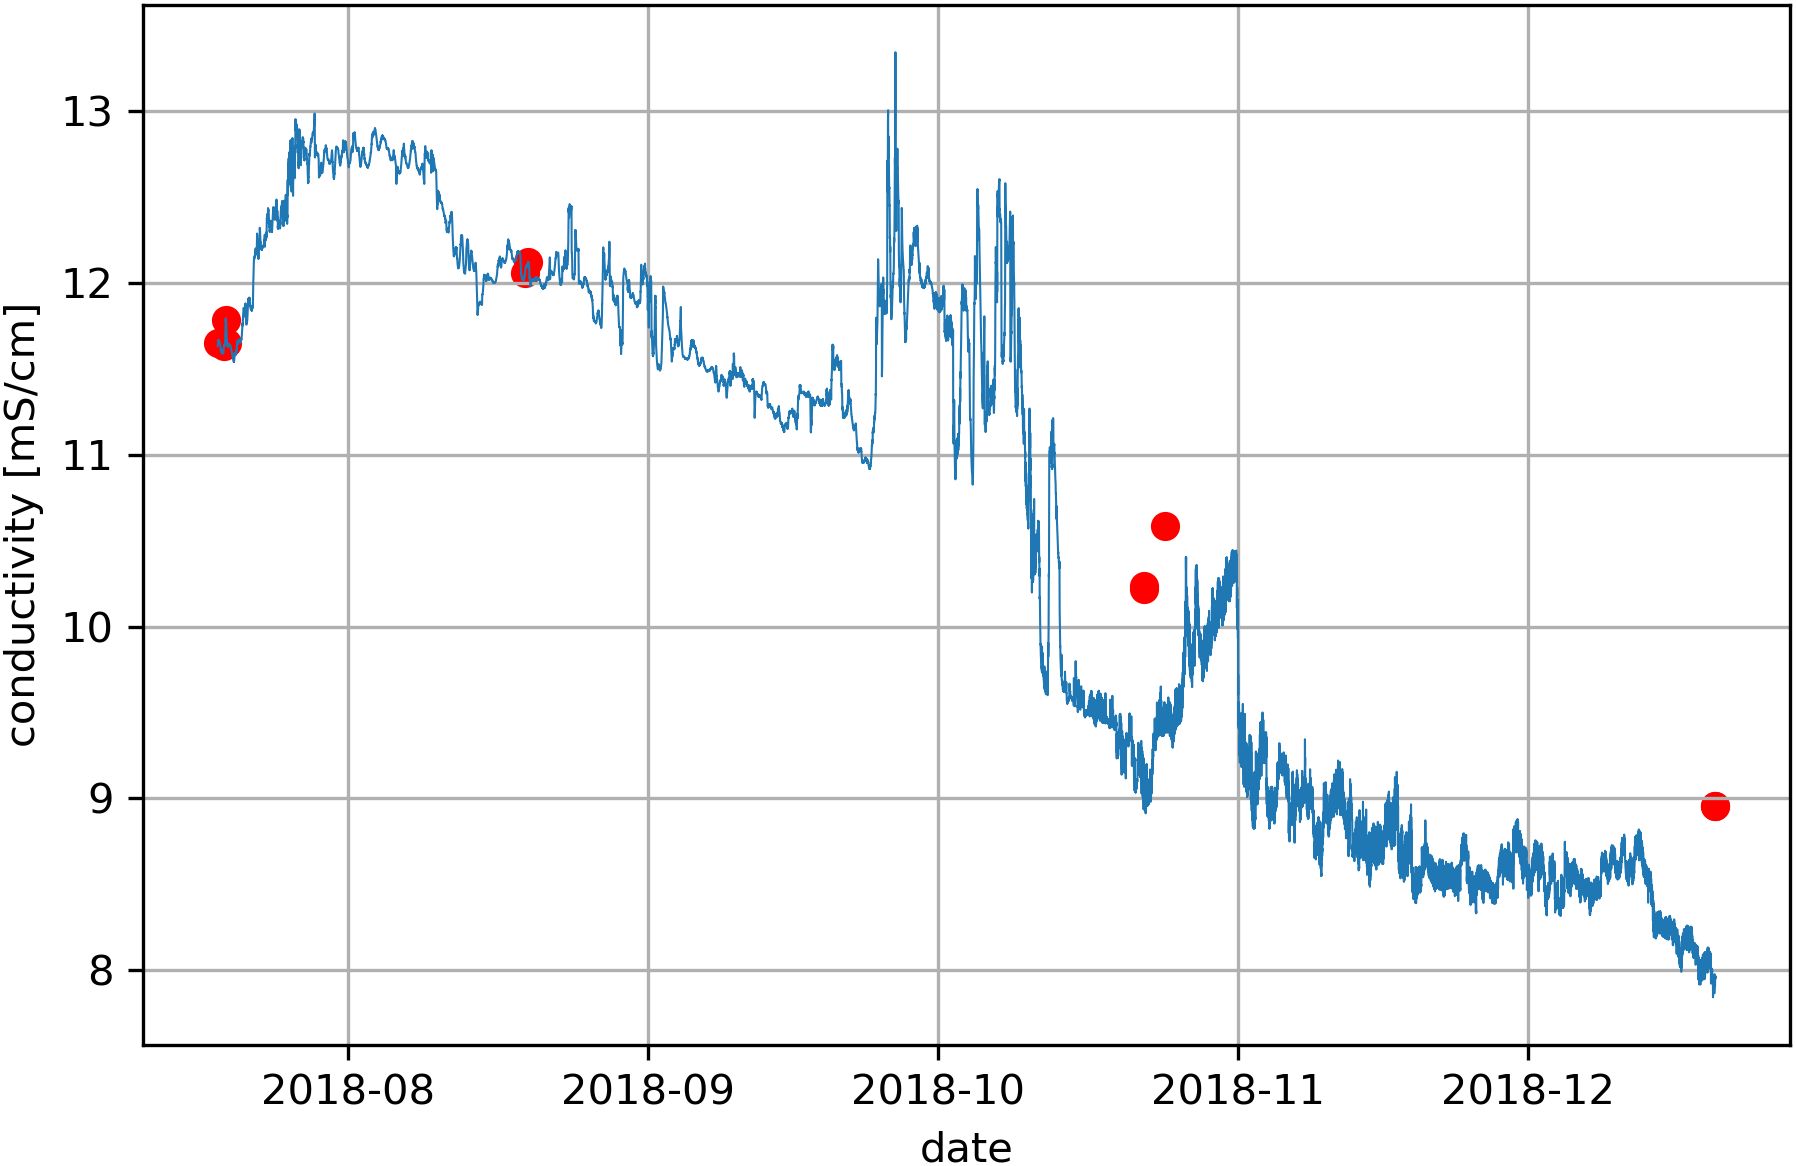
Figure 6. Conductivity data from a standard SBE37 deployment in 2m water depth in coastal Baltic Sea water. Red marker points represent reference measurements with the shipboard SBE 911plus.
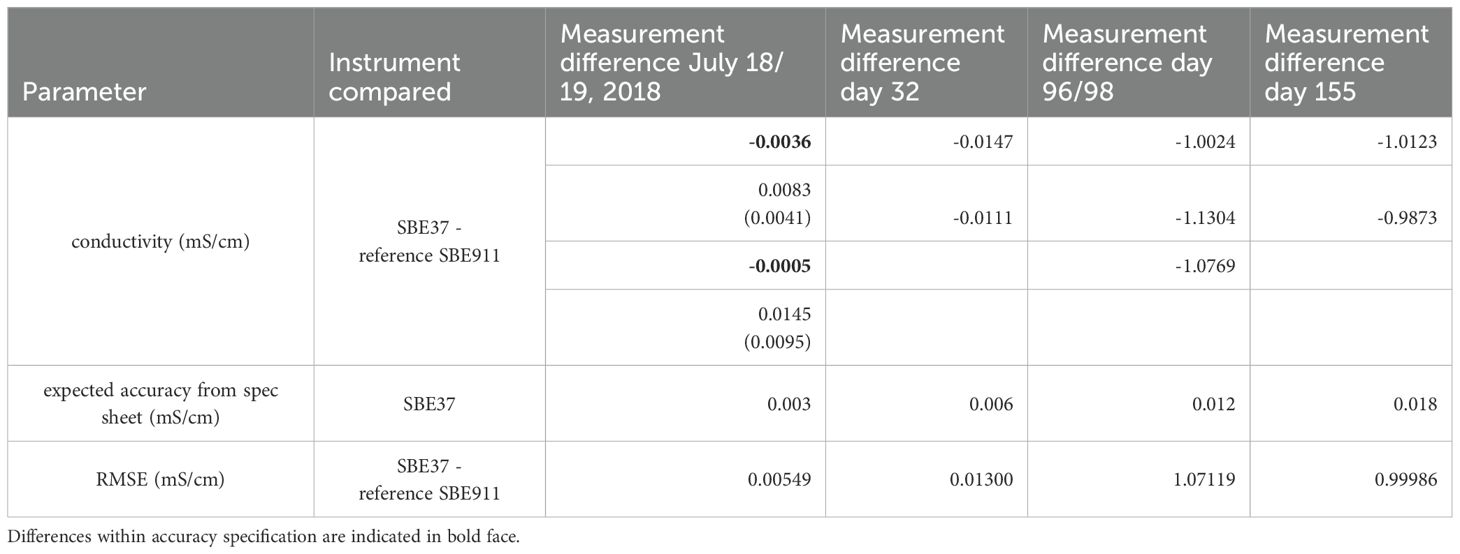
Table 2. Measurement difference of the standard SBE37 deployment compared to shipboard SBE911 (Figure 6).
A modified SBE37 deployment sampled conductivity data from 237 days in coastal Baltic Sea water in 2021 (Figure 7). The SBE37 was moored at 2m water depth with the presented UVC emitter and without TBT-cell. Two reference measurements from the first day of deployment were within the accuracy specification of the instrument (Table 3). In the case of greater differences between sample and reference measurements corresponding water masses having the same temperature in the reference profile were identified. Additionally, a match between the SBE911 profile and SBE37 data one sample (10 minutes) before or after was checked.
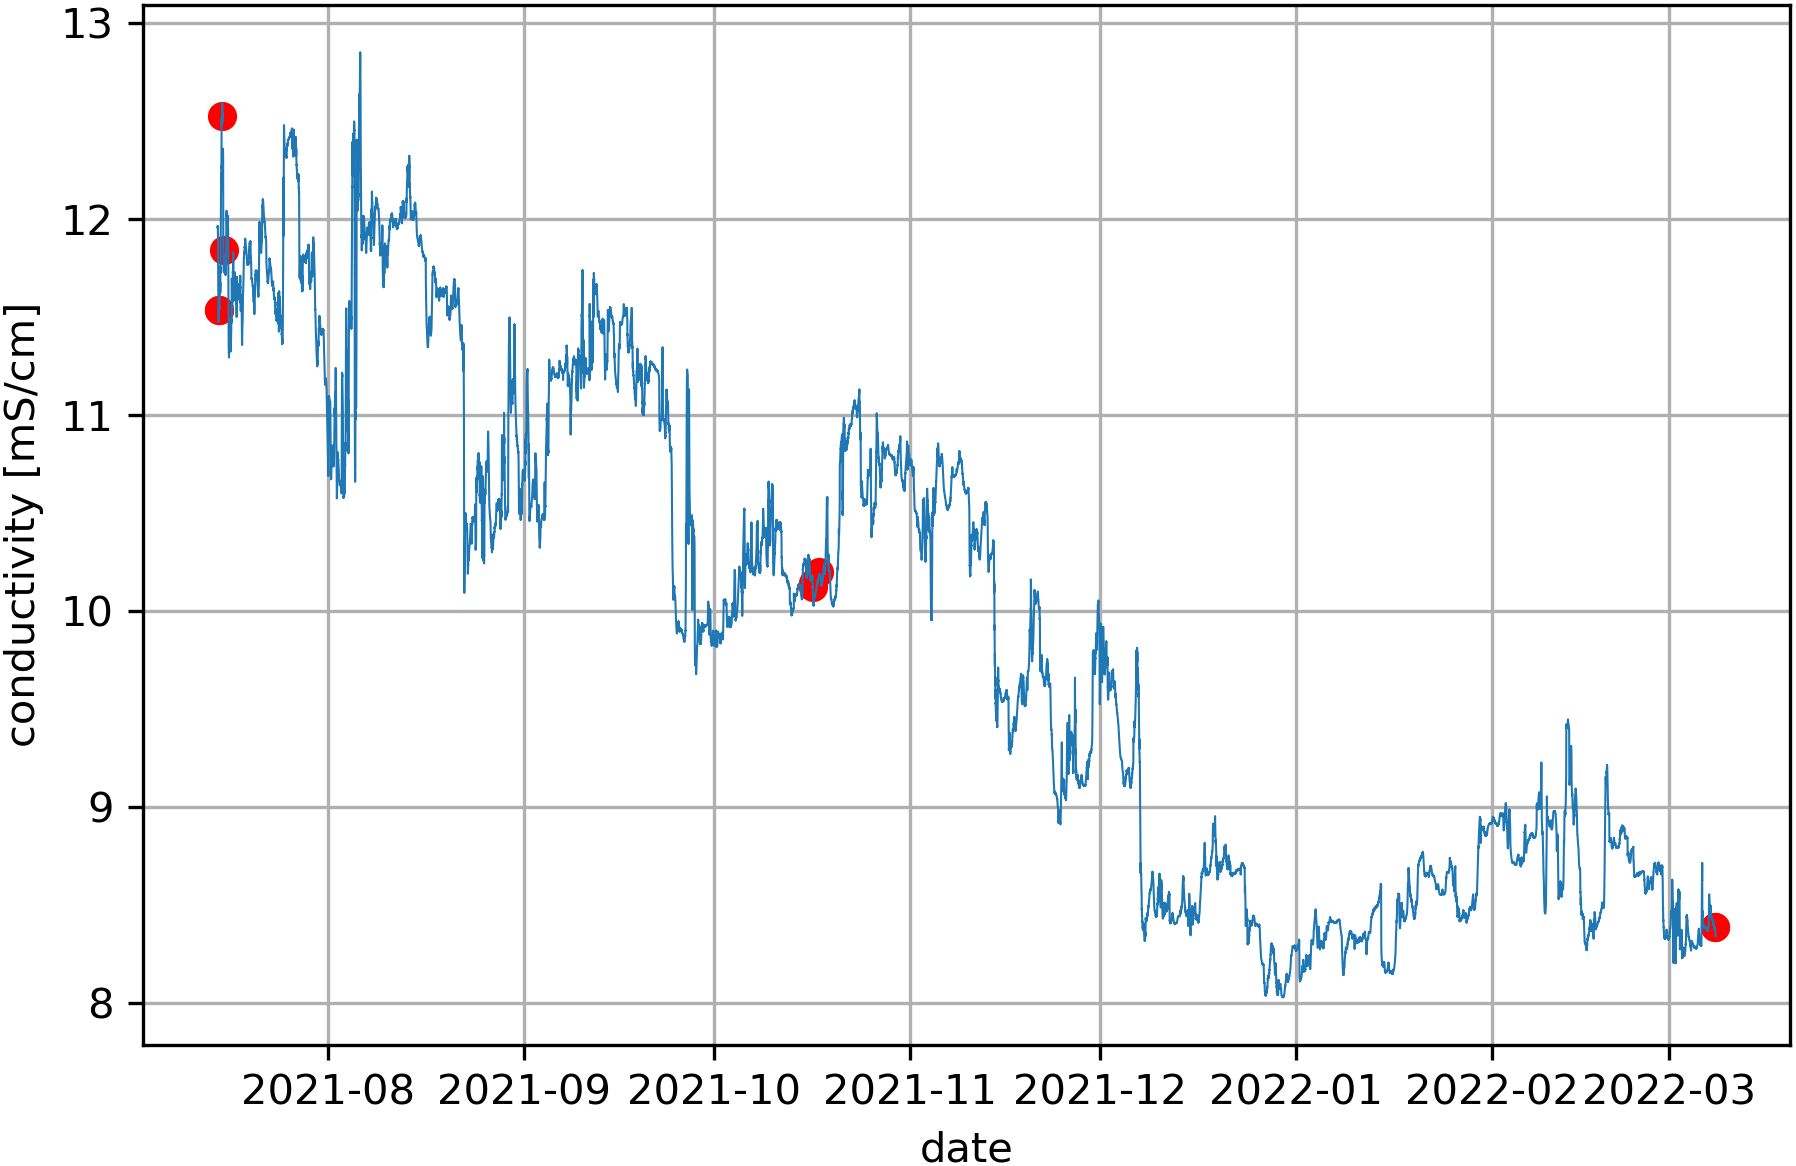
Figure 7. Conductivity data from a modified SBE37 deployment in 2m water depth in coastal Baltic Sea water including the UVC emitter. Red marker points represent reference measurements with the shipboard SBE 911plus.
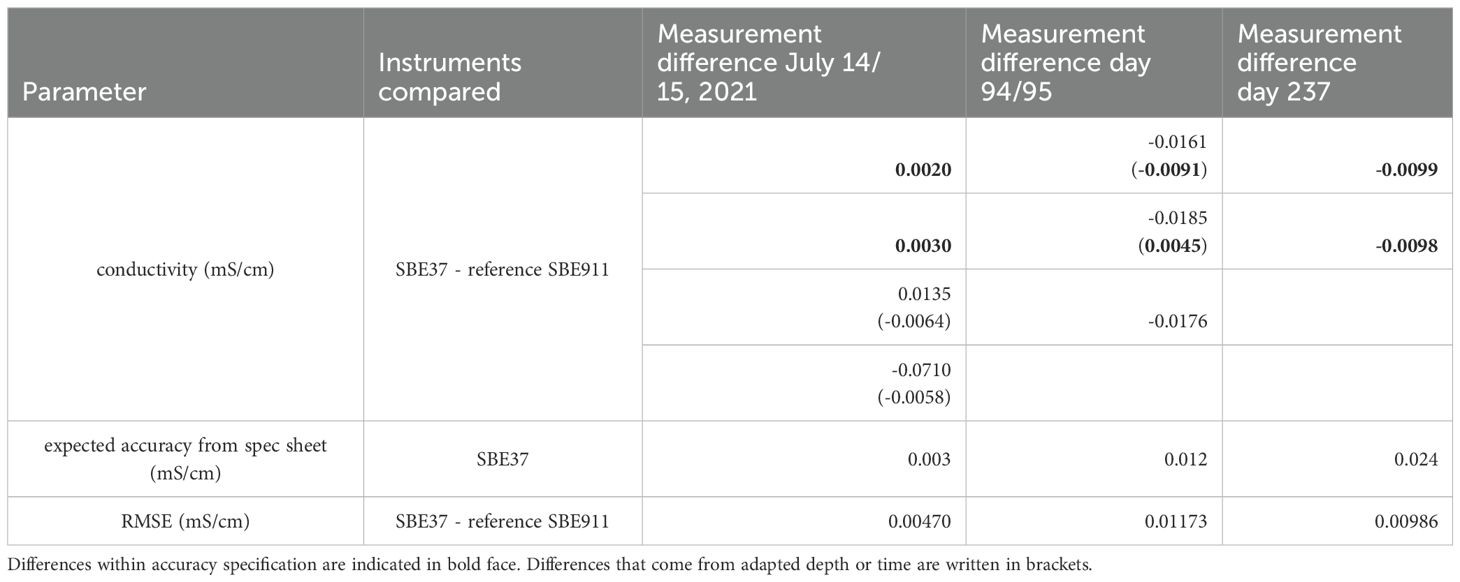
Table 3. Measurement difference of the modified SBE37 deployment compared to shipboard SBE911 (Figure 7).
In case of third reference measurement at day 1 the sample cannot be matched to a point in the profile having the same temperature. The maximum temperature measured by SBE37 in 2m depth is 0.03°C greater than maximum temperature of the corresponding SBE911 profile. The comparison of the SBE911 profile with data sampled 10 minutes later at the station reduced the conductivity deviation from 0.0135 mS/cm to -0.0064 mS/cm. In case of the fourth reference measurement at day 1 the sample was matched in terms of temperature to the sample in the SBE911 profile in 4m depth. Doing this the conductivity deviation reduced from -0.0710 mS/cm to -0.0058 mS/cm (Table 3).
Differences at day 94/95 were greater than at day 237 and their mean value was out of expected accuracy by 45%. Matching the values with corresponding temperature of the profile did not work in this case since the corresponding temperature was at 19m water depth. But shifting the first two samples in time, matching the profile with SBE37 sampled 10 minutes earlier, deviation reduced to -0.0091 mS/cm and 0.0045 mS/cm respectively. These deviations were within the limits of the expected accuracy from the spec sheet. For the third reference measurement at day 94/95 no better matching in space or time was possible. The last two reference measurements before recovery of the instrument after 237 days showed an average deviation of -0.0099 mS/cm which was well within the expected accuracy. The RMSE of the modified SBE37 deployment (0.0098 mS/cm) was two orders of magnitude lower than the standard SBE37 deployment.
4.2 Chlorophyll a fluorometer
A standard deployment with two Wetlabs ECO FLNTU devices lasting 115 days was performed in coastal Baltic Sea water in 2017 (Figure 8). The sensors were moored at 2 m and 5 m water depth at the station Arkona Basin. The ECO FLNTU instruments were used with the default wipers to keep the optical windows free from biofouling. The day 1 reference measurement showed a deviation of 0.38 µg/l. We recognized qualitatively comparable data for chlorophyll a until end of march, RMSE of four reference measurements at day 75 was 0.23 µg/l (Table 4). In April huge spikes appeared at the instrument deployed at 2 m water depth reaching ten-fold values compared to the sensor at 5 m depth, RMSE at day 115 reached 2.19 µg/l. After recovering the ECO FLNTU, we recognized the reason for this spiking. A barnacle grew on the rubber lid of the wiper. This barnacle resulted in heavy scratching on the optical window and copper surfaces which is clearly visible in Figure 2C that was taken after cleaning of the instrument.
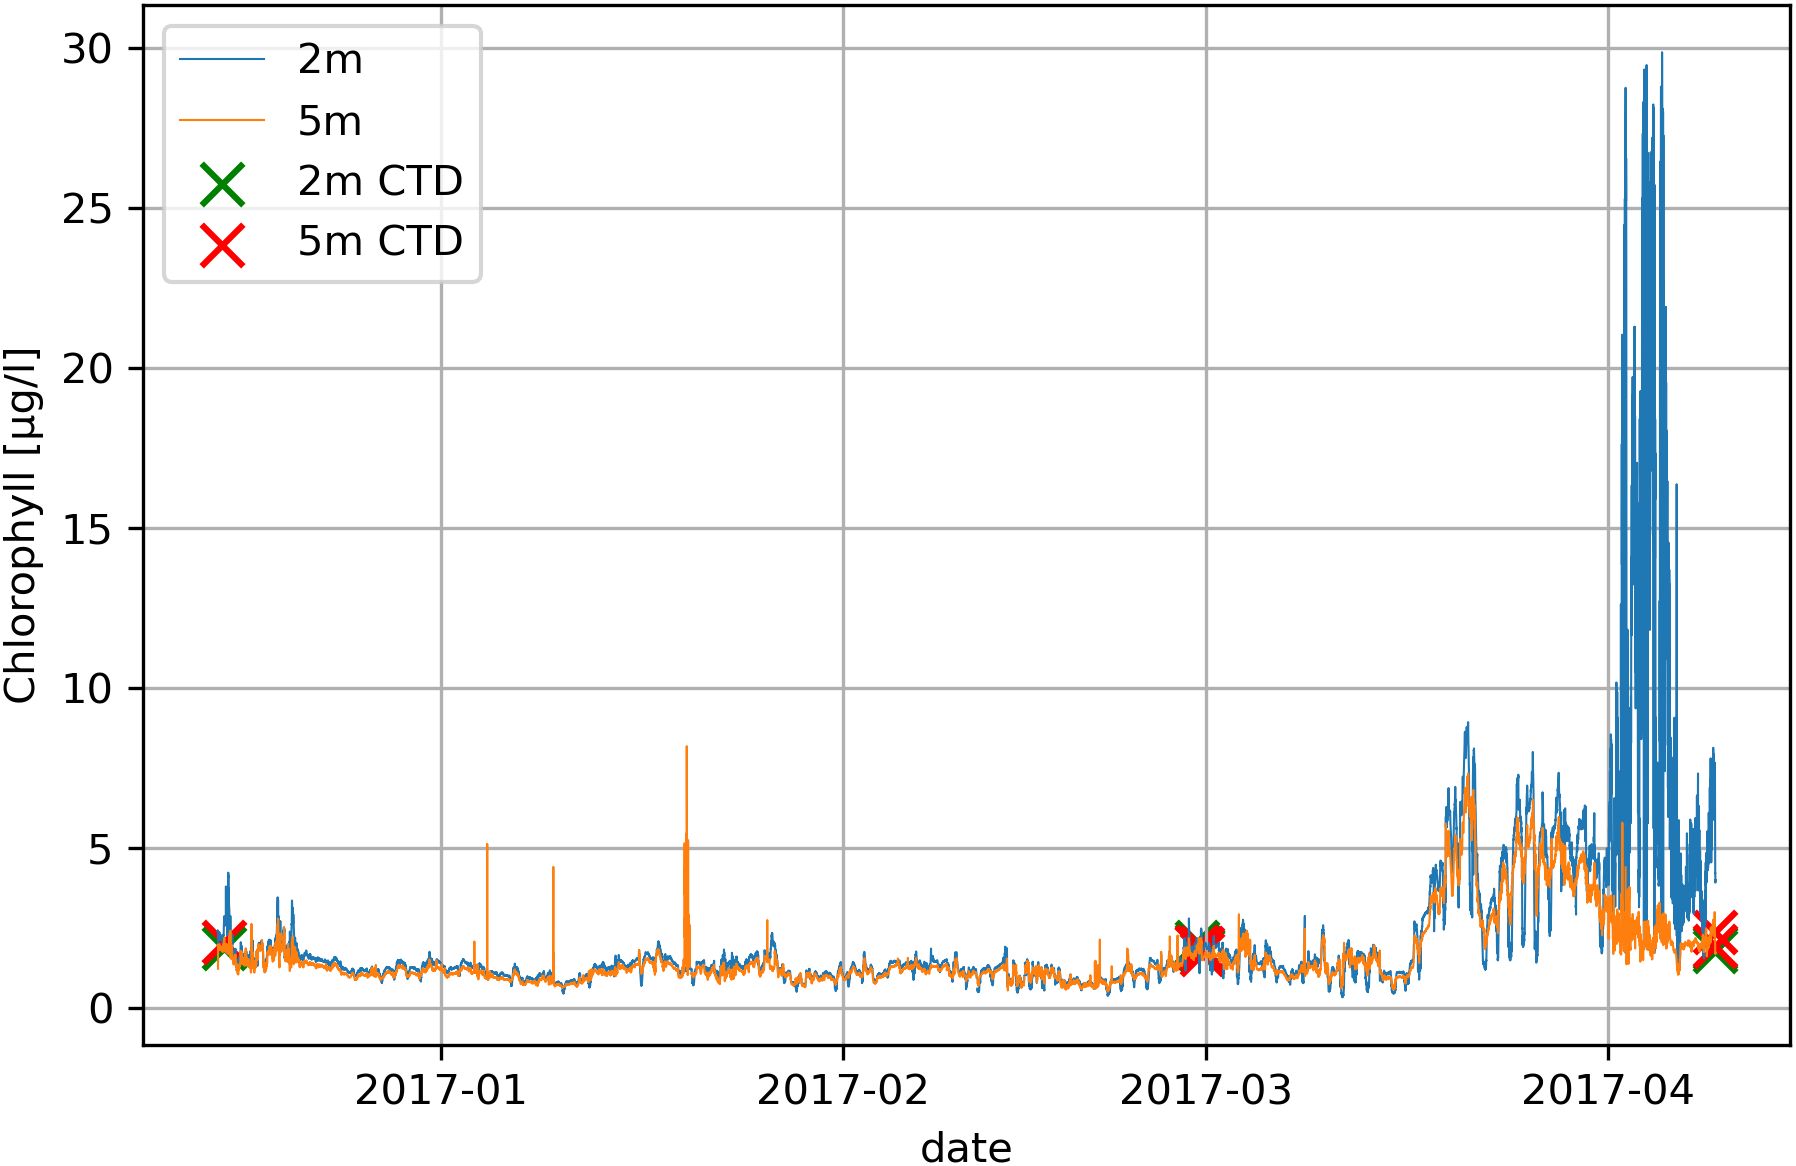
Figure 8. Chlorophyll a data from a standard ECO FLNTU deployment with wiper. The blue line represents data from 2 m depth, the orange line shows data from 5 m depth. Crosses represent reference measurements with the shipboard SBE 911plus. The growth period started in mid-march, indicated by higher chlorophyll a values. A barnacle grew on the wiper of the 2 m device and scratched the optical window. This resulted in erroneous data in April.
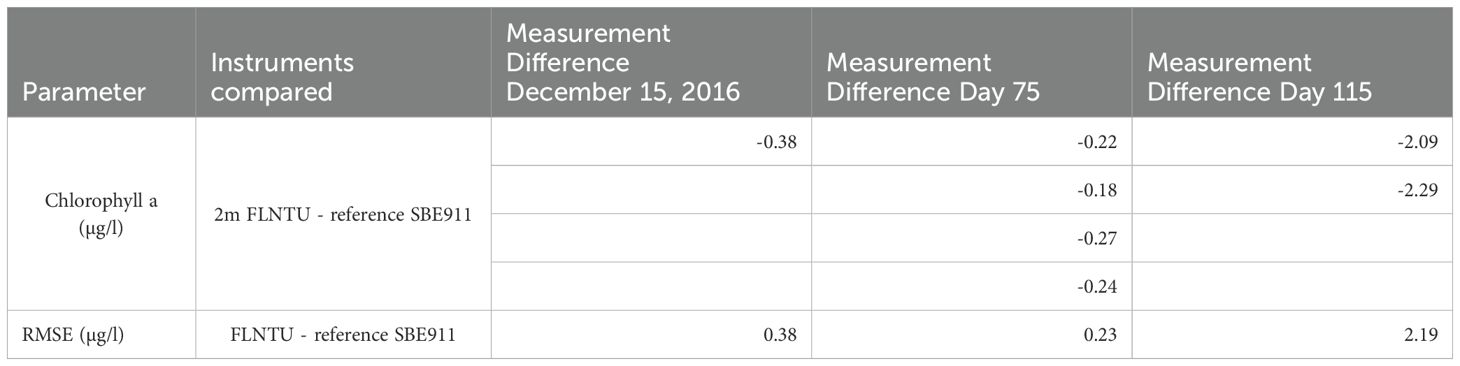
Table 4. Measurement difference of the standard ECO FLNTU deployment compared to shipboard SBE911 (Figure 8).
The second dataset originated from a 138-days-deployment in 2019 without wipers but with UVC emitters installed. Both sensors from 2 m and 5 m showed qualitatively comparable behavior over the entire time of deployment. RMSE of the modified ECO FLNTU in the time of deployment reached values between 0.25 µg/l and 0.41 µg/l (Table 5). Reference samples for laboratory analysis were taken on the last day of deployment. Measurement differences are 32% at 2 m depth and 41% at 5 m depth (Figure 9).
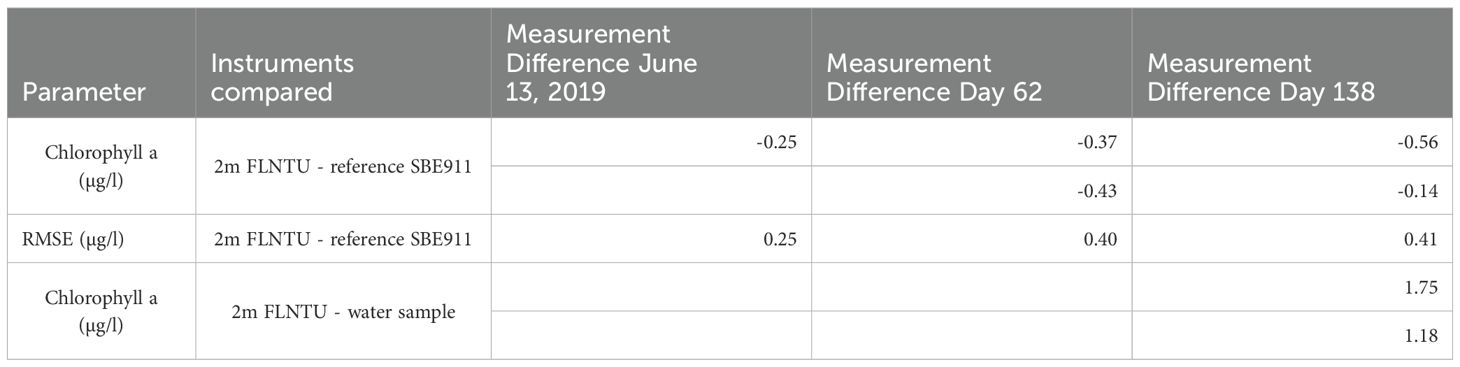
Table 5. Measurement difference of the modified ECO FLNTU deployment compared to shipboard SBE911 and water samples (Figure 9).
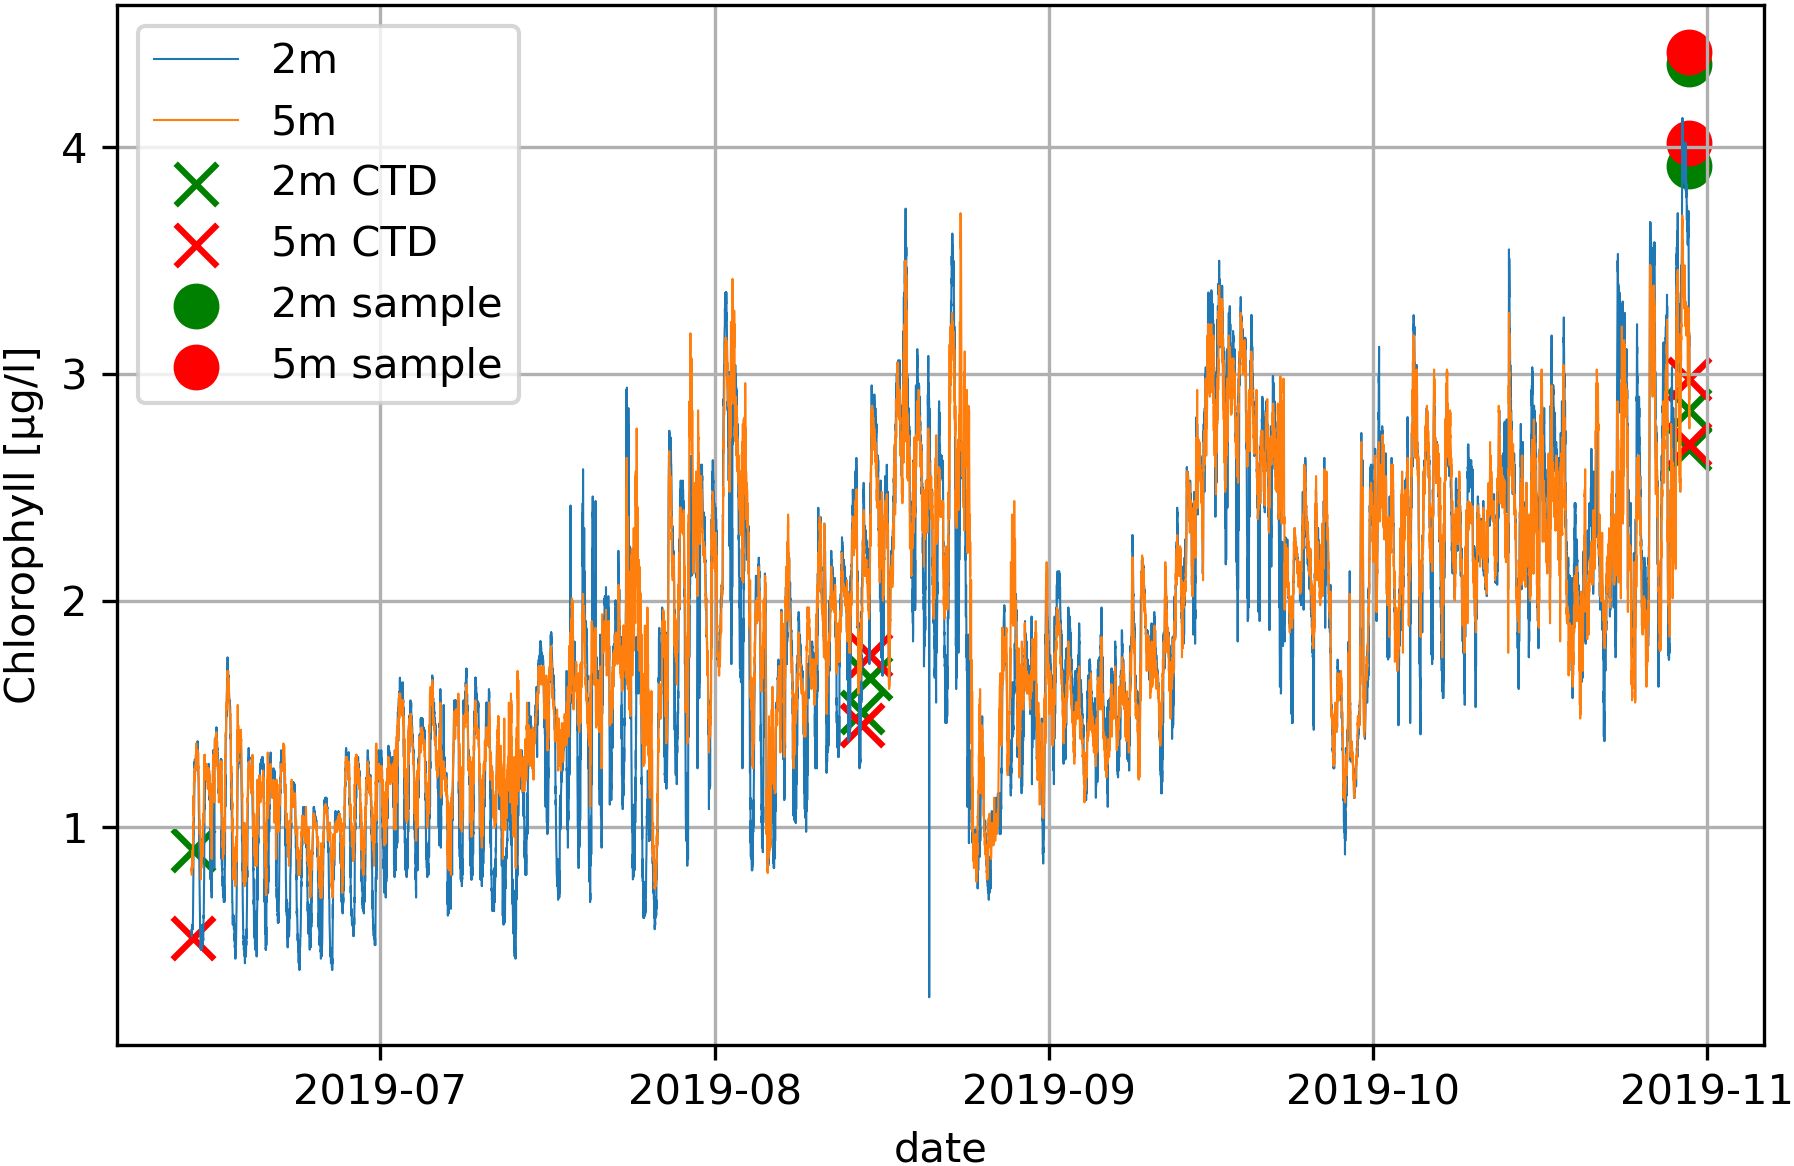
Figure 9. Chlorophyll a data from a modified ECO FLNTU deployment with UVC emitter (without wiper). The blue line represents data from 2 m depth, the orange line shows data from 5 m depth. Crosses represent reference measurements with the shipboard SBE 911plus. Dots represent the reference samples at the end of the deployment period.
4.3 UVC attenuation in natural seawater
Five sample series with the setup described in 3.2 were done. The detector was placed at eight distances between 5 cm and 50cm from the emitter. The resulting UVC intensities showed the decline of UVC intensity in respect to the distance between UVC emitter and sensor (Figure 10). Focus of this sampling was to calculate the attenuation coefficient µ for each series. The data is fitted using Orthogonal Distance Regression (ODR). The reported uncertainties (Figure 10) are standard deviations obtained by taking the square root of the diagonal elements of the covariance matrix of the estimated parameters. This covariance matrix has been scaled by the residual variance (i.e., multiplied by the reduced chi-squared) to reflect the fit quality. All of the measurements taken in this work were done in clear Baltic Sea water with turbidity below 1 NTU. The reference series in air showed massively less reduction of UVC intensity than the series in water.
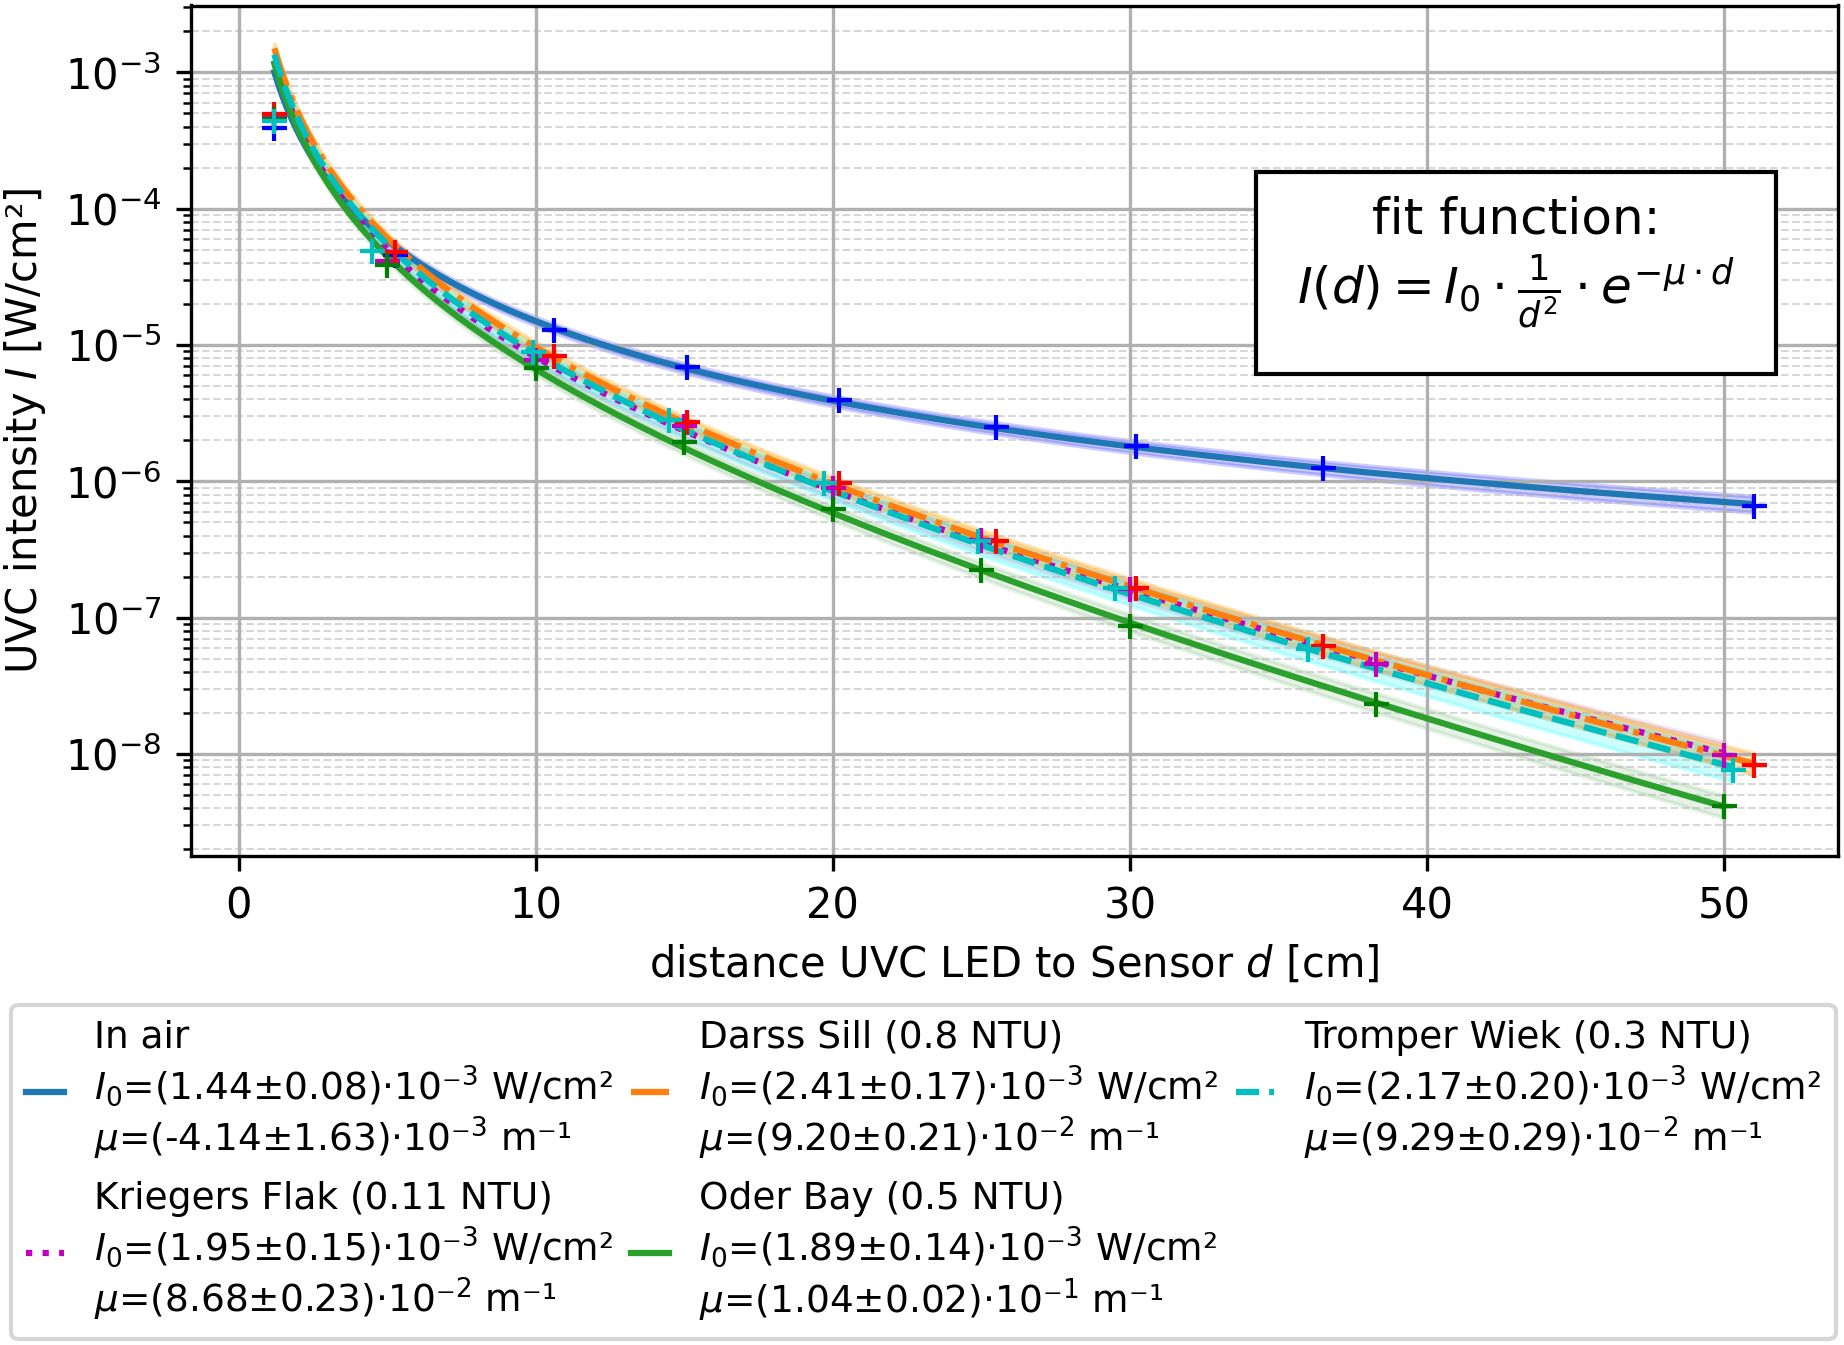
Figure 10. UVC attenuation intensity data for different turbidity values in coastal Baltic Sea waters and air. Each sample series has been fitted with (3) as the function. Series were taken over different cruises between October 2024 and April 2025.
The measured noise level of the ambient light (florescent lamps, sun/cosmic radiation) lied in the order of . Arithmetic mean value of the sample series taken in water was .
5 Discussion
Conductivity data from the standard SBE37 deployment suffers from biofouling in the coastal Baltic Sea in late summer and autumn. None of the comparison measurements after the day of deployment are inside the specified sensor accuracy. At least from conductivity data no further change in geometry of the conductivity cell is visible which indicates that no further biological growth happening between mid-October and mid-December.
The modified SBE37 deployment using the UVC emitter shows promising results regarding the conductivity measurements. Sampled conductivity ranges inside the accuracy specification at day 94 and day 237 of deployment. Two out of two unexpectedly high deviations at the day of deployment between SBE37 and reference instrument can be attributed to difficulties in matching the SBE37 data to the reference profile in this dynamic environment. Regarding the day 94 reference measurements, two out of three profiles with high deviations were matched in time with the previous sample taken by the SBE37. No such method was necessary for the day 237 reference measurements. Difficulties in matching the reference to the samples could be avoided by attaching the SBE37 to the shipboard CTD, but this is only feasible after recovery of the instruments, not during the deployment (Uchida et al., 2008).
There is no accuracy stated for ECO FLNTU hampering final conclusions on the data. To classify the accuracy of ECO FLNTU fluorometer insights exist on a global scale of measurements. Depending on the oceanographic region the fluorometer values using factory-provided calibration have an error between 20% and 640% that needs to be corrected by a slope factor (Roesler et al., 2017).
Besides taking reference samples, we can assess the data qualitatively by comparing the data from 2 m and 5 m depth. Both sensors from the modified deployment show similar behavior over the time of deployment and measurement differences of 32% and 41% at the time of recovery are well within the previously stated margin of error. The almost constant RMSE values between ECO FLNTU and reference measurement over the whole time for the modified deployment supports that statement. Knowing this leads us to the conclusion that, based on the qualitative behavior and the measurement differences at the time of recovery, UVC-based antifouling on fluorometers is a possible solution to acquire high quality moored chlorophyll a data.
The measurements of UVC attenuation in Baltic Sea water allows us to calculate an attenuation coefficient for Baltic Sea water. While a negative did not make physically sense in this context, its small absolute value indicates it was just a result of the rather large errors inherent in this simple setup and the approximations used here and indicated that attenuation in air did not play a major role for these distances.
The series measured in the Oder Bay indicated a higher attenuation compared to the other sample regions, even though a similar turbidity was observed. While this may be based in regional chemical or biological differences, we believe that this is due to our setup being slightly misaligned during this specific sample series, resulting in sub-optimal UVC coverage of the detector for larger distances.
The measured noise level of the ambient light (florescent lamps, sunlight, cosmic radiation) was on the order of and can thus be ruled out as a significant influence.
At some points the reference turbidity value fluctuated up to ±0.5 NTU during a measurement, however no significant changes in intensity could be observed during these fluctuations.
For clear Baltic Sea water an attenuation coefficient near seems to be an acceptable approximation, although the upper limit of this approximation cannot be answered within this work. A future measurement campaign covering notable different particle conditions and waters could allow for the creation of a predictive model for in-situ antifouling UVC irradiance requirements.
UVC-based antifouling still needs further improvement. Self-protection is an issue. During our tests we recognized mussels growing on the housing of the UVC emitter in areas not being illuminated in two cases out of roughly 100 individual deployments. With further growth these mussels can interrupt the beam of UVC light with their shell. In this case no further biofouling protection will be provided in the shadowed area, affecting the system efficacy negatively. Combining two UVC emitter facing each other or additional copper surfaces may help reduce the risk of shadowing. For moored instruments using pumped flow paths there is also a need for UVC-antifouling which is not tackled by the system presented in this work. This is especially important for sensitive surfaces like foils of optical dissolved oxygen meters.
We expect future increase in efficiency of the system. Duty-cycle and irradiance of the UVC-emitter need further investigation to find the optimal working point for specific areas and times of the year. The necessary power of the UVC-emitter can be calculated by the target intensity, distance and the attenuation coefficient presented in this work (Equation 4). Innovation in UVC-LED technology and LED driver circuits are promising drivers of increased efficiency of UVC-based antifouling.
UVC-based antifouling is a low-pollution, energy-efficient, and minimally invasive antifouling technology. Our results show that UVC-based solutions offer antifouling abilities that are comparable to traditional techniques. It also offers the potential for reducing service costs since surfaces of optical instruments are not damaged by mechanical influence.
Data availability statement
The datasets presented in this study can be found in online repositories. The names of the repository/repositories and accession number(s) can be found below: https://doi.org/10.12754/data-2025-0004-01.
Author contributions
RM: Resources, Investigation, Writing – original draft, Funding acquisition, Visualization, Validation, Conceptualization, Methodology, Project administration, Writing – review & editing, Data curation. BK: Visualization, Validation, Data curation, Methodology, Writing – review & editing, Software, Investigation. MB: Conceptualization, Methodology, Writing – review & editing. MC: Writing – review & editing, Investigation. OZ: Resources, Writing – review & editing.
Funding
The author(s) declare that financial support was received for the research and/or publication of this article. The development of the UVC emitter was supported by the Federal Maritime and Hydrographic Agency (BSH) under grant agreement number 4500048871.
Acknowledgments
We would like to thank Nico Günzel, Mike Sommer, Kristian Rose, Stefan Jendersie and the crew of RV Elisabeth Mann Borgese for supporting the realization of this work.
Conflict of interest
The authors declare that the research was conducted in the absence of any commercial or financial relationships that could be construed as a potential conflict of interest.
The author(s) declared that they were an editorial board member of Frontiers, at the time of submission. This had no impact on the peer review process and the final decision.
Generative AI statement
The author(s) declare that no Generative AI was used in the creation of this manuscript.
Publisher’s note
All claims expressed in this article are solely those of the authors and do not necessarily represent those of their affiliated organizations, or those of the publisher, the editors and the reviewers. Any product that may be evaluated in this article, or claim that may be made by its manufacturer, is not guaranteed or endorsed by the publisher.
Supplementary material
The Supplementary Material for this article can be found online at: https://www.frontiersin.org/articles/10.3389/fmars.2025.1625587/full#supplementary-material
References
Bailey K. (2019). Coastal mooring observing networks and their data products: recommendations for the next decade. Front. Mar. Sci. 6. doi: 10.3389/fmars.2019.00180
Bueley C., Olender D., and Bocking B. (2014). In-situ trial of UV-C as an antifoulant to reduce biofouling induced measurement error. J. Ocean Technol. 9, 48–67.
Burchard H., Lass H. U., Mohrholz V., Umlauf L., Sellschopp J., Fiekas V., et al. (2005). Dynamics of medium-intensity dense water plumes in the Arkona Basin, Western Baltic Sea. Ocean Dynamics 55, 391–402. doi: 10.1007/s10236-005-0025-2
Cantwell R. E. and Hofmann R. (2011). Ultraviolet absorption properties of suspended particulate matter in untreated surface waters. Water Res. 45, 1322–1328. doi: 10.1016/j.watres.2010.10.020
Chen E. S. and Bridgeman T. B. (2017). The reduction of Chlorella vulgaris concentrations through UV-C radiation treatments: A nature-based solution (NBS). Environ. Res. 156, 183–189. doi: 10.1016/j.envres.2017.03.007
DAkkS (2023). Accreditation IOW. Available online at: https://www.dakks.de/de/akkreditierte-stelle.html?id=D-K-14544-01-00 (Accessed December 3, 2024).
Delgado A., Briciu-Burghina C., and Regan F. (2021). Antifouling strategies for sensors used in water monitoring: review and future perspectives. Sensors. 21, 389. doi: 10.3390/s21020389
Ferdous F., Hassan M., Rahman N., Hassan T., and Islam R. (2024). Design of an energy efficient buck based LED driver in DCM and CCM. EJENG 9, 40–46. doi: 10.24018/ejeng.2024.9.3.3169
Gustafsson B. G., Schenk F., Blenckner T., Eilola K., Meier H. E. M., Müller-Karulis B., et al. (2012). Reconstructing the development of baltic sea eutrophication 1850–2006. AMBIO 41, 534–548. doi: 10.1007/s13280-012-0318-x
Hartman S. E., Gates A. R., Lopez-Garcia P., Bozzano R., Delory E., Favali P., et al. (2023). Proposed synergies between oceanography and metrology. Front. Mar. Sci. 10. doi: 10.3389/fmars.2023.1192030
Hassoun A. E. R., Tanhua T., Lips I., Heslop E., Petihakis G., and Karstensen J. (2024). The European Ocean Observing Community: urgent gaps and recommendations to implement during the UN Ocean Decade. Front. Mar. Sci. 11, 1394984. doi: 10.3389/fmars.2024.1394984
HELCOM (2023). State of the Baltic Sea 2023. Available online at: https://helcom.fi/post_type_publ/holas3_sobs (Accessed December 2, 2024).
Hijnen W. A. M., Beerendonk E. F., and Medema G. J. (2006). Inactivation credit of UV radiation for viruses, bacteria and protozoan (oo)cysts in water: A review. Water Res. 40, 3–22. doi: 10.1016/j.watres.2005.10.030
Hoeher P. A., Zenk O., Cisewski B., Boos K., and Groeger J. (2023). UVC-based biofouling suppression for long-term deployment of underwater cameras. IEEE J. Oceanic Eng. 48, 1389–1405. doi: 10.1109/JOE.2023.3265164
IMO (2001). International Convention On the Control of Harmful Anti-Fouling Systems on Ships. Available online at: https://assets.publishing.service.gov.uk/government/uploads/system/uploads/attachment_data/file/236102/8284.pdf (Accessed October 10, 2024).
Kowalski W. (2009). Ultraviolet Germicidal Irradiation Handbook: UVGI for Air and Surface Disinfection (Berlin, Heidelberg: Springer Berlin Heidelberg). doi: 10.1007/978-3-642-01999-9
Krüger S. (2000). Basic shipboard instrumentation and fixed automatic stations for monitoring in the Baltic Sea. Ocean Eng. Handb. (1st ed.) 1, 52–61. doi: 10.1201/9781420036732
Lass H. U. and Mohrholz V. (2003). On dynamics and mixing of inflowing saltwater in the Arkona Sea. J. Geophys. Res. 108, 2002JC001465. doi: 10.1029/2002JC001465
MacKenzie A., Maltby E., Harper N., Bueley C., Olender D., and Wyeth R. (2019). Periodic ultraviolet-C illumination for marine sensor antifouling. Biofouling 35 (5), 483–493. doi: 10.1080/08927014.2019.1616698
Mason JD, Cone MT, and Fry ES (2016). Ultraviolet (250–550 nm) absorption spectrum of pure water. Appl. Opt. 55, 7163–7172.
Pagoropoulos A., Kjaer L. L., and Dong Y. (2018). Economic and environmental impact trade-offs related to in-water hull cleanings of merchant vessels. J. Ind. Ecol. 22, 916–929. doi: 10.1111/jiec.12627
Qualls R. G. and Johnson J. D. (1985). Modeling and efficiency of ultraviolet disinfection systems. Water Res. 19, 1039–1046. doi: 10.1016/0043-1354(85)90374-4
Roesler C., Uitz J., Claustre H., Boss E., Xing X., Organelli E., et al. (2017). Recommendations for obtaining unbiased chlorophyll estimates from in situ chlorophyll fluorometers: A global analysis of WET Labs ECO sensors. Limnology Ocean Methods 15, 572–585. doi: 10.1002/lom3.10185
Salters B. and Piola R. (2017). UVC light for antifouling. Mar. Technol. Soc. J. 51, 59–70. doi: 10.4031/MTSJ.51.2.10
Schneider B., Eilola K., Lukkari K., Muller-Karulis B., and Neumann T. (2015). “Environmental Impacts—Marine Biogeochemistry,” In The BACC II Author Team (eds) Second Assessment of Climate Change for the Baltic Sea Basin. Regional Climate Studies. Cham: Springer. doi: 10.1007/978-3-319-16006-1_18
Smith R. C. and Baker K. S. (1981). Optical properties of the clearest natural waters (200–800 nm). Appl. Opt. 20, 177. doi: 10.1364/AO.20.000177
Su C.-S. and Yeh S.-M. (1996). UV attenuation coefficient in water determined by thermoluminescence detector. Radiat. Measurements 26, 83–86. doi: 10.1016/1350-4487(95)00284-7
Torkzadeh H. and Cates E. L. (2021). Biofilm growth under continuous UVC irradiation: Quantitative effects of growth conditions and growth time on intensity response parameters. Water Res. 206, 117747. doi: 10.1016/j.watres.2021.117747
Uchida H., Kawano T., and Fukasawa M. (2008). In situ calibration of moored CTDs used for monitoring abyssal water. J. Atmospheric Oceanic Technol. 25, 1695–1702. doi: 10.1175/2008JTECHO581.1
Vuong P., McKinley A., and Kaur P. (2023). Understanding biofouling and contaminant accretion on submerged marine structures. NPJ Mater. Degrad. 7, 50. doi: 10.1038/s41529-023-00370-5
Wasmund N., Nausch G., Gerth M., Busch S., Burmeister C., Hansen R., et al. (2019). Extension of the growing season of phytoplankton in the western Baltic Sea in response to climate change. Mar. Ecol. Prog. Ser. 622, 1–16. doi: 10.3354/meps12994
Keywords: ultraviolet, biofouling, biocide-free strategies, marine sensor data, observatory, Baltic sea, attenuation (absorption) coefficient
Citation: Mars R, Krebs B, Bjoerner M, Christopoulou M and Zielinski O (2025) Optimized UVC-based antifouling system for moored applications. Front. Mar. Sci. 12:1625587. doi: 10.3389/fmars.2025.1625587
Received: 09 May 2025; Accepted: 25 June 2025;
Published: 22 July 2025.
Edited by:
Philipp Friedrich Fischer, Alfred Wegener Institute Helmholtz Centre for Polar and Marine Research (AWI), GermanyReviewed by:
Marc Le Menn, Service Hydrographique et Océanographique de la Marine (SHOM), FranceShiguo Li, Chinese Academy of Sciences (CAS), China
Copyright © 2025 Mars, Krebs, Bjoerner, Christopoulou and Zielinski. This is an open-access article distributed under the terms of the Creative Commons Attribution License (CC BY). The use, distribution or reproduction in other forums is permitted, provided the original author(s) and the copyright owner(s) are credited and that the original publication in this journal is cited, in accordance with accepted academic practice. No use, distribution or reproduction is permitted which does not comply with these terms.
*Correspondence: Robert Mars, bWFyc0Bpby13YXJuZW11ZW5kZS5kZQ==