 Francesco Zangaro1,2
 Maria Rosaria Vadrucci3
 Mariola Ismailaj4
 Valeria Specchia1,2*
 Maurizio Pinna1,2,5*
- 1Department of Biological and Environmental Sciences and Technologies (DiSTeBA), University of Salento, Lecce, Italy
- 2NBFC, National Biodiversity Future Centre, Palermo, Italy
- 3Environmental Protection Agency of Campania-Department of Caserta, Caserta, Italy
- 4Department of Biology, Faculty of Technical and Natural Sciences, University “Ismail Qemali” Vlore, Vlorë, Albania
- 5Research Centre for Fisheries and Aquaculture of Acquatina di Frigole, Department of Biological and Environmental Sciences and Technologies (DiSTeBA), University of Salento, Lecce, Italy
Phytoplankton communities play a crucial role in the sustainability of mariculture practices, particularly regarding the risks associated with potentially harmful species that can cause algal blooms and toxin production. These harmful species can have devastating effects, not only threatening human health and safety through the contamination of seafood and water supplies but also disrupting the delicate balance of marine ecosystems. Monitoring phytoplankton levels and composition is essential to ensure that mariculture remains environmentally sustainable, economically viable, and safe for consumers. Ultimately, this contributes to the preservation of marine biodiversity and its long-term health. Traditional methods for phytoplankton identification are often labor-intensive and may fail to capture the full diversity of these organisms. Environmental DNA (eDNA) metabarcoding is emerging as an innovative tool that offers a more comprehensive assessment of phytoplankton biodiversity, although it does not yet provide a strictly quantitative measure. In our research, we employed eDNA metabarcoding to analyze eukaryotic phytoplankton community composition, both qualitatively and semi-quantitatively, along a mariculture facility located in the Mediterranean Sea. From a quantitative perspective, we evaluated whether the number of sequences obtained for each OTU could serve as an indicator of the relative abundance of each taxonomic group across different sites. We considered five sampling sites around and at the center of the mariculture facility and conducted eDNA metabarcoding analyses with three replicates per site. Statistical analysis revealed that the number of sequences per OTU were significantly consistent among replicates. This suggests that the number of sequences can be used as a proxy concerning the relative abundance of taxonomic groups across sampling sites. Consequently, this research opens the possibility of using eDNA metabarcoding as a semi-quantitative tool. From a qualitative perspective, we were able to characterize the structure of eukaryotic phytoplankton communities around the mariculture plant, detecting a high level of biodiversity. We also identified potentially dangerous species at low abundance, highlighting the potential of eDNA metabarcoding as an early warning system, an essential aspect for ensuring sustainability in mariculture. This study represents a pioneering effort in utilizing eDNA metabarcoding for both the semi-quantitative and qualitative monitoring of eukaryotic phytoplankton in mariculture supporting eco-sustainable management practices.
1 Introduction
1.1 eDNA metabarcoding: state of the art and application in aquaculture
Environmental DNA (eDNA) metabarcoding is emerging as a powerful tool for biodiversity assessment and ecological studies, particularly in aquatic ecosystems, targeting the main ecological indicator assemblages and describing different ecological communities’ structures (Taberlet et al., 2012; Bohmann et al., 2014; Kermarrec et al., 2014; Pawlowski et al., 2018; Rivera et al., 2023; Apothéloz-Perret-Gentil et al., 2021; Tzafesta et al., 2021; Xie et al., 2021; Specchia et al., 2022, 2023; Pinna et al., 2024). This molecular technique allows for the simultaneous detection and identification of multiple species from environmental samples, such as water, sediment, or biofilms, by amplifying specific genomic regions. Commonly used gene markers include the mitochondrial cytochrome c oxidase subunit I (COI) for animal identification (Hebert et al., 2003); the ribosomal RNA genes (rRNAs) such as 18S and 16S for phytoplankton and bacteria, respectively (Zimmermann et al., 2011; Tragin and Vaulot, 2018); and the chloroplast gene rbcL for plants (Kress and Erickson, 2007). Such genes are intraspecifically highly conserved, and sequence divergence presents sufficient variability and universality across taxa to ensure easy interspecific discrimination and making them suitable for DNA barcoding analyses. Advancements in sequencing technologies revolutionized the field of environmental DNA by enabling the simultaneous sequencing of amplicons from multiple DNA targets. Furthermore, the integration of bioinformatic tools and streamlined data analysis allow for more comprehensive biodiversity assessments (Bohmann et al., 2014; Bolyen et al., 2019; Macé et al., 2022; Hakimzadeh et al., 2024).
Hence, eDNA metabarcoding can provide comprehensive insights into the composition of eukaryotic and prokaryotic communities and was successfully applied in various aquatic habitats, including transitional waters, lakes, rivers, and marine environments, enabling the detection of a wide range of species, from fish to invertebrates (Sinniger et al., 2016; Elbrecht and Steinke, 2019; Leduc et al., 2019; Antich et al., 2021; Reinholdt Jensen et al., 2021; Hupało et al., 2022; Ji et al., 2022; Hickling et al., 2023; Zizka et al., 2025). Indeed, eDNA metabarcoding was successfully used in early detection of non-indigenous species (NIS) in both freshwater and coastal ecosystems (Zangaro et al., 2021; Couton et al., 2022; Jeunen et al., 2022; Zangaro et al., 2024), providing crucial insights for effective conservation efforts. Moreover, eDNA-based surveys facilitated the assessment of marine biodiversity, revealing the presence of elusive or rare species that traditional sampling methods might overlook (Djurhuus et al., 2018; Haderlé et al., 2024; Rossouw et al., 2024).
Overall, the application of eDNA metabarcoding in aquatic environments demonstrates its potential to enhance our understanding of biodiversity and ecosystem health. In this context, preliminary studies explored the application of eDNA metabarcoding in environmental monitoring and underscored the ecological consequences of aquaculture practices on marine biodiversity. Specifically, these studies focused on analyzing sediments from aquaculture sites to assess the diversity of benthic organisms and to establish a relationship between the biotic signals identified through eDNA and the ecological impacts of aquaculture on sediment ecosystems. The findings underscore the utility of eDNA metabarcoding for monitoring environmental changes in fish farming sediments (Pawlowski et al., 2014; He et al., 2021; Turon et al., 2022; Stoeck et al., 2024).
1.2 The relevance of phytoplankton in the context of mariculture activities
Monitoring phytoplankton assemblages across mariculture facilities is essential, as these microscopic organisms play a vital role in aquatic ecosystems and on the health of cultured species (Anderson et al., 2012). In particular, an overabundance of certain species can cause imbalances that may negatively impact cultured organisms. Additionally, some phytoplankton species produce toxins that are harmful to both aquatic life and human health. Tracking dominant taxa and potentially toxic species is crucial for preventing harmful algal blooms (HABs), which can lead to fish kills, shellfish poisoning, and economic losses (Grattan et al., 2016).
Traditional methods of phytoplankton identification, primarily based on microscopy, can be labor-intensive, and often overlook cryptic species. The advent of eDNA metabarcoding offers a more efficient tool for assessing phytoplankton diversity and community structure. Different studies have demonstrated the efficacy of eDNA metabarcoding in detecting phytoplankton species in various aquatic environments. Their findings indicate that eDNA can capture a broader diversity of phytoplankton and revealed significant shifts in community composition in response to environmental changes, underscoring the utility of eDNA as a monitoring tool for assessing ecological responses to abiotic factors and climate changes (De Vargas et al., 2015; Pawlowski et al., 2016a; Mächler et al., 2016; Specchia et al., 2023). Recent studies have increasingly applied eDNA metabarcoding techniques to investigate phytoplankton diversity in marine environments, revealing insights into community composition and dynamics (Pawlowski et al., 2016b). The results from eDNA metabarcoding have a critical role in assessing the influence of environmental drivers on phytoplankton communities, showcasing its relevance in ecological studies and marine biodiversity assessments (Bálint et al., 2024).
Shifts in phytoplankton populations, often driven by environmental changes or nutrient loading, can lead to harmful algal blooms (HABs) which produce toxins detrimental to fish health (Anderson et al., 2021). For instance, toxins from certain dinoflagellates and cyanobacteria can accumulate in fish tissues can accumulate in fish tissues, leading to acute toxicity and subsequent mass die-offs (Baker and Geider, 2021). Regular monitoring and quantification of phytoplankton species can provide essential information for mariculture managers, allowing them to implement timely interventions to mitigate the risks associated with harmful blooms (Zhang et al., 2022).
1.3 eDNA metabarcoding and species quantitative data: state of the art
The integration of eDNA metabarcoding with quantitative PCR (qPCR) represents the actual tool to quantify the abundance of specific target species. Recent studies have used eDNA metabarcoding in conjunction with qPCR to enhance the accuracy of fish species detection and quantification in various aquatic ecosystems. For instance, eDNA metabarcoding and qPCR techniques have been used to estimate the abundance of fish species in freshwater habitats and marine environments (Pont et al., 2023). The advantages of this dual approach in assessing fish biodiversity highlight how qPCR can provide precise quantification of eDNA signals obtained from metabarcoding (Pont et al., 2023). In addition, integrated studies have been used to unveil the presence of specific invasive non-indigenous species and to detect and assess blooming jellyfish taxa (Gargan et al., 2022; Peng et al., 2023). Besides, while eDNA metabarcoding is effective for identifying and characterizing community composition, the correlation between the number of sequences reads and actual species abundance is not yet firmly established.
This research represents a pioneering effort to utilize the number of sequences obtained through high-throughput sequencing of environmental DNA (eDNA) as a means to estimate the relative abundance of eukaryotic phytoplanktonic species across different sampling sites. The study was conducted within the context of a mariculture facility, where maintaining a balanced phytoplanktonic community is crucial for the eco-sustainability of fish production. In such environments, the composition and dynamics of phytoplankton populations can directly influence water quality, fish health, and overall ecosystem stability, as well as represent a powerful ecological indicator.
We demonstrated the feasibility of assessing the relative abundance of different eukaryotic phytoplankton species by analyzing the number of sequencing reads associated with each operational taxonomic unit (OTU). In particular, we focused on OTUs that could be confidently annotated at the species level, allowing us to gain insights into the presence and prevalence of specific species within the community.
Furthermore, our analysis extended to examining the proportional composition of eukaryotic phytoplanktonic communities surrounding the mariculture facility. In doing so, we paid special attention to species that are potentially harmful, such as those able to produce toxins or cause algal blooms. Monitoring these species is vital for early detection and ongoing management, helping to mitigate risks to both the environment and mariculture activities.
2 Materials and methods
2.1 Study area and sampling sites
The study area is represented by a mariculture facility situated along the Salento Ionian coastline in the Mediterranean sea. Located about 1 nautical mile off the Torre Suda coast, approximately 40 km southwest from the City of Lecce, this mariculture facility is strategically situated in an area characterized by strong and consistent underwater currents. These dynamic hydrological conditions create optimal growth environments for species such as European sea bass (Dicentrarchus labrax), gilthead sea bream (Sparus aurata), and meagre (Argyrosomus regius). Five sampling stations (A, B, C, D, and E) were identified according to a distance gradient from the mariculture center. Accordingly, Site A is located at the center, while Sites B, D, and E surround the facility, and Site C is the farthest (Figure 1).
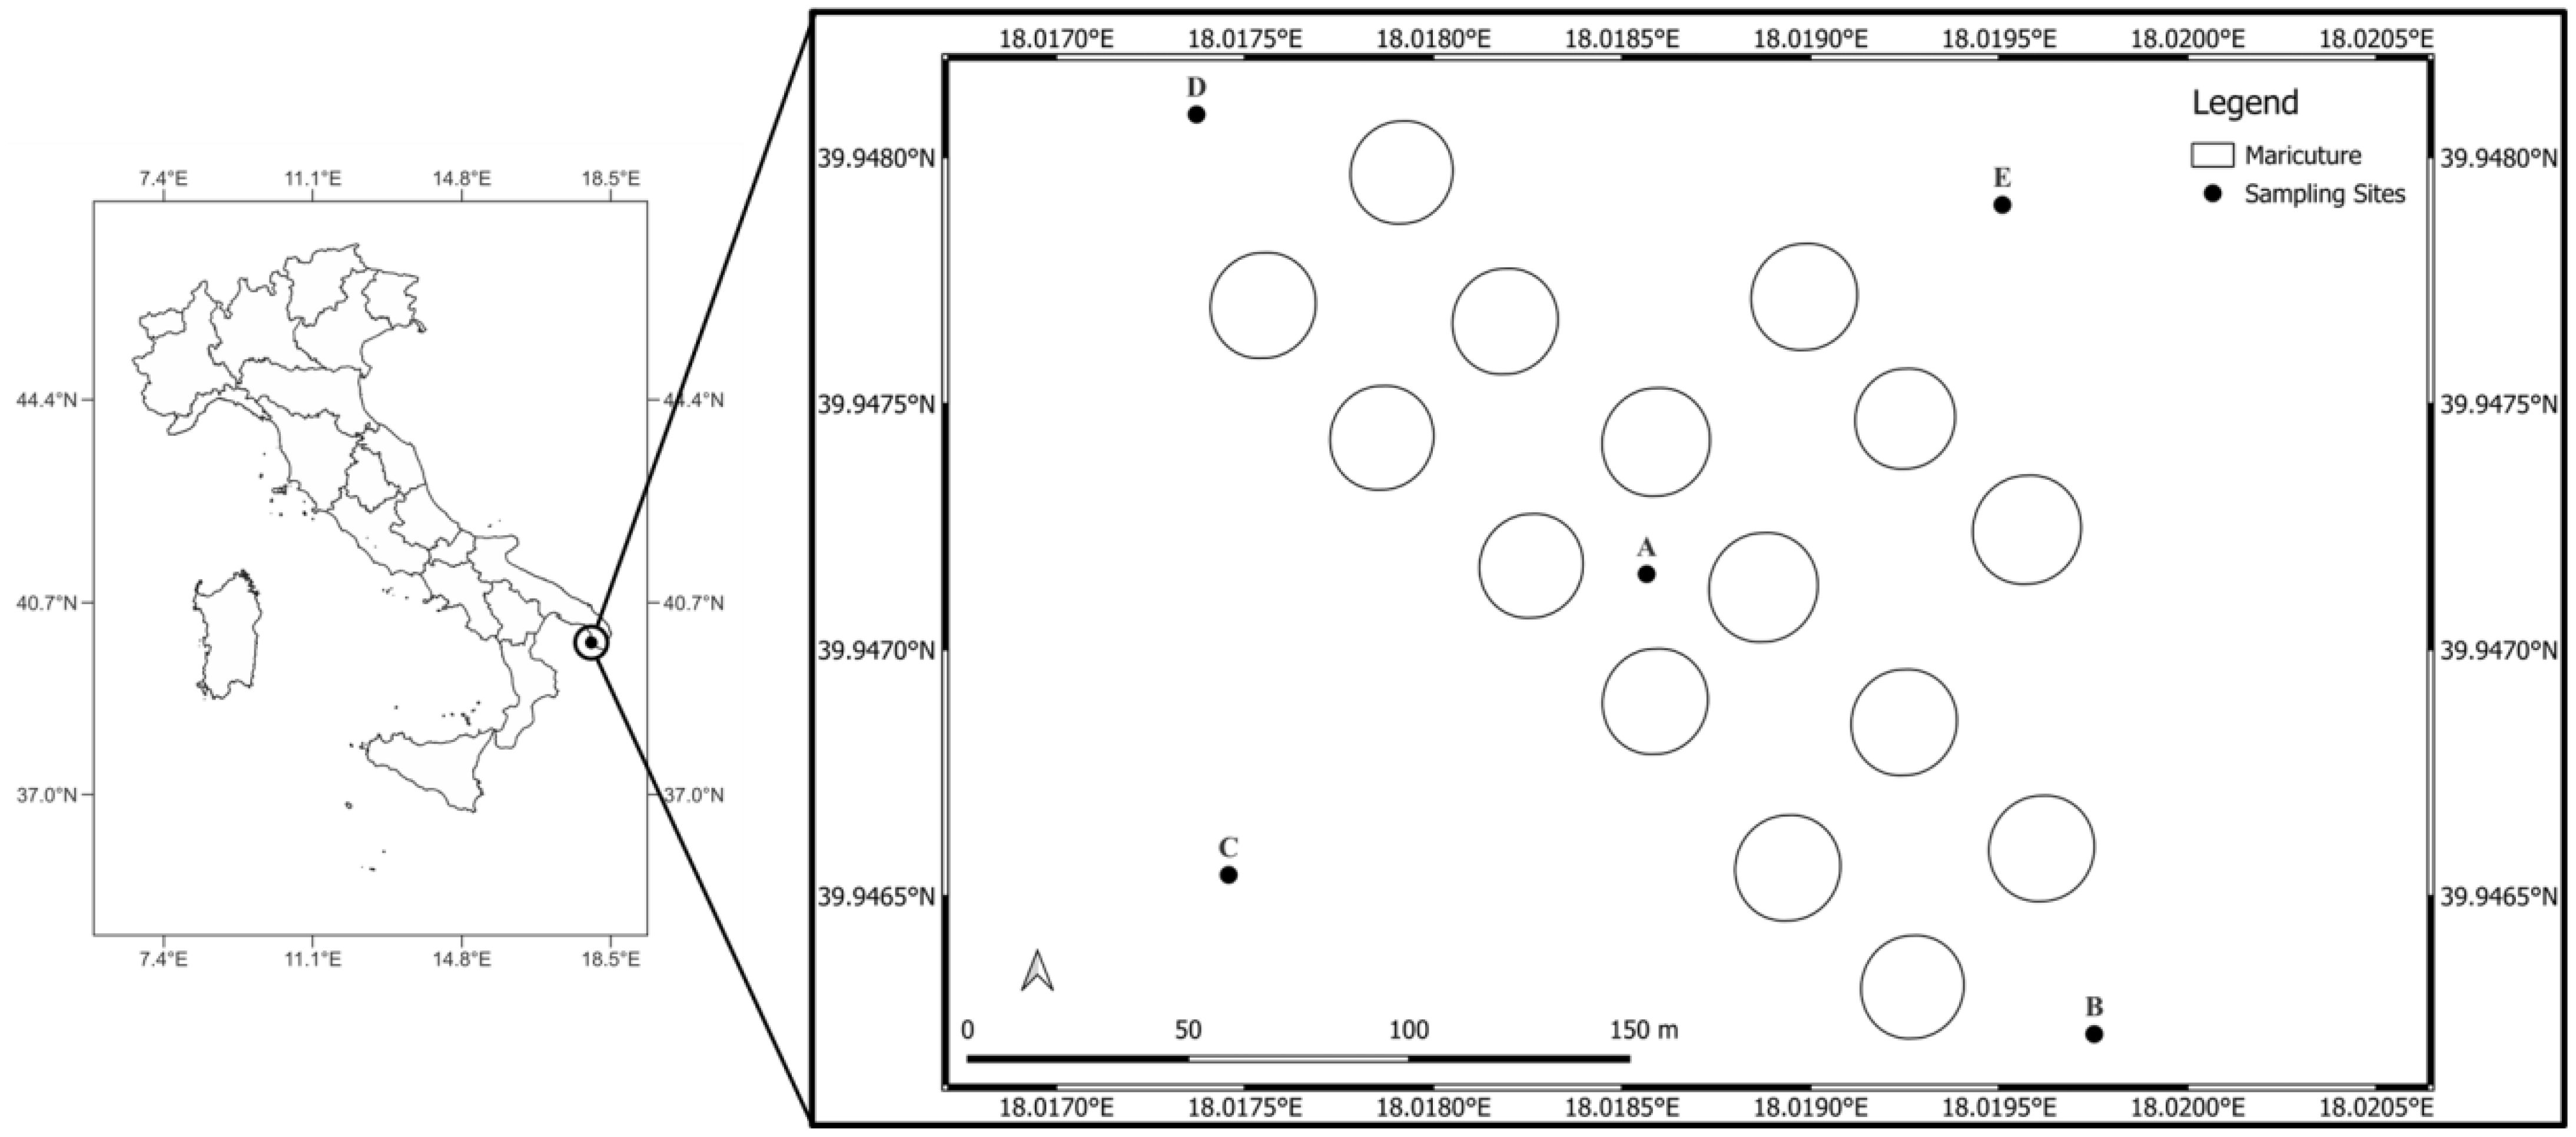
Figure 1. Geographic localization of the study area and localization of the five sampling sites (A–E) across the facility.
2.2 Water sampling, filtration, and DNA extraction
During October 2023, surface water samples were independently collected in the 5 identified sampling sites. Using a Ruttner Water Sampler, 10 liters of water were collected below one meter from the surface and stored into two separate 5 liters sterile tanks labelled referring to the sampling site. The water sampler was rinsed with ultrapure water between each sampling station. The 5 liters tanks were immediately stored in a refrigerated container and were transported to the genetics laboratory of the Department of Biological and Environmental Sciences and Technologies (DiSTeBA - University of Salento, Lecce, Italy) at the end of the sampling. The water samples were immediately processed upon arrival to the laboratory. The biological, independently collected 10 L samples were independently processed across all experimental steps.
Environmental parameters, specifically Salinity (PSU), Total Dissolved Solids (PPT), RDO Concentration (mg/L), RDO Saturation (%Sat), Partial Pressure of Oxygen (Torr), pH, Turbidity (NTU), Temperature (°C), Chlorophyll-a Fluorescence (RFU), and Chlorophyll-a Concentration (µg/L), were independently registered during the water sampling process in the 5 sampling sites using the multiparametric probe Aqua TROLL 500® (In-Situ Inc., Colorado, USA).
In the laboratory, the 10 L biological samples were singularly divided into three 2-litres technical replicates of water. The remaining 4 L were stored separately. Each 2 L replica was independently filtered through a 0.45 μm filter of 47 mm diameter (Advantec® Mixed Cellulose Ester filters) through a Chemker 300 Chemical Resistant Vacuum Pump (Rocker Scientific Co., Ltd, Taiwan). Following, each filter was singularly used in the DNA extraction using the DNeasy PowerWater kit (Qiagen, Germany) following the manufacturer’s protocol.
2.3 DNA amplification, NGS sequencing and bioinformatic analysis
The V4 region of the 18S rRNA gene was amplified with PCR using the primers TAReuk454FWD1 and TAReukREV3 (Stoeck et al., 2010). The amplicon is about 390 bp in length. The reaction was performed in a volume of 50 μL composed of 5 μL of 10X reaction buffer, 1 μL of MgCl2 (50 mM), 1 μL of dNTP mix (10 mM), 1 μL of each primer (10 mM), 10 ng of DNA, 0.2 μL of Platinum Taq (5 U/μL; Life Technologies, USA) and sterile water to reach a volume of 50 μL. A negative control PCR reaction was also set up, which did not produce any amplification. The amplification program included the following steps: denaturation at 95°C for 5 min, 30 cycles of denaturation (95°C for 30′ seconds), annealing (48°C for 30 seconds), extension (72°C for 30 seconds), and a final extension step (72°C for 1 minute).
All PCR products were purified with a PureLink PCR purification kit (Invitrogen, Carlsbad, CA, USA). CeleroTM DNA-Seq kit (NuGEN, San Carlos, CA, USA) was used for library preparation following the manufacturer’s instructions and avoiding the fragmentation step. Both input and final library were quantified by Qubit 2.0 Fluorometer (Invitrogen, Carlsbad, CA, USA) and quality tested by Agilent 2100 Bioanalyzer High Sensitivity DNA assay (Agilent technologies, Santa Clara, CA, USA). Libraries were sequenced on AVITI 2 x 300 bp platform (Element Biosciences, San Diego, CA, USA) by IGATech, Udine, Italy.
An internal pipeline was set up to analyze the metabarcoding sequences. (1) Where the amplicon length was permissive with respect to the read sequencing length, 3′-ends of pairs were overlapped with flash v.1.2.11 and parameters “–max-overlap 70 –min-overlap 15” (Magoč and Salzberg, 2011), while non-overlapping reads were maintained as separated pairs. Both overlapping and non-overlapping reads were retained. (2) Primer sequences used to amplify the 18S V4 region were removed with cutadapt v. 2.7 and parameters: “–discard-untrimmed –minimum-length 70 –overlap 10 –times 2 –error-rate 0.15” (Martin, 2011). Reads were retained if they maintained a minimum length of 70 bp. (3) Low-quality bases at 3′ tails of the reads were trimmed with the erne-filter v. 1.4.3 and parameters: “–min-size 70” (Del Fabbro et al., 2013). (4) The QIIME pipeline v. 1.9.1 (Bolyen et al., 2019) was then executed. (5) The library was scanned for the presence of chimeras with the VSEARCH algorithm v. 2.14.1 (Rognes et al., 2016). (6) The Operational Taxonomic Unit (OTU) picking process was performed in “open-reference” mode. Specifically, in “open-reference” OTUs were built de novo with a clustering threshold set at 97%. OTUs in “open-reference” analysis were generated with a minimum of 2 sequenced fragments. Finally, (7) taxonomy was assigned to OTUs using the predefined taxonomy mapping file of the reference sequences with the RDP classifier v. 2.2 (Wang and Cole, 2024). Only OTUs matching with 97% minimum identity threshold and with minimum confidence threshold of 0.50 were retained and subjected to further classification.
2.4 Statistical OTU diversity estimation
To evaluate the reliability of the number of reads obtained for each molecular taxonomic group or OTU to be used for establishing abundance, a statistical analysis to assess the consistency and homogeneity of the variance in the number of sequences among the replicates collected at each site was designed. In the initial phase, the null-hypothesis that there are no significant differences between the means of the number of sequences for the OTUs in the replicates was assessed. To investigate this, a one-way analysis of variance (ANOVA) for each sampling site was performed in R using the package vegan v. 2.6-4 (Oksanen et al., 2014), as detailed in Supplementary Table S1. The results from the independent replicas at each sampling site are very consistent and show no statistically significant differences, supporting the idea that the replications are highly dependable. To integrate the ANOVA results and assess the distribution of data, the Shapiro-Wilk test for normality was applied in R using the package vegan v. 2.6-4 (Supplementary Table S2).
The result of the Shapiro-Wilk test obtained for each sampling site indicates that the residues in the samples deviate from a normal distribution. However, considering the large number of samples, it is essential to consider that the Shapiro-Wilk test becomes particularly sensitive in the presence of very large datasets, since the test detects differences from the normal distribution with greater statistical power as the number of observations grows (Kozak and Piepho, 2018; González-Estrada et al., 2022; Shatz, 2024). To further confirm the reliability of the analysis of variance, the Levene’s test was conducted in R using the package vegan v. 2.6-4, allowing for the evaluation of the homogeneity of variances between distinct groups (Supplementary Table S3).
The results obtained show absence of significance for all sampling sites, indicating that the variances between replicates are homogeneous, confirming that the homoskedasticity condition is satisfied for the dataset (Sayago and Asuero, 2004; Gastwirth et al., 2009). To further support the previous analyses, the Intraclass Correlation Coefficient (ICC) was calculated in R using the package vegan v. 2.6-4, which allows to quantify the degree of consistency between the measurements made on replicas belonging to the same sampling site (Supplementary Table S4).
The results obtained show a relatively high Intraclass Correlation Coefficient (ICC), obtained using a two-way consistency model. A high ICC value suggests that the variability between replicates is negligible, especially when compared to the variability between different sites, confirming that the measurements are representative of the community composition at each site (Bose et al., 2014; Ionan et al., 2014; Pleil et al., 2018). The two-way model used for the analysis made it possible to evaluate the proportion of variance attributable to real differences between subjects, compared to the error component. The narrow confidence interval indicates a precise estimate of the reproducibility of the experimental method adopted. The analysis of the replications for the quantification of OTUs show good consistency between the replications. The statistical results were supported with a graphical analysis conducted in R using the packages ggplot2 v. 3.5.0 (Wickham, 2016) and vegan v. 2.6-4 (Supplementary Figures S1-S5).
The graphical analysis of the data provided further confirms the accuracy of the replicates in using the number of reads as a proxy for relative species abundance in phytoplankton communities. In particular, the boxplots related to the distribution of OTUs among the replicates show a high homogeneity. Furthermore, the barplots of the mean abundances per replicate show that the differences between the replicates are negligible. In addition, the comparison between residuals and expected values shows an absence of systematic patterns that could indicate biases in the data. Finally, the QQ-plots of the residuals showed that the observed deviations do not significantly affect the validity of the results, confirming that the data can be interpreted with confidence in the context of the ANOVA and the other analyses performed (Pleil, 2016; Fox and Weisberg, 2018).
Alpha diversity investigations were conducted calculating the Shannon diversity index for each of the five sampling sites using the R package vegan v. 2.6-4. Significance among sampling sites was assessed through the one-way ANOVA. Results were visualized as a violin plot using the R package ggplot2 v. 3.5.0. Furthermore, an intersection analysis was performed in R using the R package UpSetR v. 1.4.0 (Conway et al., 2017) and visualized as a Venn diagram using the R package VennDiagram v. 1.7.3 (Chen and Boutros, 2011).
To quantify the compositional dissimilarity between the sampling sites in terms of the number of reads associated to each OTU, a Hellinger transformation combined with a Bray-Curtis dissimilarity matrix was calculated using the R package vegan v. 2.6-4. The results are visualized as a non-metric multidimensional scaling (nMDS) plot obtained using the R package ggplot2 v. 3.5.0. Significance was assessed by permutation test (n = 999 permutations). Homogeneity of multivariate dispersions was tested using “betadisper” followed by a permutation test (999 permutations). Bonferroni correction was applied to minimize Type I errors. Statistical results are reported in the Supplementary File S1.
To better understand the differences in terms of OTUs composition of the samples and replicates and correlate it to the abiotic characteristics of the study area, a Bray-Curtis distance-based Redundancy Analysis (db-RDA) was performed on the Hellinger transformed OTUs data and standardized environmental data using the R package vegan v. 2.6-4. Response variables are represented by the number of reads per OTU for each replicate, while explanatory variables are represented by the mean abiotic parameter values registered at the sampling sites. Two-way ANOVA was calculated for significance. The results are visualized as a db-RDA plot obtained using the R package ggplot2 v. 3.5.0. Homogeneity of multivariate dispersions was tested using “betadisper” followed by a permutation test (999 permutations). Bonferroni correction was applied to minimize Type I errors. Statistical results are available in File S1.
3 Results
3.1 Eukaryotic phytoplankton biodiversity: an overall survey across a mariculture facility
The High Throughput Sequencing of environmental DNA samples collected in the marine area across the mariculture facility returned a total of 22,126,290 high quality reads (Q30 score above 85%). On average, each analyzed replica generated 1,475,086 reads, grouped into a total of 12,155 Operational Taxonomic Units (OTUs). 7,257 of these were annotated as Chromista and were selected to conduct the subsequent downstream analyses based on phytoplankton communities. Specifically, chromists show a diverse range of forms from tiny unicellular flagellates to the large brown algae known as kelp. Molecular studies confirmed the inclusion of certain organisms once considered Fungi, as well as some heterotrophic flagellates (Maneveldt and Keats, 2003).
OTUs annotated as eukaryotic phytoplankton taxa were classified into a hierarchical taxonomic output comprising 12 phyla, 40 classes, 184 families, 103 orders, 259 genera, 175 species, demonstrating a high phytoplankton biodiversity across the study area.
Observing the spatial analysis of the phytoplankton composition at the phyla level across the sampling sites, an overall and relative distribution of OTUs according to a homogeneous scheme appears clearly evident with variations in OTU richness. Sites A and B show a lower number of OTUs than the other sites, while sites D and E host the highest overall wealth of OTUs (Figure 2).
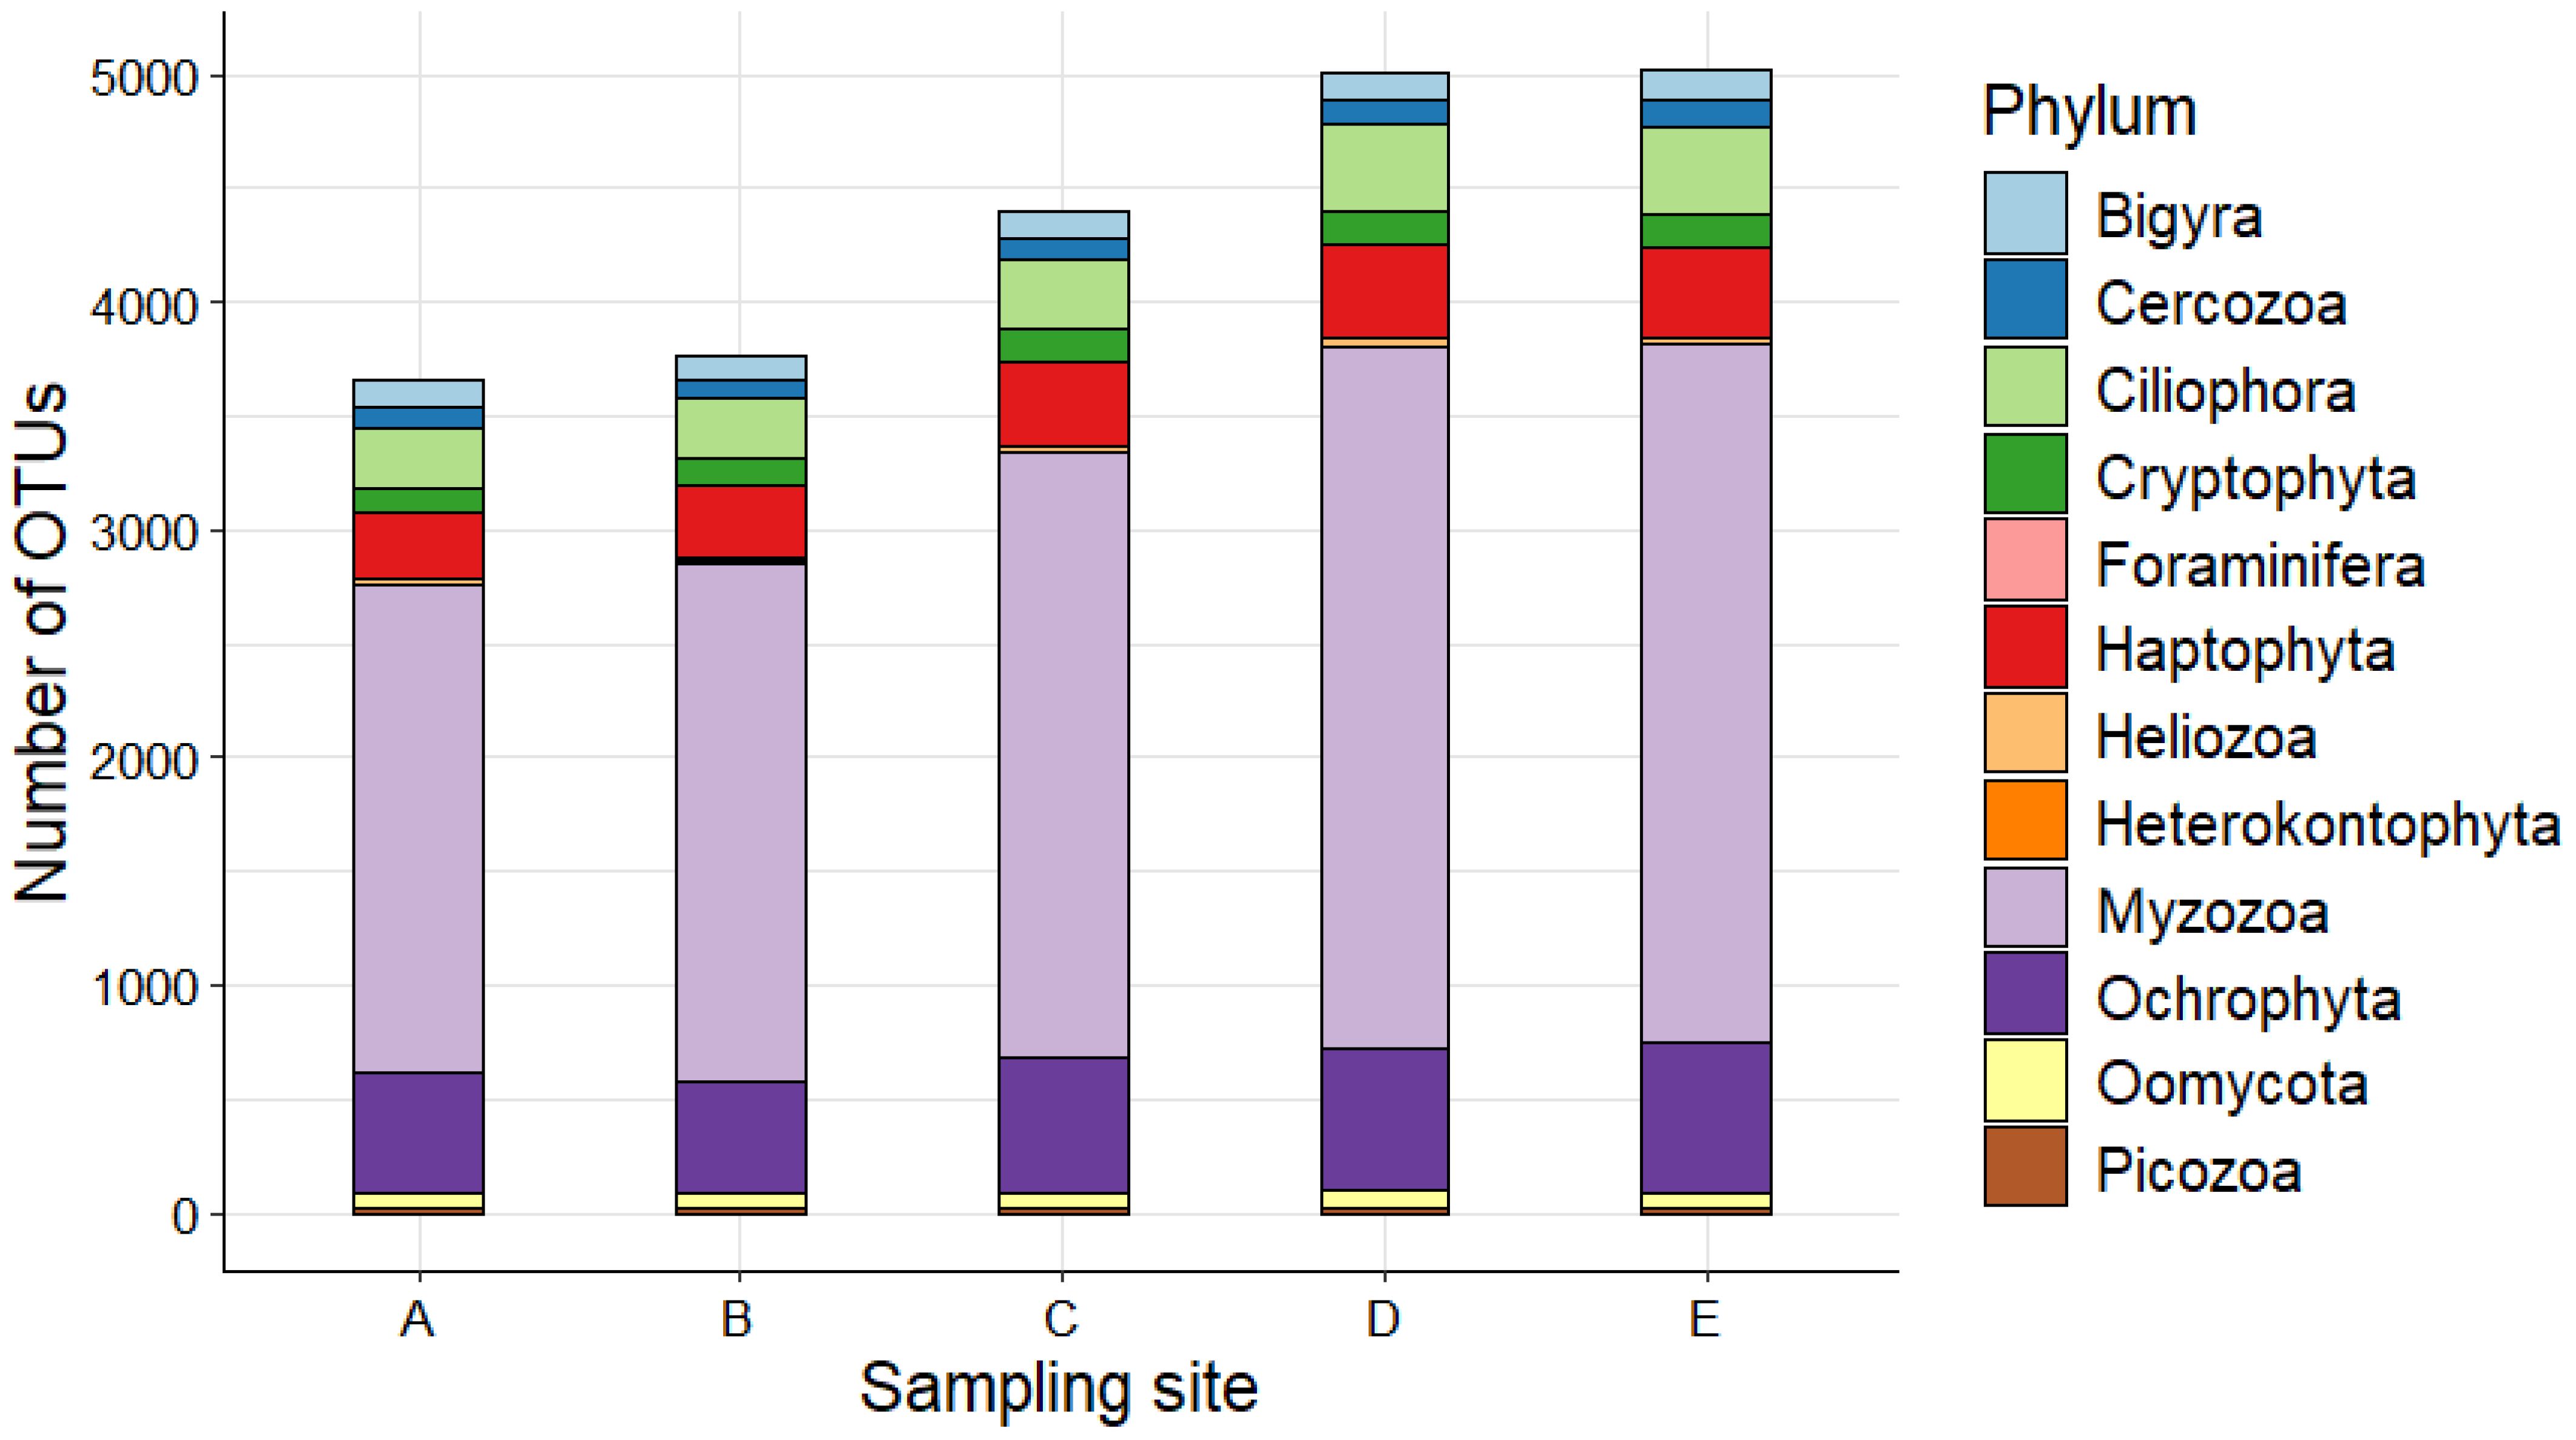
Figure 2. Phytoplankton composition at phylum level across the five sampling sites of the study area.
By increasing the taxonomic resolution and observing the eukaryotic phytoplankton composition at the class level, a similar distribution of OTUs arises, with noticeable variations in the OTUs richness in sites A and B, specifically concerning dinoflagellates (class: Dinophyceae), which show a lower number of OTUs with respect to the other sampling sites (Figure 3).
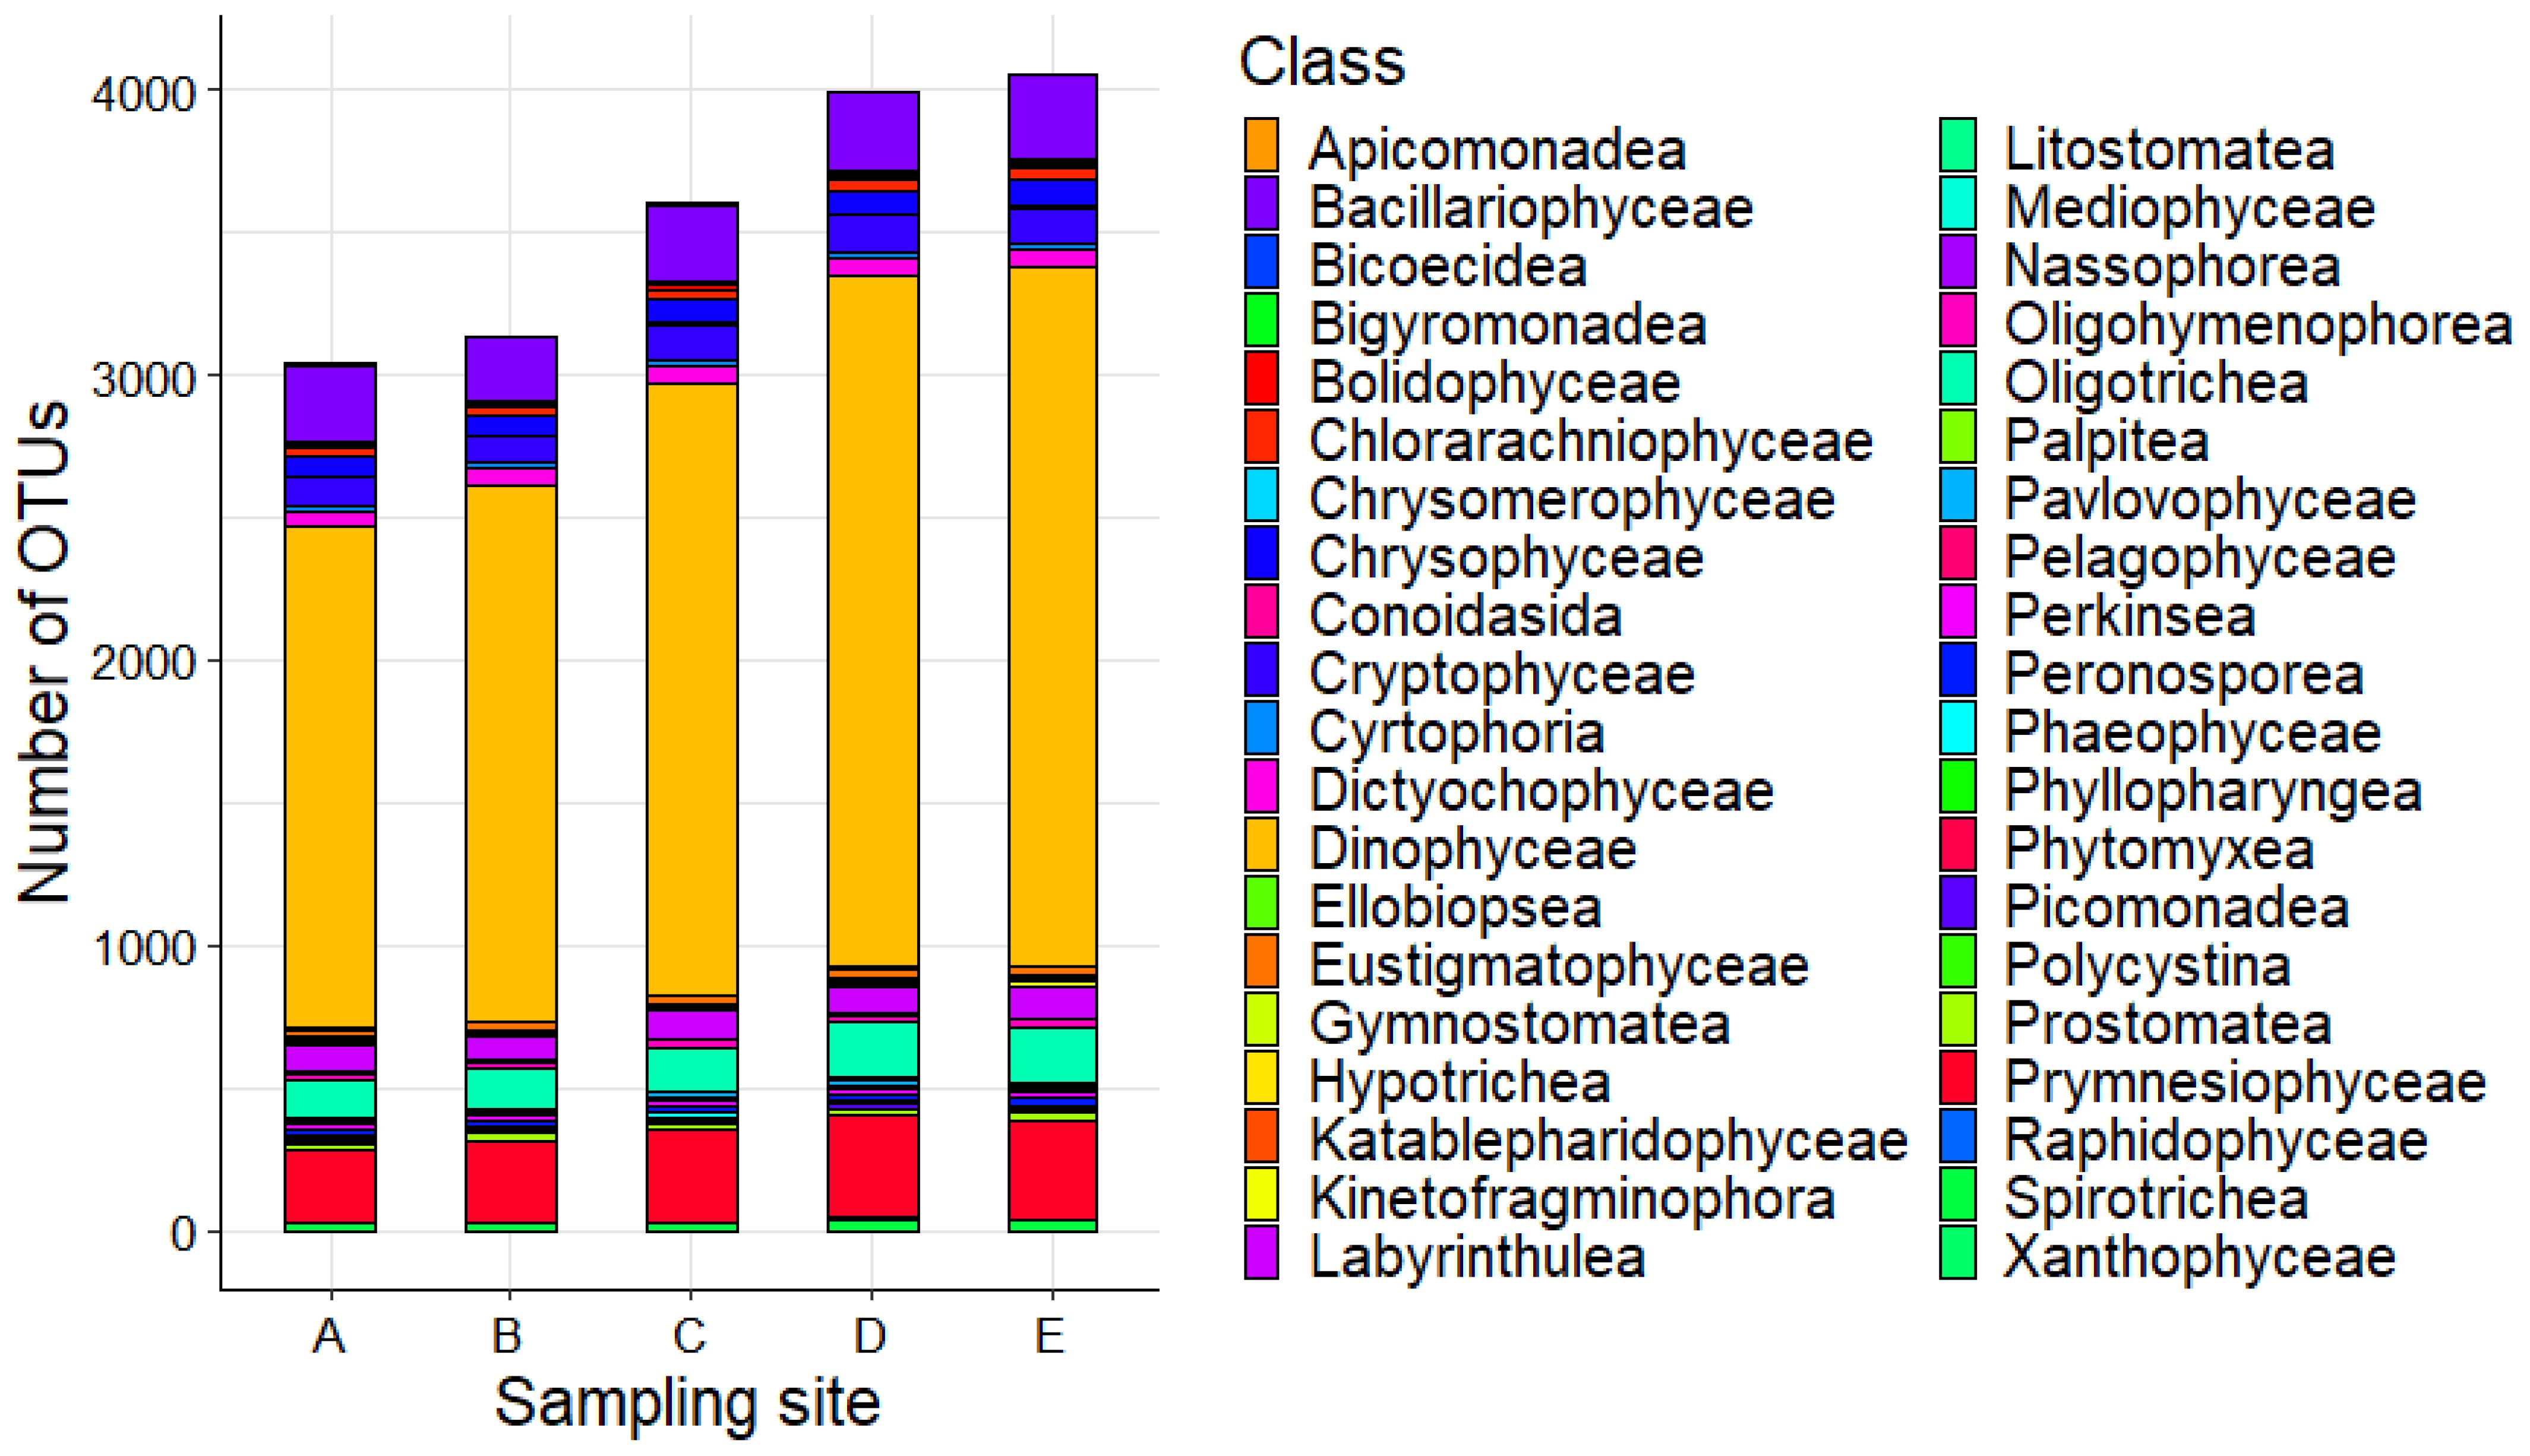
Figure 3. Phytoplankton composition at class level across the five sampling sites of the study area.
To infer the differences in eukaryotic phytoplankton diversity across the five sampling sites, alpha diversity analysis was performed using the Shannon diversity index in all sites. The results were visualized as a violin plot to highlight spatial differences in phytoplankton diversity among the five sampling sites (Figure 4). Specifically, sampling site C, representing the most external with respect to the mariculture cages, exhibited the highest diversity value (visualized as the median line in the violin plot), whereas Site D, localized around the mariculture cages external with respect to the dominant surface currents, showed the lowest value. At the same time, sampling site A, localized at the center of the mariculture plant, displayed an intermediate diversity value. In particular, this sampling site demonstrated the greatest diversity variability compared to the other sampling sites, with a narrower range of values.
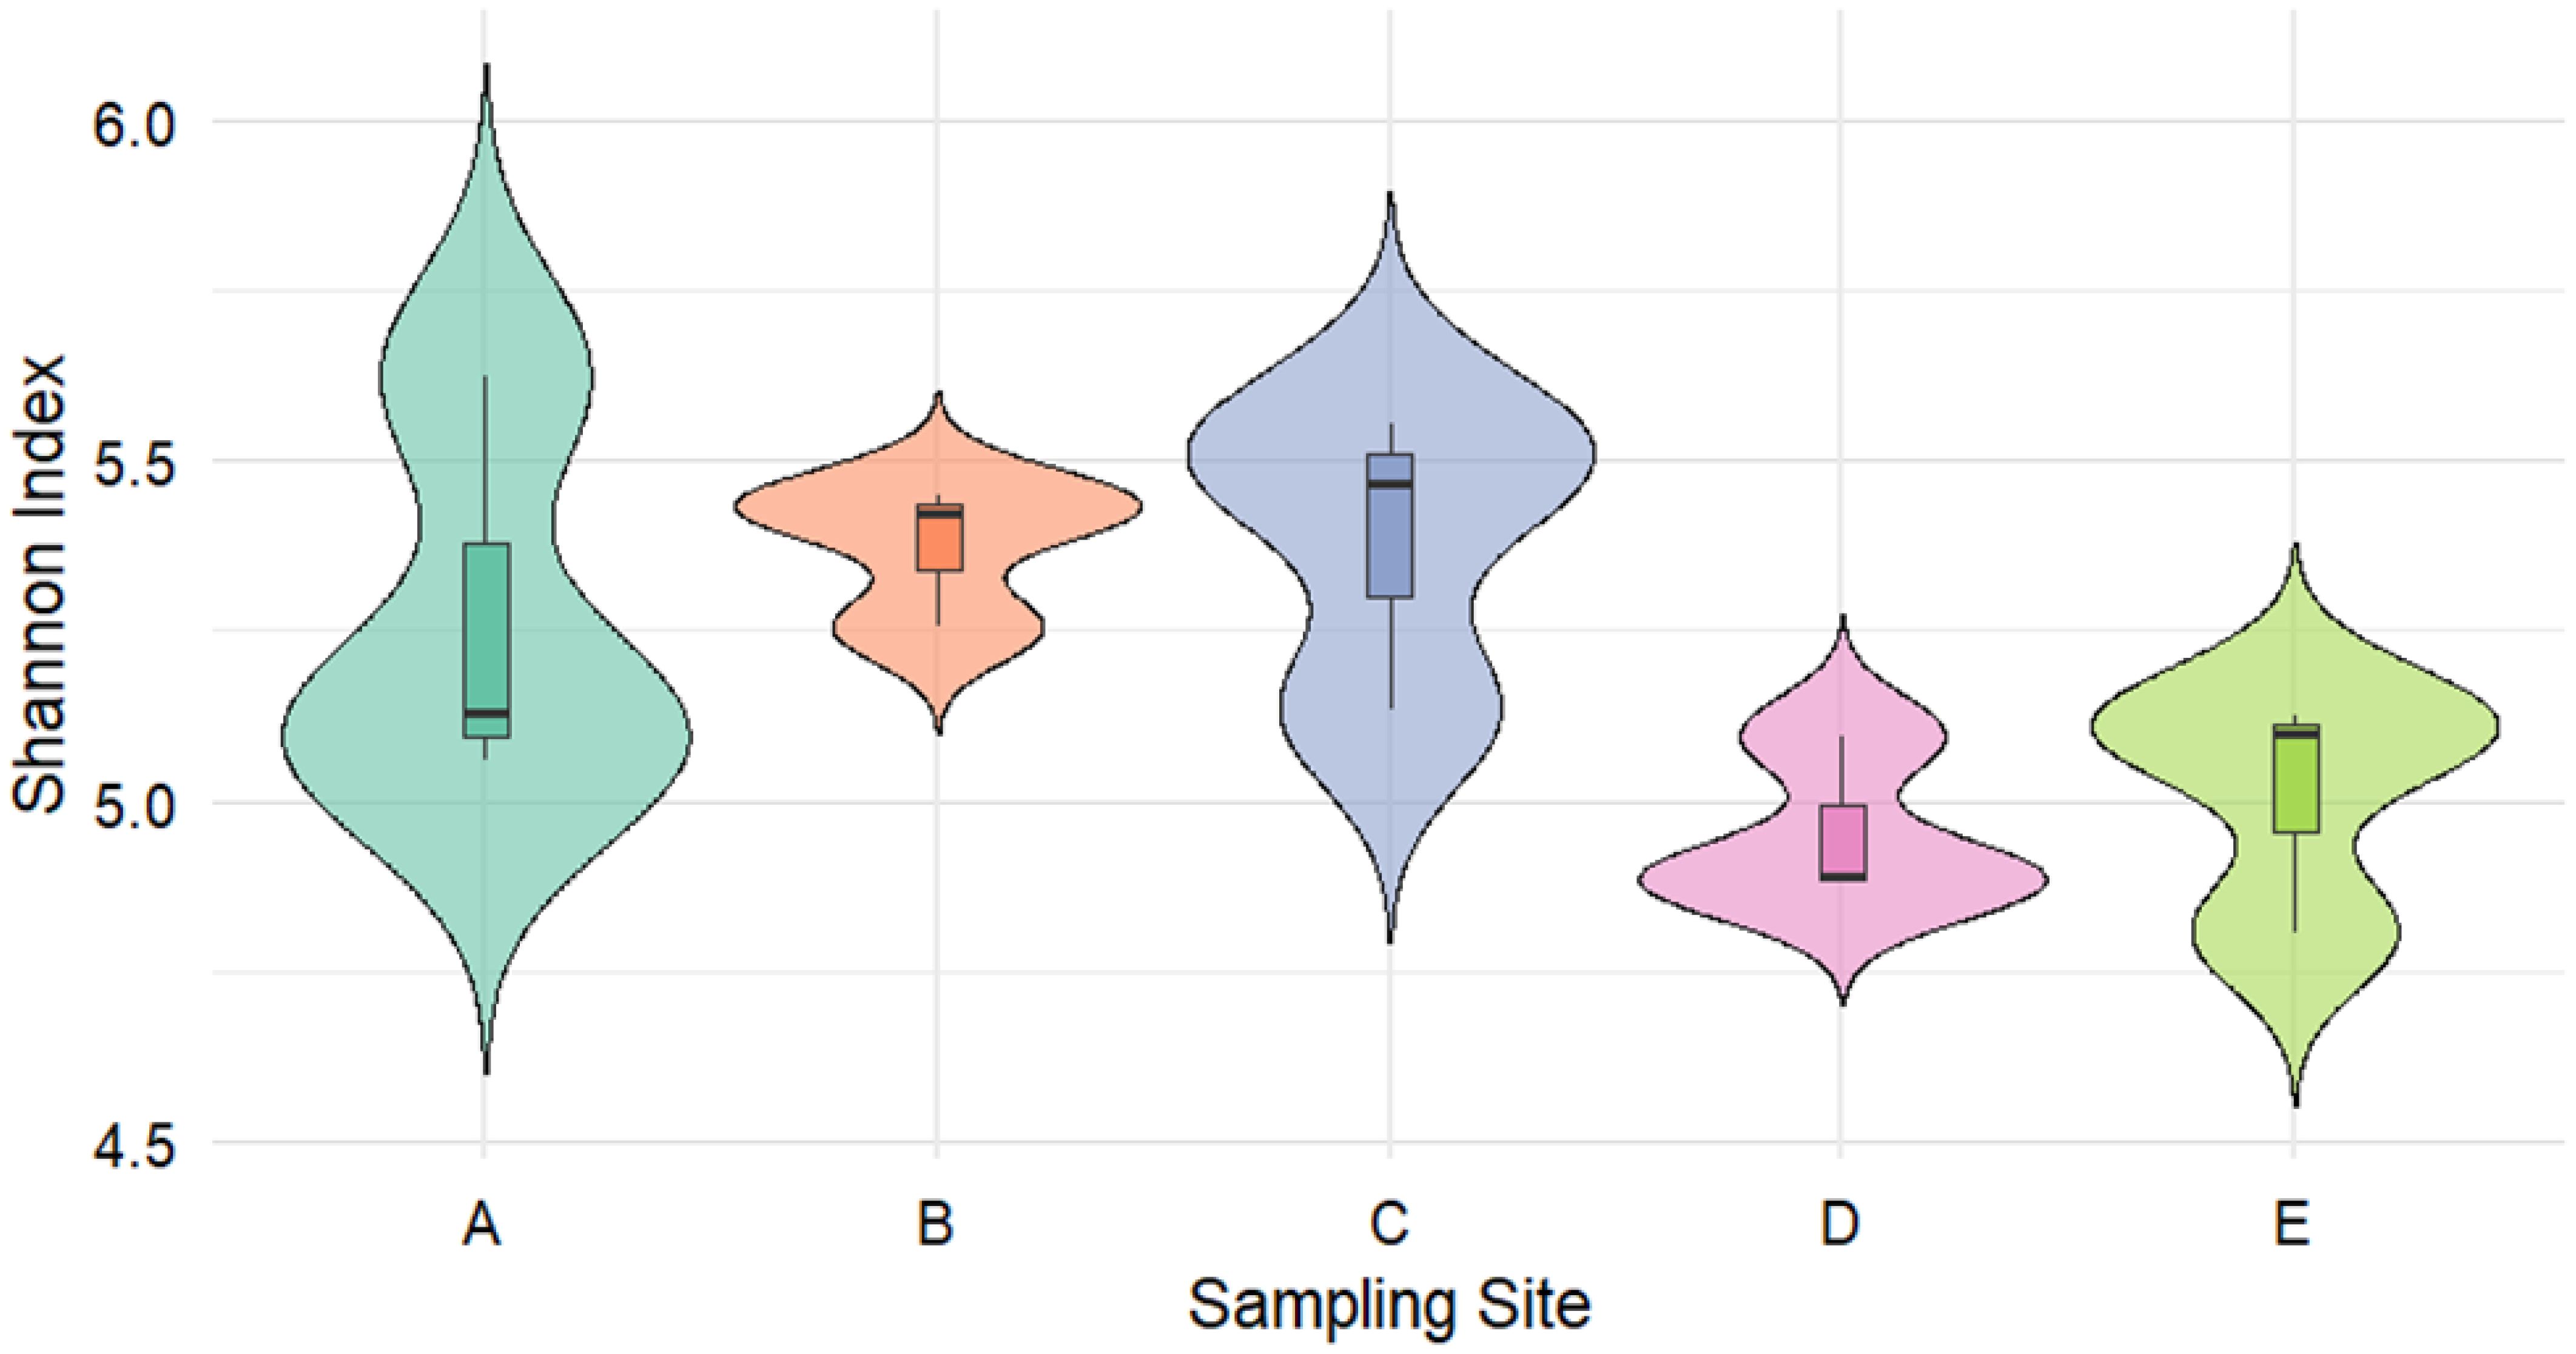
Figure 4. Violin plot showing the Alpha diversity Index (Shannon diversity index) in the five sampling sites.
To determine whether significant differences in the Shannon diversity index existed among the sampling sites, a one-way ANOVA and a Tukey multiple comparisons of means were conducted following a Shapiro-Wilk normality test and a Levene’s Test for Homogeneity of Variance for the Shannon diversity index in the five sampling sites. The analysis revealed no significant differences among the five sampling sites (p > 0.05, Supplementary File 1).
To infer the proportion of shared OTUs among the sampling sites, an intersection analysis was performed. The results, visualized as a Venn diagram (Figure 5), showed that the highest proportion of OTUs (2,251 OTUs) was shared among all five sampling sites.
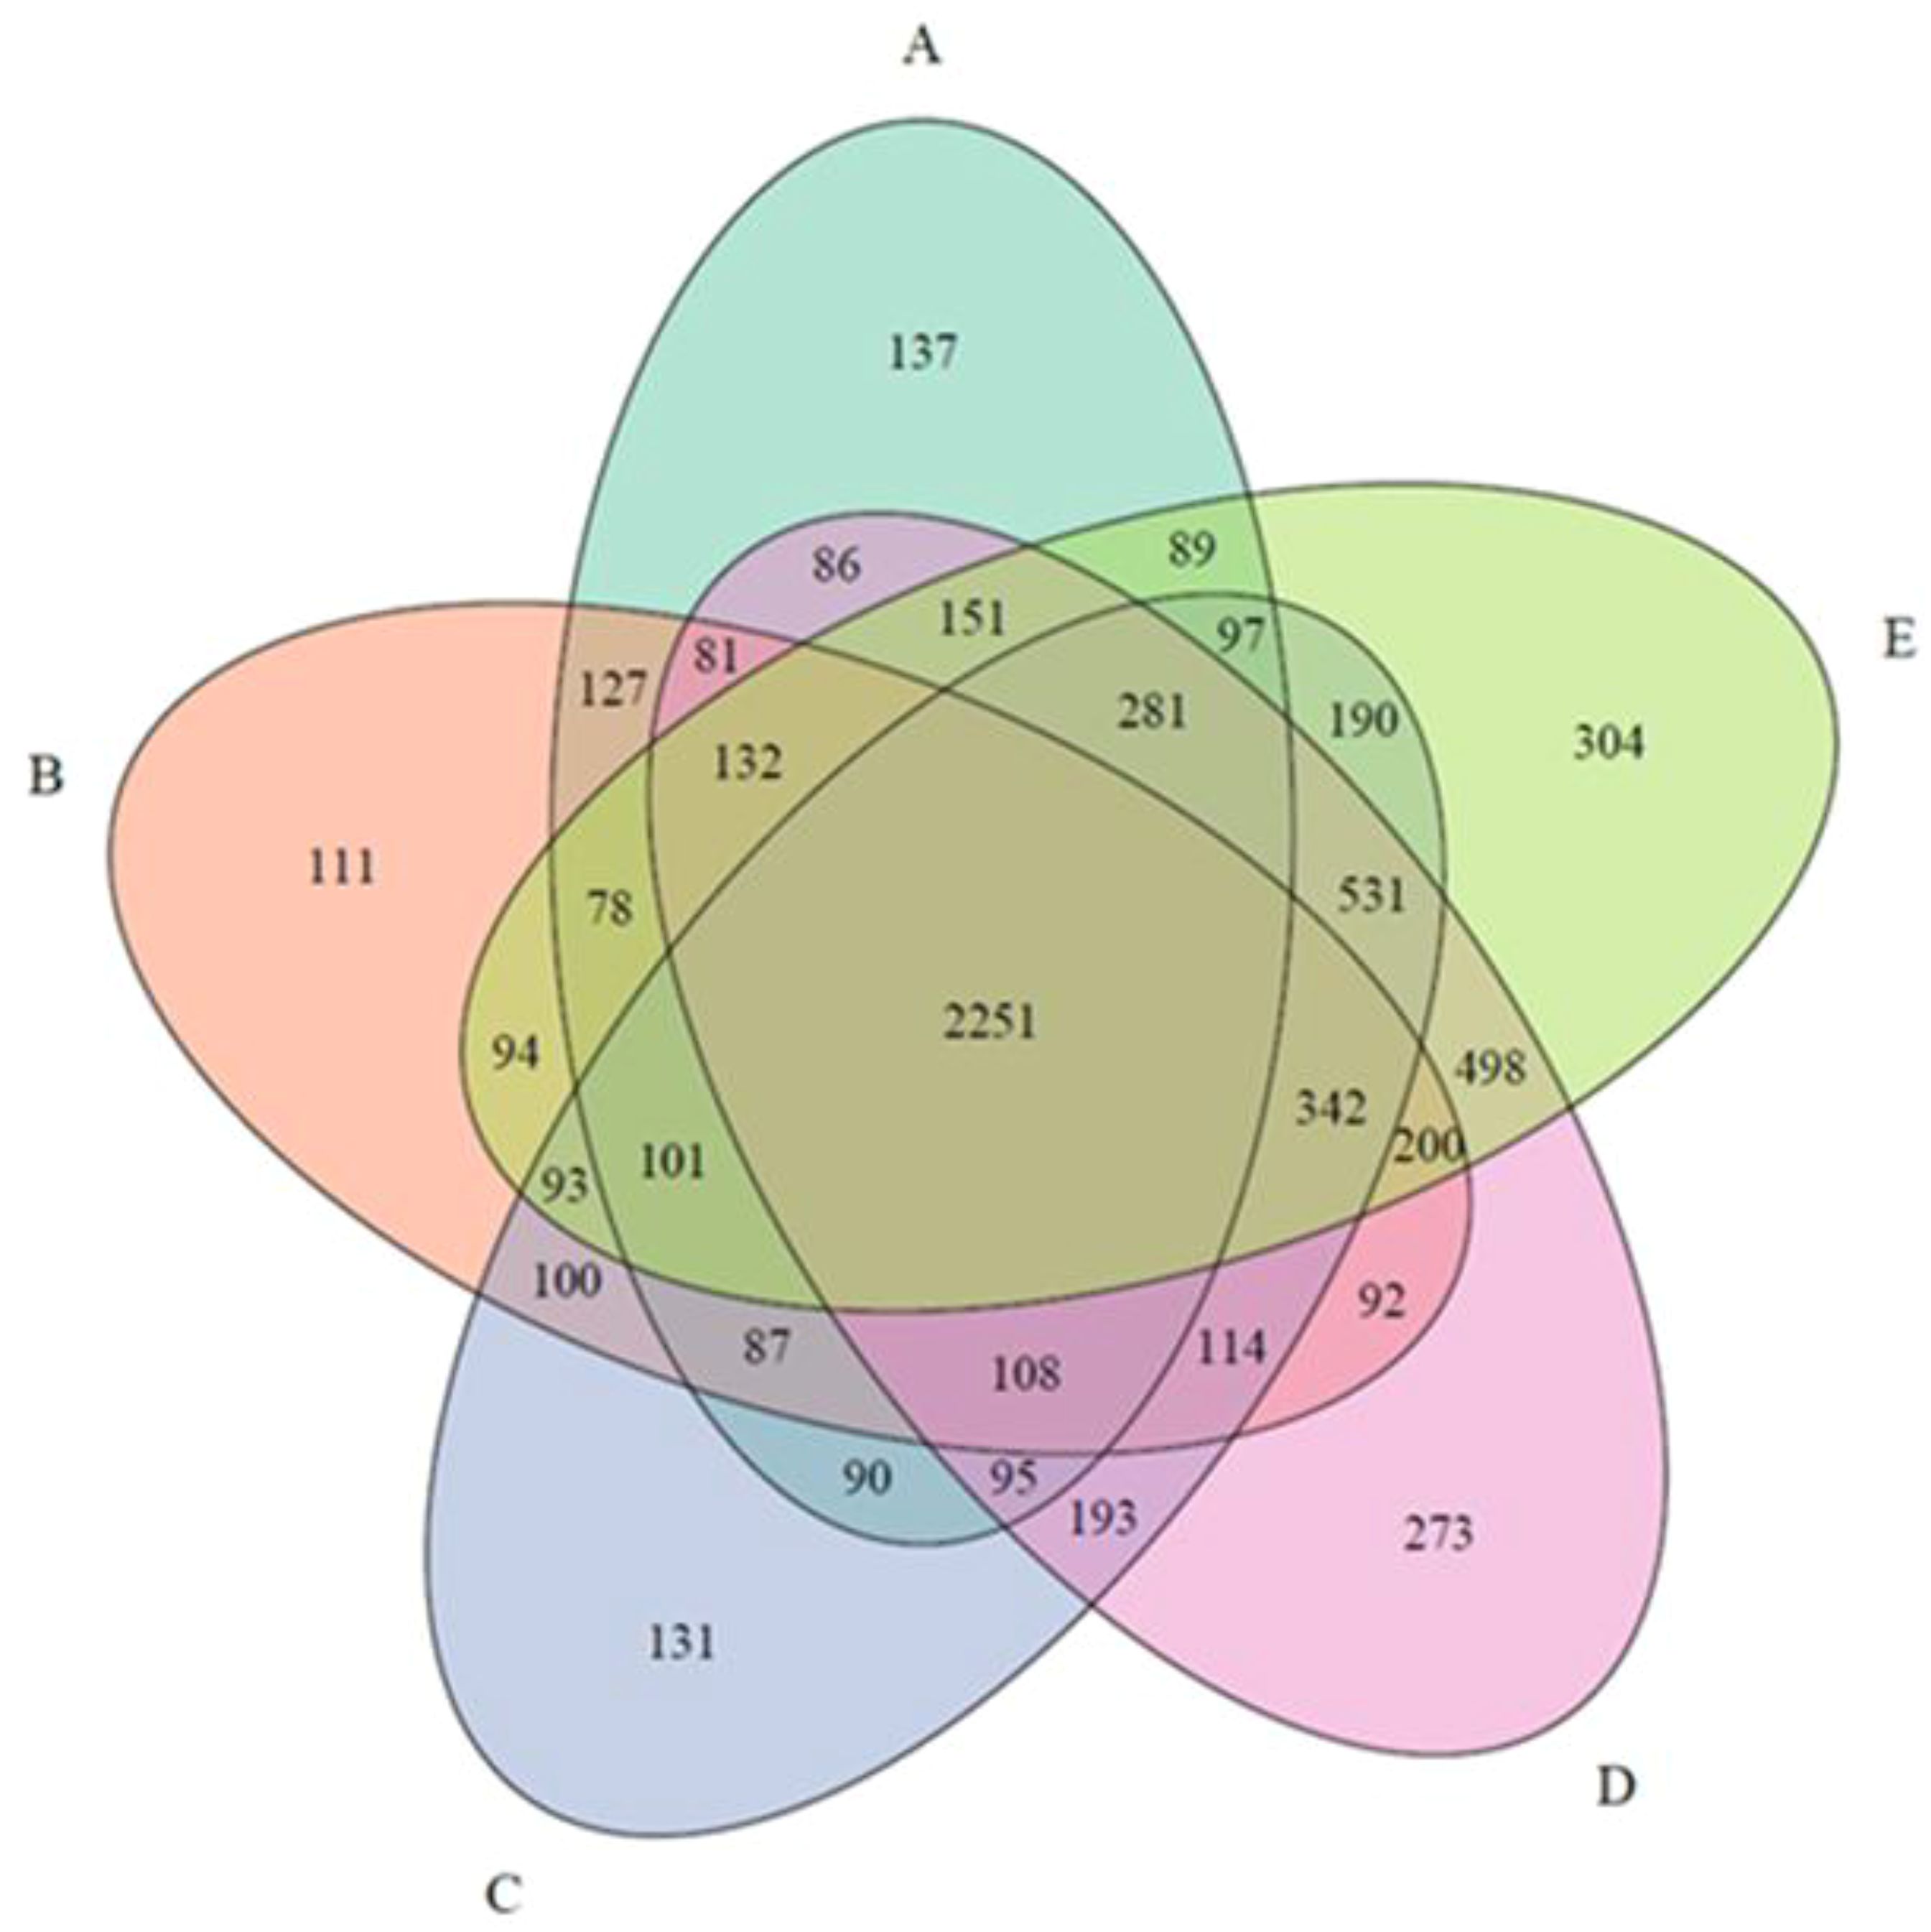
Figure 5. Venn diagram showing the number of shared OTUs among sampling sites.
Furthermore, sampling site E, localized surrounding the mariculture plant and closest to the coastal area, hosted the largest proportion of “site-endemic” OTUs (304 OTUs), while Site B, localized surrounding the mariculture plant and representing the closest to the dominant surface current exposure, hosted the lowest proportion (111 OTUs). The schematic intersection plot is provided in the Supplementary File S1.
3.2 Assessment of species relative abundance across sampling sites
After the analysis of diversity differences among sampling sites, we deepened the eukaryotic phytoplanktonic community composition in terms of relative abundance of all OTUs among the five sampling sites. The relative abundance of each OTU was measured through the quantification of the number of reads obtained from the sequencing and clustered in the same OTU, as visualized in Supplementary Figure S6.
A species proportion analysis was then performed considering the number of reads associated to each OTU annotated up to the species level as a proxy for the species’ relative abundance across the five sampling sites (Supplementary Figure S7). A subsample of the identified species, and specifically the species retrieved in the IOC-UNESCO Taxonomic Reference List of Harmful Micro Algae (Lundholm et al., 2009; Supplementary Table S5) was used to perform a further species proportion analysis to compare the relative abundance of such species in the five sampling sites (Figure 6).
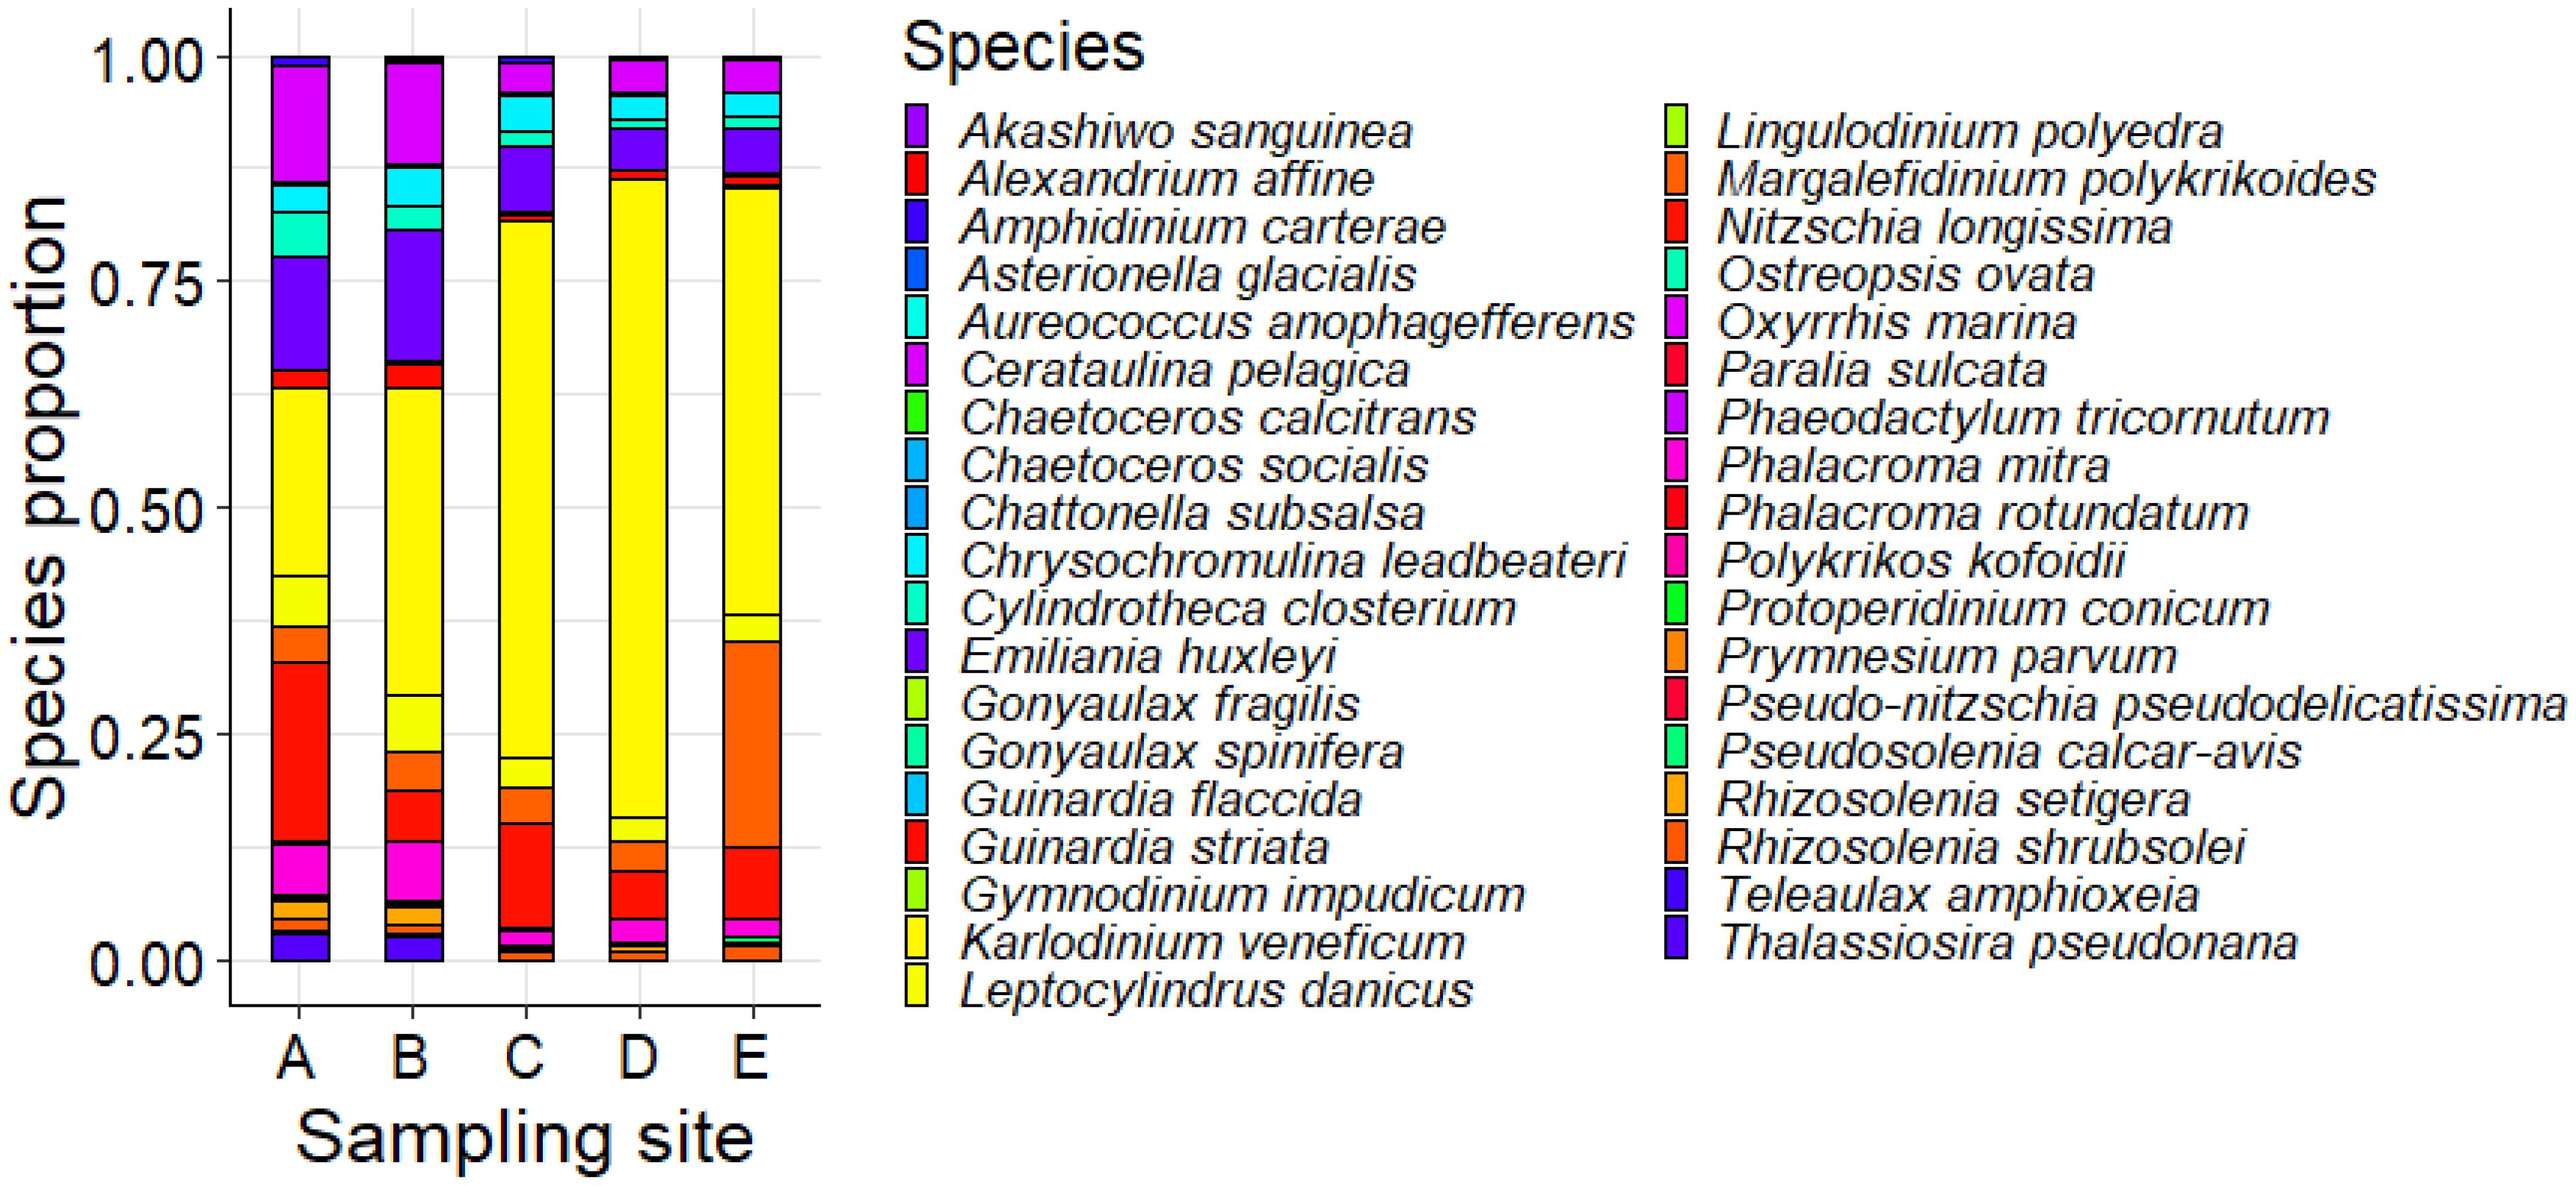
Figure 6. Potentially harmful species proportion across the five sampling sites according to the number of reads as a proxy for the species’ relative abundance.
The proportion analysis revealed some differences between sampling sites. These differences are mainly represented by the higher heterogeneity in species composition in sites A, B, and E with respect to sites C and D, where a remarked dominance of Karlodinium veneficum appears evident. Besides such differences, the proportionally most abundant potentially harmful species across the five sampling sites remain consistent, mainly represented by Ceratulina pelagica, Emilana huxleyi, Karlodinium veneficum, Margalefidinium polykrikoides, and Nitzschia longissima, which, despite representing a potential risk for the fish production, are common phytoplanktonic residents in the Mediterranean Sea. However, according to the proportion analysis conducted considering the entire dataset, the proportionally most abundant species across the five sampling sites are mainly represented by Algirosphaera robusta, Berkeleya hyalina, Cerataulina pelagica, and Cyclotella choctawhatcheeana, which are not reported as potentially harmful species (Lundholm et al., 2009).
3.3 Assessment of eukaryotic phytoplankton communities’ composition across sampling sites
The alpha diversity analyses highlighted a specific composition of eukaryotic phytoplankton communities across the five sampling sites. Hence, to investigate the distribution patterns of phytoplankton diversity across various sampling sites, we utilized the pairwise Bray-Curtis dissimilarity matrix and the non-metric multidimensional scaling (nMDS) ordination plot. These analytical tools help visualize and interpret the similarities and differences in community composition according to the relative quantification of OTUs and the proportion of OTUs shared across sampling sites and replicates. The results suggest a distribution of the phytoplankton diversity into three main communities: one localized around sampling sites A and B; one shared between sampling sites D and E; and one localized at sampling site C. (Figure 7).
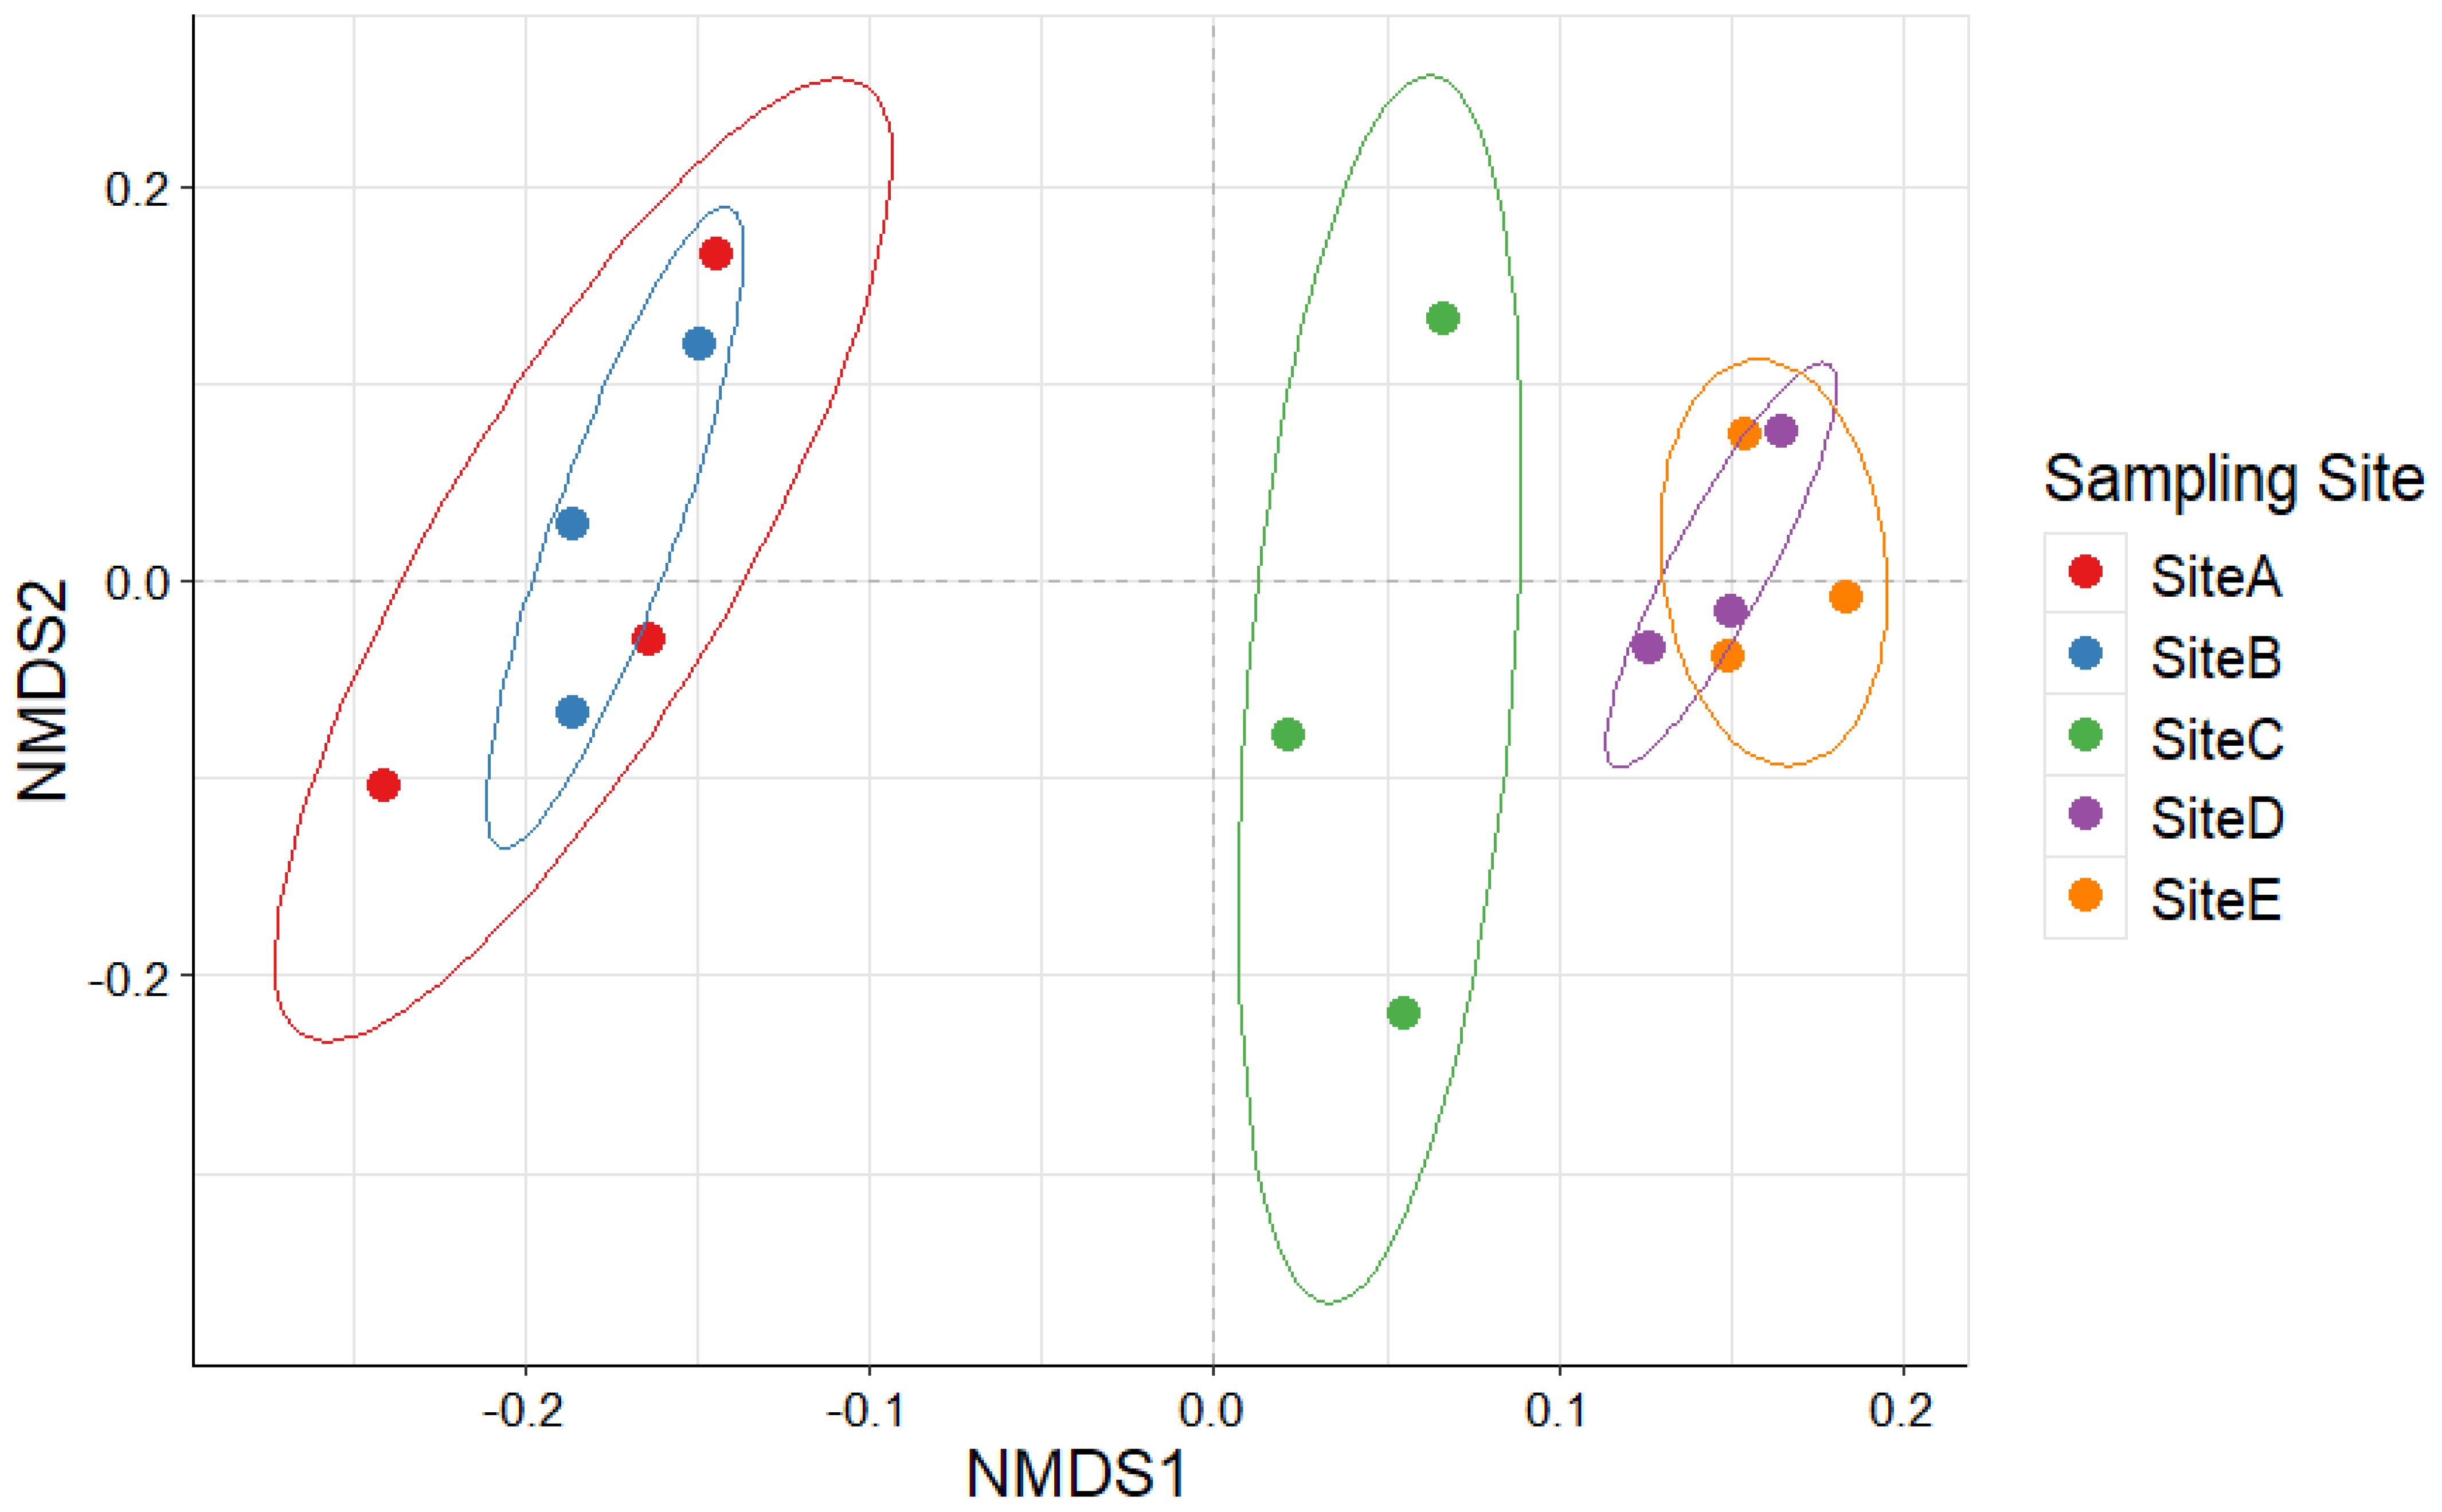
Figure 7. Non-metric multidimensional scaling (nMDS) obtained through the Bray-Curtis dissimilarity matrix based on the number of reads per OTU composition of the replicates collected in the study area.
To investigate the potential correlation between the dissimilarities obtained through the OTUs semi-quantitative analyses and the main abiotic drivers that characterize the environment under study, a constrained ordination was performed. Specifically, a Bray-Curtis distance-based Redundancy Analysis (db-RDA) was calculated (Figure 8). Ten environmental parameters were used as explanatory variables: Salinity (PSU), Total Dissolved Solids (PPT), RDO Concentration (mg/L), RDO Saturation (%Sat), Partial Pressure of Oxygen (Torr), pH, Turbidity (NTU), Temperature (°C), Chlorophyll-a Fluorescence (RFU), and Chlorophyll-a Concentration (µg/L). According to the two-way ANOVA calculated for each of the abiotic parameters, none of the explanatory variables emerged as significant (p values > 0.05), despite sites A and B appear to be characterized by slightly higher levels of chlorophyll-a and oxygen concentration, suggesting higher photosynthetic rates.
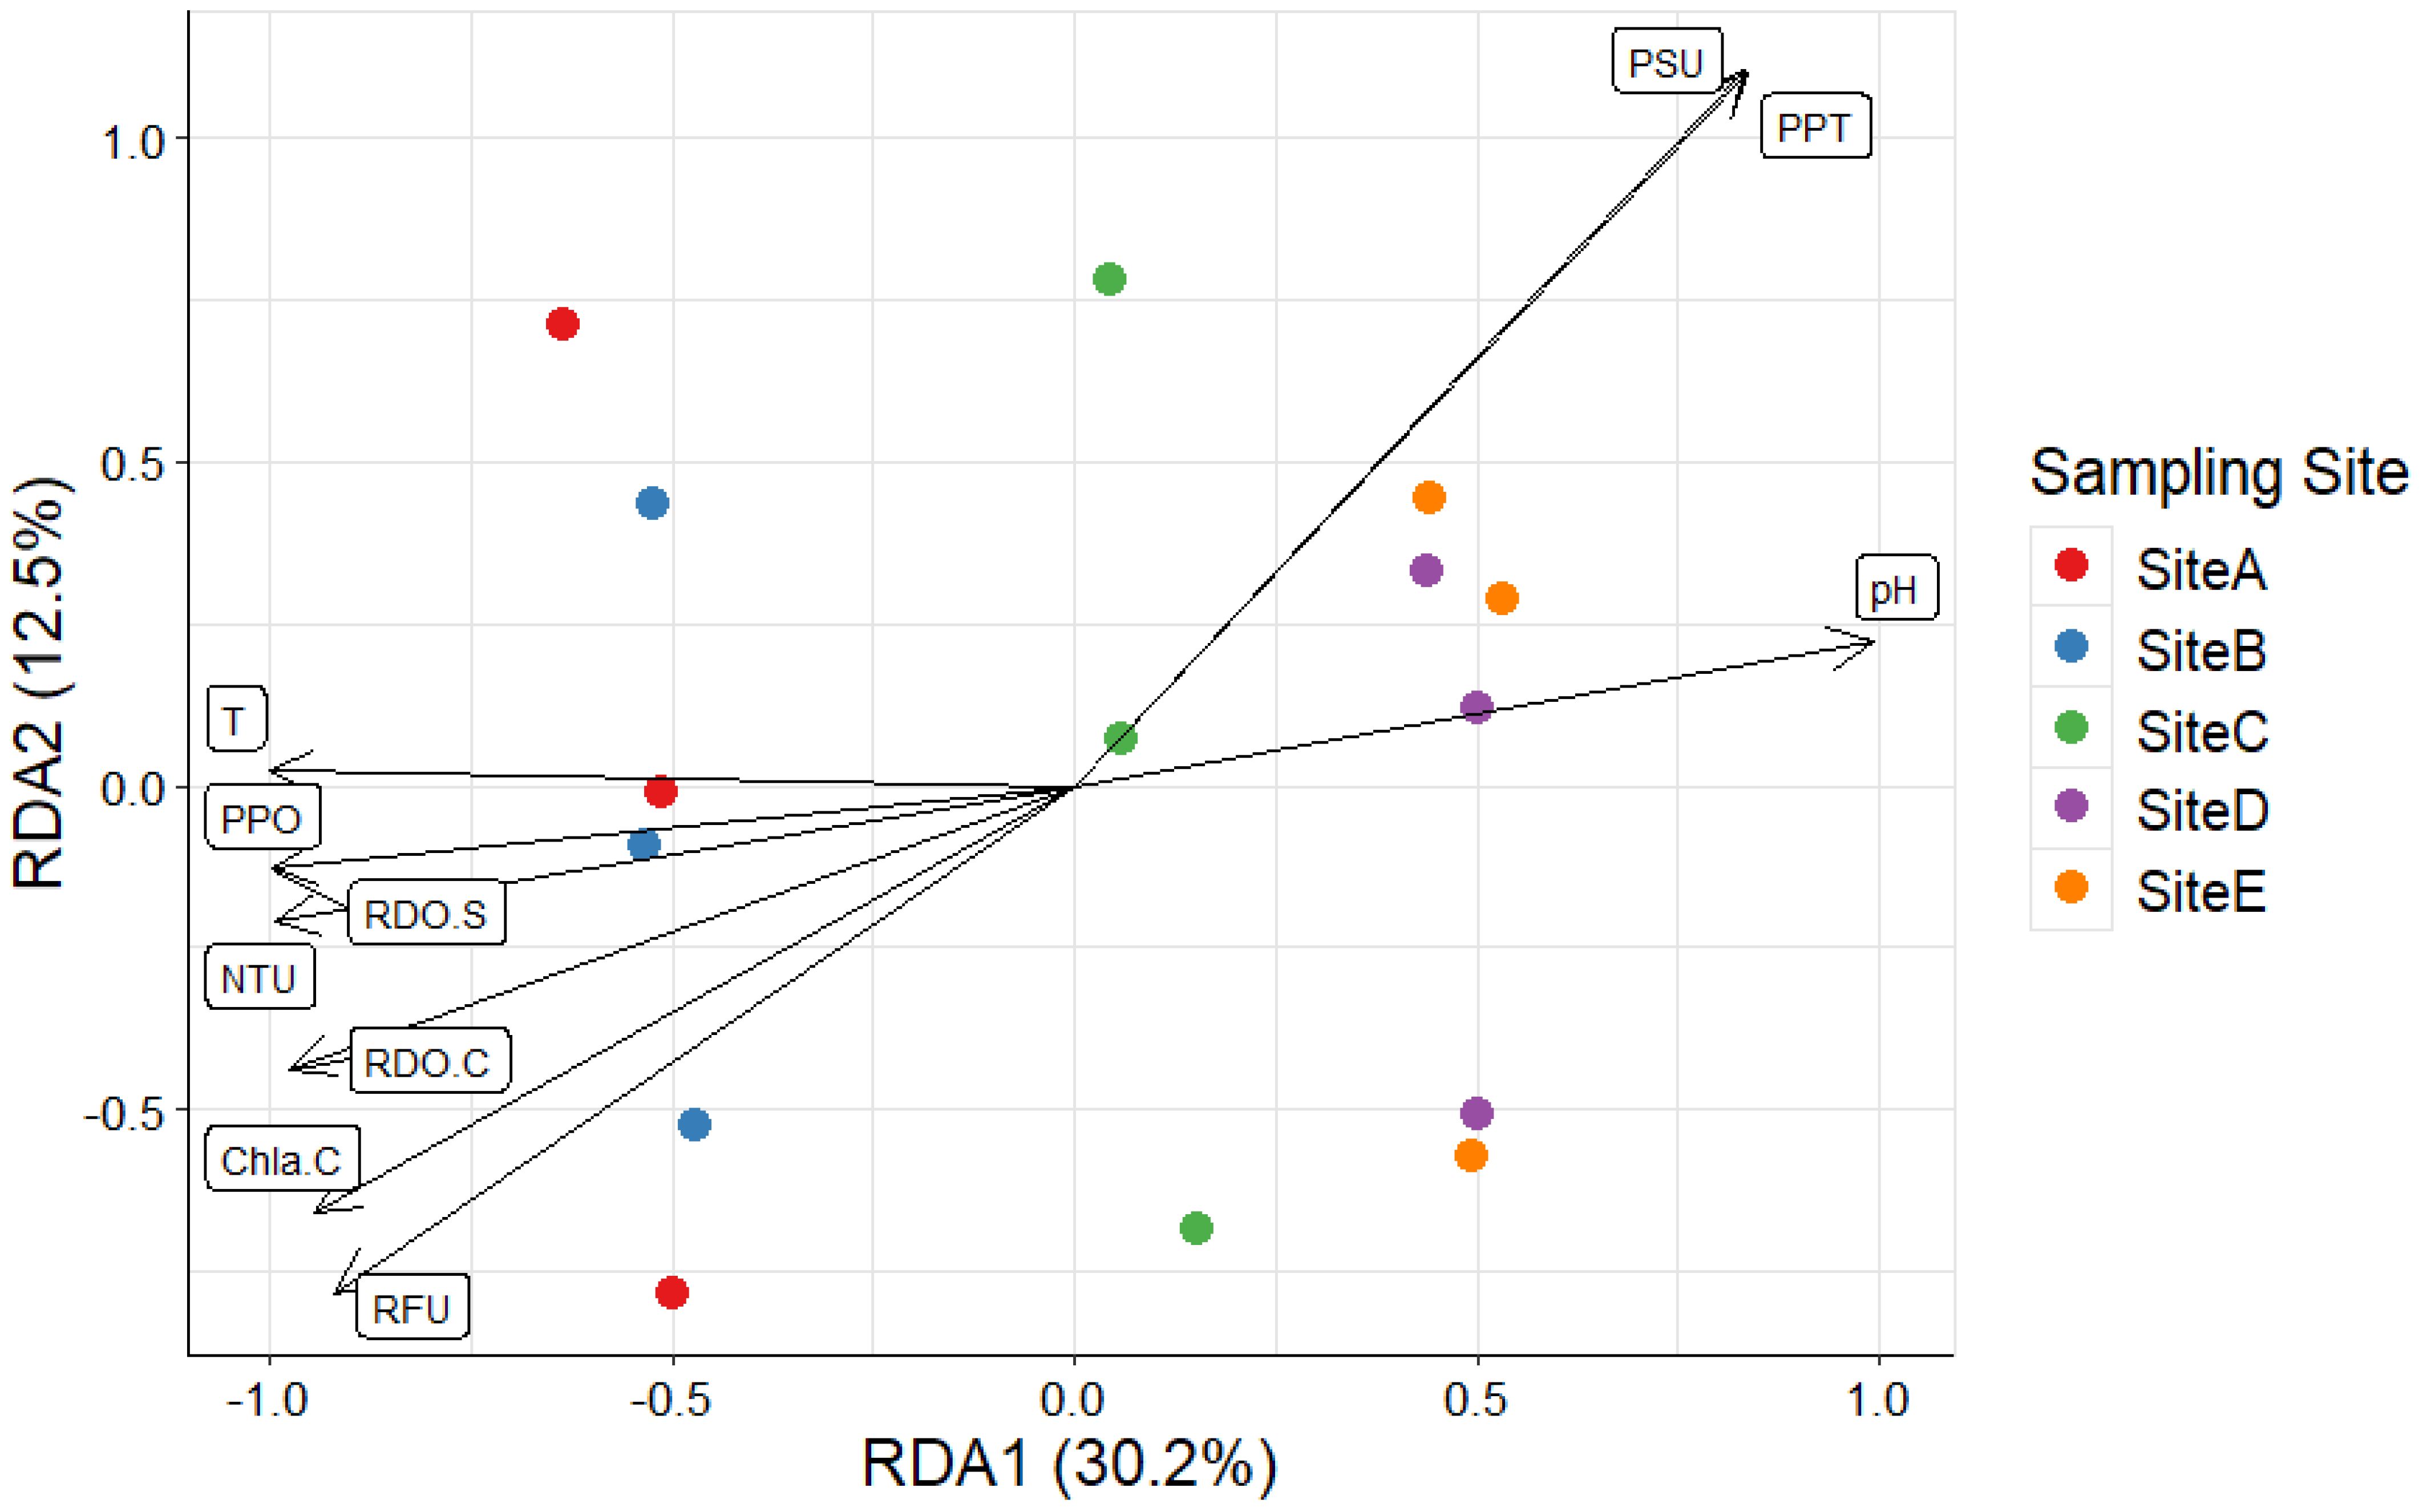
Figure 8. Bray–Curtis distance-based Redundancy Analysis (db-RDA) based on the number of reads per OTU composition and abiotic drivers identified in the replicates collected in the study area. PSU, Salinity; PPT, Total Dissolved Solids; RDO.C, RDO Concentration; RDO.S, RDO Saturation; PPO, Partial Pressure of Oxygen; NTU, Turbidity; T, Temperature; RFU, Chlorophyll-a Fluorescence; and Chla.C, Chlorophyll-a Concentration.
3.4 Potentially dangerous eukaryotic phytoplankton species: clues from the eDNA analysis
According to the proportion analysis displayed in Figure 6, eDNA metabarcoding results were able to identify some potentially harmful phytoplanktonic species (the most representative were Ceratulina pelagica, Emilana huxleyi, Karlodinium veneficum, Margalefidinium polykrikoides, and Nitzschia longissima). However, their relative abundance based on the number of reads is negligible if compared to the other identified species and to the overall diversity observed across the five sampling sites (Supplementary Figure S7).
Besides this, the potentially harmful Karlodinium veneficum was identified in all sampling sites, although in the direct vicinity of farming facility (Sampling Site A) it is underrepresented with respect to the other sampling sites and to the overall diversity observed in the area. The potentially ichthyotoxic Prymnesium parvum was identified too, although it is completely absent in the direct proximity of the facility’s fish stocks.
Overall, in all five sampling sites, the dominating proportion of phytoplanktonic species is highly heterogeneous, reflecting the absence of dominating potentially harmful taxa and highlighting the power of semi-quantitative investigations at the species level through eDNA metabarcoding results in coastal and marine areas.
4 Discussion
Given the ecological implications deriving from the economic activities carried out by humans in coastal and marine areas, it is essential to implement continuous monitoring of water quality and ecological indicators to ensure the environmental sustainability of these delicate socio-ecological systems. In light of this, the balance of phytoplankton communities represents a crucial index for the assessment of marine ecosystems ecological status.
The sustainable mariculture initiatives along the Mediterranean Sea, confirmed by the ICEA (Reg. CE 834¬/2007 and Reg. CE 889/2008) certification from the European Union, exemplify how leveraging distinctive hydrogeological features and reduced fish stock densities can foster sustainability in mariculture facilities. In this setting, the integration of mariculture with the eDNA-based biodiversity assessment and monitoring approaches strengthens an environmentally conscious production model. This strategy enables the observation of natural dynamics in novel ways, allowing for the early detection of changes that might disrupt ecological balance. The mariculture facility involved in this study stands out as a commendable model where the synergy of scientific knowledge, technological innovation, and environmental respect yields benefits for both production and ecosystem preservation.
This study represents the first experimental application of eDNA metabarcoding approaches to assess eukaryotic phytoplankton biodiversity across a mariculture facility, investigating distinct spatial patterns in community composition and providing valuable insights about the presence, abundance, and spatial distribution of potentially harmful phytoplankton species. The sampling season identified is subsequent to strong surface temperature anomalies occurring during the summer season of 2023, as reported in the publicly available databases provided by Copernicus. Such increased temperature conditions potentially increased the primary production in the presence of nutrients availability, allowing for a better monitoring of potential shifts in phytoplankton communities.
According to the observed results, 259 genera and 175 species were identified across the study area, thus demonstrating high species richness and phytoplankton biodiversity distributed across the mariculture facility displaying a certain degree of difference in community composition. More in detail, sampling site A, central with respect to the mariculture facility structure, displayed a reduced OTU richness, particularly among Dinophyceae, compared to peripheral sites C, D, and E. Alpha diversity estimations underscore the reliability of the number of reads per OTU as a proxy for inferring the relative abundance of OTUs identified in eDNA metabarcoding studies. Such validation allows for the use of the relative abundance proportions as a semi-quantitative parameter for alpha and beta diversity calculations in the context of coastal and marine biodiversity monitoring scenarios. The absence of significant differences in diversity estimations among the five sampling sites strongly confirms the statistical consistency of replicates in eDNA metabarcoding studies. Furthermore, such results highlight the absence of significant shifts in Shannon diversity among sampling sites within the context of the mariculture plant under study. The violin plot clearly shows a balanced symmetry across all five sampling sites, indicating existing natural variations in phytoplankton composition, not significantly related to the specific sampling site location within the mariculture plant. However, sampling site A exhibited the highest range extension, confirming greater variability in this location, likely attributable to its vicinity to mariculture cages. This proximity could potentially modify nutrient availability locally, probably depending also on factors such as current intensity. Moreover, the high proportion of shared OTUs among the five sampling sites further supports the consistency of eDNA studies, reinforcing the potential of molecular methods to accurately describe phytoplankton communities in diverse ecosystems. This includes environments ranging from extremely conserved conditions (Specchia et al., 2023) to ecosystems under human-use for production purposes, thereby enabling the evaluation of influences acting on ecological communities’ composition and dynamics.
The nMDS ordination further highlighted an aggregation of the eukaryotic phytoplankton communities into three clusters: one represented by sampling sites A and B, another at distal sampling sites (D and E), and a unique cluster at site C. Despite minor abiotic variations, represented by a slightly higher chlorophyll-a concentration and fluorescence, and oxygen saturation, close to the fish stocks, environmental drivers did not significantly explain compositional dissimilarities.
Notably, potentially harmful phytoplankton species (e.g., Karlodinium veneficum, Prymnesium parvum, Margelfidinium polykrikoides) were detected but at negligible abundances compared with the overall eukaryotic phytoplankton composition, suggesting minimal immediate risk to mariculture operations and human health. The minimal detection of potentially harmful species closest to the fish stocks underscores the facility’s success in maintaining ecological balance, likely facilitated by strong currents mitigating the potential localized eutrophication (MyOcean, Marine Copernicus data). This aligns with global efforts to locate areas suited to mariculture activities in hydrodynamically active regions to minimize the risk for environmental perturbations (Carballeira Braña et al., 2021; Morris et al., 2025; Ferreira, 2025). However, the persistence of K. veneficum across all sites, even though at low levels, confirms the need for constant monitoring, as this species can form ichthyotoxic blooms under shifting nutrient regimes (Place et al., 2012), and demonstrates the validity and reliability of eDNA-based monitoring plans for phytoplankton assemblages in the context of mariculture facilities.
The absence of significant shifts in eukaryotic phytoplankton composition and the negligible abundance of potentially harmful species demonstrate a high integration degree of the facility within the ecosystem landscape. A certain level of difference in the communities’ composition aligns with studies demonstrating spatial zonation in plankton communities near aquaculture systems, often linked to organic enrichment or hydrodynamic gradients (Camarena-Gómez et al., 2018). As an example, the reduced dinoflagellate diversity in the closest area to the facility’s center, coupled to the increased photosynthetic activity, suggested by the higher levels of chlorophyll-a and oxygen concentrations, may reflect competitive exclusion by fast-growing diatoms under higher availability conditions of dissolved organic material due to the presence of the fish stock (Spilling et al., 2018; Song et al., 2022). However, such variations did not demonstrate to significantly drive shifts in the phytoplankton community composition.
In this investigation, a total of 7,257 operational taxonomic units (OTUs) were identified through high-throughput sequencing of environmental DNA (eDNA) derived from Mediterranean Sea water samples. Of these, 1,301 OTUs (about 18%) were taxonomically annotated up to the species level using curated reference databases (e.g., SILVA). These observations align robustly with prior gap analyses of 18S ribosomal RNA (18S rRNA) barcode completeness in public repositories (Tzafesta et al., 2022). Specifically, in this previous analysis, a gap in reference sequences was quantified for approximately 40% of morphologically described phytoplankton species within the Mediterranean Sea, with pronounced gaps among diatoms (Bacillariophyceae) and dinoflagellates (Dinophyceae). Likely, the high gap between molecular and morphological taxon assignments arises from intrinsic challenges in traditional microscopy-based morphological identification of phytoplanktonic species, often due to the loss of diagnostic cellular structures during preservation, interspecific morphological convergence, and the prevalence of non-differentiated life stages (e.g., cysts). Despite gaps in the reference libraries, eDNA metabarcoding demonstrated remarkable efficacy in recovering spatially-related biodiversity patterns. The reliability of eDNA-based biodiversity assessments is underscored by its capacity to detect taxa even when reference databases are incomplete. This aligns with broader findings that eDNA surveys inherently reflect both biological reality and reference library gaps yet still represent reliable tools in capturing diversity (Seymour et al., 2021: Banerjee et al., 2022; Specchia et al., 2023; Cruz-Cano et al., 2024; Pinna et al., 2024). While database gaps remain a constraint for absolute species richness quantification, eDNA’s ability to resolve relative biodiversity patterns and ecological gradients remains unimpaired.
5 Conclusions
Overall, the results of this study confirm the potential reliability of eDNA metabarcoding in monitoring the presence, distribution and relative abundance proportion of eukaryotic phytoplankton communities’ assemblage and potentially harmful phytoplanktonic species in coastal marine ecosystems and, more specifically, in the close vicinity of fish production areas, where constant and efficient biomonitoring is essential. The overall elevated homogeneity among replicates validates the reliability of eDNA metabarcoding for monitoring phytoplankton dynamics. Furthermore, read counts provided robust relative abundance estimates, strengthening the potential efficiency of eDNA-based approaches in the assessment of harmful algal bloom (HAB) risks, particularly for low-abundance toxigenic phytoplankton taxa. Future prospects foresee the routine application of eDNA-based ecological monitoring in different ecosystems, as well as in the context of diverse socio-ecologic systems.
Data availability statement
The original contributions presented in the study are included in the article/Supplementary Material, further inquiries can be directed to Prof. VS at dmFsZXJpYS5zcGVjY2hpYUB1bmlzYWxlbnRvLml0.
Author contributions
FZ: Data curation, Formal analysis, Investigation, Software, Writing – original draft, Writing – review & editing. MV: Formal analysis, Writing – review & editing. MI: Formal analysis, Investigation, Writing – review & editing. VS: Conceptualization, Funding acquisition, Investigation, Resources, Supervision, Validation, Writing – original draft, Writing – review & editing. MP: Conceptualization, Formal analysis, Funding acquisition, Investigation, Methodology, Resources, Supervision, Validation, Visualization, Writing – original draft, Writing – review & editing.
Funding
The author(s) declare financial support was received for the research and/or publication of this article. This research was supported by the project titled “Shared BLUE knowledge and skills to sustain BIODIVERSITY in mariculture - BlueDiversity”, code: ITHR0200404, funded by Interreg Italy-Croatia 2021-2027 First Call to prof. Maurizio Pinna; by the project titled “A PROactive approach for COmmunities to enAble Societal Transformation - PRO-COAST, code: 101082327, funded by EU HORIZON-CL6-2022-BIODIV-01 to prof. Maurizio Pinna; by the RIPARTI project, code: a467414b, funded by Apulia Region (Italy) to prof. Valeria Specchia; by the project funded under the National Recovery and Resilience Plan (NRRP), Mission 4 Component 2 Investment 1.4 -Call for tender No. 3138 of 16 December 2021, rectified by Decree n. 3175 of 18 December 2021 of the Italian Ministry of University and Research funded by the European Union – NextGenerationEU. Project code CN_00000033, Concession Decree No. 1034 of 17 June 2022 adopted by the Italian Ministry of University CUP D33C22000960007, project title: “National Biodiversity Future Center (NBFC)” and supporting fellowship of dr Francesco Zangaro.
Acknowledgments
We thank Dr. Aldo Reho, CEO of Rehomare Srl, and Dr. Stefano Cassano, biologist at Rehomare Srl, for their logistical support and for making the company and its resources available for the sampling activities.
Conflict of interest
The authors declare that the research was conducted in the absence of any commercial or financial relationships that could be construed as a potential conflict of interest.
Generative AI statement
The author(s) declare that no Generative AI was used in the creation of this manuscript.
Any alternative text (alt text) provided alongside figures in this article has been generated by Frontiers with the support of artificial intelligence and reasonable efforts have been made to ensure accuracy, including review by the authors wherever possible. If you identify any issues, please contact us.
Publisher’s note
All claims expressed in this article are solely those of the authors and do not necessarily represent those of their affiliated organizations, or those of the publisher, the editors and the reviewers. Any product that may be evaluated in this article, or claim that may be made by its manufacturer, is not guaranteed or endorsed by the publisher.
Supplementary material
The Supplementary Material for this article can be found online at: https://www.frontiersin.org/articles/10.3389/fmars.2025.1688716/full#supplementary-material
References
Anderson D. M., Cembella A. D., and Hallegraeff G. M. (2012). Progress in understanding harmful algal blooms: paradigm shifts and new technologies for research, monitoring, and management. Annu. Rev. Mar. Sci. 4, 143–176. doi: 10.1146/annurev-marine-120308-081121
Anderson D. M., Fensin E., Gobler C. J., Hoeglund A. E., Hubbard K. A., Kulis D. M., et al. (2021). Marine harmful algal blooms (HABs) in the United States: History, current status and future trends. Harmful Algae 102, 101975. doi: 10.1016/j.hal.2021.101975
Antich A., Palacín C., Cebrian E., Golo R., Wangensteen O. S., and Turon X. (2021). Marine biomonitoring with eDNA: Can metabarcoding of water samples cut it as a tool for surveying benthic communities? Mol. Ecol. 30, 3175–3188. doi: 10.1111/mec.15641
Apothéloz-Perret-Gentil L., Bouchez A., Cordier T., Cordonier A., Guéguen J., Rimet F., et al. (2021). Monitoring the ecological status of rivers with diatom eDNA metabarcoding: A comparison of taxonomic markers and analytical approaches for the inference of a molecular diatom index. Mol. Ecol. 30, 2959–2968. doi: 10.1111/mec.15646
Baker K. G. and Geider R. J. (2021). Phytoplankton mortality in a changing thermal seascape. Glob. Change Biol. 27, 5253–5261. doi: 10.1111/gcb.15772
Bálint M., Tumusiime J., Nakintu J., Baranski D., Schardt L., Romahn J., et al. (2024). Environmental DNA barcoding reveals general biodiversity patterns in the large tropical rift Lake Albert. Sci. Total Environ. 957, 177308. doi: 10.1016/j.scitotenv.2024.177308
Banerjee P., Stewart K. A., Dey G., Antognazza C. M., Sharma R. K., Maity J. P., et al. (2022). Environmental DNA analysis as an emerging non-destructive method for plant biodiversity monitoring: a review. AoB Plants 14, plac031. doi: 10.1093/aobpla/plac031
Bohmann K., Evans A., Gilbert M. T. P., Carvalho G. R., Creer S., Knapp M., et al. (2014). Environmental DNA for wildlife biology and biodiversity monitoring. Trends Ecol. Evol. 29, 358–367. doi: 10.1016/j.tree.2014.04.003
Bolyen E., Rideout J. R., Dillon M. R., Bokulich N. A., Abnet C. C., Al-Ghalith G. A., et al. (2019). Reproducible, interactive, scalable and extensible microbiome data science using QIIME 2. Nat. Biotechnol. 37, 852–857. doi: 10.1038/s41587-019-0209-9
Bose M., Wu C., Pankow J. S., Demerath E. W., Bressler J., Fornage M., et al. (2014). Evaluation of microarray-based DNA methylation measurement using technical replicates: the Atherosclerosis Risk In Communities (ARIC) Study. BMC Bioinform. 15, 1–10. doi: 10.1186/1471-2105-15-312
Camarena-Gómez M. T., Lipsewers T., Piiparinen J., Eronen-Rasimus E., Perez-Quemaliños D., Hoikkala L., et al. (2018). Shifts in phytoplankton community structure modify bacterial production, abundance and community composition. Aquat. Microb. Ecol. 81, 149–170. doi: 10.3354/ame01868
Carballeira Braña C. B., Cerbule K., Senff P., and Stolz I. K. (2021). Towards environmental sustainability in marine finfish aquaculture. Front. Mar. Sci. 8, 666662. doi: 10.3389/fmars.2021.666662
Chen H. and Boutros P. C. (2011). VennDiagram: a package for the generation of highly-customizable Venn and Euler diagrams in R. BMC Bioinf. 12, 35. doi: 10.1186/1471-2105-12-35
Conway J. R., Lex A., and Gehlenborg N. (2017). UpSetR: an R package for the visualization of intersecting sets and their properties. Bioinformatics 33, 2938–2940. doi: 10.1093/bioinformatics/btx364
Couton M., Lévêque L., Daguin-Thiébaut C., Comtet T., and Viard F. (2022). Water eDNA metabarcoding is effective in detecting non-native species in marinas, but detection errors still hinder its use for passive monitoring. Biofouling 38, 367–383. doi: 10.1080/08927014.2022.2075739
Cruz-Cano R., Kolb M., Saldaña-Vázquez R. A., Bretón-Deval L., Cruz-Cano N., and Aldama-Cervantes A. (2024). Existing evidence on the use of environmental DNA as an operational method for studying rivers: a systematic map and thematic synthesis. Environ. Evid. 13, 2. doi: 10.1186/s13750-024-00325-6
Del Fabbro C., Scalabrin S., Morgante M., and Giorgi F. M. (2013). An extensive evaluation of read trimming effects on Illumina NGS data analysis. PloS One 8, e85024. doi: 10.1371/journal.pone.0085024
De Vargas C., Audic S., Henry N., Decelle J., Mahé F., Logares R., et al. (2015). Eukaryotic plankton diversity in the sunlit ocean. Science 348, 1261605. doi: 10.1126/science.1261605
Djurhuus A., Pitz K., Sawaya N. A., Rojas-Márquez J., Michaud B., Montes E., et al. (2018). Evaluation of marine zooplankton community structure through environmental DNA metabarcoding. Limnol. Oceanogr. Methods 16, 209–221. doi: 10.1002/lom3.10237
Elbrecht V. and Steinke D. (2019). Scaling up DNA metabarcoding for freshwater macrozoobenthos monitoring. Freshw. Biol. 64, 380–387. doi: 10.1111/fwb.13220
Ferreira J. G. (2025). Aquaculture carrying capacity estimates show that major African lakes and marine waters could sustainably produce 10–11 Mt of fish per year. Nat. Food. 6, 446–455. doi: 10.1038/s43016-025-01114-1
Fox J. and Weisberg S. (2018). Visualizing fit and lack of fit in complex regression models with predictor effect plots and partial residuals. J. Stat. Software 87, 1–27. doi: 10.18637/jss.v087.i09
Gargan L. M., Brooks P. R., Vye S. R., Ironside J. E., Jenkins S. R., Crowe T. P., et al. (2022). The use of environmental DNA metabarcoding and quantitative PCR for molecular detection of marine invasive non-native species associated with artificial structures. Biol. Invasions 24, 635–648. doi: 10.1007/s10530-021-02672-8
Gastwirth J. L., Gel Y. R., and Miao W. (2009). The impact of Levene’s test of equality of variances on statistical theory and practice. Statist. Sci. 24, 343–360. doi: 10.1214/09-STS301
González-Estrada E., Villaseñor J. A., and Acosta-Pech R. (2022). Shapiro-Wilk test for multivariate skew-normality. Comput. Stat. 37, 1985–2001. doi: 10.1007/s00180-021-01188-y
Grattan L. M., Holobaugh S., and Morris J. G. Jr (2016). Harmful algal blooms and public health. Harmful Algae 57, 2–8. doi: 10.1016/j.hal.2016.05.003
Haderlé R., Bouveret L., Chazal J., Girardet J., Iglésias S., Lopez P. J., et al. (2024). eDNA-based survey of the marine vertebrate biodiversity off the west coast of Guadeloupe (French West Indies). Biodiv. Data Jou. 12, e125348. doi: 10.3897/BDJ.12.e125348
Hakimzadeh A., Abdala Asbun A., Albanese D., Bernard M., Buchner D., Callahan B., et al. (2024). A pile of pipelines: An overview of the bioinformatics software for metabarcoding data analyses. Mol. Ecol. Res. 24, e13847. doi: 10.1111/1755-0998.13847
He X., Gilmore S. R., Sutherland T. F., Hajibabaei M., Miller K. M., Westfall K. M., et al. (2021). Biotic signals associated with benthic impacts of salmon farms from eDNA metabarcoding of sediments. Mol. Ecol. 30, 3158–3174. doi: 10.1111/mec.15814
Hebert P. D., Ratnasingham S., and De Waard J. R. (2003). Barcoding animal life: cytochrome c oxidase subunit 1 divergences among closely related species. Proc. R. Soc Lond. Ser. B: Biol. Sci. 270, S96–S99. doi: 10.1098/rsbl.2003.0025
Hickling S., Murphy J., Cox C., Mynott S., Birbeck T., and Wright S. (2023). Benthic invertebrate biodiversity enhancement with reef cubes®, evidenced by environmental DNA analysis of sediment samples. Ecol. Eng. 195, 107064. doi: 10.1016/j.ecoleng.2023.107064
Hupało K., Schmidt S., Macher T. H., Weiss M., and Leese F. (2022). Fresh insights into Mediterranean biodiversity: environmental DNA reveals spatio-temporal patterns of stream invertebrate communities on Sicily. Hydrobiologia 849, 155–173. doi: 10.1007/s10750-021-04718-3
Ionan A. C., Polley M. Y. C., McShane L. M., and Dobbin K. K. (2014). Comparison of confidence interval methods for an intra-class correlation coefficient (ICC). BMC. Med. Res. Methodol. 14, 1–11. doi: 10.1186/1471-2288-14-121
Jeunen G. J., Lipinskaya T., Gajduchenko H., Golovenchik V., Moroz M., Rizevsky V., et al. (2022). (eDNA) metabarcoding surveys show evidence of non-indigenous freshwater species invasion to new parts of Eastern Europe. Metabarcoding Metagenom. 6, e68575. doi: 10.3897/mbmg.6.e68575
Ji F., Han D., Yan L., Yan S., Zha J., and Shen J. (2022). Assessment of benthic invertebrate diversity and river ecological status along an urbanized gradient using environmental DNA metabarcoding and a traditional survey method. Sci. Tot. Env. 806, 150587. doi: 10.1016/j.scitotenv.2021.150587
Kermarrec L., Franc A., Rimet F., Chaumeil P., Frigerio J. M., Humbert J. F., et al. (2014). A next-generation sequencing approach to river biomonitoring using benthic diatoms. Freshw. Sci. 33, 349–363. doi: 10.1086/675079
Kozak M. and Piepho H. P. (2018). What's normal anyway? Residual plots are more telling than significance tests when checking ANOVA assumptions. J. Agron. Crop Sci. 204, 86–98. doi: 10.1111/jac.12220
Kress W. J. and Erickson D. L. (2007). A two-locus global DNA barcode for land plants: the coding rbcL gene complements the non-coding trnH-psbA spacer region. PloS One 2, e508. doi: 10.1371/journal.pone.0000508
Leduc N., Lacoursière-Roussel A., Howland K. L., Archambault P., Sevellec M., Normandeau E., et al. (2019). Comparing eDNA metabarcoding and species collection for documenting Arctic metazoan biodiversity. Environ. DNA 1, 342–358. doi: 10.1002/edn3.35
Lundholm N., Churro C., Escalera L., Fraga S., Hoppenrath M., Iwataki M., et al. (2009). IOC-UNESCO Taxonomic Reference List of Harmful Micro Algae. Available online at: https://www.marinespecies.org/hab (Accessed June 10, 2025).
Mächler E., Deiner K., Spahn F., and Altermatt F. (2016). Fishing in the water: effect of sampled water volume on environmental DNA-based detection of macroinvertebrates. Env. Sci. Tech. 50, 305–312. doi: 10.1021/acs.est.5b04188
Macé B., Hocdé R., Marques V., Guerin P. E., Valentini A., Arnal V., et al. (2022). Evaluating bioinformatics pipelines for population-level inference using environmental DNA. Environ. DNA 4, 674–686. doi: 10.1002/edn3.269
Magoč T. and Salzberg S. L. (2011). FLASH: fast length adjustment of short reads to improve genome assemblies. Bioinformatics 27, 2957–2963. doi: 10.1093/bioinformatics/btr507
Maneveldt G. and Keats D. (2003). Chromista. eLS. Available online at: http://hdl.handle.net/10566/1234 (Accessed July 22, 2025).
Martin M. (2011). Cutadapt removes adapter sequences from high-throughput sequencing reads. EMBnet. Jou. 17, 10–12. doi: 10.14806/ej.17.1.200
Morris J. A. Jr., Wickliffe L. C., Theuerkauf S. J., Shamaskin A. C., Jossart J., Randall A. L., et al. (2025). Marine spatial planning and best siting practices to achieve an ecosystem approach to aquaculture in the United States. Bull. Mar. Sci. 101 (2), 861–880. doi: 10.5343/bms.2024.0044
Oksanen J., Blanchet F. G., Kindt R., Legendre P., Minchin P. R., O’hara R. B., et al. (2014). Vegan: Community Ecology Package. R Package Version 2.2-0. Available online at: http://CRAN.Rproject.org/package=vegan (Accessed February 20, 2025).
Pawlowski J., Esling P., Lejzerowicz F., Cedhagen T., and Wilding T. A. (2014). Environmental monitoring through protist next-generation sequencing metabarcoding: Assessing the impact of fish farming on benthic foraminifera communities. Mol. Ecol. Res. 14, 1129–1140. doi: 10.1111/1755-0998.12261
Pawlowski J., Esling P., Lejzerowicz F., Cordier T., Visco J. A., Martins C. I., et al. (2016a). Benthic monitoring of salmon farms in Norway using foraminiferal metabarcoding. Aquac. Environ. Interact. 8, 371–386. doi: 10.3354/aei00182
Pawlowski J., Kelly-Quinn M., Altermatt F., Apothéloz-Perret-Gentil L., Beja P., Boggero A., et al. (2018). The future of biotic indices in the ecogenomic era: Integrating (e) DNA metabarcoding in biological assessment of aquatic ecosystems. Sci. Tot. Env. 637, 1295–1310. doi: 10.1016/j.scitotenv.2018.05.002
Pawlowski J., Lejzerowicz F., Apotheloz-Perret-Gentil L., Visco J., and Esling P. (2016b). Protist metabarcoding and environmental biomonitoring: time for change. Eur. J. Protistol. 55, 12–25. doi: 10.1016/j.ejop.2016.02.003
Peng S., Wang L., Ma Y., Ye L., Hou C., Liu Y., et al. (2023). Application of environmental DNA metabarcoding and quantitative PCR to detect blooming jellyfish in a temperate bay of northern China. Ecol. Evol. 13, e10669. doi: 10.1002/ece3.10669
Pinna M., Zangaro F., and Specchia V. (2024). Assessing benthic macroinvertebrate communities’ spatial heterogeneity in Mediterranean transitional waters through eDNA metabarcoding. Sci. Rep. 14, 17890. doi: 10.1038/s41598-024-69043-w
Place A. R., Bowers H. A., Bachvaroff T. R., Adolf J. E., Deeds J. R., and Sheng J. (2012). Karlodinium veneficum—The little dinoflagellate with a big bite. Harmful Algae 14, 179–195. doi: 10.1016/j.hal.2011.10.021
Pleil J. D. (2016). QQ-plots for assessing distributions of biomarker measurements and generating defensible summary statistics. J. Breath Res. 10, 035001. doi: 10.1088/1752-7155/10/3/035001
Pleil J. D., Wallace M. A. G., Stiegel M. A., and Funk W. E. (2018). Human biomarker interpretation: the importance of intra-class correlation coefficients (ICC) and their calculations based on mixed models, ANOVA, and variance estimates. J. Toxicol. Environ. Health Part B 21, 161–180. doi: 10.1080/10937404.2018.1490128
Pont D., Meulenbroek P., Bammer V., Dejean T., Erős T., Jean P., et al. (2023). Quantitative monitoring of diverse fish communities on a large scale combining eDNA metabarcoding and qPCR. Mol. Ecol. Res. 23, 396–409. doi: 10.1111/1755-0998.13715
Reinholdt Jensen M., Egelyng Sigsgaard E., Agersnap S., Jessen Rasmussen J., Baattrup-Pedersen A., Wiberg-Larsen P., et al. (2021). Seasonal turnover in community composition of stream-associated macroinvertebrates inferred from freshwater environmental DNA metabarcoding. Environ. DNA 3, 861–876. doi: 10.1002/edn3.193
Rivera S. F., Vasselon V., Bouchez A., and Rimet F. (2023). eDNA metabarcoding from aquatic biofilms allows studying spatial and temporal fluctuations of fish communities from Lake Geneva. Environ. DNA 5, 570–581. doi: 10.1002/edn3.413
Rognes T., Flouri T., Nichols B., Quince C., and Mahé F. (2016). VSEARCH: a versatile open source tool for metagenomics. PeerJ 4, e2584. doi: 10.7717/peerj.2584
Rossouw E. I., Landschoff J., Ndhlovu A., Neef G., Miya M., Courtaillac K. L., et al. (2024). Detecting kelp-forest associated metazoan biodiversity with eDNA metabarcoding. Biodivers. J. 3, 4. doi: 10.1038/s44185-023-00033-3
Sayago A. and Asuero A. G. (2004). Fitting straight lines with replicated observations by linear regression: Part II. Testing for homogeneity of variances. Crit. Rev. Anal. Chem. 34, 133–146. doi: 10.1080/10408340490888599
Seymour M., Edwards F. K., Cosby B. J., Bista I., Scarlett P. M., Brailsford F. L., et al. (2021). Environmental DNA provides higher resolution assessment of riverine biodiversity and ecosystem function via spatio-temporal nestedness and turnover partitioning. Commun. Biol. 4, 512. doi: 10.1038/s42003-021-02031-2
Shatz I. (2024). Assumption-checking rather than (just) testing: The importance of visualization and effect size in statistical diagnostics. Behav. Res. Methods 56, 826–845. doi: 10.3758/s13428-023-02072-x
Sinniger F., Pawlowski J., Harii S., Gooday A. J., Yamamoto H., Chevaldonné P., et al. (2016). Worldwide analysis of sedimentary DNA reveals major gaps in taxonomic knowledge of deep-sea benthos. Front. Mar. Sci. 3, 92. doi: 10.3389/fmars.2016.00092
Song Y., Guo Y., Liu H., Zhang G., Zhang X., Thangaraj S., et al. (2022). Water quality shifts the dominant phytoplankton group from diatoms to dinoflagellates in the coastal ecosystem of the Bohai Bay. Mar. Pollut. Bull. 183, 114078. doi: 10.1016/j.marpolbul.2022.114078
Specchia V., Saccomanno B., Zangaro F., Tzafesta E., and Pinna M. (2022). Exploring the biodiversity of a European Natura 2000 Mediterranean lagoon through eDNA metabarcoding. Diversity 14, 991. doi: 10.3390/d14110991
Specchia V., Zangaro F., Tzafesta E., Saccomanno B., Vadrucci M. R., and Pinna M. (2023). Environmental DNA detects biodiversity and ecological features of phytoplankton communities in Mediterranean transitional waters. Sci. Rep. 13, 15192. doi: 10.1038/s41598-023-42389-3
Spilling K., Olli K., Lehtoranta J., Kremp A., Tedesco L., Tamelander T., et al. (2018). Shifting diatom—dinoflagellate dominance during spring bloom in the Baltic Sea and its potential effects on biogeochemical cycling. Front. Mar. Sci. 5, 327. doi: 10.3389/fmars.2018.00327
Stoeck T., Bass D., Nebel M., Christen R., Jones M. D., Breiner H. W., et al. (2010). Multiple marker parallel tag environmental DNA sequencing reveals a highly complex eukaryotic community in marine anoxic water. Mol. Ecol. 19, 21–31. doi: 10.1111/j.1365-294X.2009.04480.x
Stoeck T., Katzenmeier S. N., Breiner H. W., and Rubel V. (2024). Nanopore duplex sequencing as an alternative to Illumina MiSeq sequencing for eDNA-based biomonitoring of coastal aquaculture impacts. Metabarcoding Metagenom. 8, 30. doi: 10.3897/mbmg.8.121817
Taberlet P., Coissac E., Pompanon F., Brochmann C., and Willerslev E. (2012). Towards next-generation biodiversity assessment using DNA metabarcoding. Mol. Ecol. 21, 2045–2050. doi: 10.1111/j.1365-294X.2012.05470.x
Tragin M. and Vaulot D. (2018). Green microalgae in marine coastal waters: The Ocean Sampling Day (OSD) dataset. Sci. Rep. 8, 14020. doi: 10.1038/s41598-018-32338-w
Turon M., Nygaard M., Guri G., Wangensteen O. S., and Præbel K. (2022). Fine-scale differences in eukaryotic communities inside and outside salmon aquaculture cages revealed by eDNA metabarcoding. Front. Genet. 13, 957251. doi: 10.3389/fgene.2022.957251
Tzafesta E., Saccomanno B., Zangaro F., Vadrucci M. R., Specchia V., and Pinna M. (2022). DNA barcode gap analysis for multiple marker genes for phytoplankton species biodiversity in Mediterranean aquatic ecosystems. Biology 11, 1277. doi: 10.3390/biology11091277
Tzafesta E., Zangaro F., Specchia V., and Pinna M. (2021). An overview of DNA-based applications for the assessment of benthic macroinvertebrates biodiversity in Mediterranean aquatic ecosystems. Diversity 13, 112. doi: 10.3390/d13030112
Wang Q. and Cole J. R. (2024). Updated RDP taxonomy and RDP Classifier for more accurate taxonomic classification. Microbiol. Resour. Announc. 13, e01063–e01023. doi: 10.1128/mra.01063-23
Wickham H. (2016). Programming with ggplot2. in Ggplot2: elegant graphics for data analysis. (Cham: Springer International Publishing), 241–253. doi: 10.1007/978-3-319-24277-4_12
Xie R., Zhao G., Yang J., Wang Z., Xu Y., Zhang X., et al. (2021). eDNA metabarcoding revealed differential structures of aquatic communities in a dynamic freshwater ecosystem shaped by habitat heterogeneity. Environ. Res. 201, 111602. doi: 10.1016/j.envres.2021.111602
Zangaro F., Pinna M., and Specchia V. (2024). Environmental DNA as early warning for alien species in mediterranean coastal lagoons: implications for conservation and management. Diversity 16, 525. doi: 10.3390/d16090525
Zangaro F., Saccomanno B., Tzafesta E., Bozzeda F., Specchia V., and Pinna M. (2021). Current limitations and future prospects of detection and biomonitoring of NIS in the Mediterranean Sea through environmental DNA. NeoBiota 70, 151–165. doi: 10.3897/neobiota.70.71862
Zhang P., Peng C., Zhang J., Zhang J., Chen J., and Zhao H. (2022). Long-term harmful algal blooms and nutrients patterns affected by climate change and anthropogenic pressures in the zhanjiang bay, China. Front. Mar. Sci. 9, 849819. doi: 10.3389/fmars.2022.849819
Zimmermann J., Jahn R., and Gemeinholzer B. (2011). Barcoding diatoms: evaluation of the V4 subregion on the 18S rRNA gene, including new primers and protocols. Org. Divers. Evol. 11, 173–192. doi: 10.1007/s13127-011-0050-6
Keywords: environmental DNA, eDNA metabarcoding, phytoplankton monitoring, mariculture facilities, quantitative analysis, harmful algal blooms
Citation: Zangaro F, Vadrucci MR, Ismailaj M, Specchia V and Pinna M (2025) eDNA metabarcoding for qualitative and semi-quantitative assessment of phytoplankton towards eco-sustainable mariculture in the Mediterranean Sea. Front. Mar. Sci. 12:1688716. doi: 10.3389/fmars.2025.1688716
Received: 19 August 2025; Accepted: 06 October 2025;
Published: 16 October 2025.
Edited by:
Kar-Hoe Loh, Universiti Malaya, MalaysiaReviewed by:
Zhaohe Luo, State Oceanic Administration, ChinaLiyan He, Chinese Academy of Sciences (CAS), China
Copyright © 2025 Zangaro, Vadrucci, Ismailaj, Specchia and Pinna. This is an open-access article distributed under the terms of the Creative Commons Attribution License (CC BY). The use, distribution or reproduction in other forums is permitted, provided the original author(s) and the copyright owner(s) are credited and that the original publication in this journal is cited, in accordance with accepted academic practice. No use, distribution or reproduction is permitted which does not comply with these terms.
*Correspondence: Valeria Specchia, dmFsZXJpYS5zcGVjY2hpYUB1bmlzYWxlbnRvLml0; Maurizio Pinna, bWF1cml6aW8ucGlubmFAdW5pc2FsZW50by5pdA==