


- 1 Department of Ecology, Evolution and Behavior, University of Minnesota, St. Paul, MN, USA
- 2 Department of Biology, University of Bergen, Bergen, Norway
Although aquatic bacteria are assumed to be nutrient-rich, they out-compete other foodweb osmotrophs for nitrogen (N) and phosphorus (P) an apparent contradiction to resource ratio theory. This paradox could be resolved if aquatic bacteria were demonstrated to be nutrient-poor relative other portions of the planktonic food web. In a survey of >120 lakes in the upper Midwest of the USA, the nutrient content of bacteria was lower than previously reported and very similar to the Redfield ratio, with a mean biomass composition of 102:12:1 (C:N:P). Individual freshwater bacterial isolates grown under P-limiting and P-replete conditions had even higher C:P and N:P ratios with a mean community biomass composition ratio of 875C:179N:1P suggesting that individual strains can be extremely nutrient-poor, especially with respect to P. Cell-specific measurements of individual cells from one lake confirmed that low P content could be observed at the community level in natural systems with a mean biomass composition of 259C:69N:1P. Variability in bacterial stoichiometry is typically not recognized in the literature as most studies assume constant and nutrient-rich bacterial biomass composition. We present evidence that bacteria can be extremely P-poor in individual systems and in culture, suggesting that bacteria in freshwater ecosystems can either play a role as regenerators or consumers of inorganic nutrients and that this role could switch depending on the relationship between bacterial biomass stoichiometry and resource stoichiometry. This ability to switch roles between nutrient retention and regeneration likely facilitates processing of terrestrial organic matter in lakes and rivers and has important implications for a wide range of bacterially mediated biogeochemical processes.
Introduction
Freshwater bacteria play a major role in decomposing organic matter that is produced by autotrophs in both terrestrial and aquatic systems. Although much work has addressed the importance of physical (temperature, moisture, etc.) and chemical (lignin content, N and P content) properties that affect decomposition rates (Benner et al., 1984; Pomeroy and Deibel, 1986; Enriquez et al., 1993), little is known about how microbial biomass stoichiometry might interact with some of these variables.
If bacterial biomass is nutrient-poor relative to the organic matter they decompose, they could act as a positive feedback to primary production due to their relatively high metabolic rates and increased nutrient regeneration rates. Alternatively, they could be a nutrient sink if their biomass is nutrient-rich as hypothesized by the “microbial loop” hypothesis several decades ago (Pomeroy, 1974; Azam et al., 1983). While many models have been developed to address this issue (e.g., Loreau, 2001), few actual measurements have been made in natural systems.
The basis for the idea of nutrient-rich bacteria was twofold. First, numerous tracer measurements in marine, terrestrial, and freshwater ecosystems demonstrated that bacteria are the dominant competitors for dissolved inorganic nutrients such as N and P at low concentrations (Currie and Kalff, 1984; Cotner and Wetzel, 1992). In most cases, these organisms were responsible for anywhere from 50 to >90% of nutrient uptake at ambient levels. Second, measurements of bacterial biomass demonstrated that these organisms were nutrient-rich relative to other components of the plankton (Bratbak, 1985; Fagerbakke et al., 1996). Nonetheless, most studies of the elemental content of aquatic and soil bacteria have been done with cultured organisms and primarily focused on carbon and nitrogen, with less emphasis on P (Goldman et al., 1987).
To our knowledge, no comprehensive study has ever examined the in situ elemental content of Bacteria and Archaea (hereafter “bacteria”) in either marine or freshwater systems. Here, we decided to address two important questions regarding the elemental composition of bacteria in aquatic systems. First, are bacteria nutrient-rich, i.e., are N and P content greater than that predicted by the Redfield ratio (106C:16N:1P; molar ratio)? Second, are bacteria more N- and P-rich than other components in the planktonic food web, i.e., phytoplankton and seston, etc.? We addressed these questions using a survey of over 120 lakes in the upper Midwest, USA, and bacterial isolates from a subset of these lakes grown at multiple resource ratios.
Materials and Methods
During the summers of 2000 and 2001, we sampled 128 lakes in the upper Midwest, USA. in the vicinity of five different biological field station sites [north-central Minnesota, Itasca Biological Station and Laboratories (University of Minnesota); northeastern Minnesota, Ely Field Station (University of Minnesota–Duluth); Twin Cities, University of Minnesota-Twin Cities; southwestern Michigan, Kellogg Biological Station (Michigan State University); eastern South Dakota, Oak Lake Biological Research Station (South Dakota State University]. In addition to this survey, we cultured bacteria from some of these lakes that had been isolated to evaluate biomass stoichiometry at defined growth rates. All lakes were sampled with a Van Dorn bottle in the mixed layer at the deepest point in the lake or in the approximate center when maximum depth was not known. Water samples were returned to the laboratory in a cooler at lake temperatures and processed and/or preserved within 8 h.
To examine bacterial and total seston stoichiometry, lake water samples were pre-filtered through a either a 147 mm 1-μm polycarbonate filter (bacteria) at low pressure (<100 mm Hg) or through 80 μm mesh netting (seston) and subsequently particles that passed these filters were collected on pre-combusted GF/F filters for analyses (CHN and particulate P). Past work has shown that GF/F filters with a nominal cutoff of 0.7 μm do not collect all of the bacteria in lake and ocean water samples with estimates of those passing through varying from 10 to 40%. Also, pre-filtering is known to omit some of the largest bacteria and particularly those associated with particles (Nagata, 1986; Cho and Azam, 1988). Nonetheless, using this approach enabled efficient sampling of a greater number of lakes. Our past work in similar systems (Biddanda et al., 2001) demonstrated that typically more than 95% of the bacteria passed through 1 μm pore-size filters. Filters used for P analysis were acid-rinsed (1% HCl) prior to filtration and when necessary, particles on filters were rinsed with dilute HCl to remove carbonates (MI, SD). Subsequently, filters were dried (∼60°C) overnight and then kept in a desiccator in individual tinfoil envelopes until analysis. CHN samples were analyzed using a Perkin Elmer CHN analyzer or from a calibrated algorithm developed for use with a near infrared spectrum (NIRS) system (Hood et al., 2006). Particulate phosphorus samples were digested using acid persulfate and analyzed spectrophotometrically (APHA, 1992). We report all element ratios as molar ratios.
Bacterial cultures were established by streaking water samples onto undefined culture media (Difco nutrient agar, or LB agar). Individual colonies were harvested from plates, and transferred onto a new plate 2–3 times to isolate individual bacterial strains. Isolates were identified by 16S rRNA gene sequences as described previously (Ghosh and LaPara, 2007). Isolates were transferred to plates containing defined, nutrient-rich (C:P = 10) culture media (Tanner, 2007), then grown to their maximum density on the same media in liquid form. Stock samples were collected from liquid cultures and stored (−80°C with 15% glycerol) for later use in experiments.
Prior to experiments, a single isolate stock was thawed and streaked onto a plate containing nutrient-rich, defined culture media. Cultures were grown at 25°C until visible growth occurred and were then refrigerated for no more than 90 days. We chose six phylogenetically diverse isolates (Aeromonas sp., Flavobacterium spp. (two strains), Cellvibrio gilvus, Cellulomonas cellulans, and Arthrobacter sp.) for experimentation. For all experiments, a single colony was extracted from a plate and grown for 24–36 h in defined, nutrient-rich (C:P = 10), liquid media. One milliliter of this liquid culture was then used to seed chemostat experimental units. Prior to experiments, the maximum growth rate (μmax) of individual strains on nutrient-rich defined media was determined by measuring the change in biomass (optical density at 600 nm) in batch cultures over a 24–36 h period and chemostat dilution rates set at 25% μmax for each isolate.
Chemostat Experiments
Unreplicated chemostat experiments were conducted using isolates to explore the response of bacterial biomass C, N, P, across a gradient of resource C:P. The P concentration of defined liquid culture media was modified to achieve resource C:P ratios of 10, 25, 50, 100, 250, 500, 750, 1000, 2500, and 5000. Chemostat dilution rates were set at 25% μmax for each isolate. Chemostats were sampled and analyzed for PC, PN, and PP as described above.
Using sub-fractions of the lake seston can be problematic for estimating bacterial biomass composition due to interferences from other food web components (phytoplankton, small zooplankton) and detritus. Therefore, we used X-ray microanalysis in one freshwater system (Lake Myravatnet, Bergen, Norway) to compare it to our other results. Lake water was collected from the nearshore region and transported to the Department of Microbiology at the University of Bergen where the analyses were performed. We added nutrients to whole lake water and incubated for 2 days to examine short-term variability in nutrient composition, i.e., before the community composition would have changed considerably.
After water was collected on August 31, 2005 sub-samples were placed in 100 mL Erlenmeyer flasks and enriched with either (a) glucose (170 μM final concentration), (b) NH4Cl (320 μM final concentration), (c) KH2PO4 (20 μM final concentration), (d) no nutrients (control), or (e) all nutrients at the same final concentrations to give a C:N:P of 50:16:1. Enrichment cultures were incubated in the dark at ambient temperature (20°C) for 2 days and sub-samples were removed for X-ray microanalysis using the methods of Norland et al. (1995). Briefly, unpreserved bacterial cells and particles (10 mL) were removed by centrifugation directly onto Al grid (100 mesh, Agar Scientific) supported with a carbon coated Formvar film. We used a Beckman ultra-centrifuge equipped with a swing out bucket rotor (SW 41). After harvesting, excess water was removed and the cells were air-dried and analyzed. For X-ray microanalysis of single cells we used a Philips CM 200 electron microscope equipped with EDAX detector DX-4 supported with SIS soft imaging software. Analyses were run at 80 kV accelerating voltage and at spot size 3 (14-nm probe size). The carbon content of the Formvar film was estimated on each grid and the content of individual cells was corrected appropriately.
In all, we analyzed over 130 cells and we did not observe any consistent differences among the different treatments discussed above (t-test; p > 0.05). Therefore, all of the treatments were pooled for the present analyses.
Literature analyses
To address the relevance of our results to those of others in both freshwater and marine systems, we conducted an analysis of literature data to determine the mean stoichiometric composition of bacteria in other studies. Some authors only reported nutrient ratios which is what was used in the analyses. Nonetheless, we have no way of determining if any of these studies had significant error introduced due to detritus.
Regressions and statistical analyses
Rather than examining nutrient ratios by taking means of ratios in different systems (individual bacteria, cultures, or lakes), we plotted elemental concentrations against each to estimating the slope and intercepts. The advantage of estimating stoichiometric variables in this way is that the data fit a normal distribution and they are less biased by outliers. We used standardized major axis (SMA) analyses to fit our data. When there is error associated with both measurements of the x and y-axes, this is more appropriate than ordinary least squares analyses (Warton et al., 2006). We used a freeware program (SMATR-ver. 2.0; Warton et al., 2006) to estimate the slopes and intercepts in plots of C vs. N, C vs. P, and N vs. P in different size-fractions and in bacterial cultures. Data were log-transformed and tested against a null model that both the slope and intercept were equal to a specific value (1; Sterner et al., 2008). A slope of one indicates that the x and y variables are allocated similarly to each other across the entire range of values. We were also able to use this statistical package to determine if the nutrient ratios and slopes of the bacterial seston pool differed from that of the larger seston (<80 μm). All regression statistics (slopes and intercepts) were considered statistically significant at p < 0.05.
Results
The lake survey in the upper Midwest USA indicated that the bacterial size-fraction was similar in N and P relative to C (Figure 1) using the Redfield ratio (106C:16N:1P) as a reference. The size-fractionated microbes had an elemental composition of 102:12:1, and a C:N ratio of 7.3:1, also very similar to the Redfield ratio.
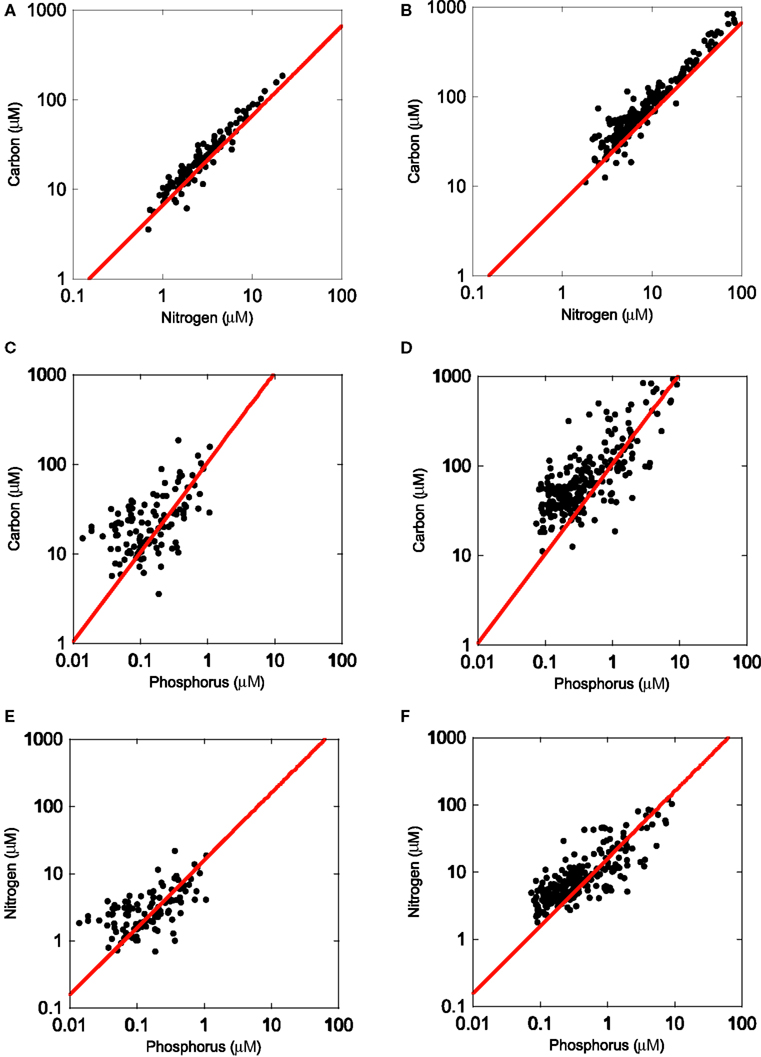
Figure 1. Regressions (SMA) of organic carbon, nitrogen, and phosphorus content in the <1 μm size-fraction [left panels (A,C,E)] and <80 μm seston [(right panels (B,D,F)]. Samples were collected in >120 lakes in the Upper Midwest (MN, IA, SD, MI). The red line represents the Redfield ratio of these elements.
To answer the question of whether or not microbes in these lakes were nutrient-rich relative to the rest of the plankton, we compared two size-fractions (<80 vs. <1 μm filter). In comparing the slopes of C:N, C:P, and N:P, we observed common slopes between the microbial and the seston size-fractions, suggesting that both of these communities of organisms were responding similarly along a nutrient gradient. However, in all three cases, the intercepts of the plots were significantly different from each other (p < 0.05) and in all three cases, the bacterial size-fraction had a lower intercept (p < 0.05) than the seston pool (Figure 1), suggesting that the bacterial pool was generally more N- and P-rich than the seston pool, which had a mean C:N:P ratio of 149:17:1. Lastly, in testing whether the bacterial and seston pools had slopes different than 1, we observed significant differences in all cases, except the C:N seston pool. In addition, the bacterial C:N slope was slightly greater than 1 (1.06; p = 0.032) while the significant slopes in all other cases were all less than 1 (bacterial and seston C:P and N:P), indicating that bacterial biomass P was increasing along the axis relative to both C and N.
To address the potential variability in bacterial biomass stoichiometry of individual bacteria, we grew several bacterial isolates at 25% of their maximum growth rates and at a range of inorganic P concentrations. This allowed us to see if single strains isolated from these lakes were able to achieve biomass C:N:P values similar to those we observed for whole communities in lake water samples. The results indicated that the bacterial size-fraction was typically more P-rich than the six strains that were isolated from freshwater systems (Figure 2). Collectively, grown under both P-replete and P-deplete conditions, the isolates had a mean C:N less than that observed for lake bacteria (5.7 vs. 7.3, respectively) with a slope not significantly different than 1. However, the intercepts of the C vs. P and N vs. P plots indicated that all of these strains were low in P relative to the lake communities (Tables 1 and 2). The mean C:P intercept of these strains was 865:1 and the mean N:P was 179:1 and in both cases the slopes were less than 1 (0.71 and 0.73 for C:P and N:P, respectively), similar to the observations in lake bacterial communities.
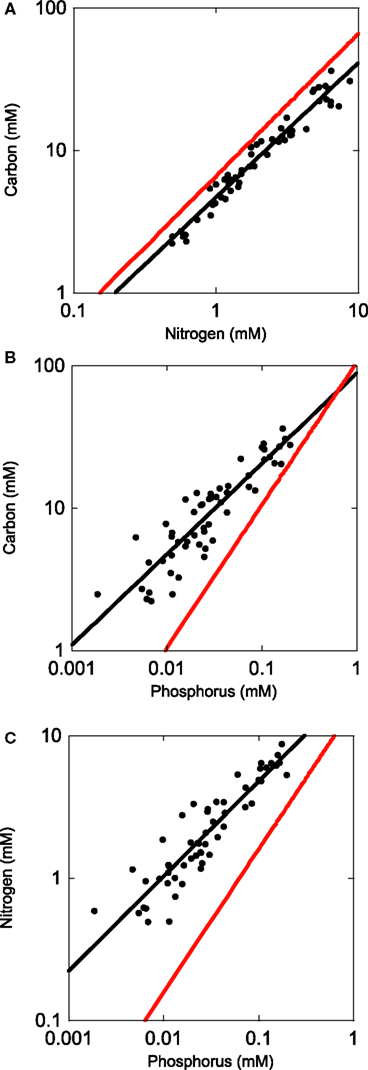
Figure 2. Regressions (SMA) of organic carbon, nitrogen, and phosphorus content in bacterial isolates from several lakes in and near Itasca State Park, MN, USA (Long Lake, Elk Lake, and Lake Itasca).
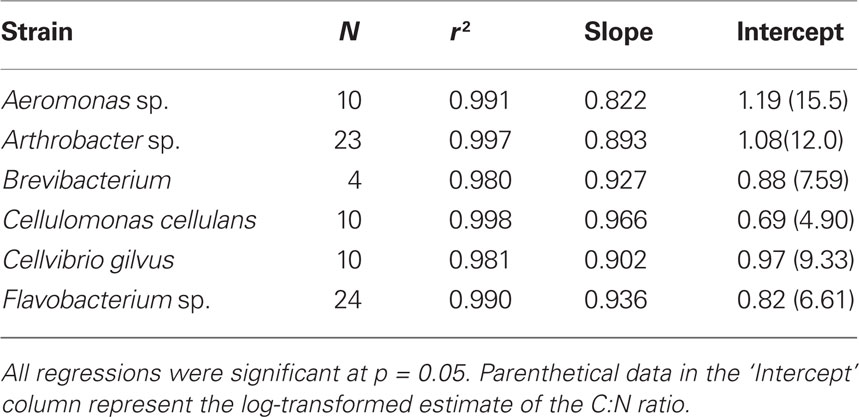
Table 1. Molar C:N SMA regression data.
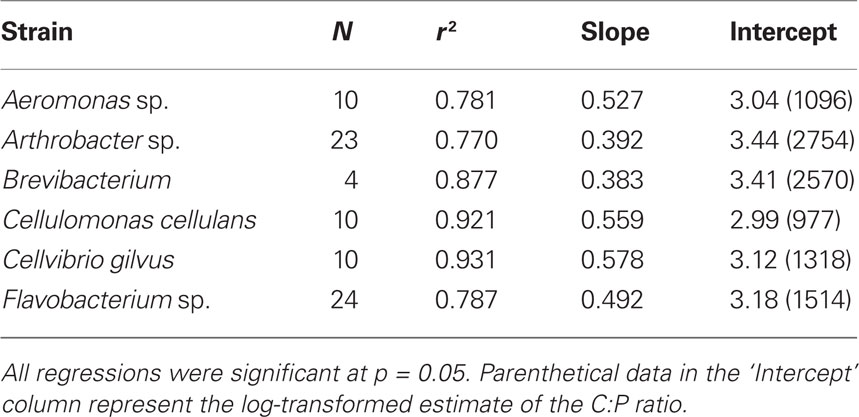
Table 2. Molar C:P SMA regression data.
For a single lake we used X-ray microanalysis to determine individual cell bacterial biomass stoichiometry. The results of observations of >130 bacteria indicated that the bacteria in Lake Myravatnet were definitely depleted in P, as we observed with pure cultures, but not as much. The C:N ratio was lowest in these bacteria (4.7) but similar to that observed with the pure cultures and the slope did not differ from 1 (Figure 3). The P content of these organisms was very low relative to the Redfield ratio, with a C:P ratio of 259:1 and a N:P of 69:1. Interestingly, the slopes of all three plots were not significantly different from 1, suggesting that C, N, and P were not allocated differently relative to each other along the axes in this one lake.
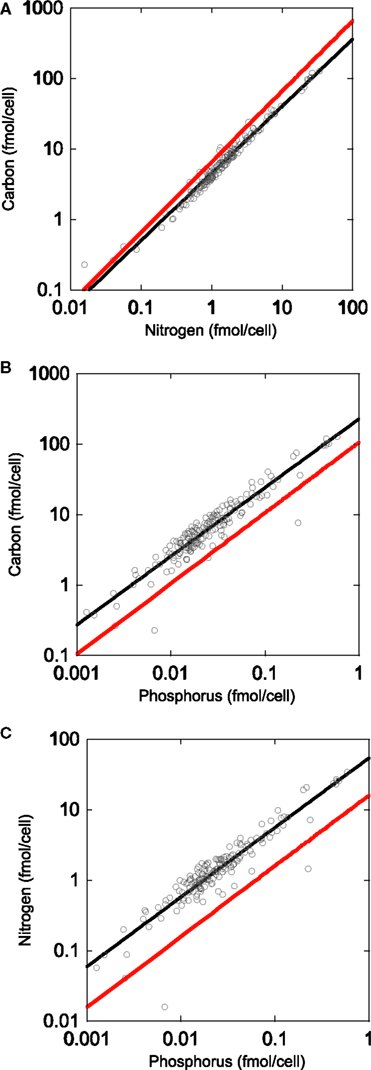
Figure 3. Regressions of organic carbon, nitrogen, and phosphorus content in Lake Myravatnet (Bergen, Norway) using X-ray microanalysis: (A) C vs. N, (B) N vs. P, and (C) C vs. P.
Finally, we examined the frequency distributions of the bacteria from both the upper Midwest survey and those from the X-ray microanalysis experiment. Despite the fact that they were collected from different systems and used different analyses, they showed similar patterns (Figure 4). In both cases, the C:N distribution differed from the C:P and N:P distribution in that there were few outliers at the high extremes.
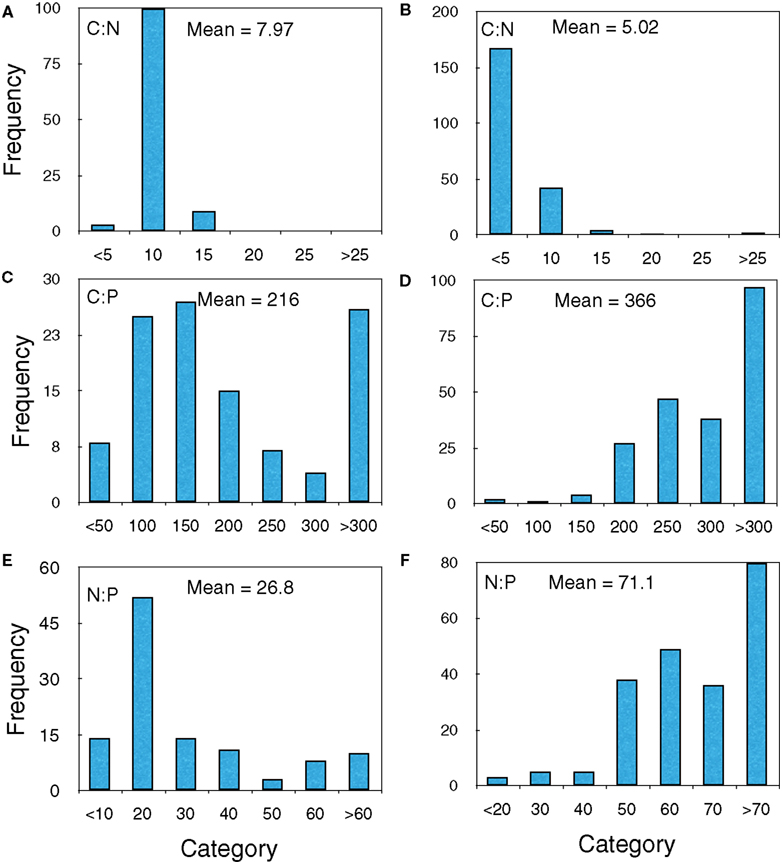
Figure 4. Frequency histograms of the upper Midwest survey lakes (A,C,E) and Lake Myravatnet (B,D,F) showing C:N, C:P, and N:P (molar) ratios.
Discussion
This study demonstrated three key results. First, that bacteria in the temperate freshwater lakes and in cultures experiencing P-limitation were not enriched in either N or P relative to the Redfield ratio. This result is inconsistent with the idea that these organisms provide an important reservoir for nutrients such as N and P in the freshwater ecosystems. However, it does suggest that bacteria are more important than often assumed in regenerating nutrients, particularly P, in freshwater systems due to their low nutrient content and high metabolic rates (del Giorgio et al., 1997). This point is further emphasized by the culture studies that demonstrated that actively growing individual isolates from lakes can be extremely deficient in nutrients, particularly P.
The second important issue we addressed was whether bacteria in freshwater lakes are more nutrient-rich than other parts of the food web. Our observations indicated that lake bacteria were slightly more enriched in N and P relative to the total seston pool in north temperate lakes but that the bacterial pool and the seston pool changed similarly along a trophic gradient in these systems, i.e., they had similar slopes but different intercepts.
The third important result was that there was considerably more variability in the P content of the microbial pool than that of C or N. The distributions in nutrient ratios from the lake survey and also Lake Myravatnet, Norway indicated a more normal distribution for C:N and fewer high outliers than the C:P and N:P distributions, which best fit a log-normal distribution (Sterner et al., 2008). Furthermore, in comparing the bacterial size-fraction with the larger seston, the C vs. N plots had very similar and high r2 values while the C vs. P and N vs. P r2-values for the bacterial size-fraction were considerably less than the sestonic size-fraction.
One mechanism to explain such variability in P among systems is that there may be differences in the ability of the microbial flora to substitute other nutrients for P as opposed to N when either nutrient is limiting. For instance, it is well-known that plants can substitute sulfolipids for phospholipids in membranes (Frentzen, 2004) and a similar substitution has been documented in several bacteria (Geiger et al., 1999; Lopez-Lara et al., 2003; Souza et al., 2008) and in marine picocyanobacteria (Van Mooy et al., 2009). As much as 30–40% of the phosphorus in small cyanobacteria is found in P-lipids so it could be an important adaptation to limit this requirement in P-deficient systems. Less is known of the importance of sulfolipids to freshwater microbes but in the lakes that we surveyed in the Upper Midwest, there was great variability in the sulfate concentrations (Gorham et al., 1983) which perhaps, could contribute to variation in the ability of microbial flora to substitute S for P in membranes.
We examined this idea further using X-ray microanalysis to evaluate P and sulfur (S) content of bacteria from Lake Myravatnet (Figure 5). Although we did not observe that the C vs. N, C vs. P, or N vs. P slopes differed from 1 in any of our measurements, there was a statistical difference (p < 0.05; slope = 1.13) in the P vs. S slope in this lake. There was also a great deal of scatter in these data (r2 = 0.32), but a slope greater than 1 suggests that P and S were allocated differently along the axis, perhaps due to different bacteria using P and S in lipids to different extents. The substitution of S-lipids for P-lipids and their biogeochemical implications have been little explored, particularly in freshwaters and its relevance to nutrient and organic carbon dynamics needs to be further addressed.
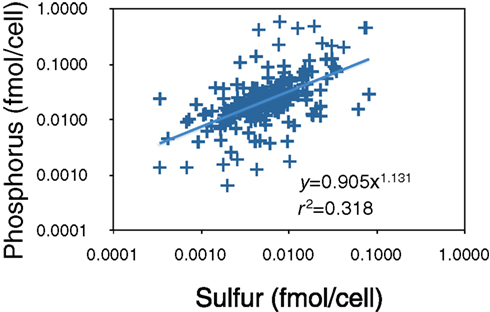
Figure 5. X-ray microanalysis of P and S-content of bacteria in Lake Myravatnet, Norway. Data are provided as femtomoles per cell.
Polyphosphate could also produce C:P or N:P outliers, but this is most likely on the low end of the biomass C:P range, i.e., C:P ratios less than 100 (Jensen and Corpe, 1993; Brown and Kornberg, 2004), which we did not observe, suggesting that P-minimization, not P-storage, was a more important mechanism. Recent work making direct measurements of poly-P with some of the same cultures used in the present study and grown at C:P ratios varying from 50 to 1000:1 demonstrated that the poly-P pool is not an important storage pool in these organisms. There was a suggestion of some low N:P bacteria in the distribution from Lake Myravatnet (Figure 4F) but they were not very common.
An important question that addresses the role of bacteria in either sequestering or regenerating P, is why you might expect the microbial pool to be very P-rich relative to the seston? In the scientific literature, it has been mostly assumed that the microbial pool is much more nutrient-rich than the remainder of the food web but the results presented here suggest more ambiguity in this role. The reason that most of the studies in the past suggested that the microbial pool is nutrient-rich focused on their high surface-to-volume ratio (Bratbak, 1993), high affinity for P-uptake (Cotner and Wetzel, 1992; Cottrell and Kirchman, 2004) and rapid growth rates (Elser et al., 2003; Makino et al., 2003; Makino and Cotner, 2004). What has not been addressed as extensively is the variability of these processes among a diversity of lakes and/or marine ecosystems. Possible explanations for variability among freshwater and marine ecosystems include: 1. Differences in the strains present in different systems, i.e., higher vs. lower uptake or growth rate capacities, or 2. Differences in the stoichiometry and lability of C, N, and P in different systems. For example, differences in mixing depths and allochthonous inputs could affect both the quantity and quality of labile carbon, nitrogen, and phosphorus available for microbial consumption.
In the present study, we observed that bacteria were more N- and P-rich than the overall seston regionally in the upper Midwest lake survey, but measurements of six individual strains grown at low growth rates (0.25 of μmax) indicated that some of these bacteria can be extremely P-poor, with C:P values greater than 500:1. These observations suggest that bacteria can be extremely deficient in P, to the point that their P content is much less than that predicted by the Redfield ratio. The idea that bacterial communities can also be extremely P-deficient was supported by results from the mixed community in Lake Myravatnet that indicated that this particular community of bacteria can have very low P content as well. Similarly low P values and high N:P ratios in bacteria were observed in a Spanish alpine lake (Villar-Argaiz et al., 2002). We did not observe such low P content in the regional study, perhaps, because of less extreme conditions and/or less severe P-limitation at a larger spatial scale (Sterner et al., 2008).
However, one potential complication could be due to the way bacteria were sampled in our fieldwork. Using pre-filtration through a 1-μm pore-size filter and collection of bacterial biomass on a GF/F filter could have selected a subset of the bacterial community that was not representative. For instance, work in our own laboratory and others has demonstrated that P-limited bacteria tend to increase their length-to-width ratio (Bratbak, 1985; Løvdal et al., 2008). Also, it has been demonstrated that bacteria growing in pelagic anoxic environments tend to be larger than aerobic bacteria in the same lake (Cole et al., 1993) and some of these large bacteria are known to have polyphosphate inclusions. If pre-filtering removed large bacteria in our samples, it most likely would have biased the C:P and N:P measurements down (more P-rich) because we sampled only in aerobic waters where large bacteria are likely P-poor, but we have no way of knowing the extent to which this occurred.
The results of work with cultures may also suggest that although aquatic bacteria can be very deficient in P at low growth rates, their C:P and N:P ratios in nature are not very far from the Redfield ratio, perhaps because the bacteria in most of the upper Midwest lakes were either growing faster than we had them growing in chemostats or had higher P cell quotas than the strains we examined in chemostats. The dilution rates we used in the present study varied from 1.2 to 2.4 d−1 which are low, but certainly not the lowest growth rates that have been used to examine bacterial biomass stoichiometry. Løvdal et al. (2008) examined the elemental content of the marine bacterium Vibrio splendidus at growth rates to ours at 0.5 d−1 and observed similar C:N:P ratios as we did (C:P 165–317:1). It is difficult to know what the mean growth rates of bacteria in natural systems is because of difficulties measuring strain-specific growth in mixed communities. Nonetheless, estimates for whole communities indicate that bacterial growth rates in open marine systems vary from 0.05 to 7 d−1 (White et al., 1991; Ducklow, 2000) and in freshwater from 0.03 to 1.5 d−1 (White et al., 1991) suggesting that, if anything, the dilution rates used in our chemostats were on the high end of bacterial specific growth rates in nature.
A less-explored topic that could also affect bacterial biomass stoichiometry has to do with the lability of their carbon sources. A more labile carbon source could increase the competitive ability of bacteria for P by increasing their ability to take up and sequester P (Cotner and Wetzel, 1992). In freshwater for instance, high abundance of macrophytes can contribute labile carbon that could increase the competitive ability of bacteria for P and consequently their P content (Stets and Cotner, 2008a,b; Williams et al., 2009). Other work in lakes with varying quantities of macrophytes has demonstrated that, in fact, higher macrophyte abundance is associated with increased bacterial production and decreased algal biomass (Rooney et al., 2003), perhaps due to increased P acquisition by bacteria due to their higher growth rates.
Following this mechanism, one could predict that if labile C increases proportionately with trophic state, one might expect that bacterial P content should increase disproportionately to C. Lake and marine bacteria in culture with a labile C source (glucose) and sufficient P can have biomass C:P ratios < 50:1 (Bratbak, 1985) and can store substantial P as polyphosphate. To address this issue from our survey work, we examined the dataset to determine whether there might be differences in the nutrient content of bacteria related to the trophic state of the system. In these lakes, there was a pattern of lower microbial C:P at high chlorophyll concentrations, as was also observed by Biddanda et al. (2001) and recently by Sterner et al. (2008) in a more exhaustive data set including marine systems, suggesting that biomass was more P-enriched in more eutrophic systems. We tested for differences in slope between C vs. N, C vs. P, and N vs. P plots in our lake survey bacterial data and found significant differences in all cases. The C:P and N:P had slopes that were less than 1 and the C:N plot had a slope greater than 1, suggesting that P, but not N content, was increasing along the biomass gradient (Figure 1). One explanation could be due to variability in how microbes are dealing with low P availability, especially in low P systems. For example, there was considerably more variability in the C:P and N:P content of the microbial pool at the lowest chlorophyll levels, again suggesting inter-system variability in the role of microbes in nutrient regeneration in unproductive lakes. Differences in bacterial community composition and their ability to use non-P-lipid could drive some of this variability but also differences in the lability of organic C among different systems could be an important factor.
Are Marine Systems Different?
The microbial loop concept originated in marine systems so one argument that should be addressed is whether or not microbial stoichiometry might be “different” in marine vs. freshwater systems, i.e., perhaps marine bacteria are more nutrient-rich. After all, several studies have demonstrated that organic matter in freshwaters is often less enriched in N and P than in marine systems so, perhaps the microbes are simply reflecting these differences (Hecky et al., 1993).
To address this issue, we compiled all of the marine studies with similar measurements and compared the mean marine biomass nutrient ratios to those measured in freshwater systems (Table 3). This analysis showed that marine bacteria were more N- and P-rich than freshwater bacteria (Figure 6). The mean C:N ratio was 5.2, mean C:P was 54.5, and N:P was 11.7, all considerably less than what we measured in lakes and also less than the Redfield ratio. One potential complication is that almost all of the published measurements in marine systems have been performed on isolates grown in the laboratory and measured using X-ray microanalysis (Table 3). As we observed in the present study, laboratory cultures may have biomass compositions that are very different than the communities that they were isolated from. There does not seem to be any obvious bias to lower values using X-ray microanalysis because our measurements in a Norwegian lake with uncultured organisms using this method gave results similar to other lakes and much higher than the marine values measured with the same technique. However, there probably is bias from making measurements particularly with batch cultures in exponential growth because these organisms would not be P-limited (Elser et al., 2003) and whether or not bacteria are P-limited can have profound effects on their biomass C:P. It should be noted from our discussion above that our culture measurements were biased toward lower P content possibly due to the fact that we made our measurements in chemostats but at relatively slow growth rates whereas most of the marine work has been done in batch culture where growth rates would be maximal.
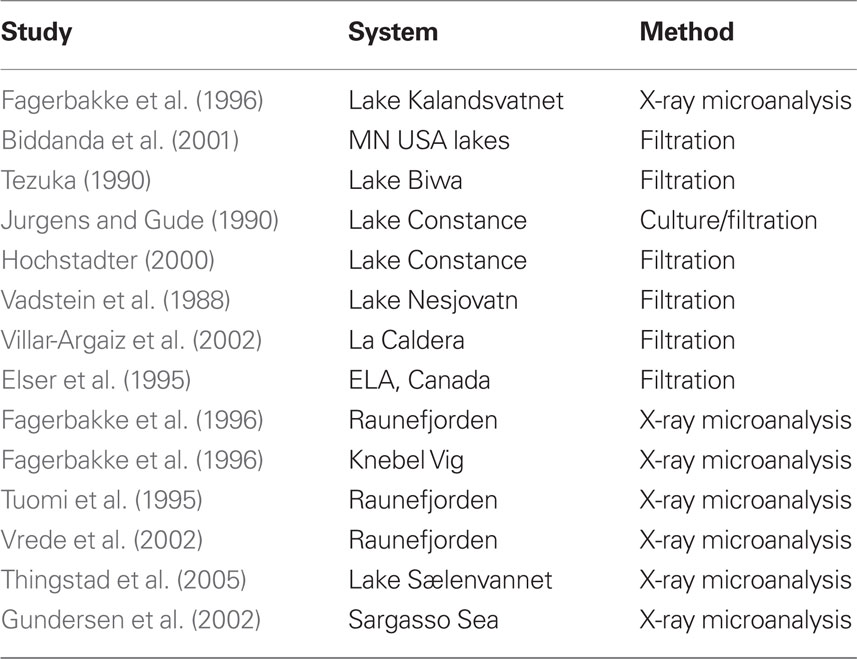
Table 3. Studies from literature survey that collected field samples to estimate bacterial stoichiometry parameters.
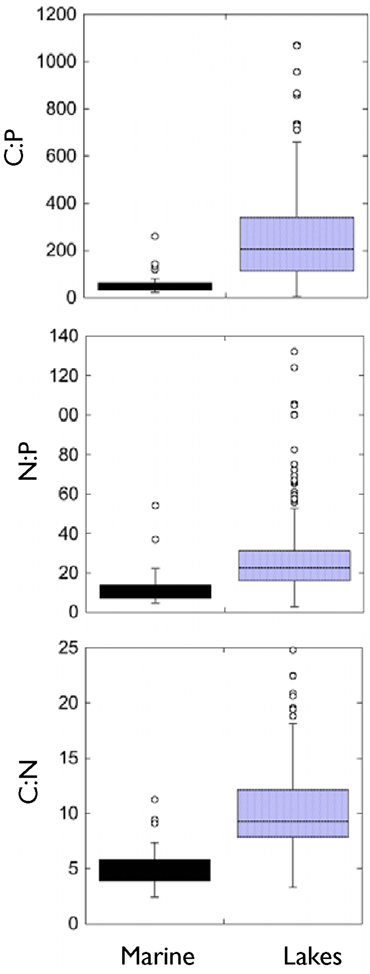
Figure 6. Comparison of all marine measurements of microbial stoichiometry in a literature survey to the measurements from the present survey plus all other freshwater measurements of microbial stoichiometry in the literature. Literature used are presented in Table 3.
It should also be noted that Sterner et al. (2008) recently concluded that trophic state, not whether they are freshwater or marine, matters most for stoichiometric differences among aquatic systems. If bacteria are not exceptional in this regard, it suggests that the higher P content of marine bacteria in the literature could be an artifact due to how the measurements have been made. A series of novel single cell methods have recently been shown to be applicable to stoichiometric analyses of bacteria and it is now possible to directly evaluate this question in the absence of culture bias.
Implications
What do these results mean to the biogeochemical functioning of bacteria in freshwater? First, it means that the idea that bacteria are a disproportionately important reservoir of nutrients relative to the seston, especially P, is probably not the case for lake ecosystems. The lake survey and culture work also indicated that while bacteria were slightly enriched with N and P relative to seston, they were not enriched in N or P relative to the Redfield ratio.
Another important implication has to do with how the microbial loop, and in particular, bacteria, function in the context of the whole food web. If bacteria are nutrient-rich relative to other food web components, it suggests that they may constrain primary production through nutrient delivery to autotrophs (Danger et al., 2007; Thingstad et al., 2008). This has been observed in individual lakes, which suggests that bacterial biomass stoichiometry it can be a constraint in P-limited lakes or as was recently demonstrated in the Arctic Ocean (Thingstad et al., 2008). There are numerous recent studies where it has been demonstrated that there are negative feedbacks due to competition for inorganic nutrients between bacteria and primary producers (Cotner and Biddanda, 2002; Sundareshwar et al., 2003). However, the key observation in the present study was that most often, the bacterial P content was similar to that of the larger seston and therefore was not likely an important constraint to primary producers. Furthermore, the culture work in the present study indicated that bacteria can be extremely P-deficient and other work in our laboratory indicates that many strains may not even be P-limited at C:P supply ratios >250. Nonetheless, the fact that bacterial macronutrient content was not very different than that of the seston suggests that there could be a great deal of variability in the role that bacteria play in this respect. Understanding what environmental factors i.e., temperature (Cotner et al., 2006; Hall et al., 2009), organic carbon supply and lability, etc., are most important in ultimately determining bacterial stoichiometry in nature could have important implications for the role that bacteria play in organic matter degradation and in facilitating primary production.
Several models and reviews suggest that the conditions that should promote competition of autotrophs and bacteria for inorganic nutrients are those where labile organic carbon availability is high, inorganic nutrient levels are low (Thingstad et al., 1997; Cotner and Biddanda, 2002) and bacterial growth is limited by the availability of inorganic nutrients. Furthermore, the potential role of bacteria to negatively affect algal production should be highest when bacterial biomass is comparable to that of the phytoplankton, i.e., under more oligotrophic conditions (Biddanda et al., 2001; Cotner and Biddanda, 2002; Danger et al., 2007).
However, demonstrations of these specific interactions in nature are rare due in part to the difficulty in measuring bacterial biomass stoichiometry and the relative amounts and availability of organic carbon in natural settings. In lakes, these interactions are complicated to a greater extent than in the oceans by allochthonous carbon inputs and macrophyte production. Some recent data in an oligotrophic and eutrophic lake in Minnesota (Stets and Cotner, 2008a) indicated that competitive effects of labile added carbon on algal growth was more pronounced in an oligotrophic lake where the bacterial biomass was more nutrient limited. Also, recent work in boreal lakes indicated that a higher proportion of bacterial respiration is supported by algal sources with increasing chlorophyll concentrations (trophic state; McCallister and del Giorgio, 2008) but increasing trophic state often means increasing P availability, decreasing potential competitive effects of bacteria.
Another important implication of these results is that bacterial biomass stoichiometry, like the seston, can change in response to internal or external drivers. In lakes, allochthonous organic C and nutrient loading are much higher and more variable than in the oceans, generating greater diversity in environmental conditions which could also help explain why lake seston stoichiometry tends to be more variable than that of the oceans (Hecky et al., 1993). Although similar stoichiometric drivers occur in the ocean and lakes, shorter hydraulic residence times in lakes necessitates more rapid response, emphasizing the role of bacteria. A model of phytoplankton biomass incorporating biological stoichiometry provided support for the idea that the Redfield ratio is not constant but rather the “optimal” stoichiometry is dictated by environmental conditions even in the oceans (Klausmeier et al., 2004). Regardless of the underlying mechanisms, the results presented here indicate that the paradigm of bacteria as an invariably nutrient-rich component of planktonic ecosystems is inaccurate and should be revised. While bacterial biomass C:N is relatively static, bacterial biomass C:P is highly variable indicating that bacteria could act as either a sink or source of mineral P in lake ecosystems. Therefore, understanding what controls bacterial biomass stoichiometry may lead to new insights into the proximate mechanisms that ultimately control or constrain larger scale ecosystem processes.
Conflict of Interest Statement
The authors declare that the research was conducted in the absence of any commercial or financial relationships that could be construed as a potential conflict of interest.
Acknowledgments
This work was supported by NSF (DEB 9977047 and DEB 0519041). We are grateful to Bob Sterner and the Upper Midwest Lake Survey Team (SWAT) for their assistance in collecting and processing samples as well as providing data for the total seston. The Norwegian Science Federation, with the help of Frede Thingstad, provided support for James B. Cotner to perform work in Bergen. D. Wohl (Elizabethtown College, PA, USA) kindly provided two strains of Bacteria for chemostat studies.
References
Azam, F., Fenchel, T., Field, J. G., Gray, J. S., Meyer-Reil, L. A., and Thingstad, F. (1983). The ecological role of water-column microbes in the sea. Mar. Ecol. Prog. Ser. 10, 257–263.
Benner, R., Maccubbin, A. E., and Hodson, R. E. (1984). Anaerobic biodegradation of the lignin and polysaccharide components of lignocellulose and synthetic lignin by sediment microflora. Appl. Environ. Microbiol. 47, 998–1004.
Biddanda, B., Ogdahl, M., and Cotner, J. (2001). Dominance of bacterial metabolism in oligotrophic relative to eutrophic waters. Limnol. Oceanogr. 46, 730–739.
Bratbak, G. (1985). Bacterial biovolume and biomass estimations. Appl. Environ. Microbiol. 49, 1488–1493.
Bratbak, G. (1993). “Microscope methods for measuring bacterial biovolume: epifluorescence microscopy, scanning electron microscopy, and transmission electron microscopy,” in Handbook of Methods in Aquatic Microbial Ecology, eds P. F. Kemp, B. F. Sherr, E. B. Sherr, and J. J. Cole (Boca Raton: Lewis), 309–317.
Brown, M. R., and Kornberg, A. (2004). Inorganic polyphosphate in the origin and survival of species. Proc. Natl. Acad. Sci. U. S. A. 101, 16085–16087.
Cho, B. C., and Azam, F. (1988). Major role of bacteria in biogeochemical fluxes in the ocean’s interior. Nature 332, 441–442.
Cole, J. J., Pace, M. L., Caraco, N. F., and Steinhart, G. S. (1993). Bacterial biomass and cell size distributions in lakes: more and larger cells in anoxic waters. Limnol. Oceanogr. 38, 1627–1632.
Cotner, J. B., and Biddanda, B. A. (2002). Small players, large role: microbial influence on auto-heterotrophic coupling and biogeochemical processes in aquatic ecosystems. Ecosystems 5, 105–121.
Cotner, J. B., Makino, W., and Biddanda, B. A. (2006). Temperature affects stoichiometry and biochemical composition of Escherichia coli. Microb. Ecol. 52, 26–33.
Cotner, J. B., and Wetzel, R. G. (1992). Uptake of dissolved inorganic and organic phosphorus compounds by phytoplankton and bacterioplankton. Limnol. Oceanogr. 37, 232–243.
Cottrell, M. T., and Kirchman, D. L. (2004). Single-cell analysis of bacterial growth, cell size, and community structure in the Delaware estuary. Aquat. Microb. Ecol. 34, 139–149.
Currie, D. J., and Kalff, J. (1984). The relative importance of bacterioplankton and phytoplankton in phosphorus uptake in freshwater. Limnol. Oceanogr. 29, 311–321.
Danger, M., Oumarou, C., Benest, D., and Lacroix, G. (2007). Bacteria can control stoichiometry and nutrient limitation of phytoplankton. Funct. Ecol. 21, 202–210.
del Giorgio, P. A., Cole, J. J., and Cimbleris, A. (1997). Respiration rates in bacteria exceed phytoplankton production in unproductive aquatic systems. Nature 385, 148–151.
Ducklow, H. (2000). “Bacterial production and biomass in the oceans,” in Microbial Ecology of the Oceans, ed. D. Kirchman (New York: Wiley-Liss), 85–120.
Elser, J. J., Acharya, K., Kyle, M., Cotner, J., Makino, W., Markow, T., Watts, T., Hobbie, S., Fagan, W., Schade, J., Hood, J., and Sterner, R. W. (2003). Growth rate-stoichiometry couplings in diverse biota. Ecol. Lett. 6, 936–943.
Elser, J. J., Stabler, L. B., and Hassett, R. P. (1995). Nutrient limitation of bacterial growth and rates of bacterivory in lakes and oceans: a comparative study. Aquat. Microb. Ecol. 9, 105–110.
Enriquez, S., Duarte, C. M., and Sand-Jensen, K. (1993). Patterns in decomposition rates among photosynthesis organisms: the importance of detritus C:N:P content. Oecologia 94, 457–471.
Fagerbakke, K. M., Heldal, M., and Norland, S. (1996). Content of carbon, nitrogen, oxygen, sulfur and phosphorus in native aquatic and cultured bacteria. Aquat. Microb. Ecol. 10, 15–27.
Frentzen, M. (2004). Phosphatidylglycerol and sulfoquinovosyldiacylglycerol: anionic membrane lipids and phosphate regulation. Curr. Opin. Plant Biol. 7, 270–276.
Geiger, O., Röhrs, V., Weissenmayer, B., Finan, T. M., and Thomas-Oates, J. E. (1999). The regulator gene phoB mediates phosphate stress-controlled synthesis of the membrane lipid diacylglyceryl-N, N, N-trimethylhomoserine in Rhizobium (Sinorhizobium) meliloti. Mol. Microbiol. 32, 63–73.
Ghosh, S., and LaPara, T. M. (2007). The effects of subtherapeutic antibiotic use in farm animals on the proliferation and persistence of antibiotic resistance among soil bacteria. ISME J. 1, 191–203.
Goldman, J. C., Caron, D. A., and Dennett, M. R. (1987). Regulation of gross growth efficiency and ammonium regeneration in bacteria by substrate C:N ratio. Limnol. Oceanogr. 32, 1239–1252.
Gorham, E., Dean, W. E., and Sanger, J. E. (1983). The chemical composition of lakes in the north-central United States. Limnol. Oceanogr. 28, 287–301.
Gundersen, K., Heldal, M., Norland, S., Purdie, D. A., and Knap, A. H. (2002). Elemental C, N, and P cell content of individual bacteria collected at the Bermuda Atlantic Time-Series Study (BATS) site. Limnol. Oceanogr. 47, 1525–1530.
Hall, E. K., Dzialowski, A. R., Stoxen, S. M., and Cotner, J. B. (2009). The effect of temperature on the coupling between phosphorus and growth in lacustrine bacterioplankton communities. Limnol. Oceanogr. 54, 880–889.
Hecky, R. E., Campbell, P., and Hendzel, L. L. (1993). The stoichiometry of carbon, nitrogen, and phosphorus in particulate matter of lakes and oceans. Limnol. Oceanogr. 38, 709–724.
Hochstadter, S. (2000). Seasonal changes of C:P ratios of seston, bacteria, phytoplankton and zooplankton in a deep, mesotrophic lake. Freshw. Biol. 44, 453–463.
Hood, J. M., Brovold, S., Sterner, R. W., Villar-Argaiz, M., and Zimmer, K. D. (2006). Near-infrared spectrometry (NIRS) for the analysis of seston carbon, nitrogen, and phosphorus from diverse sources. Limnol. Oceanogr. Methods 4, 96–104.
Jensen, T. E., and Corpe, W. A. (1993). Elemental composition of the polyphosphate bodies in microbial cells from a small lake. Arch. Hydrobiol. 127, 385–393.
Jurgens, K., and Gude, H. (1990). Incorporation and release of phosphorus by planktonic bacteria and phagotrophic flagellates. Mar. Ecol. Prog. Ser. 59, 271–284.
Klausmeier, C. A., Litchman, E., Daufresne, T., and Levin, S. A. (2004). Optimal nitrogen-to-phosphorus stoichiometry of phytoplankton. Nature 429, 171–174.
Lopez-Lara, I. M., Sohlenkamp, C., and Geiger, O. (2003). Membrane lipids in plant-associated bacteria: their biosyntheses and possible functions. Mol. Plant Microbe Interact. 16, 567–579.
Loreau, M. (2001). Microbial diversity, producer–decomposer interactions and ecosystem processes: a theoretical model. Proc. Biol. Sci. 268, 303–309.
Løvdal, T., Skjoldal, E. F., Heldal, M., Norland, S., and Thingstad, T. F. (2008). Changes in morphology and elemental composition of Vibrio splendidus along a gradient from carbon-limited to phosphate-limited growth. Microb. Ecol. 55, 152–161.
Makino, W., and Cotner, J. B. (2004). Elemental stoichiometry of a heterotrophic bacterial community in a freshwater lake: implications for growth- and resource-dependent variations. Aquat. Microb. Ecol. 34, 33–41.
Makino, W., Cotner, J. B., Sterner, R. W., and Elser, J. J. (2003). Are bacteria more like plants or animals? Growth rate and resource dependence of bacterial C:N:P stoichiometry. Funct. Ecol. 17, 121–130.
McCallister, S. L., and del Giorgio, P. A. (2008). Direct measurement of the d 13 C signature of carbon respired by bacteria in lakes: linkages to potential carbon sources, ecosystem baseline metabolism, and CO2 fluxes. Limnol. Oceanogr. 53, 1204–1216.
Nagata, T. (1986). Carbon and nitrogen content of natural planktonic bacteria. Appl. Environ. Microbiol. 52, 28–32.
Norland, S., Fagerbakke, K. M., and Heldal, M. (1995). Light element analysis of individual bacteria by X-ray microanalysis. Appl. Environ. Microbiol. 61, 1357–1362.
Pomeroy, L. R., and Deibel, D. (1986). Temperature regulation of bacterial activity during the spring bloom in Newfoundland coastal waters. Science 233, 359–361.
Rooney, N., Kalff, J., and Habel, C. (2003). The role of submerged macrophyte beds in phosphorus and sediment accumulation in Lake Memphremagog, Quebec, Canada. Limnol. Oceanogr. 48, 1927–1937.
Souza, V., Eguiarte, L. E., Siefert, J., and Elser, J. J. (2008). Microbial endemism: does phosphorus limitation enhance speciation? Nat. Rev. Microbiol. 6, 559–564.
Sterner, R. W., Anderson, T., Elser, J. J., Hessen, D. O., Hood, J. M., McCauley, E., and Urabe, J. (2008). Scale-dependent carbon: nitrogen: phosphorus seston stoichiometry in marine and freshwaters. Limnol. Oceanogr. 53, 1169–1180.
Stets, E. G., and Cotner, J. B. (2008a). The influence of dissolved organic carbon on bacterial phosphorus uptake and bacteria-phytoplankton dynamics in two Minnesota lakes. Limnol. Oceanogr. 53, 137–147.
Stets, E. G., and Cotner, J. B. (2008b). Littoral zones as sources of biodegradable dissolved organic carbon in lakes. Can. J. Fish. Aquat. Sci. 65, 2454–2460.
Sundareshwar, P. V., Morris, J. T., Koepfler, E. K., and Fornwalt, B. (2003). Phosphorus limitation of coastal ecosystem processes. Science 299, 563–565.
Tanner, R. S. (2007). “Cultivation of bacteria and fungi,” in Manual of Environmental Microbiology, eds C. J. Hurst, R. L. Crawford, J. L. Garland, D. A. Lipson, A. L. Mills, and L. D. Stetzenbach (Washington, DC: American Society for Microbiology Press), 69–78.
Tezuka, Y. (1990). Bacterial regeneration of ammonium and phosphate as affected by the carbon:nitrogen:phosphorus ratio of organic substrates. Microb. Ecol. 19, 227–238.
Thingstad, T. F., Hagström, A., and Rassoulzadegan, F. (1997). Accumulation of degradable DOC in surface waters: is it caused by a malfunctioning microbial loop? Limnol. Oceanogr. 42, 398–404.
Thingstad, T. F., Bellerby, R. G. J., Bratbak, G., Borsheim, K. Y., Egge, J. K., Heldal, M., Larsen, A., Neill, C., Nejstgaard, J., Norland, S., Sandaa, R. A., Skjoldal, E. F., Tanaka, T., Thyrhaug, R., and Topper, B. (2008). Counterintuitive carbon-to-nutrient coupling in an Arctic pelagic ecosystem. Nature 455, 387–390.
Thingstad, T. F., Ovreas, L., Egge, J. K., Lovdal, T., and Heldal, M. (2005). Use of non-limiting substrates to increase size; a generic strategy to simultaneously optimize uptake and minimize predation in pelagic osmotrophs? Ecol. Lett. 8, 675–682.
Tuomi, P., Fagerbakke, K. M., Bratbak, G., and Heldal, M. (1995). Nutritional enrichment of a microbial community: the effects on activity, elemental composition, community structure and virus production. FEMS Microbiol. Ecol. 16, 123–134.
Vadstein, O., Jensen, A., Olsen, Y., and Reinertsen, H. (1988). Growth and phosphorus status of limnetic phytoplankton and bacteria. Limnology 33, 489–503.
Van Mooy, B. A., Fredricks, H. F., Pedler, B. E., Dyhrman, S. T., Karl, D. M., Koblížek, M., Lomas, M. W., Mincer, T. J., Moore, L. R., Moutin, T., Rappé, M. S., and Webb, E. A. (2009). Phytoplankton in the ocean use non-phosphorus lipids in response to phosphorus scarcity. Nature 458, 69–72.
Villar-Argaiz, M., Medina-Sanchez, J. M., and Carrillo, P. (2002). Microbial plankton response to contrasting climatic conditions: insights from community structure, productivity and fraction stoichiometry. Aquat. Microb. Ecol. 29, 253–266.
Vrede, K., Heldal, M., Norland, S., and Bratbak, G. (2002). Elemental composition (C, N, P) and cell volume of exponentially growing and nutrient-limited bacterioplankton. Appl. Environ. Microbiol. 68, 2965–2971.
Warton, D. I., Wright, I. J., Falster, D. S., and Westoby, M. (2006). Bivariate line-fitting methods for allometry. Biol. Rev. Camb. Philos. Soc. 81, 259–291.
White, P. A., Kalff, J., Rasmussen, J. B., and Gasol, J. M. (1991). The effect of temperature and algal biomass on bacterial production and specific growth rate in freshwater and marine habitats. Microb. Ecol. 21, 99–118.
Keywords: stoichiometry, heterotrophs, carbon, nitrogen, phosphorus, nutrient regeneration
Citation: Cotner JB, Hall EK, Scott JT and Heldal M (2010) Freshwater bacteria are stoichiometrically flexible with a nutrient composition similar to seston. Front. Microbio. 1:132. doi: 10.3389/fmicb.2010.00132
Received: 10 September 2010;
Paper pending published: 29 September 2010;
Accepted: 08 November 2010;
Published online: 08 December 2010
Edited by:
George S. Bullerjahn, Bowling Green State University, USAReviewed by:
Robert M. Mckay, Bowling Green State University, USALucas Stal, The Netherlands Institute of Ecology/Royal Netherlands Academy of Arts and Sciences, Netherlands
Copyright: © 2010 Cotner, Hall, Scott and Heldal. This is an open-access article subject to an exclusive license agreement between the authors and the Frontiers Research Foundation, which permits unrestricted use, distribution, and reproduction in any medium, provided the original authors and source are credited.
*Correspondence: James B. Cotner, Department of Ecology, Evolution and Behavior, University of Minnesota, 1987 Upper Buford Circle, St. Paul, MN 55108, USA. e-mail:Y290bmUwMDJAdW1uLmVkdQ==