- 1 Department of Environmental Science, University of Eastern Finland, Kuopio, Finland
- 2 Finnish Environment Institute, Kuopio, Finland
- 3 Department of Bioresources/Microbiology, Austrian Institute of Technology, Seibersdorf, Austria
Methane is the second most abundant greenhouse gas in the atmosphere. A major part of the total methane emissions from lake ecosystems is emitted from littoral wetlands. Methane emissions are significantly reduced by methanotrophs, as they use methane as their sole energy and carbon source. Methanotrophic activity can be either activated or inhibited by nitrogen. However, the effects of nitrogen on methanotrophs in littoral wetlands are unknown. Here we report how nitrogen loading in situ affected the function and diversity of methanotrophs in a boreal littoral wetland. Methanotrophic community composition and functional diversity were analyzed with a particulate methane monooxygenase (pmoA) gene targeted microarray. Nitrogen load had no effects on methane oxidation potential and methane fluxes. Nitrogen load activated pmoA gene transcription of type I (Methylobacter, Methylomonas, and LW21-freshwater phylotypes) methanotrophs, but decreased the relative abundance of type II (Methylocystis, Methylosinus trichosporium, and Methylosinus phylotypes) methanotrophs. Hence, the overall activity of a methanotroph community in littoral wetlands is not affected by nitrogen leached from the catchment area.
Introduction
Methane (CH4) is the second most abundant greenhouse gas in the atmosphere after carbon dioxide. It is 25 times more efficient (with a time horizon of 100 years) as a greenhouse gas than carbon dioxide (Denman et al., 2007). It accounts for about 20% of the radiative forcing (warming effect) of the atmosphere (Denman et al., 2007). In oxic surface layers of wetlands, methanotrophs, which are aerobic methane oxidizing bacteria, can consume more than 90% of the CH4 produced in deeper anoxic layers (Oremland and Culbertson, 1992), implementing an important ecosystem service.
Taxonomically, methanotrophs belong to two phyla, Verrucomicrobia and Proteobacteria (Semrau et al., 2010). Verrucomicrobial methanotrophs have been shown to live only in extreme conditions in geothermal environments (Op den Camp et al., 2009), so they are not of particular interest to this study. Proteobacterial methanotrophs are divided into two classes, Gammaproteobacteria and Alphaproteobacteria (often referred to as type I and type II methanotrophs, respectively) on the basis of phylogeny, physiology, morphology, and biochemistry (Semrau et al., 2010). Type I methanotrophs are further divided into type Ia and type Ib subgroups based on their phylogeny (Bodrossy et al., 2003).
Methane mono-oxygenases (MMO) of methanotrophs are the key enzymes in the CH4 oxidation process, and the phylogeny of MMO genes corresponds well with 16S rRNA gene-based phylogeny. The gene fragments of the particulate form of MMO, pmoA, and soluble form of MMO, mmoX, can be used for the detection of a diversity of methanotrophs and their CH4 oxidation activity. Almost all methanotrophs possess the pmoA gene, and strains lacking it can be detected by mmoX-targeted approaches (Dedysh et al., 2005; Rahman et al., 2011; Vorobev et al., 2011). Most methanotrophs use only methane as their carbon and energy source, but some strains of Alphaproteobacteria methanotrophs have been shown to grow also with C2 substrates (Dedysh et al., 2005; Dunfield et al., 2010; Belova et al., 2011).
A littoral zone can contribute as much as 70% of the total CH4 emissions of lakes (Juutinen et al., 2003). Nitrogen (N) can either inhibit (Steudler et al., 1989) or stimulate (Bodelier et al., 2000) CH4 oxidation and subsequently cause higher or lower CH4 emissions. Both responses are possible in upland and wetland soils but the mechanisms behind the different effects are not fully understood (Bodelier and Laanbroek, 2004). Littoral wetlands, which are under the influence of the fluctuating water levels of lakes, are the target of N leached from the catchment. If N inhibits CH4 oxidation, the CH4 emissions from littoral wetlands can increase. However, the effects of nitrogen on the function and diversity of methanotrophs at the species level in littoral wetlands are unknown.
We studied the effects of experimental nitrogen loading in situ on the function and diversity of methanotrophs and fluxes of CH4 in a boreal littoral wetland during a growing season. The relative abundance of pmoA genes and gene transcripts was examined with a pmoA targeting diagnostic microarray (Bodrossy et al., 2003).
Materials and Methods
Study Site
The studied littoral wetland of the hypereutrophic Lake Kevätön is located in Eastern Finland (63°6′N, 27°37′E). Since spatial variation contributes to the function and diversity of methanotrophs, six (three for N fertilization and three for control) study plots of 1.44 m2 were randomly established in the “intermediate” area of the wetland, i.e., in the area 7–10 m from the shoreline (Siljanen et al., 2011). This area has only minor spatial variation in hydrology and distribution of vegetation. The vegetation consists mainly of sedges and it did not vary among the study plots (variances were tested by the Kruskal Wallis rank sum test, P > 0.35). The water level variation did not differ statistically significantly between the control and manipulated plots (Mixed model, P > 0.124… 0.421) although the N-treated plots had a slightly lower water table than the control plots (Figure A4 in Appendix).
Soil Sampling, Nitrogen Load, Biogeochemical Analyses, and Nucleic Acid Extractions from the Soils
Soil samples were taken on June 7, July 7, and August 16, 2007 from triplicate nitrogen and control plots. Nitrogen treatment (NH4NO3 dissolved in distilled H2O, total dose 10 g N m−2, corresponds with 100 kg N ha−1) was done four times during the 2007 growing season with 1 week intervals (2.5 g N m−2 each dose). Control plots received similar amounts of water (distilled H2O) as the nitrogen treated plots. The first soil samples were taken 14 days before the first nitrogen dose. The second soil samples were taken 14 days after the start of the nitrogen loading, when 50% (5.0 g N m−2) of the total nitrogen dose was applied (Figure A1 in Appendix). The last soil samples were collected 6 days after the nitrogen loading. Soil profiles were taken with a box corer (diameter 8 cm × 8 cm) from the plots and divided into 0–2, 2–10, and 10–20 cm layers. Methane fluxes, CH4 oxidation potential, and soil chemical characteristics (nitrate and ammonium concentrations) were determined as described previously (Siljanen et al., 2011). From each soil layer, 15 ml sub-samples were collected for molecular analyses of the methanotrophic community and were frozen immediately with dry ice at the study site. Soil was freeze-dried (−50°C, 48 h). DNA extractions were performed as described previously (Siljanen et al., 2011). RNA extractions and clean-up were done according to a protocol described by Steenbergh et al. (2010) with minor modifications: contaminating DNA was removed according to the manufacturer’s instructions with DNase I and cDNA synthesis with RevertAid MuLV–H reverse transcriptase, both provided by Fermentas.
Molecular Analyses of Methanotrophs
PCR products of pmoA genes for microarray analysis were amplified with a semi-nested approach with reaction mixtures and cycling conditions, as described earlier (Siljanen et al., 2011). The primers used for the semi-nested approach were A189 (5′-GGNGACTGGGACTTCTGG-3′), A682-T7 (5′-TAATACGACTCACTATAGGAASGCNGAGAAGAASGC-3′), and mb661-T7 (5′-TAATACGACTCACTATAGCCGGMGCAA CGTCYTTACC-3′). The relative abundance of pmoA genes and gene transcripts was examined with a pmoA microarray as described previously (Bodrossy et al., 2003). The presence of Methylocella and Methylocella-like methanotrophs was determined with a PCR method (Rahman et al., 2011). For amplification, 2 × Premix F (Epicentre), 1 unit of Taq polymerase (Invitrogen), and 50 ng of template DNA or cDNA were used. For amplification of pmoA genes 25 pmol of each primer was used, and 40 pmol of each primer was used for mmoX genes. Reactions were carried out in 50 μl volume. The PCR cycling conditions for Methylocella primers were the following: denaturation 95°C, 15 s, annealing 68°C, 1 min, elongation 72°C, 1 min for 45 cycles. The primers used for Methylocella PCR were mmoXLF (5′-GAAGATTGGGGCGGCATCTG-3′) and mmoXLR (5′-CCCAATCATCGCTGAAGGAGT-3′; Rahman et al., 2011). Cloned fragments of mmoX genes of Methylocella palustris were used as a positive control for the assay. For analysis of the diversity of Methylocella methanotrophs, PCR products were ligated to a pDRIVE vector and cloned, as described previously (Siljanen et al., 2011). Clones were subjected to restriction fragment length polymorphism (RFLP). In RFLP analysis, DNA of clones was digested with SalI and BamHI restriction enzymes and restriction patterns were visualized with electrophoresis in a 2.5% (w/v) agarose gel. Clones displaying identical restriction patterns were grouped into operational taxonomical units (OTUs). One to two clones per OTUs were sequenced. DNA sequencing was performed at the University of Eastern Finland Sequencing Laboratory with the MegaBACE 750 analysis system with a DYEnamic™ ET Dye Terminator Cycle Sequencing Kit. The identity of clones was examined by BLASTn searches of the GenBank database (Altschul et al., 1990).
Statistical Analysis
The effects of the manipulation on CH4 fluxes, CH4 oxidation, and on the responses of community composition and functional diversity of methanotrophs at the species level were analyzed with a mixed-effect model (proportional to a repeated measure ANOVA; Laird and Ware, 1982). Amplification of pmoA genes for four cDNA replicates (10–20 cm layer, mainly clay with negligible CH4 oxidation potential) did not succeed even though re-extraction was performed. In these cases, duplicates instead of triplicates were used for the analysis. For evaluating the effect of nitrogen at the species level of methanotrophs, 1020 mixed-effect models were calculated, one model for both manipulated and control plots and for each of 85 microarray probes showing positive signals. Prior to the analysis, the microarray data were square-root transformed. The effects of nitrogen loading were evaluated with the difference between the models of the manipulated and control plots (see example of model results in Figure A3 in Appendix). The normality of residuals was tested for each variable group to fulfill the requirements of the analysis set-up. Mixed-effect model tests were done with the statistical program SPSS 17.0 (SPSS Inc., USA). The relation between the change in the methanotroph community (both community composition and functional diversity), CH4 oxidation and nitrogen load was studied with constrained correspondence analysis (CCA). CCA analyses were performed for those microarray probes showing change. The analysis included the probes Mb271, Mb C11-403, Mm531, MmES546, Ia 193, Ia 575, LW21-374, LW21-391, Ib453, Mcy233, Mcy413, Mcy264, Mcy459, Mcy255, McyM309, MsT214, Msi269, MsS314, Msi423, Msi294, and NMsiT-271. The probes targeting the RA14 group (probe RA14-591) and Methycapsa (probes B2all343, B2all341) were omitted from the analysis because of lack of hybridization to species-specific probes (RA14-594, B2-400). Constrained correspondence analyses were conducted with the VEGAN (Oksanen et al., 2010) add-on package in the R 2.12.0 statistical program (R Development Core Team, 2010). The Pearson correlation co-efficients between nitrate and ammonium concentrations, CH4 oxidation potential, and microarray data were also calculated with the R program.
Results
Effects of Nitrogen on CH4 Oxidation and CH4 Fluxes
Nitrogen loading increased nitrate (Fnitrate = 12.792, P < 0.005, maximum in loaded plots was  ) concentration in the 0- to 2-cm soil layer (Figure A2 in Appendix). Ammonium concentration increased also slightly in this layer (Fammonium = 4.366, P = 0.059, the maximum in the loaded plots was
  ) as well as in the deeper layers (2–10 cm layer Fammonium = 3.409, P = 0.090; 10–20 cm layer Fammonium = 3.825, P = 0.076; Figure A2 in Appendix). Nitrogen load did not affect CH4 oxidation potential statistically significantly but CH4 oxidation increased during the experimental season in the 0- to 2-cm layer in both control and manipulated plots (Figure 1) as a result of changing environmental conditions (natural lowering in water table, Figure A4 in Appendix). Nitrogen loading had no significant effect also on the CH4 fluxes which decreased in both control and manipulated plots toward autumn as a result of the decrease in water level (Figure A4 in Appendix). The relative decrease in methane fluxes was higher in the N-treated plots (Figure 2) also indicating that nitrogen load did not inhibit methane oxidation.
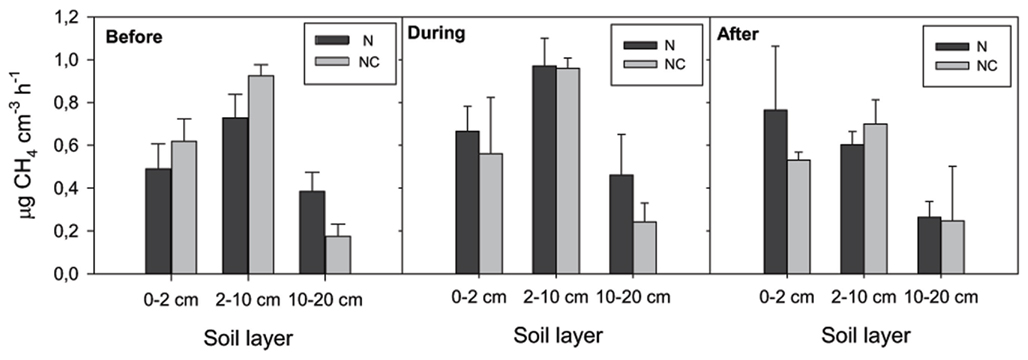
Figure 1. Methane oxidation potential. N denotes nitrogen loading plots and NC control plots. Fixed effect of nitrogen load: F0–2 cm layer = 0.105, P = 0.762; F2–10 cm layer = 0.821, P = 0.416; F10–20 cm layer = 2.035, P = 0.227.
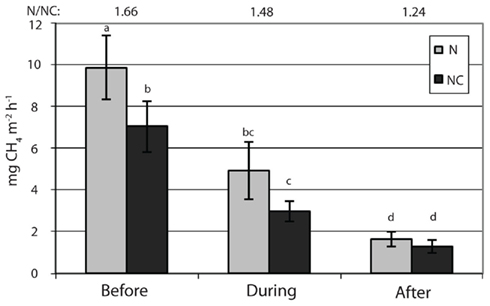
Figure 2. Methane fluxes. N denotes nitrogen loading plots and NC control plots. Fixed effect of nitrogen load: F = 2.3, P = 0.204. Significant differences in fluxes are marked with letters (P < 0.05). The ratio of methane fluxes in the nitrogen loaded plots to those in the control plots are shown by numbers on top of the figure.
Effects of Nitrogen on the Methanotrophic Community
The methanotrophic community structure was close the same in the manipulated and control plots before nitrogen loading, only a few phylotypes showed some variation (14 days before fertilization started; Figure 3A). Nitrogen loading changed the community structure and functional diversity of methanotrophs as revealed by mixed-effect models (Figure 3A) and CCA analysis (Figures 3B–D). When the site had received 50% of the total nitrogen load there was a decrease in the relative abundance of pmoA genes of type II (Methylocystis, Methylosinus trichosporium, and Methylosinus phylotypes, P < 0.05) methanotrophs in the 0- to 10-cm soil layers (Figure 3A; Figure A3A in Appendix). There was also an increase in the relative abundance of pmoA transcripts of type I (Methylobacter, Methylomonas, and LW21-freshwater phylotypes, P < 0.05) methanotrophs in the 2- to 10-cm soil layer (Figure 3A; Figure A3B in Appendix). CCA multivariate ordination analysis revealed a correlation between the concentrations of ammonium and nitrate and microarray data measured during nitrogen loading in affected soil layers and gene pools, as samples during the experiment are clustered together with the ordinated arrows for ammonium and nitrate (Figures 3B–D). Manipulation had the strongest effect on the community in the 2- to 10-cm soil layer (Figures 3C,D), and nitrate also had an effect on functional diversity after the experiment (Figure 3D). However, methanotrophic community also shows seasonal variation in the littoral wetland (Siljanen et al., 2012), and this variation was taken into account by comparing the nitrogen loading plots with non-treated control plots.
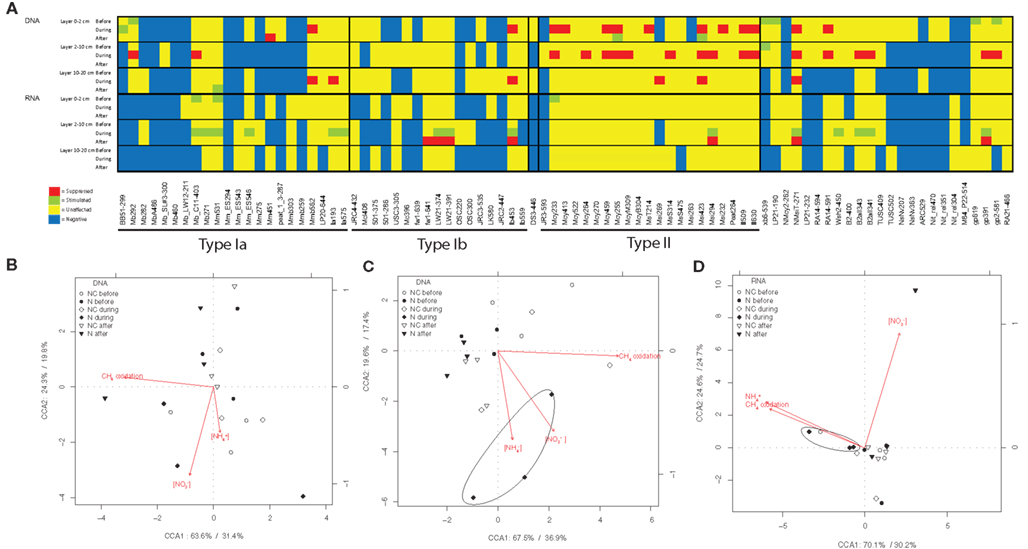
Figure 3. The effect of nitrogen loading on methanotrophs. The species level effects of nitrogen loading on relative abundance of pmoA genes (DNA) and relative abundance of pmoA transcripts (RNA) of methanotrophs. (A) The table summarizes the mixed-effect model tests between manipulated and control plots. Soil samples were taken from control and manipulated plots before, during and after the nitrogen loading for methanotroph community analysis, and the effects of manipulation were evaluated with mixed-effect models. Only probes with signals are shown. Table A2 in Appendix shows complete list of microarray probes used and specificity of them. Effects of nitrogen load on microarray probes in manipulated plots compared with control plots (df1 = 1, df2 = 12, P < 0.05) are marked at the each time point. Probe intensity inhibitions compared to control plots, are marked with red and stimulations with green. Yellow color means that probe is positive (but not affected by nitrogen) and blue that probe is negative. (B) Constrained correspondence analysis of nitrogen affected community, nitrogen content and CH4 oxidation in the 0- to 2-cm layer, and (C) in the 2- to 10-cm layer of DNA and (D) in the 2- to 10-cm layer of RNA samples. The percentages at the axes shows the proportion of constrained inertia explained by the constrained axis and inertia explained by unconstrained axis, respectively.
The effects of nitrogen loading on the methanotrophic community were also examined more deeply with correlation analysis for the relative abundance of pmoA genes and gene transcripts (Table A1 in Appendix). The relative abundance of the pmoA genes and gene transcripts of type I methanotrophs correlated positively with the content of ammonium and nitrate, while pmoA transcripts of type II methanotrophs correlated negatively with ammonium (Table A1 in Appendix). Across the experiment, type I and type II methanotrophs had opposite correlations with CH4 oxidation, suggesting differences in the reactions of the taxonomical groups to nitrogen (Table A1 in Appendix).
Discussion
Methane fluxes declined similarly in the control and manipulated plots over the study period because of the decrease in water level toward autumn. Nitrogen load had no statistically significant effects on either CH4 oxidation potential or CH4 fluxes in the littoral wetland, suggesting that the overall activity of methanotrophic communities there was not disturbed by nitrogen, although the methanotrophic community structure was affected. Similar observations on the tolerance of methane oxidation against nitrogen have been made previously in other soil types (Dunfield et al., 1995; Delgado and Mosier, 1996; Cai and Yan, 1999; Bykova et al., 2007).
As in our littoral wetland, nitrogen has been reported to inhibit type II methanotrophs in forest (Mohanty et al., 2006) and field soils (Cébron et al., 2007). The activity of type I methanotrophs was stimulated by nitrogen load in the present study as has been found in rice field soil (Bodelier et al., 2000; Mohanty et al., 2006; Noll et al., 2008; Shrestha et al., 2010) and in forest soil at high methane concentrations (Mohanty et al., 2006). Nitrogen leached from agricultural soils (Riley et al., 2001; Pare et al., 2006) to littoral wetlands evidently does not inhibit CH4 oxidation because methanotrophic communities there are dominated by type I methanotrophs (Siljanen et al., 2011).
In the littoral wetland, pmoA gene transcription of type I methanotrophs was stimulated but not the relative abundance of these methanotrophs, indicating the existence of factors limiting the increase in their number. It can be that type I methanotrophs are nitrogen limited in the littoral wetland and subsequently stimulated by nitrogen load (see later) similarly to the rhizosphere of rice (Bodelier et al., 2000). Selective grazing by protists on type I methanotrophs (Murase and Frenzel, 2008) may be another reason for the lack of increase in their relative abundance.
It has been suggested that the inhibition of type II methanotrophs by nitrogen is due to competition between different types of methanotrophs (Cébron et al., 2007). In nitrogen-rich conditions, type I methanotrophs could outcompete type II methanotrophs. This can be associated to the better ability of type II methanotrophs to fix molecular nitrogen, which lowers their need for ammonium and nitrate (Murrell and Dalton, 1983). Thus, type I methanotrophs can increase their CH4 oxidation activity by nitrogen addition in nitrogen-limited environments. Biomass production of wetland plants in the littoral wetland studied is high (Larmola et al., 2003) causing high demand for nitrogen, and nitrogen can also be efficiently removed by denitrification in wetland. Competition for nitrogen there is thus high.
A similar inhibitory effect of nitrogen on type II methanotrophs, as in the littoral wetland here, has been detected among Methylocystis methanotrophs (Mohanty et al., 2006; Cébron et al., 2007). In the littoral wetland, Methylosinus and M. trichosporium methanotrophs were also inhibited (Figure 3A). However, nitrogen loading increased the relative abundance of pmoA transcripts of one Methylosinus phylotype (Msi294). The results of the present study support the findings that nitrogen can reduce CH4 oxidation if type II methanotrophs dominate the methanotrophic community (Mohanty et al., 2006).
Since the microarray method depicts the relative abundance in methanotrophic communities, a change in the relative abundance of type II methanotrophs could be a result either of an increase in the relative abundance of type I methanotrophs over type II methanotrophs, or a decrease in the relative abundance of type II methanotrophs. However, microarray data indicated no distinctive co-increase of type I methanotrophs during the experiment when inhibition of type II methanotrophs took place (Figure A3A in Appendix), suggesting that type II methanotrophs have been inhibited by nitrogen load as such, not through competition between type I and type II methanotrophs. However, it is important to note that the methanotrophic community of the littoral wetland reacted rapidly to nitrogen load and acclimated to the prevailing conditions. The shift in the methanotroph community took place within 14 days after the start of the nitrogen loading, and the community recovered soon after the loading ended (Figure 3A). This reveals the ability of methanotrophic community in the littoral wetland to withstand environmental changes and perturbations.
The semi-nested PCR approach and microarray probe set-up targeted type I and type II methanotrophs as well as RA14 members of upland soil cluster α (USCα) methanotrophs and Methylocapsa methanotrophs but excluded Crenothrix, Methylocella, and Verrucomicrobia methanotrophs. However, it was proven by analysis of A682 PCR products with the pmoA microarray (detects Crenothrix, Siljanen et al., 2011) that Crenothrix methanotrophs were not present in that part of the wetland studied here (data not shown). Thus, Crenothrix may play a role in littoral wetlands but only in the areas with a higher water table than that in the area used in this study (Siljanen et al., 2011). Methylocella specific primers mmoXLF/R (Rahman et al., 2011) showed only a few negligible and very faint products from DNA samples and none from RNA samples. Therefore, although Methylocella methanotrophs are found in the littoral wetland, they play only a limited role in the CH4 oxidation.
The studied littoral wetland has a moderately high diversity of methanotrophs: 47 OTUs with 93% similarity (Siljanen et al., 2011), compared with other environments: 26 OTUs in temperate forest soils, 93% similarity (Degelmann et al., 2010), and about 35 OTUs, 90% similarity, in rice field soils (Lüke et al., 2010). Since the sub-communities of this diverse community in the littoral wetland react differently to nitrogen load, the overall effect of nitrogen loading was neutral, causing no change in CH4 oxidation potential or CH4 fluxes.
There are only a few studies where the effects of nitrogen on CH4 fluxes and the methanotrophic community composition in situ have been studied simultaneously. Previous studies have investigated the effects of nitrogen load on the functioning and diversity of methanotrophs using microcosms and incubation experiments (Bodelier et al., 2000; Mohanty et al., 2006; Cébron et al., 2007; Noll et al., 2008; Shrestha et al., 2010). Here we provide new insights into how the nitrogen load affects the methanotrophic community and its functioning in situ.
In conclusion, methane oxidation in boreal littoral wetland tolerates nitrogen load as a result of diverse methanotrophic community. Although some methanotrophs are suffered by nitrogen, there are methanotrophs responding positively to extra nitrogen.
Conflict of Interest Statement
The authors declare that the research was conducted in the absence of any commercial or financial relationships that could be construed as a potential conflict of interest. Nucleotide sequence accession numbers: sequences from this study are under Accession numbers HE653916-HE653917 in the EMBL-bank.
Acknowledgments
We thank S. Hämäläinen, K. Martikainen, T. Rahkonen, N. Partanen, R. Laroma, N. Stralis-Pavese, and G. C. J. Abell for technical assistance, and V. Paganuzzi for comments on the language of the manuscript. The academy of Finland (ESF and EuroDIVERSITY-METHECO), the Maj and Tor Nessling Foundation, the Niemi Foundation, Maa-ja vesitekniikan tuki association, and the Kone Foundation are acknowledged for financial support. Research at AIT was supported by the ESF EuroDiversity program METHECO (No. FP018, local funding agencies: FWF, Austria, project number I40-B06).
References
Altschul, S. F., Gish, W., Miller, W., Myers, E. W., and Lipman, D. J. (1990). Basic local alignment search tool. J. Mol. Biol. 215, 403–410.
Belova, S. E., Baani, M., Suzina, N. E., Bodelier, P. L. E., Liesack, W., and Dedysh, S. N. (2011). Acetate utilization as a survival strategy of peat-inhabiting Methylocystis spp. Environ. Microbiol. Rep. 3, 36–46.
Bodelier, P. L. E., and Laanbroek, H. J. (2004). Nitrogen as a regulatory factor of methane oxidation in soils and sediments. FEMS Microbiol. Ecol. 47, 265–277.
Bodelier, P. L. E., Roslev, P., Henckel, T., and Frenzel, P. (2000). Stimulation by ammonium-based fertilizers of methane oxidation in soil around rice roots. Nature 403, 421–424.
Bodrossy, L., Stralis-Pavese, N., Murrell, J. C., Radajewski, S., Weilharter, A., and Sessitsch, A. (2003). Development and validation of a diagnostic microbial microarray for methanotrophs. Environ. Microbiol. 5, 566–582.
Bykova, S., Boeckx, P., Kravchenko, I., Galchenko, V., and Van Cleemput, O. (2007). Response of CH4 oxidation and methanotrophic diversity to NH4+ and CH4 mixing ratios. Biol. Fertil. Soils 43, 341–348.
Cai, Z. C., and Yan, X. Y. (1999). Kinetic model for methane oxidation by paddy soil as affected by temperature, moisture and N addition. Soil Biol. Biochem. 31, 715–725.
Cébron, A., Bodrossy, L., Stralis-Pavese, N., Singer, A. C., Thompson, I. P., Prosser, J. I., and Murrell, J. C. (2007). Nutrient amendments in soil DNA stable isotope probing experiments reduce the observed methanotroph diversity. Appl. Environ. Microbiol. 73, 798–807.
Dedysh, S. N., Knief, C., and Dunfield, P. F. (2005). Methylocella species are facultatively methanotrophic. Environ. Microbiol. 187, 4665–4670.
Degelmann, D. M., Borken, W., Drake, H. L., and Kolb, S. (2010). Different atmospheric methane-oxidizing communities in European beech and Norway spruce soils. Appl. Environ. Microbiol. 76, 3228–3235.
Delgado, J. A., and Mosier, A. R. (1996). Mitigation alternatives to decrease nitrous oxides emissions and urea-nitrogen loss and their effect on methane flux. J. Environ. Qual. 25, 1105–1111.
Denman, K. L., Brasseur, G., Chidthaisong, A., Ciais, P., Cox, P. M., Dickinson, R. E., Hauglustaine, D., Heinze, C., Holland, E., Jacob, D., Lohmann, U., Ramachandran, S., da Silva Dias, P. L., Wofsy, S. C., and Zhang, X. (2007). “Couplings between changes in the climate system and biogeochemistry,” in Climate Change 2007: The Physical Science Basis. Contribution of Working Group I to the Fourth Assessment Report of the Intergovernmental Panel on Climate Change, eds S. Solomon, D. Qin, M. Manning, Z. Chen, M. Marquis, K. B. Averyt, M. Tignor, and H. L. Miller (Cambridge: Cambridge University Press), 500–587.
Dunfield, P. F., Belova, S. E., Vorob’ev, A. V., Cornish, S. L., and Dedysh, S. N. (2010). Methylocapsa aurea sp. nov., a facultatively methanotrophic bacterium possessing a particulate methane monooxygenase. Int. J. Syst. Evol. Microbiol. 60, 2659–2664.
Dunfield, P. F., Topp, E., Archambault, C., and Knowles, R. (1995). Effect of nitrogen fertilizers and moisture-content on CH4 and N2O fluxes in a humisol – measurements in the field and intact soil cores. Biogeochemistry 29, 199–222.
Juutinen, S., Alm, J., Larmola, T., Huttunen, J. T., Morero, M., Martikainen, P. J., and Silvola, J. (2003). Major implication of the littoral zone for methane release from boreal lakes. Global Biogeochem. Cycles 17, 1117.
Laird, N. M., and Ware, J. H. (1982). Random-effects models for longitudinal data. Biometrics 38, 963–974.
Larmola, T., Alm, J., Juutinen, S., Martikainen, P. J., and Silvola, J. (2003). Ecosystem CO2 exchange and plant biomass in the littoral zone of a boreal eutrophic lake. Freshw. Biol. 48, 1295–1310.
Lüke, C., Krause, S., Cavigiolo, S., Greppi, D., Lupotto, E., and Frenzel, P. (2010). Biogeography of wetland rice methanotrophs. Environ. Microbiol. 12, 862–872.
Mohanty, S. R., Bodelier, P. L. E., Floris, V., and Conrad, R. (2006). Differential effects of nitrogenous fertilizers on methane consuming microbes in rice field and forest soils. Appl. Environ. Microbiol. 72, 1346–1354.
Murase, J., and Frenzel, P. (2008). Selective grazing of methanotrophs by protozoa in a rice field soil. FEMS Microbiol. Ecol. 65, 408–414.
Murrell, J. C., and Dalton, H. (1983). Nitrogen fixation in obligate methanotrophs. J. Gen. Microbiol. 129, 3481–3486.
Noll, M., Frenzel, P., and Conrad, R. (2008). Selective stimulation of type I methanotrophs in a rice paddy soil by urea fertilization revealed by RNA-based stable isotope probing. FEMS Microbiol. Ecol. 65, 125–132.
Oksanen, J., Blanchet, F. G., Kindt, R., Legendre, P., O’Hara, R. B., Simpson, G. L., Solymos, P., Stevens, M. H. H., and Wagner, H. (2010). vegan: Community Ecology Package. R package version 1.17-4. Available at: http://CRAN.R-project.org/
Op den Camp, H. J. M., Islam, T., Stott, M. B., Harhangi, H. R., Hynes, A., Schouten, S., Jetten, M. S. M., Birkeland, N. K., Pol, A., and Dunfield, P. F. (2009). Environmental, genomic and taxonomic perspectives on methanotrophic Verrucomicrobia. Environ. Microbiol. Rep. 1, 293–306.
Oremland, R. S., and Culbertson, C. W. (1992). Importance of methane-oxidizing bacteria in the methane budget as revealed by the use of specific inhibitor. Nature 356, 421–423.
Pare, K., Chantigny, M. H., Carey, K., Johnston, W. J., and Dionne, J. (2006). Nitrogen uptake and leaching under annual bluegrass ecotypes and bentgrass species: a lysimeter experiment. Crop Sci. 46, 847–853.
R Development Core Team. (2010). R: A language and environment for statistical Computing 2.12.0. Vienna: R Foundation for Statistical Computing. Available at: http://www.R-project.org
Rahman, M. T., Crombie, A., Chen, Y., Stralis-Pavese, N., Bodrossy, L., Meir, P., McNamara, N. P., and Murrell, J. C. (2011). Environmental distribution and abundance of the facultative methanotroph Methylocella. ISME J 5, 1061–1066.
Riley, W. J., Ortiz-Monasterio, I., and Matson, P. A. (2001). Nitrogen leaching and soil nitrate, nitrite, and ammonium levels under irrigated wheat in Northern Mexico. Nutr. Cycl. Agroecosys. 61, 223–236.
Semrau, J. D., DiSpirito, A. A., and Yoon, S. (2010). Methanotrophs and copper. FEMS Microbiol. Rev. 34, 496–531.
Shrestha, M., Shrestha, P. M., Frenzel, P., and Conrad, R. (2010). Effect of nitrogen fertilization on methane oxidation, abundance, community structure, and gene expression of methanotrophs in the rice rhizosphere. ISME J. 4, 1545–1556.
Siljanen, H. M. P., Saari, A., Bodrossy, L., and Martikainen, P. J. (2012). Seasonal variation in the function and diversity of methanotrophs in the littoral wetland of a boreal eutrophic lake. FEMS Microbiol. Ecol. (in press).
Siljanen, H. M. P., Saari, A., Krause, S., Lensu, A., Abell, G. C. J., Bodrossy, L., Bodelier, P. L. E., and Martikainen, P. J. (2011). Hydrology is reflected in the functioning and community composition of methanotrophs in the littoral wetland of a boreal lake. FEMS Microbiol. Ecol. 75, 430–445.
Steenbergh, A. K., Meima, M. M., Kamst, M., and Bodelier, P. L. E. (2010). Biphasic kinetics of a methanotrophic community is a combination of growth and increased activity per cell. FEMS Microbiol. Ecol. 71, 12–22.
Steudler, P. A., Bowden, R. D., Melillo, J. M., and Aber, J. D. (1989). Influence of nitrogen fertilization on methane uptake in temperate forest soils. Nature 341, 314–316.
Vorobev, A. V., Baani, M., Doronina, N. V., Brady, A. L., Liesack, W., Dunfield, P. F., and Dedysh, S. N. (2011). Methyloferula stalleta gen. nov., sp. nov., and acidophilic, obligately methanotrophic bacterium possessing only a soluble methane monooxygenase. Int. J. Syst. Evol. Microbiol. 61, 2456–2463.
Appendix
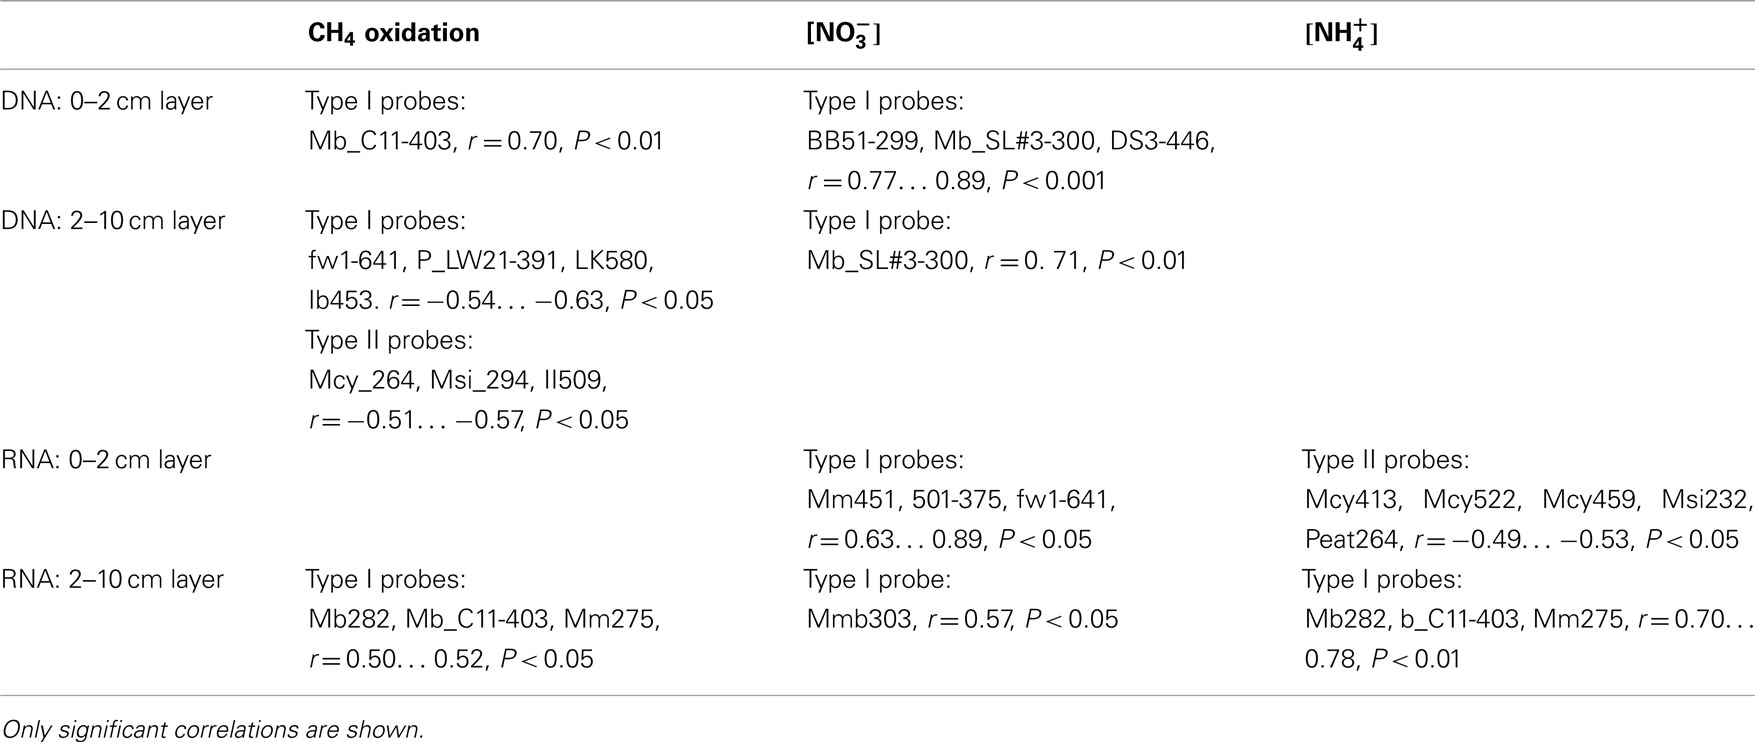
Table A1. Pearson correlation co-efficients across the experiment between methanotroph relative abundance of pmoA genes/pmoA transcripts, CH4 oxidation potential, and concentration of nitrate/ammonium (n = 18).
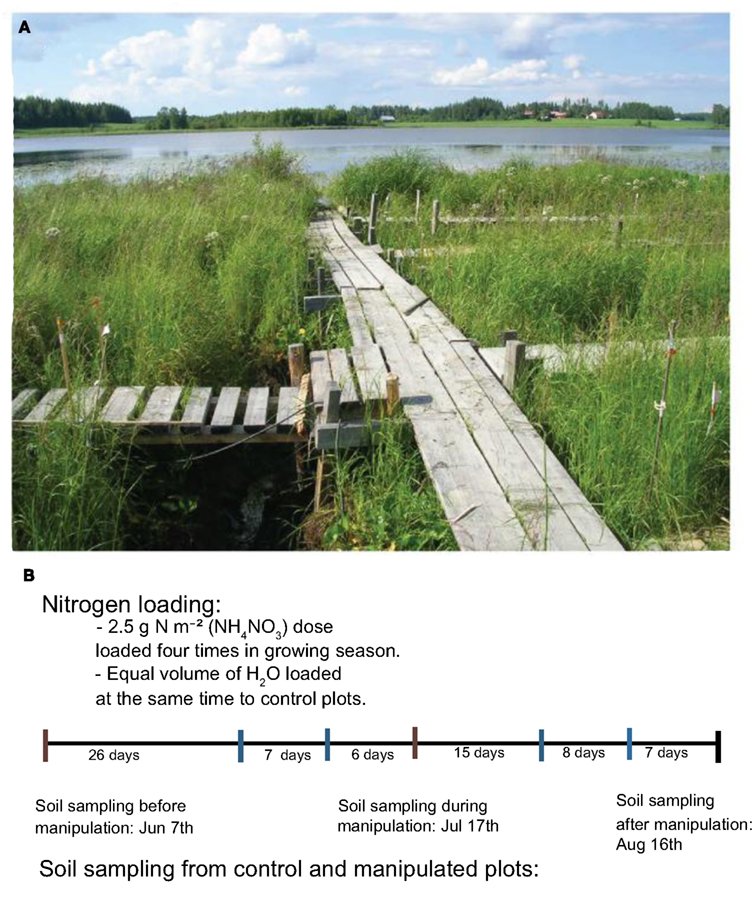
Figure A1. (A) The littoral wetland of Lake Kevätön in July 2007. For experiment, three control and three manipulated plots of 1.44 m2 were established to area having equal water level and vegetation. The chambers for measurements of in situ CH4 fluxes were inserted into study plots 2 weeks before the experiment. Soil sampling and in situ CH4 flux measurements were taken from boardwalks to omit disturbance of the soil. (B) Soil sampling and nitrogen loading scheme. Time points of soil samplings and nitrogen/water loading are colored with brown and blue respectively. Methane fluxes were measured three times before, during and after the nitrogen loading (with 1–2 week intervals). During the N loading period, fluxes were measured before addition of NH4NO3 solution or distilled water.
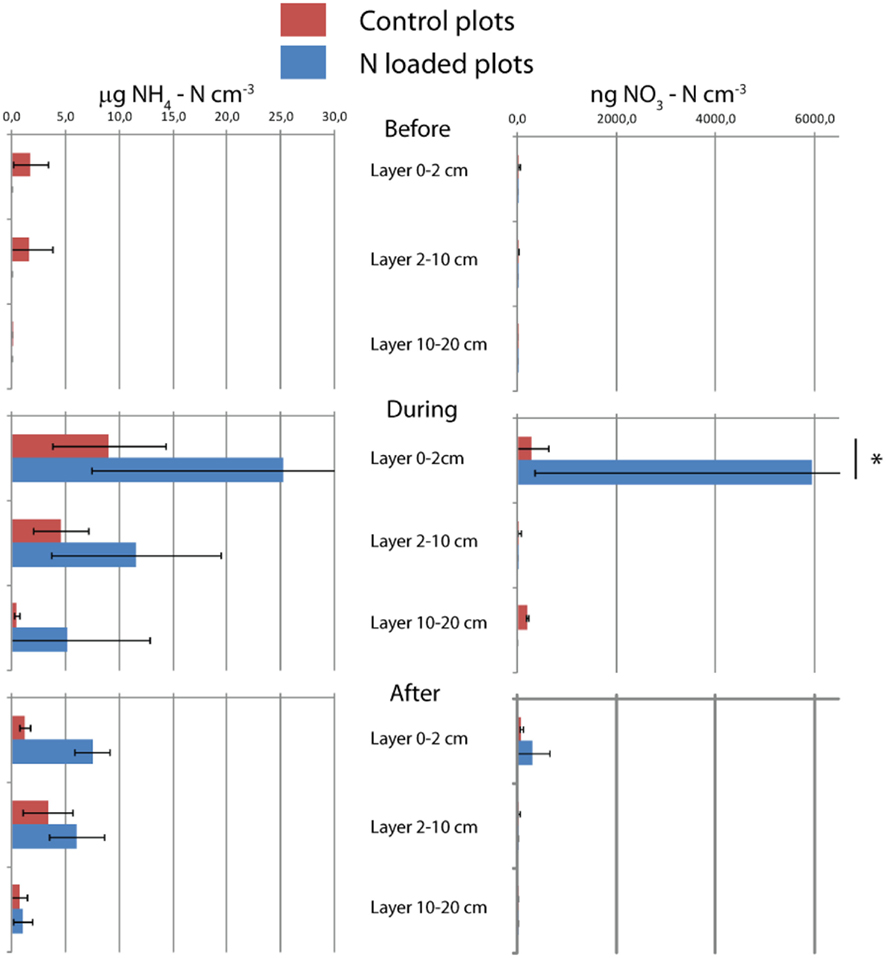
Figure A2. Nitrogen content of soil. Means and SDs of triplicates are shown. The asterisk indicates the difference between control and manipulation (P < 0.01).
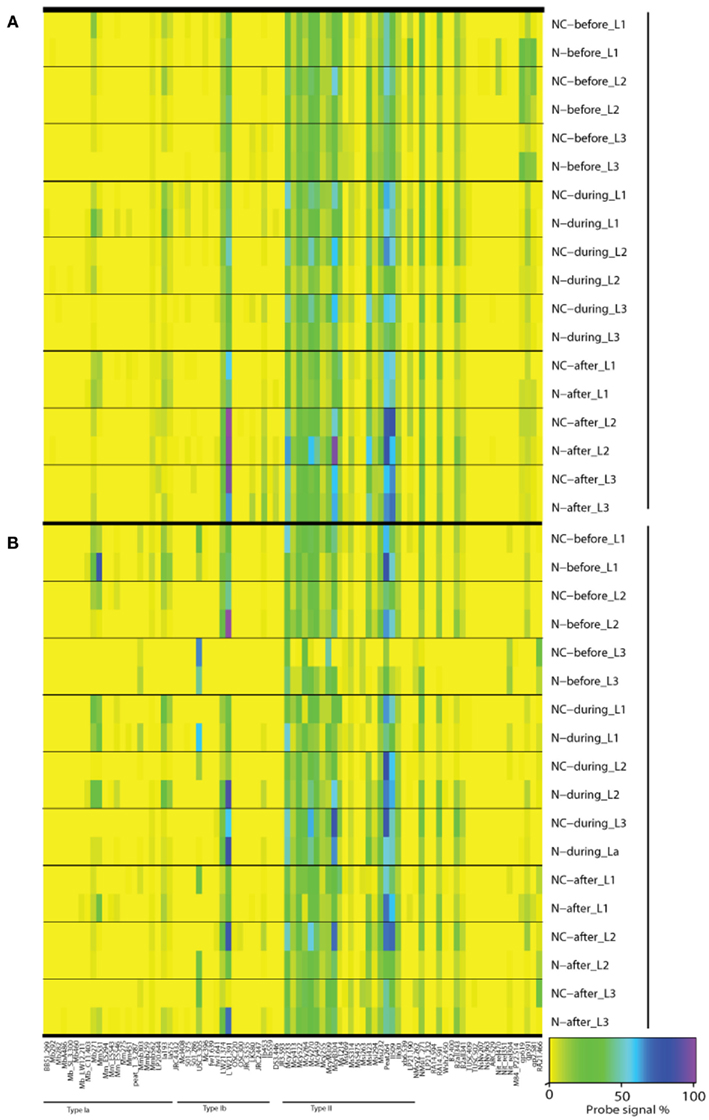
Figure A3. Microarray results of community composition [(A), DNA] and functional diversity [(B), RNA] of methanotrophs before, during, and after nitrogen loading. Averages of triplicate plots are shown. A value of 100 (purple) indicates the maximum and a value of 0 (yellow) indicates the minimum signal intensity of a probe against reference hybridizations determined for each probe individually (Bodrossy et al., 2003). Only probes having positive hybridization are shown. N denotes nitrogen loading plots, NC control plots, L1 0–2 cm layer, L2 2–10 cm layer, and L3 10–20 cm layer.
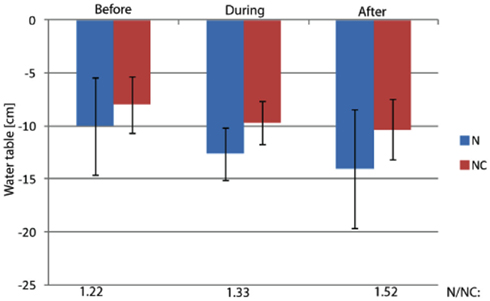
Figure A4. The water table in the study plots. The water table was measured from perforated plastic tubes inserted in soil inside the study plots. The ratio of mean water level of nitrogen loaded and control plots is marked on bottom of the figure.
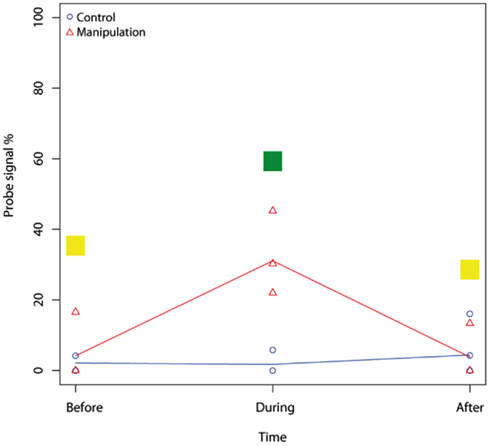
Figure A5. Example of a mixed-effect model result for the microarray probe Mb271 (RNA samples, 2–10 cm). Mixed-effect model comparison evaluated the difference between two fitted models, the control and the manipulation model. In Figure 3A, the result of each comparison is shown in color, thus, no effect on studied microarray probe by nitrogen = yellow, stimulated effect = green, inhibited effect = red, and for negative probes = blue.
Keywords: methane, littoral wetland, methanotrophs, nitrogen, pmoA gene, pmoA transcript, pmoA microarray
Citation: Siljanen HMP, Saari A, Bodrossy L and Martikainen PJ (2012) Effects of nitrogen load on the function and diversity of methanotrophs in the littoral wetland of a boreal lake. Front. Microbio. 3:39. doi: 10.3389/fmicb.2012.00039
Received: 25 November 2011;
Accepted: 24 January 2012;
Published online: 20 February 2012.
Edited by:
Svetlana N. Dedysh, Russian Academy of Sciences, RussiaReviewed by:
Ingeborg Bussmann, Alfred-Wegener-Institut, GermanyYin Chen, University of Warwick, UK
Copyright: © 2012 Siljanen, Saari, Bodrossy and Martikainen. This is an open-access article distributed under the terms of the Creative Commons Attribution Non Commercial License, which permits non-commercial use, distribution, and reproduction in other forums, provided the original authors and source are credited.
*Correspondence: Henri M. P. Siljanen, Department of Environmental Science, University of Eastern Finland, P. O. Box 1627, FI-70211 Kuopio, Finland. e-mail:aGVucmkuc2lsamFuZW5AdWVmLmZp
†Present address: Levente Bodrossy, National Research Flagship, CSIRO Marine and Atmospheric Research and Wealth from Oceans, Hobart, TAS, Australia.


