


- 1 Department of Geology, Appalachian State University, Boone, NC, USA
- 2 UMR 7619 Sisyphe, CNRS – Université Pierre et Marie Curie, 75005 Paris, France
- 3 Environmental Science, Policy and Management, University of California, Berkeley, CA, USA
Enhanced anthropogenic inputs of nitrogen (N) and sulfur (S) have disturbed their biogeochemical cycling in aquatic and terrestrial ecosystems. The N and S cycles interact with one another through competition for labile forms of organic carbon between nitrate-reducing and sulfate-reducing bacteria. Furthermore, the N and S cycles could interact through nitrate  reduction coupled to S oxidation, consuming
  and producing sulfate
  The research questions of this study were: (1) what are the environmental factors explaining variability in N and S biogeochemical reaction rates in a wide range of surficial aquatic sediments when
  and
and  are present separately or simultaneously, (2) how the N and S cycles could interact through S oxidation coupled to
  reduction, and (3) what is the extent of sulfate reduction inhibition by nitrate, and vice versa. The N and S biogeochemical reaction rates were measured on intact surface sediment slices using flow-through reactors. The two terminal electron acceptors
  and
and  were added either separately or simultaneously and
  and
and  reduction rates as well as
  reduction linked to S oxidation were determined. We used redundancy analysis, to assess how environmental variables were related to these rates. Our analysis showed that overlying water pH and salinity were two dominant environmental factors that explain 58% of the variance in the N and S biogeochemical reaction rates when
  and
and  were both present. When
  and
and  were added separately, however, sediment N content in addition to pH and salinity accounted for 62% of total variance of the biogeochemical reaction rates. The
  addition had little effect on
  reduction; neither did the
  addition inhibit
  reduction. The presence of
  led to
  production most likely due to the oxidation of sulfur. Our observations suggest that metal-bound S, instead of free sulfide produced by
  reduction, was responsible for the S oxidation.
Introduction
Human-induced disturbances to the nitrogen (N) and sulfur (S) biogeochemical cycles, resulting for instance from atmospheric deposition and agricultural activities, have altered the global storage and fluxes of those elements (Schlesinger, 1997; Galloway et al., 2008). More specifically, the N and S loadings to aquatic ecosystems have increased dramatically due to anthropogenic activities in recent decades (Schlesinger, 1997), which lead to intensified interactions between the N and S cycles. For example, increased N loading associated with coastal development may lead to overlapping zones of abundant N and S in tidal creeks and salt marsh estuaries (Howarth et al., 1996). Furthermore, S content in freshwater ecosystems used to be too low (Holmer and Storkholm, 2001) for interactions between the N and S cycles to play a significant role in the biogeochemical cycles of those elements in such systems. However, salt water intrusion due to frequent hurricanes and storm surge caused by climate change in coastal areas (Ericson et al., 2006) have resulted in an increase in S concentrations in freshwater systems. Furthermore, whereas atmospheric S deposition from fossil fuel burning has decreased in North America and Europe due to air pollution control measures (Mayewski et al., 1990; Fischer et al., 1998), it is still important in southern Asia (Duan et al., 2007). There is consequently a pressing need to understand how biogeochemical processes constitutive of the N and S cycles will interact with one another in these human-altered environments. The N and S cycles are driven by microbially mediated reactions affecting the redox states of both elements, and consequently their mobility and availability. Among them, denitrification converts nitrate  to dinitrogen gas (N2), effectively removing N from the soluble and bioavailable pools (Knowles, 1982). Similarly, S cycling in anoxic aquatic sediments involves both reductive and oxidative processes (Holmer and Storkholm, 2001). Both
  and sulfate
  are commonly used as terminal electron acceptors (TEA) for microbial respiration in anoxic sediments, with
  being energetically more favorable than
  (Froelich et al., 1979). Whereas nitrate reduction is a widespread process carried out by members of the alpha, beta, gamma, and epsilon Proteobacteria, Gram-positive Bacteria, and Archaea (Zumft, 1997; Philippot, 2002), sulfate reduction is more specialized and restricted to members of the delta Proteobacteria and Archaea (Wagner et al., 1998; Muyzer and Stams, 2008). Whether as a competitive or inhibitory phenomenon, a decrease in sulfate reduction has been reported upon nitrate addition (Westermann and Ahring, 1987; Whitmire and Hamilton, 2005). Sulfide as the final product of sulfate reduction can be microbially oxidized coupled to nitrate, manganese, and iron reduction in anoxic environments or rapidly incorporated into minerals such as iron monosulfides (FeS) and pyrite (FeS2) (Thamdrup et al., 1994). An important interaction between the N and the S cycles is denitrification coupled with biotic sulfide oxidation (Brettar and Rheinheimer, 1991; Garciagil and Golterman, 1993; Burgin and Hamilton, 2007). The biogeochemical importance of
  use by S-oxidizing bacteria has been widely recognized in marine sediments (Brettar and Rheinheimer, 1991) as well as freshwater sediments (Brunet and GarciaGil, 1996; Whitmire and Hamilton, 2005) and groundwater systems (Engesgaard and Kipp, 1992; Jorgensen et al., 2009). This process is used to mitigate toxic sulfide production in organic-rich sludge through
  sulfide oxidation (Schwermer et al., 2010). Vice versa, elemental sulfur has also been applied to wastewater treatment to remove
  by coupled sulfur oxidation and
  reduction (Sierra-Alvarez et al., 2007).
Numerous studies have investigated the environmental (physical and biogeochemical) factors controlling the N and S cycling to better understand the processes involved, interpret the observed rates, and extrapolate them across temporal and spatial scales (Cornwell et al., 1999; Seitzinger et al., 2006; Wallenstein et al., 2006; Burgin and Hamilton, 2007). Most of those studies however, have examined the N and S cycling separately, either on individual sites or single ecosystem and the controls vary across systems. Therefore, the goal of the present study was to investigate the environmental factors controlling N and S biogeochemical reaction rates in a range of littoral sediments. For that purpose we compared fourteen surficial aquatic sediments from lakes, rivers, estuaries, salt marshes, and marine coastal sites that were characterized by a wide range of water salinity, pH,  and
and  concentration, as well as sediment porosity, organic carbon (Corg), N, Arsenic (As), and iron (Fe) contents. We subsequently investigated possible interactions between the N and S cycles via comparison of N and S biogeochemical reaction rates measured when
  and
and  were present separately or concomitantly. Understanding the effects of environmental parameters on the coupled N and S cycles will help us elucidate potential mechanisms that lead to this coupling and generalize our findings across ecosystems types.
Materials and Methods
Study Sites
We conducted a multi-site study, investigating surficial sediments from 14 aquatic systems ranging from freshwater to hypersaline in the USA and Europe. Identical analytical methods were used at all sites and a large number of water and sediment physical and chemical characteristics were measured as described below. The sites include temperate lakes, rivers, salt marshes, estuaries, and marine coastal waters in France, the Netherlands, and the USA (California; see Table 1). Sites were selected to encompass a range of salinities, as well as  and
and  concentrations in sediment overlying waters. We sampled two freshwater sites (Tresmes, Créteil), eight estuarine and salt marsh sites covering brackish (Elkhorn Slough, Elkhorn Slough Marsh, Waarde), brackish/saline conditions (Pescadero, Baylands) and saline conditions (Hourdel Port, Hourdel Salt Marsh, Rattekaai), two marine sites (Humboldt Bay and North CA Coast) and two hypersaline sites (Mono Lake Boat Launch and Mono Lake Black Point). Intact surficial sediment cores (4.2 cm inside diameter) were collected from each site and samples corresponding to the top 1 cm of the sediments were used for the flow-through experiments and physico-chemical characterization (except North CA Coast and Humboldt Bay where the top 2 cm were used). All estuarine sediments were sampled by hand in intertidal mudflats. River and lake sediments were sampled by hand 1–2 m from the river bank in water depths no greater than 0.5 m to avoid surface perturbations and sediment resuspension. Marine sediments from the North California (CA) Coast and Humboldt Bay were sampled from a ship at water depths of 70 and 10 m, respectively, using a bottom grab device that left the sediment surface intact. All sediment samples were transported and stored at 4°C under anoxic conditions for 1–3 days until the experiments started.
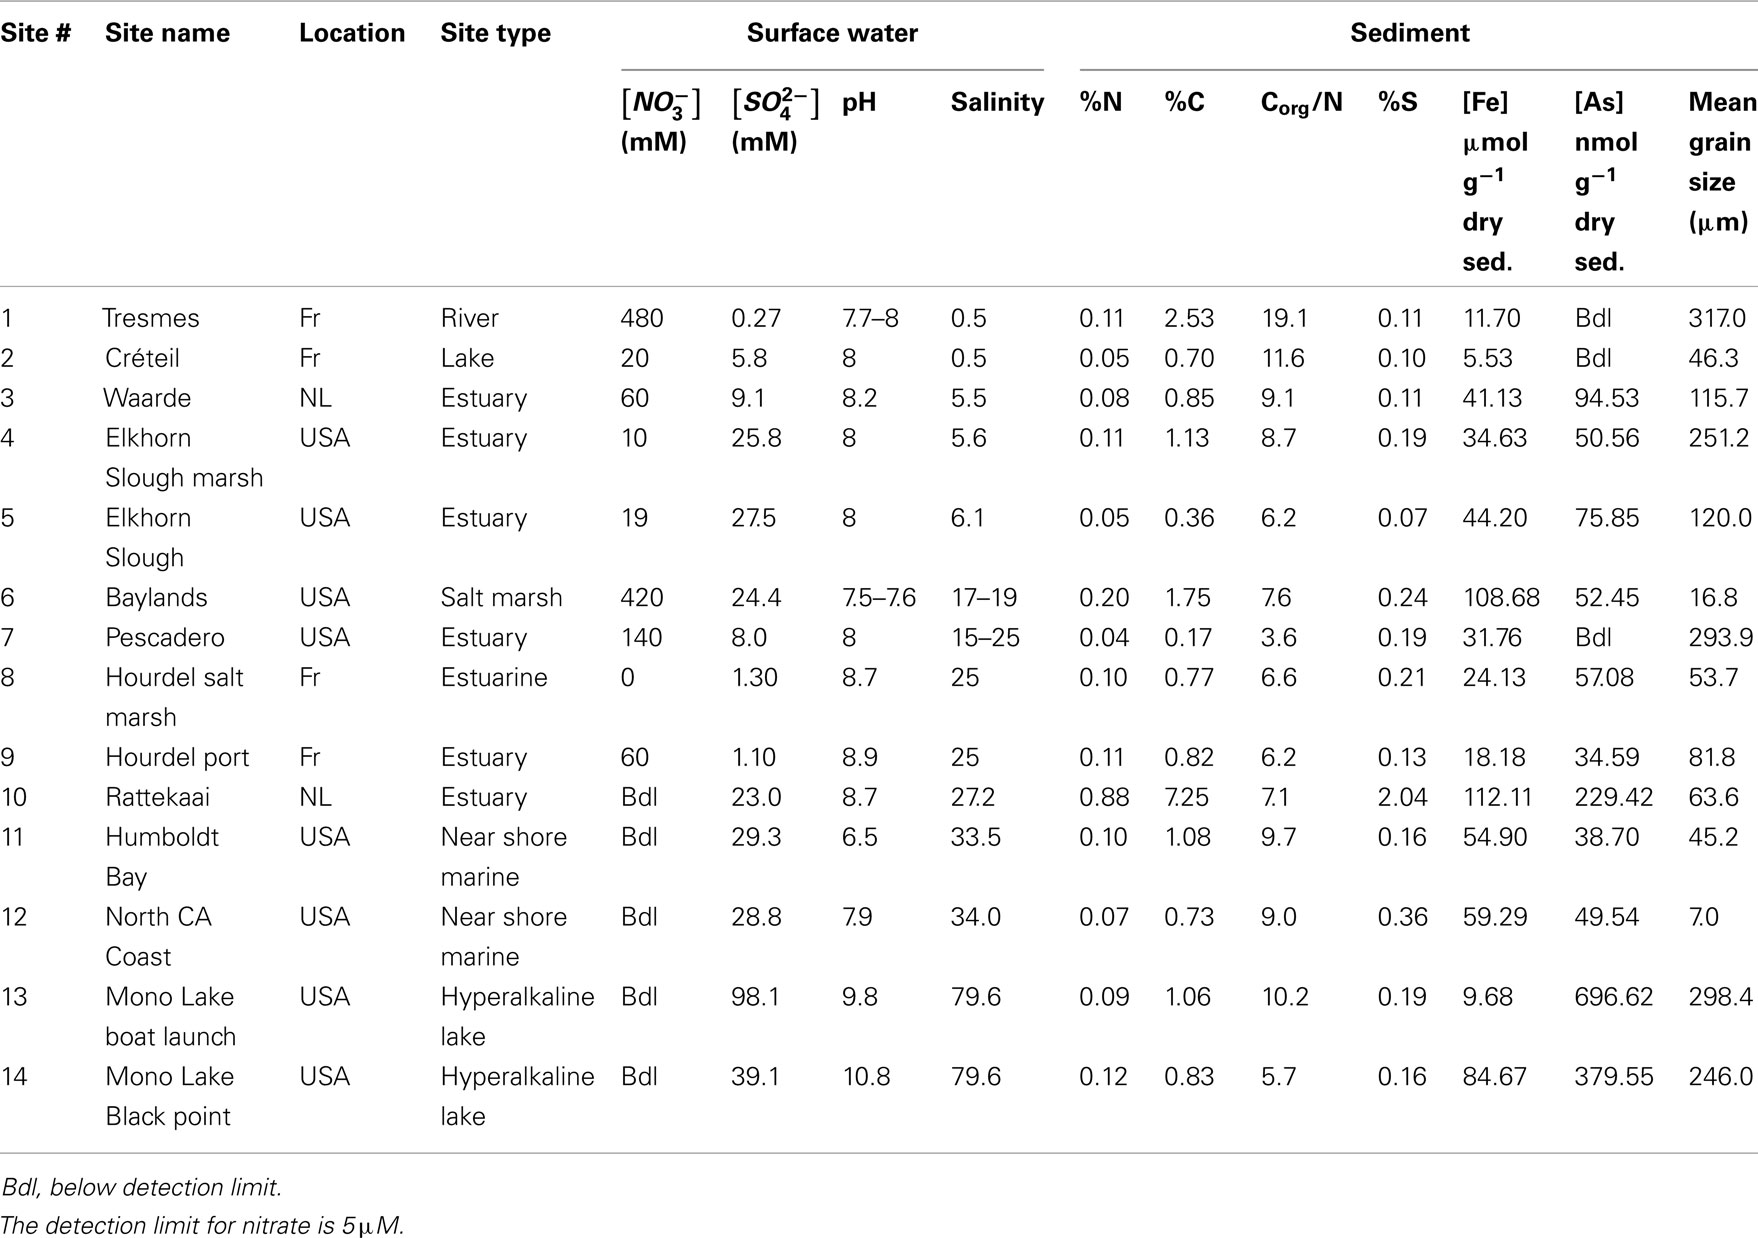
Table 1. Surface water and sediment characteristics of 14 study sites in USA (California) and Europe; the Netherlands (NL) and France (Fr).
Water and Sediment Characterization
 nitrite
  and ammonium
  concentrations in liquid samples were measured colorimetrically on a Nutrient Autoanalyzer 3 (Bran and Luebbe).
  concentrations in liquid samples were measured by ion chromatography (IC, Dionex DX-120). Sediment porosity was calculated from the dry bulk density (ρd) and particle density (ρs) as 1 − (ρd/ρs), with ρd determined from the weight loss of a known volume of wet sediment sample after drying (2 days at 105°C or freeze drying). Corg, total N and total S contents were determined using a Carlo Erba CN analyzer. Mean grain size of bulk sediment was determined with a Malvern Instruments Mastersizer S, after removal of organic matter (with 6% H2O2) and carbonate (with 1 N HCl), followed by chemical (in 4.5% Na4P2O7 + 4.2% Na2CO3) and ultrasonic dispersion. As and Fe were extracted from sediments after 0.2 g freeze dried samples were digested in 10 mL 2 M trace metal grade HCl for 24 h. Total As concentrations were determined by graphite furnace atomic absorption spectrometry (GFAAS) on a Unicam_989 QZ spectrometer. Total Fe concentrations were determined by a flame atomic absorption spectrometer and a solar S spectrometer.
Flow through Reactor Experiments
Steady-state reaction rates [e.g., maximum potential nitrate and sulfate reduction rates, and nitrite and ammonium production rates] were measured on intact sediment slices using recently developed flow-through reactors (FTRs; Roychoudhury et al., 1998; Laverman et al., 2006; Pallud and Van Cappellen, 2006; Pallud et al., 2007). Undisturbed surface sediment slices were collected directly in Plexiglas® reactor cells (4.2 cm inside diameter and 1 or 2 cm long) between June 2006 and July 2008. Input solutions were supplied to the reactors at a constant flow rate (Q = 2 ± 0.15 mL h−1) using peristaltic pumps, and the reactor output samples were collected in tubes pre-filled with 2 mL of sulfide trap solution (1% zinc acetate) at 4-h intervals using a fraction collector. Input solutions consisted of demineralized water containing  (5 mM, supplied as NaNO3) or
  (1.5 mM, supplied as Na2SO4) or both supplied simultaneously, NaCl at varying concentrations (see below), and for the Mono Lake sediments, also Na2CO3 (0.047 M) and NaHCO3 (0.28 M; see below).
  and
and  sulfate inflow concentrations have been chosen well above the half saturation constant (Km) for
  (0.2–0.8 mM) and sulfate (0.16–0.37 mM) that were measured in surface sediments using similar FTR systems (Laverman et al., 2006; Pallud et al., 2007) so maximum potential rates (Rmax) would be measured. The input solutions were sterilized, then made anoxic by boiling and purging with O2-free N2. The salinity of the inflow solutions was adjusted with NaCl to match the salinity measured at the site (see Table 1). In order to mimic ambient hyperalkaline conditions in Mono Lake, the inflow pH for these reactors was adjusted using Na2CO3 (0.047 M) and NaHCO3 (0.28 M). For each site, two sets of duplicate reactors were treated as follows: one set was supplied with
  for days 1–3 (N1), then with
  for days 4–6 (S2), and finally with
  and
and  simultaneously for days 7–9 (N1S2); a second set of duplicates was supplied with
  for days 1–3 (S1), then with
  for days 4–6 (N2), and finally with
  and
and  simultaneously for days 7–9 (N2S1). We will use the notation N to include both
  only treatments (N1 and N2), the notation S to include both
  only treatments (S1 and S2), and the notation NS to include both
  treatments (N1S2 and N2S1). A summary of the notation system can be found in Table 2. All FTR experiments were run at a constant temperature of 21 ± 2°C under anoxic conditions.
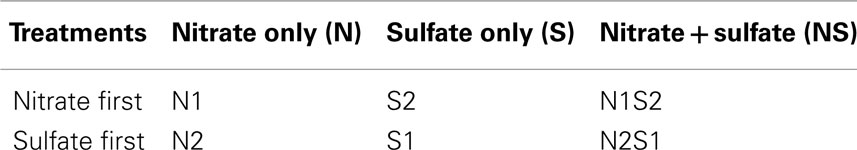
Table 2. Nomenclature of treatment groups.
Potential Reaction Rate Calculations
For each of the N1, N2, S1, S2, N1S2, N2S1 steps, potential steady-state reaction rates were calculated. Nitrate reduction rates (NRR), nitrite production rates (NiPR), ammonium production rate (APR), and sulfate production rates (SPR) were calculated for N1 and N2. Sulfate reduction rate (SRR), and APR were calculated for S1 and S2. Finally, NRR, NiPR, SRR, and APR were calculated for N1S2 and N2S1. Rates were determined by multiplying the flow rate (Q) by the concentration difference between the input and output solutions normalized per volume of sediment for time intervals during which the outflow concentrations of the externally supplied electron acceptors ( or both) remained constant (Laverman et al., 2006; Pallud et al., 2007), which typically happened after 10–24 h. Rates are expressed throughout in nanomolar analyte per cubic centimeter wet sediment per hour.
Statistical Analysis
MATLAB 9.0 was used to compute descriptive statistics and generate box plots of variables. Since the data were skewed, variables were log transformed before correlations and regressions were calculated. Variables having zero values were expressed as log (variable + 1). Log transforms improved the symmetry of the distributions. Differences in reaction rates across treatment types were tested with one way repeated measures ANOVA.
A principal component analysis (PCA) was conducted on the environmental variables and biogeochemical reaction rates, respectively. A multivariate analysis was conducted to analyze the relationships between explanatory variables (i.e., environmental variables) and response variables (i.e., biogeochemical reaction rates). The first step is to use detrended correspondence analyses (DCA) to obtain the gradient length of response variables. The linear model redundancy analysis (RDA) was suggested by the small gradient lengths (<1.5 SD). Stepwise RDA (Canoco Version 4.53; Wageningen, the Netherlands) was selected to study the effects of environmental variables on sediment biogeochemical reaction rates. RDA is a type of direct gradient analysis (Vandenwollenberg, 1977) that summarizes all the variance of response variables which is related to the explanatory variables and, at the same time, provides a synthetic and simple interpretation of the relationships between response and explanatory variables. Significant predictors were chosen using Canoco’s forward selection procedure in the order of greatest additional contribution to the explained variance, but only if their addition did not cause any variation inflation factor to exceed 3.0. Statistical significance of variation components were tested with Monte Carlo Permutation tests (104 unrestricted permutations) on the trace statistic (Terbraak and Verdonschot, 1995). In the RDA triplot, the correlation between environmental variables and biogeochemical reaction rates is given by the cosine of the angle between the two vectors. Vectors pointing in roughly the same direction indicate a positive correlation, vectors crossing at right angles indicate a near zero correlation, while vectors pointing in opposite direction show a high negative correlation.
Results
Water and Sediment Characteristics
Physical and chemical characteristics of the sediment and water column from the 14 study sites are summarized in Table 1. The overlying water pH and salinity values ranged from 6.5 to 10.8 and from 0.5 to 79.6, respectively. The Corg:N ratio ranged from 3.6 to 19.1. The highest values (11.6 and 19.1) were observed in the freshwater sediments. The sediment S and Fe content ranged from 0.07 to 2.04% and from 5.53 to 112.11 μmol g−1 dry sediment, respectively, with the lowest values measured in the freshwater sediments. Sediment As content varied from below detection limit (bdl) to 696.62 nmol g−1 dry sediment and the lowest sediment As content were observed in the freshwater sediments.
The results of the PCA of the environmental variables revealed two main axes that explain most of the variation in all water and sediment characteristics (Figure 1). The first two principal components (PCs) explained 32 and 20% respectively of the total variance in the data. Correlations can be estimated by perpendicularly projecting the arrow tips of the other variables onto a particular variable arrow. The first component was mainly related to salinity,  and
and  concentration in the overlying water and sediment As content. The second PC was associated with sediment grain size and, to a lesser extent, with sediment total Fe content. Sediment total Fe content tended to increase with decreasing grain size. Coarse-grained sediments were generally poor in total Fe. In addition, sediment Fe content correlated positively with sediment S contents. The Fe and sulfur contents were negatively correlated to the Corg:N ratio. The highest measured sediment N contents were associated with the highest measured Fe and/or S content. In general, sample sites were heterogeneously distributed around the origin of the coordinate system. On the basis of the distribution of sample PC scores on the PC1 and PC2 axes, several distinct sectors can be described: (1) the two hypersaline Mono lake sites (#13 and 14) characterized by high pH, salinity,
  in overlying water and sediment As content; (2) the river sediment site at Tresmes (#1) characterized by the highest
  in overlying water and the highest Corg:N ratio; (3) the salt marsh estuarine site Rattekaai (#10) characterized by high sediment S and Fe content; (4) the salt marsh site and two near coast marine sites (#6, 11, and 12) characterized by fine texture and high sediment Fe content. The rest of the sample sites were within these extreme sectors.
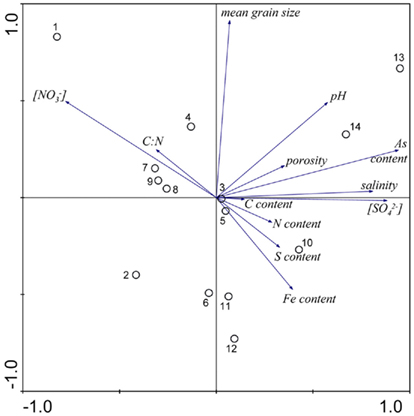
Figure 1. Principal component analysis bi-plots of the sample stations (O) and the surface water and sediment characteristics (→) along the first two principal components.
Biogeochemical Reaction Rates of N and S Cycles
The PCA of the reaction rates showed two main axes that explain most of the variation in all reaction rates (Figure 2). Note that all reaction rates reported in this study are maximum potential rates rather than field observed actual rates. The first two PCs explained 58 and 26% respectively of the total variance in the data. The first axis is related to NRR, NiPR, APR, and SPR. The second axis is defined mainly by SRR. NiRR increased with increasing NRR. Furthermore, NRR and APR for N treatments (i.e., N1 and N2) correlated strongly with those for NS treatments (i.e., N1S2 and N2S1). In contrast, there was no significant correlation between SRR for S treatment (i.e., S1 and S2) and SRR for NS treatments (i.e., N2S1 and N1S2). Several distinct sectors can be distinguished in all sediment sites based on the PC scores distribution: (1) the two hypersaline Mono Lake sites (#13 and 14) characterized by high NRR and NiPR, and low SRR in the presence of  (2) the river sediment site at Tresmes (#1) and the freshwater lake site at Créteil (#2) characterized by the highest SRR; (3) the estuarine site Rattekaai (#10) characterized by the highest APR; (4) the two near coast marine sites (#11 and 12) characterized by the lowest NRR and APR.
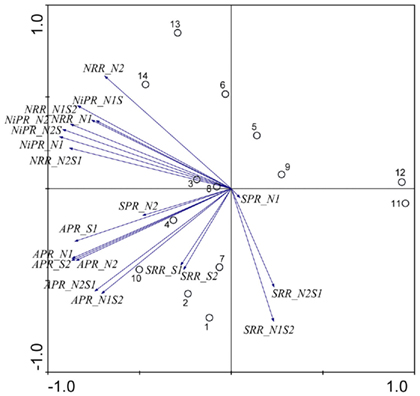
Figure 2. Principal component analysis bi-plots of the sample stations (O) and the potential reaction rates (→) along the first two principal components.
Nitrate reduction rates were highly variable within a given treatment [coefficient of variance (CV) ranged from 39 to 64%, Figure 3]. There was no significant difference for the NRR (p = 0.5, repeated measures ANOVA) among the four treatment groups (i.e., N1, N2, N1S2, N2S1). The variances of NRR for N treatments were slightly larger than those for NS treatments.
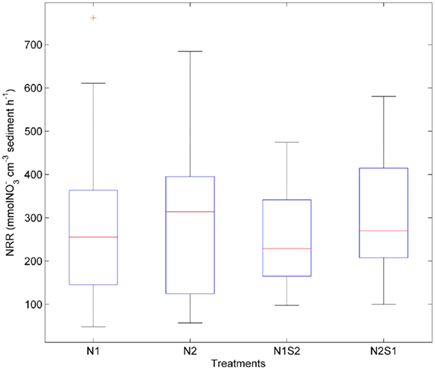
Figure 3. Box plots of nitrate reduction rates (NRR) across all sites for the nitrate only treatments (N1 if nitrate first, N2 if sulfate first) and nitrate + sulfate treatments (N1S2 if nitrate first, N2S1 if sulfate first). Boxes encompass the upper and lower quartiles, while the line indicates the median. Asterisks are outliers.
Sulfate reduction rates varied greatly within a treatment (CV ranged from 46 to 94%, Figure 4). The simultaneous application of  and
and  (NS) resulted in lower SRR than did a single application of
  (S) (p = 0.03, repeated measures ANOVA). Note that the SRR here represented an apparent or net
  removal after subtracting
  produced by sulfide oxidation. By adding the SPR for the N treatments to the net SRR, we obtain estimates of the gross SRR (i.e., corrected SRR). Interestingly, there was no significant difference in the gross SRR between the S and NS treatments (p = 0.64, repeated measures ANOVA). Additionally, the average NRR was almost an order of magnitude higher than the average SRR.
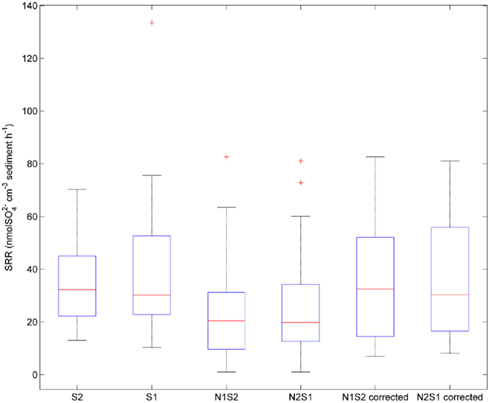
Figure 4. Box plot of sulfate reduction rates (SRR) across all sites for the sulfate only treatments (S1 if sulfate first, S2 if nitrate first), and sulfide oxidation uncorrected and corrected SRR for nitrate + sulfate treatments (N1S2 if nitrate first, N2S1 if sulfate first). Boxes encompass the upper and lower quartiles, while the line indicates the median. Asterisks are outliers.
The largest within-treatment variance was observed in APR (CV ranged from 77 to 149%, Figure 5). APR did not vary greatly with treatments (p = 0.3, repeated measures ANOVA). However, the NS treatments had a greater variation of APR than the N or S treatment. The extremely high APR values indicated by the three outliers were all from the Rattekaai site.
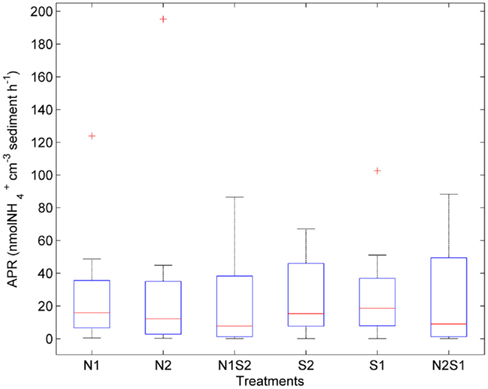
Figure 5. Box plot of ammonium production rates (APR) across all for the nitrate only treatments (N1 of nitrate first, N2 if sulfate first), sulfate only treatments (S1 of sulfate first, S2 if nitrate first), and nitrate + sulfate treatments (N1S2 of nitrate first, N2S1 if sulfate first). Boxes encompass the upper and lower quartiles, while the line indicates the median. Asterisks are outliers.
Environmental Controls on Biogeochemical Reaction Rates
Relationships between N and S biogeochemical reaction rates and the environmental variables measured were examined by RDA using the potential reaction rates measured on intact sediment slices as response variables for both separate and simultaneous addition of  and
and  (see Flow Through Reactor Experiments and Potential Reaction Rate Calculations) and the environmental variables listed in Table 1 as explanatory variables. The relative importance of various environmental factors is shown in Table 3. The single variable that explained the greatest percentage of variability in sediment biogeochemical reaction rates was the pH (lambda, the percentage of the variability explained by a single variable, is 0.24), followed by sediment As content, grain size, and N content that explained 21, 17, and 13% of the variability, respectively. After stepwise forward selection by RDA, three variables, namely pH, salinity, and N content, that had a significant effect on the reaction rates in the sediments were retained (p < 0.05 tested by Monte Carlo permutation, Table 3). The pH, salinity, and sediment N content describe the most variance (54%) in the set of response variables that included all reaction rates. Exploratory RDA indicated that the pH of overlying water had the largest effect (lambda A, the additional percentage of variability explained by a variable after the forward selection, is 0.24, Table 3) for the N and S reaction rates. Salinity and sediment N content, as strong indicators of freshwater-marine ecosystem gradients, added an additional 18 and 12% to the total explained variance.
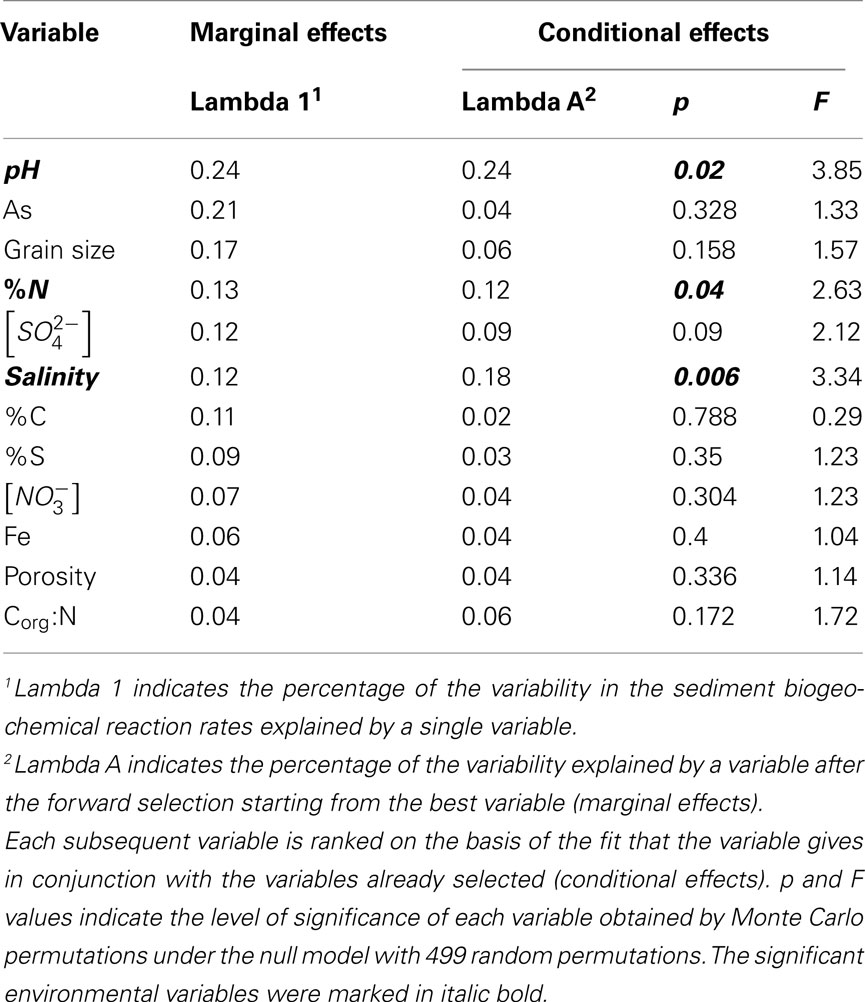
Table 3. Summary of 12 environmental variables by their effects on sediment biogeochemical reaction rates.
Redundancy analysis results are visualized in triplot ordination diagrams. Figure 6 shows the ordination diagram derived from running an RDA using the reaction rates measured when only one electron acceptor was added (treatments N and S). The first axis (horizontal) displayed a gradient of APR, and to a lesser extent, of SPR, NRR, and NiRR. The second axis (vertical) represented SRR, which were negatively correlated with salinity of the overlying water. In addition, the pH vector points in the same direction as the NRR and NiPR vectors indicating a significant positive correlation between pH and NRR and NiPR. pH explained 23% of total variance, followed by salinity that contributed an additional 23% and by sediment N content that explained an additional 15% of the total variance in reaction rates. The sites 1–5, 8, and 13 followed the salinity gradient strongly, while the sites 1–5, 7, and 12 were predominantly affected by the gradient of sediment N content. Finally, the variations associated with sites 5, 6, 8, 9, and 14 were mainly attributed to the variations in pH.
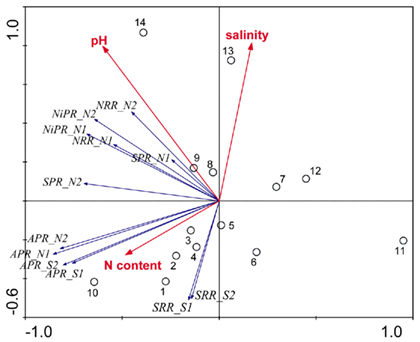
Figure 6. Ordination triplots of first two axes (RDA1 and RDA2) generated from redundancy analysis using reaction rates (NRR, SRR, APR, NiPR, and SPR) measured when only one electron acceptor was added (treatments N and S). Response variables (red vectors) include the combination of response variables (NRR and SRR). Explanatory variables (blue vectors) entered into the models were selected stepwise by Monte Carlo permutation test. Site numbers are located according to their ordination sample scores. Transform: response variable via log 10 (x + 1), and explanatory variables via square root. Vectors pointing in the same direction indicate a positive correlation, vectors crossing at right angles indicate a near zero correlation, while vectors pointing in opposite direction show a high negative correlation.
An ordination diagram derived from running an RDA using the reaction rates measured for the NS treatments is shown in Figure 7. Again, pH and salinity are the two most dominant environmental variables that explained 30 and 17% of the total variance in reaction rates, respectively. The first RDA axis (horizontal) increased with decreasing pH and the second RDA axis (vertical) increased with salinity. The vectors of NRR and NiPR loaded negatively on the first axis, and pointed in a same direction as pH, indicating a positive relationship with this explanatory variable. On the other hand, the vectors of SRR pointed roughly in a direction opposite to the salinity vectors, suggesting an inverse relationship between these variables. Contrary to the RCA results for reaction rates measured when only one TEA is present (N and S treatments, Figure 6), sediment N content was not selected as a significant environmental factor on the reaction rates for the NS treatments.
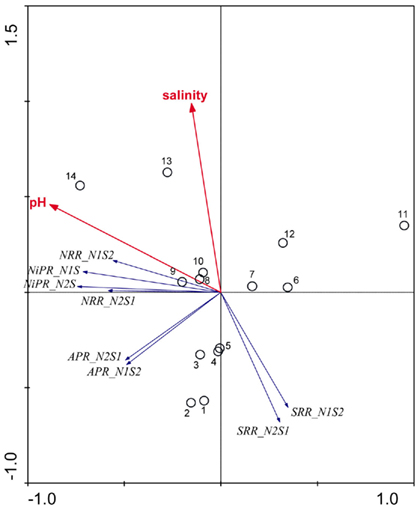
Figure 7. Ordination triplots of first two axes (RDA1 and RDA2) generated from redundancy analysis using reaction rates (NRR, SRR, APR, and NiPR) measured when the two electron acceptors were added simultaneously (treatments NS). Response variables (red vectors) include the combination of response variables (NRR and SRR). Explanatory variables (blue vectors) entered into the models were selected stepwise by Monte Carlo permutation test. Site numbers are located according to their ordination sample scores. Transform: Response variable via log 10 (x + 1), and explanatory variables via square root.
To study the effect of environmental factors on the relative differences in NRR and SRR measured for separate (N or S) and simultaneous (NS) additions of  and
and  we derived a new set of response variables named Ratio_NRR and Ratio_SR, defined as the ratio of NRR and SRR measured in NS treatment compared to NRR and SRR measured for N and S treatment, respectively. These ratios indicate either an increase or a decrease in NRR or SRR when both TEAs are added compared to the supply of only one TEA. Stepwise RDA analysis (Figure 8) showed that the sediment As content (28%), Fe content (17%), and Corg:N (14%) accounted for 59% of the total variance of the differences in NRR and SRR between separated or simultaneous addition of TEAs.
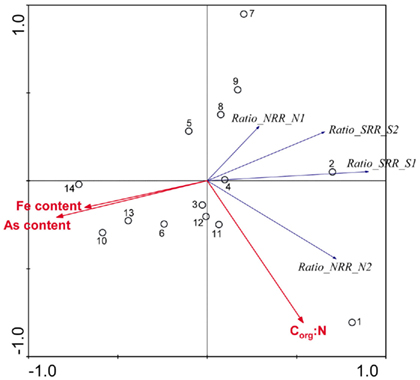
Figure 8. Ordination triplots of first two axes (RDA1 and RDA2) generated from redundancy analysis using the ratio in NRR and SRR measured for separate (N or S) and simultaneous (NS) additions of nitrate and sulfate (RATIO_NRR and RATIO_SRR). Response variables (red vectors) include the combination of response variables. Explanatory variables (blue vectors) entered into the models were selected stepwise by Monte Carlo permutation test. All variables showed significant correlations with the canonical axes. Site numbers are located according to their ordination sample scores. Transform: response variable via log 10 (x + 1), and explanatory variables via square root.
Discussion
Environmental Controls on Potential Biogeochemical Reaction Rates
The PCA and RDA results revealed three dominant gradients in the variations in the sediment potential biogeochemical reaction rates. Gradient (1) is characterized by variations in the NRR, NiPR, and SPR, which were closely correlated with the overlying water pH. Gradient (2) is characterized by variations in the APR, which were mainly controlled by the sediment N content. Gradient (3) is characterized by variations in the SRR, which were correlated with the overlying water salinity.
The RDA analysis suggested a significant positive relationship between in situ water pH and NRR and NiRR, which is in agreement with previous findings. Song et al. (2011) found a correlation between potential denitrification rates and the pH of the overlying water in constructed wetlands. In fact, several studies have shown that acidic conditions may reduce or even completely inhibit the nitrate reduction process in aquatic sediments (Knowles, 1982). In the present study, the in situ pH of overlying water is mostly slightly alkaline except for a slightly acidic pH of 6.5 at the near shore marine site, and for a hyperalkaline pH at the two Mono lake sites. Glass and Silverstein (1998) found that NRRs as well as the nitrate to nitrite ratios increased with above-neutral pH in activated sludge of a synthetic wastewater containing high nitrate concentration. Similar results were obtained in laboratory batch experiments by Zhang et al. (2009) showing increased nitrite accumulation with increasing pH. Nitrite accumulation associated with nitrate reduction with increasing pH might be attributed to inhibition of nitrite reductase at high pH (Zhang et al., 2009).
Furthermore, our results suggest a positive correlation between APR and the sediment N pool. Sediment N can originate from various sources such as phytoplankton, benthic algae, and littoral deposition. As a result, littoral sediments are usually associated with high N content. In this study, the highest APR corresponded to the N rich sediment at the Rattekaai site, whereas the lowest APRs were found at two deep non-littoral marine sediments (#11 and #12). High N content sediments might lead to high APR through intensive anaerobic organic matter degradation and consequent nitrogen mineralization. Previous studies also observed increasing  production with decreasing Corg:N ratio (Blackburn and Henriksen, 1983). Under anoxic conditions, another
  source is dissimilatory nitrate reduction to ammonium (DNRA). Our results, however, did not confirm that DNRA is significant. In fact, if DNRA was a major source of
  higher APR would be observed in the N only treatments than in the S only treatments. However, we did not find any significant difference in APR between these two treatments.
Finally, a freshwater to saline water gradient, represented by salinity in overlying water explained a large portion of variance of the sediment SRR. In situ salinity showed an inverse relationship with SRR. Under in situ conditions, SRR in most freshwater systems are usually very low and considerably lower than in most marine systems (Capone and Kiene, 1988) due to the limited  present in the overlying water. Despite these low in situ rates and activities, sulfate reducers have shown to be present and diverse in freshwater sediments (Kondo et al., 2007; Miletto et al., 2008), and with high potential activities (this study, Pallud and Van Cappellen, 2006; Kondo et al., 2007), most likely due to their metabolic diversity (Muyzer and Stams, 2008). In addition, in hypersaline anaerobic environments, the significant energetic requirements associated with halophilism may preclude the existence of microbial groups that obtain little energy from dissimilatory processes, including sulfate reduction (Oren, 2011). This could explain why the lowest SRR were observed in the two hypersaline sites.
We found both similarities and differences in the sets of environmental factors that explain the variance in the sediment N and S potential reaction rates between separate and simultaneous addition of  and
and  Both treatments suggest that pH and salinity are the two most important predictors of variability of sediment N and S reaction rates. However, when
  and
and  were added separately, the APR were also significantly affected by sediment N content, but not when
  and
and  were added concomitantly. This indicates that other process(es) than anaerobic organic nitrogen mineralization might contribute to
  production when N and S were added together.
Distinct biogeochemical processes in response to separate and simultaneous addition of  and
and  can also be suggested by the comparison of NRR and SRR between separate addition and simultaneous addition of
  and
and  Sediment As, Corg:N ratio, and Fe content were the main factors that explained the variation of the NRR and SRR changes. The coupled sediment S, As, and Fe cycles, probably through the reactions listed in Table 4, explained the lower SRR in sediments when
  and
and  were present. On the other hand, the quality of sediment organic matter, indicated by Corg:N ratio, might account for the majority of variance in the NRR changes.
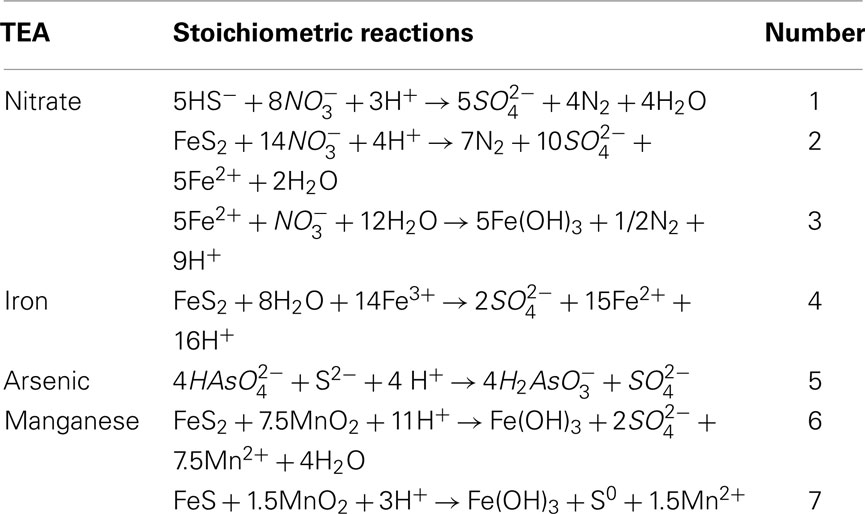
Table 4. Summary of stoichiometric reactions of sulfide oxidized by varying terminal electron acceptors.
Effects of Alternative TEAs on Potential Nitrate and Sulfate Reduction Rates
The lack of correlation of SRR between S only and NS treatments suggested that distinct processes must be involved in  reduction. The observation that the presence of
  results in lower overall SRR than when
  is added alone suggests that
  reduction was inhibited by the presence of
  and/or that,
  was produced by sulfide oxidation (reaction 1 in Table 4). The gross SRR in the NS treatments was calculated by adding the SPR measured in the N treatments to the net SRR measured for the NS treatments. The corrected SRR for the NS treatments were not significantly different than for the S treatments. This confirms that the lower SRR measured when
  and
and  were added together are most likely due to the
  produced from sulfide oxidation linked to
  reduction. Therefore, not only do we observe active
  reduction when
  is present but we also conclude that overall there is negligible inhibition of
  reduction by the presence of
  This contrasts with the current consensus that
  reduction will be active only when
  a thermodynamically more favorable electron acceptor, is fully consumed (Froelich et al., 1979; Whitmire and Hamilton, 2005). However, it is supported by previous observations that
  was actively reduced by microorganisms in the presence of
  (Dalsgaard and Bak, 1994). It is very well likely, considering the metabolic versatility of both the
  - and
- and  -reducers, that active sulfate reduction in the presence of nitrate is due to the use of different electron donors by the two bacterial groups. In addition, the sediment matrix could provide a spatial separation of the different microbial groups resulting in coexistence instead of a competition between the two processes within these sediments. Whether spatial separation or the use of different carbon pools allows the coexistence of sulfate and nitrate reduction in these sediments is subject to ongoing work.
On the other hand, the presence of  , and subsequently of sulfide produced as a result of
  reduction, did not significantly affect NRR. The strong correlation between NRR measured for N only and for NS treatments suggested that same processes must be involved in
  reduction. Sulfide has been shown to inhibit nitrate reduction in estuarine and coastal sediments (Senga et al., 2006; Aelion and Warttinger, 2009). However, a positive effect of sulfide addition on NRR has been found in oxidized and low organic matter sediments (Canfield et al., 2010). Recent work in a marine environment off the Chilean northern coast suggests that
  reduction is enhanced by sulfide addition in ocean waters (Canfield et al., 2010). In our study, however, the amount of sulfide produced as a result of
  reduction was too low to enhance or inhibit
  removal. We estimated the fraction of
  removal due to sulfide oxidation to
  by multiplying the ratio of the measured SPR to NRR by 1.6, which is the molar ratio of
  reduced to
  produced as shown in Equation 1 (Table 4). In our survey,
  mediated sulfide oxidation accounts for a small portion (~9%) of total
  reduction on average, implying that this process did not affect overall
  reduction significantly. Furthermore, the observation that
  was produced in the absence of
  addition suggests that sediment S content is the main source of sulfide in our systems, probably from sediment bound sulfide rather than produced by
  reduction. However, the effect of
  reduction as a sulfide source cannot be underestimated due to the fact that sediment sulfide is ultimately regenerated from
  reduction.
In addition to  oxidized metal(loid) species, such as Fe, Mn, and As, could be preferentially used over
  by microorganisms as TEA for anaerobic respiration. For example, it has been shown that direct sulfide oxidation by Fe(III) might lead to
  production (reaction 4, in Table 4; Holmer and Storkholm, 2001). In our study, SRR decreased in the NS treatments with increasing sediment As content suggesting that SRR might be inhibited by As, possibly by As(V) produced via As(III) oxidation coupled to NO3-reduction. Such an anoxic oxidation of As(III) linked to chemolithotrophic denitrification was shown to be feasible in continuous bioreactors (Sun et al., 2010). The oxidized As subsequently affect the sediment S cycle in two ways. First, As(V) and/or As(III) inhibit
  reduction, presumably through a toxic effect (Dowdle et al., 1996). Second,
  might be produced through As(V)-mediated sulfide oxidation (reaction 5 in Table 4). Recent studies (Hoeft et al., 2004; Oremland et al., 2005; Hollibaugh et al., 2006) found that sulfide oxidation coupled to As(V) reduction appears to proceed via a two electron transfer, resulting in the production of As(III) and of an intermediate S compound such as thiosulfate that is subsequently disproportionated into sulfate. Oxidized Mn might also serve as electron acceptor to oxidize iron sulfide minerals (reactions 6 and 7 in Table 4). However, we did not measure sediment Mn content in our study and consequently cannot confirm the occurrence of Mn-mediated sulfide oxidation.
Alternative Nitrate Removal Pathways
Our observation that in 70% of the studied sites  was produced when
  was reduced suggested that
  production was linked to
  removal. The possibility of
  reduction coupled to sulfide oxidation by sulfur-oxidizing bacteria is supported by research in both marine and freshwater ecosystems (Dannenberg et al., 1992; Fossing et al., 1995; Brunet and GarciaGil, 1996; Otte et al., 1999). On average, 9% of the NRR can be accounted for by sulfide oxidation to sulfate in our studied sediments (Laverman et al., 2012), which is much lower than the range of 25–40% reported for freshwater ecosystems (Burgin and Hamilton, 2008). Note that these could be minimum estimates because of the possibility that some of the S oxidation does not proceed completely to
We were not able to ascertain the ultimate fate of the added  (i.e., denitrification or DNRA) in our sediments. Inhibition of denitrification by the presence of free sulfide might favor the reduction of
  to NH4+ rather than to N2O and N2 (Brunet and GarciaGil, 1996), though accumulation of N2O has also been observed (Senga et al., 2006). An increase in NRR due to DNRA coupled with S oxidation would likely be accompanied by an increase in APR (Payne et al., 2009). However our results did not show significant increase in APR when
  and
and  were added together, ruling this hypothesis out. On the other hand, metal-bound sulfides (e.g., FeS) could potentially enhance denitrification to N2 (Brunet and GarciaGil, 1996). We consequently speculate that denitrification instead of DNRA is the major pathway of
  reduction that couples with metal-bound sulfide oxidation in the present study.
Our RDA results revealed that nitrate-mediated oxidation of iron sulfide (FeS) or Fe disulfide (FeS2), rather than free sulfide, might account for  production (reactions 2 and 3 in Table 4). This is supported by the positive correlation between change of SRRs (NS vs. S) and sediment Fe contents in our RDA analysis. FeS and FeS2 are compounds resulting from the chemical precipitation of reduced Fe and sulfur, and are commonly found in sediments, such as those investigated in this study. The sediment Fe content correlated positively with sediment S contents in this study, which indicated that iron and sulfide could be present as iron sulfide minerals such as FeS and FeS2. The oxidation of iron disulfide coupled to
  reduction produces
  as end product (Brunet and GarciaGil, 1996). Under anoxic conditions FeS or FeS2 can be used as electron donors for denitrification by facultative anaerobic lithotrophs (Benz et al., 1998; Schwientek et al., 2008). Jorgensen et al. (2009) recently found that around 65–80% of the
  reduction measured in a groundwater aquifer was coupled to the anoxic oxidation of pyrite by
  releasing
Conclusion
Our study shows that the effects of the presence of  and/or
  on biogeochemical N and S cycles are complex, depending on various environmental factors. The environmental factors that explained the variability in the N and S biogeochemical reaction rates when
  and
and  were present simultaneously were in situ water pH and salinity, whereas sediment N content, in situ water pH and salinity were the best explanatory variables when
  and
and  were present separately. More specifically, potential NRR were positively correlated to in situ water pH and potential SRR were inversely correlated with salinity. Furthermore, the highest sediment As or Fe content was associated with the largest reduction in the potential SRR when
  or
or  were both present. Finally, our results indicate that the simultaneous presence of
  and
and  led to sulfur oxidation coupled with
  reduction and metal-bound S, instead of free sulfide produced by
  reduction, was responsible for this
  S oxidation.
Aquatic ecosystems are exposed to increasing  and
and  concentrations and intensified interactions between the N and S cycles. The sulfur induced nitrate reduction observed in this study implies that sediment N cycling is closely linked to the S cycling across a wide range of sediments. Increased
  concentrations in freshwater ecosystems will lead to sulfide production in such ecosystems, where sulfide concentrations are usually low (Capone and Kiene, 1988). This sulfide can either be oxidized coupled to nitrate reduction as shown in this study, or serve as a sink for potentially toxic metals, such as As, Cd, Hg, and Pb (Moller et al., 2004). Increasing anthropogenic
  input from acid deposition and agricultural runoff to ecosystems might affect the S cycle by stimulating anoxic iron sulfide oxidation in iron sulfide rich sediments. As observed in this study, the magnitude of the sulfide oxidation coupled to
  reduction increases with increasing sediment As and Fe content, which means that saline sediments rich in metal (such as As and Fe) would be more strongly affected. Through the release of toxic metals by metal sulfide oxidation (Morse, 1994; Haaijer et al., 2007), this stimulation will have adverse effects on aquatic ecosystems. It is therefore crucial to better understand the coupling between the N and the S cycles given that
  and
and  inputs to ecosystems are enhanced by anthropogenic activities, and are expected to increase in the future.
Conflict of Interest Statement
The authors declare that the research was conducted in the absence of any commercial or financial relationships that could be construed as a potential conflict of interest.
Acknowledgments
C. Gu and C. Pallud are grateful to the Agricultural Experimental Station (AES) for funding the work done at UC Berkeley. The authors would also like to thank Jeffrey Abell for providing his data for the two near shore marine sites and Emmanuel Aubry for Fe and As analysis.
References
Aelion, C. M., and Warttinger, U. (2009). Low sulfide concentrations affect nitrate transformations in freshwater and saline coastal retention pond sediments. Soil Biol. Biochem. 41, 735–741.
Benz, M., Brune, A., and Schink, B. (1998). Anaerobic and aerobic oxidation of ferrous iron at neutral pH by chemoheterotrophic nitrate-reducing bacteria. Arch. Microbiol. 169, 159–165.
Blackburn, T. H., and Henriksen, K. (1983). Nitrogen cycling in different types of sediments from danish waters. Limnol. Oceanogr. 28, 477–493.
Brettar, I., and Rheinheimer, G. (1991). Denitrification in the central baltic – evidence for H2s-oxidation as motor of denitrification at the oxic-anoxic interface. Mar. Ecol. Prog. Ser. 77, 157–169.
Brunet, R. C., and GarciaGil, L. J. (1996). Sulfide-induced dissimilatory nitrate reduction to ammonia in anaerobic freshwater sediments. FEMS Microbiol. Ecol. 21, 131–138.
Burgin, A. J., and Hamilton, S. K. (2007). Have we overemphasized the role of denitrification in aquatic ecosystems? A review of nitrate removal pathways. Front. Ecol. Environ. 5, 89–96.
Burgin, A. J., and Hamilton, S. K. (2008). NO3− driven SO42− production in freshwater ecosystems: implications for N and S cycling. Ecosystems 11, 908–922.
Canfield, D. E., Stewart, F. J., Thamdrup, B., De Brabandere, L., Dalsgaard, T., Delong, E. F., Revsbech, N. P., and Ulloa, O. (2010). A cryptic sulfur cycle in oxygen-minimum-zone waters off the chilean coast. Science 330, 1375–1378.
Capone, D. G., and Kiene, R. P. (1988). Comparison of microbial dynamics in marine and fresh-water sediments – contrasts in anaerobic carbon catabolism. Limnol. Oceanogr. 33, 725–749.
Cornwell, J. C., Kemp, W. M., and Kana, T. M. (1999). Denitrification in coastal ecosystems: methods, environmental controls, and ecosystem level controls, a review. Aquatic Ecol. 33, 41–54.
Dalsgaard, T., and Bak, F. (1994). Nitrate reduction in a sulfate-reducing bacterium, desulfovibrio-desulfuricans, isolated from rice paddy soil – sulfide inhibition, kinetics, and regulation. Appl. Environ. Microbiol. 60, 291–297.
Dannenberg, S., Kroder, M., Dilling, W., and Cypionka, H. (1992). Oxidation of H-2, organic-compounds and inorganic sulfur-compounds coupled to reduction of O-2 or nitrate by sulfate-reducing bacteria. Arch. Microbiol. 158, 93–99.
Dowdle, P. R., Laverman, A. M., and Oremland, R. S. (1996). Bacterial dissimilatory reduction of arsenic(V) to arsenic(III) in anoxic sediments. Appl. Environ. Microbiol. 62, 1664–1669.
Duan, K., Thompson, L. G., Yao, T., Davis, M. E., and Mosley-Thompson, E. (2007). A 1000 year history of atmospheric sulfate concentrations in southern Asia as recorded by a Himalayan ice core. Geophys. Res. Lett. 34, L01810.
Engesgaard, P., and Kipp, K. L. (1992). A geochemical transport model for redox-controlled movement of mineral fronts in groundwater-flow systems – a case of nitrate removal by oxidation of pyrite. Water Resour. Res. 28, 2829–2843.
Ericson, J. P., Vorosmarty, C. J., Dingman, S. L., Ward, L. G., and Meybeck, M. (2006). Effective sea-level rise and deltas: causes of change and human dimension implications. Glob. Planet. Change 50, 63–82.
Fischer, H., Wagenbach, D., and Kipfstuhl, J. (1998). Sulfate and nitrate firn concentrations on the Greenland ice sheet – 2. Temporal anthropogenic deposition changes. J. Geophys. Res. 103, 21935–21942.
Fossing, H., Gallardo, V. A., Jørgensen, B. B., Hüttel, M., Nielsen, L. P., Schulz, H., Canfield, D. E., Forster, S., Glud, R. N., Gundersen, J. K., Küver, J., Ramsing, N. B., Teske, A., Thamdrup, B., and Ulloa, O. (1995). Concentration and transport of nitrate by the mat-forming sulfur bacterium Thioploca. Nature 374, 713–715.
Froelich, P. N., Klinkhammer, G. P., Bender, M. L., Luedtke, N. A., Heath, G. R., Cullen, D., Dauphin, P., Hammond, D., Hartman, B., and Maynard, V. (1979). Early oxidation of organic-matter in pelagic sediments of the eastern equatorial atlantic – suboxic diagenesis. Geochim. Cosmochim. Acta 43, 1075–1090.
Galloway, J. N., Townsend, A. R., Erisman, J. W., Bekunda, M., Cai, Z., Freney, J. R., Martinelli, L. A., Seitzinger, S. P., and Sutton, M. A. (2008). Transformation of the nitrogen cycle: recent trends, questions, and potential solutions. Science 320, 889–892.
Garciagil, L. J., and Golterman, H. L. (1993). Kinetics of FeS-mediated denitrification in sediments from the Camargue (Rhone delta, southern France). FEMS Microbiol. Ecol. 13, 85–91.
Glass, C., and Silverstein, J. (1998). Denitrification kinetics of high nitrate concentration water: pH effect on inhibition and nitrite accumulation. Water Res. 32, 831–839.
Haaijer, S. C. M., Lamers, L. P. M., Smolders, A. J. P., Jetten, M. S. M., and den Camp, H. J. M. O. (2007). Iron sulfide and pyrite as potential electron donors for microbial nitrate reduction in freshwater wetlands. Geomicrobiol. J. 24, 391–401.
Hoeft, S. E., Kulp, T. R., Stolz, J. F., Hollibaugh, J. T., and Oremland, R. S. (2004). Dissimilatory arsenate reduction with sulfide as electron donor: experiments with mono lake water and isolation of strain MLMS-1, a chemoautotrophic arsenate respirer. Appl. Environ. Microbiol. 70, 2741–2747.
Hollibaugh, J. T., Budinoff, C., Hollibaugh, R. A., Ransom, B., and Bano, N. (2006). Sulfide oxidation coupled to arsenate reduction by a diverse microbial community in a Soda Lake. Appl. Environ. Microbiol. 72, 2043–2049.
Holmer, M., and Storkholm, P. (2001). Sulphate reduction and sulphur cycling in lake sediments: a review. Freshw. Biol. 46, 431–451.
Howarth, R. W., Billen, G., Swaney, D., Townsend, A., Jaworski, N., Lajtha, K., Downing, J. A., Elmgren, R., Caraco, N., Jordan, T., Berendse, F., Freney, J., Kudeyarov, V., Murdoch, P., and Zhu, Z. L. (1996). Regional nitrogen budgets and riverine N&P fluxes for the drainages to the North Atlantic Ocean: natural and human influences. Biogeochemistry 35, 75–139.
Jorgensen, C. J., Jacobsen, O. S., Elberling, B., and Aamand, J. (2009). Microbial oxidation of pyrite coupled to nitrate reduction in anoxic groundwater sediment. Environ. Sci. Technol. 43, 4851–4857.
Kondo, R., Purdy, K. J., Silva, S. D. Q., and Nedwell, D. B. (2007). Spatial dynamics of sulphate-reducing bacterial compositions in sediment along a salinity gradient in a UK estuary. Microbes Environ. 22, 11–19.
Laverman, A. M., Pallud, C., Abell, J., and Van Cappellen, P. (2012). Comparative survey of potential nitrate and sulfate reduction rates in aquatic sediments. Geochim. Cosmochim. Acta 77, 474–488.
Laverman, A. M., Van Cappellen, P., van Rotterdam-Los, D., Pallud, C., and Abell, J. (2006). Potential rates and pathways of microbial nitrate reduction in coastal sediments. FEMS Microbiol. Ecol. 58, 179–192.
Mayewski, P. A., Lyons, W. B., Spencer, M. J., Twickler, M. S., Buck, C. F., and Whitlow, S. (1990). An ice-core record of atmospheric response to anthropogenic sulfate and nitrate. Nature 346, 554–556.
Miletto, M., Loy, A., Antheunisse, A. M., Loeb, R., Bodelier, P. L., and Laanbroek, H. J. (2008). Biogeography of sulfate-reducing prokaryotes in river floodplains. FEMS Microbiol. Ecol. 64, 395–406.
Moller, A., Grahn, A., and Welander, U. (2004). Precipitation of heavy metals from landfill leachates by microbially-produced sulphide. Environ. Technol. 25, 69–77.
Morse, J. W. (1994). Release of toxic metals via oxidation of authigenic pyrite in resuspended sediments. Environ. Geochem. Sulfide Oxidation 550, 289–297.
Muyzer, G., and Stams, A. J. M. (2008). The ecology and biotechnology of sulphate-reducing bacteria. Nat. Rev. Microbiol. 6, 441–454.
Oremland, R. S., Kulp, T. R., Blum, J. S., Hoeft, S. E., Baesman, S., Miller, L. G., and Stolz, J. F. (2005). A microbial arsenic cycle in a salt-saturated, extreme environment. Science 308, 1305–1308.
Oren, A. (2011). Thermodynamic limits to microbial life at high salt concentrations. Environ. Microbiol. 13, 1908–1923.
Otte, S., Kuenen, J. G., Nielsen, L. P., Paerl, H. W., Zopfi, J., Schulz, H. N., Teske, A., Strotmann, B., Gallardo, V. A., and Jorgensen, B. B. (1999). Nitrogen, carbon, and sulfur metabolism in natural Thioploca samples. Appl. Environ. Microbiol. 65, 3148–3157.
Pallud, C., Meile, C., Laverman, A. M., Abell, J., and Van Cappellen, P. (2007). The use of flow-through sediment reactors in biogeochemical kinetics: methodology and examples of applications. Mar. Chem. 106, 256–271.
Pallud, C., and Van Cappellen, P. (2006). Kinetics of microbial sulfate reduction in estuarine sediments. Geochim. Cosmochim. Acta 70, 1148–1162.
Payne, E. K., Burgin, A. J., and Hamilton, S. K. (2009). Sediment nitrate manipulation using porewater equilibrators reveals potential for N and S coupling in freshwaters. Aquat. Microb. Ecol. 54, 233–241.
Philippot, L. (2002). Denitrifying genes in bacterial and Archaeal genomes. Biochim. Biophys. Acta 1577, 355–376.
Roychoudhury, A., Viollier, E., and Van Cappellen, P. (1998). A plug flow-through reactor for studying biogeochemical reactions in undisturbed aquatic sediments. Appl. Geochem. 13, 269–280.
Schlesinger, W. H. (1997). Biogeochemistry: An Analysis of Global Change. San Diego: Academic Press, 588.
Schwermer, C. U., Ferdelman, T. G., Stief, P., Gieseke, A., Rezakhani, N., van Rijn, J., de Beer, D., and Schramm, A. (2010). Effect of nitrate on sulfur transformations in sulfidogenic sludge of a marine aquaculture biofilter. FEMS Microbiol. Ecol. 72, 476–484.
Schwientek, M., Einsiedl, F., Stichler, W., Stögbauer, A., Strauss, H., and Maloszewski, P. (2008). Evidence for denitrification regulated by pyrite oxidation in a heterogeneous porous groundwater system. Chem. Geol. 255, 60–67.
Seitzinger, S., Harrison, J. A., Böhlke, J. K., Bouwman, A. F., Lowrance, R., Peterson, B., Tobias, C., and Van Drecht, G. (2006). Denitrification across landscapes and waterscapes: a synthesis. Ecol. Appl. 16, 2064–2090.
Senga, Y., Mochida, K., Fukumori, R., Okamoto, N., and Seike, Y. (2006). N2O accumulation in estuarine and coastal sediments: The influence of H2S on dissimilatory nitrate reduction. Estuar. Coast. Shelf Sci. 67, 231–238.
Sierra-Alvarez, R., Beristain-Cardoso, R., Salazar, M., Gómez, J., Razo-Flores, E., and Field, J. A. (2007). Chemolithotrophic denitrification with elemental sulfur for groundwater treatment. Water Res. 41, 1253–1262.
Song, K., Lee, S. H., and Kong, H. (2011). Denitrification rates and community structure of denitrifying bacteria in newly constructed wetland. Eur. J. Soil Biol. 47, 24–29.
Sun, W. J., Sierra-Alvarez, R., Hsu, I., Rowlette, P., and Field, J. A. (2010). Anoxic oxidation of arsenite linked to chemolithotrophic denitrification in continuous bioreactors. Biotechnol. Bioeng. 105, 909–917.
Terbraak, C. J. F., and Verdonschot, P. F. M. (1995). Canonical correspondence-analysis and related multivariate methods in aquatic ecology. Aquat. Sci. 57, 255–289.
Thamdrup, B., Fossing, H., and Jorgensen, B. B. (1994). Manganese, iron, and sulfur cycling in a coastal marine sediment, Aarhus bay, Denmark. Geochim. Cosmochim. Acta 58, 5115–5129.
Vandenwollenberg, A. L. (1977). Redundancy analysis an alternative for canonical correlation analysis. Psychometrika 42, 207–219.
Wagner, M., Roger, A. J., Flax, J. L., Brusseau, G. A., and Stahl, D. A. (1998). Phylogeny of dissimilatory sulfite reductases supports an early origin of sulfate respiration. J. Bacteriol. 180, 2975–2982.
Wallenstein, M. D., Myrold, D. D., Firestone, M., and Voytek, M. (2006). Environmental controls on denitrifying communities and denitrification rates: insights from molecular methods. Ecol. Appl. 16, 2143–2152.
Westermann, P., and Ahring, B. K. (1987). Dynamics of methane production, sulfate reduction, and denitrification in a permanently waterlogged alder swamp. Appl. Environ. Microbiol. 53, 2554–2559.
Whitmire, S. L., and Hamilton, S. K. (2005). Rapid removal of nitrate and sulfate in freshwater wetland sediments. J. Environ. Qual. 34, 2062–2071.
Zhang, Y. H., Zhong, F. H., and Xia, S. Q. (2009). Effect of initial ph on autohydrogenotrophic denitrification. Fresenius Environ. Bull. 18, 2352–2358.
Keywords: aquatic sediments, denitrification, sulfate reduction, sulfide oxidation, salinity, salt marsh, estuarine sediments, wetland soils
Citation: Gu C, Laverman AM and Pallud CE (2012) Environmental controls on nitrogen and sulfur cycles in surficial aquatic sediments. Front. Microbio. 3:45. doi: 10.3389/fmicb.2012.00045
Received: 12 December 2011;
Accepted: 29 January 2012;
Published online: 27 February 2012.
Edited by:
Paul Bodelier, Netherlands Institute of Ecology, NetherlandsReviewed by:
Nick Bouskill, Lawrence Berkeley National Laboratory, USASuzanne Caroline Marianne Haaijer, Radboud University Nijmegen, Netherlands
Copyright: © 2012 Gu, Laverman and Pallud. This is an open-access article distributed under the terms of the Creative Commons Attribution Non Commercial License, which permits non-commercial use, distribution, and reproduction in other forums, provided the original authors and source are credited.
*Correspondence: Anniet M. Laverman, UMR 7619 Sisyphe, Université Pierre et Marie Curie, 75005 Paris, France. e-mail:QW5uaWV0LkxhdmVybWFuQHVwbWMuZnI=